


Languages
Pages
Legal


Grading Fiscal Policy in the Last Decade
Eduardo Fernández-AriasResearch DepartmentResearch Department
Regional Seminar on Fiscal PolicyECLACSantiago de Chile, March 2013

http://www.iadb.org
The opinions expressed in this presentation are tho se of the authors and do not necessarily reflect th e views of the Inter-American Development Bank, its Board of Directors, or the co untries they represent.
The unauthorized commercial use of Bank documents i s prohibited and may be punishable under the Bank's policies and/or applicable laws.
Copyright © [Type year of first publication] Inter-American Development Bank. All rights reserve d; may be freely reproduced for any non-commercial purpose.

GRADING FISCAL POLICY OVER THE DECADE
OUTLINE
I. OVERALL, SATISFACTORY FISCAL REVENUE MANAGEMENT OVER THE DECADE…DECADE…
II. ….BUT HEALTHY FISCAL SPENDING STANCE DETERIORATED AFTER GLOBAL CRISIS
III. HOW TO IMPROVE THE CURRENT “B” GRADE TO AN “A” GRADE INSTEAD OF RISKING IT FALLING TO AN “F” GRADE?

I. SATISFACTORY FISCAL REVENUE MANAGEMENT OVER THE DECADE
Estimation methods for structural and temporaryfiscal revenues• Temporary revenue is the sum of temporary:
GDP-linked revenue (tax on output gap) andCommodity-linked revenue (temporary price effect)
• GDP-linked based on:– Trend or Structural GDP (HP filter, real time)– Trend or Structural GDP (HP filter, real time)
• Commodity-linked based on:– HP-filtered commodity revenues (like Chile)– Trend or Structural Prices (5-year real-time
forecast prices) (MORE LATER)
Assessing prudent fiscal revenue management (1)
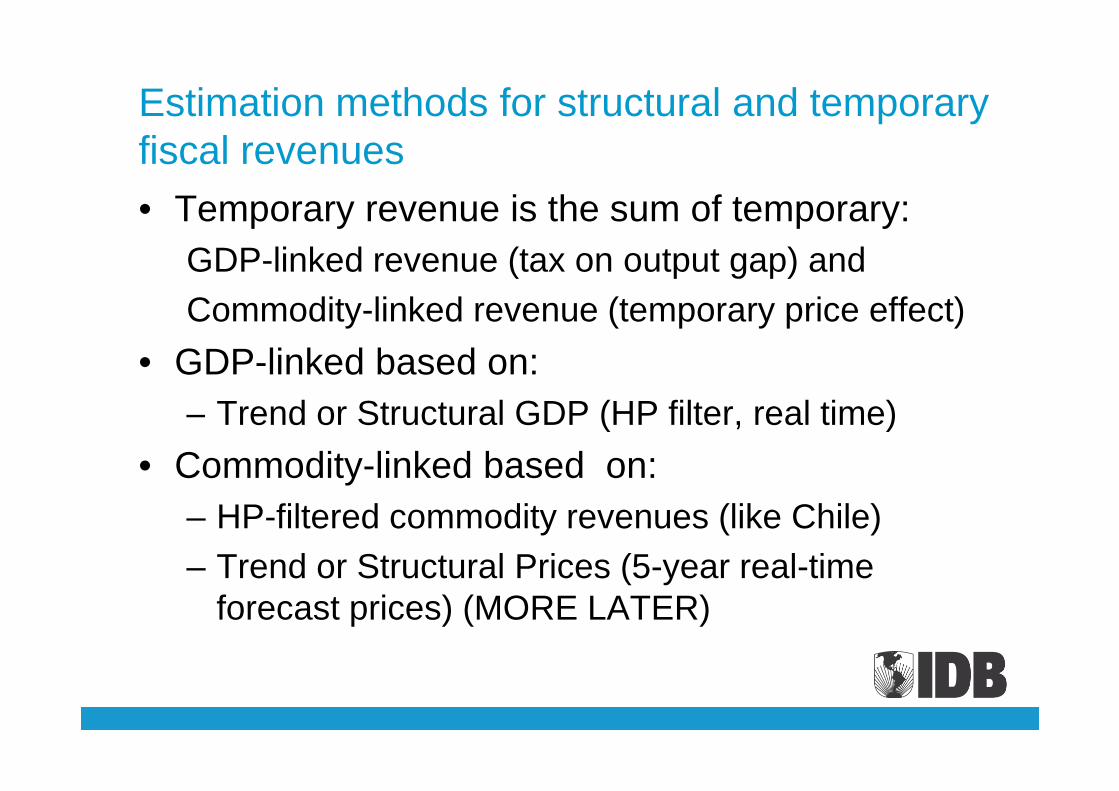
• KEY QUESTION FOR CYCLICAL REVENUE: To what extent are temporary revenues saved or spent?
• More specifically, to what degree does spending • More specifically, to what degree does spending move with temporary revenues:– In good times (TR>0)– In bad times (TR<0)
• KEY QUESTION FOR STRUCTURAL REVENUE: To what extent are structural revenues spent?

Assessing prudent fiscal revenue management (2)
• Prudent/sustainable management of cyclical revenue requires symmetry: spending out of TR equal (or lower) in good times.
• Efficient management would further require • Efficient management would further require zero spending out of TR (cyclically stable spending).
• Prudent/sustainable management of (increasing) structural revenue requires unitary (or fractional) marginal spending impact.

Revenues and Spending over a decade: comovements difficult to assess visually

1) For TR, favorable symmetry and low spending leakage; 2) For SR, some savings margin
The special case of commodity exporting countries experiencing massive changes in structural and
temporary revenues is also satisfactorytemporary revenues is also satisfactory

Commodity revenues are large and volatile; structural rose by 40% while temporary fell!
1
1.5
2
2.5
3
7
8
9
10
11
12
Tota
l and
Str
uctu
ral R
even
ues
(% o
f Str
uctu
ral G
DP
)
Commodity Linked RevenuesTypical LAC Commodity Exporter
-2
-1.5
-1
-0.5
0
0.5
1
0
1
2
3
4
5
6
7
2007
q4
2008
q1
2008
q2
2008
q3
2008
q4
2009
q1
2009
q2
2009
q3
2009
q4
2010
q1
2010
q2
2010
q3
2010
q4
2011
q1
2011
q2
Tota
l and
Str
uctu
ral R
even
ues
(% o
f Str
uctu
ral G
DP
)
Structural Total TemporarySource: LMW, Author's calculations.Source: LMW, Author's calculations.Source: LMW, Author's calculations.Source: LMW, Author's calculations.Source: LMW, Author's calculations.Source: LMW, Author's calculations.
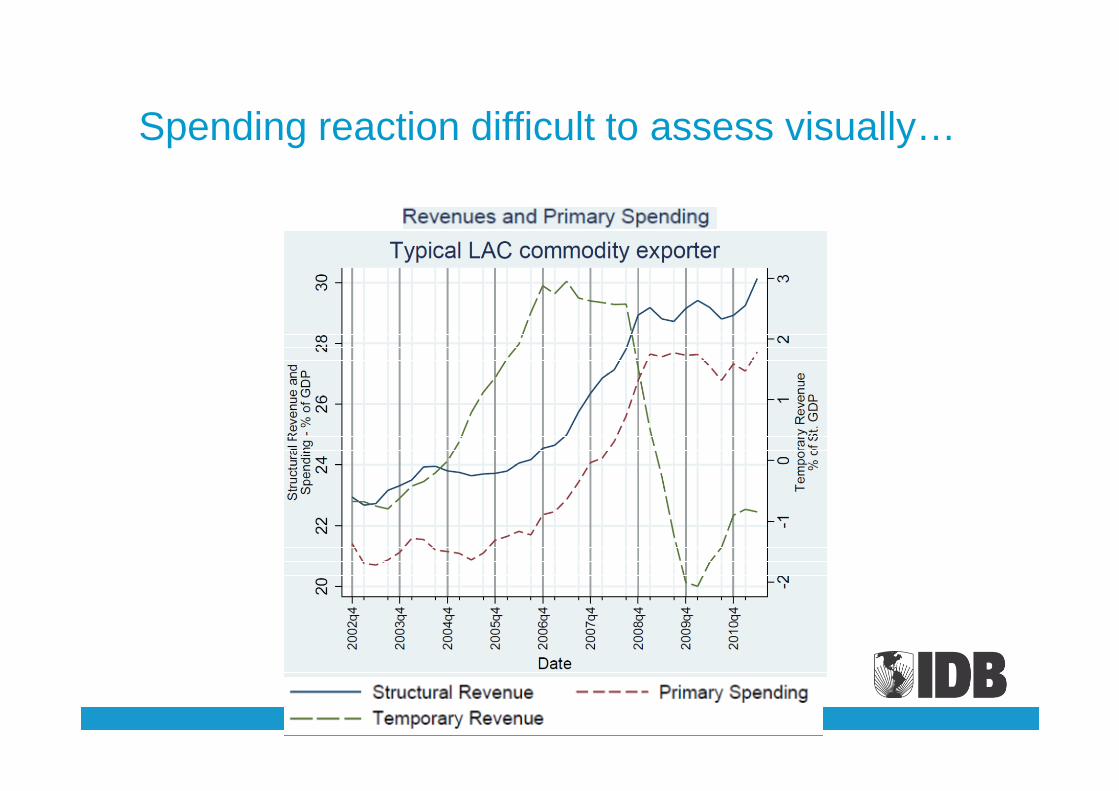
Spending reaction difficult to assess visually…

…but regression confirms overall satisfactory findings for this grouping (LAC-CM)
II. HEALTHY FISCAL SPENDING STANCE DETERIORATED AFTER THE GLOBAL CRISIS

Prudent/sustainable fiscal policy also depends on prudent autonomous spending policy
• Increasing underlying autonomous spending trends (unrelated to revenues) may over time lead to fiscal unsustainability
• Even if trends are not dynamically unfavorable, • Even if trends are not dynamically unfavorable, underlying autonomous spending levels may be already too high for fiscal sustainability
• Basic measure: level and trend of structural balance (leaving out temporary revenues from observed balance).

Split regression suggests a substantial regime change in autonomous spending after 2007 (jump in intercepts)

Time series show improving structural balance and then a strong countercylical response to Global Crisis that lingers on

Better sustainability measure: Neutral structural balance (adjusting for temporary revenue impact to estimate structural balance at zero TR)

Interestingly, commodity exporters exhibit better structural balance trends…

…but similarly worrisome neutral structural balance trends
Current level of spending may be unsustainable
• Fiscal sustainability analysis based on observed and required structural primary balance presented last year indicated that:
• Current sustainability uniformly lower than prior to Global Crisis
• Many countries with measurable unsustainability risk (required structural adjustment gap above 1 % of GDP)

III. HOW TO IMPROVE THE CURRENT “B” GRADE TO AN “A” GRADE INSTEAD OF RISKING IT FALLING TO AN “F” GRADERISKING IT FALLING TO AN “F” GRADE

Spending expansion holds and continues today
27.00%
29.00%
31.00%
Primary Expenditure (% of Potential GDP)
21.00%
23.00%
25.00%
27.00%
Typical LAC Typical Commodity Exporter
Source: LMW, IMF (WEO), Ministries of Finance and Authors' Calculations.

Incomplete retirement of successful countercyclical package in Global Recession as recovery took hold may lead to an “F” grade
• Low sustainability assessment based on current SB is optimistic in that it implicitly assumes that negative regime change is a one-off shock
• It may be more realistic for markets to infer that • It may be more realistic for markets to infer that recent SB deterioration reveals a pattern of ratcheting up expansion, dynamically unsustainable
• Extraordinary low levels of world interest rates and consequently low spreads and yields may be hiding it for now.

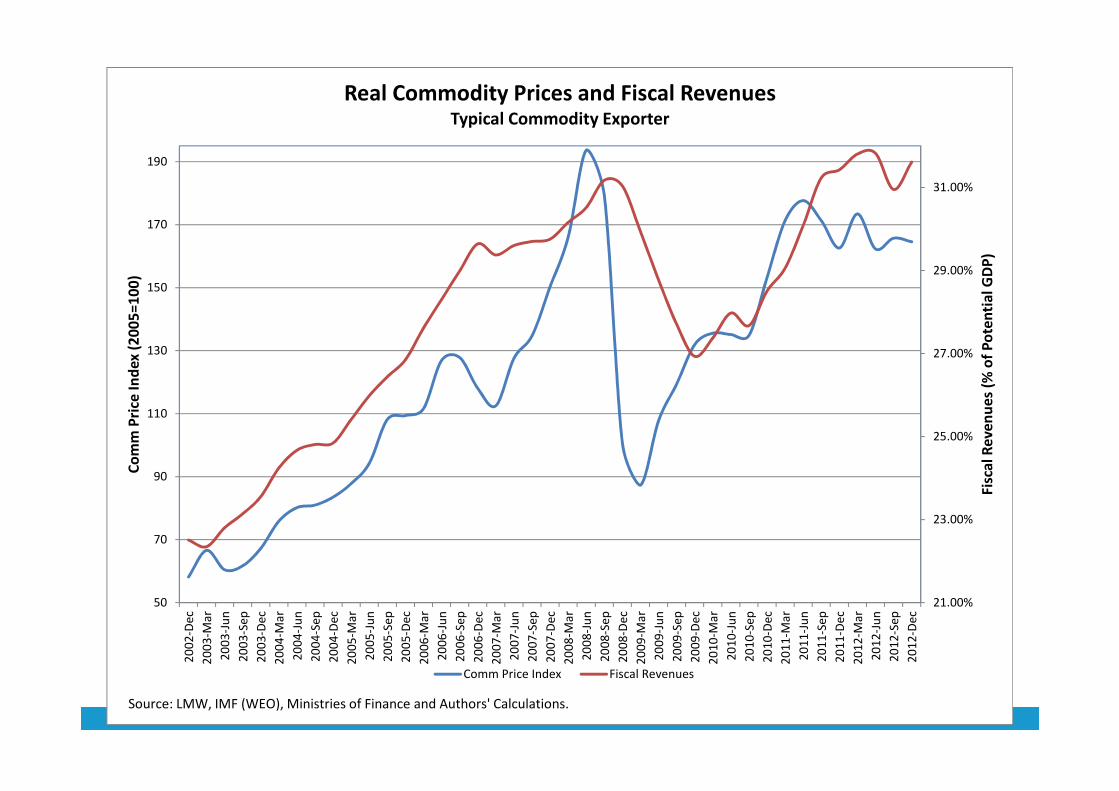
For commodity exporters, current trends and future uncertainties entail special risks:
• Commodity prices are highly volatile and fiscal revenues are dependent on them; no room for error
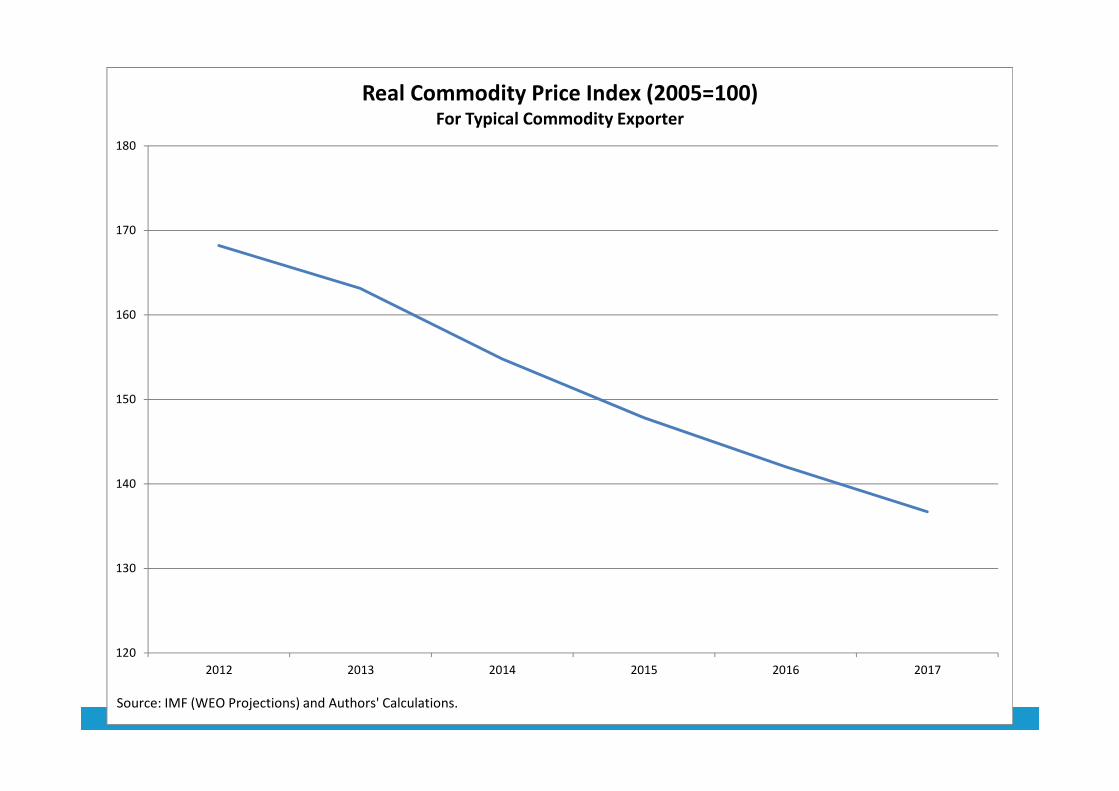
• Commodity prices expected to fall over the next • Commodity prices expected to fall over the next 5 years according to WEO (20% real terms)
• Decade average is some 25% below current price (prudent structural forecast in the spirit of Chile’s)
• Estimation of structural prices is unreliable, a strong reason for caution
• Non-renewability is another reason for structural revenue risk
27.00%
29.00%
31.00%
130
150
170
190
Fis
cal
Re
ve
nu
es
(% o
f P
ote
nti
al
GD
P)
Co
mm
Pri
ce I
nd
ex
(2
00
5=
10
0)
Real Commodity Prices and Fiscal RevenuesTypical Commodity Exporter
21.00%
23.00%
25.00%
50
70
90
110
20
02
-De
c
20
03
-Ma
r
20
03
-Ju
n
20
03
-Se
p
20
03
-De
c
20
04
-Ma
r
20
04
-Ju
n
20
04
-Se
p
20
04
-De
c
20
05
-Ma
r
20
05
-Ju
n
20
05
-Se
p
20
05
-De
c
20
06
-Ma
r
20
06
-Ju
n
20
06
-Se
p
20
06
-De
c
20
07
-Ma
r
20
07
-Ju
n
20
07
-Se
p
20
07
-De
c
20
08
-Ma
r
20
08
-Ju
n
20
08
-Se
p
20
08
-De
c
20
09
-Ma
r
20
09
-Ju
n
20
09
-Se
p
20
09
-De
c
20
10
-Ma
r
20
10
-Ju
n
20
10
-Se
p
20
10
-De
c
20
11
-Ma
r
20
11
-Ju
n
20
11
-Se
p
20
11
-De
c
20
12
-Ma
r
20
12
-Ju
n
20
12
-Se
p
20
12
-De
c
Fis
cal
Re
ve
nu
es
(% o
f P
ote
nti
al
GD
P)
Co
mm
Pri
ce I
nd
ex
(2
00
5=
10
0)
Comm Price Index Fiscal Revenues
Source: LMW, IMF (WEO), Ministries of Finance and Authors' Calculations.
150
160
170
180
Real Commodity Price Index (2005=100)For Typical Commodity Exporter
120
130
140
150
2012 2013 2014 2015 2016 2017
Source: IMF (WEO Projections) and Authors' Calculations.

110
130
150
170
190
Real Commodity Prices Index (2005=100) - Fiscal SharesFor Typical Commodity Exporter
30
50
70
90
20
00
-Ma
r
20
00
-Ju
n
20
00
-Se
p
20
00
-De
c
20
01
-Ma
r
20
01
-Ju
n
20
01
-Se
p
20
01
-De
c
20
02
-Ma
r
20
02
-Ju
n
20
02
-Se
p
20
02
-De
c
20
03
-Ma
r
20
03
-Ju
n
20
03
-Se
p
20
03
-De
c
20
04
-Ma
r
20
04
-Ju
n
20
04
-Se
p
20
04
-De
c
20
05
-Ma
r
20
05
-Ju
n
20
05
-Se
p
20
05
-De
c
20
06
-Ma
r
20
06
-Ju
n
20
06
-Se
p
20
06
-De
c
20
07
-Ma
r
20
07
-Ju
n
20
07
-Se
p
20
07
-De
c
20
08
-Ma
r
20
08
-Ju
n
20
08
-Se
p
20
08
-De
c
20
09
-Ma
r
20
09
-Ju
n
20
09
-Se
p
20
09
-De
c
20
10
-Ma
r
20
10
-Ju
n
20
10
-Se
p
20
10
-De
c
20
11
-Ma
r
20
11
-Ju
n
20
11
-Se
p
20
11
-De
c
20
12
-Ma
r
20
12
-Ju
n
20
12
-Se
p
20
12
-De
c
Comm Price Index 10-year MA
Source: IMF and Author's Calculations

Mexico
Venezuela
Trinidad and Tobago
Bolivia
Ecuador
Estimated Impact in Total Revenues as % of Potential GDP as result of a 25%
decline in Real Commodity Prices
-4.50% -4.00% -3.50% -3.00% -2.50% -2.00% -1.50% -1.00% -0.50% 0.00%
Colombia
Argentina
Peru
Chile
Source: Ministries of Finance and Authors' Calculations.

A fiscal agenda towards an “A” grade (while preparing for action given low growth prospects and global downside risks):
• First and foremost, normalize fiscal structural balance where needed as soon as practical
• Credibly establish fiscal framework under principles of sound structural budget objectives principles of sound structural budget objectives and the use of (self-reversed) automatic stabilizers
• Prepare fiscal measures and projects that are fast to launch, have high multiplier effect, are temporary or easily reversible, economize in fiscal space. Infrastructure maintenance and investment may fill these requirements.
Top Related