


Languages
Pages
Legal


1
2017 Edelman Trust BarometerFlash PollMexico’s Trust Challenges—the U.S. Perspective
November 23, 2017

Methodology
2017 Edelman Trust Barometer: 28-country global data margin of error: General Population +/-0.6% (N=32,200), Informed Public +/- 1.2% (N=6,200), Mass Population +/- 0.6% (26,000+). Country-specific data margin of error: General Population +/- 2.9 ( N=1,150), Informed Public +/- 6.9% (N = min 200, varies by country), China and U.S. +/- 4.4% (N=500), Mass Population +/- 3.0 to 3.6 (N =min 740, varies by country), half sample Global General Online Population +/- 0.8 (N=16,100). 2017 Edelman Trust Barometer Flash Poll, Mexico’s Trust Challenges—the U.S. Perspective: margin of error: +/- 3.1% (N=1,000).
EdelmanTrust Barometer17 years of studying trust
Launched annually at the World Economic Forum Annual Meeting in Davos
2017 EdelmanTrust BarometerOnline survey in 28 countries
33,000+ respondents total
All fieldwork conducted between October 13th and November 16th, 2016
Ages 18+
1,150 respondents per country
Trust Barometer Flash Poll: U.S. Perspective on MexicoOnline survey in the U.S.
1,000 respondents total, ages 18+
All fieldwork conducted between Nov. 3 – Nov. 6, 2017
Using the Edelman Intelligence Command Center, we analyzed media coverage of Mexico in the U.S. A total of 2,103 stories were analyzed for associated topics and sentiment.

2017: Trust Gap Widens
Source: 2017 Edelman Trust Barometer. The Trust Index is an average of a country’s trust in the institutions of government, business, media and NGOs. Informed Public and Mass Population, 25-country global total.
3
Percent trust in the four institutions of government, business, media and NGOs, 2012 to 2017
21 pts
19 pts
18 pts
53
60 60
44
48
45
2012 2016 2017
Informed Public
15pt
Gap
9pt
Gap
A 3-point increase in the last year
12pt
Gap
Largest Gaps
MassPopulation
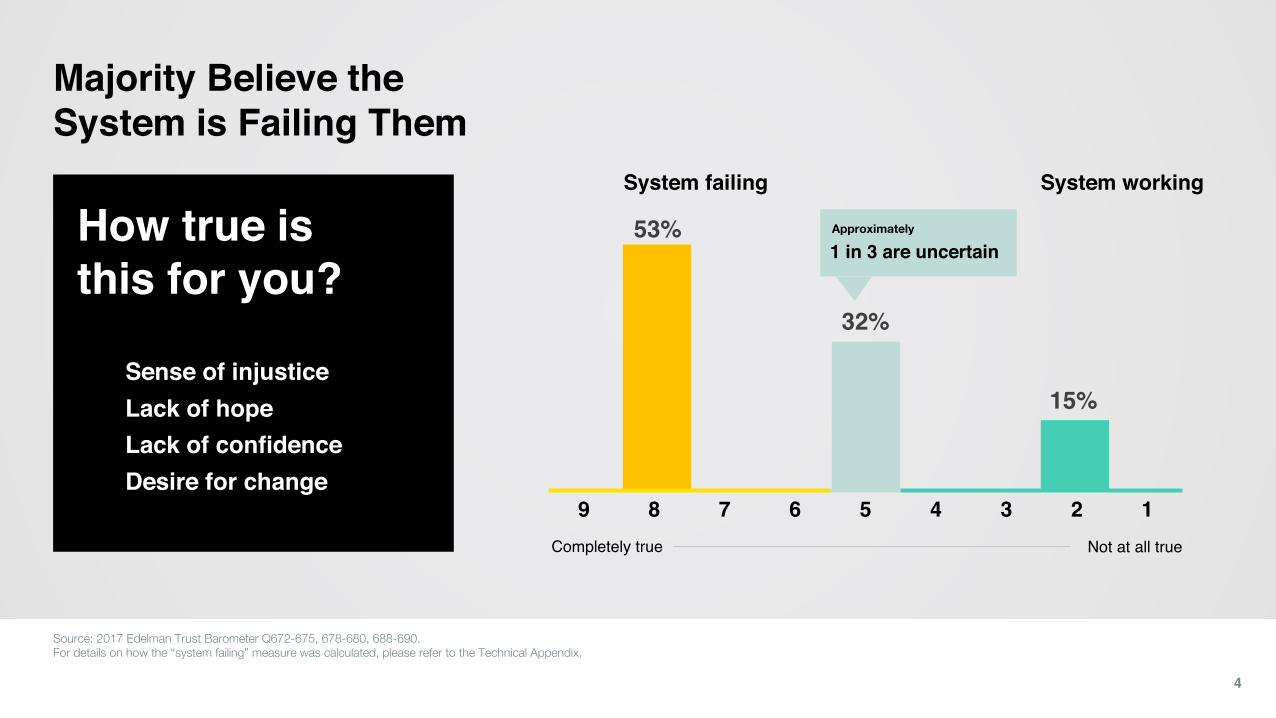
How true is this for you?
Sense of injustice Lack of hope Lack of confidence Desire for change
53%
32%
15%
Majority Believe the System is Failing Them
Source: 2017 Edelman Trust Barometer Q672-675, 678-680, 688-690. For details on how the “system failing” measure was calculated, please refer to the Technical Appendix.
4
Not at all true
9 8 7 6 5 4 3 2 1
1 in 3 are uncertain
Completely true
System failing System working
Approximately
30 32 32 34
4348 48
55 5660 61 61 64 64
68 68 68
Mex
ico
Braz
il
Indi
a
Chi
na
S. K
orea
Italy
Spai
n
U.S
.
Fran
ce
Japa
n
Net
herla
nds
U.K
.
Aust
ralia
Ger
man
y
Can
ada
Swed
en
Switz
erla
nd
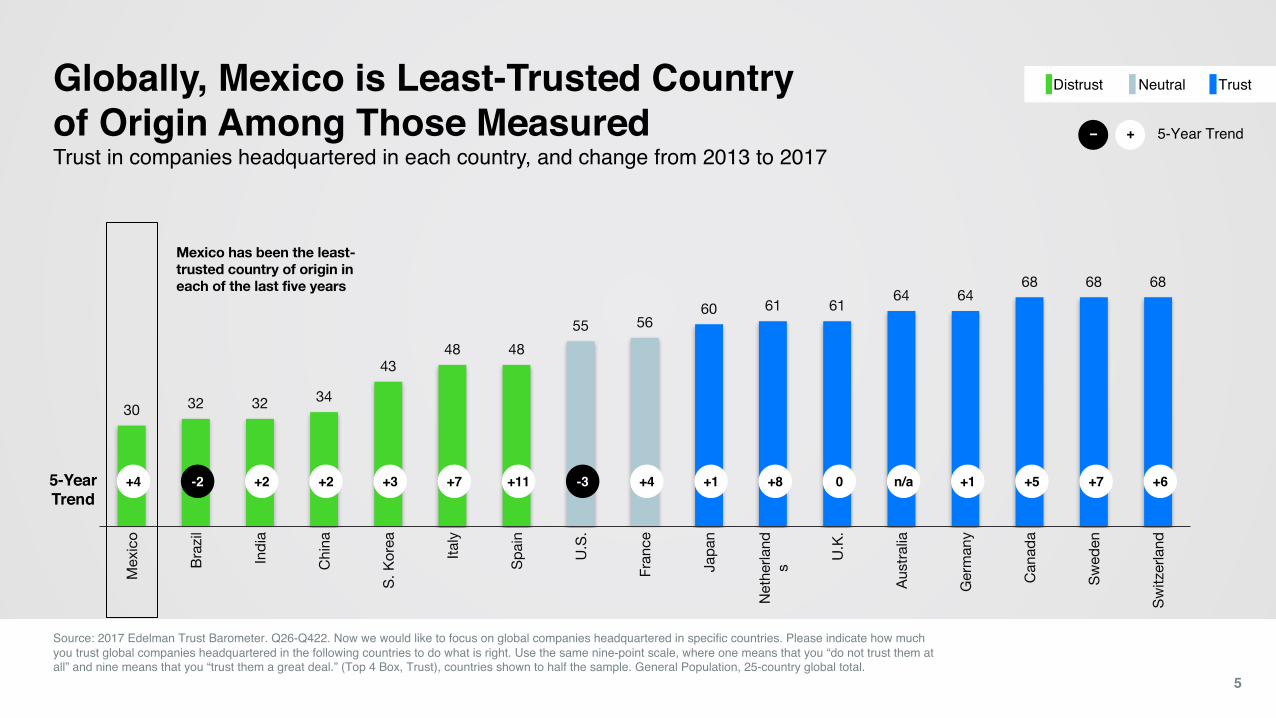
Globally, Mexico is Least-Trusted Country of Origin Among Those Measured
Source: 2017 Edelman Trust Barometer. Q26-Q422. Now we would like to focus on global companies headquartered in specific countries. Please indicate how much you trust global companies headquartered in the following countries to do what is right. Use the same nine-point scale, where one means that you “do not trust them at all” and nine means that you “trust them a great deal.” (Top 4 Box, Trust), countries shown to half the sample. General Population, 25-country global total.
5
Trust in companies headquartered in each country, and change from 2013 to 2017
+1+4+7 +11-2 +8 0 +1n/a +6+7+5-3+3+2+2+45-Year Trend
NeutralDistrust Trust
5-Year Trend+−
Mexico has been the least-trusted country of origin in each of the last five years

Mexico Distrusted in 22 of 28 Countries
Source: 2017 Edelman Trust Barometer. Q26-Q422. Now we would like to focus on global companies headquartered in specific countries. Please indicate how much you trust global companies headquartered in the following countries to do what is right. Use the same nine-point scale, where one means that you “do not trust them at all” and nine means that you “trust them a great deal.” (Top 4 Box, Trust), countries shown to half the sample. General Population, across countries.
6
Trust in companies headquartered in Mexico, China, and Brazil
China
Mexico
Brazil
50%
14 15 18 18 18 18 19 20 20 22 22 23 23 24 25 27 29 32 33 33 39 40 50 50 56 57 58 61
Swed
en
Pola
nd
Ger
man
y
Irela
nd
Japa
n
Rus
sia
Aust
ralia
Fran
ce
S. K
orea
Net
herla
nds
Spai
n
Hon
g Ko
ng
U.K
.
Can
ada
S. A
frica
Italy
Sing
apor
e
Turk
ey
Arge
ntin
a
Mal
aysi
a
UAE U.S
.
Braz
il
Col
ombi
a
Indo
nesi
a
Chi
na
Indi
a
Mex
ico

14 15 18 18 18 18 19 20 20 22 22 23 23 24 25 27 29 32 33 3339 40
50 5056 57 58 61
Swed
en
Pola
nd
Ger
man
y
Irela
nd
Japa
n
Russ
ia
Aust
ralia
Fran
ce
S. K
orea
Net
herla
nds
Spai
n
Hon
g Ko
ng
U.K
.
Can
ada
S. A
frica
Italy
Sing
apor
e
Turk
ey
Arge
ntin
a
Mal
aysi
a
UAE U.S
.
Braz
il
Col
ombi
a
Indo
nesi
a
Chi
na
Indi
a
Mex
ico
Trust in Mexican Companies Has Increased in 18 Countries since 2013
Source: 2017 Edelman Trust Barometer. Q26-Q422. Now we would like to focus on global companies headquartered in specific countries. Please indicate how much you trust global companies headquartered in the following countries to do what is right. Use the same nine-point scale, where one means that you “do not trust them at all” and nine means that you “trust them a great deal.” (Top 4 Box, Trust), countries shown to half the sample. General Population, across countries.
7
Trust in companies headquartered in Mexico, and change from 2013 to 2017
5-Year Trend
NeutralDistrust Trust
5-Year Trend+−
-10 +7 +4 +1 -6+11 -5 +10 n/a+19 +14 +14 -1+4 +6 +4 0-5+3-2 +6+2 +9 n/a +13 -2+5 +4
50%

2936
40 4044
51 53 53 54 5661 64 65 65 67
74 75
Chi
na
Indi
a
Braz
il
Mex
ico
S. K
orea
Japa
n
Ger
man
y
Italy
Fran
ce
Spai
n
Net
herla
nds
U.K
.
Swed
en
Switz
erla
nd
Aust
ralia
U.S
.
Can
ada
In U.S., Brand Mexico Gaining Ground—But Remains in Bottom Tier
Source: 2017 Edelman Trust Barometer. Q26-Q422. Now we would like to focus on global companies headquartered in specific countries. Please indicate how much you trust global companies headquartered in the following countries to do what is right. Use the same nine-point scale, where one means that you “do not trust them at all” and nine means that you “trust them a great deal.” (Top 4 Box, Trust), countries shown to half the sample. General Population, U.S.
8
Trust among U.S. in companies headquartered in each country,and change from 2013 to 2017
+21+17+7 +7+11 +15 +5 +11+14 +8+7n/a+15+17+19+12+11
NeutralDistrust Trust
5-Year Trend+−
5-Year Trend

In U.S., Brand Mexico Tarnishedby Government Image and Business Practices
Source: 2017 Edelman Trust Barometer Flash Poll, Mexico’s Trust Challenges—the U.S. Perspective, Nov. 23Q3: For each of the statements below, please indicate how much you agree or disagree. (Top 4 box, Agree)
9
Percent of U.S. respondents who agree with each of the following statements
32
42
54
59
Products and services from Mexico are of low quality
Mexico does not have adequate laws to protect the environment
Mexico does not pay its workers a fair wage
There is a lot of corruption within the Mexican government
Product quality is not the problem

Few High-Profile Mexican CEOs
Source: 2016 Edelman Trust Barometer CEO Supplement Q1. Thinking about CEOs of companies in general, how many can you name? Please be specific and use their full names in the boxes below. General Population, [Open ended question, coded for industry sector], 10-country global total.
10
Percent who mention each CEO name, 10-country global data (unaided)
10% Mark Zuckerberg 8% Bill Gates 4% Steve Jobs 4% Tim Cook 3% Carlos Slim
3% Jack Ma 3% Satya Nadella 2% Sundar Pichai 2% Carlos Ghosn 2% Richard Branson

Few High-Profile Mexican Brands
11
?
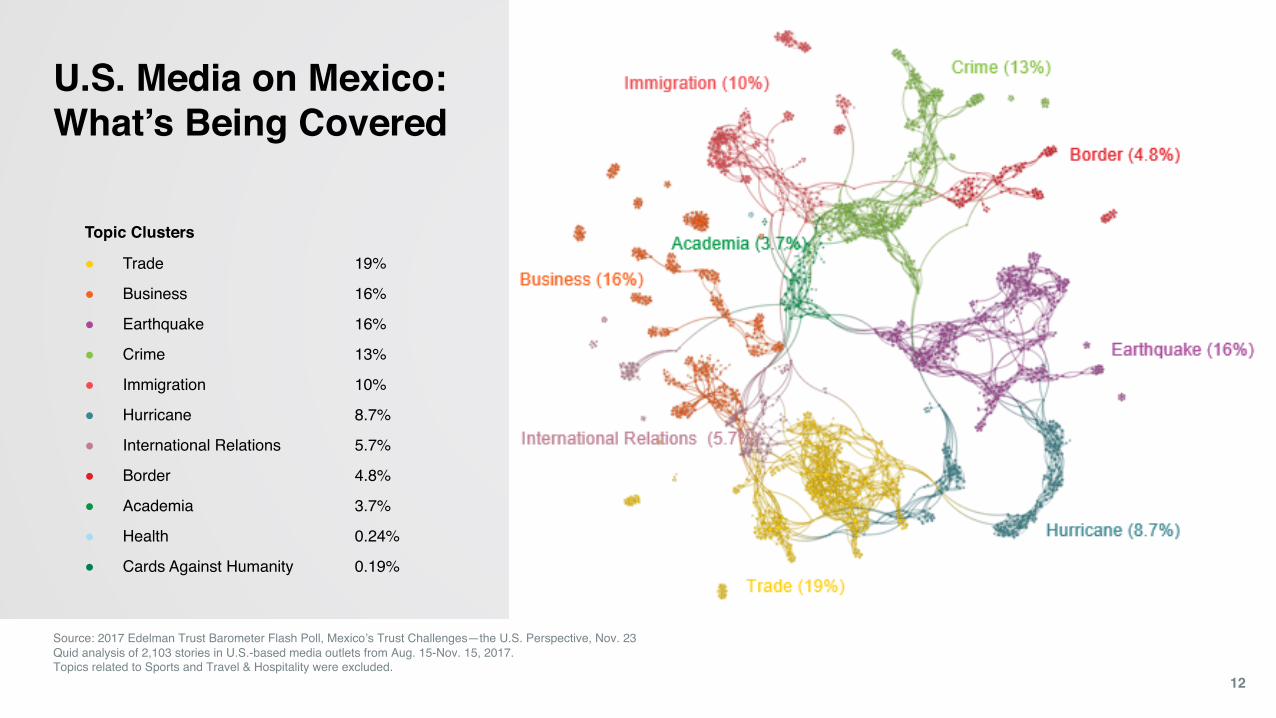
Source: 2017 Edelman Trust Barometer Flash Poll, Mexico’s Trust Challenges—the U.S. Perspective, Nov. 23 Quid analysis of 2,103 stories in U.S.-based media outlets from Aug. 15-Nov. 15, 2017.Topics related to Sports and Travel & Hospitality were excluded.
12
Topic Clusters
! Trade 19%
! Business 16%
! Earthquake 16%
! Crime 13%
! Immigration 10%
! Hurricane 8.7%
! International Relations 5.7%
! Border 4.8%
! Academia 3.7%
! Health 0.24%
! Cards Against Humanity 0.19%
U.S. Media on Mexico: What’s Being Covered

U.S. Media Coverage of Mexico Slants Negative
Source: 2017 Edelman Trust Barometer Flash Poll, Mexico’s Trust Challenges—the U.S. Perspective, Nov. 23 Quid analysis of 2,103 stories in U.S.-based media outlets from Aug. 15-Nov. 15, 2017.Topics related to Sports and Travel & Hospitality were excluded.
13
Sentiment summary
! Positive 37%
! Neutral 31%
! Negative 30%

U.S. Ambivalent on Relationship With Mexico
Source: 2017 Edelman Trust Barometer Flash Poll, Mexico’s Trust Challenges—the U.S. Perspective, Nov. 23Q3: For each of the statements below, please indicate how much you agree or disagree. (Top 4 box, Agree)
14
61% agree
48% agree with
one or more
Build a stronger, more collaborative relationship with Mexico
• End flow of immigrants• Build a border wall• Withdraw from NAFTA
vs.

4250
21 25
4760
1526
6250
57 576045 51 46
Trust Diverges Along Voting Lines
15
Percent trust in the four institutions of government, business, media and NGOs, pre- and post-election, Trump vs. Clinton voters
Source: 2017 Edelman Trust Barometer Q11-620 and U.S. Flash Poll. Below is a list of institutions. For each one, please indicate how much you trust that institution to do what is right using a nine-point scale, where one means that you “do not trust them at all” and nine means that you “trust them a great deal.” (Top 4 Box, Trust) Audience: U.S. General Population of Trump and Clinton voters who participated both in main and re-contact study.
+10 -6 +1
-6-5-2
+5
Media highly distrusted by Trump voters; declines among both
Government highly distrusted by Trump voters
Change+−
Pre-election Post-election
Trump Voters
Clinton Voters
-11
Business MediaNGOs Government
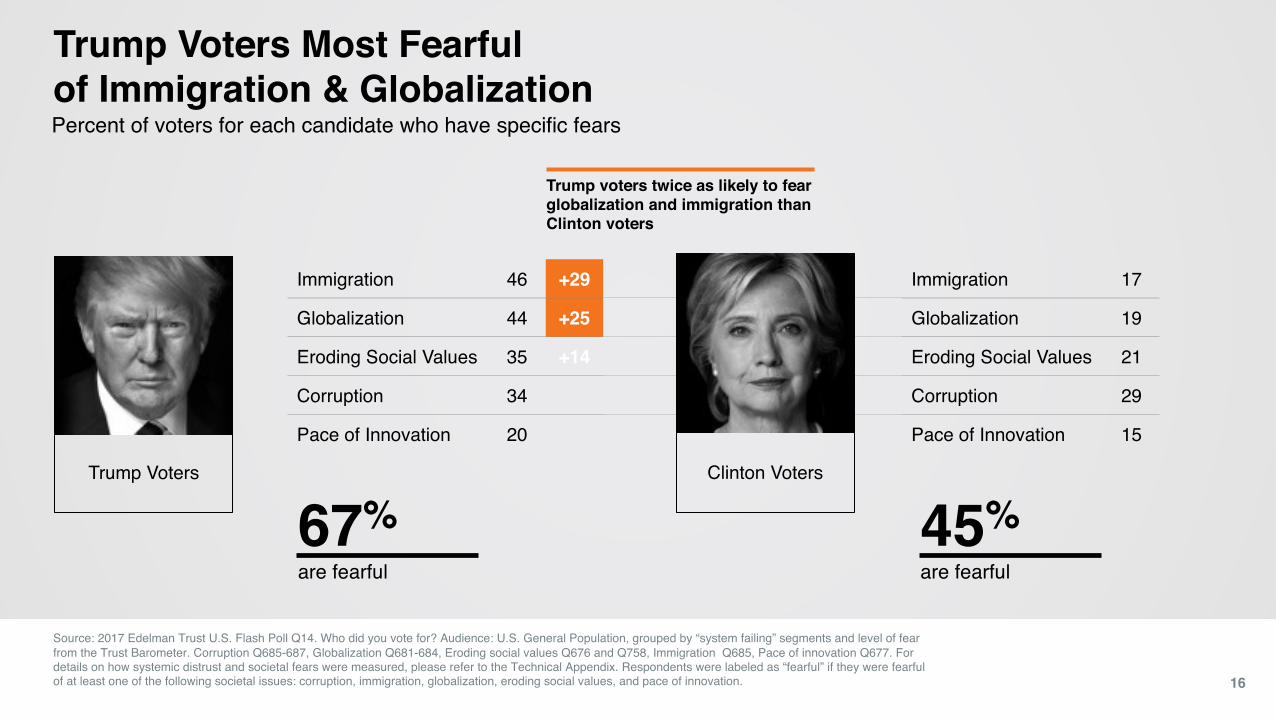
Trump Voters Most Fearful of Immigration & Globalization
Source: 2017 Edelman Trust U.S. Flash Poll Q14. Who did you vote for? Audience: U.S. General Population, grouped by “system failing” segments and level of fear from the Trust Barometer. Corruption Q685-687, Globalization Q681-684, Eroding social values Q676 and Q758, Immigration Q685, Pace of innovation Q677. For details on how systemic distrust and societal fears were measured, please refer to the Technical Appendix. Respondents were labeled as “fearful” if they were fearful of at least one of the following societal issues: corruption, immigration, globalization, eroding social values, and pace of innovation. 16
Percent of voters for each candidate who have specific fears
Trump Voters
67% are fearful
45% are fearful
Immigration 46 +29
Globalization 44 +25
Eroding Social Values 35 +14
Corruption 34
Pace of Innovation 20
Immigration 17
Globalization 19
Eroding Social Values 21
Corruption 29
Pace of Innovation 15
Trump voters twice as likely to fear globalization and immigration than Clinton voters
Clinton Voters
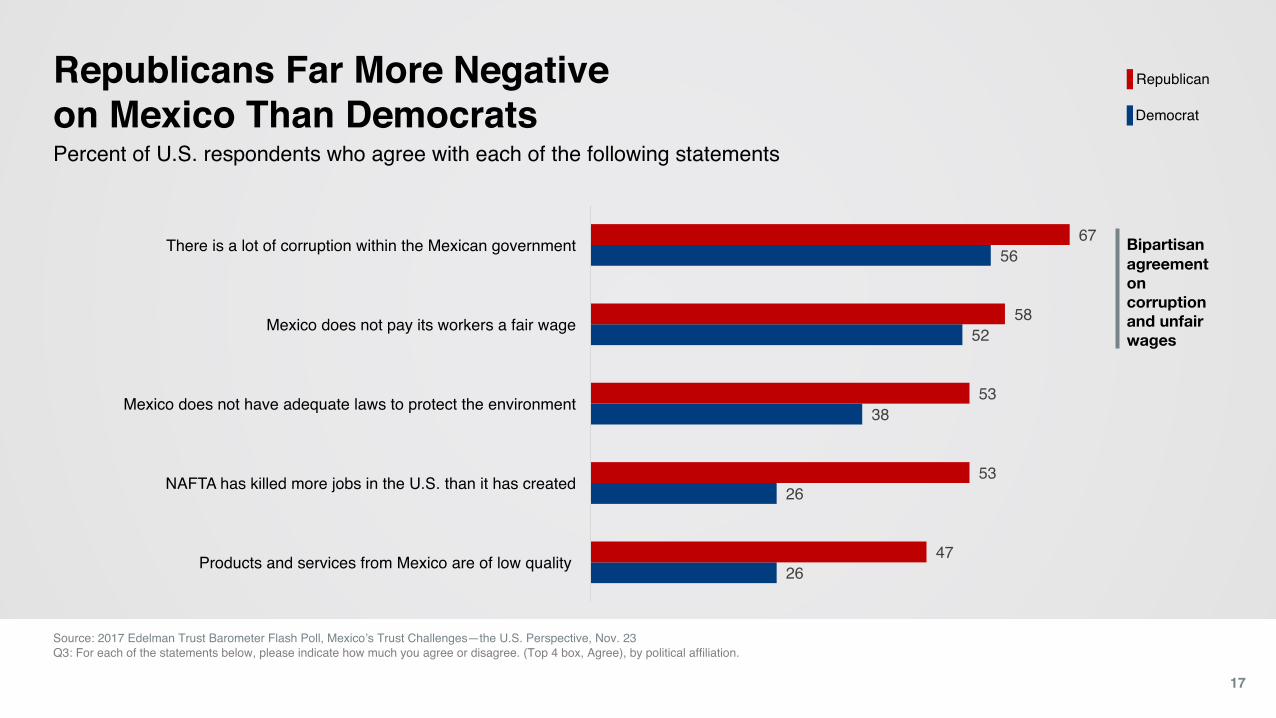
Republicans Far More Negative on Mexico Than Democrats
Source: 2017 Edelman Trust Barometer Flash Poll, Mexico’s Trust Challenges—the U.S. Perspective, Nov. 23Q3: For each of the statements below, please indicate how much you agree or disagree. (Top 4 box, Agree), by political affiliation.
17
Percent of U.S. respondents who agree with each of the following statements
26
26
38
52
56
47
53
53
58
67
Products and services from Mexico are of low quality
NAFTA has killed more jobs in the U.S. than it has created
Mexico does not have adequate laws to protect the environment
Mexico does not pay its workers a fair wage
There is a lot of corruption within the Mexican government
Republican
Democrat
Bipartisan agreement on corruption and unfair wages
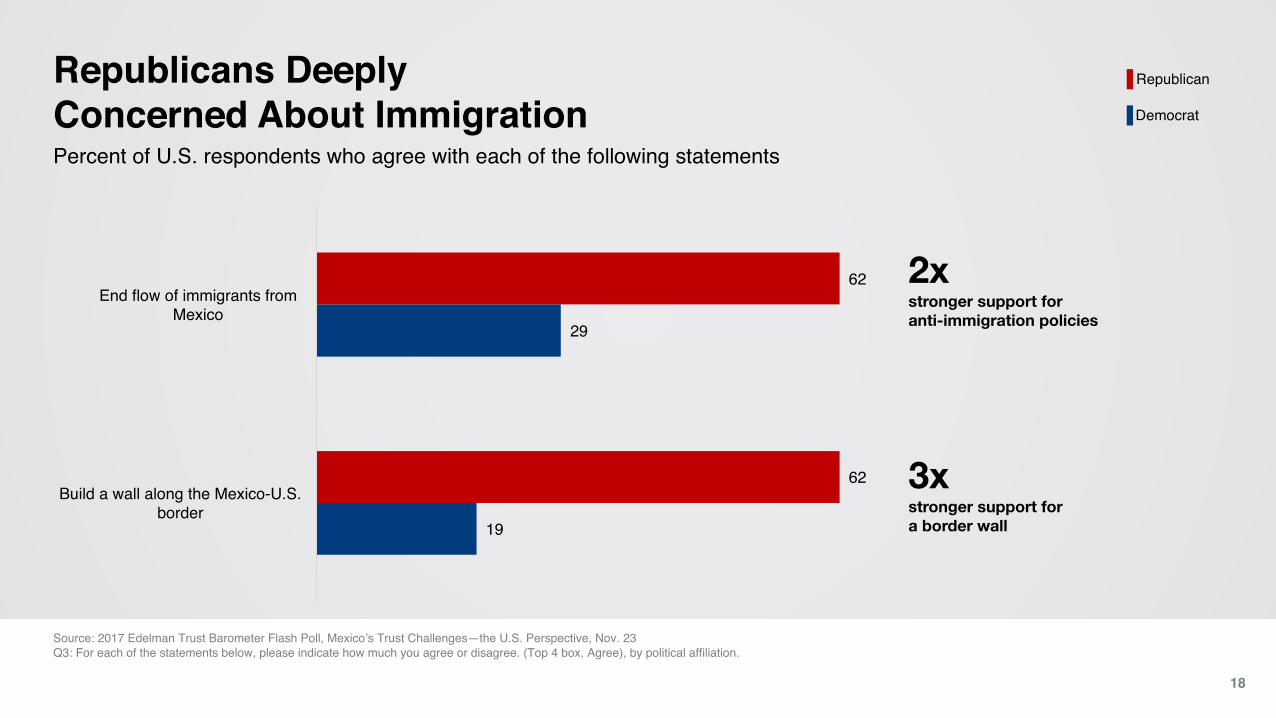
Republicans Deeply Concerned About Immigration
Source: 2017 Edelman Trust Barometer Flash Poll, Mexico’s Trust Challenges—the U.S. Perspective, Nov. 23Q3: For each of the statements below, please indicate how much you agree or disagree. (Top 4 box, Agree), by political affiliation.
18
Percent of U.S. respondents who agree with each of the following statements
19
29
62
62
Build a wall along the Mexico-U.S. border
End flow of immigrants from Mexico
Republican
Democrat
2xstronger support for anti-immigration policies
3xstronger support for a border wall

1 in 2 Americans Believe it is Unsafe to Travel to Mexico
Source: 2017 Edelman Trust Barometer Flash Poll, Mexico’s Trust Challenges—the U.S. Perspective, Nov. 23 Q3: For each of the statements below, please indicate how much you agree or disagree. (Top 4 box, Agree), total and by political affiliation.
19
Percent of U.S. respondents who agree with each of the following statements
35
46
44
42
34
60
35
41
50
I feel uncomfortable travelling to Mexico given the negative things the President has said
I would eagerly go to Mexico for a vacation
It is dangerous for Americans to travel in Mexico
Republican
Democrat
All Americans
59% have never been to Mexico

Who is going to tell the real story about Mexico?
20

Average Person More Credible on Mexicothan Officials or the Media
Source: 2017 Edelman Trust Barometer Flash Poll, Mexico’s Trust Challenges—the U.S. Perspective, Nov. 23. Q2: In general, if you heard information about Mexico from each of the sources listed below, how credible would the information be to you--extremely credible, very credible, somewhat credible, or not credible at all? (Top 2 box, Credible)Source: 2017 Edelman Trust Barometer. Q130-747. Below is a list of people. In general, when forming an opinion of a company, if you heard information about a company from each person, how credible would the information be—extremely credible, very credible, somewhat credible, or not credible at all? (Top 2 Box, Very/Extremely Credible), question asked of half the sample. General Population, 28-country global total.
21
Percent of U.S. respondents who rate each spokesperson as extremely/very credible when hearing information about Mexico
21
21
22
26
28
30
31
34
36
39
CEO of a Mexican company
Mexican news media
Mexican government official
Mexico Tourism Board
Spanish language news media in the U.S.
Mainstream U.S. news media
The President of the U.S.
U.S. government officials who are Mexican American
Average person who has visited or lived in Mexico
Average person who is Mexican American Most credible spokespeople on companies:
60% Person like myself
60% Technical expert
60% Academic expert

Americans Who Have Visited Mexico Far More Likely to Trust Mexican Companies
Source: 2017 Edelman Trust Barometer Flash Poll, Mexico’s Trust Challenges—the U.S. Perspective, Nov. 23 Q1: First, we would like to focus on global companies headquartered in specific countries. (Top 4 Box, Trust), among those who have never been to Mexico vs. those who have visited Mexico.
22
Trust in companies headquartered in each country, among U.S. respondents …
28% Trust
43% Trust
…who have never been to Mexico (59% of total)
…who have visited Mexico (41% of total)

Americans Who Have Visited Mexico Far More Likely to Want a Stronger Relationship
23
Percent who agree, among U.S. respondents …
“America’s interests will best be served by building a stronger, more
collaborative relationship with Mexico”54% 71%
Source: 2017 Edelman Trust Barometer Flash Poll, Mexico’s Trust Challenges—the U.S. Perspective, Nov. 23 Q3: For each of the statements below, please indicate how much you agree or disagree. (Top 4 box, Agree), among those who have never been to Mexico vs. those who have visited Mexico.
…who have never been to Mexico (59% of total)
…who have visited Mexico (41% of total)
agree agree

24
Building a Stronger U.S. - Mexico Relationship
1.Refute the negatives
2. Address U.S. interests
3.Mobilize the travelers and experts
Thank You
1