


Languages
Pages
Legal


ECZACIBAfiI
BUILDING MATERIALS
COMPANY
ANNUAL REPORT 2001


3
Group Profile / Company Profile 5
Board of Directors 6
Message from the Chairman 8
Vitra Ceramic Sanitary Ware 10
Artema Sanitary Fittings 14
Report and Accounts for 2001 21
Balance Sheet 28
Notes to the Balance Sheet 30
Statement of Income 43
Notes to the Statement of Income 44
Statement of Retained Earnings 47
Statement of Sources and Uses of Funds 48
Statement of Cash Flows 49
Statement of Cost of Goods Sold 50
Independent Auditor’s Report 51
CONTENTS

4
Eczac›bafl› is a prominent Turkish industrial group with a
combined net turnover of $1.2 billion, 37 companies and
more than 7,200 employees in 2001. Eczac›bafl›’s core
sectors are pharmaceuticals, building materials and
consumer products. The Group is also active in finance,
information technology and welding technology.
In Turkey, Eczac›bafl› is the leader in seven of its 12
industries, including pharmaceuticals, ceramic sanitary
ware, tissue paper and personal care products. It also has
the most extensive distribution coverage, reaching over 90
percent of the nation’s sales points.
International partnership is a central component of the
Eczac›bafl› Group’s growth strategy. Eczac›bafl› has 10 joint
ventures and close to 30 cooperation agreements with
leading international companies. All of these are grounded
on the principle of long-term mutual benefit, based on firm
business criteria and ethical business practices.
Founded in 1942 by Dr. Nejat F. Eczac›bafl›, the Eczac›bafl›
Group takes its name from the honorary title "chief
pharmacist", conferred on the father of Dr. Eczac›bafl› at
the turn of the last century. The Eczac›bafl› Group’s
mission is to be a pioneer of modern, high quality and
healthy lifestyles. Accordingly, the Group encourages each
of its companies to surpass established standards in their
sectors and raise consumer benchmarks of product and
service quality. Through sponsorship and responsible
corporate practices, it also promotes social and economic
development that nurtures cultural and scientific activity,
protects the environment and preserves scarce natural
resources.
Eczac›bafl› Holding is the parent company of the Eczac›bafl›
Group. This is a family-owned, professionally managed
company now directed by the second generation. Five
Group companies are traded on the Istanbul Stock
Exchange, including Eczac›bafl› Pharmaceuticals Company,
Eczac›bafl› Building Materials Company and Intema Building
Materials Marketing and Sales Company.
5
GROUP PROFILE COMPANY PROFILE
Eczac›bafl› Building Materials Company (EYAP) comprises
two divisions: Vitra Ceramic Sanitary Ware, Turkey’s
leading producer of ceramic sanitary ware, and Artema
Sanitary Fittings, Turkey’s largest supplier of single lever
mixers. In Turkey, Vitra and Artema primary serve the
quality-conscious, high-income consumer segments, where
they compete successfully with prestigious international
brands. Vitra and Artema also export over half their sales
to major markets in Europe and North America. Vitra is
particularly strong in Germany and the UK, where it has
respective market shares of 12 percent and 5 percent.
Artema’s main export market is the US, but it is rapidly
increasing its presence in Europe as well.
The main shareholders of Eczac›bafl› Building Materials
Company are Eczac›bafl› Holding Company (52.02 percent)
and Intema Building Materials and Marketing Company (11.0
percent). Twenty-nine percent of the company is traded on
the Istanbul Stock Exchange.
6

7
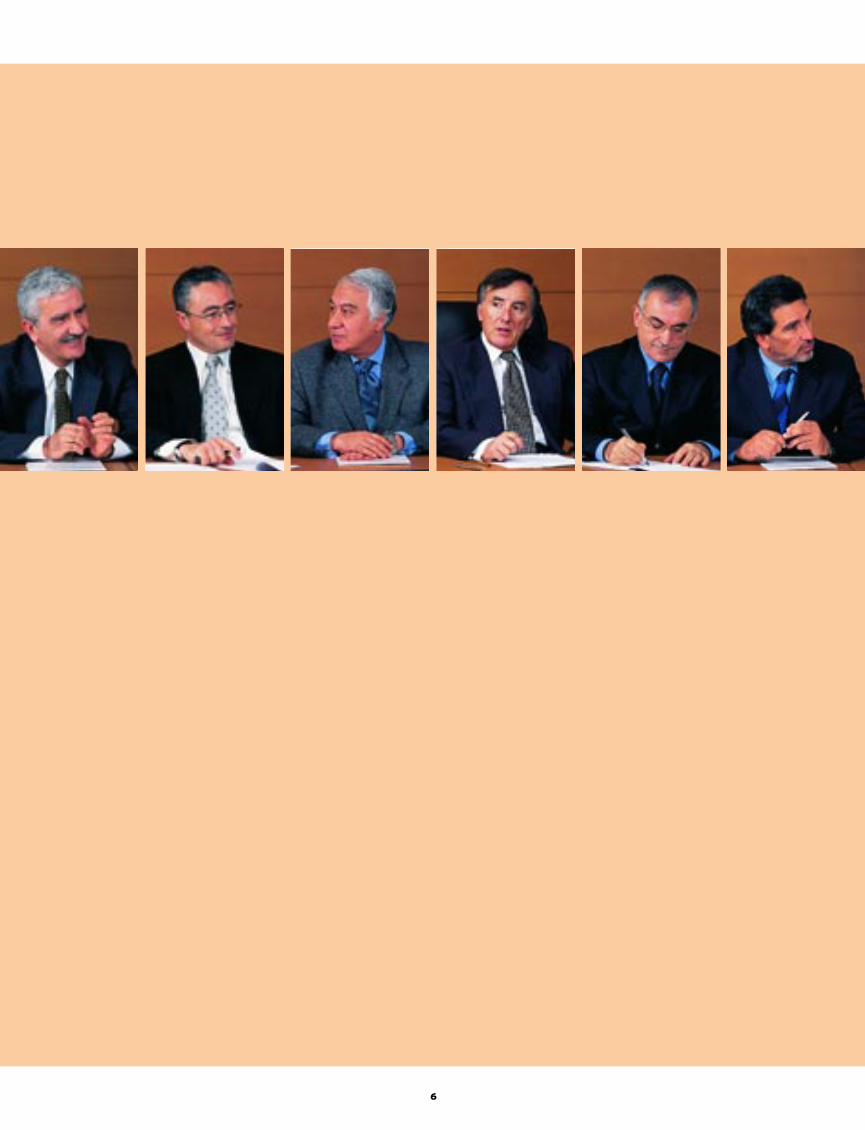
(From left to right)
N. Atila Ildafl Director
Hüsamettin Onanç Director
A. Tayfun ‹ndirkafl Director
F. Bülent Eczac›bafl› Chairman
M. Reflat Alatal› Director
A. fiadi Burat Director
Ahmet T. Yamaner Director
Engin Bayraktar Director
BOARD OF DIRECTORS
8
Eczac›bafl› Building Materialsachieved a solid performance in2001.
In Turkey, where domesticdemand and construction activityplunged, Eczac›bafl› BuildingMaterials reinforced its standingin both the premium and economy
segments of the ceramic sanitary ware and fittings markets. During theyear, Eczac›bafl› launched more than 100 new products aimed atreinforcing its reputation for innovative design and functionality in thepremium segment and enhancing its offer of quality-for-value products inthe middle and economy segments.
Abroad, Eczac›bafl› Building Materials continued to expand itsdistribution reach in targeted export markets. Backed by its strongbrand position in the domestic market, Eczac›bafl› has increasinglyfocused on developing its share in major export markets. Today,exports account for 70-75 percent of total sales. Eczac›bafl› BuildingMaterials’ long-term goal is to transform Vitra and Artema intoglobal brands.
EYAP-Vitra Ceramic Sanitary Ware exported 74 percent of its totalsales in 2001, advancing its position in Germany, Britain, the United
MESSAGE FROM THE CHAIRMAN

9
States, France, Portugal, Israel and Scandinavian countries. It alsoinitiated exports to China, India, South Africa and several MiddleEastern countries, raising the number of its export markets to 51.Looking ahead, Vitra finalized cooperation agreements with severalinternational bathroom and furniture companies that will contributesignificantly to export sales in the coming years.
EYAP-Artema Sanitary Fittings also extended its export reach in2001, raising the number of its export markets from 29 to 36 andstrengthening its cooperation agreements with international companies.Last year, the world’s largest DIY hypermarket chain, IKEA,increased its product orders from Artema from two categories to 30,leading to a sharp increase in business between the two companies.Despite adverse conditions in Turkey’s financial markets, Artemacompleted a major investment in a new plating unit that will enable it tooffer life-long guarantees on products coated with this specialtechnology.
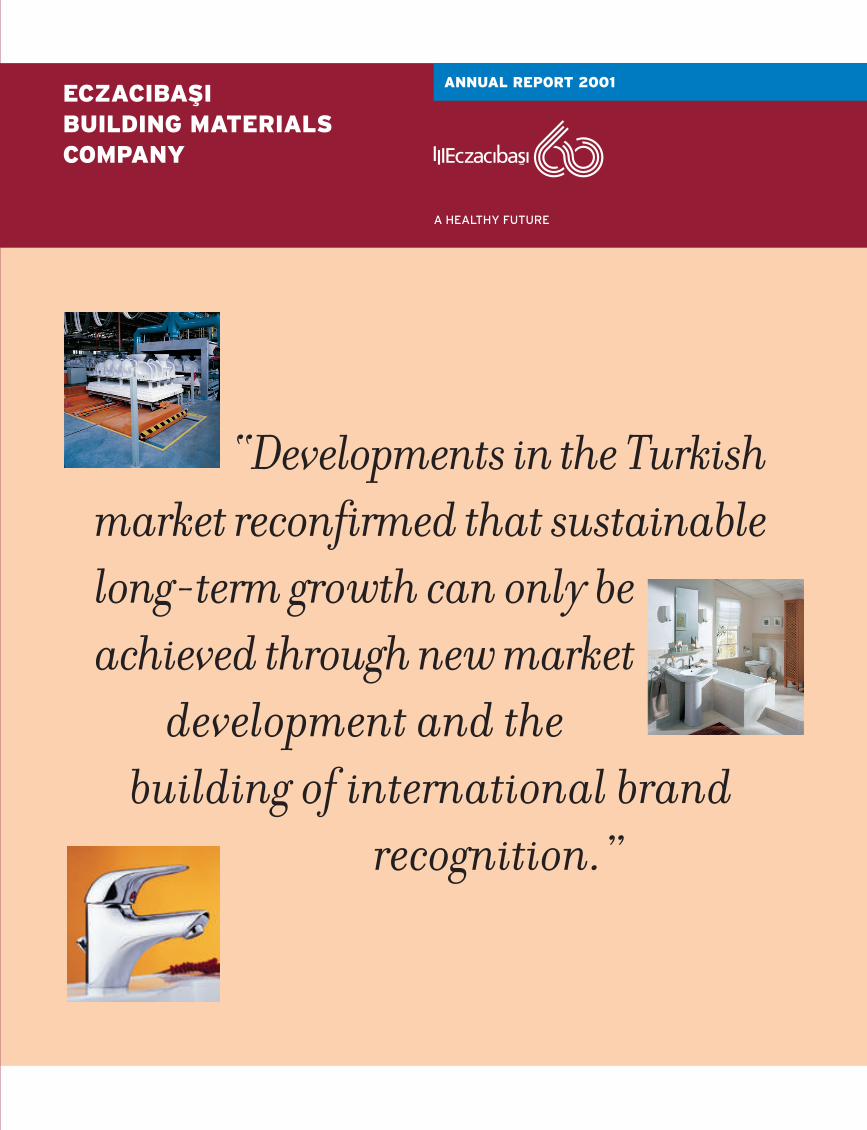
Last year, developments in the Turkish market reconfirmed the wisdomof Eczac›bafl› Building Materials’ long-standing focus on exports. Webelieve that sustainable long-term growth can only be achieved throughnew market development and the building of international brandrecognition. Eczac›bafl› Building Materials is making steady progressin both areas.
BÜLENT
ECZACIBAfiI

10
Vitra is Turkey’s leading supplier and exporter of high
quality ceramic sanitary ware for bathrooms and kitchens.
With an annual capacity of 3.5 million big pieces and state-
of-the-art technology, Vitra’s plant in Bozüyük, Turkey,
ranks among the world’s top three in terms of capacity and
product quality. Founded in 1958, Vitra‘s mission is to raise
continually the standards for modern bathrooms through
innovative, high quality products that revolutionize the
look and functionality of bathrooms and enhance consumer
value. Vitra aims to become a global brand by extending
this mission to international markets.
REVIEW OF OPERATIONS
VITRA
CERAMIC SANITARY WARE

11
Vitra achieved a solid performance in 2001, strengthening
its domestic brand leadership while expanding its presence
in major export markets.
In Turkey, where the economic crisis and sharp decline in
disposable income further exacerbated stagnant conditions
in the construction market, Vitra bolstered its market share
with new product launches and marketing campaigns aimed
at increasing distributor and consumer awareness of
innovative product attributes.
Abroad, Vitra continued efforts to build sizeable and
sustainable market shares in major international markets, a
strategy it has pursued actively for more than two decades.
In 2001, Vitra directed more than 70 percent of its sales to
51 export markets and established several new strategic co-
operation agreements with global companies.
Vitra has a particularly strong reputation in the German and
UK markets, where it has respective market shares of 12
percent and 5 percent. In 2001, Vitra accelerated
preparations to expand its sales in the premium segment of
the German market and raise its overall market share in the
UK to 10 percent within a few years time.
One of Vitra’s top priorities is to establish a strong foothold
in the large and highly competitive US market. Last year,
Vitra took a major step towards achieving this goal with the
establishment of a wholesaler network that will expand its
reach to distributors and retailers from New England to
California.
In France, Vitra expanded its export volume by 48 percent
in 2001 and the number of its customers to more than 100.
New agreements with large customers and wholesaler
groups contributed to this achievement, as did the
establishment of customer warehouses and improvements in
logistic services. In Italy, cooperation agreements enabled
Vitra to augment its share of this market to 2 percent.
Vitra became the leading international supplier of ceramic
sanitary ware to Scandinavian markets in 2001. Last year,
Vitra activated a large warehousing operation in Denmark to
facilitate quick and efficient supplies to customers in
Denmark, Sweden, Finland and Norway.
Measures taken in other European markets also yielded
good results. Strong sales to Spain, the Czech Republic and
MARKET DEVELOPMENTS
12
Malta were complemented by first-time exports to
Lithuania and an expanded presence in the luxury segments
of the Portuguese and Croatian markets. To reinforce sales
in neighboring Greece, Vitra established a wide-reaching
distribution network with regional wholesalers.
In recent years, Vitra has also increased its marketing
activity in Asian and Pacific markets. Vitra aims to acquire
a 10 percent share of the Israeli market, where it is already
the best known building material brand. In 2001, Vitra also
initiated contacts with distributors in Yemen and Palestine
and finalized commercial agreements with large-scale
distributors in Algeria and Tunisia. New showrooms in
Lebanon, Saudi Arabia and the United Arab Emirates
continued to boost sales in these markets, as did strong
distribution channels and showroom networks in Australia
and New Zealand. In a major move last year, Vitra also
established sales networks in India and China, opening the
door for exports to these giant markets.
One of Vitra’s major marketing achievements in 2001 was
the establishment of cooperation agreements with three
global companies. Last year, Vitra signed cooperation
agreements with Toto and Kohler and became the exclusive
supplier of ceramic sanitary ware products to IKEA, the
world’s largest DIY hypermarket chain.
Vitra’s long-term goal is to become a global brand. To raise
the prestige and recognition of its brand in international
markets, Vitra is continually expanding the number of its
showrooms and its marketing activities abroad. In 2001,
Vitra participated in several international fairs, including
the ISH fair in Germany, the Mosbuild fair in Russia, the
Kievbuild fair in the Ukraine and the Cersaie fair in Italy.
Vitra manufactures ceramic toilet bowls, reservoirs, wash
basins, basin stands, bidets, pissoirs, kitchen sinks, shower
stalls and a variety of ceramic accessories. It also
produces toilet seats, built-in reservoirs, flushing systems,
hand bars and seats for the elderly and disabled, as well as
complementary products for bathroom sets.
In 2001, Vitra launched 85 new products and four
bathroom sets aimed at enhancing its prestigious image in
domestic and export markets: Nuova, Mona, Katia and Mia.
Nuova and Mona are geared to consumers seeking unique
and modern designs; Katia and Mia offer ergonomic designs
with a classic feel. All together, Vitra produces 14 complete
bathroom suites for a wide variety of lifestyles.
Most of Vitra’s new products incorporate innovative
technological features, such as water-saving and photocell
flushing systems and hygiene-enhancing surfaces. Last
year, Vitra expanded the range of products under its
VitrAclean and VitrAhygiene labels, which refer to special
technologies that prevent the accumulation of dirt and
bacteria on surfaces. First applied to ceramic sanitary
ware, Vitra now offers anti-bacterial options for toilet
seats and acrylic shower trays as well.
All Vitra products are certified by the Turkish Standards
Institute (TSE) as well as by the standards institutes of
major export markets. These include, among others,
certifications from Germany, the UK, France, Holland,
Denmark, the US, Israel, Australia, Canada and Russia.
Vitra obtained ISO 9001 Quality Systems Certification in
1994 and ISO 14001 Environmental Management Systems
Certification in 1998. Vitra is the only ceramic sanitary
ware producer in Turkey and the second in the world to
receive ISO 14001, a demonstration of its singular
commitment to protecting the environment and preserving
scarce natural resources.
NEW PRODUCT LAUNCHES

13

14
Artema is the leading supplier of single lever mixers to the
Turkish market and the second largest sanitary fittings
producer overall, with a combined annual capacity of 5
million chrome-plated, color-finished and brass faucet
batteries. In addition to sanitary fittings for bathrooms and
kitchens, Artema manufactures bathroom accessories.
Artema’s mission is to provide bathroom and kitchen
solutions that surpass customer expectations of quality,
design and functionality.
ARTEMA
SANITARY FITTINGS

15
Artema maintained its strong share in the Turkish market
in 2001 while increasing its export markets and
strengthening its business with global companies.
Artema used the sharp contraction in domestic building
material sales in 2001 to review its competitive position in
the Turkish market and initiate a series of measures aimed
at strengthening its domestic market share in coming
years. Based on a careful analysis of competitor products
and market segments, Artema adjusted its product
development plans and stepped up marketing activities
aimed at communicating product attributes to dealers and
consumers.
Abroad, Artema was particularly successful in expanding
its export reach, raising the number of its export markets
from 29 to 36 in 2001, four more than originally planned.
Product and brand communication were the key objectives
of Artema’s international marketing activity last year.
Here, Artema focused primarily on target export markets
Germany, Sweden, Israel, the UK, Italy, Poland, Australia as
well as Middle Eastern and CIS republics providing
training to sales and marketing teams distributing Artema
products. It also participated in major international fairs in
these markets, including the ISH fair in Germany, the
Mosbuild fair in Russia, the Kievbuild fair in the Ukraine,
the Cersaie fair in Italy and the Interbuild fair in Australia.
Artema’s strong export record 65 percent of sales in
2001 reflects the strength of its international customer
portfolio. Business with these customers has increased
steadily over the last decade, indicating high satisfaction
with Artema’s product quality and customer services. As
of end-2001, 40 of its 69 large international customers
were concluding their fourth consecutive year of business
with Artema.
Artema’s single largest customer is Moen Inc., the leading
supplier of faucets to the US market. In 2000, Artema also
became a preferred supplier of IKEA, the world’s largest
DIY hypermarket chain. Last year, IKEA increased its
orders from two product categories to 30, leading to a
sharp increase in business between the two companies.
IKEA’s satisfaction with Artema’s performance was
confirmed by its selection of Artema for its 2001 IKEA
Most Successful Supplier, Second Prize. As of end-2001,
Artema products were available in more than 150 IKEA
sales points in 30 countries.
MARKET DEVELOPMENTS
16
NEW PRODUCT DEVELOPMENTMANAGING THE 2001
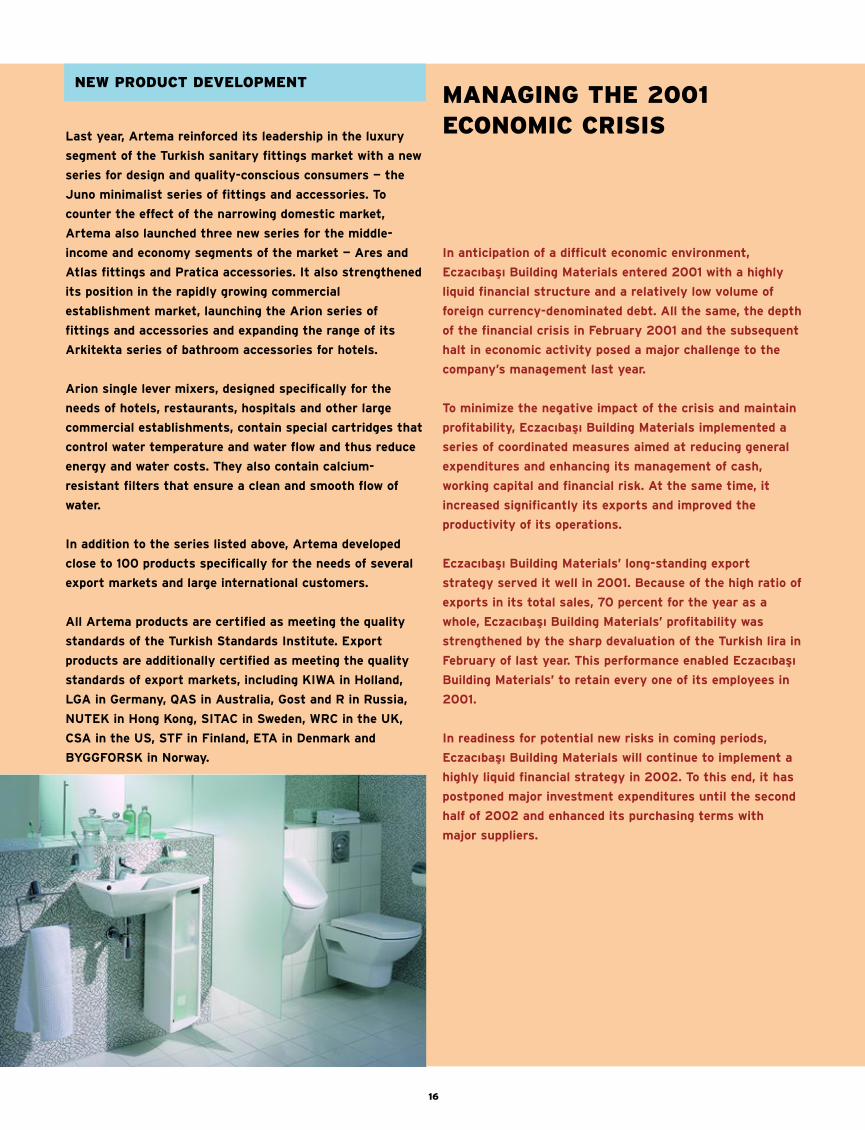
ECONOMIC CRISISLast year, Artema reinforced its leadership in the luxury
segment of the Turkish sanitary fittings market with a new
series for design and quality-conscious consumers — the
Juno minimalist series of fittings and accessories. To
counter the effect of the narrowing domestic market,
Artema also launched three new series for the middle-
income and economy segments of the market — Ares and
Atlas fittings and Pratica accessories. It also strengthened
its position in the rapidly growing commercial
establishment market, launching the Arion series of
fittings and accessories and expanding the range of its
Arkitekta series of bathroom accessories for hotels.
Arion single lever mixers, designed specifically for the
needs of hotels, restaurants, hospitals and other large
commercial establishments, contain special cartridges that
control water temperature and water flow and thus reduce
energy and water costs. They also contain calcium-
resistant filters that ensure a clean and smooth flow of
water.
In addition to the series listed above, Artema developed
close to 100 products specifically for the needs of several
export markets and large international customers.
All Artema products are certified as meeting the quality
standards of the Turkish Standards Institute. Export
products are additionally certified as meeting the quality
standards of export markets, including KIWA in Holland,
LGA in Germany, QAS in Australia, Gost and R in Russia,
NUTEK in Hong Kong, SITAC in Sweden, WRC in the UK,
CSA in the US, STF in Finland, ETA in Denmark and
BYGGFORSK in Norway.
In anticipation of a difficult economic environment,
Eczac›bafl› Building Materials entered 2001 with a highly
liquid financial structure and a relatively low volume of
foreign currency-denominated debt. All the same, the depth
of the financial crisis in February 2001 and the subsequent
halt in economic activity posed a major challenge to the
company’s management last year.
To minimize the negative impact of the crisis and maintain
profitability, Eczac›bafl› Building Materials implemented a
series of coordinated measures aimed at reducing general
expenditures and enhancing its management of cash,
working capital and financial risk. At the same time, it
increased significantly its exports and improved the
productivity of its operations.
Eczac›bafl› Building Materials’ long-standing export
strategy served it well in 2001. Because of the high ratio of
exports in its total sales, 70 percent for the year as a
whole, Eczac›bafl› Building Materials’ profitability was
strengthened by the sharp devaluation of the Turkish lira in
February of last year. This performance enabled Eczac›bafl›
Building Materials’ to retain every one of its employees in
2001.
In readiness for potential new risks in coming periods,
Eczac›bafl› Building Materials will continue to implement a
highly liquid financial strategy in 2002. To this end, it has
postponed major investment expenditures until the second
half of 2002 and enhanced its purchasing terms with
major suppliers.
17
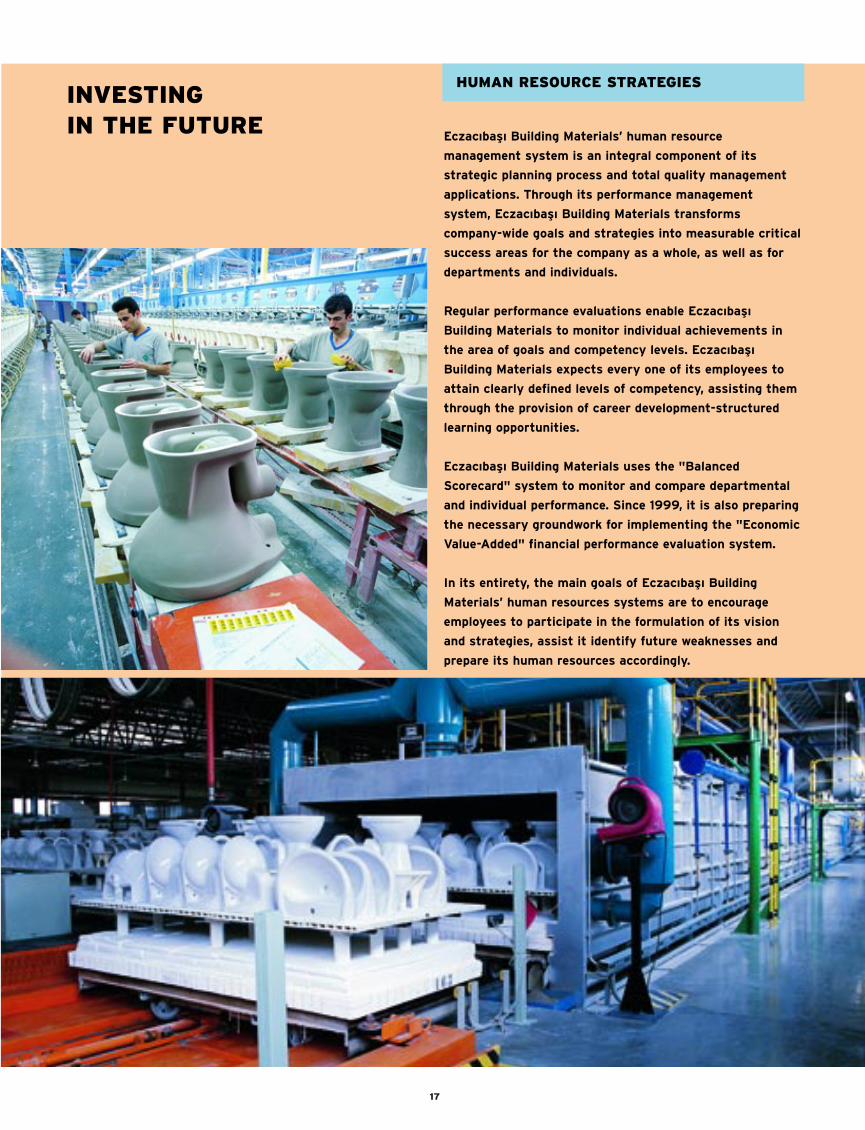
Eczac›bafl› Building Materials’ human resource
management system is an integral component of its
strategic planning process and total quality management
applications. Through its performance management
system, Eczac›bafl› Building Materials transforms
company-wide goals and strategies into measurable critical
success areas for the company as a whole, as well as for
departments and individuals.
Regular performance evaluations enable Eczac›bafl›
Building Materials to monitor individual achievements in
the area of goals and competency levels. Eczac›bafl›
Building Materials expects every one of its employees to
attain clearly defined levels of competency, assisting them
through the provision of career development-structured
learning opportunities.
Eczac›bafl› Building Materials uses the "Balanced
Scorecard" system to monitor and compare departmental
and individual performance. Since 1999, it is also preparing
the necessary groundwork for implementing the "Economic
Value-Added" financial performance evaluation system.
In its entirety, the main goals of Eczac›bafl› Building
Materials’ human resources systems are to encourage
employees to participate in the formulation of its vision
and strategies, assist it identify future weaknesses and
prepare its human resources accordingly.
HUMAN RESOURCE STRATEGIESINVESTING
IN THE FUTURE
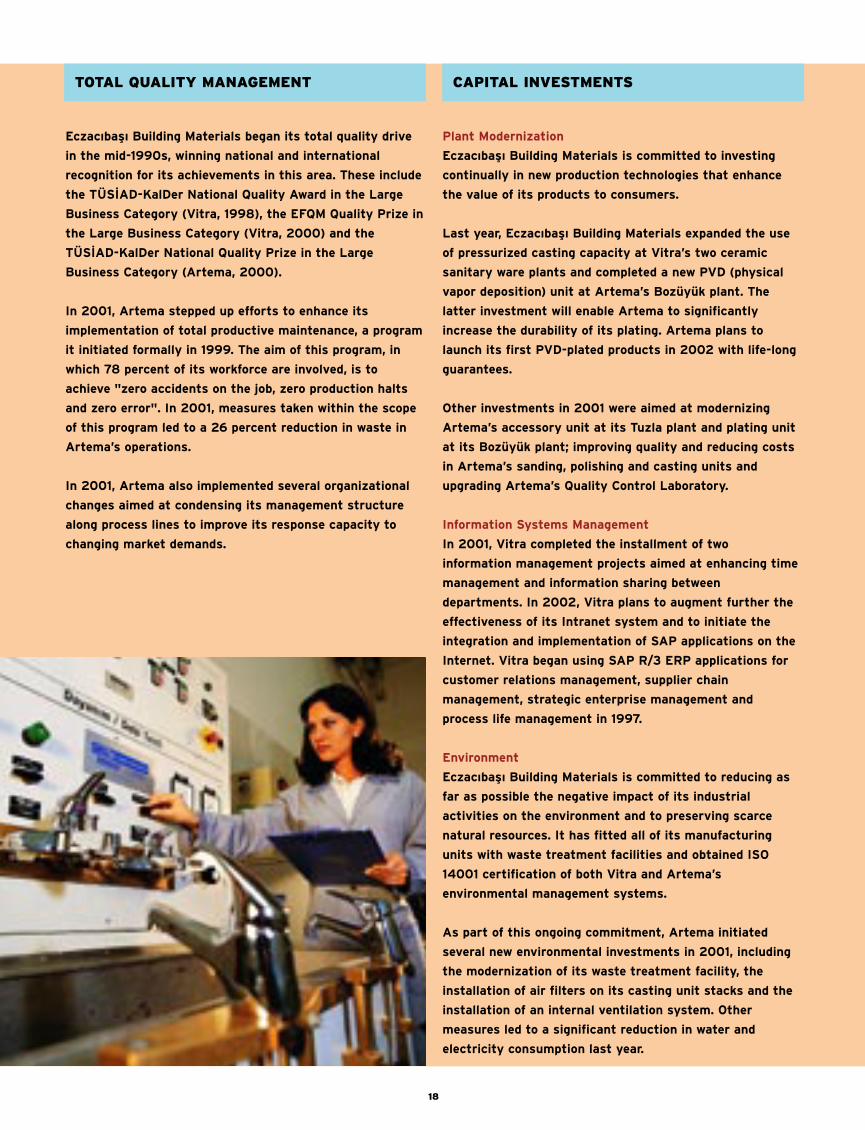
Eczac›bafl› Building Materials began its total quality drive
in the mid-1990s, winning national and international
recognition for its achievements in this area. These include
the TÜS‹AD-KalDer National Quality Award in the Large
Business Category (Vitra, 1998), the EFQM Quality Prize in
the Large Business Category (Vitra, 2000) and the
TÜS‹AD-KalDer National Quality Prize in the Large
Business Category (Artema, 2000).
In 2001, Artema stepped up efforts to enhance its
implementation of total productive maintenance, a program
it initiated formally in 1999. The aim of this program, in
which 78 percent of its workforce are involved, is to
achieve "zero accidents on the job, zero production halts
and zero error". In 2001, measures taken within the scope
of this program led to a 26 percent reduction in waste in
Artema’s operations.
In 2001, Artema also implemented several organizational
changes aimed at condensing its management structure
along process lines to improve its response capacity to
changing market demands.
18
TOTAL QUALITY MANAGEMENT
Plant Modernization
Eczac›bafl› Building Materials is committed to investing
continually in new production technologies that enhance
the value of its products to consumers.
Last year, Eczac›bafl› Building Materials expanded the use
of pressurized casting capacity at Vitra’s two ceramic
sanitary ware plants and completed a new PVD (physical
vapor deposition) unit at Artema’s Bozüyük plant. The
latter investment will enable Artema to significantly
increase the durability of its plating. Artema plans to
launch its first PVD-plated products in 2002 with life-long
guarantees.
Other investments in 2001 were aimed at modernizing
Artema’s accessory unit at its Tuzla plant and plating unit
at its Bozüyük plant; improving quality and reducing costs
in Artema’s sanding, polishing and casting units and
upgrading Artema’s Quality Control Laboratory.
Information Systems Management
In 2001, Vitra completed the installment of two
information management projects aimed at enhancing time
management and information sharing between
departments. In 2002, Vitra plans to augment further the
effectiveness of its Intranet system and to initiate the
integration and implementation of SAP applications on the
Internet. Vitra began using SAP R/3 ERP applications for
customer relations management, supplier chain
management, strategic enterprise management and
process life management in 1997.
Environment
Eczac›bafl› Building Materials is committed to reducing as
far as possible the negative impact of its industrial
activities on the environment and to preserving scarce
natural resources. It has fitted all of its manufacturing
units with waste treatment facilities and obtained ISO
14001 certification of both Vitra and Artema’s
environmental management systems.
As part of this ongoing commitment, Artema initiated
several new environmental investments in 2001, including
the modernization of its waste treatment facility, the
installation of air filters on its casting unit stacks and the
installation of an internal ventilation system. Other
measures led to a significant reduction in water and
electricity consumption last year.
CAPITAL INVESTMENTS

19
The Eczac›bafl› Group’s founder, Dr. Nejat F. Eczac›bafl›,
firmly believed that corporations had a fundamental
responsibility to contribute to the healthy development of
their communities through sponsorship of the arts,
education, scientific research and sports. Today, this
continues to be one of the core values of the Eczac›bafl›
Group.
In line with this commitment, Vitra provides substantial
monetary support to three of Turkey’s leading cultural
foundations the Dr. Nejat F. Eczac›bafl› Foundation, the
Istanbul Foundation for Culture and the Arts and the Izmir
Culture, Arts and Education Foundation. It also sponsors
the "Vitra Ceramic Art Studio", a project it founded in
1997 to promote ceramic art and raise public awareness of
this medium.
In 2001, Vitra organized two exhibitions of ceramic art
produced by nine artists at the workshop and hosted a
Turkish-Greek Ceramic Symposium aimed at reinforcing the
bonds of friendship between the two countries. In parallel
with this friendship theme, Vitra chose the world’s oldest
known peace treaty, the Kadesh Agreement, as the model
for its 2001 limited "Anatolia Collection" series.
Artema is a long-time sponsor of the Eczac›bafl› Sports
Club, which the Eczac›bafl› Group founded in 1966 to
promote sports among young people. Over the years, the
club has trained some of Turkey’s best basketball,
volleyball and table tennis athletes; today, its primary
objective is to prepare young women for its professional
volleyball team, which has an impressive record in both
national and international tournaments. Artema also
provides monetary and logistic support to a number of
public organizations in its community.
CORPORATE
REPONSIBILITY

20
21
REPORT AND ACCOUNTS 2001ECZACIBAfiI
BUILDING MATERIALS
COMPANY
I. Introduction
1. Period Covered by the Report
This report covers the activities of EYAP from January 1, 2001 to December 31, 2001.
2. Company Name
Eczac›bafl› Building Materials Industry and Trading Company (EYAP).
3. Board of Directors
F. Bülent Eczac›bafl› Chairman
M. Reflat Alatal› Executive Director
A. fiadi Burat Executive Director
A. Tayfun ‹ndirkafl Executive Director
Engin Bayraktar Director
N. Atila ‹ldafl Director
Hüsamettin Onanç Director
Ahmet T. Yamaner Director
The Board of Directors was elected at the April 18, 2001 General Shareholders' Meeting for a
period of one year.
Auditor
Ülkü Kabaday›
The auditor was appointed to serve until the examination of the accounts at the General
Shareholders' meeting.
4. Shareholders' Registered and Paid-in Capital
Registered Capital TL10,000,000,000,000
Paid-in Capital TL2,500,000,000,000
Profit before tax TL16,613,1 17,067,159
As it is a publicly-traded company, the exact number of EYAP shareholders is not known.
The value of the Company's shares fluctuated over the year parallel to movements in the
composite index of the Istanbul Stock Exchange. The 2001 closing price per share was TL
28,500.
In 1998 and 2000, the Company transferred profits to reserves. In 1999, the Company retained
all of its profit, amounting to TL 359,493,827,113, and used this to increase its capital in 2000.
22
ECZACIBAfiI
BUILDING MATERIALS COMPANY
REPORT AND ACCOUNTS FOR 2001

23
The list of shareholders owning 10% or more of Company shares is as follows:
Shareholder Share Value (TL) Share (%)
Eczac›bafl› Holding Company 1,300,411,430,000 52,02
Intema Building and Installation Materials Investment and Marketing Company 275,000,000,000 11,00
II. Activities
A) Investments
In 2001, the Company invested a total of TL 8.789,5 billion ($ 7,256,000) in improving Vitra and Artema's plants.
All of the investments benefited from investment incentives.
Description Total Investment Incentive Certificate
of the Investment (TL Billion) Date & Number Incentives
Artema modernization 4,757 12.05.1999-3278 100% Investment allowance
100% Duty free import
VAT exemption
Exemption from taxes and fees
Artema capacity increase 2,309 11.06.2000-3533 100% Investment allowance
100% Duty free import
VAT exemption
Exemption from taxes and fees
Vitra-Bozüyük modernization 1,691 30.04.2001-3743 60% Investment allowance
100% Duty free import
VAT exemption
Exemption from taxes and fees
Vitra-Kartal modernization 1,464 30.04.2001-3747 40% Investment allowance
100% Duty free import
VAT exemption
Exemption from taxes and fees
Vitra-Bozüyük modernization 427 26.04.2000-3502 100% Investment allowance
100% Duty free import
VAT exemption
Exemption from taxes and fees
Vitra-Bozüyük modernization 364 01.05.2000-3508 100% Investment allowance
100% Duty free import
VAT exemption
Exemption from taxes and fees

B) Developments in Products and Services
Capacity Utilization Ratios (%) 2001 2000
Ceramic Sanitary Ware 90 90
Sanitary Fittings 85 100
Output (' 000 Units) 2001 2000 (%) Change
Ceramic Sanitary Ware 3,034 3,065 -1
Duroplast Toilet Seats and Covers 195 255 -23
Chrome-Plated Fittings 1,451 1,719 -16
Brass Products 84 154 -45
Accessories 351 302 16
Other Products * 9,301 10,085 -8
* Parts of sanitary fittings sold to external producers
4. EYAP achieved net sales of TL 137,286.9 billion in 2001. Of this amount, TL 41,361.2 billion
comprised sales to the Turkish market and TL 95,925.7 billion comprised export sales. In 2001,
Vitra and Artema's domestic sales increased by 25.7% and 9% respectively, while their export
sales rose by 139% and 96.7% relative to the previous year.
Net Sales (TL Million)
2001 2000 Increase Change (%)
Domestic Sales
Vitra 21,843,631 17,373,614 4,470,017 25.7
Artema 19,517,537 17,846,419 1,671,118 9.3
Exports
Vitra 59,594,549 24,930,563 34,663,986 139.0
Artema 36,331,255 18,468,764 17,862,491 96.7
24
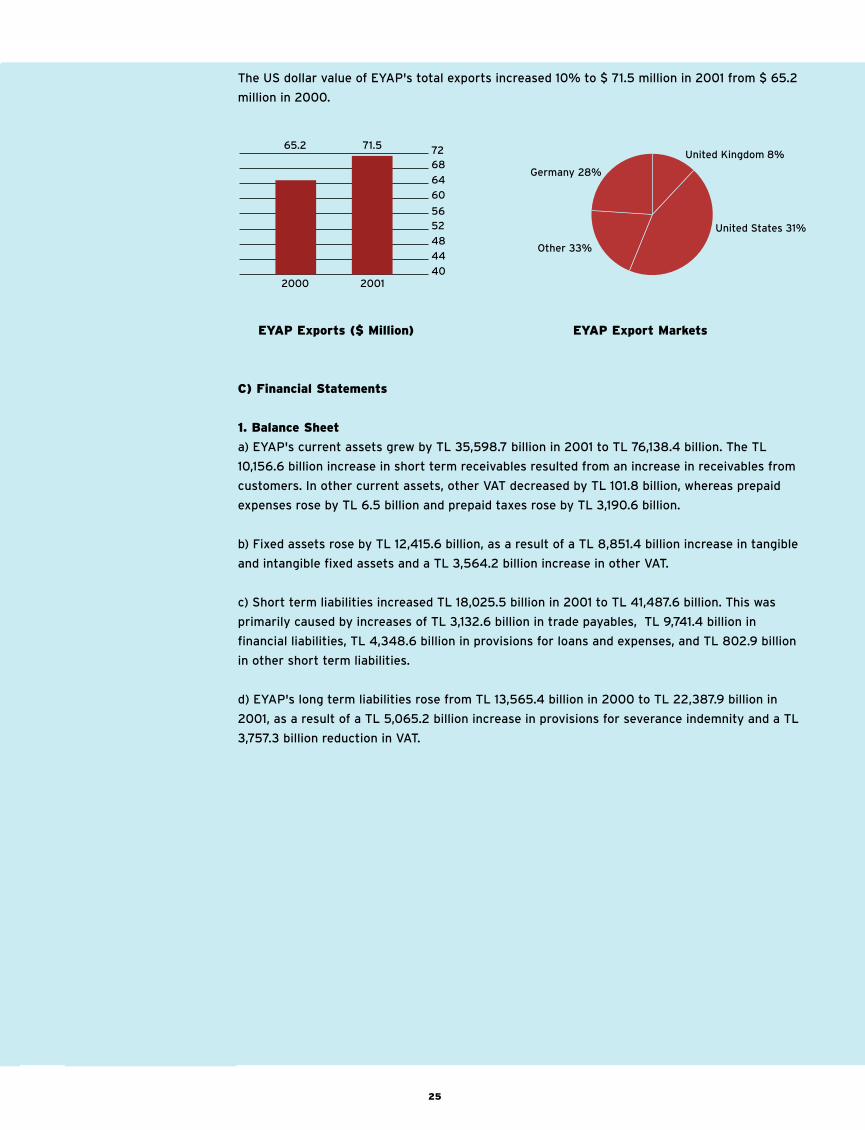
The US dollar value of EYAP's total exports increased 10% to $ 71.5 million in 2001 from $ 65.2
million in 2000.
EYAP Exports ($ Million) EYAP Export Markets
C) Financial Statements
1. Balance Sheet
a) EYAP's current assets grew by TL 35,598.7 billion in 2001 to TL 76,138.4 billion. The TL
10,156.6 billion increase in short term receivables resulted from an increase in receivables from
customers. In other current assets, other VAT decreased by TL 101.8 billion, whereas prepaid
expenses rose by TL 6.5 billion and prepaid taxes rose by TL 3,190.6 billion.
b) Fixed assets rose by TL 12,415.6 billion, as a result of a TL 8,851.4 billion increase in tangible
and intangible fixed assets and a TL 3,564.2 billion increase in other VAT.
c) Short term liabilities increased TL 18,025.5 billion in 2001 to TL 41,487.6 billion. This was
primarily caused by increases of TL 3,132.6 billion in trade payables, TL 9,741.4 billion in
financial liabilities, TL 4,348.6 billion in provisions for loans and expenses, and TL 802.9 billion
in other short term liabilities.
d) EYAP's long term liabilities rose from TL 13,565.4 billion in 2000 to TL 22,387.9 billion in
2001, as a result of a TL 5,065.2 billion increase in provisions for severance indemnity and a TL
3,757.3 billion reduction in VAT.
25
United Kingdom 8%
United States 31%
Other 33%
2000 2001
65.2 71.5
Germany 28%
72
68
64
60
56
52
48
44
40

2.Statement of income
a) In 2001, EYAP's net sales increased by TL 58,667.6 billion to TL 137,286.9 billion. Of this
amount, TL 95,925.8 billion was generated from exports and TL 41,361.1 billion from sales to the
domestic market.The US dollar value of FOB exports was $ 71.5 million.
b) The cost of goods sold increased to TL 72,760.7 billion in 2001 from TL 50,561.4 billion in
2000.
c) Sales and marketing expenses rose by TL 12,178.3 billion to TL 21,986.4 billion, while general
administrative expenses increased by TL 4,848.4 billion to TL 16,003.6 billion.
d) Financial expenses increased by TL 13,289.9 billion to TL 16,106.2 billion.
3.Financial Ratios
EYAP's key financial ratios for 2001 and 2000 were as follows:
Ratios 2001 2000
Current Ratio 1.84 1.71
Liquidity Ratio 1.15 1.04
Total Debts/Total Assets 0.15 0.53
Shareholders' Equity/Total Assets 0.46 0.47
Shareholders' Equity/Total Debts 0.84 0.88
Operating Income/Net Sales 0.15 0.07
Profit Before Taxes/Net Sales 0.22 0.06
26

D) Administrative Activities
1.Changes in the Number of Employees
New Departed End-Year Total
Union 20 82 1,171
Non-Union 40 40 510
Total 60 122 1,681
2.Implementation of Collective Bargaining Agreements
The Vitra Division's collective bargaining agreement, signed on May 19, 2001, will terminate on
December 31, 2002.
The Artema Division's collective bargaining agreement, signed on September 1, 2000, will
terminate on August 31, 2002.
3.Severance Indemnity
As of the end of 2001, the total amount accrued for severance indemnity was TL 14,022,352
million.
III) Recommended Distribution of Profits
The Company recommended that the whole of 2001 net profits be transferred to its retained
earnings.
The Board of Directors.
27

Assets Dec. 31, 2001 Dec. 31, 2000
I. Current Assets 76,138,361 40,539,634
A. Cash and Cash Equivalents 14,292,002 1,305,221
1 . Cash 7,527 9,578
2. Bank Deposits 14,256,804 1,282,908
3. Other 27,671 12,735
B. Securities 263,732 2,972,490
C. Short Term Receivables 30,406,634 20,250,011
1 . Accounts Receivable 27,794,694 14,312,784
2. Rediscount on Accounts Receivable (-) (432,778) (1,061,750)
3. Notes Receivable 3,048,014 7,004,038
4. Rediscount on Notes Receivable (-) (3,297) (5,062)
5. Deposits and Guarantees
6. Other Short Term Receivables 23,400 7,226
7. Provision for Bad Debts (-) (23,399) (7,225)
D. Other Short Term Receivables 2,764,284 466,815
1 . Receivables from Shareholders
2. Receivables from Affiliates
3. Other Receivables 2,764,284 466,815
E. Inventories 23,045,284 13,273,951
1 . Raw and Auxiliary Materials 6,369,364 3,056,269
2. Semi-Finished Goods 4,654,243 2,994,526
3. Finished Goods 11,165,924 6,907,763
4. Commodities 236,144 190,441
5. Other Inventories 71,813 55,205
6. Advance Payments for Inventories 547,796 69,747
F. Other Current Assets 5,366,425 2,271,145
II.Fixed Assets 41,327,416 28,911,839
A. Long Term Receivables 3,221 3,726
1 . Deposits and Guarantees 3,221 2,564
2. Other 1,162
B. Other Long Term Receivables
C. Financial Fixed Assets 27,330 27,330
D. Tangible Fixed Assets 31,613,570 23,063,473
1 . Land 13,328 3,007
2. Land Improvements 835,020 688,738
3. Buildings 12,561,425 8,186,718
4. Machinery and Equipment 78,682,013 52,833,808
5. Vehicles 1,572,923 1,139,241
6. Furniture and Fixtures 5,322,105 3,768,008
7. Other Tangible Fixed Assets 11,390 7,572
8. Accumulated Depreciation (-) (69,472,948) (45,517,878)
9. Investment-In-Progress 625,489 1,469,950
10. Advance Payments for Fixed Assets 1,462,825 484,309
E. Intangible Fixed Assets 1,506,458 1,204,623
1 . Rights 680,425 389,624
2. Research and Development Expenses 125,227 125,227
3. Other Intangible Fixed Assets 2,814,846 1,762,808
4. Accumulated Depreciation (-) (2,114,039) (1,073,037)
F. Other Fixed Assets 8,176,837 4,612,686
Total Assets 117,465,777 69,451,473
28
ECZACIBAfiI
BUILDING MATERIALS COMPANY
BALANCE SHEET
AT DECEMBER 31, 2001 AND 2000
(Turkish Liras in Million)

Liabilities and Shareholders' Equity Dec. 31, 2001 Dec. 31, 2000
I. Short-Term Liabilities 41,487,588 23,462,113
A. Financial Liabilities 21,779,465 12,038,109
1 . Bank Loans 3,101,718 3,591,042
2. Current Installments of
Long Term Credits and Equities 873
3. Other Financial Liabilities 18,677,747 8,446,194
B. Trade Payables 9,376,779 6,244,146
1 . Accounts Payable 9,332,959 6,201,687
2. Notes Payable 18,556 35,860
3. Deposits and Guarantees 27,671 12,735
4. Other
5. Rediscount on Payables (-) (2,407) (6,136)
C. Other Short Term Liabilities 3,274,437 2,471,534
1. Debts to Shareholders 413,966 946
2. Debts to Affiliates and Subsidiaries
3. Taxes and Duties Payable 2,032,579 1,752,595
4. Other 827,892 717,993
D. Provisions for Loans and Expenses 7,056,906 2,708,323
1 . Provisions for Taxes 6,585,144 2,488,118
2. Provisions for Prepaid Taxes
3. Provisions for Expenses 471,762 220,205
E. Others
II.Long-Term Liabilities 22,387,971 13,565,404
A. Financial Liabilities 373
1 . Bank Loans 373
B. Trade Payables 745 346
1 . Deposits and Guarantees 745 346
C. Other Long Term Liabilities 8,400,769 4,643,425
1. Other VAT 8,400,769 4,643,425
D. Provisions for Loans and Expenses 13,986,457 8,921,260
1 . Severance Indemnity 13,986,457 8,921,260
III. Shareholders' Equity 53,590,218 32,423,956
A. Paid-In Capital 2,500,000 2,500,000
B. Revaluation Fund 36,322,254 25,204,376
1 . Revaluation of Fixed Assets 36,322,254 25,204,376
2. Revaluation of Participations
3. Other Funds
C. Retained Earnings 4,739,991 2,050,653
1 . Legally Retained Earnings 433,201 305,165
2. Undistributed Profits 4,178,175 1,745,488
3. Other Reserves 128,615
D. Net Profit 10,027,973 2,668,928
Total Liabilities and Shareholders' Equity 117,465,777 69,451,473
29
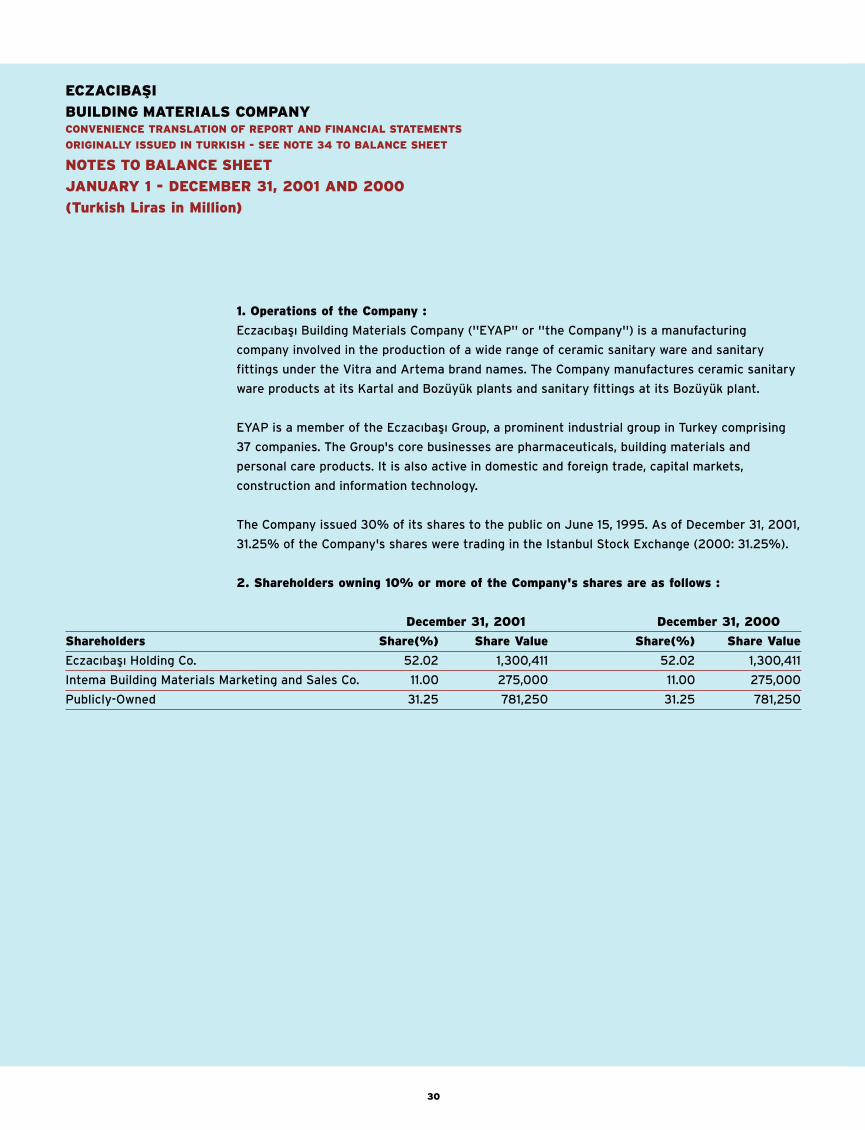
1. Operations of the Company :
Eczac›bafl› Building Materials Company (''EYAP'' or ''the Company'') is a manufacturing
company involved in the production of a wide range of ceramic sanitary ware and sanitary
fittings under the Vitra and Artema brand names. The Company manufactures ceramic sanitary
ware products at its Kartal and Bozüyük plants and sanitary fittings at its Bozüyük plant.
EYAP is a member of the Eczac›bafl› Group, a prominent industrial group in Turkey comprising
37 companies. The Group's core businesses are pharmaceuticals, building materials and
personal care products. It is also active in domestic and foreign trade, capital markets,
construction and information technology.
The Company issued 30% of its shares to the public on June 15, 1995. As of December 31, 2001,
31.25% of the Company's shares were trading in the Istanbul Stock Exchange (2000: 31.25%).
2. Shareholders owning 10% or more of the Company's shares are as follows :
December 31, 2001 December 31, 2000
Shareholders Share(%) Share Value Share(%) Share Value
Eczac›bafl› Holding Co. 52.02 1,300,411 52.02 1,300,411
Intema Building Materials Marketing and Sales Co. 11.00 275,000 11.00 275,000
Publicly-Owned 31.25 781,250 31.25 781,250
30
ECZACIBAfiI
BUILDING MATERIALS COMPANY
CONVENIENCE TRANSLATION OF REPORT AND FINANCIAL STATEMENTS
ORIGINALLY ISSUED IN TURKISH - SEE NOTE 34 TO BALANCE SHEET
NOTES TO BALANCE SHEET
JANUARY 1 - DECEMBER 31, 2001 AND 2000
(Turkish Liras in Million)

3. Privileges given to share stocks representing capital: None (2000: None).
4. Registered Capital: The Company's registered capital was TL 10,000,000,000,000 as of
December 31, 2001 and 2000.
5. Capital increases during the year and their sources: None (2000: The Company increased
its capital by TL 500 billion.)
6. Marketable securities other than share stock issued during the year: None (2000:None).
7. Marketable securities representing borrowings which expired during the year:
None (2000: None).
8. Movements of tangible fixed assets during the year:
Dec. 31, 2001 Dec. 31, 2000
a. Movements of tangible fixed assets during the year 8,849,227 7,470,118
b. Total cost of tangible fixed assets sold or scrapped 531,208 408,515
c. Increase due to the revaluation of fixed assets in the current period 11,305,811 8,490,095
- Increase in value (+) 25,395,931 19,408,228
- Increase in accumulated depreciation (-) 14,090,120 10,918,133
d. Description, total amount, starting and completion dates, and percentage of completion of investment-in-progress:
Description Total Total
of the Investment Investment Incentive Certificate Starting Completion Completion
Investment (TL Million) ($) Date Number Date Date Ratio (%)
Modernization, quality improvement 1,691,680 1,439,728 30/04/2001 3743 15/03/2001 30/06/2002 49%
Modernization, quality improvement 1,463,588 1,219,657 30/04/2001 3747 14/03/2001 30/06/2002 29%
9. Current and unutilized investment allowances:
Dec. 31, 2001 Dec. 31, 2000
Current 866,439 4,302,235
To be used in the future 3,100,000 3,250,000
31

10. Balances and transactions with shareholders, subsidiaries, affiliates and group
companies: Those companies which are wholly or partly owned by the shareholders of the
company are defined as group companies.
December 31, 2001 Receivables Payables
Trade Non-Trade Trade Non-Trade
1) Shareholders 7,927,481 - - 413,966
Eczac›bafl› Holding Co. - - - 413,966
Intema Building Materials Marketing and Sales Co. 7,927,481 - - -
2) Subsidiaries - - - -
3) Affiliates - - 79,612 -
Vitra USA Inc. - - 79,612 -
4) Group Companies 17,261,164 30,148 864,093 19,153,109
Eczac›bafl› Foreign Trade Company 17,060,451 - - 18,677,747
Eczac›bafl› Kitchen and Bathroom Furniture M.Co.(*) 200,663 30,148 - -
Eczac›bafl› Information Technology Co. - - - 78,444
Do¤a Minerals Trading Company - - 14,489 -
Eczac›bafl› Ceramic Tiles Manufacturing Co. - - 78,344 59,854
Eczac›bafl› Industrial Raw Materials Co. - - 703,680 -
Eczac›bafl› Insurance Agency - - - 46,308
EKOM Sanitaer Marketing GmbH - - 67,580 -
Vitra Sanitary Ware Marketing U.K.Ltd. - - - 290,756
Other 50 - - -
Total 25,188,645 30,148 943,705 19,567,075
December 31, 2000 Receivables Payables
Trade Non-Trade Trade Non-Trade
1) Shareholders 6,201,545 - - 157,835
Eczac›bafl› Holding Co. - - - 157,835
Intema Building Materials Marketing and Sales Co. 6,201,545 - - -
2) Subsidiaries - - - -
3) Affiliates - - 37,151 -
Vitra USA Inc. - - 37,151 -
4) Group Companies 9,440,983 502 912,566 8,599,870
Eczac›bafl› Foreign Trade Company 9,396,617 - - 8,446,194
Eczac›bafl› Bathtubs Manufacturing Co. (*) 16,750 - - -
Eczac›bafl› Kitchen and Bathroom Furniture M.Co. (*) 22,627 - - -
Eczac›bafl› Information Technology Co. - - - 12,836
Do¤a Minerals Trading Company 4,989 - - -
Eczac›bafl› Ceramic Tiles Manufacturing Co. - - 32,732 -
Eczac›bafl› Industrial Raw Materials Co. - - 285,190 -
Eczac›bafl› Insurance Agency - - - 82,633
EKOM Sanitaer Marketing GmbH - - 594,644 -
Vitra Sanitary Ware Marketing U.K.Ltd. - - - 57,925
Eczac›bafl›-Baxter Hospital Supply Co. - - - 282
Kaynak Tekni¤i Welding Electrodes Co. - 484 - -
Other - 18 - -
Total 15,642,528 502 949,717 8,757,705
(*) On April 30, 2001, these two companies merged under Eczac›bafl› Kitchen and Bathroom Furniture Manufacturing Co., whose name was changed
to Eczac›bafl› Bathroom and Kitchen Products Company.
32

11. Valuation, compilation and depreciation policies for inventories and other balance sheet
items; changes made in these and other accounting policies compared to the previous
period; the monetary effects of these changes; probable developments which may alter the
continuity and periodic assumptions of the company and reasons for the above:
Accounting policies
The Turkish Capital Market Board (CMB) has set out the principles and rules relating to the
preparation and presentation of financial statements and reports prepared on or after
December 31, 1988, by companies and intermediary institutions in Communiqué XI/1 issued in
the Official Gazette dated January 29, 1989, amended and supplemented by Communiqués XI/4,
XI/5, XI/11, XI/13, XI/14, XI/15 and XI/16. The principles and rules relating to the preparation and
presentation of interim financial statements are set out in Communiqué XI/3 issued in the
Official Gazette dated July 26, 1989.
The Company has prepared its financial statements in compliance with relevant commercial
practice and the generally accepted accounting principles issued by the CMB.
Inventories
Inventories are stated at the lower of acquisition cost or net realizable value. Cost is
determined by the weighted average method and includes material, labor and an appropriate
amount of overhead.
Tangible fixed assets
Tangible fixed assets (except land and current year purchases) are carried at acquisition cost
plus revaluation, which is computed by applying indices and procedures to acquisition costs in
accordance with Law No.3094. The revaluation rate used at December 31, 2001 was 53.2%
(2000:56%). Depreciation is based on revaluation amounts except in the case of buildings.
Depreciation is calculated by the straight-line method for entries before 2001.
For 2001 entries, the Company used the declining balance method.
Depreciations Rates
Assets acquired Assets acquired Assets acquiredBefore 1983 (%) between 1983 and 1994 1994 onwards (%)
Land improvements 4-6 25 20
Buildings 2 2-4 2-4
Machinery and equipment 2-10 5-25 10-20
Vehicles 5-20 25 20
Furniture and Fixtures 6 6-25 20
Marketable securities
The marketable securities portfolio, which consists of public sector bonds and bills as well as
shares, is stated at cost. Accrued income and profit from sales of marketable securities are
charged to current year profit.
33

Valuation of receivables and payables Trade receivables and payables with terms exceeding
three months, apart from advances, deposits and guarantees, are discounted in 1997 in
accordance with the CMB Communiqué No./I issued in the Official Gazette dated March 1, 1995,
No:22217.
The rediscount on accounts and notes receivable is TL 436,075 million (2000: TL 1,067,855
million) and is included in ''Non-Operating Expenses and Losses'', while the rediscount for
payables amounting to TL 2,407 million (2000: TL 6,136 million) is included in "Others".
Foreign currency assets and liabilities Transactions in foreign currencies are converted into
Turkish lira at the exchange rates prevailing at the dates of such transactions. Balance sheet
assets and liabilities denominated in foreign currencies are converted into Turkish lira at the
exchange rates declared by the Central Bank of Turkey at the balance sheet dates. Foreign
exchange gains or losses arising from the settlement and translation of foreign currency items
are included in the related income and expense accounts as appropriate.
Severance indemnity As required by Turkish Labor Law, severance indemnity is booked in the
accompanying financial statements as it is earned.
12. Subsequent events: None (2000:None).
13. Contingent losses and income:
a) Cases in which EYAP is plaintiff:
Subject Amount (TL) Statement
Objection to bills 82,188 Objection to bills issued by the Istanbul Gas Distribution Company
Receivable claims 11,634 Miscellaneous receivable claims
b) Cases against EYAP: None (2000:None).
c) Letters of guarantee
Subject Amount (TL) Statement
Value Added Tax 1,044,602 To customs
Investments 8,036 To investment credits benefiting from incentives
Other 260,945 Energy consumption and other
Total 1,313,583
14. Changes in accounting forecasts and their monetary effects: None (2000:None).
34

15. Mortgages or collateral on assets: There was no mortgage on assets as of December 31,
2001. The list below refers to 2000.
December 31, 2000
Mortgage Mortgage Reason Mortgage Release Amount Collateral Degree Benefactor for Mortgage Date Date (TL)
Mortgage 1 Turkish Industrial Development Bank 23/10/1980 * 1,545
Mortgage 1 Garanti Bank A.fi. 30/03/1981 * 100
Mortgage 2 Turkish Industrial Development Bank 30/11/1982 * 750
Mortgage 2 Garanti Bank A.fi. Long 30/11/1982 * 50
Mortgage 3 Turkish Industrial Development Bank Term 09/12/1985 * 3,500
Mortgage 7 Turkish Industrial Development Bank Credit 19/01/1989 * 12,000
Mortgage 5 Turkish Industrial Development Bank 01/11/1990 * 10,000
Mortgage 6 Turkish Industrial Development Bank 11/12/1990 * 7,000
Mortgage 7 Turkish Industrial Development Bank 08/06/1995 * 2,000
Total 36,945
16. Total insurance coverage on assets :
December 31, 2001
Asset Insurance Insurance Book Beginning Endinginsured Company Value Value Date (*) Date
Vehicles Koç Alliance A.fi. 1,090,988 1,572,923 01/01/2001 31/12/2001
Inventory (inc. transport insurance) Koç Alliance A.fi. 32,101,039 22,497,488 01/01/2001 31/12/2001
Machinery equipment Koç Alliance A.fi. 119,160,846 97,413,891 01/01/2001 31/12/2001
Cash Koç Alliance A.fi. 5,279,900 3,062,141 01/01/2001 31/12/2001
Other (**) Koç Alliance A.fi. 40,419,099 - 01/01/2001 31/12/2001
Total 198,051,872 124,546,443
December 31, 2001
Asset Insurance Insurance Book Beginning Endinginsured Company Value Value Date (*) Date
Vehicles Koç Alliance A.fi. 931,138 1,139,241 01/01/2000 31/12/2000
Inventory (inc. transport insurance) Koç Alliance A.fi. 21,100,000 13,204,204 01/01/2000 31/12/2000
Machinery equipment Koç Alliance A.fi. 69,114,415 65,484,845 01/01/2000 31/12/2000
Cash Koç Alliance A.fi. 5,395,600 6,924,539 01/01/2000 31/12/2000
Other Koç Alliance A.fi. 32,231,192 - 01/01/2000 31/12/2000
Total 128,772,345 86,752,829
* Beginning date for the goods purchased during the year varies.** Includes financial liability, fraud and profit loss.
35
Long
Term
Credit

17. Total mortgages and collateral obtained for receivables
Guarantee letters December 31, 2001
Subject TL USD EURO TOTAL TL
Transport 47,650 42,000 194,291 354,495
Sales - 11,181 920,000 1,182,761
Dealers 107,994 47,000 355,629 626,633
Customs 5,000 - 20,452 30,935
Total 160,644 100,181 1,490,372 2,194,824
December 31, 2000
Subject TL DM USD CHF EURO TOTAL TL
Transport 41,044 483,000 42,000 - - 222.014
Sales 62,467 - 34,786 - - 85.835
Dealers 59,501 1,029,230 33,337 426,000 750,000 1,045,084
Total 163,012 1,512,230 110,123 426,000 750,000 1,352,933
Guarantee bills
December 31, 2001
Subject TL USD EURO TOTAL TL
Transport 24,950 35,000 10.609 88,788
Sales - 25,636 - 36,905
Customs - - - -
Dealers 395,512 54,550 70.916 563,970
Total 420,462 115,186 81.525 689,663
December 31, 2000
Subject TL DM USD TOTAL TL
Transport 24,850 - 35,000 48,362
Sales - - 25,636 17,221
Customs 600 - - 600
Dealers 170,412 159,450 7,150 225,643
Total 195,862 159,450 67,786 291,826
36

Guarantee checks
December 31, 2001
Subject TL USD TOTAL TL
Transport 32,500 2,672 36,346
Sales 25,514 8,018 37,057
Customs - - -
Dealers 18,435 - 18,435
Total 76,449 10,690 91,838
December 31, 2000
Subject TL USD TOTAL TL
Transport 33,357 2,672 35,152
Sales 21,324 2,046 22,698
Customs 2,000 - 2,000
Dealers 6,434 23,053 21,920
Total 63,115 27,771 81,770
Exchange rates
December 31, 2001 December 31, 2000
USD 1,439,567 671,765
DM 648,377 316,265
CHF 854,490 407,884
EURO 1,268,115 618,561
18. Off-Balance sheet commitments and contingent liabilities: None (2000:None).
19. Blocked deposits at banks: None (2000:None).
20. Information regarding the value of marketable securities as per current market rates
when their book value is below the market rate: None (2000:None).
21. Marketable securities of shareholders affiliates and subsidiaries included under
marketable securities: None (2000:None).
37
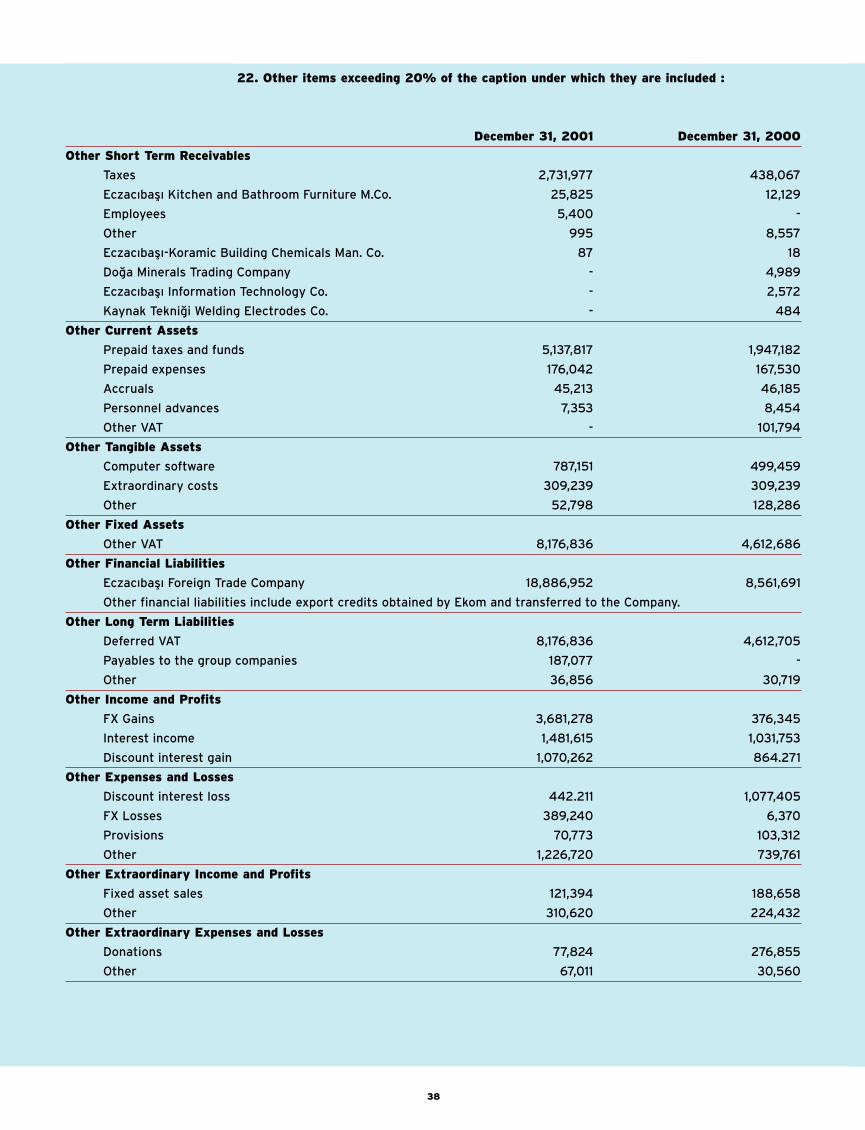
22. Other items exceeding 20% of the caption under which they are included :
December 31, 2001 December 31, 2000
Other Short Term Receivables
Taxes 2,731,977 438,067
Eczac›bafl› Kitchen and Bathroom Furniture M.Co. 25,825 12,129
Employees 5,400 -
Other 995 8,557
Eczac›bafl›-Koramic Building Chemicals Man. Co. 87 18
Do¤a Minerals Trading Company - 4,989
Eczac›bafl› Information Technology Co. - 2,572
Kaynak Tekni¤i Welding Electrodes Co. - 484
Other Current Assets
Prepaid taxes and funds 5,137,817 1,947,182
Prepaid expenses 176,042 167,530
Accruals 45,213 46,185
Personnel advances 7,353 8,454
Other VAT - 101,794
Other Tangible Assets
Computer software 787,151 499,459
Extraordinary costs 309,239 309,239
Other 52,798 128,286
Other Fixed Assets
Other VAT 8,176,836 4,612,686
Other Financial Liabilities
Eczac›bafl› Foreign Trade Company 18,886,952 8,561,691
Other financial liabilities include export credits obtained by Ekom and transferred to the Company.
Other Long Term Liabilities
Deferred VAT 8,176,836 4,612,705
Payables to the group companies 187,077 -
Other 36,856 30,719
Other Income and Profits
FX Gains 3,681,278 376,345
Interest income 1,481,615 1,031,753
Discount interest gain 1,070,262 864.271
Other Expenses and Losses
Discount interest loss 442.211 1,077,405
FX Losses 389,240 6,370
Provisions 70,773 103,312
Other 1,226,720 739,761
Other Extraordinary Income and Profits
Fixed asset sales 121,394 188,658
Other 310,620 224,432
Other Extraordinary Expenses and Losses
Donations 77,824 276,855
Other 67,011 30,560
38
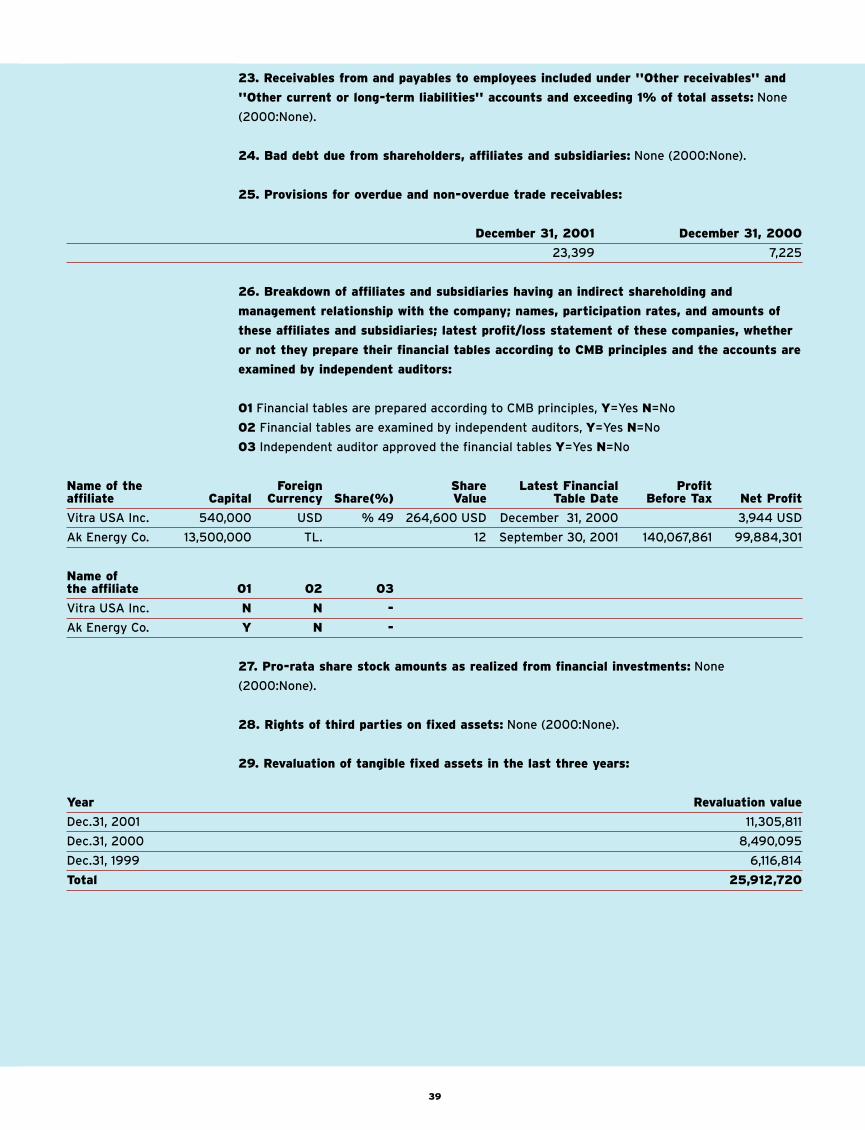
23. Receivables from and payables to employees included under ''Other receivables'' and
''Other current or long-term liabilities'' accounts and exceeding 1% of total assets: None
(2000:None).
24. Bad debt due from shareholders, affiliates and subsidiaries: None (2000:None).
25. Provisions for overdue and non-overdue trade receivables:
December 31, 2001 December 31, 2000
23,399 7,225
26. Breakdown of affiliates and subsidiaries having an indirect shareholding and
management relationship with the company; names, participation rates, and amounts of
these affiliates and subsidiaries; latest profit/loss statement of these companies, whether
or not they prepare their financial tables according to CMB principles and the accounts are
examined by independent auditors:
01 Financial tables are prepared according to CMB principles, Y=Yes N=No
02 Financial tables are examined by independent auditors, Y=Yes N=No
03 Independent auditor approved the financial tables Y=Yes N=No
Name of the Foreign Share Latest Financial Profit affiliate Capital Currency Share(%) Value Table Date Before Tax Net Profit
Vitra USA Inc. 540,000 USD % 49 264,600 USD December 31, 2000 3,944 USD
Ak Energy Co. 13,500,000 TL. 12 September 30, 2001 140,067,861 99,884,301
Name of the affiliate 01 02 03
Vitra USA Inc. N N -
Ak Energy Co. Y N -
27. Pro-rata share stock amounts as realized from financial investments: None
(2000:None).
28. Rights of third parties on fixed assets: None (2000:None).
29. Revaluation of tangible fixed assets in the last three years:
Year Revaluation value
Dec.31, 2001 11,305,811
Dec.31, 2000 8,490,095
Dec.31, 1999 6,116,814
Total 25,912,720
39

30. The amount of assets and liabilities not hedged and denominated in foreign currency,
foreign currency amounts in assets, and exchange rates used for the translation of these
items:
December 31, 2001
Foreign currency assets
Foreign Currency Exchange rateAsset Amount Type Used In Translation Amount in TL
Cash 4,205 USD 1,438,559 6,049
Bank 2,995,259 USD 1,439,567 4,311,876
3,385 GBP 2,081,497 7,046
2,502,246 EURO 1,268,115 3,173,136
537,000 SEK 135,513 72,770
Trade Receivables 11,695,593 DM 648,377 7,583,153
3,117,262 USD 1,439,567 4,487,507
1,934,147 GBP 2,081,497 4,025,921
1,586,363 EURO 1,268,115 2,011,691
5,390,203 SEK 135,513 730,442
3,315,617 FF 193,323 640,985
265,745,760 ITL 655 174,063
Short Term
Checks & Bills 6,910 USD 1,439,567 9,947
Total 27,234,586
Foreign currency liabilities
Foreign Currency Exchange rateLiability Amount Type Used In Translation Amount in TL
Short Term 217,042 USD 1,446,510 313,953
Liabilities 156,263 GBP 2,092,377 326,961
197,044 EURO 1,274,231 251,079
152,432 FF 194,255 29,611
59,791 AUD 738,588 44,161
Letters of Credit 1,917 GBP 2,092,377 4,011
375 EURO 1,274,231 478
20,015,000 ITL 658 13,170
Total 983,424
Loans in foreign currency
Foreign Currency Exchange rateLoan Amount Type Used In Translation Amount in TL
Short Term 4,400,000 USD 1,446,510 6,364,644
Credits 9,250,000 EURO 1,274,231 11,786,637
4,020,000 SEK 136,923 550,430
Total 18,701,711
40

December 31, 2000
Foreign currency assets
Foreign Currency Exchange rateAsset Amount Type Used In Translation Amount in TL
Cash 10,223 USD 671,295 6,863
60 DM 316,044 19
Bank 92,935 USD 671,295 62,387
15,205 DM 316,044 4,805
1,296 EURO 618,561 802
Trade Receivables 4,331,276 USD 671,765 2,909,600
5,865,669 DM 316,265 1,855,106
2,651,272 GBP 993,878 2,635,041
3,993,437 FF 94,299 376,577
376,907,040 ITL 319 120,233
19,832 EURO 618,561 12,267
Short Term
Checks & Bills 133,994 USD 671,765 90,012
Total 8,073,712
Foreign currency liabilities
Foreign Currency Exchange rateLiability Amount Type Used In Translation Amount in TL
Short Term Liabilities 289,587 USD 675,004 195,472
2,146,658 DM 317,790 682,186
58,657 GBP 999,073 58,603
532,804 FF 94,754 50,485
723,488,000 ITL 321 232,240
369,000 CHF 410,511 151,478
14,057 AUD 375,842 5,283
Letters of Credit 245,755 DM 317,790 78,098
161,828 GBP 999,073 161,678
284,580 FF 94,754 26,965
Total 1,642,488
Loans in foreign currency
Foreign Currency Exchange rateLoan Amount Type Used In Translation Amount in TL
Short Term 3,900,000 USD 675,004 2,632,516
Credits 13,700,000 EURO 621,544 8,515,153
Total 11,147,669
41

31. Guarantees, commitments and securities given for shareholders affiliates and
subsidiaries:
December 31, 2001
Shareholder/group company Liability Amount (TL) Foreign currency
Eczac›bafl› Foreign Trade Company Guarantee 10,144,920 8,000,000 EURO
Eczac›bafl› Foreign Trade Company Guarantee 4,462,658 3,100,000 USD
Total 14,607,578
December 31, 2000
Shareholder/group company Liability Amount (TL) Foreign currency
Eczac›bafl› Foreign Trade Company Guarantee 1,701,043 2,750,000 EURO
Eczac›bafl› Foreign Trade Company Guarantee 940,471 1,400,000 USD
Total 2,641,514
32. Average number of employees:
December 31,2001 December 31,2000
Number of employees (beginning of the year) 1,743 1,755
White collar (Non-union) 507 512
White collar (Union) - -
Other (Union) 1,236 1,243
Other (Non-union) 12 -
Number of employees (end of the year) 1,681 1,743
White collar (Non-union) 510 507
White collar (Union) - -
Other (Union) 1,171 1,224
Other (Non-union) - 12
33. Other significant issues
As of December 31, 2001, the total amount of rediscounted checks receivable from Intema
Building Materials Marketing and Sales Company was TL 2,988,237 million (2000: TL
3,325,750). These receivables are booked under ''Notes Receivable'.'
34. Explanation added for convenience translation into English
As indicated in Note 1, the accompanying financial statements are prepared and presented in
accordance with the accounting and reporting principles issued by the Turkish Capital Market
Board, which differ from the accounting principles generally accepted in countries where the
accompanying financial statements are to be distributed as well as from International
Accounting Standards (IAS). The effects of such differences have not been quantified.
Accordingly, the accompanying financial statements are not intended to present the Company's
financial position, results of operations and changes in financial position and cash flow in
accordance with the accounting principles generally accepted in such countries and IAS
accounting principles.
42
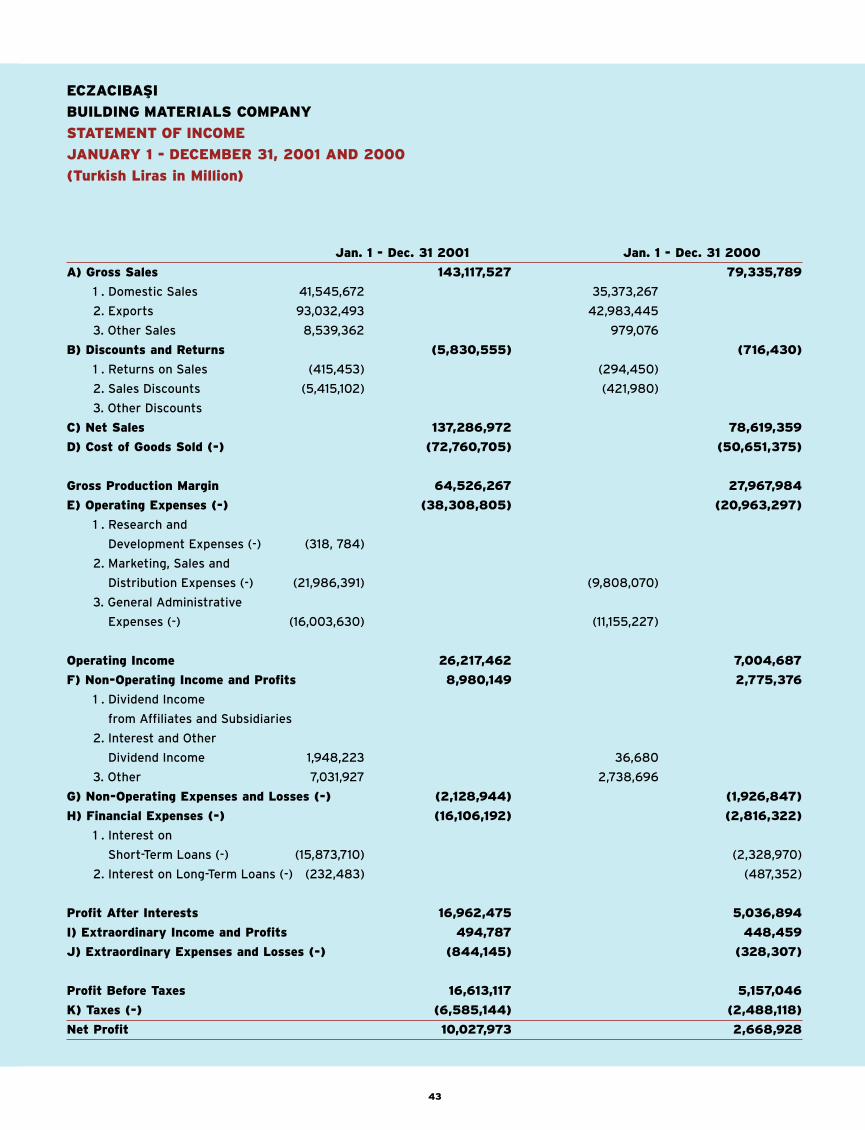
Jan. 1 - Dec. 31 2001 Jan. 1 - Dec. 31 2000
A) Gross Sales 143,117,527 79,335,789
1 . Domestic Sales 41,545,672 35,373,267
2. Exports 93,032,493 42,983,445
3. Other Sales 8,539,362 979,076
B) Discounts and Returns (5,830,555) (716,430)
1 . Returns on Sales (415,453) (294,450)
2. Sales Discounts (5,415,102) (421,980)
3. Other Discounts
C) Net Sales 137,286,972 78,619,359
D) Cost of Goods Sold (-) (72,760,705) (50,651,375)
Gross Production Margin 64,526,267 27,967,984
E) Operating Expenses (-) (38,308,805) (20,963,297)
1 . Research and
Development Expenses (-) (318, 784)
2. Marketing, Sales and
Distribution Expenses (-) (21,986,391) (9,808,070)
3. General Administrative
Expenses (-) (16,003,630) (11,155,227)
Operating Income 26,217,462 7,004,687
F) Non-Operating Income and Profits 8,980,149 2,775,376
1 . Dividend Income
from Affiliates and Subsidiaries
2. Interest and Other
Dividend Income 1,948,223 36,680
3. Other 7,031,927 2,738,696
G) Non-Operating Expenses and Losses (-) (2,128,944) (1,926,847)
H) Financial Expenses (-) (16,106,192) (2,816,322)
1 . Interest on
Short-Term Loans (-) (15,873,710) (2,328,970)
2. Interest on Long-Term Loans (-) (232,483) (487,352)
Profit After Interests 16,962,475 5,036,894
I) Extraordinary Income and Profits 494,787 448,459
J) Extraordinary Expenses and Losses (-) (844,145) (328,307)
Profit Before Taxes 16,613,117 5,157,046
K) Taxes (-) (6,585,144) (2,488,118)
Net Profit 10,027,973 2,668,928
43
ECZACIBAfiI
BUILDING MATERIALS COMPANY
STATEMENT OF INCOME
JANUARY 1 - DECEMBER 31, 2001 AND 2000
(Turkish Liras in Million)
Jan. 1 - Dec. 31 2001 Jan. 1 - Dec. 31 2000
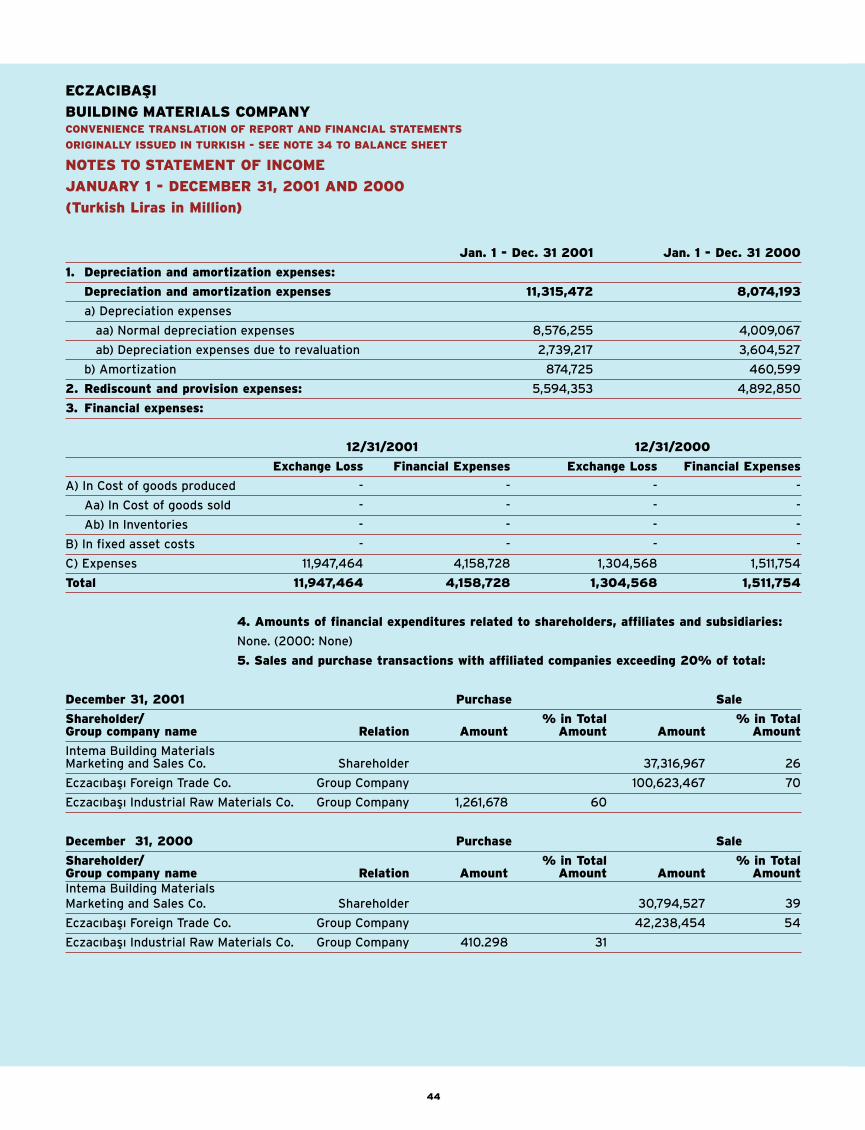
1. Depreciation and amortization expenses:
Depreciation and amortization expenses 11,315,472 8,074,193
a) Depreciation expenses
aa) Normal depreciation expenses 8,576,255 4,009,067
ab) Depreciation expenses due to revaluation 2,739,217 3,604,527
b) Amortization 874,725 460,599
2. Rediscount and provision expenses: 5,594,353 4,892,850
3. Financial expenses:
12/31/2001 12/31/2000
Exchange Loss Financial Expenses Exchange Loss Financial Expenses
A) In Cost of goods produced - - - -
Aa) In Cost of goods sold - - - -
Ab) In Inventories - - - -
B) In fixed asset costs - - - -
C) Expenses 11,947,464 4,158,728 1,304,568 1,511,754
Total 11,947,464 4,158,728 1,304,568 1,511,754
4. Amounts of financial expenditures related to shareholders, affiliates and subsidiaries:
None. (2000: None)
5. Sales and purchase transactions with affiliated companies exceeding 20% of total:
December 31, 2001 Purchase Sale
Shareholder/ % in Total % in TotalGroup company name Relation Amount Amount Amount Amount
Intema Building Materials Marketing and Sales Co. Shareholder 37,316,967 26
Eczac›bafl› Foreign Trade Co. Group Company 100,623,467 70
Eczac›bafl› Industrial Raw Materials Co. Group Company 1,261,678 60
December 31, 2000 Purchase Sale
Shareholder/ % in Total % in TotalGroup company name Relation Amount Amount Amount Amount
Intema Building Materials
Marketing and Sales Co. Shareholder 30,794,527 39
Eczac›bafl› Foreign Trade Co. Group Company 42,238,454 54
Eczac›bafl› Industrial Raw Materials Co. Group Company 410.298 31
44
ECZACIBAfiI
BUILDING MATERIALS COMPANY
CONVENIENCE TRANSLATION OF REPORT AND FINANCIAL STATEMENTS
ORIGINALLY ISSUED IN TURKISH - SEE NOTE 34 TO BALANCE SHEET
NOTES TO STATEMENT OF INCOME
JANUARY 1 - DECEMBER 31, 2001 AND 2000
(Turkish Liras in Million)

6. Interest, rent and equivalents paid to and received from shareholders, affiliates and
subsidiaries:
December 31, 2001
Financial, Rent and other expenses
Shareholder/ % in Total Group Company Name Relation Expense type Amount Amount
Eczac›bafl› Foreign Trade Co. Group Company Service 16,160,886 69
Eczac›bafl› Holding Co. Shareholder Service and rent 2,854,419 12
Intema Building Materials Marketing and Sales Co. Shareholder Service 608,492 3
Eczac›bafl› Information Technology Co. Group Company Service 945,612 4
EKOM Sanitaer Marketing GmbH Group Company Service 1,939,521 8
Other Group Company Service 990,828 4
Total 23,499,754 100
December 31, 2000
Financial, Rent and other expenses
Shareholder/ % in Total Group Company Name Relation Expense type Amount AmountEczac›bafl›
Foreign Trade Co. Group Company Service 2,491,841 40
Eczac›bafl› Holding Co. Shareholder Service and rent 2,164,983 35
Intema Building and Installation Materials Co. Shareholder Service 577,862 9
Eczac›bafl› InformationTechnology Co. Group Company Service 562,250 9
Other Group Company Service 454,311 7
Total 6,251,247 100
7. Payments to top management: At December 31, 2001, these payments totalled TL
3,003,490 million (2000: TL 1,782,643 million).
8. Depreciation calculation method and changes in depreciation expenses: Depreciation was
calculated using the straight-line method for assets acquired before 2001. The declining balance
method was used for 2001 entries.
9. Inventory costing system and procedures: The company uses the cost-per-stage and the
yearly moving average method for the valuation of inventories.
10. Stock count: Stock count was carried out at the end of the year.
11. Product, scrap or service sales that exceed 20% of gross sales :
Dec. 31, 2001 Dec. 31, 2000
Ceramic sanitary ware 81,495,890 40,134,049
Sanitary fittings 55,846,878 33,269,969
45

12. Sales incentives and subsidies, if any:
December 31, 2001 At December 31, 2001, the Company had various export incentive
certificates with export commitments amounting to USD 51,567,281.
December 31, 2000 At December 31, 2000, the Company had various export incentive
certificates with export commitments amounting to USD 41,188,000
13. Income and expenses related to prior years:
Dec. 31, 2001 Dec. 31, 2000
Income 62,773 35,369
Expenses 265,259 20,892
14. Profit per share and percentage
Dec. 31, 2001 Dec. 31, 2000
Profit per Profit Dividend per Profit per Profit per Dividend pershare (%) per share share (%) share (%) share share (%)
Common stock - 4,011.19 - 1,067.57
15. Changes in production units:
Output (Units)
Products 2001 2000 (%) Change
Ceramic Sanitary Ware 3,033,962 3,064,512 (1)
Chrome-Plated Fittings 1,450,881 1,719,200 (16)
Duroplast Toilet Seats 195,235 255,013 (23)
Brass Products 83,916 153,730 (45)
Accessories 351,011 302,570 16
Other Products 9,301,183 10,084,654 (8)
Total 14,416,188 15,579,679 8
16. Changes in sales units:
Sales (Units)
Products 2001 2000 (%) Change
Ceramic Sanitary Ware 2,859,935 3,054,708 (6)
Chrome-Plated Fittings 1,411,890 1,870,104 (25)
Duroplast Toilet Seats 194,799 234,018 (17)
Brass Products 99,562 175,914 (43)
Accessories 350,689 289,489 21
Other Products 9,479,794 9,911,223 (4)
Total 14,396,669 15,534,756 (7)
46
Jan. 1 - Dec. 31, 2001 Jan. 1 - Dec. 31, 2000
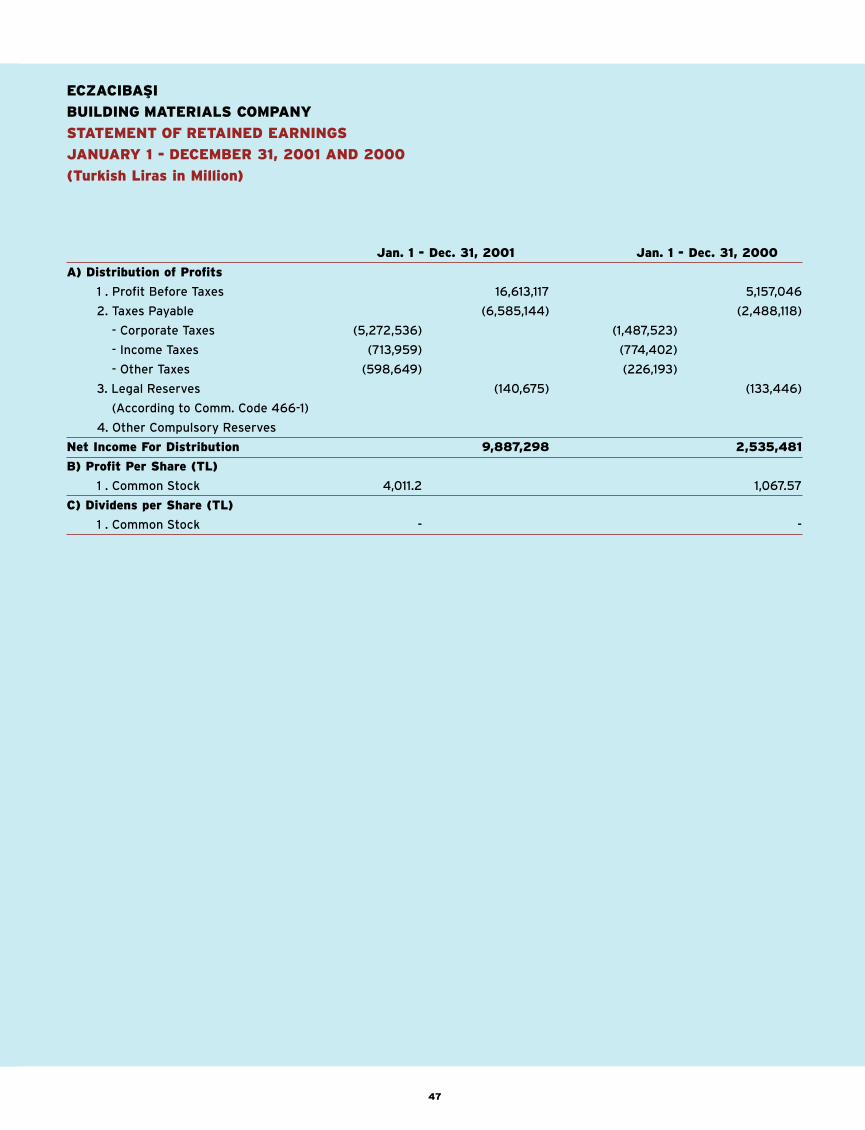
A) Distribution of Profits
1 . Profit Before Taxes 16,613,117 5,157,046
2. Taxes Payable (6,585,144) (2,488,118)
- Corporate Taxes (5,272,536) (1,487,523)
- Income Taxes (713,959) (774,402)
- Other Taxes (598,649) (226,193)
3. Legal Reserves (140,675) (133,446)
(According to Comm. Code 466-1)
4. Other Compulsory Reserves
Net Income For Distribution 9,887,298 2,535,481
B) Profit Per Share (TL)
1 . Common Stock 4,011.2 1,067.57
C) Dividens per Share (TL)
1 . Common Stock - -
47
ECZACIBAfiI
BUILDING MATERIALS COMPANY
STATEMENT OF RETAINED EARNINGS
JANUARY 1 - DECEMBER 31, 2001 AND 2000
(Turkish Liras in Million)

Jan. 1 - Dec. 31, 2001 Jan. 1 - Dec. 31, 2000
A) Sources of Funds 50,292,761 19,999,557
1 . Sources of Operating Income 32,117,585 17,139,727
a) Operating Income 16,962,475 5,036,894
b) Depreciation 10,631,017 8,074,250
c) Expenses that do not require funds 5,594,353 4,892,851
d) Income that does not generate funds (1,070,262) (864,269)
2. Sources of Extraordinary Income 494,787 448,459
a) Extraordinary Income 494,787 -
b) Expenses that do not require funds 448,459
c) Income that does not generate funds - -
3. Decrease in Current Assets
4. Decrease in Fixed Assets
5. Increase in Short-Term Liabilities 13,923,019 2,411,372(Does not include provisions
for loans and expenses)
6. Increase in Long-Term Liabilities 3,757,371 -(Does not include provisions
for loans and expenses)
7. Increase in Paid-In Capital (Cash) - -
8. Premium on Sales of Stocks - -
B) Uses of Funds 50,292,761 19,999,557
1 . Uses Due to Operating Losses - -
2. Uses Due to Extraordinary Losses 844,145 328,307
a) Extraordinary Losses 844,145 328,307
b) Expenses that do not require funds
c) Income that does not generate funds
3. Tax Payments 4,841,363 1,039,849
4. Dividend Payments
5. Increase in Current Assets 32,590,371 10,688,130
6. Increase in Fixed Assets(Does not include revaluation fund) 12,016,882 5,957,280
7. Decrease in Short-Term Liabilities
8. Decrease in Long-Term Liabilities 1,985,991
Changes in Net Working Capital
1 . Increase in Net Working Capital 16,946,245 6,379,201
2. Decrease in Net Working Capital
48
ECZACIBAfiI
BUILDING MATERIALS COMPANY
STATEMENT OF SOURCES AND USES OF FUNDS
JANUARY 1 - DECEMBER 31, 2001 AND 2000
(Turkish Liras in Million)
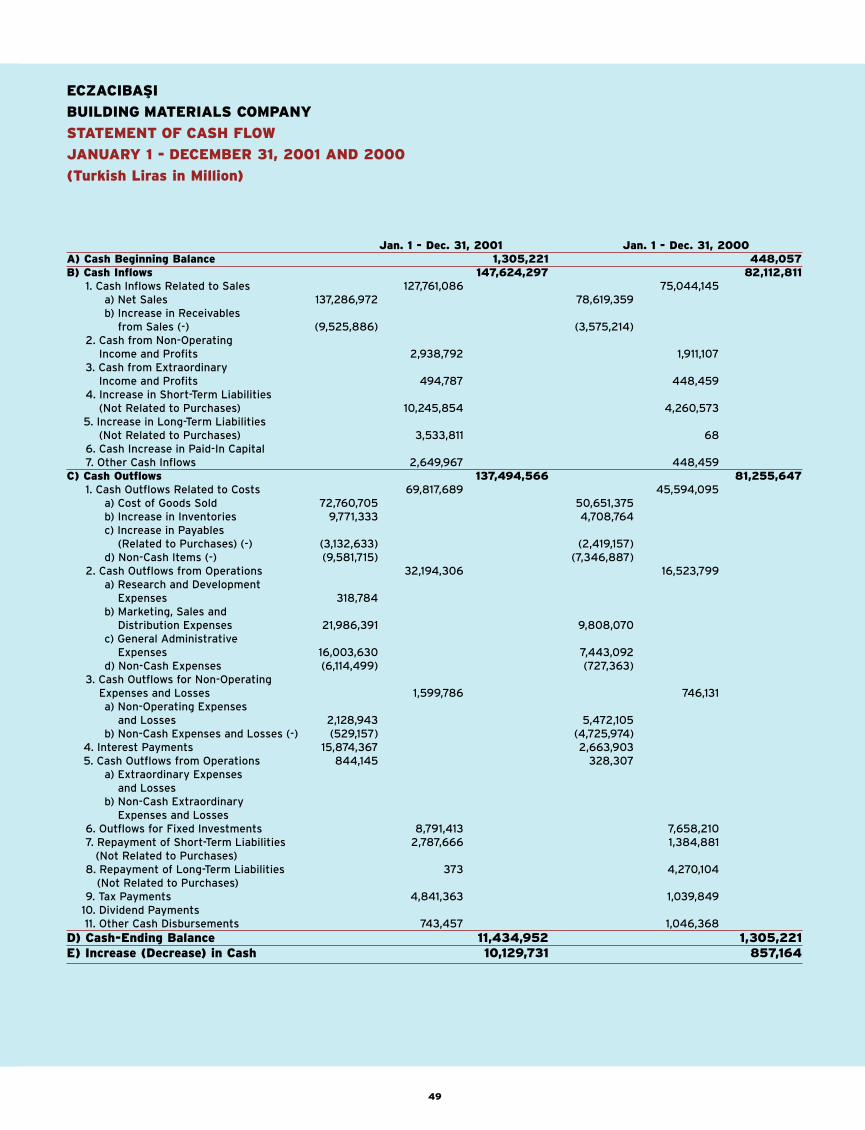
Jan. 1 - Dec. 31, 2001 Jan. 1 - Dec. 31, 2000
A) Cash Beginning Balance 1,305,221 448,057
B) Cash Inflows 147,624,297 82,112,811
1. Cash Inflows Related to Sales 127,761,086 75,044,145
a) Net Sales 137,286,972 78,619,359
b) Increase in Receivables
from Sales (-) (9,525,886) (3,575,214)
2. Cash from Non-Operating
Income and Profits 2,938,792 1,911,107
3. Cash from Extraordinary
Income and Profits 494,787 448,459
4. Increase in Short-Term Liabilities
(Not Related to Purchases) 10,245,854 4,260,573
5. Increase in Long-Term Liabilities
(Not Related to Purchases) 3,533,811 68
6. Cash Increase in Paid-In Capital
7. Other Cash Inflows 2,649,967 448,459
C) Cash Outflows 137,494,566 81,255,647
1. Cash Outflows Related to Costs 69,817,689 45,594,095
a) Cost of Goods Sold 72,760,705 50,651,375
b) Increase in Inventories 9,771,333 4,708,764
c) Increase in Payables
(Related to Purchases) (-) (3,132,633) (2,419,157)
d) Non-Cash Items (-) (9,581,715) (7,346,887)
2. Cash Outflows from Operations 32,194,306 16,523,799
a) Research and Development
Expenses 318,784
b) Marketing, Sales and
Distribution Expenses 21,986,391 9,808,070
c) General Administrative
Expenses 16,003,630 7,443,092
d) Non-Cash Expenses (6,114,499) (727,363)
3. Cash Outflows for Non-Operating
Expenses and Losses 1,599,786 746,131
a) Non-Operating Expenses
and Losses 2,128,943 5,472,105
b) Non-Cash Expenses and Losses (-) (529,157) (4,725,974)
4. Interest Payments 15,874,367 2,663,903
5. Cash Outflows from Operations 844,145 328,307
a) Extraordinary Expenses
and Losses
b) Non-Cash Extraordinary
Expenses and Losses
6. Outflows for Fixed Investments 8,791,413 7,658,210
7. Repayment of Short-Term Liabilities 2,787,666 1,384,881
(Not Related to Purchases)
8. Repayment of Long-Term Liabilities 373 4,270,104
(Not Related to Purchases)
9. Tax Payments 4,841,363 1,039,849
10. Dividend Payments
11. Other Cash Disbursements 743,457 1,046,368
D) Cash-Ending Balance 11,434,952 1,305,221
E) Increase (Decrease) in Cash 10,129,731 857,164
49
ECZACIBAfiI
BUILDING MATERIALS COMPANY
STATEMENT OF CASH FLOW
JANUARY 1 - DECEMBER 31, 2001 AND 2000
(Turkish Liras in Million)
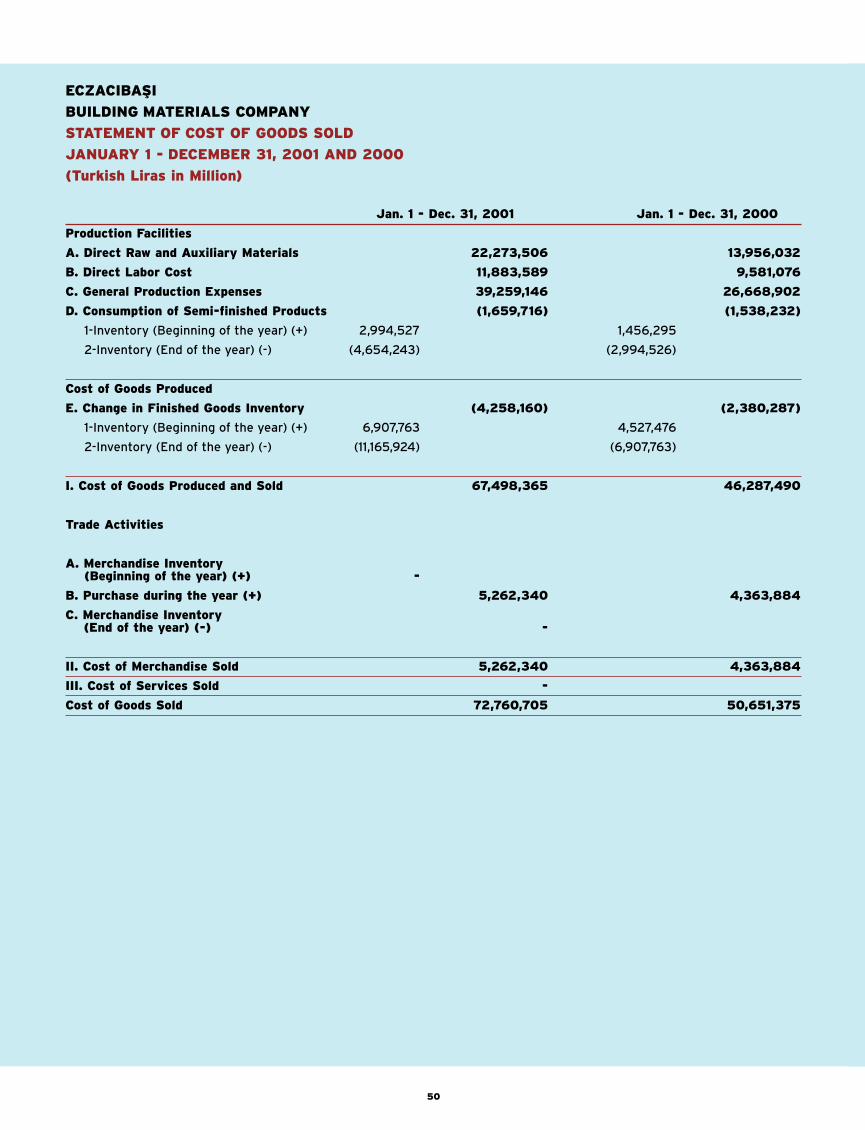
Jan. 1 - Dec. 31, 2001 Jan. 1 - Dec. 31, 2000
Production Facilities
A. Direct Raw and Auxiliary Materials 22,273,506 13,956,032
B. Direct Labor Cost 11,883,589 9,581,076
C. General Production Expenses 39,259,146 26,668,902
D. Consumption of Semi-finished Products (1,659,716) (1,538,232)
1-Inventory (Beginning of the year) (+) 2,994,527 1,456,295
2-Inventory (End of the year) (-) (4,654,243) (2,994,526)
Cost of Goods Produced
E. Change in Finished Goods Inventory (4,258,160) (2,380,287)
1-Inventory (Beginning of the year) (+) 6,907,763 4,527,476
2-Inventory (End of the year) (-) (11,165,924) (6,907,763)
I. Cost of Goods Produced and Sold 67,498,365 46,287,490
Trade Activities
A. Merchandise Inventory (Beginning of the year) (+) -
B. Purchase during the year (+) 5,262,340 4,363,884
C. Merchandise Inventory (End of the year) (-) -
II. Cost of Merchandise Sold 5,262,340 4,363,884
III. Cost of Services Sold -
Cost of Goods Sold 72,760,705 50,651,375
50
ECZACIBAfiI
BUILDING MATERIALS COMPANY
STATEMENT OF COST OF GOODS SOLD
JANUARY 1 - DECEMBER 31, 2001 AND 2000
(Turkish Liras in Million)
1. We have examined the accompanying balance sheets of Eczac›bafl› Yap› Gereçleri Sanayi ve
Ticaret A.fi. (''The Company'') at 31 December 2001 and the related statements of income for
the year then ended. Our examination was made in accordance with generally accepted auditing
standards issued by the Turkish Capital Market Board (CMB) and accordingly included such
tests of the accounting records and other auditing procedures as we considered necessary
under the circumstances.
2. In our opinion the accompanying financial statements present fairly, in all material respects,
the financial position of Eczac›bafl› Yap› Gereçleri Sanayi ve Ticaret A.fi. at December 31, 2001,
and the results of its operations for the year then ended, in accordance with generally accepted
accounting principles issued by the CMB (see footnote 11 to the balance sheets), which are
applied consistently.
3. Additional paragraph for convenience translation to English:
The effects of differences between accounting principles issued by the CMB and accounting
principles generally accepted in countries where the accompanying financial statements are to
be distributed as well as International Accounting Standards (IAS) have not been quantified in
the accompanying financial statements. Accordingly, the accompanying financial statements are
not intended to present the financial position and results of operations in accordance with
accounting principles generally accepted in such countries and IAS.
Baflaran Nas Serbest Muhasebeci
Mali Müflavirlik Anonim fiirketi
(a member of PricewaterhouseCoopers)
Cansen Baflaran, SMMM, Partner
‹stanbul, March 1, 2002
51
ECZACIBAfiI
BUILDING MATERIALS COMPANY
CONVENIENCE TRANSLATION OF INDEPENDENT AUDITOR’S REPORT
ORIGINALLY ISSUED IN TURKISH)
INDEPENDENT AUDITOR’S REPORT
1 JANUARY - 31 DECEMBER 2001

Büyükdere Caddesi, 193
Levent 80640, Istanbul, Turkey
Tel: +90 212 339 90 00
Faks: +90 212 282 67 45
www.vitraartema.com.tr
Istanbul, June 2002
52
ECZACIBAfiI
BUILDING MATERIALS COMPANY
Top Related