


Languages
Pages
Legal


Health, Population, and NutritionGlobal Practice
THEECONOMICSOF KRETEKROLLING ININDONESIA
Pub
lic D
iscl
osur
e A
utho
rized
Pub
lic D
iscl
osur
e A
utho
rized
Pub
lic D
iscl
osur
e A
utho
rized
Pub
lic D
iscl
osur
e A
utho
rized

Cover photos (clockwise from left): Box of Asian cigarettes. Photo by zodebala / iStock. Tobacco Crop in Indonesia. Photo by hanafichi / iStock. Portrait of man and rooster, Indonesia. Curt Carnemark / World Bank. Indonesia Java Malang, factory for clove cigarettes Kretek, women roll tobacco and clove dust in cigarettes manually. Photo by Joerg Boethling / Alamy Stock Photo.
THE ECONOMICS OF KRETEK ROLLING IN INDONESIAHealth, Population, and Nutrition Global Practice

2 // The Economics of Tobacco Taxation
SMOKING HAS BEEN A MAJOR CONTRIBUTOR OF DISEASE BURDEN IN INDONESIA. SMOKING PREVALENCE AMONG WORKING-AGE INDIVIDUALS HAS EXCEEDED 30 PERCENT SINCE 2001.

33
LIST OF ACRONYMS
BPJS Badan Penyelenggara Jaminan Sosial
FGD Focus Group Discussion
FT Full-time
FTE Full-time Equivalent
GDP Gross Domestic Product
KIS Kartu Indonesia Sehat
KKS Kartu Keluarga Sejahtera
KPS Kartu Perlindungan Sosial
NCD Noncommunicable Diseases
PBI Penerima Bantuan Iuran
PPP Purchasing Power Parity
Rp Indonesian Rupiah
SKM Machine-made kretek
SKT Hand-made kretek
SPM White cigarettes
4 // Executive Summary
EXECUTIVE SUMMARY
Indonesia, home to 73.6 million smokers estimated as of 2015, has one of the high-est rates of cigarette consumption in the world. Smoking prevalence among work-
ing-age individuals has exceeded 30 percent since 2001. In 2013, smoking prevalence
among males was 66%, while smoking prevalence among females was 6.7%. If the current
trend of smoking rate remains unabated, the smoking population will grow to 95 million
by 2025. The share of the smoking population could be reduced from 35.7% in 2010 to
25% in 2025, if Indonesia adopts the global target endorsed by the United Nations General
Assembly in 2011 (30% relative reduction in smoking prevalence) for prevention of prema-
ture deaths from four major noncommunicable diseases (NCDs), such as, cancer, diabetes,
lung disease and cardiovascular disease.
Indonesia has one of the most complex cigarette excise tax systems in the world. The current cigarette excise tax has 12 tiers, which are based on the type of cigarettes, the
number of cigarettes produced, and per-unit retail price. Such a system favors downward
substitution to lower priced products and has limited impact on smoking reduction. The
tiers in the cigarette excise tax structure aim to accommodate small-scale cigarette firms,
especially SKT firms. The rationale for such a structure is that smaller SKT firms account for
more than half of total factories in the tobacco industry. Moreover, these firms are responsi-
ble for employing a significant share of the workers in tobacco manufacturing.
This report aims to contribute to the policy debate over the tobacco excise tax reform and employment in Indonesia by identifying the socioeconomic and labor market characteristics of kretek workers and their households from two large kretek producing districts. The analysis in this report is based on data collected from a sample
survey of 720 kretek workers’ households from two large kretek producing districts, Kudus
and Malang. The rationale for undertaking a special survey of hand-rolled kretek workers’
households is twofold. First, kretek making is much more labor intensive in hand-rolled
kretek firms than in machine-made kretek firms. It is estimated that 93% of kretek workers
are employed in hand-rolled kretek factories (World Bank, 2017a). However, the existing
national-level surveys do not distinguish between kretek workers in machine-made and
hand-rolled kretek firms. Second, the insight into the qualitative dimensions of choice of
livelihood, particularly the work-life preference pattern of predominantly female hand-rolled
kretek workers, is critical in identifying the alternative livelihood options for displaced kretek
workers. This dimension was captured in both the focus group discussions (FGDs) and a
specific module on kretek workers’ livelihood options in the kretek roller household survey.
We found that Kretek workers are typically female, older adults with a low level of education. The average age of the kretek worker is 40 years, and about 94% of the kretek
workers are female. More than half of the kretek workers obtained an elementary educa-

5
tion. About 27% of the kretek workers obtained a junior high school education, while only
15% of them obtained a senior high school education.
The kretek rollers in the sample work mostly in large firms, and the clear majority are production line workers. Large firms employ 72.6% of the workers, followed by
20.2% in medium firms and only 4.9% and 2.3% in small firms and micro firms, respec-
tively. Kretek workers are involved in different stages of kretek production. About 38% are
involved in rolling paper, 33% in filling tobacco dust, 38% in cutting, 31% in packaging,
and 13% in ticketing. About 46% of these workers are engaged in more than
one task.
The majority (65%) of the kretek workers reported having an unwritten contract with their firms. While there is no significant difference between wages of contract and
casual workers, a significantly larger fraction of contract workers reported receiving non-
wage benefits from their employers, such as, paid sick leave, paid holiday/vacation, and
paid maternity leave.
An average kretek worker has been working in her firm for 214 months or close to 18 years and only a third were working full-time in the kretek industry. The observed long-term employment opportunity of kretek workers suggests that the
kretek industry offers a sense of job security that they may not get in other occupations.
The full-time workers worked on average 2,568 hours annually, while kretek workers who
worked less than full-time worked on average 1,426 hours annually. The full-time employ-
ment among kretek workers is 80.4% (639 FTE workers out of 795), which means that the
307,793 workers employed in the kretek industry as of 2014 are equivalent to 247,394
full-time workers. Given that kretek workers are predominantly female who are less likely
to be household heads and more likely to have nonmarket responsibilities (e.g., child care,
household chores), it is typically the motivation to provide supplementary income for the
family that drives the less than full employment nature of kretek rolling.
About two-thirds of the kretek households (60.84% of the sample) reported receiv-ing at least one form of social benefits in the past year provided by the government of Indonesia. These are social safety nets for the poor and near-poor population docu-
mented in the ownership of a Social Protection Card (Kartu Perlindungan Social, KPS and
Kartu Keluarga Sejahtera, KKS) and Health Insurance Card (Kartu Indonesia Sehat, KIS and
BPJS Penerima Bantuan Iuran, PBI). These benefits include cash assistance or transfer, rice
for the poor (raskin), assistance for health payment, assistance for poor students, and assis-
tance from the social protection programs of KPS or KKS. About 11.9% of kretek house-
holds own KPS or KKS cards. They are entitled to a monthly cash assistance of Rp 200,000
(US$15). We find that enrollment in the rice for the poor program is positively and signifi-
cantly correlated with female-headed households.
We estimate that the desired tax increase will reduce employment in the handmade kretek industry by about 0.22% which is equivalent to loss of jobs of 2,245 workers. On average, kretek workers’ households whose member is laid off from the kretek industry
6 // Executive Summary
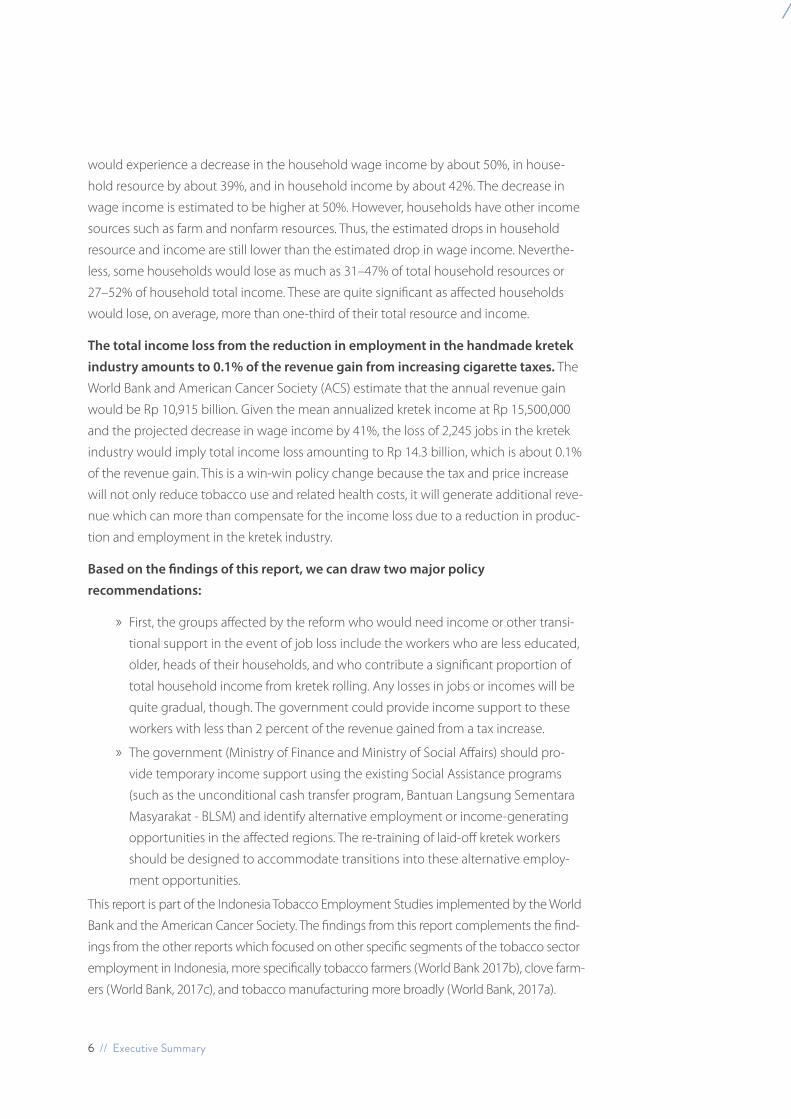
would experience a decrease in the household wage income by about 50%, in house-
hold resource by about 39%, and in household income by about 42%. The decrease in
wage income is estimated to be higher at 50%. However, households have other income
sources such as farm and nonfarm resources. Thus, the estimated drops in household
resource and income are still lower than the estimated drop in wage income. Neverthe-
less, some households would lose as much as 31–47% of total household resources or
27–52% of household total income. These are quite significant as affected households
would lose, on average, more than one-third of their total resource and income.
The total income loss from the reduction in employment in the handmade kretek industry amounts to 0.1% of the revenue gain from increasing cigarette taxes. The
World Bank and American Cancer Society (ACS) estimate that the annual revenue gain
would be Rp 10,915 billion. Given the mean annualized kretek income at Rp 15,500,000
and the projected decrease in wage income by 41%, the loss of 2,245 jobs in the kretek
industry would imply total income loss amounting to Rp 14.3 billion, which is about 0.1%
of the revenue gain. This is a win-win policy change because the tax and price increase
will not only reduce tobacco use and related health costs, it will generate additional reve-
nue which can more than compensate for the income loss due to a reduction in produc-
tion and employment in the kretek industry.
Based on the findings of this report, we can draw two major policy recommendations:
» First, the groups affected by the reform who would need income or other transi-
tional support in the event of job loss include the workers who are less educated,
older, heads of their households, and who contribute a significant proportion of
total household income from kretek rolling. Any losses in jobs or incomes will be
quite gradual, though. The government could provide income support to these
workers with less than 2 percent of the revenue gained from a tax increase.
» The government (Ministry of Finance and Ministry of Social Affairs) should pro-
vide temporary income support using the existing Social Assistance programs
(such as the unconditional cash transfer program, Bantuan Langsung Sementara
Masyarakat - BLSM) and identify alternative employment or income-generating
opportunities in the affected regions. The re-training of laid-off kretek workers
should be designed to accommodate transitions into these alternative employ-
ment opportunities.
This report is part of the Indonesia Tobacco Employment Studies implemented by the World
Bank and the American Cancer Society. The findings from this report complements the find-
ings from the other reports which focused on other specific segments of the tobacco sector
employment in Indonesia, more specifically tobacco farmers (World Bank 2017b), clove farm-
ers (World Bank, 2017c), and tobacco manufacturing more broadly (World Bank, 2017a).

77
ACKNOWLEDGMENTSThe preparation of this report was carried out under the World
Bank Global Tobacco Control Program coordinated by Patricio
V. Marquez, with the support of the Bill & Melinda Gates
Foundation and the Bloomberg Foundation.
The report is part of the Indonesia Tobacco Employment Studies
and was prepared by a team comprised of:
Nigar Nargis, PH.D. | Scientific Director, Economic and Health
Policy Research
Gumilang Aryo Sahadewo (Research Faculty Universitas Gadjah Mada
and Consultant World Bank);
Edson C. Araujo (Senior Economist and Task-Team Leader, World Bank);
Pandu Harimurti (Senior Health Specialist and Task-Team Leader,
World Bank);
Jeffrey Drope (Scientific Vice-President, American Cancer Society)
Qing Li (Senior Data Analyst, American Cancer Society);
Josefine Durazo (Survey Specialist, World Bank);
Firman Witoelar (Director of Research, SurveyMeter); and
Bondan Sikoki (Chairperson, SurveyMeter).
The report greatly benefited from comments, inputs, and advice
provided by Truman G. Packard (Lead Economist, World Bank), and Rajeev
Cherukupalli (Assistant Scientist, School of Public Health, Johns Hopkins
University).
8 // Table of Contents
The Economics of Tobacco Taxation in Indonesia
TABLE OF CONTENTS
List of Acronyms 3
Executive Summary 4
Acknowldgements 7
List of Tables 9
List of Figures 9
1. Introduction 11
2. Socioeconomic Profile of Kretek Rollers 15
3. Labor Market Outcomes of Kretek Rollers 21
4. The Livelihood of Kretek Rollers 31
5. Potential Impacts of Higher Tobacco Taxes on Kretek Households 41
6. Concluding Remarks 47
Appendix A: Methods of Data Collection 51
Sampling and Survey 51
Focus Group Discussion 53
Appendix B: Calculation of Total Household Income and Resource 56
9
List of Tables
Table 1: Primary and secondary occupations of the members of kretek rollers’ households 16
Table 2: Median daily, weekly, and monthly wages (Rp) of kretek rollers by firm size 19
Table 3: Percentage of contract and casual kretek workers receiving employer provided benefits 20
Table 4: Results of estimation of female kretek rollers’ labor supply function 23
Table 5: Determinants of reasons to stay or work in the kretek industry 25
Table 6: Summary statistics of household income, resources, and poverty status 30
Table 7: Determinants of poverty status among kretek households 31
Table 8: Availability of social safety nets to kretek households 32
Table 9: Determinants of borrowing status among kretek households 35
Table 10: Proposed cigarette tax increase and new cigarette excise tariffs 38
Table 11: The simulated impacts of cigarettes excise tax reform on the livelihood of hand
made kretek workers 39
Table A1: Number of factories and sample clusters (kretek factories) 48
Table A2: Summary statistics of kretek workers and their household members 50
List of Figures Figure 1: Number of days stopped working by self-reported health status of kretek workers 17
Figure 2: Correlation between length of tenure and age of kretek workers 21
Figure 3: Reasons to continue working in the kretek industry 27
Figure 4: Correlation between household wage income and proportion of kretek income 33
Figure 5: Contribution of different income sources to household total resource 33
Figure 6: Average household resources (Rp) by source and full-time (FT) work status of
kretek workers 34
Figure 7: Contribution of different income sources to household total income 34

10 // Table of Contents
The Economics of Kretek Rolling in IndonesiaSMOKING HAS BEEN A MAJOR CONTRIBUTOR OF DISEASE BURDEN IN INDONESIA. SMOKING PREVALENCE AMONG WORKING-AGE INDIVIDUALS HAS EXCEEDED 30 PERCENT SINCE 2001.
11
INTRODUCTIONKretek or clove cigarette is a major form of combustible tobacco product in Indo-nesia, home to 73.6 million smokers estimated as of 2015 (around 40% of the adult population). If the current trend of smoking rate remains unabated, the smoking
population will grow to 95 million by 2025. The share of the smoking population could
be reduced from 35.7% in 2010 to 25% in 2025, if Indonesia adopts the global target
endorsed by the United Nations General Assembly in 2011 (30% relative reduction in
smoking prevalence) for prevention of premature deaths from four major noncommuni-
cable diseases (NCDs), such as, cancer, diabetes, lung disease and cardiovascular disease.
Indonesia is poised to fight the NCD epidemic by reducing tobacco use through aggressive tobacco control measures including significant increases in tobacco taxes. The tobacco industry in Indonesia has been actively defying tax increases based
on the argument that the livelihood of workers employed in the tobacco industry
depends on the continuing demand for tobacco products, and their economic well-be-
ing would be at stake if they lose jobs due to a fall in production in the wake of falling
demand in this sector. The employment consideration in tobacco manufacturing has also
been reflected historically in the preferential treatment of the hand-rolled kretek industry
in cigarette excise tax policy (see Box 1).
The costs of employment and income loss are, however, expected to be minimal when compared to the social and fiscal gains attainable from tax increases. The
additional revenue generated from tax increases can be channeled to provide income
support to displaced tobacco workers and help them find alternative sources of employ-
ment. By examining the socioeconomic status and alternative livelihood options of kretek
workers, we provide an estimate of the income loss that kretek rollers can incur vis-à-vis
the revenue gain from a desired tax increase. We argue that the additional revenue can
be made available to provide government support required to compensate the affected
households for surviving the income shock and re-skill the kretek workers to make transi-
tions to alternative jobs.
Using data from the Indonesian Central Bureau of Statistics, the World Bank esti-mates 307,793 kretek workers in Indonesia in 2014 (World Bank, 2017a). With an
average household size of four, this employment size implies that approximately 1.2 mil-
lion people are dependent on kretek rolling for their livelihood in Indonesia. The report
shows that tobacco manufacturing represents only a small share of the economy wide
employment (0.60%). Additionally, the contribution of the tobacco manufacturing to
employment in the manufacturing sector is quite small (5.3%) in comparison to the
1

12 // Introduction
The Economics of Kretek Rolling in Indonesia
contribution of the food (27.43%), garment (11.43%), and textile (7.90%) sectors. Although
small, tobacco manufacturing jobs are heavily concentrated with about 94% of tobacco
manufacturing workers in Central Java, East Java, and West Nusa Tenggara. In these prov-
inces, several districts are quite dependent on tobacco sector employment, as for exam-
ple Kudus (30%), Temanggung (27.6%), and Kediri (26%).
This report identifies the socioeconomic and labor market characteristics of kretek workers and their households from two large kretek producing districts. The anal-
ysis in this report is based on data collected from a sample survey of 720 kretek workers’
households from two large kretek producing districts, Kudus and Malang. The details of
the survey methodology are provided in Appendix A. The purposive selection of sample
districts is driven by a high degree of regional concentration of kretek factories. Based on
the annual Survey of Industry (SI), 40% of Indonesian kretek workers are in three districts
only—Kudus (21.4%), Kediri (10.2%), and Malang (8.6%) (World Bank, 2017a).
The rationale for undertaking a special survey of hand-rolled kretek workers’ households is twofold. First, kretek making is much more labor intensive in hand-rolled
kretek firms than in machine-made kretek firms. It is estimated that 93% of kretek workers
are employed in hand-rolled kretek factories (World Bank, 2017a). It is expected that the
brunt of the employment impact of tax policy change would be felt by those currently
employed in hand-rolled kretek factories, and they would need targeted intervention for
income support and redeployment programs. However, the existing national level sur-
veys do not distinguish between kretek workers in machine-made and hand-rolled kretek
firms. Due to this limitation, we were unable to investigate the socio-economic and liveli-
hood conditions of hand-rolled kretek workers in isolation from the machine-made kretek
workers. The hand-rolled kretek roller survey thus complements the existing national level
surveys. Second, the insight into the qualitative dimensions of choice of livelihood, partic-
ularly the work-life preference pattern of predominantly female hand-rolled kretek work-
ers, is critical in identifying the alternative livelihood options for displaced kretek workers.
This dimension was captured in both the focus group discussions (FGDs) and a specific
module on kretek workers’ livelihood options in the kretek roller household survey.
This report consists of six sections, including this introduction. The next section,
Section 2, describes the socioeconomic profile of kretek workers and their households. In
Section 3, the labor market characteristics of kretek workers are discussed. The livelihood
status of kretek workers are covered in Section 4. Section 5 presents the simulated results
of the impacts of cigarette excise tax policy reform on the livelihood of kretek workers.
Finally, Section 6 concludes with the summary of findings and policy recommendations.
The Economics of Kretek Rolling in Indonesia
13
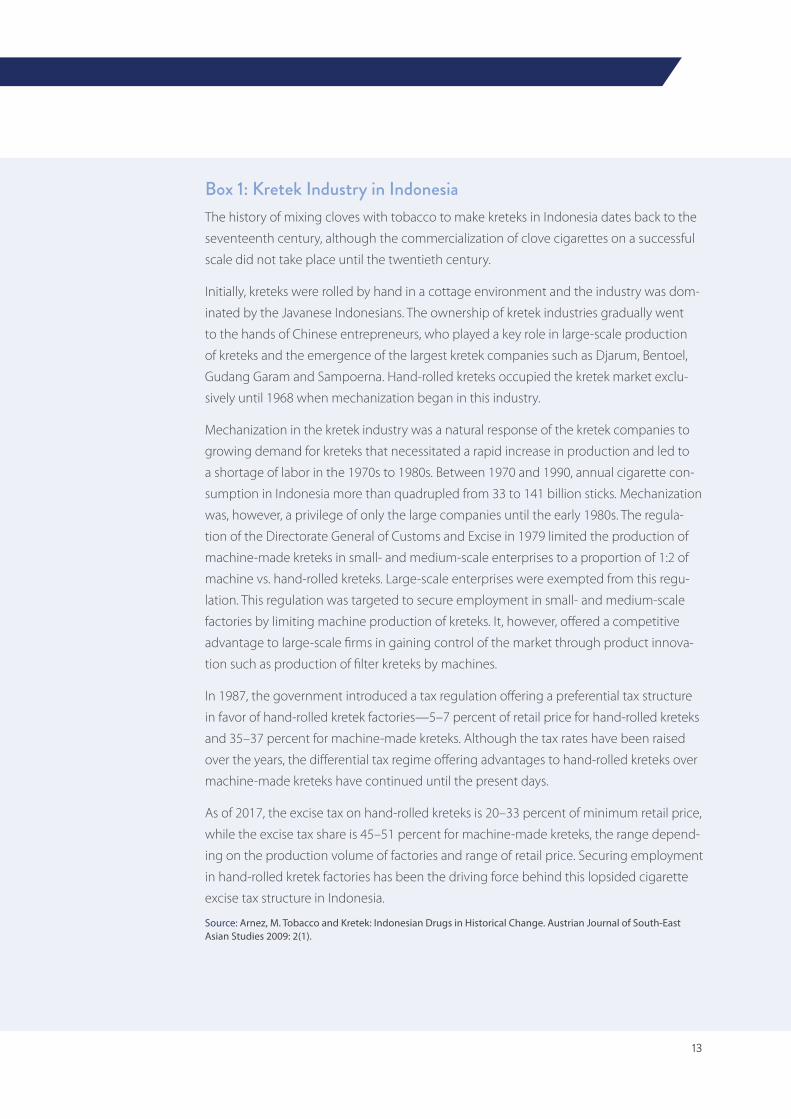
Box 1: Kretek Industry in IndonesiaThe history of mixing cloves with tobacco to make kreteks in Indonesia dates back to the
seventeenth century, although the commercialization of clove cigarettes on a successful
scale did not take place until the twentieth century.
Initially, kreteks were rolled by hand in a cottage environment and the industry was dom-
inated by the Javanese Indonesians. The ownership of kretek industries gradually went
to the hands of Chinese entrepreneurs, who played a key role in large-scale production
of kreteks and the emergence of the largest kretek companies such as Djarum, Bentoel,
Gudang Garam and Sampoerna. Hand-rolled kreteks occupied the kretek market exclu-
sively until 1968 when mechanization began in this industry.
Mechanization in the kretek industry was a natural response of the kretek companies to
growing demand for kreteks that necessitated a rapid increase in production and led to
a shortage of labor in the 1970s to 1980s. Between 1970 and 1990, annual cigarette con-
sumption in Indonesia more than quadrupled from 33 to 141 billion sticks. Mechanization
was, however, a privilege of only the large companies until the early 1980s. The regula-
tion of the Directorate General of Customs and Excise in 1979 limited the production of
machine-made kreteks in small- and medium-scale enterprises to a proportion of 1:2 of
machine vs. hand-rolled kreteks. Large-scale enterprises were exempted from this regu-
lation. This regulation was targeted to secure employment in small- and medium-scale
factories by limiting machine production of kreteks. It, however, offered a competitive
advantage to large-scale firms in gaining control of the market through product innova-
tion such as production of filter kreteks by machines.
In 1987, the government introduced a tax regulation offering a preferential tax structure
in favor of hand-rolled kretek factories—5–7 percent of retail price for hand-rolled kreteks
and 35–37 percent for machine-made kreteks. Although the tax rates have been raised
over the years, the differential tax regime offering advantages to hand-rolled kreteks over
machine-made kreteks have continued until the present days.
As of 2017, the excise tax on hand-rolled kreteks is 20–33 percent of minimum retail price,
while the excise tax share is 45–51 percent for machine-made kreteks, the range depend-
ing on the production volume of factories and range of retail price. Securing employment
in hand-rolled kretek factories has been the driving force behind this lopsided cigarette
excise tax structure in Indonesia.
Source: Arnez, M. Tobacco and Kretek: Indonesian Drugs in Historical Change. Austrian Journal of South-East Asian Studies 2009: 2(1).

14 // Executive Summary
SMOKING HAS BEEN A MAJOR CONTRIBUTOR OF DISEASE BURDEN IN INDONESIA. SMOKING PREVALENCE AMONG WORKING-AGE INDIVIDUALS HAS EXCEEDED 30 PERCENT SINCE 2001.

15
SOCIOECONOMIC PROFILE OF KRETEK WORKERS Kretek workers are typically female, older adults with low levels of education. Table
A2 in Appendix A (Sampling and Survey Methods) summarizes the socioeconomic charac-
teristics of the kretek workers and their household members in the sample. The average
age of the kretek worker is 40 years, and about 94% of the kretek workers are female.
More than half of the kretek workers obtained elementary education. About 27% of the
kretek workers obtained a junior high school education, while only 15% of them obtained
a senior high school education.
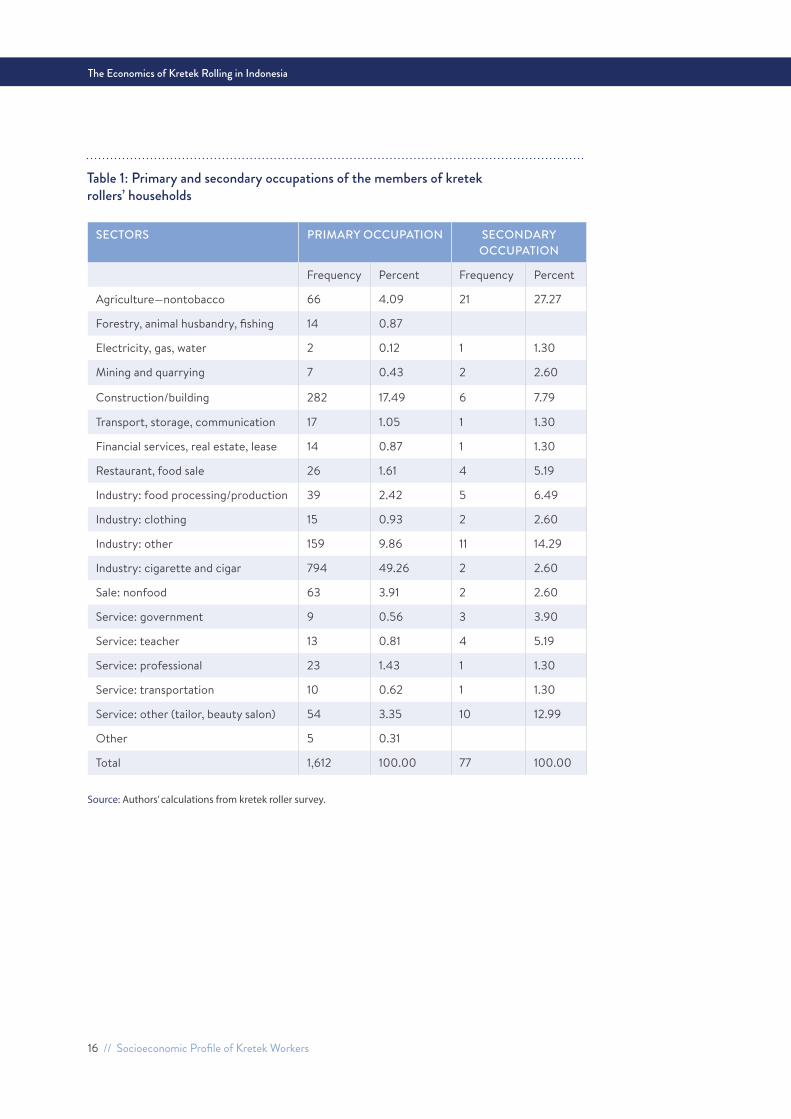
Kretek rollers’ households rely on diverse sources for wage income. About half of
wage workers in the kretek-rollers’ households work in kretek firms as their primary occu-
pation (Table 1). The second largest proportion of household members (17.5%) work in the
construction sector. Almost all kretek rollers (98.6%) reported that they have other house-
hold members who work in different sectors other than kretek rolling, such as farming,
nonfarm agricultural activities, utilities, mining and quarrying, construction, transport, food
processing and sales, textile industry, trading, and different services. Thus, less than 2% of
kretek rollers’ households depend solely on kretek rolling as their main occupation and are
likely the most vulnerable segment of the population dependent on the kretek industry.
While lack of skill generally limits market opportunities to be employed, there is no specific skill requirement to work in a kretek factory, as revealed by several FGD par-ticipants. Other reasons for working in a kretek factory are the proximity to home, favorable
working hours, and avoidance of boredom. One participant mentioned that she works
shorter hours in a kretek factory (6 A.M. - 12 noon) than in other sectors (7 A.M. - 5 P.M.).
The participants also mentioned that a typical wage laborer or salaried employee receives
wages or salaries on a weekly or monthly basis, while kretek workers receive daily wages
which offer them greater liquidity of money. Furthermore, some participants mentioned
that they did not formally apply to work in kretek factories. They were brought in by their
friends or relatives and became apprentices in the factories.
About 70% of kretek workers reported that they are either in good, very good, or excellent health condition. Only 3.2% of workers reported poor health status. About
35% of workers reported to have suffered from any illness or injury in the past 30 days.
The median number of days these workers suffered from illness or injury is three. The medi-
an number of workdays lost due to illness or injury is one. In Figure 1, we show the average
2
The Economics of Kretek Rolling in Indonesia
16 // Socioeconomic Profile of Kretek Workers
SECTORS PRIMARY OCCUPATION SECONDARY OCCUPATION
Frequency Percent Frequency Percent
Agriculture—nontobacco 66 4.09 21 27.27
Forestry, animal husbandry, fishing 14 0.87
Electricity, gas, water 2 0.12 1 1.30
Mining and quarrying 7 0.43 2 2.60
Construction/building 282 17.49 6 7.79
Transport, storage, communication 17 1.05 1 1.30
Financial services, real estate, lease 14 0.87 1 1.30
Restaurant, food sale 26 1.61 4 5.19
Industry: food processing/production 39 2.42 5 6.49
Industry: clothing 15 0.93 2 2.60
Industry: other 159 9.86 11 14.29
Industry: cigarette and cigar 794 49.26 2 2.60
Sale: nonfood 63 3.91 2 2.60
Service: government 9 0.56 3 3.90
Service: teacher 13 0.81 4 5.19
Service: professional 23 1.43 1 1.30
Service: transportation 10 0.62 1 1.30
Service: other (tailor, beauty salon) 54 3.35 10 12.99
Other 5 0.31
Total 1,612 100.00 77 100.00
Table 1: Primary and secondary occupations of the members of kretek rollers’ households
Source: Authors’ calculations from kretek roller survey.

17
The Economics of Kretek Rolling in Indonesia
number of days kretek workers stopped working by their health status. It appears that
kretek workers who reported poor health conditions stopped working for about four days,
while those who did not report poor health stopped working for about two days. We find
no correlation between the number of days stopped working and age.
The employment in kretek factories is mostly localized. Most kretek workers (56%)
were born in the same place where they were working and residing. Others migrated
from their place of birth to the current place of residence primarily due to marriage
(51.6%), work (33.1%) and transfer of residence of family (9.5%). Thus, only 14.8% of all the
kretek workers migrated to work in the kretek industry.
There seems to exist relative ease of substitution of labor across industries. We observe that about 40% of the kretek workers were employed in a different sector, such
as textile, food production and processing, farming, retail sales, restaurant, tailoring, beauty
salon, and service industries, prior to working in the kretek industry. The fact that nearly half
of the kretek workers have prior market skills other than kretek rolling is evidence of resil-
ience to make a transition to a different sector in the event of job loss in the
kretek industry.
Figure 1: Number of days stopped working by self-reported health status of kretek workers
0
1
2
3
4D
AYS
STO
PPED
DO
ING
ACT
IVIT
IES
DU
E TO
ILLN
ESS
exce
llent
very
good
good
fair
poor
Source: Authors’ calculations from kretek roller survey.

The Economics of Kretek Rolling in Indonesia
18 // Socioeconomic Profile of Kretek Workers
A quarter of the kretek workers indicated that they switched to the kretek industry because it pays better. It is estimated that workers in tobacco manufacturing draw 14–
16% higher wages than comparable workers in other manufacturing sectors (see Table 7
in World Bank 2017a). In addition, 16% of kretek workers reported a better offer of benefits
and 17% reported proximity of the kretek factory to residence as the major incentives for
switching to the kretek industry. In the FGD, kretek workers mentioned that the benefits
of working in a large kretek firm include religious holiday allowance (tunjangan hari raya),
bonus for national holidays, paid maternal leave, health insurance, and severance pay. One
FGD participant mentioned that the pay for maternal leave is equivalent to the salary for
90 days.
More than a fifth of the kretek workers (22.6%) reported that one of their parents or parents-in-law were employed in the kretek industry. Only a small proportion of kretek
workers (4.4%) reported that their grandparents were employed in the kretek industry. How-
ever, most kretek workers (82%) do not want their children to be employed in the kretek
industry because they want to see their children move upward to higher paying jobs.

19
The Economics of Kretek Rolling in Indonesia
20 // Executive Summary
SMOKING HASBEEN A MAJORCONTRIBUTOR ODISEASE BURDENINDONESIA. SMOPREVAVV LENCE
AGE INDIVIDUALHAS EXCEEDED 3PERCENT SINCE 2

21
LABOR MARKET OUTCOMES OF KRETEK ROLLERSThe kretek rollers in the sample work mostly in large firms that employ more than 500
workers (72.6%) followed by medium firms with 151–500 workers (20.2%), small firms with
51–150 workers (4.9%) and micro firms with less than 50 workers (2.3%). Based on the
unconditional median wage rates (including value of in-kind benefits) reported in Table
2 for daily, weekly, and monthly payments stratified by firm size, we find that larger kretek
rolling firms tend to pay higher wages than smaller kretek rolling firms for daily wage
laborers. The difference is not systematic for weekly and monthly payments.
Most kretek workers (96%) are production line workers. Kretek workers are involved
in different stages of kretek production. About 38% are involved in rolling paper, 33% in
filling tobacco dust, 38% in cutting, 31% in packaging, and 13% in ticketing. About 46%
of these workers are engaged in more than one task. For example, 26.8% of workers are
engaged in both rolling paper and filling tobacco dust. There is, however, a clear division
of labor on task combinations. Kretek workers engaged in rolling paper are also engaged
in filling tobacco dust and cutting. On the other hand, kretek workers engaged in pack-
aging may also be engaged in ticketing, but not in rolling paper, filling tobacco dust, or
cutting. Therefore, we classify kretek workers into those who roll, fill tobacco dust, and cut
(63%) and those who pack and place tickets (32%). There is generally no difference in spe-
cialization in tasks between contract and casual labor, except in filling tobacco dust and
packaging where a larger proportion of contract workers are engaged.
3
SMOKING HASBEEN A MAJORCONTRIBUTOR ODISEASE BURDENINDONESIA. SMOPREVAVV LENCE
AGE INDIVIDUALHAS EXCEEDED 3PERCENT SINCE 2
Table 2: Median daily, weekly, and monthly wages (Rp) of kretek rollers by firm size
FREQUENCY OF PAYMENT
MICRO FIRM(<=50 WORKERS)
SMALL FIRM (51–150 WORKERS)
MEDIUM FIRM (151–500 WORKERS)
LARGE FIRM (>500 WORKERS)
ALL KRETEK FIRMS
Daily 20,000 20,000 32,900 40,000 40,000
Weekly 350,000 225,000 265,750 407,000 350,000
Monthly 2,200,000 1,400,000 1,639,000 1,670,000 1,670,000
Number of observations
18 39 160 576 793
The Economics of Kretek Rolling in Indonesia
22 // Labor Market Outcomes of Kretek Workers
In the FGD, participants mentioned that the wage is different across tasks, such as, rolling kretek (nggiling), cutting both edges of kreteks (mbathil), and packing kreteks (nyonthong). For example, a participant who works in a large factory mentioned
that they can roll 4,000 kreteks per day and earn Rp 50,000 for rolling (nggiling) or Rp
30,000 for cutting the edge of kreteks (mbathil). On the other hand, a participant who
works in a smaller firm rolls 1,500 to 2,000 kreteks per day and earns Rp 16,000 for rolling
or Rp 11,000 for cutting the edge of kreteks.
Most workers (96%) receive annual religious holiday allowances and three-quar-ters receive health allowance from their employers, suggesting a wide coverage of benefits offered by the kretek industry. Moreover, over two-thirds of workers reported
that they receive masks, apparel, and hats as safety equipment in their workplace. In case
of illness, 40% of workers receive free medication from factory clinics, 67% of workers
are covered by the Indonesian National Health Insurance Badan Penyelenggara Jaminan
Sosial (BPJS), and 32% of workers receive reimbursements for medications they purchase
individually.
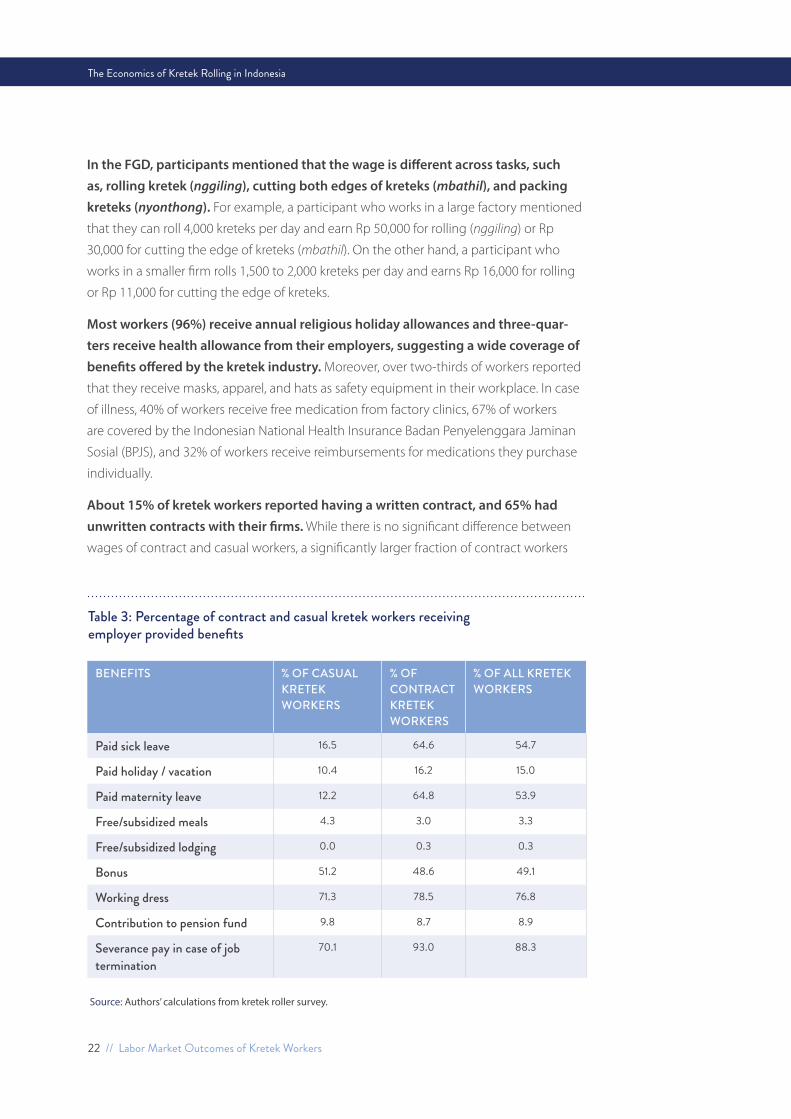
About 15% of kretek workers reported having a written contract, and 65% had unwritten contracts with their firms. While there is no significant difference between
wages of contract and casual workers, a significantly larger fraction of contract workers
BENEFITS % OF CASUAL KRETEK WORKERS
% OF CONTRACT KRETEK WORKERS
% OF ALL KRETEK WORKERS
Paid sick leave 16.5 64.6 54.7
Paid holiday / vacation 10.4 16.2 15.0
Paid maternity leave 12.2 64.8 53.9
Free/subsidized meals 4.3 3.0 3.3
Free/subsidized lodging 0.0 0.3 0.3
Bonus 51.2 48.6 49.1
Working dress 71.3 78.5 76.8
Contribution to pension fund 9.8 8.7 8.9
Severance pay in case of job termination
70.1 93.0 88.3
Table 3: Percentage of contract and casual kretek workers receiving employer provided benefits
Source: Authors’ calculations from kretek roller survey.
23
The Economics of Kretek Rolling in Indonesia
reported receiving nonwage benefits from their employers, such as, paid sick leave, paid
holiday/vacation, paid maternity leave and severance pay (Table 3). Note that while the
coverage of severance pay benefit is enormous (93%) for contract workers, the percent-
age of casual workers receiving this benefit (70%) is not negligible.
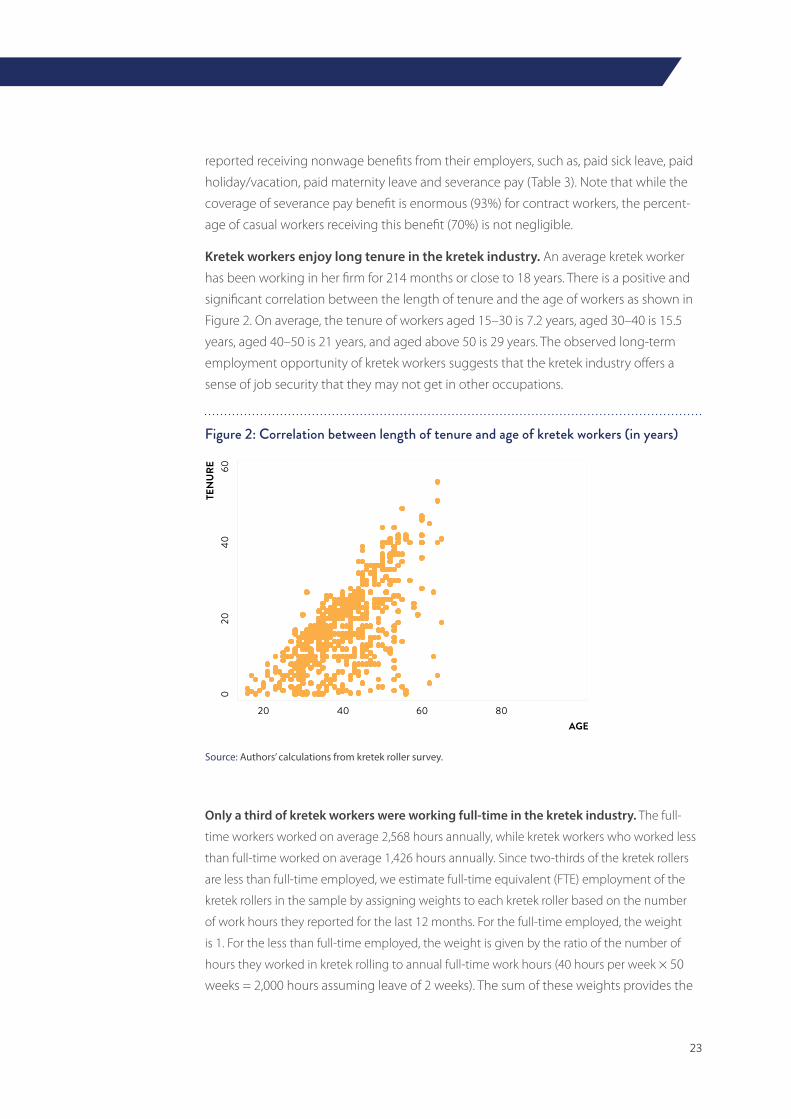
Kretek workers enjoy long tenure in the kretek industry. An average kretek worker
has been working in her firm for 214 months or close to 18 years. There is a positive and
significant correlation between the length of tenure and the age of workers as shown in
Figure 2. On average, the tenure of workers aged 15–30 is 7.2 years, aged 30–40 is 15.5
years, aged 40–50 is 21 years, and aged above 50 is 29 years. The observed long-term
employment opportunity of kretek workers suggests that the kretek industry offers a
sense of job security that they may not get in other occupations.
Only a third of kretek workers were working full-time in the kretek industry. The full-
time workers worked on average 2,568 hours annually, while kretek workers who worked less
than full-time worked on average 1,426 hours annually. Since two-thirds of the kretek rollers
are less than full-time employed, we estimate full-time equivalent (FTE) employment of the
kretek rollers in the sample by assigning weights to each kretek roller based on the number
of work hours they reported for the last 12 months. For the full-time employed, the weight
is 1. For the less than full-time employed, the weight is given by the ratio of the number of
hours they worked in kretek rolling to annual full-time work hours (40 hours per week × 50
weeks = 2,000 hours assuming leave of 2 weeks). The sum of these weights provides the
Figure 2: Correlation between length of tenure and age of kretek workers (in years)
020
4060
TEN
URE
20 40 60 80AGE
Source: Authors’ calculations from kretek roller survey.
The Economics of Kretek Rolling in Indonesia
24 // Labor Market Outcomes of Kretek Workers
FTE number of kretek rollers. The FTE employment is thus 80.4% (639 FTE workers out of
795) of the actual number of individuals employed in kretek rolling. By this measure, the
307,793 workers employed in the kretek industry as of 2014 is equivalent to 247,394 full-
time workers.
An FTE ratio of less than one may indicate the presence of underemployment or casual labor, as well as willingness to provide supplementary income for total household earning among kretek workers. Given that kretek workers are predom-
inantly female who are less likely to be household heads and more likely to have non-
market responsibilities (e.g., child care, household chores), it is typically the motivation to
provide supplementary income for the family that drives the less than full employment
nature of kretek rolling.
Labor force participation is somewhat higher among women (80%) than men (74%) among working-age members (15–69 years) in kretek rollers’ households. The female
labor force participation rate is biased upward given the sample selection criterion of the
inclusion of households with at least one kretek roller who is predominantly female. Among
the female labor force participants, 85.5% are employed in the kretek industry, indicating the
predominance of the kretek industry as a source of employment to the female labor force in
the region. The other 14.5% female workers are employed in retail sales, the food processing
industry, services such as tailoring and beauty salon, garments industry, teaching and other
professional services, farming, restaurants, and other industries.
In what follows, we examine the determinants of labor force participation and work hour decisions in the kretek industry. Since most workers in the kretek industry are
women (94%) and female labor supply decisions are characteristically different from male
labor supply, we have limited the labor supply analysis below to female kretek rollers only.
The labor supply decisions in kretek industry can be modeled in three stages:
1. Participation in the labor market
2. Choice to work in the kretek industry conditional on participation in the
labor market
3. Work intensity or number of hours worked annually conditional on labor
market participation and choice to work in the kretek industry
In order to determine the wage elasticity of labor supply of kretek rollers, we have used a
predicted wage from an ordinary least squares (OLS) wage regression (Column 1 in Table 4)
fitted with the basic socio-demographic characteristics and area of residence of the female
working-age (15–69) individuals in the sample. The reported wages for working individuals
are replaced with predicted wages in order to address the possible endogeneity of the wage
variable in the regression.

25
The Economics of Kretek Rolling in Indonesia
1: HOURLY WAGE (OLS)
2: PROBABILITY TO PARTICIPATE IN LABOR MARKET (PROBIT)
3: PROBABILITY TO WORK IN KRETEK INDUSTRY (PROBIT)
4: WORK HOURS IN KRETEK INDUSTRY (OLS)
Predicted hourly wage (thousand Rp)
0.0091(0.11)
–0.1259(–1.86)
–9.5887(–0.75)
Age –0.0003(–0.02)
–0.0017(–1.24)
0.0066***(4.73)
0.8670(0.24)
Married 1.993***(3.41)
0.2611(1.53)
0.4110**(3.03)
290.6*(2.05)
Divorced/separated/widowed
1.037(1.33)
0.1204(1.23)
0.2013*(2.53)
227.8(1.42)
Elementary education 1.496**(2.62)
0.1836(1.36)
0.3170**(2.78)
28.17(0.23)
Junior high schooleducation level
1.844**(2.91)
0.1607(0.97)
0.3369*(2.45)
118.2(0.89)
Senior high school andabove education level
3.068***(4.45)
0.0698(0.26)
0.3905(1.80)
–136.6(–0.87)
Number of childrenage 5 and below
–0.1153***(–6.00)
0.0192(0.97)
–65.26(–1.38)
Household asset(million Rp)
–0.0038(–0.48)
–0.0010(–0.97)
–0.127(–0.08)
Household nonlaborincome (million Rp)
–0.0017(–1.21)
0.0015(0.82)
–6.412(–1.04)
Firm size 105.9*(2.33)
ObservationsAdjusted R2
8600.338
1,080 830 7420.303
Table 4: Results of estimation of female kretek rollers’ labor supply function
Source: Authors’ calculations from kretek roller survey. Note: 1. The reference categories include never married and no schooling/kindergarten level education. 2. The coefficients for enumeration areas are suppressed for brevity of presentation. There are 40 enumeration areas in the sample. 3. The estimated coefficients are marginal effects that represent change in the dependent variable from a unit difference in the continuous independent variables or from the reference category for discrete independent variables. 4. t statistics are shown in parentheses below the coefficients in Columns (1) and (4). Z statistics are shown in parentheses below the coefficients in Columns (2) and (3). 5. * p < 0.05, ** p < 0.01, *** p < 0.001

The Economics of Kretek Rolling in Indonesia
26 // Labor Market Outcomes of Kretek Workers
The results of estimation of the above four functions, provided in Table 4, indicate that wage rate is not a significant determinant of women’s labor force participation or the decision to work in the kretek industry or number of work hours (Columns 2, 3 and 4). The only significant determinant of labor force participation of women is the pres-
ence and number of young children (age 5 and below) in the family. For each additional
child, the probability of a woman participating in the labor market goes down by 0.11
(Column 2). However, number of minor children is not a significant factor in the decision
to work in the kretek industry. This finding distinguishes kretek rolling as a convenient
source of employment for the female labor force, who prefer flexibility of work hours criti-
cally needed for household management.
Among the female labor force participants, older, married, divorced/separated/widowed, and workers with elementary or junior high school level educations are more likely to work in the kretek industry than in other sectors (Column 3). The
number of annual work hours is significantly higher for married women and for the work-
ers in larger firms (Column 4).
When asked where they would have worked had they not been working in a kretek factory to begin with, about 35% of workers answered that they would have been a housewife. This percentage is somewhat lower (26.8%) among the kretek rollers who
are the heads of their households and are presumably heavily dependent on their job
in the kretek industry as the principal earner of the family. Kretek workers gave similar
responses when they were asked about the type of job they see themselves having if the
factory closes.
The likelihood that a kretek roller would have been a housewife is correlated with years of schooling and age. As reported in Column 1 of Table 5, kretek workers with
fewer years of schooling are associated with a greater likelihood of being a housewife, as
these workers are less likely to possess specific skills that are needed in the labor market.
Similarly, older workers expressed greater willingness to turn to be a housewife in the
absence of kretek rolling.
The preference of female kretek workers for reverting to the role of a housewife in case of job loss in the kretek industry was also reflected exclusively in the FGDs. The participants revealed that they would not look for any other job. They would rather
stay home and take care of children and household chores. Their strong preference for
kretek rolling as a job comes from the fact that it offers flexible work hours, and they can
enjoy a balance between their responsibilities at work and their households. The flexibility
of work hours in kretek factories lends support to the finding in the labor supply function
presented in Table 4, that shows the number of minor children in the household is not a
significant factor in the decision to participate in kretek rolling.

27
The Economics of Kretek Rolling in Indonesia
1: WOULD HAVE BEEN A HOUSEWIFE
2: WOULD HAVE BEEN WORKING IN HOME-BASED ECONOMIC ACTIVITY
3: QUIT WHEN GOVERNMENT HAS REDEPLOYMENT/SOCIAL ASSISTANCE PROGRAM
Years of schooling –0.013**(0.006)
0.019***(0.006)
–0.004(0.007)
Months since first worked –0.000(0.000)
0.000(0.000)
–0.001***(0.000)
1 if head of households –0.104(0.109)
0.030(0.082)
0.150(0.094)
Actual age 0.006**(0.003)
–0.004(0.003)
–0.004(0.003)
1 if married 0.146(0.089)
–0.089(0.069)
–0.013(0.093)
Number of dependents in the household
0.016(0.022)
–0.013(0.022)
–0.007(0.022)
Both husband and wife work
–0.120(0.100)
0.113(0.094)
0.067(0.093)
Proportion of kretek income in total household income
–0.001(0.001)
0.001(0.001)
0.001*(0.001)
1 if have a contract 0.157***(0.049)
0.006(0.047)
0.067(0.047)
Daily payment –0.237***(0.042)
0.092**(0.036)
–0.146***(0.042)
Full-time equivalent –0.065(0.085)
–0.056(0.068)
–0.049(0.087)
Number of observations 718 718 718
Table 5: Determinants of reasons to stay or work in the kretek industry
Source: Authors’ calculations from kretek roller survey. Note: * p < 0.10, ** p < 0.05, *** p < 0.01

The Economics of Kretek Rolling in Indonesia
28 // Labor Market Outcomes of Kretek Workers
Another 25% of kretek workers reported that they would have been engaged in home-based nonfarm self-employment activities had they not been working in a kretek factory. These activities include, but are not limited to, opening a beauty shop,
bamboo wicker business, bird cage business, cake shop, noodle shop, clothes shop, food
stall, massage service, meatball shop, phone shop, printing shop, snack/drink stall, doing
embroidery, selling fruits, selling cooked snail, or becoming a tailor. As reported in Col-
umn 2 of Table 5, kretek workers with longer years of schooling are more likely to choose
home-based income generating activities. These workers may have gained specific skills
during their schooling years. About 9.4% of kretek workers indicated that they would
have been engaged in home-based farming. Thus, in total, about 35% (25% in non-
farm and 9.4% in farm activities) of kretek workers indicated that they would have been
engaged in micro or home-based enterprises had they not worked in the kretek industry.
Kretek workers were asked if they would quit their job at the kretek industry if the government launches a re-skilling and redeployment program. About 38% of work-
ers are willing to quit their current job, while the majority (62%) are reluctant to quit. As
shown in Column 3 of Table 5, kretek workers with longer tenure at the factory are more
likely to be reluctant to quit. It is also notable that kretek workers with a higher proportion
of kretek income in total household income, who are more dependent on employment in
the kretek industry and who are more vulnerable in the event of loss of a job in the kretek
industry, are more willing to quit and join a re-skilling and redeployment program.
The critical policy relevant question is whether kretek workers are capable or willing to find employment in alternative occupations. When asked whether they
would continue to work in the kretek industry if they have job opportunities offering
equal or higher wages than they currently make in the kretek industry, 88% answered in
the affirmative. Others indicated that they can be self-employed in household farm and
nonfarm activities.
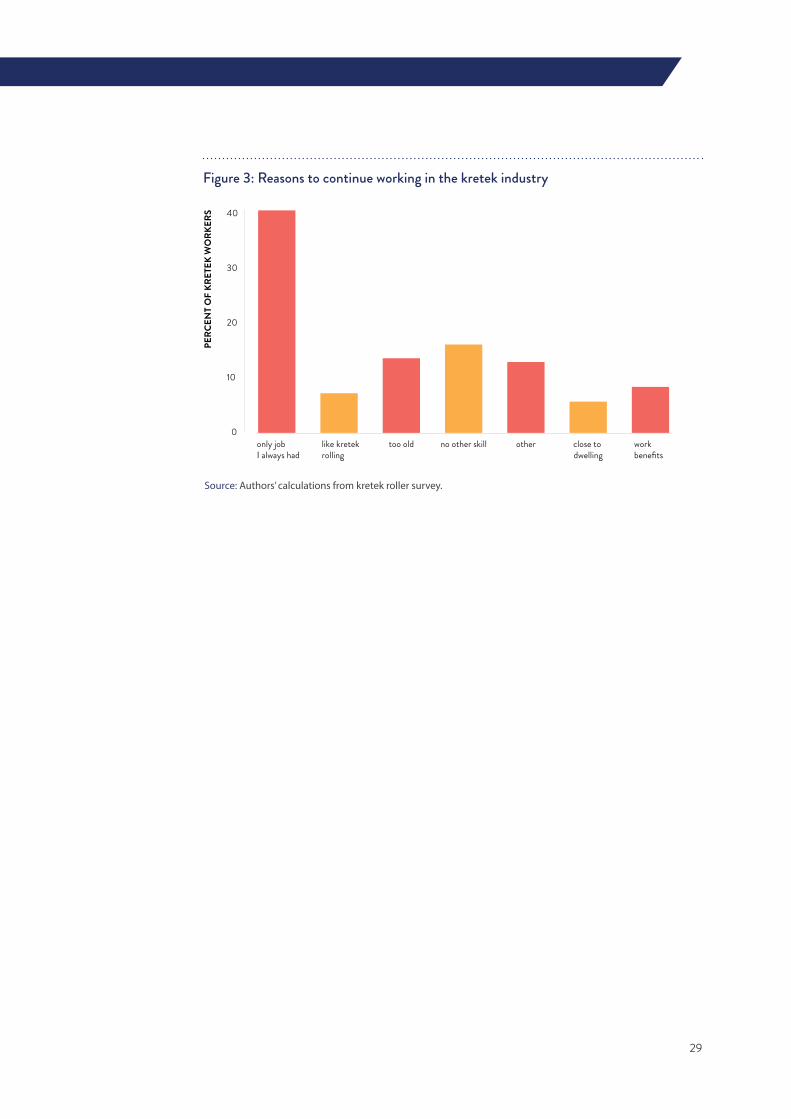
The preference for continuing to work in the kretek industry is strongly correlated with tenure. The largest proportion of workers (40%) reported that the main reason for
staying in the kretek industry is that kretek rolling is the only job they ever had (Figure 3).
Apparently, these workers are older and have enjoyed longer tenure. Recall that the aver-
age length of tenure among kretek workers is 18 years. The long-term nature of employ-
ment in the kretek industry suggests that the industry offers a stable and secure job to its
workers. Some kretek workers reported that they lack necessary skills for other jobs (15%),
are too old to move (13%), and prefer the work benefits (8%)—such as facilities, insurance,
and allowance. The minority of kretek workers who preferred to move to another industry
argued that working in the kretek industry is harmful to health (24%), they are willing to
learn new skills (20%), and they are not earning enough from kretek rolling (7%).
29
The Economics of Kretek Rolling in Indonesia
Figure 3: Reasons to continue working in the kretek industry
0
10
20
30
40PE
RCEN
T O
F KR
ETEK
WO
RKER
S
only job I always had
like kretekrolling
too old no other skill other close to dwelling
workbenefits
Source: Authors’ calculations from kretek roller survey.

30 // The Livelihoods of Kretek Rollers
SMOKING HAS BEEN A MAJOR CONTRIBUTOR OF DISEASE BURDEN IN INDONESIA. SMOKING PREVALENCE AMONG WORKING-AGE INDIVIDUALS HAS EXCEEDED 30 PERCENT SINCE 2001.

31
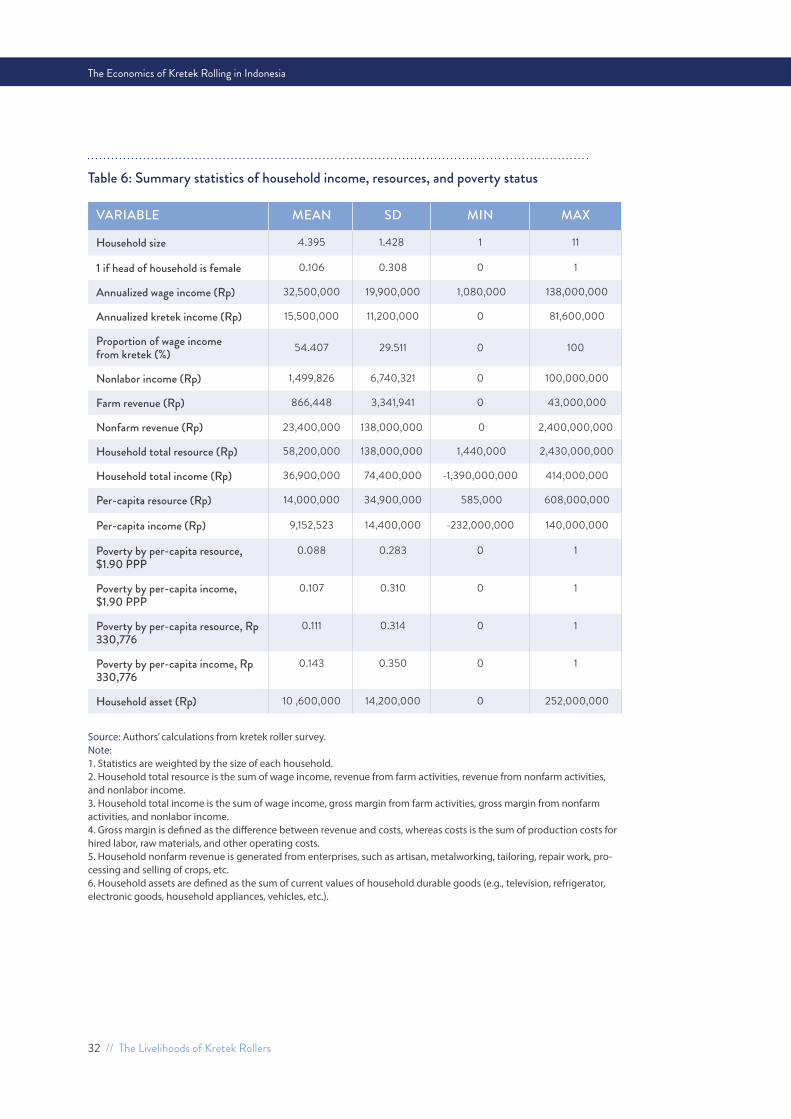
THE LIVELIHOODS OF KRETEK ROLLERSIn this section, we investigate kretek workers’ livelihoods, including their annual wage income, annual total household income, and total resources, per-capita resource and income, and poverty status.1 The summary statistics of these character-
istics of kretek rollers’ households are provided in Table 6. It shows that an average kretek
household earned about Rp 32,500,000 (US$2,437) of total wage income in the past year
and about Rp 15,500,000 (US$1,162) from the kretek industry. So, for the average house-
hold in the sample with a kretek worker, income from kretek rolling contributes a bit less
than half of the total wage income of the household.
The estimated poverty headcount ratio by the per-capita household resource is 8.8% based on the individual poverty line at US$1.90 a day at 2011 purchasing power parity (PPP) (Table 6). This figure is quite similar to the national level poverty rate of
8.3% in 2014 (World Bank Poverty and Equity Database). The estimated poverty rate based
on the national poverty line of Rp 330,776 per person per month (US$22.60) is 11.2%,
which is identical to Indonesia’s statistics estimate of 11.1% in September 2015.
So, households with kretek-based income are no more or less likely to be poor than
those who do not have any kretek-based income.
The poverty rate increases to 10.7% at US$1.90 a day at 2011 PPP or 14.3% at the national poverty line when using per-capita household income. The difference
in the poverty rates based on the household resource and income measures comes from
the difference in accounting for these two measures. Household resource adds up rev-
enue from farm and nonfarm household enterprises with wage and nonlabor income,
and household income measure subtracts the costs of farm and nonarm activities from
revenue and adds up the profit (or loss) with wage and non-labor income. While some of
the households who incur losses in farm and nonfarm enterprises make up for the loss by
cross-subsidizing from wages and nonlabor income, about 2–3% of households fail to
do so and are pushed below the poverty line.
4
1 We explain in detail the calculation of household income and household resource in Appendix B: Calculation of Total House-
hold Income and Resource.
The Economics of Kretek Rolling in Indonesia
32 // The Livelihoods of Kretek Rollers
VARIABLE MEAN SD MIN MAX
Household size 4.395 1.428 1 11
1 if head of household is female 0.106 0.308 0 1
Annualized wage income (Rp) 32,500,000 19,900,000 1,080,000 138,000,000
Annualized kretek income (Rp) 15,500,000 11,200,000 0 81,600,000
Proportion of wage income from kretek (%) 54.407 29.511 0 100
Nonlabor income (Rp) 1,499,826 6,740,321 0 100,000,000
Farm revenue (Rp) 866,448 3,341,941 0 43,000,000
Nonfarm revenue (Rp) 23,400,000 138,000,000 0 2,400,000,000
Household total resource (Rp) 58,200,000 138,000,000 1,440,000 2,430,000,000
Household total income (Rp) 36,900,000 74,400,000 -1,390,000,000 414,000,000
Per-capita resource (Rp) 14,000,000 34,900,000 585,000 608,000,000
Per-capita income (Rp) 9,152,523 14,400,000 -232,000,000 140,000,000
Poverty by per-capita resource, $1.90 PPP
0.088 0.283 0 1
Poverty by per-capita income, $1.90 PPP
0.107 0.310 0 1
Poverty by per-capita resource, Rp 330,776
0.111 0.314 0 1
Poverty by per-capita income, Rp 330,776
0.143 0.350 0 1
Household asset (Rp) 10 ,600,000 14,200,000 0 252,000,000
Table 6: Summary statistics of household income, resources, and poverty status
Source: Authors’ calculations from kretek roller survey. Note: 1. Statistics are weighted by the size of each household. 2. Household total resource is the sum of wage income, revenue from farm activities, revenue from nonfarm activities, and nonlabor income. 3. Household total income is the sum of wage income, gross margin from farm activities, gross margin from nonfarm activities, and nonlabor income. 4. Gross margin is defined as the difference between revenue and costs, whereas costs is the sum of production costs for hired labor, raw materials, and other operating costs. 5. Household nonfarm revenue is generated from enterprises, such as artisan, metalworking, tailoring, repair work, pro-cessing and selling of crops, etc. 6. Household assets are defined as the sum of current values of household durable goods (e.g., television, refrigerator, electronic goods, household appliances, vehicles, etc.).

33
The Economics of Kretek Rolling in Indonesia
The poverty status of households is significantly correlated with a lower level of education of household heads, larger number of dependents below age 15, female head, and higher proportion of kretek income in household total wage income (Table 7). These characteristics can help identify the vulnerable group of households who
need immediate support or a social safety net to prevent increased impoverishment from
job loss of kretek workers.
About two-thirds of the kretek households (60.84% in the sample) reported re-ceiving at least one form of social benefit in the past year provided by the gov-ernment of Indonesia. These are social safety nets for poor and near poor populations
documented in the ownership of a Social Protection Card (Kartu Perlindungan Sosial, KPS
and Kartu Keluarga Sejahtera, KKS) and Health Insurance Card (Kartu Indonesia Sehat, KIS
and BPJS Penerima Bantuan Iuran, PBI). Table 8 summarizes the enrollment of households
into these programs. These benefits include cash assistance or transfer, rice for the poor
(raskin), assistance for health payment, assistance for poor students, and from the social
protection programs of KPS or KKS. About 11.9% of kretek households own a KPS or KKS
card. They are entitled to a monthly cash assistance of Rp 200,000 (US$15). We find that
enrollment in the rice for the poor program is positively and significantly correlated with
female-headed households.
DEPENDENT VARIABLE: 1: POVERTY (US$1.90 PPP), RESOURCE
2: POVERTY (US$1.90 PPP), INCOME
3: POVERTY (RP 330,776), RESOURCE
4: POVERTY (RP 330,776), INCOME
Years of schooling of head -0.013***(0.003)
-0.013***(0.004)
-0.014***(0.004)
-0.016***(0.004)
Household size 0.004(0.010)
0.009(0.011)
-0.002(0.011)
0.019(0.015)
Number of dependents <15 0.040**(0.016)
0.043**(0.017)
0.061***(0.017)
0.047**(0.021)
1 if head of household is female 0.054*(0.030)
0.067**(0.032)
0.065**(0.032)
0.070*(0.036)
Proportion of wage income from kretek
0.001*(0.000)
0.001**(0.000)
0.001**(0.000)
0.002***(0.001)
Number of individualsNumber of households
2,838720
2,838720
2,838720
2,838720
Table 7: Determinants of poverty status among kretek households
Source: Authors’ calculations from kretek roller survey. Notes: Standard errors are clustered at the household level. * p < 0.10, ** p < 0.05, *** p < 0.01. The coefficients in the table indicate average marginal effects.

The Economics of Kretek Rolling in Indonesia
34 // The Livelihoods of Kretek Rollers
More than 95% of kretek households reported having sufficient food in the past year. Only 4.4% of households reported that they did not have enough food for their
household. About 70% of kretek households who did not have enough food received
rice from the rice for the poor program. When asked about reasons for experiencing food
insecurity, many kretek households reported job loss or inadequate income as the main
reasons. Note that 98% of kretek households purchase their staple foods, mainly rice, from
the market. Dependence on the market to obtain staple foods can make kretek house-
holds susceptible to food insecurity in a volatile job market or income uncertainties
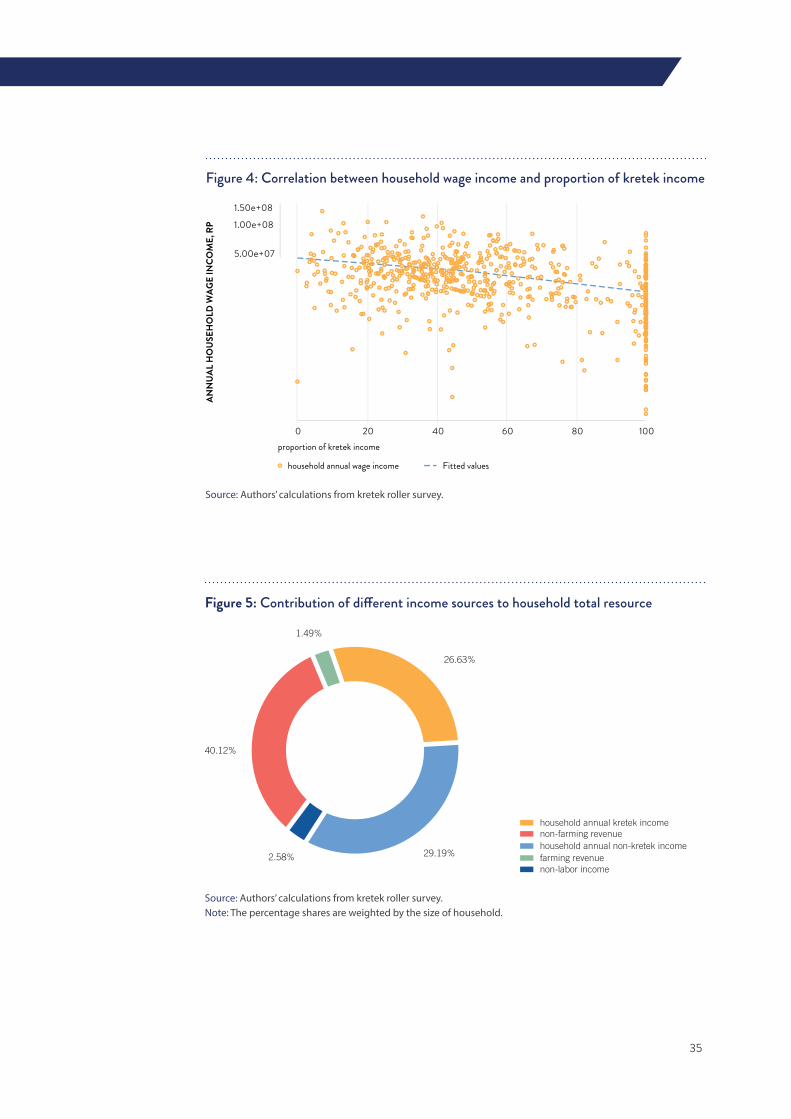
In about a quarter of kretek households with an estimated 292,491 household members, the share of kretek income to household wage income is 92% or higher. About 22% of kretek households rely solely on kretek rolling for wage income. This per-
centage is much larger (40%) among female-headed kretek households. We observe that
there is a significant and negative correlation between annual household wage income
and proportion of kretek income. As shown in Figure 4, households that rely solely on
kretek income have, on average, lower household wage income. These households are,
therefore, not only heavily dependent on kretek rolling and vulnerable to the loss of a job
in a kretek factory, but also suffer from relatively low wage income compared to house-
holds that diversify wage employment of household members.
VARIABLE MEAN SD MIN MAX N
1 has a social protection card (KPS or KKS) 0.12 0.32 0 1 720
1 has a health insurance (BPJS BPI or KIS) 0.31 0.46 0 1 720
Share of household member with health insurance 0.26 0.44 0 2.5 720
1 if received cash transfer, past year 0.04 0.19 0 1 720
1 if received subsidized rice (raskin), past year 0.57 0.50 0 1 720
1 if received assistance for health payment, past year 0.05 0.22 0 1 720
1 if received assistance for poor student, past year 0.08 0.27 0 1 720
Table 8: Availability of social safety nets to kretek households
Source: Authors’ calculations from kretek roller survey.
35
The Economics of Kretek Rolling in Indonesia
Figure 4: Correlation between household wage income and proportion of kretek income
5.00e+07
1.00e+08
1.50e+08AN
NU
AL H
OU
SEH
OLD
WAG
E IN
COM
E, R
P
0 20 40 60 80 100
proportion of kretek income
household annual wage income Fitted values
Source: Authors’ calculations from kretek roller survey.
Figure 5: Contribution of different income sources to household total resource
26.63%
29.19%2.58%
40.12%
1.49%
household annual kretek income
household annual non-kretek income
non-labor income
non-farming revenue
farming revenue
Source: Authors’ calculations from kretek roller survey. Note: The percentage shares are weighted by the size of household.

The Economics of Kretek Rolling in Indonesia
36 // The Livelihoods of Kretek Rollers
Figure 6: Average household resources (Rp) by source and full-time (FT) work status of kretek workers
0
1.0e+07
2.0e+07
3.0e+07
no FT kretek workers have FT kretek workers
kretek income non-kretek income non-labor incomenon-farming revenue farming revenue
Figure 7: Contribution of different income sources to household total income
non-farming profitfarming profit
household annual non-kretek incomenon-labor income
household annual kretek income46.06%
42.02%
4.07%
1.44%6.42%
Source: Authors’ calculations. Notes: Household total income is the sum of wage income, gross margins from farm activities, gross margins from nonfarm activities, and nonlabor income. The percentage shares are weighted by the size of household.
The Economics of Kretek Rolling in Indonesia
Kretek households rely mainly on wage income and nonfarming revenue to derive household resources. As shown in Figure 5, the largest share of household resource
(40%) comes from nonfarm revenue. The households with kretek workers who work less
than full-time in the kretek industry, on average, earn higher nonfarm revenue compared
to the households with full-time kretek workers (Figure 6). Kretek wage income contrib-
utes about 27% and non-kretek wage income contributes about 29% of household total
resource. The contribution of nonlabor income and farming revenue is quite small, only
4.1% of a household’s total resource.
The contributions of different sources change dramatically when the costs of pro-duction in farm and nonfarm activities are considered to calculate household total income (Figure 7). The contributions of nonfarm activities reduce to 6.4%. The contributions
of kretek wage income and non-kretek wage income, on the other hand, increase to 42%
and 46% respectively. Thus, total wage income accounts for the bulk (88%) of household
total income. In order to reduce the heavy reliance of kretek households on the kretek
industry for their livelihoods, their household income composition needs to be diverted to
nonwage sources such as profitable nonfarm enterprises and nonlabor income, which in
turn calls for educating and training of kretek workers in new skills.
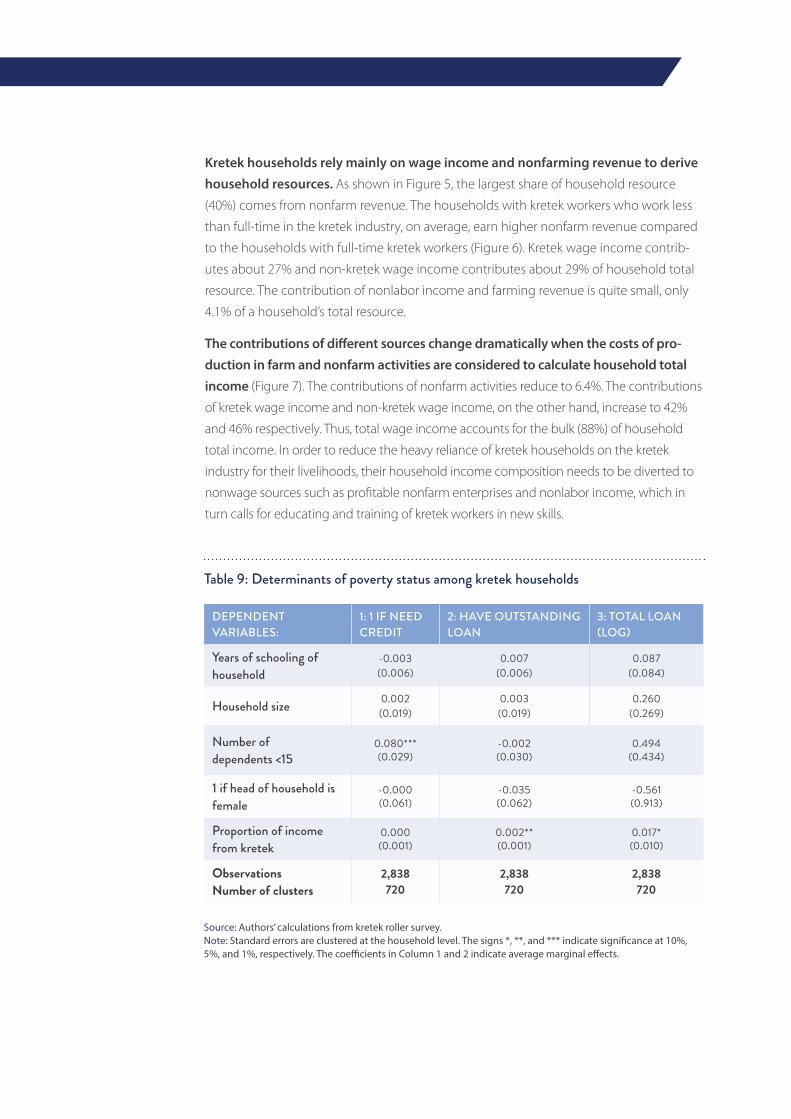
Table 9: Determinants of poverty status among kretek households
DEPENDENT VARIABLES:
1: 1 IF NEED CREDIT
2: HAVE OUTSTANDING LOAN
3: TOTAL LOAN (LOG)
Years of schooling of household
-0.003(0.006)
0.007(0.006)
0.087(0.084)
Household size 0.002(0.019)
0.003(0.019)
0.260(0.269)
Number of dependents <15
0.080*** (0.029)
-0.002(0.030)
0.494(0.434)
1 if head of household is female
-0.000(0.061)
-0.035(0.062)
-0.561(0.913)
Proportion of income from kretek
0.000(0.001)
0.002**(0.001)
0.017*(0.010)
ObservationsNumber of clusters
2,838720
2,838720
2,838720
Source: Authors’ calculations from kretek roller survey. Note: Standard errors are clustered at the household level. The signs *, **, and *** indicate significance at 10%, 5%, and 1%, respectively. The coefficients in Column 1 and 2 indicate average marginal effects.
The Economics of Kretek Rolling in Indonesia
38 // The Livelihoods of Kretek Rollers
About 54% of kretek households reported taking a loan in the past year, and about 66% of kretek households reported having outstanding loans. The average amount of
loan taken by kretek households is Rp 11.3 million, and the average amount the households
owe including interest is Rp 14.7 million. On average, the amount of new loans is equivalent
to 31% of household total resource, while the outstanding loan in the past year is equivalent
to 41% of household total resource. More than a quarter of the loans are used to finance
consumption of daily needs. This suggests that kretek households face a liquidity constraint
or irregular income flow. Among the kretek workers who used loans for daily needs, 82% are
contract workers. Apparently, the presence of a contract in kretek industry employment does
not mitigate the liquidity constraint. Another major use of the loans is for financing purchase
of a vehicle (16%) and schooling (13%).
The most reported sources of loans are tobacco companies (16.2%), relatives (16.1%), and micro-finance institutions (15%). Almost 93% of the loans taken from the tobacco
companies were interest bearing. The other two major sources of loans are commercial banks
and local money lenders. Most of the loans taken from relatives, neighbors, or fellow farmers
are interest free.
Households with a higher proportion of kretek income are more likely to have out-standing loans and tend to have larger amounts of outstanding loans (Table 9). This
result can be explained by the fact that these households have lower wage income and are
more likely to be poor. Lastly, households with more dependents need credit to meet the
basic needs. However, female-headed households are not at a higher risk of having an out-
standing loan.

39
The Economics of Kretek Rolling in Indonesia
40 // Executive Summary
SMOKING HAS BEEN A MAJOR CONTRIBUTOR OF DISEASE BURDEN IN INDONESIA. SMOKING PREVALENCE AMONG WORKING-AGE INDIVIDUALS HAS EXCEEDED 30 PERCENT SINCE 2001.
41
5POTENTIAL IMPACTS OF HIGHER TOBACCO TAXES ON KRETEK HOUSEHOLDS In the current agenda of improving the tobacco tax system as part of strengthen-ing tobacco control in Indonesia, increase in cigarette excise tax would have to be accompanied by simplification of the multitiered tax structure. Currently Indonesia
has a 12-tiered specific excise tax system for hand-rolled kreteks, machine-made kreteks,
and white cigarettes. The current system favors relatively cheap hand-rolled kreteks by
offering lower tax rates. On the one hand, it offers affordable products to the young and
potential smokers encouraging smoking initiation; on the other hand, it makes a cheaper
option for current smokers to switch down to in the event of price increase. A desirable
tax reform would gradually unify the tax rates and reduce the price gap between different
types of cigarettes. With the current tiered tax structure benefiting hand-rolled kretek
manufacturers, the required tax and price increases would not be uniform across all types.
More specifically, the tax increase would be proportionately larger at the lower end for
hand-made kreteks.
In this section, we run simulations to measure the potential impacts of such reforms in the cigarette excise tax policy on the livelihood outcomes of handmade kretek rollers. This effect should be interpreted in isolation from the negative effects on
handmade kretek rollers’ employment that is already in place due to the rise in demand
for machine-made kreteks relative to handmade kreteks. The growth in cigarette produc-
tion over the past decade from 235.5 billion sticks in 2005 to 342 billion sticks in 2016 has
been dominated by the upward trend in the demand for machine-made kreteks (World
Bank, 2017a).
The rise in machine-made kretek sales partly reflects shifting consumer preference from traditional hand-rolled kreteks to machine-made kreteks, spurred by high income growth of the Indonesian population. From 2005 through 2015, the annual
per capita gross domestic product (GDP) growth in Indonesia ranged from 3.3% to 5%.2
Without matching increases in the real price of tobacco products, this income growth
is expected to not only boost the demand for tobacco products, but also lead smokers
2 IMF. World Economic Outlook Database, International Monetary Fund, April 2017.

The Economics of Kretek Rolling in Indonesia
42 // Potential Impacts of Higher Tobacco Taxes on Kretek Households
to switch upward to more appealing and higher priced tobacco products. The declining
trend in the demand for hand-rolled kreteks and loss of employment in this sector may
also be attributable in part to the mechanization of kretek production and the switching
of producers to more efficient technology. The effects of these factors have not been con-
sidered in the current simulation.
The policy scenario deemed for cigarette excise tax reform in the report, The Economics of Tobacco Taxation and Employment in Indonesia (World Bank, 2017a), is summarized in Table 10. We considered two criteria for determining the
desired tax increases at varying rates for different categories of cigarettes: (i) the minimum
tax increase required to induce increase in cigarette price that would keep the affordabil-
ity of cigarettes from increasing, and (ii) the disproportionately larger tax increases for the
categories with lower tax rates that would help bridge the price gap between different
categories of cigarettes and reduce the number of tax tiers.
TYPE A: TIER B: CONSUMPTION (BILLIONS OF STICKS)
C: EXCISE TARIFF 2017 (RP)
D: BASE REVENUE (BILLION RP))
F: PROPOSED TAX INCREASE (%)
H: NEW TARIFFS (RP)
Machine-made keretek (SKM )
I 212 530 112,360 12 594
IIA 17 365 6,205 40 511
IIB 21 335 7,035 53 511
Hand-made kretek (SKT)
IA 13 345 4,485 16 400
IB 40 265 10,600 51 400
IIA 5 165 825 21 200
IIB 5 155 775 29 200
IIIA 5 100 500 100 200
IIIB 7 80 560 150 200
White ciga-rettes (SPM)
I 16 555 8,880 10 611
IIA 2 330 660 30 429
IIB 2 290 580 48 429
Total 345 153,465
Table 10: Proposed cigarette tax increase and new cigarette excise tariffs
Source: Authors' calculations.

43
The Economics of Kretek Rolling in Indonesia
We estimate that the desired tax increase will reduce employment in the tobacco manufacturing sector by 0.43%. This implies a reduction of 2,914 tobacco man-ufacturing jobs, including 2,245 jobs (0.22%) in the handmade kretek industry. This estimate is based on the price elasticity of demand for cigarettes and the employ-
ment elasticity of output in the kretek industry calculated in The Economics of Tobacco
Taxation and Employment in Indonesia (World Bank, 2017a). To estimate the effects of
raising tobacco taxes on kretek households’ livelihoods, we use the following procedure.
First, we randomly select kretek workers in the survey sample so that on average 0.22%
of them lose their job. Second, we calculate the effect of losing the kretek-rolling job on
household total wage income, household total income, household total resource, and
poverty status. For kretek workers who lose their job, we calculate their households’ post-
kretek wage income, total income, and total resource. Then, we calculate the percentage
changes of these variables. We also identify whether the poverty status of their house-
holds changes after losing their jobs. Note that the results of the calculation depend on
which worker is “randomly” chosen to be laid off. To address this concern, we draw the
sub-sample of laid off workers and simulate 1000 times. Table 11 reports the results of the
simulations in 776 cases where some positive number of workers are laid off randomly.
SIMULATIONS MEAN SD MIN MAX
Share of laid-off workers, % 776 0.276 0.18 0.035 1.38
Change in wage income, % 776 –50.27 23.37 -100 0
Change in household resource, % 776 -38.82 20.14 -100 0
Change in household income, % 776 -41.89 20.08 -100 0
Change in poverty level (resource), US$1.90 PPP, %
776 0.049 0.076 0 0.422
Change in poverty level (resource), Rp 330,776, %
776 0.064 0.087 0 0.458
Change in poverty level (income), US$1.90 PPP, %
776 0.060 0.087 0 0.528
Change in poverty level (income), Rp 330,776, %
776 0.077 0.098 0 0.564
Table 11: The simulated impacts of cigarettes excise tax reform on the livelihood of handmade kretek workers
Source: Authors’ calculations.. Note: Since the share of laid-off workers is quite low, 0.22%, then there are cases in the simulations with no kretek workers laid off. We discard those cases from the simulations.

The Economics of Kretek Rolling in Indonesia
44 // Potential Impacts of Higher Tobacco Taxes on Kretek Households
On average, the simulations suggest that the loss of jobs will be 0.22%, which is quite low. For kretek workers who lose their jobs, their households would experi-ence a decrease in wage income by about 50%, in household resource by about 39%, and in household income by about 42%, due to the loss of jobs of 0.22% workers. The decrease in wage income is estimated to be higher at 50%. However,
households have other income sources such as farm and nonfarm resources. Thus, the
estimated drops in household resources and income are still lower than the estimated
drop of wage income.
Some of the affected households, particularly those without a significant support from nonwage income, would plunge into poverty. The higher tobacco taxes are esti-
mated to increase poverty among kretek households by about 0.04% to 0.06%, depend-
ing on the definition of poverty. The negative tobacco tax impacts on households’ liveli-
hoods call for government support for social safety nets for these households.
The total income loss from the reduction in employment in the handmade kretek industry is, however, minimal compared to the revenue gain from the tax increase. The simulation in The Economics of Tobacco Taxation and Employment in Indonesia
(World Bank, 2017a) paper based on the policy scenario in Table 10 estimates that the
annual revenue gain would be Rp 10,915 billion (Table 11 in The Economics of Tobacco
Taxation and Employment in Indonesia (World Bank, 2017a) ) and the employment loss
in the handmade kretek industry would be 2,245 (Table 12 in The Economics of Tobacco
Taxation and Employment in Indonesia (World Bank, 2017a)). Given the mean annualized
kretek income at Rp 15,500,000 and the projected decrease in wage income by 41%, the
loss of 2,245 jobs in the kretek industry would imply total income loss amounting to Rp 14.3 billion, which is approximately 0.1% of the annual revenue gain. This is a
win-win policy change because the tax and price increase will not only reduce tobacco
use and related health costs, it will generate additional revenue which can more than
compensate for the income loss due to a reduction in production and employment in the
kretek industry.

45
The Economics of Kretek Rolling in Indonesia

46 // Concluding Remarks
SMOKING HAS BEEN A MAJOR CONTRIBUTOR OF DISEASE BURDEN IN INDONESIA. SMOKING PREVALENCE AMONG WORKING-AGE INDIVIDUALS HAS EXCEEDED 30 PERCENT SINCE 2001.

47
CONCLUDING REMARKSWhile pervasive use of tobacco and the growing number of smokers have been a long-standing public health issue in Indonesia, the relatively low prices and tax rates of hand-rolled kreteks pose an added challenge for policymakers in curb-ing the epidemic. Hand-rolled kreteks continue to be an affordable product for poor
individuals. Since these individuals receive government subsidized health insurance, the
government of Indonesia would see an increasing burden of health care costs of these
individuals in the near future. Besides, young individuals are more likely to purchase
cheap hand-rolled kreteks. This encourages smoking initiation which will further raise the
already high smoking prevalence among youth. Under these circumstances, raising the
tax of hand-rolled kreteks to push the price beyond the affordable range of the poor and
youth population is a policy priority.
The policymakers have, however, faced the dilemma that raising the tax and price of hand-rolled kreteks with the overarching goal of simplification of cigarette excise tax structure can reduce the demand for hand-rolled kreteks so much that it would imperil the livelihood of the kretek worker community. There are currently an
estimated 307,793 workers employed in the hand-rolled kretek industry and 1.2 million
household members dependent on them, who are potentially at risk of being adversely
affected by the tax reform. The findings from the current study suggest that apprehension
about the social costs associated with the potential job loss is largely overstated.
The total income loss from the reduction in employment in the handmade kretek industry from the desired tax increase is minimal compared to the revenue gain from the tax increase. We estimate that in total around 2,245 kretek workers would lose
their jobs as a result of the tax and price increase and the reduction in kretek consump-
tion and production. The total income loss of kretek workers would be approximately Rp
14.3 billion, which is merely 0.1% of the annual revenue gain of Rp 10,915 billion resulting
from the tax increase. This is a win-win policy change because the tax and price increase
will not only reduce tobacco use and related health costs, it will generate additional rev-
enue which can more than compensate for the income loss due to reduction in produc-
tion and employment in the kretek industry.
6
The Economics of Kretek Rolling in IndonesiaThe Economics of Kretek Rolling in Indonesia
48 // Concluding Remarks
We can draw two major policy recommendations—one for immediate action and the other for longer term planning—based on the findings of this report.
» The most vulnerable groups in the affected population who would need immediate income support in the event of job loss include the workers who are less educated, older, heads of their households, and contribute a signif-icant proportion of total household income from kretek rolling. Nearly half
of the kretek workers had different occupations and market skills prior to work-
ing in a kretek factory, which indicates their resilience to make a transition to a
different job in the event of job loss in the kretek industry. Besides, kretek workers
are predominantly female, who not only value the wage premium, benefits and
long-term employment opportunity in the kretek industry over other comparable
sectors, but also prefer the flexibility of work hours in the kretek industry that offer
them the opportunity to balance responsibilities between work and home-based
nonmarket activities (including child rearing and household chores). It suggests
that the female kretek workers can be incentivized to re-skill and move to home-
based nonfarm enterprises that would have similar appeal to their preference for
work-life balance.
» The government (Ministry of Finance and Ministry of Social Affairs) should pro-
vide temporary income support using the existing Social Assistance programs
(such as the unconditional cash transfer program, Bantuan Langsung Sementara
Masyarakat - BLSM) and identify alternative employment or income-generating
opportunities in the affected regions. The re-training of laid-off kretek workers
should be designed to accommodate transitions into these alternative employ-
ment opportunities.
In addition to government interventions, national and international nongovernmental
organizations can introduce targeted training and micro-credit programs to help the laid
off kretek workers acquire new skills and finances to invest in nonfarm self-employment
generating activities that they prefer to run from home.
The merit of this study lies in its focus on the kretek workers’ livelihood options that led to the above-mentioned policy direction needed to tackle the unintended employment consequences of the desired tax reform in Indonesia. The study is not
free from its limitation though. All the households included in the survey have at least
one kretek worker. This sample selection criterion limited our ability to assess the socio-
economic status and labor market outcomes of kretek households in comparison with
the rest of the population. However, we do make the observation that kretek households
are no more or less likely to be poor than those who are not dependent on the kretek
industry for their livelihood.

49
The Economics of Kretek Rolling in Indonesia
The vulnerability of kretek households to job loss can hardly be overemphasized. It can even be discounted for the households which have multiple earners in different
occupations besides kretek rolling. Because these households have diversified income
sources, they have the capability to absorb transitory income shocks owing to the struc-
tural decline of one of those sources. In a broader macroeconomic framework, the reduc-
tion in demand for kreteks would be matched by increased demand for other goods
and services in the thriving sectors, which will eventually provide new and alternative
sources of employment for the displaced kretek workers in the long run. Moreover, for a
growing economy like in Indonesia, the growth in employment in new sectors can more
than offset the decrease in employment in the handmade kretek industry. The reform
in cigarettes excise tax policy can be reasonably viewed as a way forward for divert-
ing resources away from the goods that cost the health and welfare of the nation and
toward the goods that contribute to a healthier population and higher standard of living.

The Economics of Kretek Rolling in Indonesia
50 // Concluding Remarks
REFERENCES Ahsan, A., and Wiyono, N. (2007) An Analysis of the Impact of Higher Cigarette Prices on
Employment in Indonesia.
World Bank (2017a). The Economics of Tobacco Taxation and Employment in Indonesia. Indo-
nesia Tobacco Employment Studies. World Bank, Washington, DC.
World Bank (2017b). The Economics of Tobacco Farming in Indonesia. Indonesia Tobacco
Employment Studies. World Bank, Washington, DC.
World Bank (2017c). The Economics of Clove Farming in Indonesia. Indonesia Tobacco
Employment Studies. World Bank, Washington, DC.

51
The Economics of Kretek Rolling in Indonesia
Appendix A: Methods of Data CollectionThis study applied a mixed method to analyze the socioeconomic and labor mar-ket characteristics of Indonesian kretek workers and their households. First, we
surveyed a sample of kretek workers in Kudus and Malang to understand their socioeco-
nomic characteristics, labor market outcomes, and alternative livelihood options than
the kretek industry. Second, we conducted focus group discussions (FGDs) among a
subsample of kretek workers in Kudus. In total, we performed two FGDs among 14 female
kretek workers. The FGDs aimed to complement the survey data by eliciting contextual
information not captured by the quantitative survey and by clarifying issues that weren’t
sufficiently explained by the survey.
Sampling and SurveyThe survey of kretek workers was based on a multistage clustered sampling pro-cedure with the target population of production workers employed in the kretek industry. Central Java employs 42% of all kretek workers, followed by East Java (40%). We
selected the top employing district in each province: Kudus in Central Java, and Malang
in East Java. Out of the 92 districts listed in the 2014 Annual Survey of Manufacturing
where kretek factories were located, Kudus in Central Java was the number one employer
(14.75% of total employees in kretek), followed by Temanggung, also in Central Java
(10.45%). Kabupaten Malang in East Java was third on the list (8.57%), but if combined
with Kotamadya Malang (2.37%), they employ more than Temanggung.Thus Kudus from
Central Java and Malang from East Java were selected as the two districts with the largest
kretek worker population for conducting the survey on kretek workers.
The 2014 Annual Survey of Manufacturing Industry and the 2014 Annual Survey of Micro and Small Industry suggest that there are 57 kretek firms in Kudus (8% of total kretek firms in Indonesia) and 46 kretek firms in Malang (6.5%). In Kudus,
47 kretek firms are categorized as large firms while the rest of the kretek firms are cate-
gorized as medium firms.3 In Malang, 22 kretek firms are categorized as large firms while
the rest are categorized as medium firms. Kretek workers in Kudus accounted for 40% of
total kretek workers in Indonesia, while kretek workers in Malang (including those in Kota-
madya Malang) accounted for 10.94% of total kretek workers.
The kretek factories located in these two districts were used as a proxy for clusters (neighboring villages) where kretek workers are expected to reside. Thus, 20 fac-
tories in Kudus and 20 factories in Malang were selected as clusters. It can be seen from
Table A1 that all the kretek factories from Malang and all the kretek factories in Kudus
3 Firms that employ 1–4 workers are categorized as micro firms, 5–19 workers as small firms, 20–99 workers as
medium firms, an more than 99 workers as large firms.

The Economics of Kretek Rolling in Indonesia
52 // Concluding Remarks
employing less than 500 workers were covered by the sample clusters. For the large
factories in Kudus employing over 500 workers, a sample of 8 clusters was selected out
of 37 factories in the district. To ensure targeted sample size per cluster, only factories
employing above 50 workers (medium and large factories) were listed for the selection
of clusters.
We first aimed at getting the sample size per cluster at 23 production workers. This
size is expected to provide more stable variances within clusters. With this sample size per
cluster, we had to exclude factories with workers fewer than 23 workers. In fact, we aimed
to exclude factories with workers fewer than 50 workers for several practical reasons. First,
it would be easier to get the sample of 23 workers out of 50 rather than the same size
of sample from a factory with 30 workers. This also minimizes the chance of replacing
factories or adding more workers in the field when a selected factory has production
workers fewer than 23.4 Second, from the survey perspective, it is always better to target a
sample from relatively large clusters. While the rule of “50” workers is arbitrary, this helped
us in reducing the number of clusters while information loss from smaller firms might be
minimal. Besides, the factories employing above 50 workers are presumed to have similar
technologies and can differ systematically in terms of production capacity from those
employing below 50 workers. However, in the survey we did pick 18 kretek workers who
reported that the factories where they worked employed less than 50 workers.
In each sample cluster (neighboring village of a factory), we obtained the list of all sub-villages (dusun). The sub-villages were chosen randomly as the primary statistical
units (PSU) that usually had 90–120 households each. In each sub-village, we met the vil-
lage head to get a complete list of kretek workers in the area. Using this method, kretek
workers employed in small factories were covered in addition to those working in medium
and large factories.
Table A1: Number of factories and sample clusters (kretek factories)
KUDUS MALANG
NUMBER OF WORKERS
NUMBER OF FACTORIES
SAMPLE CLUSTERS
NUMBER OF FACTORIES
SAMPLE CLUSTERS
50-150 7 7 7 7
151-500 5 5 6 5
>500 8 8 37 8
Total 20 20 50 20
4 Although we get the number of workers for each factory from the agricultural census, the data may be measured with error.
53
The Economics of Kretek Rolling in Indonesia
In the next stage, we visited the listed households with kretek workers in sub- village 1 to confirm that the households have at least one kretek worker and inquired if they were aware of anyone else who were kretek workers. After the enu-
meration was complete in sub-village 1, we randomly selected the minimum number of
kretek workers (23) targeted for the sample from each cluster. If the available number of
kretek workers in sub-village 1 fell short of the targeted number from a cluster, we went
to sub-village 2 to repeat the same process.
The survey team approached 757 households in total and found 735 households (97%) reporting at least one kretek worker in the household working full-time or part-time in the kretek industry. It indicates the targeting of the sample was very
accurate. Out of the 735 eligible households, 720 households agreed to be interviewed,
showing a 98% response rate. The final sample contains 18–22 households from each
cluster. The respondents from each household, except one, were female and all of them
were kretek workers. Given the sampling method described above, the kretek households
covered in the sample are representative of the kretek population in the two kretek pro-
ducing districts, Kudus and Malang. We are unable to classify the factories into Class I, II or
III categories because kretek workers do not have information on the scale of production
of the factories where they were employed.
The survey was conducted during October–November 2016 by SurveyMeter. A
household level questionnaire was used in a face-to-face interview of kretek workers,
which lasted for about an hour. The demographic and socioeconomic characteristics of
kretek rollers and their household members are summarized in Table A2.
Written or verbal consent was obtained from the respondents prior to the interview. The confidentiality of data is maintained by separating the identifying infor-
mation of the respondent from the rest of the data file. The study was approved by the
Institutional Review Board (IRB) of the Morehouse School of Medicine, the IRB record for
the American Cancer Society and SurveyMeter.
Focus Group DiscussionThe quantitative data collected through the sample survey was complemented by the
qualitative data collected through two Focus Group Discussions (FGD) conducted on two
groups of female kretek workers (7 in each group) in the district of Kudus in March 2017.
The average age of the participants was 44 years (minimum 27 and maximum 61 years) and
average tenure in the kretek industry was 21 years (minimum 3 and maximum 48 years),
longer tenure generally corresponding to older age. They did not have any formal occupa-
tion prior to working in the kretek factory. All of them were housewives taking care of chil-
dren and other household chores. Only five of them were engaged in embroidery.

The Economics of Kretek Rolling in Indonesia
54 // Concluding Remarks
VARIABLES
ALL HOUSEHOLD MEMBERS
KRETEK WORKERS
Mean Mean SD Min Max N
Age 31.00 40.06 9.70 16 73 794
1 if female 0.53 0.94 0.24 0 1 794
1 if head of household 0.25 0.15 0.36 0 1 794
1 if younger than 15 0.25 0.00 0.04 0 1 794
1 if married 0.53 0.83 0.37 0 1 794
1 if attained no schooling 0.12 0.03 0.17 0 1 794
1 if attained elementary education 0.44 0.55 0.50 0 1 794
1 if attained junior high education 0.23 0.27 0.45 0 1 794
1 if attained senior high education 0.20 0.15 0.35 0 1 794
1 if attained Diploma I, II, or III 0.00 0.00 0.05 0 1 794
1 if attained college degree 0.01 0.00 0.00 0 0 794
Years of schooling 5.81 6.77 3.25 0 14 794
1 if spouse works 0.84 0.82 0.38 0 1 794
1 if works in kretek industry 0.49 1.00 0.00 1 1 794
1 if production worker 0.57 0.96 0.19 0 1 794
1 if casual worker 0.24 0.00 0.04 0 1 794
1 if have a contract 0.48 0.79 0.41 0 1 794
Tenure (months) 162.48 214.65 128.47 1 593 791
Hours worked in the past week 42.11 39.61 13.76 6 84 793
Total working hours in past year 1,060.5 1,798.7 724.3 0 5,904 794
1 if receive daily payment 0.36 0.47 0.50 0 1 794
1 if receive weekly payment 0.50 0.50 0.50 0 1 794
1 if receive monthly payment 0.14 0.03 0.16 0 1 794
1 if task is rolling, filling, or cutting
0.63 0.48 0 1 720
1 if task is packing or ticketing
0.32 0.47 0 1 720
Kretek rolled per day (in sticks) 3
2782.92 1000.14 200 5,000 508
Table A2: Summary statistics of kretek workers and their household members
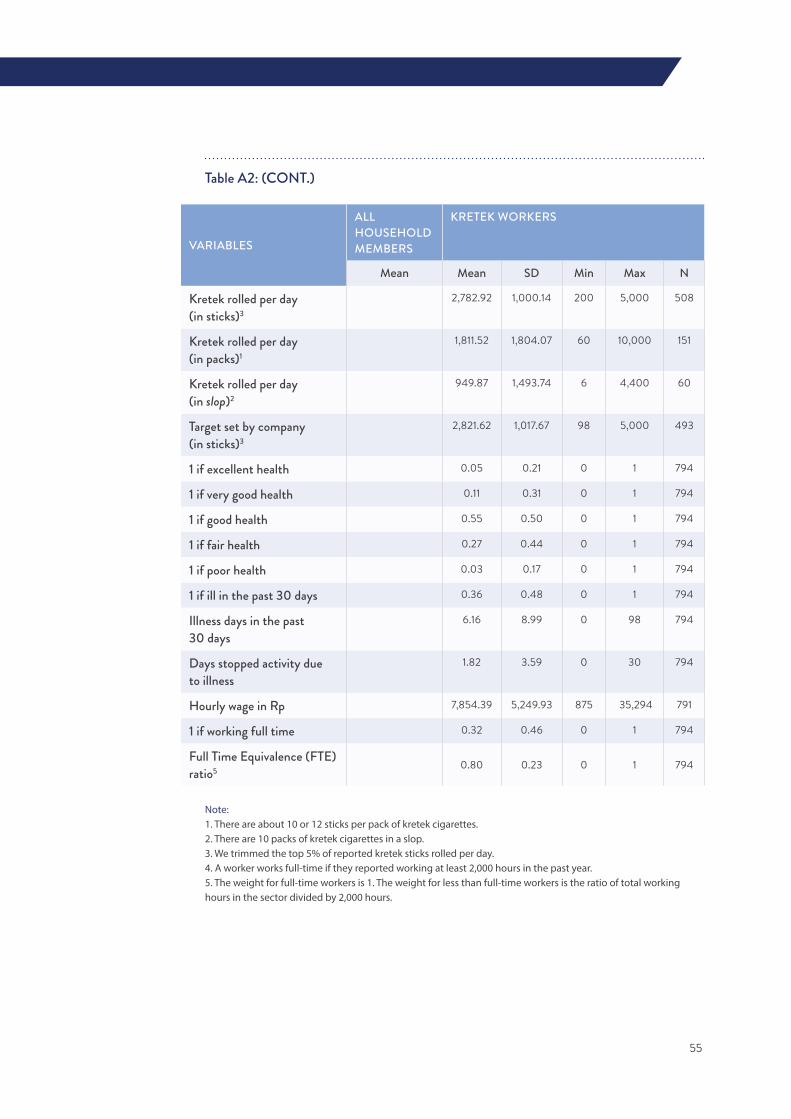
55
The Economics of Kretek Rolling in Indonesia
VARIABLES
ALL HOUSEHOLD MEMBERS
KRETEK WORKERS
Mean Mean SD Min Max N
Kretek rolled per day (in sticks)3
2,782.92 1,000.14 200 5,000 508
Kretek rolled per day (in packs)1
1,811.52 1,804.07 60 10,000 151
Kretek rolled per day (in slop)2
949.87 1,493.74 6 4,400 60
Target set by company (in sticks)3
2,821.62 1,017.67 98 5,000 493
1 if excellent health 0.05 0.21 0 1 794
1 if very good health 0.11 0.31 0 1 794
1 if good health 0.55 0.50 0 1 794
1 if fair health 0.27 0.44 0 1 794
1 if poor health 0.03 0.17 0 1 794
1 if ill in the past 30 days 0.36 0.48 0 1 794
Illness days in the past 30 days
6.16 8.99 0 98 794
Days stopped activity due to illness
1.82 3.59 0 30 794
Hourly wage in Rp 7,854.39 5,249.93 875 35,294 791
1 if working full time 0.32 0.46 0 1 794
Full Time Equivalence (FTE) ratio5 0.80 0.23 0 1 794
Table A2: (CONT.)
Note: 1. There are about 10 or 12 sticks per pack of kretek cigarettes. 2. There are 10 packs of kretek cigarettes in a slop. 3. We trimmed the top 5% of reported kretek sticks rolled per day. 4. A worker works full-time if they reported working at least 2,000 hours in the past year. 5. The weight for full-time workers is 1. The weight for less than full-time workers is the ratio of total working hours in the sector divided by 2,000 hours.
The Economics of Kretek Rolling in Indonesia
56 // Concluding Remarks
Appendix B: Calculation of Total Household Income and ResourceThe data on wage income were collected for each household member by primary and
secondary jobs. Household wage income is the sum of each member’s annualized wage
income from both primary and secondary jobs. The components used in the calcula-
tion of each member’s annualized wage income are the annual working hours and the
reported wage. We use a similar approach to calculate annualized household income
from kretek rolling.
Data on annual farm income, nonfarm income, and nonlabor income were collected at
the household level. We use these data to calculate total household income and house-
hold resource. There are two sources that determine the farm and nonfarm resource.
The first source is the revenue from the sale of products from farm and nonfarm activities.
The second source is the market value for the home-grown products used for household
consumption. The farm and non-farm resources were then added to household wage
and nonlabor income to obtain total household resource.
Total household income, on the other hand, is measured by the sum of household wage
income, nonlabor income, and gross margins from farm and nonfarm activities. We first
calculate total revenues and costs from farm and nonfarm activities to obtain the gross
margins. The total revenue is the market values of the sale or household consumption of
products from farm and nonfarm activities. The total costs include household expendi-
tures on hired labor, raw materials, and other operational costs. Total household income is
a better measure of household well-being. The variable reflects the amount of resources
available for household consumption after taking into account household production
costs incurred in farm and nonfarm activities.

57
The Economics of Kretek Rolling in Indonesia

The Economics of Kretek Rolling in Indonesia
Top Related