


Languages
Pages
Legal


ECE 333 © 2002 – 2017 George Gross, University of Illinois at Urbana-Champaign, All Rights Reserved. 1
ECE 333 – Renewable Energy Systems 5. Wind Power
George Gross
Department of Electrical and Computer EngineeringUniversity of Illinois at Urbana–Champaign
ECE 333 © 2002 – 2017 George Gross, University of Illinois at Urbana-Champaign, All Rights Reserved. 2
q The physics of rotors
q Evaluation of power in the wind
q The definition of specific power and its analysis
q Temperature and altitude variations in specific
power
q The impacts of tower height on wind turbine
output
OUTLINE
ECE 333 © 2002 – 2017 George Gross, University of Illinois at Urbana-Champaign, All Rights Reserved. 3
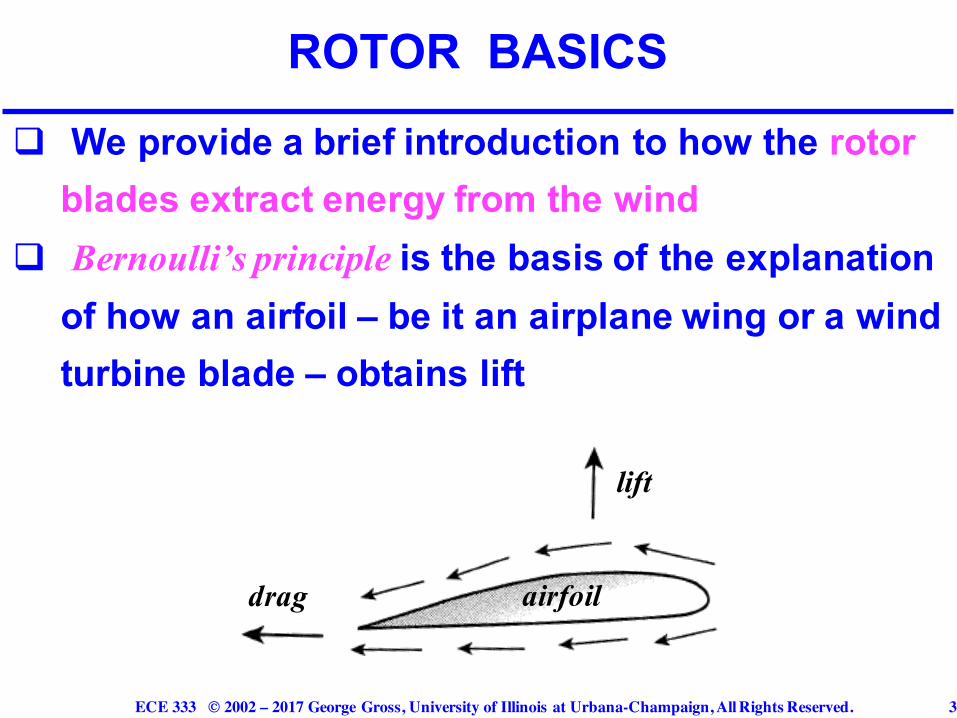
q We provide a brief introduction to how the rotor blades extract energy from the wind
q Bernoulli’s principle is the basis of the explanation of how an airfoil – be it an airplane wing or a wind turbine blade – obtains lift
ROTOR BASICS
airfoildrag
lift

ECE 333 © 2002 – 2017 George Gross, University of Illinois at Urbana-Champaign, All Rights Reserved. 4
m air that travels over the top of the airfoil must
cover a longer distance before it rejoins the
air that uses the shorter path under the foil
m air on top travels faster and so results in
lower pressure than air under the airfoil
m the difference between the two pressures
creates the lifting force that holds an airplane
up and that rotates the wind turbine blade
ROTOR BASICS
ECE 333 © 2002 – 2017 George Gross, University of Illinois at Urbana-Champaign, All Rights Reserved. 5
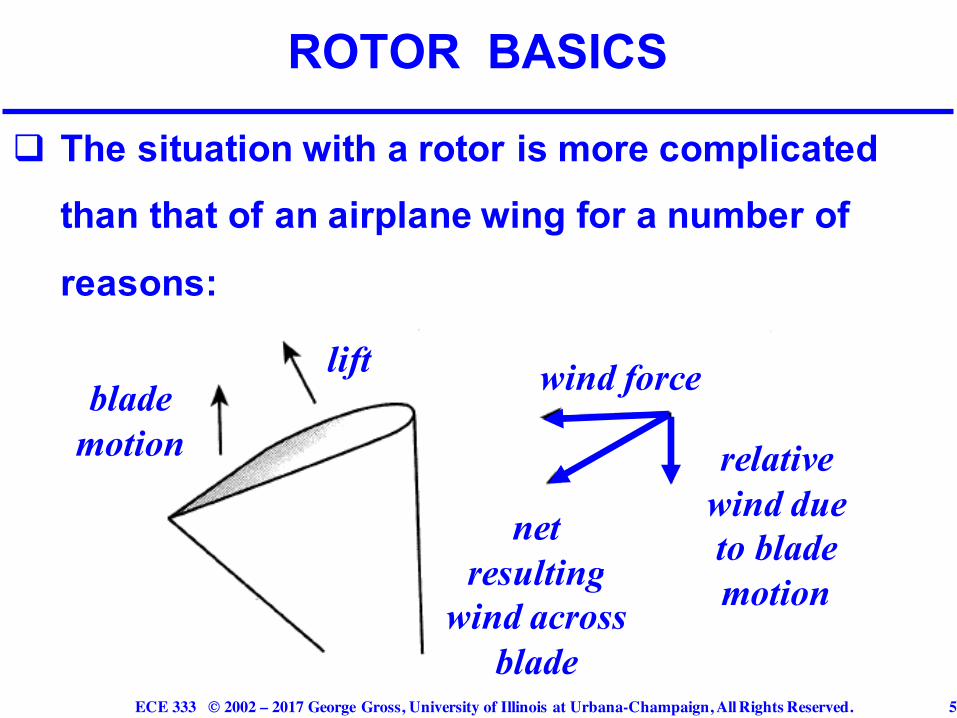
q The situation with a rotor is more complicated than that of an airplane wing for a number of
reasons:
ROTOR BASICS
lift wind forceblade motion relative
wind due to blade motion
net resulting
wind across blade

ECE 333 © 2002 – 2017 George Gross, University of Illinois at Urbana-Champaign, All Rights Reserved. 6
m a rotating blade experiences the air moving
toward it from the wind and from the relative
motion of the blade as it spins
m the combined effect of the wind itself and the
rotating blade results in a force that is at the
appropriate angle so that the force is along
the blade and can provide the lift that moves
the rotor along
ROTOR BASICS
ECE 333 © 2002 – 2017 George Gross, University of Illinois at Urbana-Champaign, All Rights Reserved. 7
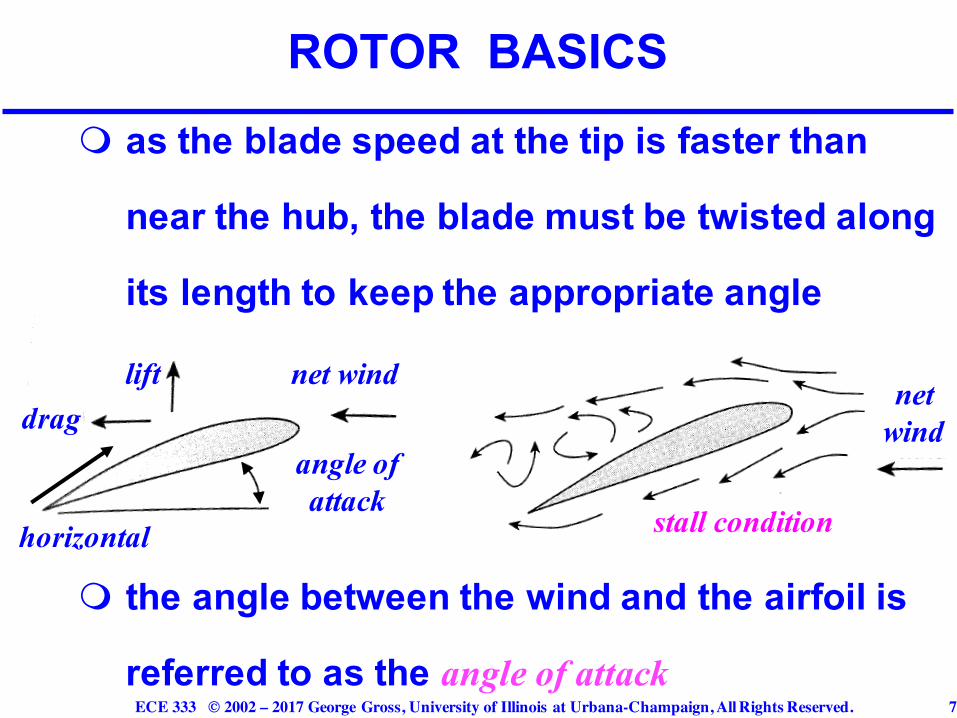
m as the blade speed at the tip is faster than
near the hub, the blade must be twisted along
its length to keep the appropriate angle
m the angle between the wind and the airfoil is
referred to as the angle of attack
ROTOR BASICS
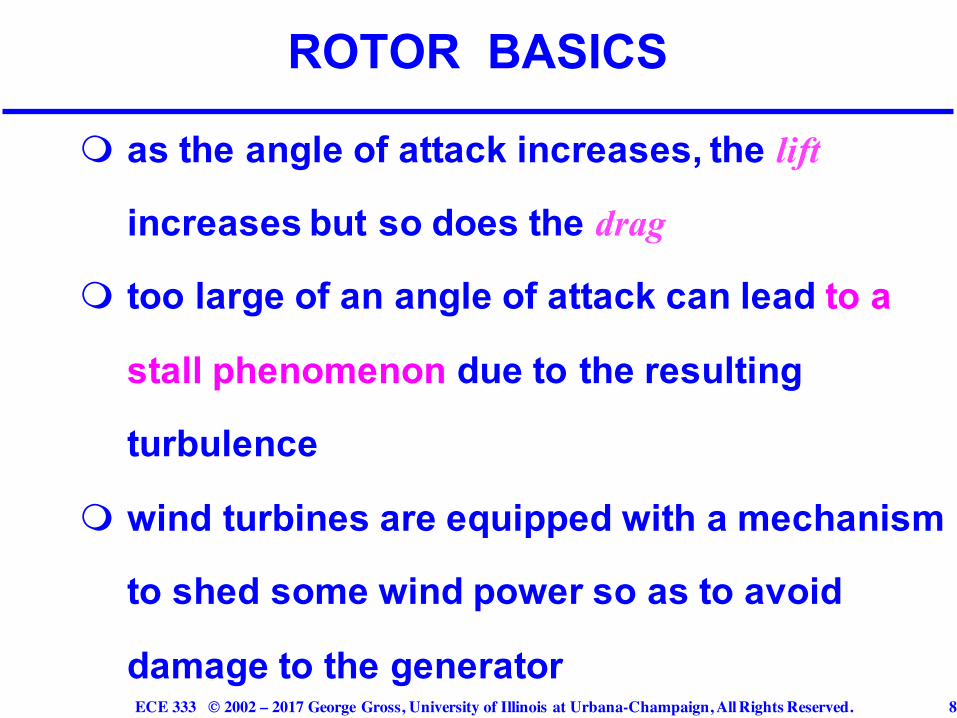
liftdrag
net wind
angle of attack
stall condition
net wind
horizontal
ECE 333 © 2002 – 2017 George Gross, University of Illinois at Urbana-Champaign, All Rights Reserved. 8
m as the angle of attack increases, the lift
increases but so does the drag
m too large of an angle of attack can lead to a
stall phenomenon due to the resulting
turbulence
m wind turbines are equipped with a mechanism
to shed some wind power so as to avoid
damage to the generator
ROTOR BASICS

ECE 333 © 2002 – 2017 George Gross, University of Illinois at Urbana-Champaign, All Rights Reserved. 9
q We wish to analytically characterize the level of
power associated with wind
q For this purpose, we view wind as a “packet” of
air with mass m moving at a constant speed v
please note, this assumption represents a major
simplification since air is a fluid; however, the
simplified modeling is useful to explain the key
concepts in wind generation
POWER IN THE WIND
ECE 333 © 2002 – 2017 George Gross, University of Illinois at Urbana-Champaign, All Rights Reserved. 10
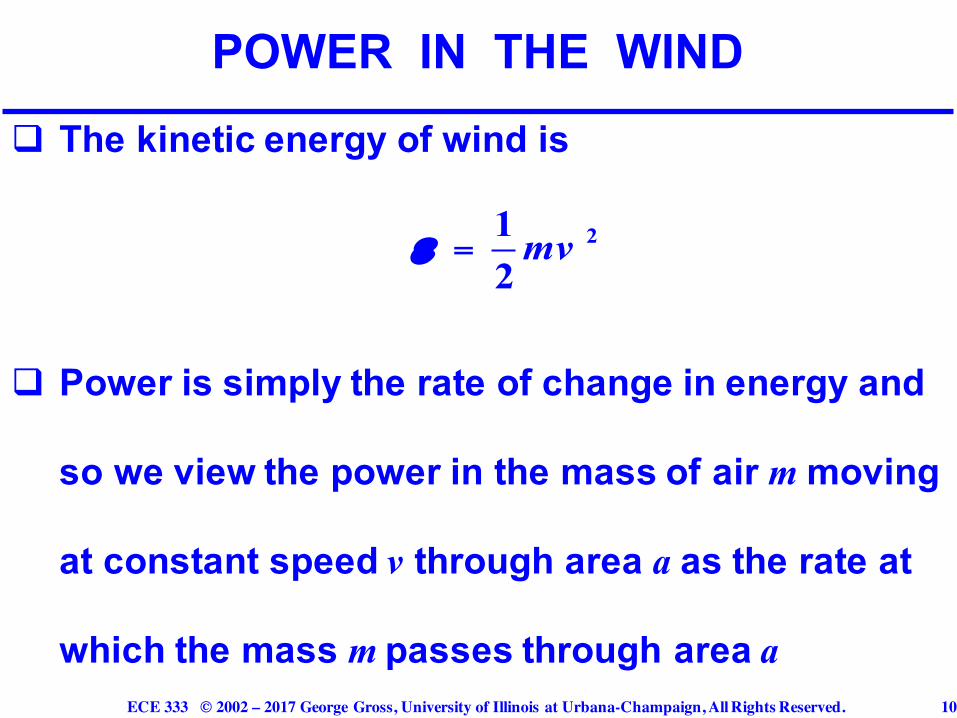
q The kinetic energy of wind is
q Power is simply the rate of change in energy and
so we view the power in the mass of air m moving
at constant speed v through area a as the rate at
which the mass m passes through area a
POWER IN THE WIND
= 212mvε
ECE 333 © 2002 – 2017 George Gross, University of Illinois at Urbana-Champaign, All Rights Reserved. 11
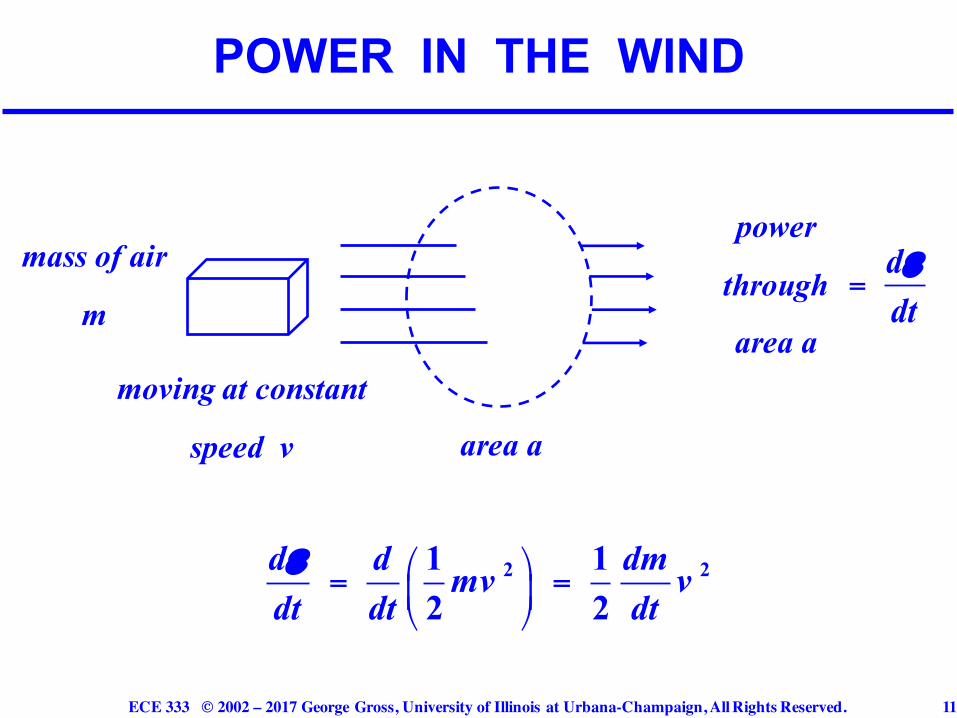
POWER IN THE WIND
⎛ ⎞= =⎜ ⎟⎝ ⎠
2 21 12 2
d d dmmv vdt dt dtε
mass of air
m
moving at constant
speed v
power
through
area a
area a
=ddtε

ECE 333 © 2002 – 2017 George Gross, University of Illinois at Urbana-Champaign, All Rights Reserved. 12
q The term is the rate of flow of the mass of air
through area a and is given by ρav where ρ is the
air density, i.e., the mass per unit of volume
q The volume w of mass m is given by the area a
times the “length” of mass m
q Over time dt, the mass m moves a distance v dt
resulting in the volume
POWER IN THE WIND
dmdt
ECE 333 © 2002 – 2017 George Gross, University of Illinois at Urbana-Champaign, All Rights Reserved. 13
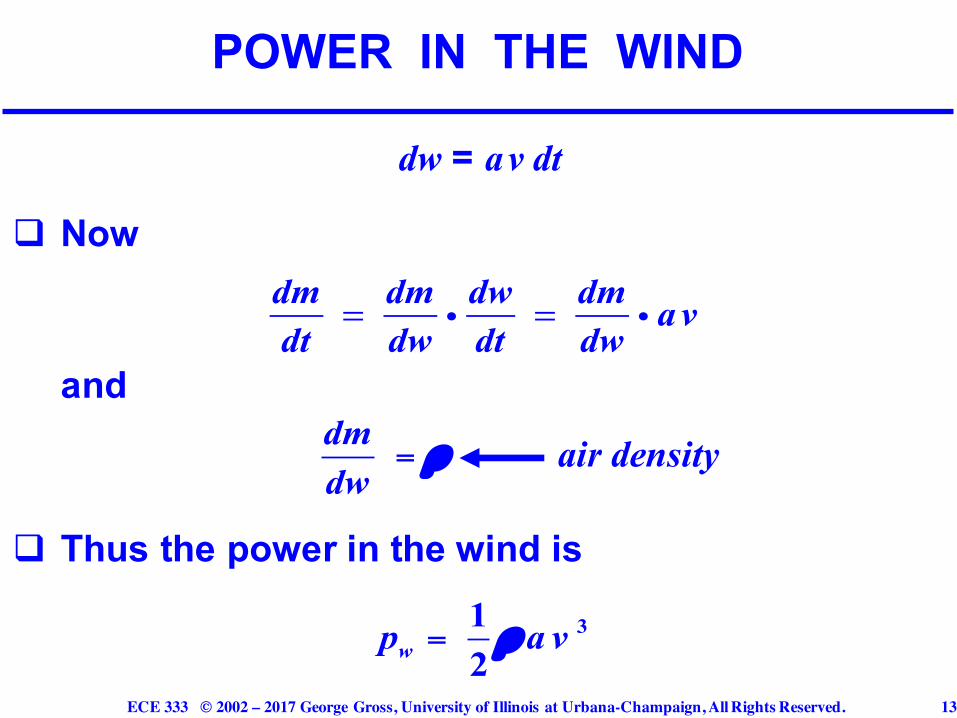
dw = av dt
q Now
and
q Thus the power in the wind is
POWER IN THE WIND
dmdt
= dmdw
idwdt
= dmdw
i av
=dmdw
ρ air density
= 312wp a vρ
ECE 333 © 2002 – 2017 George Gross, University of Illinois at Urbana-Champaign, All Rights Reserved. 14
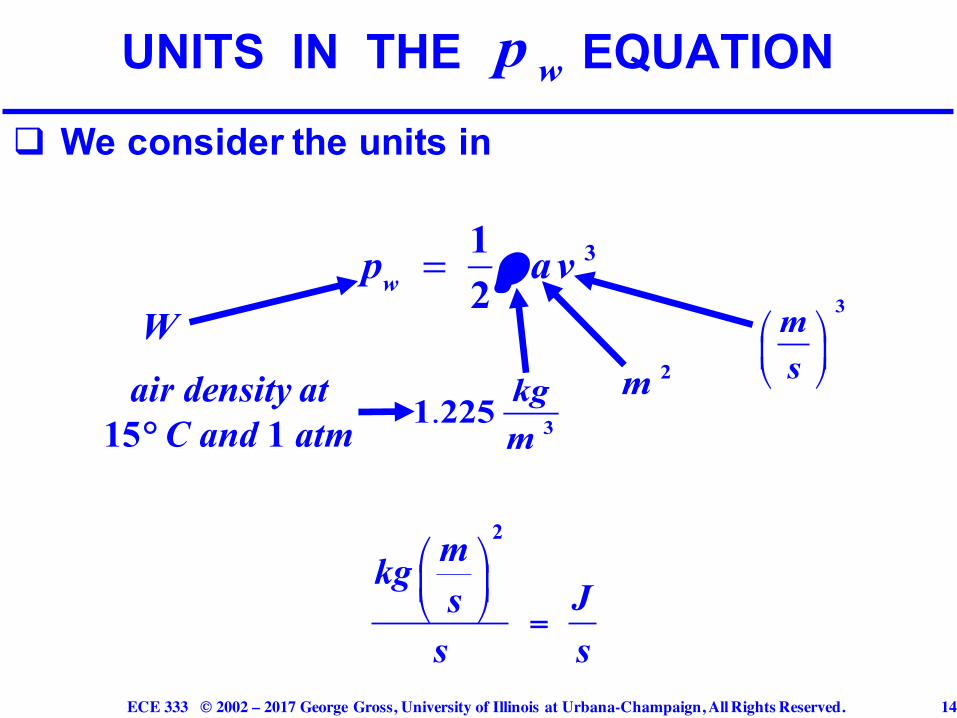
q We consider the units in
UNITS IN THE EQUATION
pw = 1
2ρ av 3
⎛ ⎞⎜ ⎟⎝ ⎠
3ms2m
1.225 kg
m 3
W
⎛ ⎞⎜ ⎟⎝ ⎠ =
2mkgJs
s s
air density at 15° C and 1 atm
wp

ECE 333 © 2002 – 2017 George Gross, University of Illinois at Urbana-Champaign, All Rights Reserved. 15
q The power in wind is, typically, expressed in units
per cross sectional area –
q We refer to the expression for as specific power
or power density
q We next consider in more detail and analyze
the impacts of temperature and altitude
UNITS IN THE EQUATION
2
Wm
wp
wp
wp
ECE 333 © 2002 – 2017 George Gross, University of Illinois at Urbana-Champaign, All Rights Reserved. 16
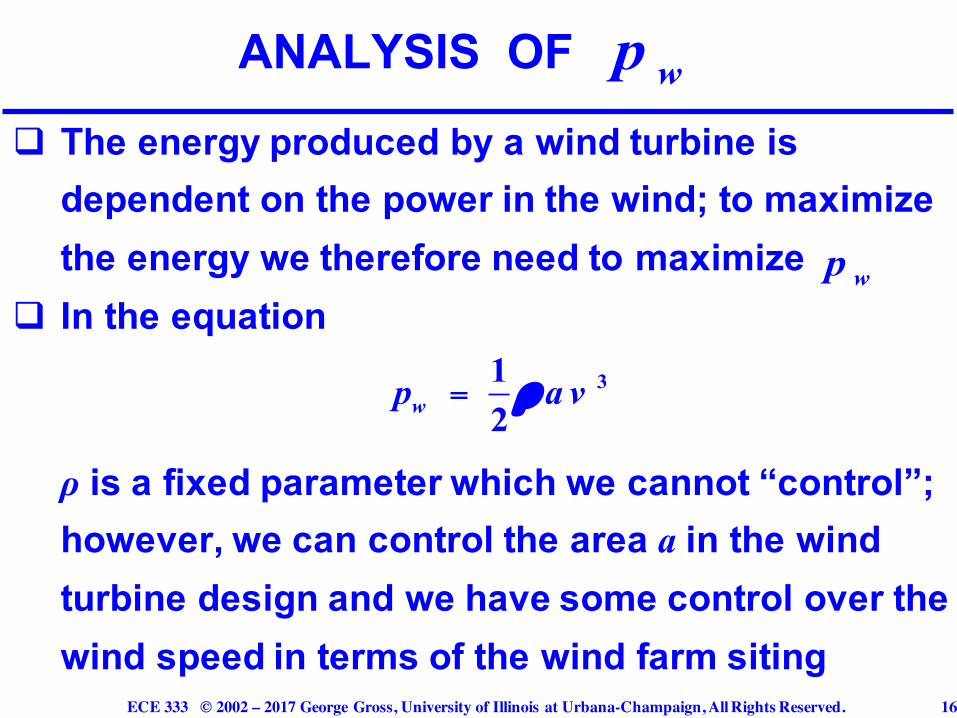
q The energy produced by a wind turbine is dependent on the power in the wind; to maximize the energy we therefore need to maximize
q In the equation
ρ is a fixed parameter which we cannot “control”; however, we can control the area a in the wind turbine design and we have some control over the wind speed in terms of the wind farm siting
ANALYSIS OF
= 312wp a vρ
wp
wp

ECE 333 © 2002 – 2017 George Gross, University of Illinois at Urbana-Champaign, All Rights Reserved. 17
q The area a is the swept area by the turbine rotor: for a HAWT with a blade with diameter d
q Clearly, there are economies of scale that are associated with larger wind turbines:m cost of a turbine m power output of a turbine
and so the larger rotors are more cost effective
ANALYSIS OF
⎛ ⎞= =⎜ ⎟⎝ ⎠
221
2 4da dπ π
∝ d
∝ 2d
wp
ECE 333 © 2002 – 2017 George Gross, University of Illinois at Urbana-Champaign, All Rights Reserved. 18
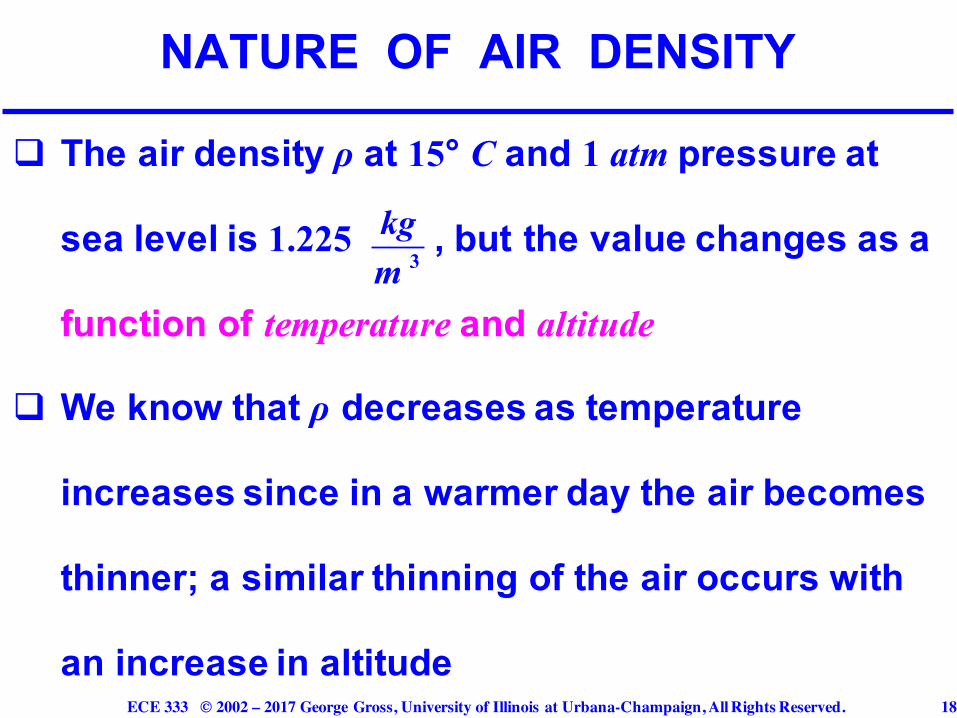
q The air density ρ at 15° C and 1 atm pressure at
sea level is 1.225 , but the value changes as a
function of temperature and altitude
q We know that ρ decreases as temperature
increases since in a warmer day the air becomes
thinner; a similar thinning of the air occurs with
an increase in altitude
NATURE OF AIR DENSITY
3
kgm
ECE 333 © 2002 – 2017 George Gross, University of Illinois at Urbana-Champaign, All Rights Reserved. 19
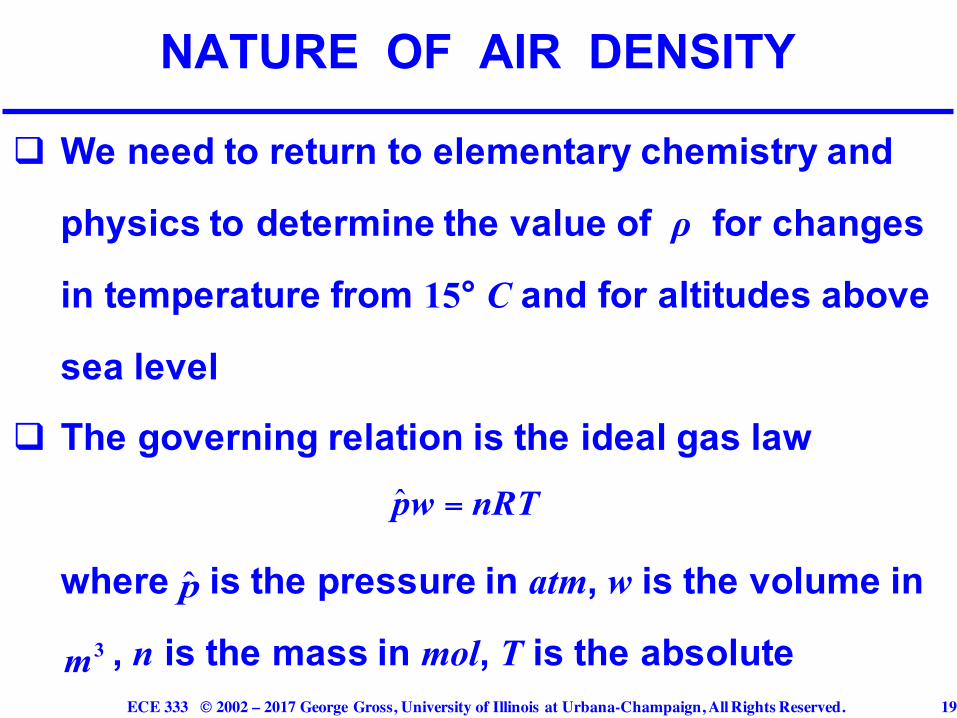
q We need to return to elementary chemistry and
physics to determine the value of ρ for changes
in temperature from 15° C and for altitudes above
sea level
q The governing relation is the ideal gas law
where is the pressure in atm, w is the volume in
, n is the mass in mol, T is the absolute
NATURE OF AIR DENSITY
ˆ =pw nRT
p̂
3m

ECE 333 © 2002 – 2017 George Gross, University of Illinois at Urbana-Champaign, All Rights Reserved. 20
temperature in K, and R is the Avogadro number, the
ideal gas constant
q The pressure in atm is expressible in SI units since
1 atm = 101.325 kPa
where Pa is the abbreviation for the Pascal unit
and
NATURE OF AIR DENSITY
. − − −× 5 3 1 18 2056 10 m atm K mol
= 21 NPam
ECE 333 © 2002 – 2017 George Gross, University of Illinois at Urbana-Champaign, All Rights Reserved. 21
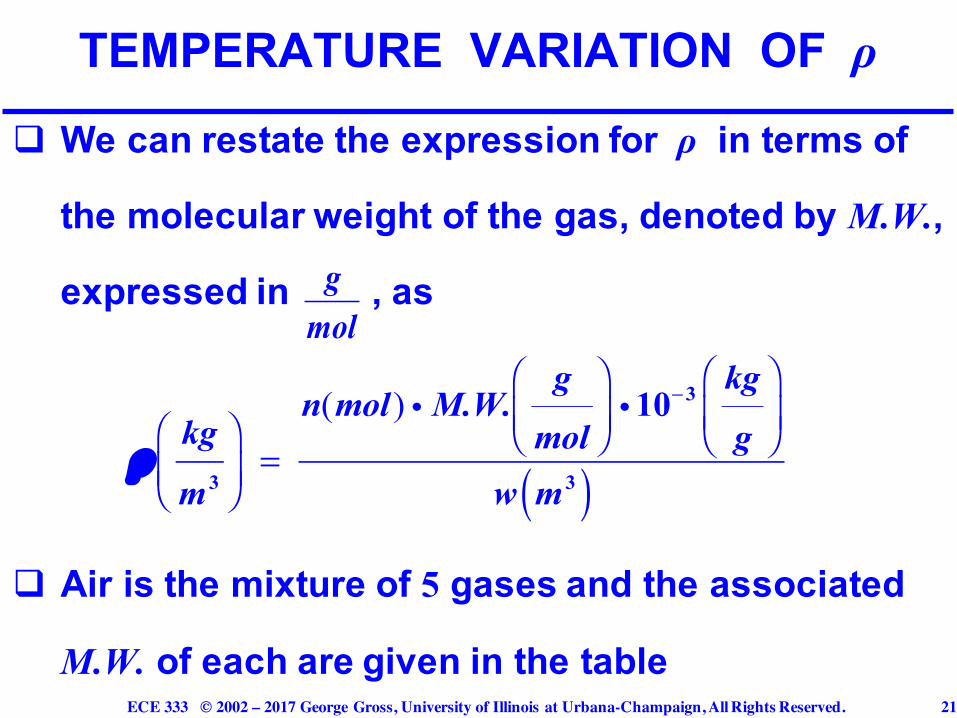
q We can restate the expression for ρ in terms of
the molecular weight of the gas, denoted by M.W.,
expressed in , as
q Air is the mixture of 5 gases and the associated
M.W. of each are given in the table
TEMPERATURE VARIATION OF ρ
ρkg
m3
⎛
⎝⎜⎞
⎠⎟=
n(mol) i M.W.g
mol
⎛
⎝⎜⎞
⎠⎟i 10−3 kg
g
⎛
⎝⎜⎞
⎠⎟
w m3( )
gmol

ECE 333 © 2002 – 2017 George Gross, University of Illinois at Urbana-Champaign, All Rights Reserved. 22
q Thus,
TEMPERATURE VARIATION OF ρgas fraction (%) M.W. (g/mol)
nitrogen 78.08 28.02
oxygen 20.95 32.00
argon 0.93 39.95
CO2 0.039 44.01
neon 0.0018 20.18
( ) ( . )( . ) ( . )( . )
( . )( . ) ( . )( . ) ( . )( . )
. . = + +
+ +
0 7808 28 02 0 2095 32 00
0 0093 39 95 0 039 44 01 0 0018 20 18
M W air
.= 28 97 gmol
ECE 333 © 2002 – 2017 George Gross, University of Illinois at Urbana-Champaign, All Rights Reserved. 23
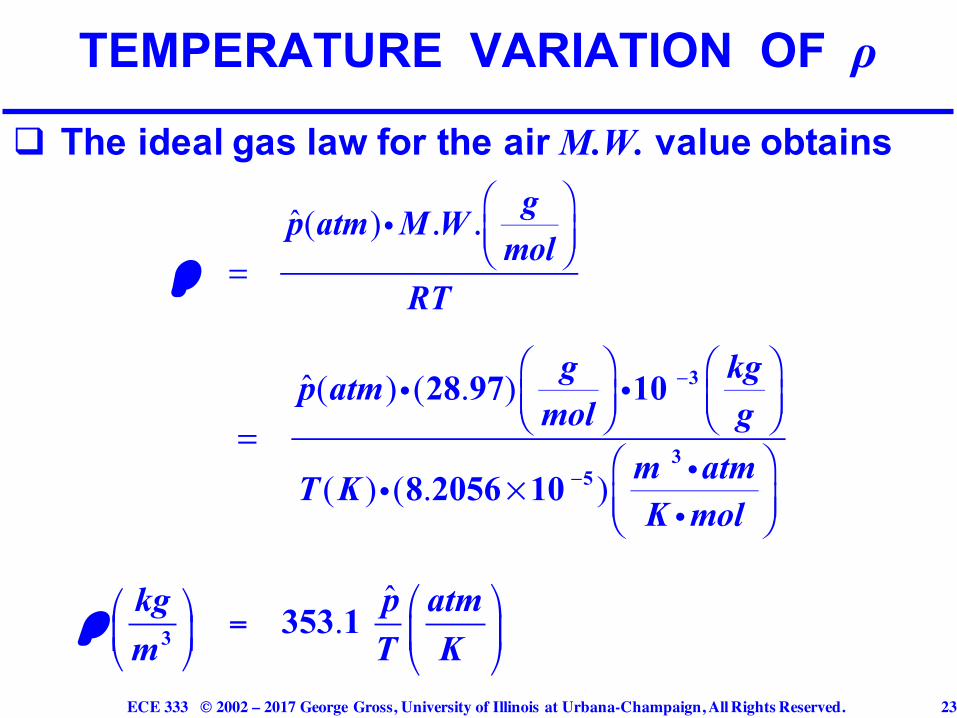
q The ideal gas law for the air M.W. value obtains
TEMPERATURE VARIATION OF ρ
ρ =
p̂(atm)i M.W . gmol
⎛⎝⎜
⎞⎠⎟
RT
=p̂(atm)i(28.97) g
mol⎛⎝⎜
⎞⎠⎟i10 −3 kg
g⎛⎝⎜
⎞⎠⎟
T (K )i(8.2056×10 −5 ) m 3 iatmK imol
⎛⎝⎜
⎞⎠⎟
ˆ.
⎛ ⎞⎛ ⎞ = ⎜ ⎟⎜ ⎟⎝ ⎠ ⎝ ⎠
3 353 1kg p atmm T K
ρ
ECE 333 © 2002 – 2017 George Gross, University of Illinois at Urbana-Champaign, All Rights Reserved. 24
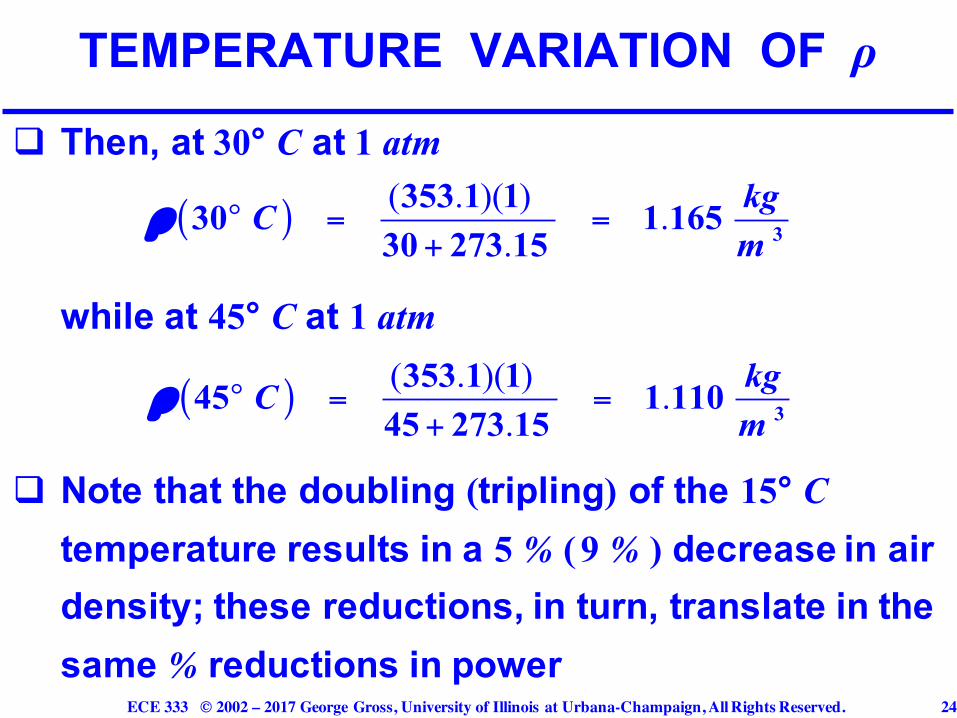
q Then, at 30° C at 1 atm
while at 45° C at 1 atm
q Note that the doubling (tripling) of the 15° Ctemperature results in a 5 % ( 9 % ) decrease in air density; these reductions, in turn, translate in the same % reductions in power
TEMPERATURE VARIATION OF ρ
( ) ( . )( ) ..
° = =+ 3
353 1 130 1 16530 273 15
kgCm
ρ
( ) ( . )( ) ..
° = =+ 3
353 1 145 1 11045 273 15
kgCm
ρ
ECE 333 © 2002 – 2017 George Gross, University of Illinois at Urbana-Champaign, All Rights Reserved. 25
q A change in altitude brings about a change in air
pressure; we evaluate the ramifications of such a
change
q We consider a static column of air with cross-
sectional area a and we examine a horizontal slice
in that column of thickness dz with air density ρ
so that its mass is ρa dz
ALTITUDE VARIATION OF ρ
ECE 333 © 2002 – 2017 George Gross, University of Illinois at Urbana-Champaign, All Rights Reserved. 26
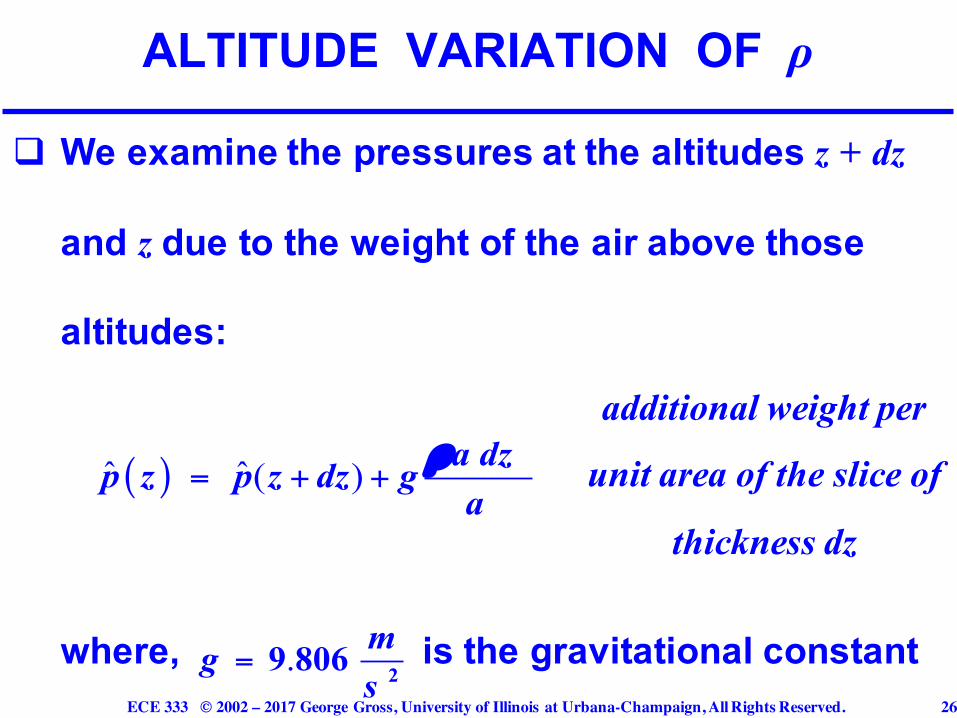
q We examine the pressures at the altitudes z + dz
and z due to the weight of the air above those
altitudes:
where, is the gravitational constant
ALTITUDE VARIATION OF ρ
( )ˆ ˆ ( )= + +a dzp z p z dz ga
ρadditional weight per
unit area of the slice of
thickness dz
.= 29 806 mgs
ECE 333 © 2002 – 2017 George Gross, University of Illinois at Urbana-Champaign, All Rights Reserved. 27
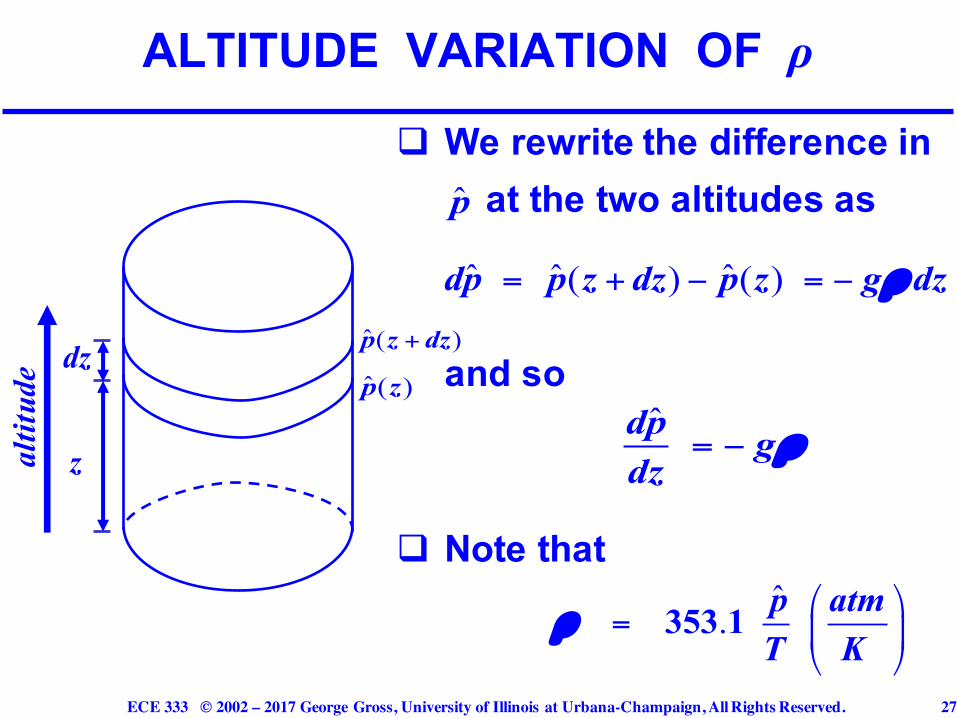
q We rewrite the difference in at the two altitudes as
and so
q Note that
ALTITUDE VARIATION OF ρ
ˆ ˆ ˆ( ) ( )= + − = −dp p z dz p z g dzρ
ˆ= −
dp gdz
ρ
ˆ.
⎛ ⎞= ⎜ ⎟
⎝ ⎠353 1 p atm
T Kρ
z
dzˆ ( )p z
ˆ ( )+p z dz
altit
ude
p̂
ECE 333 © 2002 – 2017 George Gross, University of Illinois at Urbana-Champaign, All Rights Reserved. 28
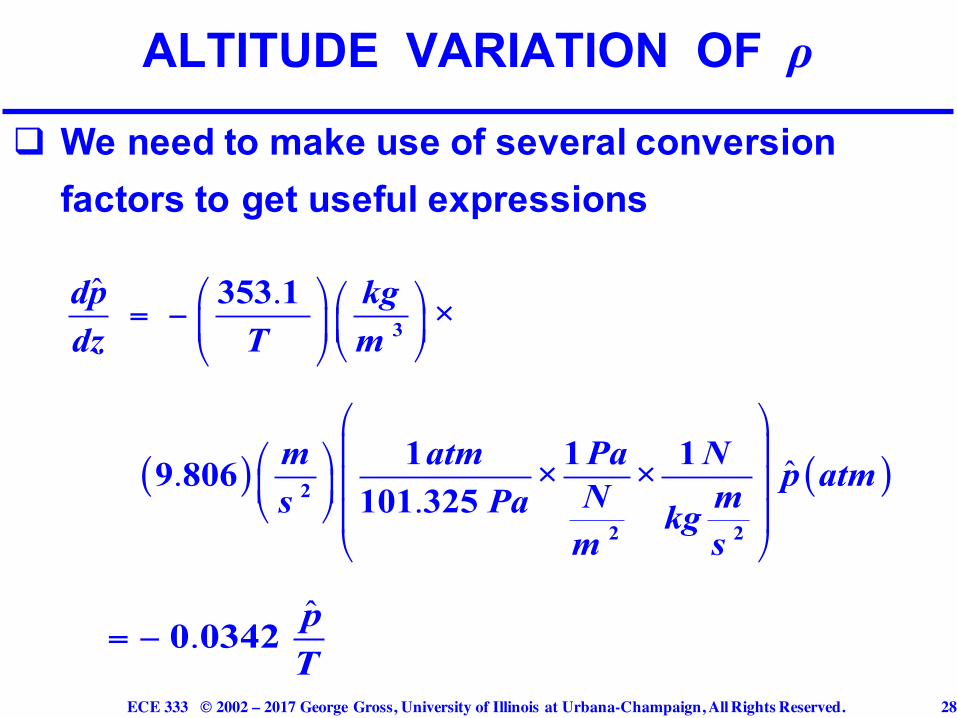
q We need to make use of several conversion factors to get useful expressions
ALTITUDE VARIATION OF ρ
( ) ( )
ˆ .
ˆ..
⎛ ⎞⎛ ⎞= − ⎜ ⎟⎜ ⎟⎝ ⎠⎝ ⎠
⎛ ⎞⎜ ⎟⎛ ⎞⎜ ⎟⎜ ⎟
⎝ ⎠⎜ ⎟⎝ ⎠
3
2
2 2
353 1 ×
1 1 19 806 × ×101 325
dp kgdz T m
m atm Pa N p atmN ms Pa kgm s
ˆ.= − 0 0342 p
T

ECE 333 © 2002 – 2017 George Gross, University of Illinois at Urbana-Champaign, All Rights Reserved. 29
q The solution of this differential equation is
complicated by the fact that the temperature also
changes with altitude at the rate of 6.5° C drop for
each km increase in altitude
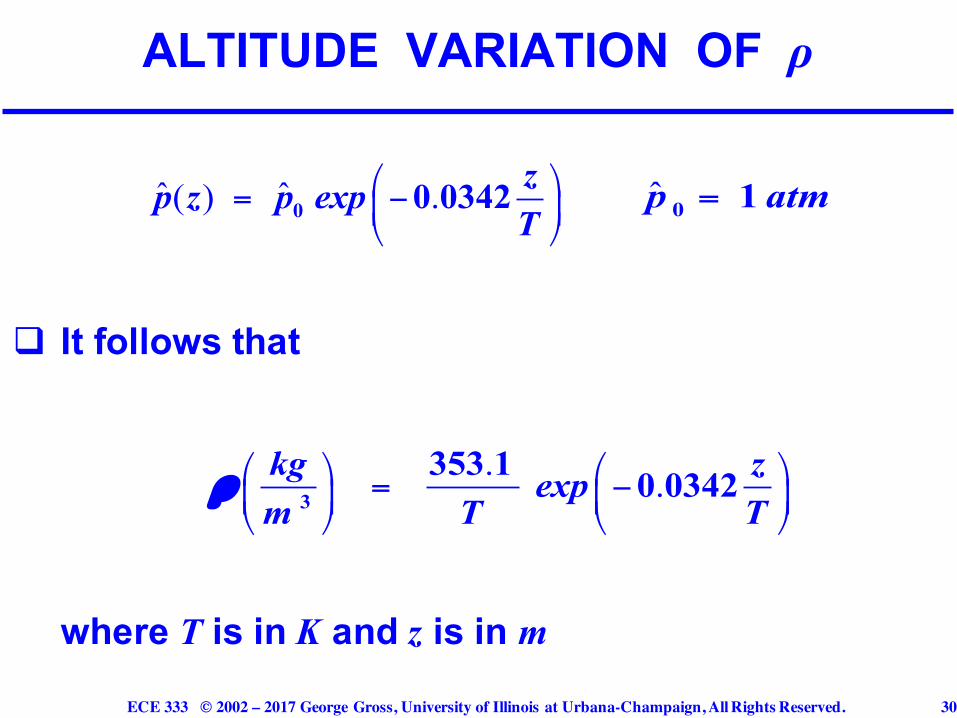
q Under the simplifying assumption that T remains
constant, the solution of the differential equation is
ALTITUDE VARIATION OF ρ
ECE 333 © 2002 – 2017 George Gross, University of Illinois at Urbana-Champaign, All Rights Reserved. 30
q It follows that
where T is in K and z is in m
ALTITUDE VARIATION OF ρ
. .⎛ ⎞ ⎛ ⎞= −⎜ ⎟ ⎜ ⎟⎝ ⎠ ⎝ ⎠3
353 1 0 0342kg zexpm T T
ρ
ˆ ˆ( ) .⎛ ⎞= −⎜ ⎟⎝ ⎠
0 0 0342 zp z p expT
ˆ =0 1p atm

ECE 333 © 2002 – 2017 George Gross, University of Illinois at Urbana-Champaign, All Rights Reserved. 31
q We compare the value of ρ at 25° C at 2,000 m to that under the standard 1 atm 15° C conditions
q We compute
q The is thus reduced by 23 % and thus
results in a 23 % decrease in power output – a rather substantial decrease
EXAMPLE: COMBINED TEMPERATURE AND ALTITUDE IMPACTS
. 21 225 kgm
,
. . .. .
°⎛ ⎞= − =⎜ ⎟⎝ ⎠
25 32 000
353 1 20000 0342 0 9415298 15 298 15
Cm
kgexpm
ρ

ECE 333 © 2002 – 2017 George Gross, University of Illinois at Urbana-Champaign, All Rights Reserved. 32
q The fact that power in the wind varies with
where, v is the wind speed, implies that an
increase in the wind speed has a pronounced
effect on the wind output
q Since for a given site, v increases as the height of
the tower is raised, we can generally increase the
wind turbine output by mounting it on a taller
tower
THE DEPENDENCE ON TOWER HEIGHT
3v
ECE 333 © 2002 – 2017 George Gross, University of Illinois at Urbana-Champaign, All Rights Reserved. 33
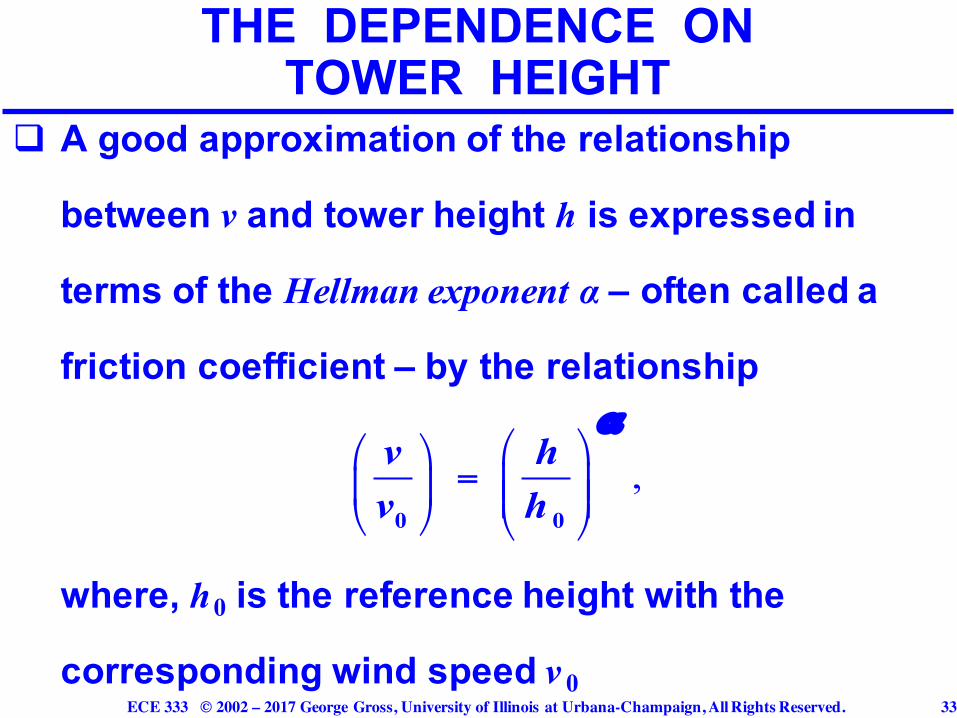
q A good approximation of the relationship
between v and tower height h is expressed in
terms of the Hellman exponent α – often called a
friction coefficient – by the relationship
where, h0 is the reference height with the
corresponding wind speed v 0
THE DEPENDENCE ON TOWER HEIGHT
,⎛ ⎞⎛ ⎞
= ⎜ ⎟⎜ ⎟ ⎜ ⎟⎝ ⎠ ⎝ ⎠0 0
v hv h
α
ECE 333 © 2002 – 2017 George Gross, University of Illinois at Urbana-Champaign, All Rights Reserved. 34
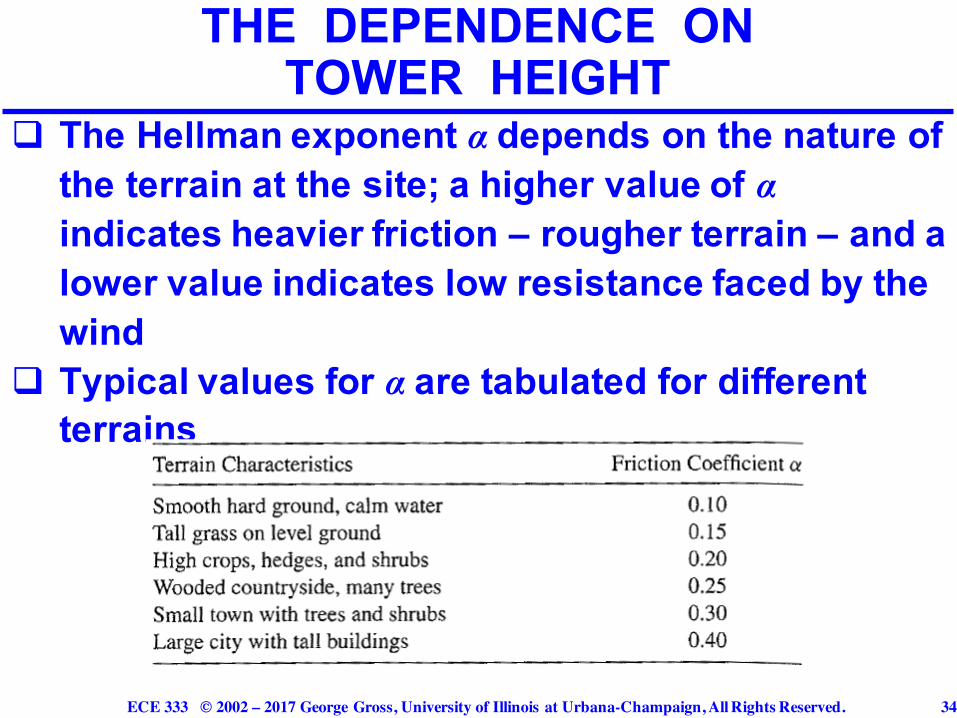
q The Hellman exponent α depends on the nature of the terrain at the site; a higher value of α indicates heavier friction – rougher terrain – and a lower value indicates low resistance faced by the wind
q Typical values for α are tabulated for different terrains
THE DEPENDENCE ON TOWER HEIGHT
ECE 333 © 2002 – 2017 George Gross, University of Illinois at Urbana-Champaign, All Rights Reserved. 35
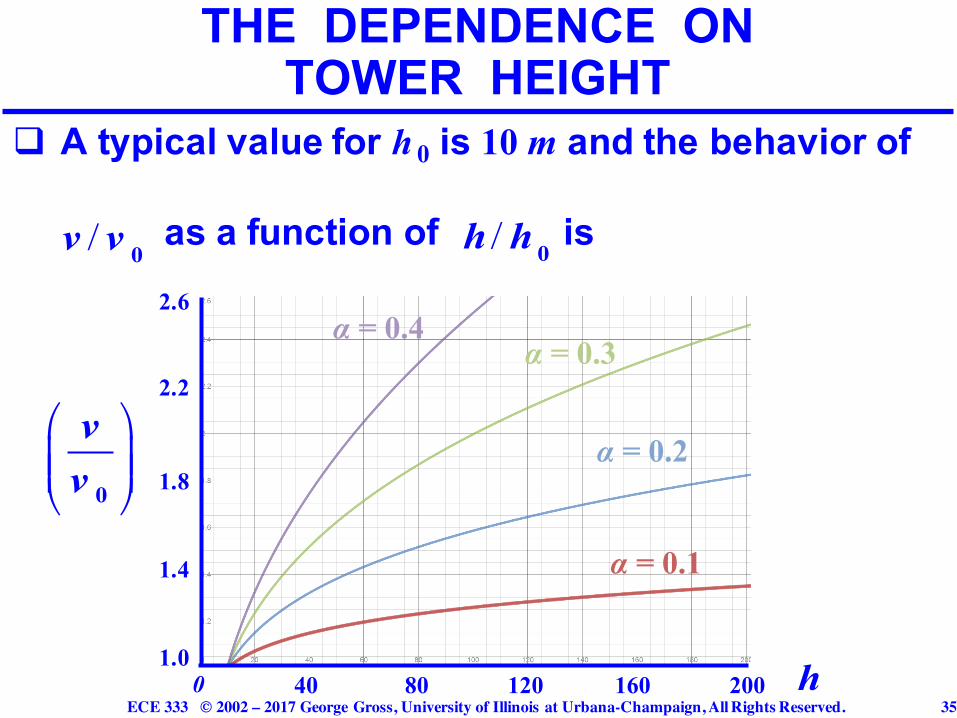
q A typical value for h 0 is 10 m and the behavior of
as a function of is
THE DEPENDENCE ON TOWER HEIGHT
v / v 0 h / h 0
α = 0.1
α = 0.2
α = 0.3α = 0.4
1.0
1.4
1.8
2.2
2.6
400 80 120 160 200
⎛ ⎞⎜ ⎟⎜ ⎟⎝ ⎠0
vv
h

ECE 333 © 2002 – 2017 George Gross, University of Illinois at Urbana-Champaign, All Rights Reserved. 36
q We can also determine the ratio of p w (h) to p w (h 0)
under the assumption that the air density ρ
remains unchanged over the range [ h0, h ] using
the relationship
THE DEPENDENCE ON TOWER HEIGHT
( )( )
⎛ ⎞⎛ ⎞
= = = ⎜ ⎟⎜ ⎟ ⎜ ⎟⎝ ⎠ ⎝ ⎠
3 33
30 0 00
1212
w
w
a vp h v hp h v ha v
αρ
ρ

ECE 333 © 2002 – 2017 George Gross, University of Illinois at Urbana-Champaign, All Rights Reserved. 37
q We can observe the dramatic change in the power output ratio as a function of height
THE DEPENDENCE ON TOWER HEIGHT
α = 0.1
α = 0.2
α = 0.3α = 0.4
4
8
400 80 120 160 2001
12
( )( )0w
w
p hp h
h
ECE 333 © 2002 – 2017 George Gross, University of Illinois at Urbana-Champaign, All Rights Reserved. 38
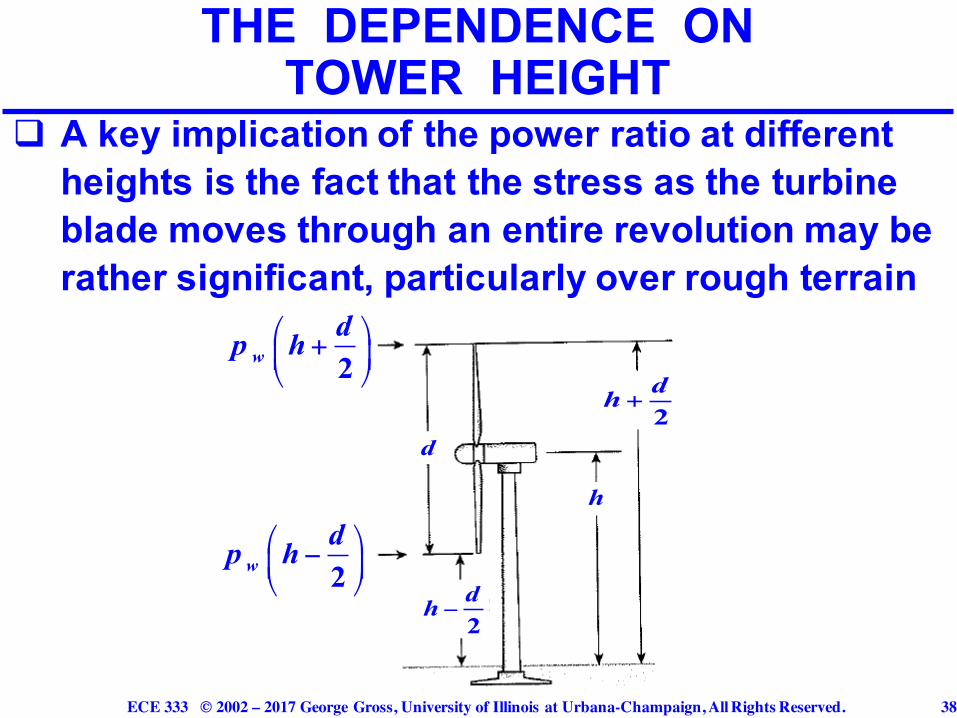
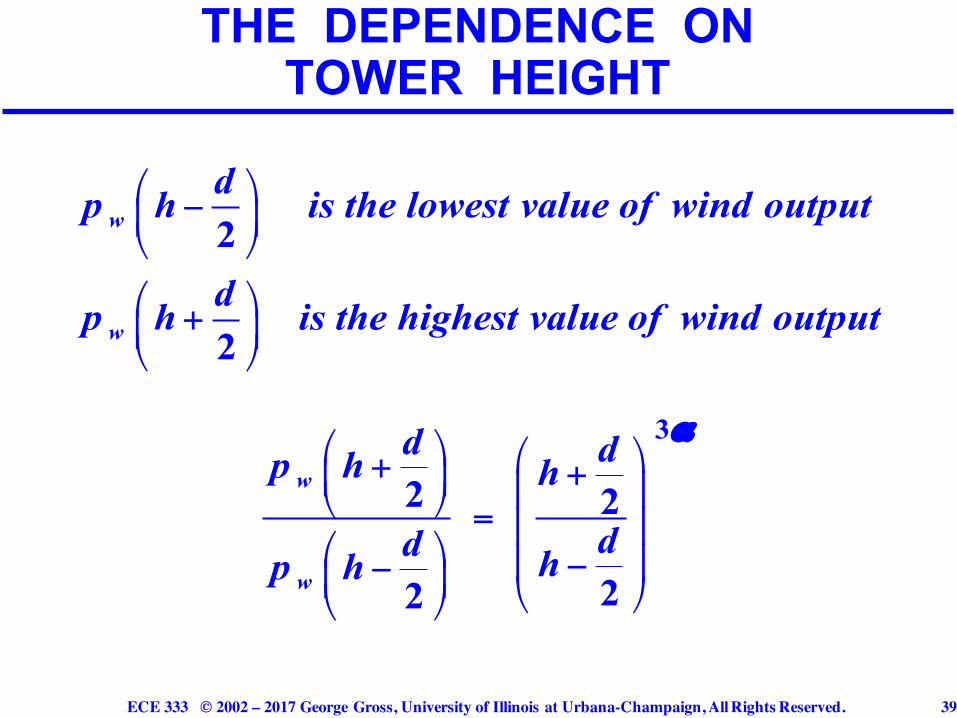
q A key implication of the power ratio at different heights is the fact that the stress as the turbine blade moves through an entire revolution may be rather significant, particularly over rough terrain
THE DEPENDENCE ON TOWER HEIGHT
⎛ ⎞−⎜ ⎟⎝ ⎠2w
dp h
−2dh
+2dh
⎛ ⎞+⎜ ⎟⎝ ⎠2w
dp h
h
d
ECE 333 © 2002 – 2017 George Gross, University of Illinois at Urbana-Champaign, All Rights Reserved. 39
THE DEPENDENCE ON TOWER HEIGHT
⎛ ⎞−⎜ ⎟⎝ ⎠
⎛ ⎞+⎜ ⎟⎝ ⎠
2
2
w
w
dp h is the lowest value of wind output
dp h is the highest value of wind output
⎛ ⎞ ⎛ ⎞+ +⎜ ⎟ ⎜ ⎟⎝ ⎠ = ⎜ ⎟⎛ ⎞ ⎜ ⎟−−⎜ ⎟ ⎝ ⎠⎝ ⎠
3
2 2
22
w
w
d dp h h
dd hp h
α
Top Related