


Languages
Pages
Legal


Earnings Update for Q4’FY21 and FY21
Zee Entertainment Enterprises Limited – 20th May, 2021
1
Safe Harbor Statement
This Release/Communication, except for the historical information, may contain statements, including the words or phrases such as ‘expects, anticipates, intends, will, would, undertakes, aims, estimates, contemplates, seeks to, objective, goal, projects, should’ and similar expressions or variations of these expressions or negatives of these terms indicating future performance or results, financial or otherwise, which are forward looking statements. These forward looking statements are based on certain expectations, assumptions, anticipated developments and other factors which are not limited to, risk and uncertainties regarding fluctuations in earnings, market growth, intense competition and the pricing environment in the market, consumption level, ability to maintain and manage key customer relationship and supply chain sources and those factors which may affect our ability to implement business strategies successfully, namely changes in regulatory environments, political instability, change in international oil prices and input costs and new or changed priorities of the trade. The Company, therefore, cannot guarantee that the forward-looking statements made herein shall be realized. The Company, based on changes as stated above, may alter, amend, modify or make necessary corrective changes in any manner to any such forward looking statement contained herein or make written or oral forward looking statements as may be required from time to time on the basis of subsequent developments and events. The Company does not undertake any obligation to update forward looking statements that may be made from time to time by or on behalf of the Company to reflect the events or circumstances after the date hereof.
2

EBITDA margin for the quarter with EBITDA of Rs. 5,408mn
Q4 domestic subscription revenue growth (LTL)
Q4 domestic advertising revenue growth
Strong advertising growth during the quarter
3
+8.9% +5.6% 27.5%
All India TV network share
18.9%
Original shows and movies released on ZEE5 in FY21
75+
Dividend announced by the BoD
250%

Business Performance
4

ZEE network share improves to 18.9%, continues to be India’s #2 TV entertainment network
5
Network share grew by 70bps QoQ led by FTA and two channels in South markets
ZEE network share improves 70bps QoQ
Performance of regional channels shows improvement
7% increase in TV universe reaffirms its status as the biggest reach media in the country
TV reaches ~900mn people now
183 197
210 780
836892
2016 BI 2018 BI 2021 UE
Total TV HHs TV Universe
18.3%
15.8%
19.0%18.2%
18.9%
Q4'20 Q1'21 Q2'21 Q3'21 Q4'21
ZEE’s new channels off to a strong start
In first full year of operations, ZEE’s new regional channels have established strong positions in their respective markets
Bengali, Telugu and Kannada channels improved shares during the year. Performance in Tamil and Marathi lagging expectations
TV HHs and Universe (mn)
19.0
24.5 24.2 25.7
29.9
33.8 33.5 35.3
31.3 31.3 34.8
36.0
20.0
22.0
24.0
26.0
28.0
30.0
32.0
34.0
36.0
38.0
40.0
15
20
25
30
35
Q1'21 Q2'21 Q3'21 Q4'21
Zee Telugu Zee Kannada Zee Bangla
*Relative share in respective markets; TG: U+R 2+
Viewership Share* (%)
#2 Kannada movie channel
#2 Bhojpuri channel
#3 Tamil movie channel #1 reach channel in Punjab

Radhey received an unprecedented response across multiple platforms
ZEE5 released 75+ originals during FY21
14 original shows and movies released during the quarter
➢ 72.6mn global MAUs*, 6.1mn global DAUs* in Mar’21
➢ 156 minutes average watch time per viewer per month in Q4FY21
➢ Q4 Revenue and EBITDA# stood at Rs. 1,075mn and Rs. (1,625)mn
➢ Annual pricing revised to Rs. 499 to enable increased adoption of yearly subscription packs
*Operating KPIs based on internal data analytics#EBITDA loss excludes costs incurred by the business on ZEEL network

➢ 50%+ YoY growth in YouTube video views, showing strong consumer affinity for ZMC music library
➢ ZMC added ~4mn subscribers on YouTube; with 72.8mn subscribers it is the second most subscribed Indian music channel on YouTube
Resurgence in COVID cases impacted the near-term plan of Movies business
➢ A strong slate of movies across languages in FY22
➢ COVID cases and lockdown guidelines will have a bearing on Zee Studios’ release plans
7
7.8 8.0
9.8
11.0
12.2
4QFY20 1QFY21 2QFY21 3QFY21 4QFY21
ZMC YouTube Views (bn)

Financial Performance
8

EBITDA margin for the quarter at 27.5%
9
(INR million) 4QFY21 4QFY20 Growth
Operating revenue 19,658 19,511 0.8%
Expenditure (14,250) (22,349) -36.2%
EBITDA 5,408 (2,839)
EBITDA excluding one-offs^ 5,408 3,193 69.4%
Other income 186 407 -54.3%
Depreciation (627) (778) -19.3%
Finance cost (491) (864) -43.1%
Fair value through P&L 207 (2,787)
Exceptional items (295) (1,137)
Profit Before Tax (PBT) 4,388 (7,997)
PBT excl. exceptional and one-offs^^ 4, 683 3,006 55.8%
Provision for Tax (1,664) 372
Share of Profit of Associates 1 (33)
Minority interest 34 (9)
Profit after Tax (PAT) 2,758 (7,667)
11,230
10,389
8,034
7,414
395
1,708
4QFY21
4QFY20
Advertising Subscription Other Sales & Services
Operating revenue breakup (INR mn)
8,443
10,448
2,142
1,604
1,498
1,841
2,168
2,425
4QFY21
4QFY20
Operating Personnel A&P Others
Cost breakup^ (INR mn)
^ Excludes one offs in Operating cost (Rs. 2,598 mn) and Other costs (Rs. 3,433 mn) in 4QFY20^^ Excludes above-mentioned one offs, exceptional items and loss on sale of Investments (Rs. 3,835 mn in FVTPL) in Q4FY20

FY21 revenues remained suppressed due to impact of COVID in H1FY21
10
(INR million) FY21 FY20 Growth
Operating revenue 77,299 81,299 -4.9%
Expenditure (59,398) (64,953) -8.6%
EBITDA 17,901 16,346 9.5%
EBITDA excluding one-offs^ 17,932 22,377 -19.9%
Other income 1,104 2,836 -61.1%
Depreciation (2,649) (2,706) -2.1%
Finance cost (571) (1,449) -60.6%
Fair value through P&L (1,962) (2,597)
Exceptional items (1,266) (2,843)
Profit Before Tax (PBT) 12,556 9,587 31.0%
PBT excl. exceptional and one-offs^^ 13,852 22,297 -37.9%
Provision for Tax (4,625) (4,317) 7.1%
Share of Profit of Associates (1) (24)
Minority interest 70 19
Profit after Tax (PAT) 8,001 5,265 51.9%
37,488
46,811
32,430
28,873
1,869
5,614
FY21
FY20
Advertising Subscription Other Sales & Services
Operating revenue breakup (INR mn)^
32,774
35,687
8,183
7,805
6,166
6,956
6,732
8,474
FY21
FY20
Operating Personnel A&P Others
Cost breakup (INR mn)^
^ FY20 excludes one offs in Operating cost (Rs. 2,598 mn) and Other costs (Rs. 3,433 mn)^ FY21 excludes one offs for content syndication deal (Revenue of Rs. 5,512mn and operating cost of Rs. 4,730 mn), and Other costs (Rs. 812 mn)^^ Excludes above-mentioned one offs, exceptional items and loss on sale of Investments (Rs. 3,835 mn in FVTPL) in FY20

Strong recovery in domestic advertising continues
11
Domestic advertising revenue for the quarter grew by 8.9% YoY driven by the continued recovery in macro advertising environment; FY21 domestic advertising revenue declined by 19.7% due to impact of pandemic in H1
Programming cost (excluding one-time inventory write-off of Rs. 2,598mn in Q4FY20) declined by 19.2% during the quarter, primarily due to lower accelerated inventory amortisation this quarter; Adjusted programming cost for the year declined by 8.2% due to lower original programming during first quarter
Advertisingrevenues
Operating cost
Like to like growth (excluding reclassification of music subscription revenue) of 5.6% and 5.8% for the quarter and year respectively, was primarily driven by ZEE5
Subscription revenues
Decreased YoY due to continued impact of pandemic on theatrical revenues and reclassification of music revenue to subscription
Other Sales & Services
A&P and other expenses (excluding one time provision of Rs. 3,433mn in Q4FY20) declined by 14.1% YoY during the quarter; there was a decline of 16.4% in FY21 due to lower marketing spends in the first quarter
A&P and Other expenses
Advertising revenue - Rs. 526mn, Subscription revenue - Rs. 553mn, Other Sales & Services – Rs. 154mn Internationalrevenue break-up

Condensed Balance Sheet
12
Assets (Rs. mn) Mar’21 Sep’20 Mar’ 20
Non-Current Assets
Fixed assets 12,667 12,919 13,979
Investments 316 477 478
Other financial assets 347 443 429
Income tax & Deferred tax assets (net) 7,380 7,295 6,844
Others Non-Current Assets 227 102 90
Current Assets
Inventories 54,030 52,086 53,475
Cash, Loans and other investments 18,574 14,177 10,115
Trade receivables 19,452 20,087 21,286
Others financial assets 3,418 3,825 3,732
Other current assets 11,035 9,691 12,804
Non-current assets - Held for Sale 742 933 945
Total Assets 1,28,187 1,22,035 124,176
Liabilities (Rs. mn) Mar’21 Sep’20 Mar’ 20
Equity Capital 1,01,074 94,409 93,549
Non-Current Liabilities
Preference shares - 3,631 2,975
Other borrowings 195 276 526
Provisions 1,546 1,432 1,405
Current Liabilities
Trade Payables 13,982 13,969 16,803
Redeemable preference shares 3,832 3,631 2,975
Other financial liabilities 3,498 3,083 2,808
Other current liabilities 2,811 1,420 2,107
Provisions 163 149 121
Income tax liabilities 1,085 39 906
Deferred tax liabilities (net) - - -
Total Equity & Liabilities 1,28,187 1,22,035 124,176
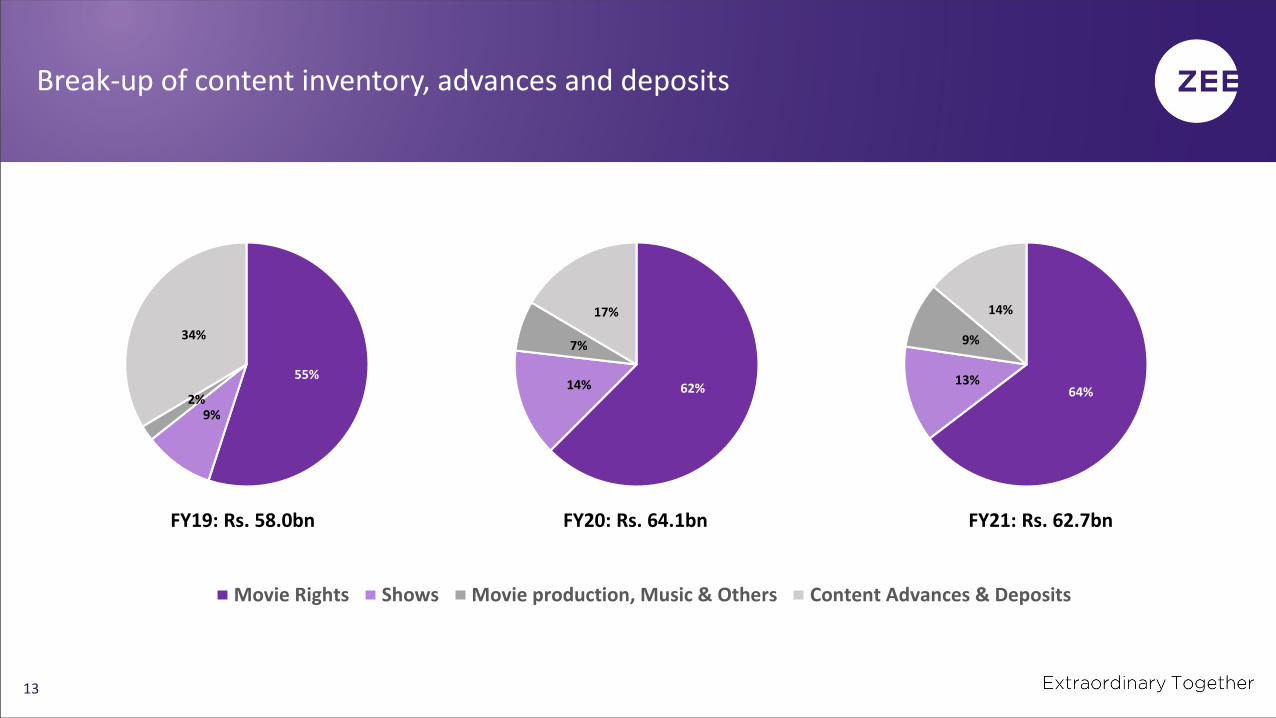
Break-up of content inventory, advances and deposits
13
FY19: Rs. 58.0bn FY20: Rs. 64.1bn
Movie Rights Shows Movie production, Music & Others Content Advances & Deposits
62%14%
7%
17%
55%
9%2%
34%
64%13%
9%
14%
FY21: Rs. 62.7bn

14
Top Related