


Languages
Pages
Legal

Contact: Email: [email protected] Press office: 020 7783 8300 Public enquiries: 0370 000 2288
Early years foundation stage profile
results in England, 2018
18 October 2018
The percentage achieving a good level of development continues to increase
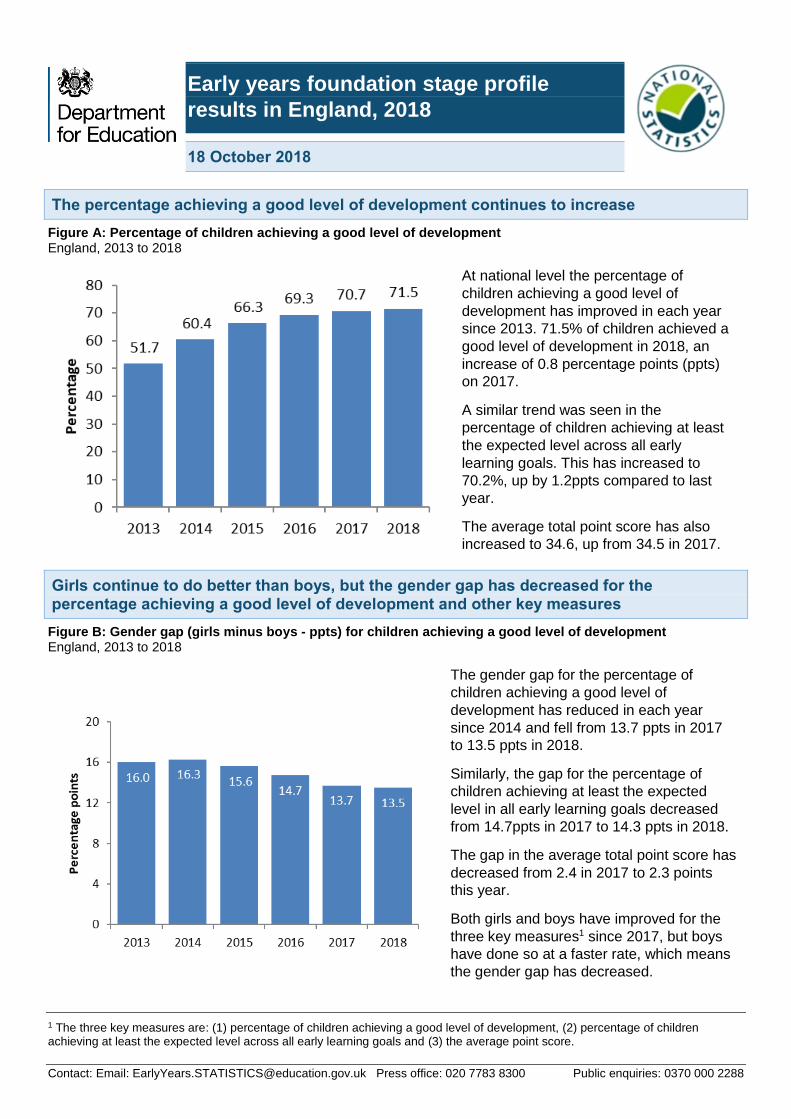
Figure A: Percentage of children achieving a good level of development England, 2013 to 2018
At national level the percentage of
children achieving a good level of
development has improved in each year
since 2013. 71.5% of children achieved a
good level of development in 2018, an
increase of 0.8 percentage points (ppts)
on 2017.
A similar trend was seen in the
percentage of children achieving at least
the expected level across all early
learning goals. This has increased to
70.2%, up by 1.2ppts compared to last
year.
The average total point score has also
increased to 34.6, up from 34.5 in 2017.
Girls continue to do better than boys, but the gender gap has decreased for the percentage achieving a good level of development and other key measures
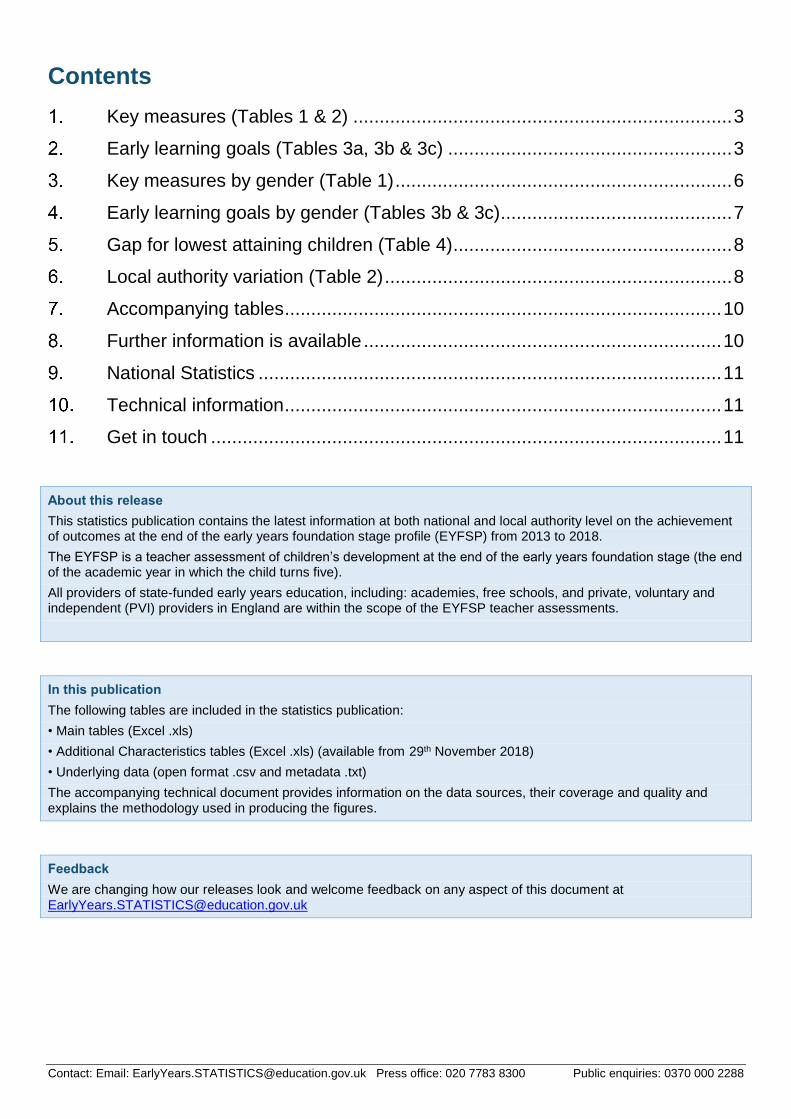
Figure B: Gender gap (girls minus boys - ppts) for children achieving a good level of development England, 2013 to 2018
The gender gap for the percentage of
children achieving a good level of
development has reduced in each year
since 2014 and fell from 13.7 ppts in 2017
to 13.5 ppts in 2018.
Similarly, the gap for the percentage of
children achieving at least the expected
level in all early learning goals decreased
from 14.7ppts in 2017 to 14.3 ppts in 2018.
The gap in the average total point score has
decreased from 2.4 in 2017 to 2.3 points
this year.
Both girls and boys have improved for the
three key measures1 since 2017, but boys
have done so at a faster rate, which means
the gender gap has decreased.
1 The three key measures are: (1) percentage of children achieving a good level of development, (2) percentage of children achieving at least the expected level across all early learning goals and (3) the average point score.
Contact: Email: [email protected] Press office: 020 7783 8300 Public enquiries: 0370 000 2288
Contents
Key measures (Tables 1 & 2) ........................................................................ 3
Early learning goals (Tables 3a, 3b & 3c) ...................................................... 3
Key measures by gender (Table 1) ................................................................ 6
Early learning goals by gender (Tables 3b & 3c) ............................................ 7
Gap for lowest attaining children (Table 4) ..................................................... 8
Local authority variation (Table 2) .................................................................. 8
Accompanying tables ................................................................................... 10
Further information is available .................................................................... 10
National Statistics ........................................................................................ 11
Technical information ................................................................................... 11
Get in touch ................................................................................................. 11
About this release
This statistics publication contains the latest information at both national and local authority level on the achievement of outcomes at the end of the early years foundation stage profile (EYFSP) from 2013 to 2018.
The EYFSP is a teacher assessment of children’s development at the end of the early years foundation stage (the end of the academic year in which the child turns five).
All providers of state-funded early years education, including: academies, free schools, and private, voluntary and independent (PVI) providers in England are within the scope of the EYFSP teacher assessments.
In this publication
The following tables are included in the statistics publication:
• Main tables (Excel .xls)
• Additional Characteristics tables (Excel .xls) (available from 29th November 2018)
• Underlying data (open format .csv and metadata .txt)
The accompanying technical document provides information on the data sources, their coverage and quality and explains the methodology used in producing the figures.
Feedback
We are changing how our releases look and welcome feedback on any aspect of this document at [email protected]
Page 3 of 12
Key measures (Tables 1 & 2)
Results for all three key measures have continued to rise, although the rate of improvement has slowed in
recent years.
Figure C: EYFSP key measures England, 2013 to 2018
% achieving good level of development
% achieving at least expected in
all 17 early learning goals
Average total point score
2013 51.7 48.9 32.8
2014 60.4 58.0 33.8
2015 66.3 64.1 34.3
2016 69.3 67.3 34.5
2017
2018
70.7
71.5
69.0
70.2
34.5
34.6
Definitions:
Good level of development
Children achieving a good level of development are those achieving at least the expected level within the following areas of learning: communication and language; physical development; personal, social and emotional development; literacy and mathematics. These are the early learning goals 1–12 in Figures D and E below.
Achieving at least the expected level across all early learning goals
Children achieving at least the expected level across all early learning goals (ELGs) are those achieving ‘expected’ or ‘exceeded’ in all 17 ELGs.
Average total point score
This is a supporting measure taking into account performance across all 17 ELGs, 1 point for emerging, 2 for expected and 3 for exceeding. The sum is then taken for all children and the mean given.
Early learning goals (Tables 3a, 3b, 3c, 5a & 5b)
The percentage of children achieving at least the expected level within each of the 17 early learning goals
improved year on year between 2013 and 2016.
2017 was the first year where a decrease in performance was seen in some of the early learning goals.
There was an increase in the percentage of children achieving at least the expected level in 8 of the early
learning goals compared to 2016. In 6 goals there was a decrease in performance and for the remaining 3,
the percentage achieving remained the same.
In 2018, there was an increase in the percentage of children achieving at least the expected level in 11 of
the early learning goals compared to 2017 In 4 goals there was a decrease in performance and for the
remaining 2, the percentage achieving remained the same (See Figures D and E below).
Although performance still varies between each early learning goal, this variation has reduced compared to
2013. Reading, writing and numbers continue to be the 3 goals with the lowest percentage of children
achieving at the expected level or above. The largest improvements from 2013 were for writing and
numbers.
Page 4 of 12
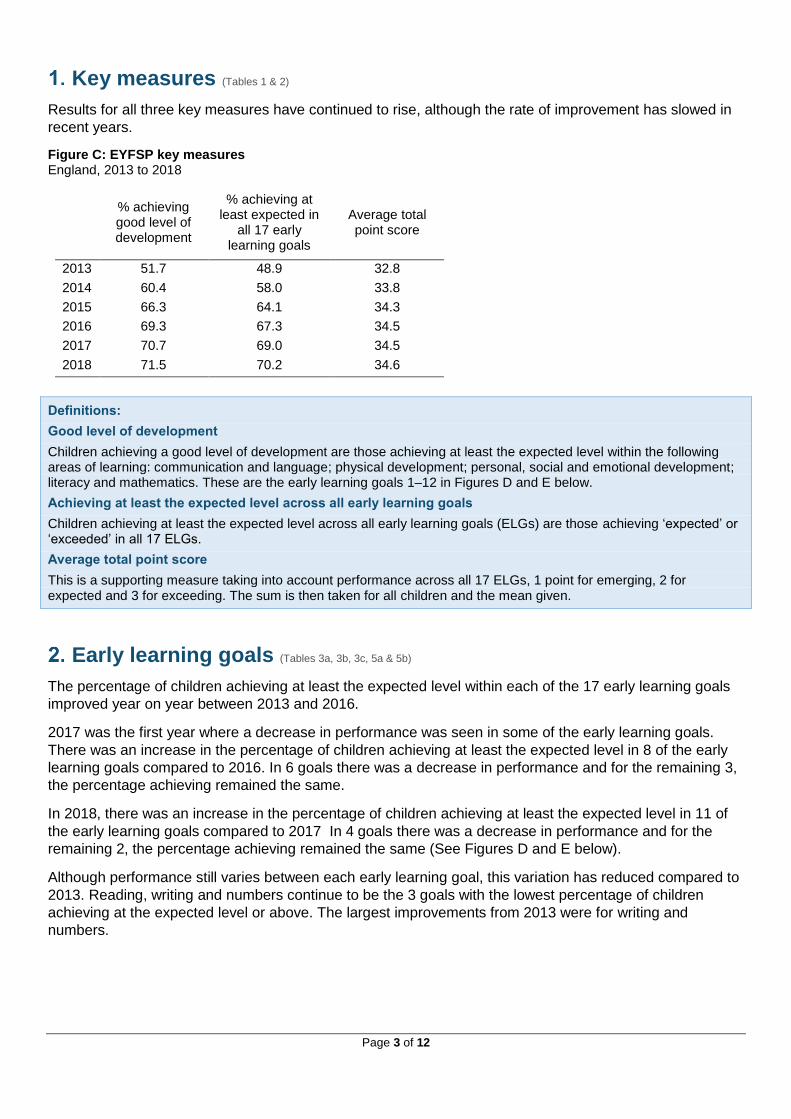
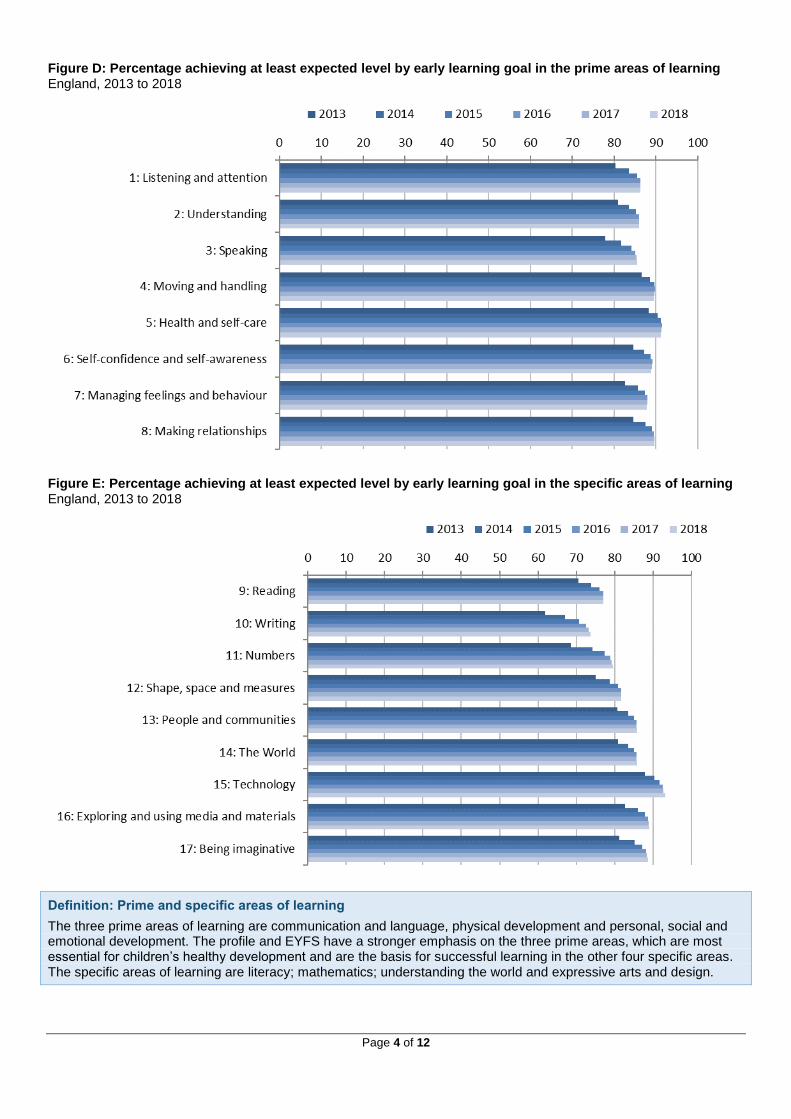
Figure D: Percentage achieving at least expected level by early learning goal in the prime areas of learning England, 2013 to 2018
Figure E: Percentage achieving at least expected level by early learning goal in the specific areas of learning England, 2013 to 2018
Definition: Prime and specific areas of learning
The three prime areas of learning are communication and language, physical development and personal, social and emotional development. The profile and EYFS have a stronger emphasis on the three prime areas, which are most essential for children’s healthy development and are the basis for successful learning in the other four specific areas. The specific areas of learning are literacy; mathematics; understanding the world and expressive arts and design.
Page 5 of 12
For the first time this publication includes tables showing the percentage of children achieving at least the
expected level of learning across all the early learning goals within the Communication & Language and
Literacy areas of learning, at both national and local authority level.
These areas of learning include the following early learning goals: listening and attention; understanding;
speaking; reading, and writing. These tables have been added to this publication due to a particular focus
on this combination of the areas of learning and learning goals in the public debate.
In 2018, 72.4% of children achieved at least the expected level of development across all the early learning
goals within the Communication & Language and Literacy areas of learning, up from 71.8% in 2017 and
56.9% in 2013. Girls continue to outperform boys, however the gender gap has narrowed in each year
since 2013 and is currently 13.3 percentage points.
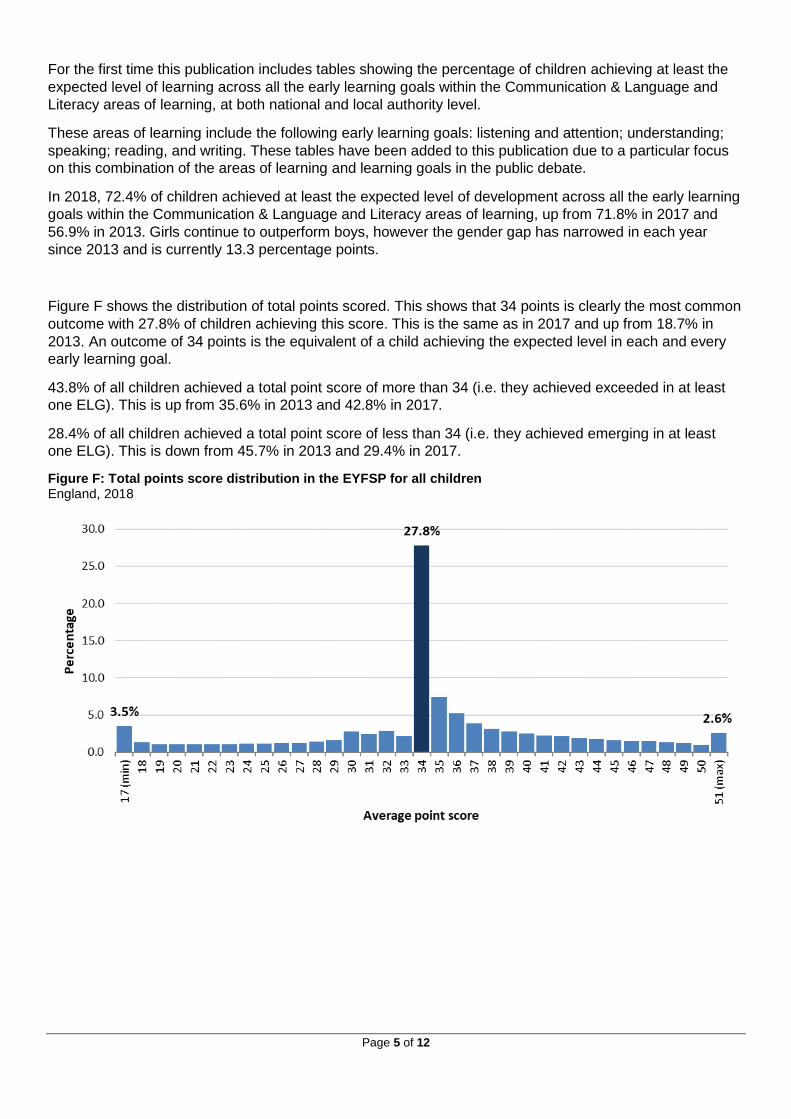
Figure F shows the distribution of total points scored. This shows that 34 points is clearly the most common
outcome with 27.8% of children achieving this score. This is the same as in 2017 and up from 18.7% in
2013. An outcome of 34 points is the equivalent of a child achieving the expected level in each and every
early learning goal.
43.8% of all children achieved a total point score of more than 34 (i.e. they achieved exceeded in at least
one ELG). This is up from 35.6% in 2013 and 42.8% in 2017.
28.4% of all children achieved a total point score of less than 34 (i.e. they achieved emerging in at least
one ELG). This is down from 45.7% in 2013 and 29.4% in 2017.
Figure F: Total points score distribution in the EYFSP for all children England, 2018
Page 6 of 12
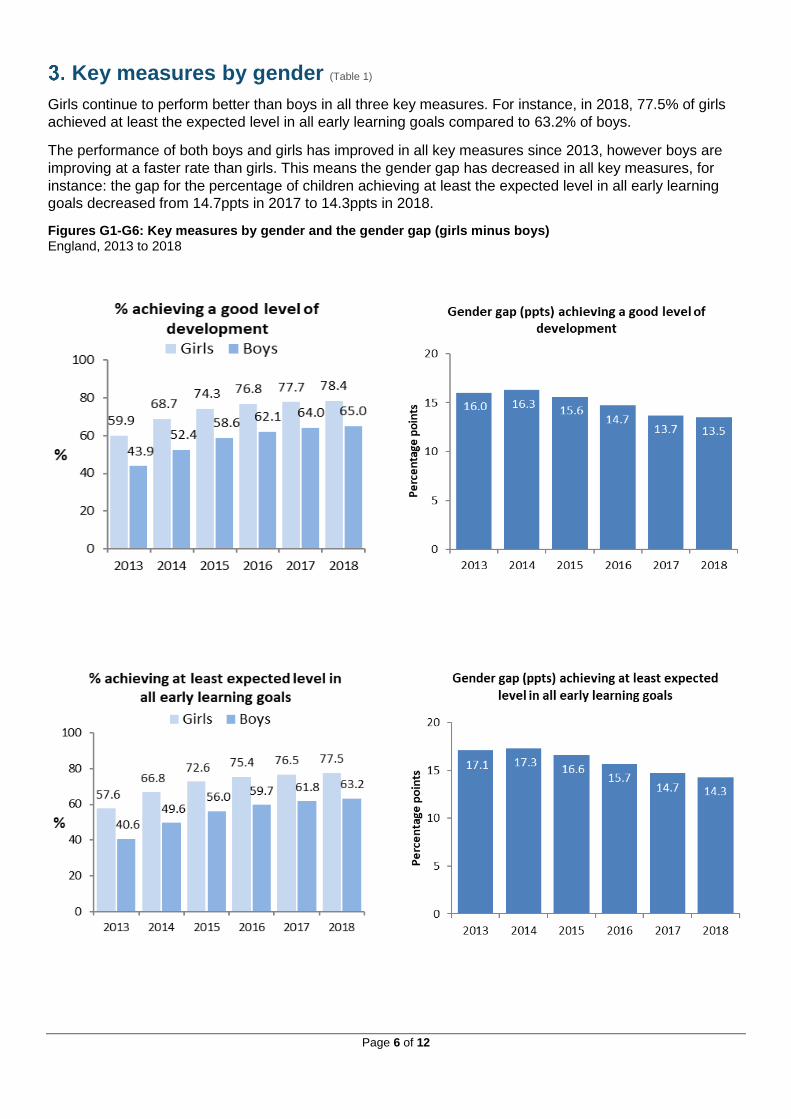
Key measures by gender (Table 1)
Girls continue to perform better than boys in all three key measures. For instance, in 2018, 77.5% of girls
achieved at least the expected level in all early learning goals compared to 63.2% of boys.
The performance of both boys and girls has improved in all key measures since 2013, however boys are
improving at a faster rate than girls. This means the gender gap has decreased in all key measures, for
instance: the gap for the percentage of children achieving at least the expected level in all early learning
goals decreased from 14.7ppts in 2017 to 14.3ppts in 2018.
Figures G1-G6: Key measures by gender and the gender gap (girls minus boys) England, 2013 to 2018
Page 7 of 12
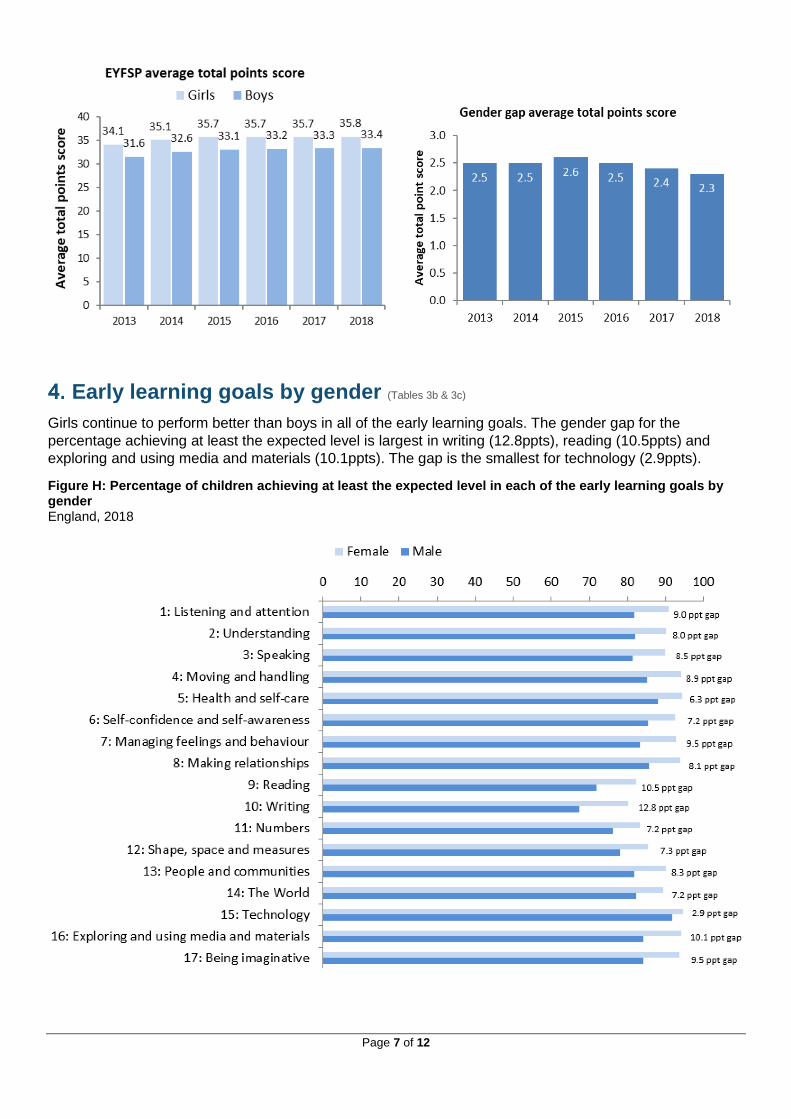
Early learning goals by gender (Tables 3b & 3c)
Girls continue to perform better than boys in all of the early learning goals. The gender gap for the
percentage achieving at least the expected level is largest in writing (12.8ppts), reading (10.5ppts) and
exploring and using media and materials (10.1ppts). The gap is the smallest for technology (2.9ppts).
Figure H: Percentage of children achieving at least the expected level in each of the early learning goals by gender England, 2018
Page 8 of 12
The gender gap has increased since 2013 for the following five early learning goals: self-confidence and
self-awareness; numbers; shape, space and measures; the world and technology but has decreased for all
the other goals.
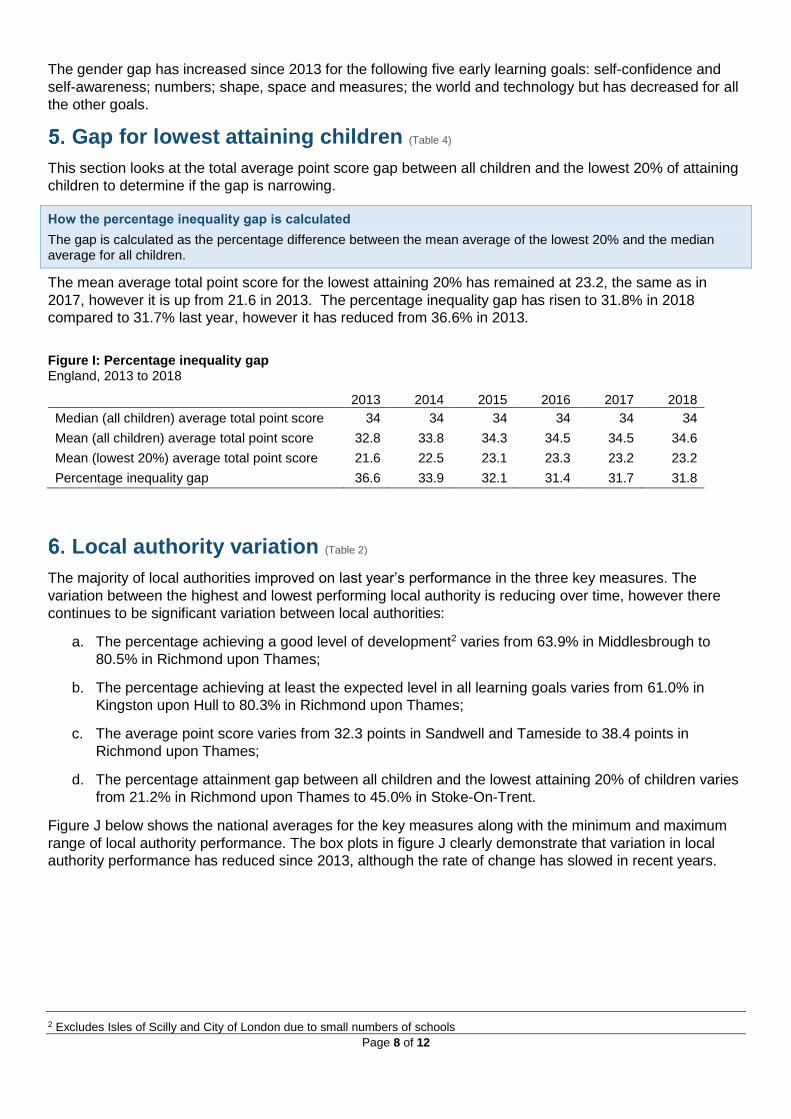
Gap for lowest attaining children (Table 4)
This section looks at the total average point score gap between all children and the lowest 20% of attaining
children to determine if the gap is narrowing.
How the percentage inequality gap is calculated
The gap is calculated as the percentage difference between the mean average of the lowest 20% and the median average for all children.
The mean average total point score for the lowest attaining 20% has remained at 23.2, the same as in
2017, however it is up from 21.6 in 2013. The percentage inequality gap has risen to 31.8% in 2018
compared to 31.7% last year, however it has reduced from 36.6% in 2013.
Figure I: Percentage inequality gap England, 2013 to 2018
2013 2014 2015 2016 2017 2018
Median (all children) average total point score 34 34 34 34 34 34
Mean (all children) average total point score 32.8 33.8 34.3 34.5 34.5 34.6
Mean (lowest 20%) average total point score 21.6 22.5 23.1 23.3 23.2 23.2
Percentage inequality gap 36.6 33.9 32.1 31.4 31.7 31.8
Local authority variation (Table 2)
The majority of local authorities improved on last year’s performance in the three key measures. The
variation between the highest and lowest performing local authority is reducing over time, however there
continues to be significant variation between local authorities:
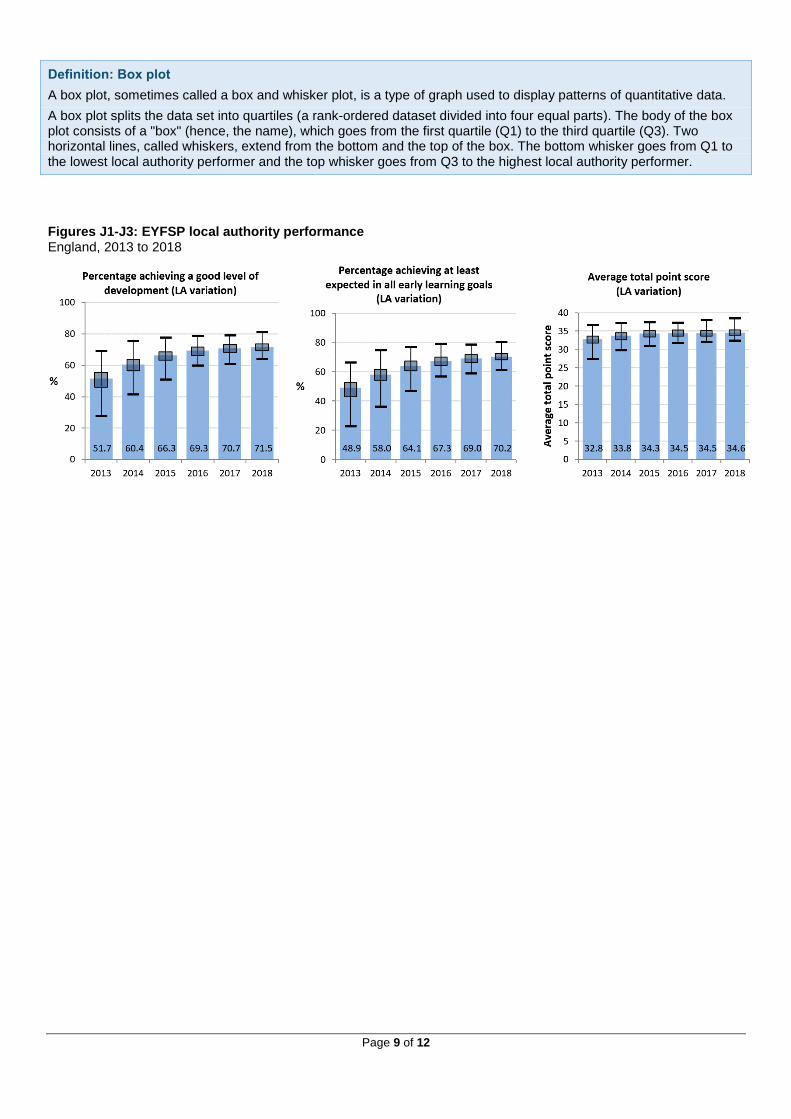
a. The percentage achieving a good level of development2 varies from 63.9% in Middlesbrough to
80.5% in Richmond upon Thames;
b. The percentage achieving at least the expected level in all learning goals varies from 61.0% in
Kingston upon Hull to 80.3% in Richmond upon Thames;
c. The average point score varies from 32.3 points in Sandwell and Tameside to 38.4 points in
Richmond upon Thames;
d. The percentage attainment gap between all children and the lowest attaining 20% of children varies
from 21.2% in Richmond upon Thames to 45.0% in Stoke-On-Trent.
Figure J below shows the national averages for the key measures along with the minimum and maximum
range of local authority performance. The box plots in figure J clearly demonstrate that variation in local
authority performance has reduced since 2013, although the rate of change has slowed in recent years.
2 Excludes Isles of Scilly and City of London due to small numbers of schools
Page 9 of 12
Definition: Box plot
A box plot, sometimes called a box and whisker plot, is a type of graph used to display patterns of quantitative data.
A box plot splits the data set into quartiles (a rank-ordered dataset divided into four equal parts). The body of the box plot consists of a "box" (hence, the name), which goes from the first quartile (Q1) to the third quartile (Q3). Two horizontal lines, called whiskers, extend from the bottom and the top of the box. The bottom whisker goes from Q1 to the lowest local authority performer and the top whisker goes from Q3 to the highest local authority performer.
Figures J1-J3: EYFSP local authority performance England, 2013 to 2018
Page 10 of 12
Accompanying tables
The following tables are available in Excel format on the department’s statistics website:
Tables
1 Time series of EYFSP attainment in key measures by gender
2 EYFSP attainment in key measures by gender and local authority
3a EYFSP attainment of all children in each early learning goal by area of learning and local authority
3b EYFSP attainment of girls in each early learning goal by area of learning and local authority
3c EYFSP attainment of boys in each early learning goal by area of learning and local authority
4 EYFSP average total point score distribution by local authority
5a EYFSP attainment in Communication & Language and Literacy areas of learning by gender
5b EYFSP attainment in Communication & Language and Literacy areas of learning by gender and local authority
When looking at the tables, please note that:
Only includes children with a
valid result for every early
learning goal
Some children may not have a full assessment for each early learning
goal. This may include a child who has not been assessed due to long
periods of absence, for instance a prolonged illness; a child who arrives
too late in the summer term for teacher assessment to be carried out. For
example, within 2 weeks of the data submission date, or a child who has
an exemption.
Attainment gaps are
calculated from unrounded
percentages
Therefore, the gap may not always be the same as the difference
between the two figures provided.
Further information is available
Previous EYFSP statistical
publications including
characteristic breakdowns
Statistics: early years foundation stage profile.
Underlying data is also available at the main publication page.
Additional tables providing characteristic breakdowns of EYFSP results
will be available on the 29th November 2018.
Early Years Foundation
Stage Profile collection
guide
Information for preparing and completing the annual Early Years
Foundation Stage Profile, including the scope of the return, technical
specifications and what data needs to be submitted to the Department for
Education by local authorities.
Documents and information for local authorities in relation to the EYFSP
return
Early Years Foundation
Stage Handbook
This handbook supports practitioners in making accurate judgements
about each child's attainment.

11
Early years foundation stage profile: handbook
Early years foundation
stage: assessment and
reporting arrangements
(ARA)
Statutory guidance for head teachers and local authority assessment co-
ordinators assessing and reporting the early years foundation stage
(EYFS) during the 2017 to 2018 academic year.
Early years foundation stage: assessment and reporting arrangements
(ARA)
Early years foundation
stage: the future
The government response to the Primary Assessment Consultation,
published on 14 September 2017, set out the government’s proposals to
improve the EYFSP. This academic year, twenty four schools across
England are piloting revised Early Learning Goals and a revised approach
to assessment and moderation. A full public consultation will follow the
pilot and its evaluation before national implementation.
National Statistics
The United Kingdom Statistics Authority has designated these statistics as National Statistics, in
accordance with the Statistics and Registration Service Act 2007 and signifying compliance with the Code
of Practice for Official Statistics.
Designation can be broadly interpreted to mean that the statistics:
meet identified user needs;
are well explained and readily accessible;
are produced according to sound methods, and
are managed impartially and objectively in the public interest.
Once statistics have been designated as National Statistics it is a statutory requirement that the Code of
Practice shall continue to be observed.
The Department has a set of statistical policies in line with the Code of Practice for Official Statistics.
Technical information
A technical document accompanies this statistical release. This provides further information on the data
sources, their coverage and quality and explains the methodology used in producing the data, including
how it is validated and processed.
Get in touch
Media enquiries
Press Office News Desk, Department for Education, Sanctuary Buildings, Great Smith Street, London
SW1P 3BT.
Tel: 020 7783 8300
Email: [email protected]
© Crown copyright 2018
This publication (not including logos) is licensed under the terms of the
Open Government Licence v3.0 except where otherwise stated. Where
we have identified any third party copyright information you will need to
obtain permission from the copyright holders concerned.
To view this licence:
visit www.nationalarchives.gov.uk/doc/open-government-licence/version/3
email [email protected]
write to Information Policy Team, The National Archives, Kew, London, TW9 4DU
About this publication:
enquiries Early Years Statistics, Data Insight and Statistics Division, Department for Education, Level
2 Riverside, Bishopsgate House, Feethams, Darlington, DL1 5QE, 01325 340688
Reference: Early Years Foundation Stage Profile results in England: 2018
Follow us on Twitter: @educationgovuk
Like us on Facebook: facebook.com/educationgovuk
Top Related