


Languages
Pages
Legal


Dublin City Sustainable Energy Action Plan Monitoring and Progress Report 2014


Dublin City Sustainable Energy Action Plan Monitoring and Progress Report 2014
Reporting on Implementation and Actions for the Covenant of Mayors
Report prepared by Codema
December 2013

Copyright © Codema
All rights reserved
Reproduction of the contents is permissible provided the source is acknowledged.
Disclaimer
While Codema considers that the information given in this work is sound, all parties must reply upon their own
skill and judgement when making use of it. Codema does not make any representation or warranty, expressed
or implied, as to the accuracy or completeness of the information contained in this report and assumes no
responsibility for the accuracy or completeness of such information. Codema will not assume any liability to
anyone for any loss or damage arising out of the provision of this report.

Contents
Foreword - 4 -
Executive Summary - 6 -
Introduction - 8 -
Monitoring Report - 10 -
Introduction - 10 -
Overall Results - 10 -
Residential Sector - 12 -
Commercial Sector - 19 -
Transport - 24 -
Municipal - 30 -
Summary of Monitoring Report - 32 -
Action Report - 33 -
Monitoring Emissions Inventory - 37 -
Appendix I i
Appendix II iii
Works Cited vi
List of Figures ix
List of Tables ix

- 3 -
Acronyms
CoM Covenant of Mayors
SEAP Sustainable Energy Action Plan
BEI Baseline Emissions Inventory
MEI Monitoring Emissions Inventory
EU European Union
BER Building Energy Rating
DEAP Dwelling Energy Assessment Procedure
DCC Dublin City Council
CO2 Carbon Dioxide
RE Renewable Energy
kWh Kilowatt hour
MWh Megawatt hour
TWh Terawatt hour
GWh Gigawatt hour
GDP Gross Domestic Product
NTA National Transport Authority
LGV Light Goods Vehicles
SEAI Sustainable Energy Authority of Ireland
CIBSE Chartered Institution of Building Services Engineers
LUAS Dublin’s Light Rail System
DART Dublin Area Rapid Transit
CSO Central Statistics Office (Ireland)

Dublin City Sustainable Energy Action Plan – Monitoring and Progress Report
- 4 -
Foreword
This report has been prepared by Codema, Dublin’s Energy Agency, which is working
in association with Dublin City Council with the overall aim of meeting the following
energy and climate targets:
1. Reduction in Dublin City’s CO2 emissions by 20% by the year 2020, compared
with a baseline of 9.7 tonnes CO2/capita/year in 2006
2. Reduction of Dublin City Council’s own energy consumption (for Council
buildings, public lighting, fleet of vehicles and other facilities) by 33%,
compared with a baseline of 211,916 MWh/year in 2006
The work of this first Monitoring and Progress Report follows on from the Dublin City Sustainable Energy Action
Plan 2010-2020 (SEAP), which was prepared by Codema in association with an interdepartmental Steering
Committee set up by Dublin City Council. This SEAP was approved by the Environment and Energy Strategic
Policy Committee in May 2009 and, following a formal public consultation process and Strategic Environment
Assessment, was approved by the full City Council in December 2010.
A political commitment to reduce Dublin’s carbon dioxide (CO2) emissions, which contribute to global warming
and climate change, was made by the City Council through the European Union Covenant of Mayors initiative,
which was signed by Cllr. Eibhlin Byrne, Lord Mayor of Dublin, on 25th March 2009. This commitment
includes the preparation of an initial SEAP, followed by subsequent Monitoring and Progress Reports. Dublin
is thus among the first group of signatories in this initiative, which has since grown to include about 5,500
signatures and 3,800 SEAPs from European cities and towns.
The Dublin City SEAP is fully aligned with the National Energy Efficiency Action Plan 2009-2020. This created
the framework for public authorities to lead by example by improving energy efficiency in their organisations.
With regard to the Council’s own energy consumption, the Minus 3% project, which was led by Codema and
financially supported by the EU Intelligent Energy Europe programme, has contributed greatly to this process,
both by promoting the concept of energy efficiency within the Council and by developing strategies to achieve
the goals.
Dublin City Council is currently on track towards meeting their 33% energy reduction target. According to the
Sustainable Energy Authority of Ireland’s (SEAI) benchmarking, Dublin City is currently ahead of the target
‘glide-path’, having achieved an energy saving of 26.7% by end of December 2013. Further savings are
planned over the next six years up to 2020. However, this will not happen all by itself, it will require a
significant investment of capital and human resources.
Codema continues to be fully committed to working with Dublin City Council in meeting, and even exceeding,
its 33% energy reduction target. For example, Codema has initiated the successful Think Energy campaign for
energy awareness among Council staff. We are also exploring the new concept of Energy Performance
Contracting (EPC) through facilitating the energy upgrade of several of the Council’s Leisure Centres and Fire
Stations. Finally, we are preparing an EPC strategy, in association with Dublin City Council, and this will be
incorporated in future updates of this SEAP.
........................................................................
Gerry Wardell
Director, Codema

Dublin City Sustainable Energy Action Plan – Monitoring and Progress Report
- 5 -

Dublin City Sustainable Energy Action Plan – Monitoring and Progress Report
- 6 -
Executive Summary
Codema carried out an assessment of the progress of the Dublin City Sustainable Energy Action Plan 2010-
2020, as part of the City Council’s commitment to the European Union Covenant of Mayors initiative. This
involved the monitoring of city level energy consumption and CO2 emissions and reporting on the progress of
energy actions which affect energy use in the city.
The results of the assessment have shown a substantial decrease in the overall energy consumption and
emissions for Dublin City over the period 2006-2011. This decrease has been due to numerous factors, such
as energy awareness, increased energy efficiency, economic recession, increased regulation, and reduced
CO2 levels in the electricity supply. The calculations, based on the latest best available data, show the city
consumes 10.14 TWh of final energy per year, with emissions of 5.6 tonnes CO2/year/citizen.
Each energy consuming sector in the city has seen a decrease in energy consumption. The residential sector
has seen the least change, and is now responsible for a large proportion of total energy used in the city at
45%. The commercial and transport sectors each hold a 27% share respectively and the municipality is
responsible for 1.6% of the city’s energy use.
The decrease in energy use in the transport sector can be attributed largely to the decrease in freight traffic in
the city, but has also been affected by the increased uptake of cycling and walking. The transport sector in the
city has seen a significant modal shift; although the overall number of passenger journeys has not increased
significantly, commuters have moved away from the use of public transport modes and toward independent
travel modes of driving, walking and cycling.
The residential sector in Dublin City has an ageing housing stock, with the majority built pre-1970. This is
reflected in the poor energy ratings of the majority of the city’s domestic dwellings, particularly terraced
housing. Most household energy is used for heating requirements, with the majority of energy provided by
natural gas.
The commercial sector, which includes both the industrial and services sectors, has seen the largest decrease in
energy consumption, which can be largely explained by the economic downturn experienced during the
period analysed.
The following report is divided into two main chapters: the monitoring report and the action report. The
monitoring report describes the process and detailed outcomes of the energy consumption calculations carried
out for each of the energy consuming sectors in Dublin City. The action report then outlines the main local,
regional and national level actions which have been, are being, and will be carried out in order to curtail
energy consumption and CO2 emissions in the city.

Dublin City Sustainable Energy Action Plan – Monitoring and Progress Report
- 7 -

Dublin City Sustainable Energy Action Plan – Monitoring and Progress Report
- 8 -
Introduction
This report was produced by Codema as part of
Dublin City’s obligations to the Covenant of
Mayors. The Covenant of Mayors is a commitment
by signatory cities to meet and exceed the EU
target of 20% CO2 reduction by 2020. Dublin City
signed up to the Covenant of Mayors in 2009, and
has since created and submitted a Sustainable
Energy Action Plan (SEAP) 2010-2020 for the City
of Dublin. The SEAP contains a Baseline Emission
Inventory (BEI) and a plan of actions to be
implemented in order to reduce energy
consumption and associated CO2 emissions. The
BEI is an extensive analysis of the energy
consumed and CO2 emitted in the residential,
transport and commercial sectors within Dublin
City. This was the first time such an analysis had
been undertaken, and was based on the best
available information at the time. Since then, a
number of actions and initiatives have been taken
on a local, regional and national level in order to
lower energy and emissions, and the next step is to
monitor this progress.
Figure 1: Steps involved in Covenant of Mayors
This report specifically deals with ‘Step 3’ of the
Covenant of Mayors requirements, as seen in
Figure 1, which involves submitting an update on
the implementation of the SEAP’s actions and the
monitoring of progress in terms of energy savings
and CO2 emission reductions. For this purpose, this
report is split into two sections; a ‘Monitoring
Report’ which includes the Monitoring Emissions
Inventory (MEI), and an ‘Action Report’ which
updates the progress status of actions taken and
identify any new actions planned. The information
gathered in this analysis can then be compared
with the previous study to identify areas of progress
and key areas for future initiatives.
Monitoring and reporting the progress of the SEAP
is an important step in ensuring the project is a
success. It can help to identify actions which have
been highly effective and use these as benchmarks
of excellence in the respective sectors. It can also
identify initiatives that have not progressed as
planned and seek to rectify this matter. Analysing
the actual final energy figures can help to
recognise how other external variables can have
an unexpected impact on energy use, both
positively and negatively.
The steps marked in blue in the process chart in
Figure 2 show the steps that have already been
accomplished through the SEAP document, and the
green lower half represents the steps which are
completed through this report. The blue steps were
based on data from the year 2006, and the green
steps covered in this report are based on figures
for 2011.
Figure 2: Progress made in Covenant of Mayors
Step 3: Regular Submission of Implementation Reports
Step2: Sustainable Energy Action Plan Submission
Implementation of SEAP Monitoring Progress
Step 1: Signature of the Covenant of Mayors
Creation of Administrative Structures
BEI and SEAP Development

Dublin City Sustainable Energy Action Plan – Monitoring and Progress Report
- 9 -
Changes in the Period 2006 to 2011
In this 5 year period, there have been significant
changes in the economic climate in Ireland. The
economic recession has had an effect on energy in
all sectors, particularly in the commercial and
transport sectors. For example, in the transport
sector, the tonne kilometres1 travelled nationally by
road freight dropped from 17,687 million tonne-
km in 2006 to 9,941 million tonne-km in 2011,
equating to a 43% decrease (Central Statistics
Office, 2012). The number of persons unemployed
rose 221%, from 92,000 at the start of 2006, to
295,700 at the start of 2011 (Central Statistics
Office, 2006, 2011). The energy use per
household fell by 18% from 2006 levels (SEAI,
2013). The economic crisis has also had the
adverse effect of reducing the amount of equity
available in the public and private sector to invest
in energy saving and renewable energy initiatives.
These types of national trends have had a large
impact on energy levels in all regions in Ireland,
particularly in Dublin City, being the hub of the
country’s commercial activities.
1 A tonne kilometre is one metric tonne of goods carried one
kilometre.
The population of Dublin City rose by just over
20,000 to 527,612 residents in 2011. There were
207,847 households in the same year, the
majority of which being terraced housing (Central
Statistics Office, 2013). There are approximately
21,017 commercial premises in Dublin City, which
together total approximately 7.9 million meters
squared floor area (Valuation Office, 2013). 158
of these premises are listed as currently vacant2.
The number of private cars licensed in the county
of Dublin marginally increased by 5% from 2006
to 2011, an average of 1% per year (Central
Statistics Office, 2007, 2012). There have been
increases in public transport facilities which
originate in the city, with extensions to the LUAS
tram system and new initiatives like the Dublin City
Bikes rental scheme. The significance of Dublin City
in the Irish economic landscape means it is
imperative to plan and commit to energy saving
and CO2 reduction through multi-level governance
structures and local level action. The following
monitoring and action reports will show the
progress Dublin City has made through the use of
such structures.
2 Based on Valuation Office information

Dublin City Sustainable Energy Action Plan – Monitoring and Progress Report
- 10 -
Monitoring Report
Introduction
This section outlines the methodologies used to
update energy consumption and associated CO2
emissions figures in the residential, commercial,
transport and municipal sectors, and the resulting
Monitoring Emissions Inventory, for the year 2011.
This year was chosen as it had the best and most
in-depth data available for Dublin City, mainly due
to the 2011 national census. The data available
for each sector was analysed in order to identify
the most suitable methodology for the calculations,
which took into account both accuracy and
simplicity of updating in the future.
The methodologies chosen differ to those used to
calculate the BEI figures. The reason for this being
that the data available now, in comparison to the
data when the BEI was compiled in 2006, allows
much greater accuracy of results. The new data
available now for some sectors is far superior to
what was previously available, and will continue to
improve in the near future with the introduction of
new initiatives such as smart metering. The new
methodological approach taken for the MEI yields
higher accuracy and reliability of results, and it is
now evident that the previous BEI was overly
conservative due to the lack of dependable data
available at the time.
The problem now, evidently, is that the results of
both will be offset from each other to a degree by
these differing methodologies. It is difficult to
extract and allocate what percentage of the
change is due to each of the contributory factors
of; 1) energy related actions, 2) the economic
recession and 3) the change in methodology.
Therefore an undefined portion of the change in
the figures for each sector will be attributable to the
difference in methodology used. An examination of
these differences and an estimation of the degree
of disparity will be discussed further in this section.
Asides from this stipulation, which only affects the
exact percentage change in each sector, the
resultant trend of energy consumption in each
sector is supported by comparisons to the national
changes in energy and emissions. This is further
verified by indicators relating directly to Dublin
City’s energy use over the same period. These
indicators are discussed further in the following
relevant sections.
Overall Results
A comparison of the 2006 and 2011 results show
Dublin City’s energy consumption, following the
general national trend, has decreased overall3.
This decrease is due to local, regional and national
energy initiatives, which are outlined later in the
action report, coupled with the effect of the
economic recession. The total reduction in energy
use over the 5 year period is equal to 36%,
dropping from 15.88 to 10.14 TWh/yr.
The CO2 emissions have decreased by a larger
percentage, dropping 43%, due to numerous
changes in fuel use in each sector, but mainly
attributable to the decrease in emissions from the
national electricity grid, which dropped from 596g
to 489g CO2/kWh (SEAI, 2013)4. CO2 per
capita has decreased to 5.6t per person in 2011,
down from the 2006 figure of 10.4t, which was
likely overestimated at the time. This brings Dublin
City more in line with other peer cities such as
London, which had a CO2 figure of 4.9t per
person in the same year (Dept. of Energy &
Climate Change UK, 2012).
3 Tables of results can be found in the Appendix. 4 The figure for emissions from the national grid used in the
SEAP BEI calculations was 662g CO2/kWh

Dublin City Sustainable Energy Action Plan – Monitoring and Progress Report
- 11 -
The sectorial share of final energy consumption has
not changed significantly, as can be seen in Figure
3 and Figure 4. The residential sector now holds a
larger percentage share, not due to an increase in
residential energy use, but rather due to a greater
decrease in commercial energy usage. The reasons
behind the decreases in energy use in each sector
will be analysed further in the following sections
where each sector is discussed individually.
Figure 3: Final Energy Consumption in Dublin City 2006
Figure 4: Final Energy Consumption for Dublin City 2011

Dublin City Sustainable Energy Action Plan – Monitoring and Progress Report
- 12 -
Residential Sector
On a national level, the number of permanent
dwellings rose 12.7% from 2006-2011 which is a
substantial decrease in growth rate when
compared to the 21% increase in the period 2002-
2006 (Central Statistics Office, 2012). This again
is directly linked to the economic downturn, with
the construction sector being one of the worst
affected. Dublin City has seen an even lower
growth rate, with the number of households
increasing by only 9%. Of these additional city
dwellings, 6% were apartments. This is indicative
of the age profile of the housing stock in the city;
apartments make up the majority of housing built
since the 1990’s, as can be seen in Figure 5. The
majority of housing, 57%, were constructed
pre1970, and only 16% were built since 2001.
Figure 5: Dublin City Total Housing Stock 2011 by Type and
Period Built
This picture differs greatly from the national profile
of housing, where 31% were constructed before
1970, and 26% built since 2001. Also the
national stock is 42% detached housing, compared
to only 5% in Dublin City, as shown in Figure 6.
Figure 6: Total Dublin City Housing 2011 by Dwelling Type
The difference between the National and Dublin
City housing make-up is evident of the need for
individual, in-depth, local level analysis of energy
figures, rather than a methodology which involves
a scaling down of national level figures to estimate
regional energy levels. This scaling down has the
effect of overlooking the individual energy
characteristics of an area which are often not
reflected in national statistics, and can therefore
miss opportunities to custom build more effective
local level energy action plans.
Methodology
The methodology chosen is based mainly on two
sources of information, the results of the 2011
National Census, and the newly available Building
Energy Rating (BER) resource tool from the
Sustainable Energy Authority of Ireland (SEAI). The
BER database currently holds in-depth energy data
on over 390,000 households nationwide (SEAI,
2013)5. The BER for a household is a calculation of
the energy required for normal use of space
heating, hot water, ventilation and lighting per
meter squared area of the dwelling.
The BERs are calculated using the latest version of
the national Dwelling Energy Assessment Procedure
(DEAP). The final certificate given to a household
shows its energy rating in kWh/m2/year and on
an energy efficiency scale A to G, with A being the
most efficient and G the least efficient. An example
of such a certificate can be seen in Figure 7. The
database also provides many other energy related
data such as percentage of energy efficient lighting
per household, the year the dwelling was
5 The information from this database is updated daily, and that
which is used in this report was accurate as of the 29th of
August 2013

Dublin City Sustainable Energy Action Plan – Monitoring and Progress Report
- 13 -
constructed and the type of fuel used. Such in-
depth data has allowed us to gain a near accurate
picture of residential energy usage, and the
analysis of this sector is the most detailed in this
report.
Figure 7: Sample BER Certificate. Source: (SEAI, n.d.)
Altogether there were 57,627 BERs analysed in
this report. The BERs analysed were restricted to
those representing households in Dublin City, as far
as possible, by filtering by post code. These were
then broken down further into type of
accommodation; Detached, Semi-Detached etc.,
and by period built. These categories were defined
to match the information available from the Census
for the entire housing stock. There is a high
representation of BER’s for each dwelling type, as
seen in Figure 8, with a 26% overall
representation. The highest representation is for
apartments, where 37% have a BER.
Figure 8: Representation of Dublin City Housing in BER
Database
The disadvantages of using the BER data is that it
does not allow for differences in energy use due to
user behaviour and does not account for energy
used by appliances. The BER is only required for
housing that is being sold, for rent or applying for
grants for energy upgrades. This means that it will
not be fully representative until all housing is
required to have a BER certificate. Also, even
though the BER database is filled in by competent
assessors, there is the possibility of human error.
Additional energy use due to household appliances
is calculated based on the figures for national
annual residential electricity usage taken from the
SEAI’s Energy in the Residential Sector report
(SEAI, 2013).
A comparison between the thermal energy
averages derived from the BER database and the
actual monitoring of energy use in a sample of
300 households in Tipperary, carried out in the
Kerry Sustainable Energy Community Roadmap,
shows a high level of correlation between
theoretical BER energy levels and actual monitored
energy data (Dubuisson, 2013 ).
The Census data for the entire Dublin City housing
stock was provided by the Central Statistics Office
(CSO) and broken down into type of
accommodation and period built. This was then
applied to the averages calculated from the BER
database for all 24 data subsets; six periods of
construction by 4 dwelling types. This breakdown
allows a higher level of accuracy when applying
the averages to all housing, as it is known that the
age profile and type of dwelling has a significant
effect on related energy use.

Dublin City Sustainable Energy Action Plan – Monitoring and Progress Report
- 14 -
Analysis
Figure 9 gives an idea of the energy performance
of the housing stock according to dwelling type. As
can be seen, although apartments hold a 35%
share of the housing stock, they account for only
21% of the total energy used. Thus, as a sector,
apartments have the best energy efficiency of the
four housing sectors in Dublin City. When the
energy use is compared to floor area, apartments
again use comparatively less kWh/m2 floor area
than any other dwelling type. The detached
housing sector use 10% of the total energy, which
is an equal share of energy when compared to
floor area, but double the share of number of
dwellings.
Figure 9: Shares of Total Energy Use, Floor Area, and Number
of Dwellings for Each Dwelling Type in Dublin City
The semi-detached and terraced housing sectors
use a higher share of total energy than their share
of total floor area, with terraced housing having
the highest kWh/m2 of any dwelling type.
Some of the reasons for these findings are that
apartments have less exposed wall area, and they
make up the majority of the newer built housing,
which would have been built with better energy
efficiency measures, whereas terraced housing
makes up the majority of the oldest housing built in
Dublin City.
This chart also gives an idea of the average floor
size of housing in Dublin City, with detached
housing holding a 10% share of total floor area,
but only 5% of the total numbers of dwellings, this
type of dwelling is double the size of the average
apartment or terraced house. The energy use per
household was 31MWh in 2006, which dropped
30% to 22MWh in 2011. This is slightly more than
the overall residential sector reduction of 25% due
to the increase in the number of dwellings coupled
with the overall decrease in energy. The national
average energy use per household in 2011 was
20MWh (SEAI, 2013), which is 9% lower than the
Dublin City average.
The final energy is broken down into areas of
demand in Figure 10. Total delivered energy
amounts to 4.5 TWh in 2011, down 23% on
2006 figures. Almost two thirds of all energy used
in the residential sector is for space heating. The
heating demand calculated in the building energy
ratings is based on average annual heating degree
days in Ireland, which means this figure could be
higher or lower in any particular year depending
on actual weather conditions. Space heating has
by far the highest energy demand, and should
therefore be the first area of focus for further
energy savings initiatives. Hot water and
appliances make up the majority of the remaining
energy demand, with lighting and pumps/fans
together contributing only 4%.
Figure 10: Energy Demand in Dublin City Residential Sector
The breakdown of final fuel consumption is shown
in Figure 11. The sector is dominated by natural
gas use, which makes up over 75% of fuel used,
due to the density of the gas grid in the Dublin City
region. Oil only contributes just over 7% to the
final fuel mix. This picture differs greatly from the
national level figures, where oil makes up over
36% of residential fuel consumption, and the share
of gas is much lower at only 20% (SEAI, 2013).
This means the associated CO2 emissions will be
correspondingly lower in Dublin City due to natural
gas having a lower CO2 emission factor than
heating oil.

Dublin City Sustainable Energy Action Plan – Monitoring and Progress Report
- 15 -
Figure 11: Final Energy Consumption Fuel Mix
There is very little peat used, and the share of coal
is only 0.4%. Other fossil fuel accounts for 1%,
and this includes the use of multi-fuel stoves where
no particular fuel is specified for use.
Total renewable fuel sources account for less than
0.09% of the final fuel consumption, the majority of
which is wood. The reason there are no figures for
solar thermal and heat pumps is due to the lack of
clarity in the BER data, as these systems are
classified as secondary heating, and at the moment
any secondary water heating is only recognised as
an electrical immersion heater (SEAI, 2013).
There can be estimates made to the amount of
energy from these sources, taken from data
gathered from renewable energy grant schemes.
The Greener Homes scheme from the SEAI, which
ran from 2006-2011, shows that there were 2,957
Renewable Energy (RE) installations installed in the
county of Dublin (SEAI, 2012). Estimates made in
a Codema report on Renewable Energy in Dublin
show this equates to approximately 23,764
MWh/year (Codema, 2013). Of this, it is
estimated there are approximately 4079 MWh
Solar Hot Water and 2785 MWh Heat Pump
energy per year in Dublin City. With this
additional renewable energy entered into the
calculations, it brings the total RE in Dublin City
residential sector up to around 0.3%.
The percentage of electricity used for space
heating is high in Dublin City due to the amount of
storage heating used in apartments. Although
Dublin City is home to only 12% of the Irish
population, it contributes over half of the residential
electricity used nationally for space heating, as
seen in Figure 12.
Figure 12: Residential Electricity Used Annually For Each
Purpose
The total electricity use in Dublin City is split as
seen in Figure 13. Just over a quarter is used for
space heating, whereas space heating only
accounts for 7% nationally (SEAI, 2013). The fact
that a lot of heating is already provided by
electricity and not direct combustion of fossil fuels
means this is a sector which could be the focus for
renewable heating sources or highly efficient
electrical heating systems, such as heat pumps, to
replace the less efficient, inconvenient storage
heaters, rather than converting to fossil fuel use.
Figure 13: Dublin City Residential Sector Final Electricity Use
The breakdown of energy used for cooking, cold
appliances, wet appliances and small appliances
is taken from the national figures, as was
previously mentioned, the BERs do not contain this
information. The national figures for these areas
should be representative of Dublin City as the
energy use for these appliances is based on typical

Dublin City Sustainable Energy Action Plan – Monitoring and Progress Report
- 16 -
user behaviour and not dependent on housing type
or age. However, there have been studies which
show that there is less use of appliances in
apartments and rental properties (SEAI, 2013),
meaning the energy figure for appliances in Dublin
City may be lower than the national average and
therefore may be overestimated in these
calculations.
The use of electricity for appliances is growing,
and even though the energy efficiency of the likes
of white goods is increasing, the number of digital
appliances being used is growing and goods such
as televisions and refrigerators are becoming
larger in size. The number of households with two
or more televisions increased from 49% to 65%
from 2004 to 2010 (Central Statistics Office,
2012). Appliance use is clearly an area which
needs to be addressed in energy awareness
initiatives, as the combined digital appliance
annual electricity use is now higher than that of
traditional (white goods) appliances (SEAI, 2013).
The problem with introducing initiatives to reduce
energy used for appliances is how it can be
monitored on a large scale, which could be solved
with the national roll out of smart meters if
monitoring of different lighting/socket circuits was
available.
Figure 14 shows the total building energy ratings
for all housing in the city after the averages
calculated for each dwelling type and period built
are applied to the entire housing stock. This shows
that the majority of dwellings, 70%, are rated D1
or lower, which corresponds to energy use of 225
kWh/m2/year or higher. There is a high level of G
ratings at 14%, the majority of which, 46%, are
terraced housing. The vast majority of the higher B
ratings are apartments, and only 2 buildings are
classified as having an A2 level rating.
There are no A1 rated buildings in Dublin City.
Terraced housing has the worst energy ratings,
with 76% rated D1 or lower. With new energy
grant schemes for home owners, the introduction of
smart meters and other such actions, the blocks in
this chart should start to shift over to the left. This
picture of the housing stock can now be updated
easily at any stage to monitor changes in energy
ratings as we progress toward 2020.
Figure 14: Building Energy Ratings for All Dublin City Housing Stock

Dublin City Sustainable Energy Action Plan – Monitoring and Progress Report
- 17 -
Results: Dublin City Monitoring Energy and Emissions Inventory for Residential Sector
Table 1: Dublin City Residential Monitoring Emissions Inventory; Final Energy and CO2 Emission
Indicators
There are numerous indicators which we can now
use to monitor progress through the database
created for this analysis of the residential sector.
The database contains over 130 different fields for
each household, from efficiencies to details of the
structure, and these can be used as indicators to
match different action areas. Examples of these
are;
Percentage of A or B rated dwellings = 9%
Average energy use per household = 22
MWh
Percentage fossil fuel use = 84.3%
Example of the percentage low energy lighting
indicator can be seen in Figure 15. The overall
average percentage of low energy lighting in
Dublin City residential sector is 31%, and the
figure shows how this breaks down by house type
and period built. It is interesting to see that the
newer built dwellings have higher levels of low
energy lighting. The highest percentage of low
energy lighting is found in newly built semi-
detached housing at 57%, which shows that even
in the best case, there is still a lot of room for
improvement in this area.
Figure 15: Percentage Low Energy Lighting by Building type
and Period Built
The main target areas for energy actions identified
from this analysis are;
Terraced housing energy use
Energy used for space heating
Reliance on fossil fuel
Growth in appliance use
Lighting in apartments
Natural
gas
Liquid
gas
Heating
oilPeat Coal
Other
fossil
fuels
Biofuel Other
biomass
1,182,997 2,989,232 4,697 294,023 967 14,798 40,310 6 3,557 4,530,587
578,012 603,825 1,077 82,032 362 5,040 11,650 2 89 1,282,089
Renewable
Energies
Total
Energy (MWh)
CO2 Emissions (t )
Residential SectorElectricity
Fossil fuels

Dublin City Sustainable Energy Action Plan – Monitoring and Progress Report
- 18 -
Comparison of BEI and MEI
Methodologies
Both methodologies used for the 2006 BEI and the
2011 MEI are based on the BER system. For the
BEI, the DEAP software, which is used to calculate
a BER, was used and a typical dwelling type for
Dublin City selected and inserted into this software.
Different specifications were applied to this typical
dwelling for different periods of construction. The
resultant BER for each construction period was then
applied to the entire housing stock for 2006. The
BEI is therefore based on estimated BERs, and the
MEI on actual BERs. It is reasonable to compare
the BEI to the MEI as they are both based on the
same fundamental calculation methods; the only
difference is the accuracy is much higher in the
MEI. From a comparison of the estimated BERs,
and the actual, it seems the original energy use in
the BEI may have been over estimated. Also,
because we do not know how many of the BERs
used for the MEI were for housing that has had
energy efficiency upgrades, there is a chance the
energy averages used may be slightly lower than
in reality. Due to this, the percentage decrease in
energy consumption from 2006 to 2011 is
probably slightly higher than it is in reality.

Dublin City Sustainable Energy Action Plan – Monitoring and Progress Report
- 19 -
Commercial Sector
The commercial sector includes both the industrial
and the services sector6. The changes in the Irish
economy, previously described in the introduction,
have had a large impact on the commercial sector.
The consumer price index dropped dramatically by
approximately 8% from 2006 to 2009 during the
economic crisis (IMF, 2013). GDP per capita fell
5% from 2006 to 2011, and 11% from 2008
levels (IMF, 2013). Unemployment rose to nearly
15% nationally in 2011. Between 2008 and
2011, 46,931companies ceased trading in
Ireland (Irish Independent, 2011). These statistics
give an indication of how businesses in Dublin
have been affected by the change in economic
circumstances.
National industrial energy use in 2011 was 18%
lower than in 2006, and 1.4% lower than 2010
despite the fact that industry output increased by
3.1% in the same year (SEAI, 2012). This shows
that there has also been an increase in energy
efficiency, coupled with the decrease in overall
industrial activity over the 5 year period in
question. The national figures for the services
sector are based on a ‘residual’, as there is no
other methodology available for calculating energy
figures for this sector with any accuracy due to its
diverse nature (SEAI, 2012). This inhibits the
comparison of national and local level service
sector energy, and also highlights the difficulty in
obtaining data for this sector.
In Dublin City there are over 21,000 commercial
and industrial properties, as listed by the valuation
office. Figure 16 shows these properties broken
down by category.
6 Services will be referred to as ’Tertiary’ later for Covenant of
mayors purposes.
Figure 16: Dublin City Commercial Properties by Category7
Over two thirds of commercial properties are retail
outlets and offices. Industrial properties only
account for 17%, which is likely due to the high
demand and rates for property in Dublin City
which favours numerous smaller retail type
businesses with smaller floor area requirements.
The hospitality sector makes up 3% of all
commercial properties, reflecting the large number
of hotels in the city.
It is interesting to compare this breakdown of the
number of properties in each category, to the total
floor area used by each category. Figure 17 shows
the share of the total floor areas, and here we can
see that the industrial sector has a much higher
share of the total floor area at 30%, compared to
number of properties. Conversely, retail outlets
have only half their share of the total floor area
compared to their share of units. The hospitality
sector also holds a noticeably larger share of floor
space.
7 Retail (Warehouse) category is specified as different to Retail
(Shops) as the former are large warehouse type facilities which
have different energy requirements.

Dublin City Sustainable Energy Action Plan – Monitoring and Progress Report
- 20 -
Figure 17: Total Commercial Floor Area by Category
Methodology
The two main sources used for the analysis of the
commercial sector are the Valuation Office and the
Charted Institution of Building Services Engineers
(CIBSE). The Valuation Office has provided
Codema with a list of all the commercial properties
in Dublin City and their respective floor areas in
meter squared (Valuation Office, 2013). These
properties are also broken down into category (as
seen above), property use (i.e. factory, hotel etc.),
and by electoral district.
There is no actual energy data publicly available
for these properties. In order to allocate energy
figures to each business, energy benchmarks from
the UK CIBSE Guide F: Energy Efficiency and
TM46 are used (CIBSE, 2012). These sources
provide typical energy usage figures per square
meter floor area for a range of business types,
amalgamated from numerous UK surveys.
The property uses listed by the Valuation Office
were matched as accurately as possible with the
descriptions of building use given in the CIBSE
guides. The measurements of floor areas listed by
the Valuation Office are based on different
requirements for each business type, as seen in the
Valuation Office’s Code of Measuring Practice
(Valuation Office Ireland, 2009)8. If the
measurement of floor area from the valuation office
did not match that in the CIBSE guides, i.e. gross
floor area to net floor area, then a conversion
factor had to be applied9. The energy figures were
8 The valuation office figures for floor areas are subject to
human error. 9 The conversion factors used were also taken from the CIBSE
sources.
then applied to all 21,000 property listings
individually, by their property use. There are over
230 different property uses listed in Dublin City,
from abattoirs to video shops.
The CIBSE energy figures are only broken down
into either fossil fuel or electricity, so due to a lack
of local level data in this area, the 2011 national
breakdown of fossil fuel types for service sector
energy and fossil fuel and electricity breakdown for
industrial sector energy is used (SEAI, 2012). This
unfortunately does not allow an accurate picture of
fuel use in the commercial sector specific to Dublin
City.
There are advantages and disadvantages to using
the CIBSE energy benchmarks too. Some
advantages are that many of the benchmarks are
based on large sample sets, and the Irish building
regulations are principally derived from UK
regulations, which make the energy figures given
applicable for an Irish context. On the other hand,
the UK climate is more severe than the Irish and
can have up to a 10% effect on results when
applied to the Irish context, and also, there are
standard occupancy rates applied in CIBSE figures
which cannot be adjusted (SEAI, n.d.). A lot of the
benchmarks used in the CIBSE guides are now
outdated, with some taken from surveys dating as
far back as 1992, and therefore many of these
figures will not reflect energy efficiency measures
and newer building regulations which have been
brought in since this time. Assumptions made are
listed in the appendix.
There are no figures for data centre energy use in
the CIBSE guides, and there are no known figures
from Irish studies given in kWh per meter squared
floor area. Consequently, energy figures for data
centres were taken from a research report from
Lawrence Berkeley University on data centre power
requirements (Mitchell-Jackson, et al., 2003).
Dublin City Sustainable Energy Action Plan – Monitoring and Progress Report
- 21 -
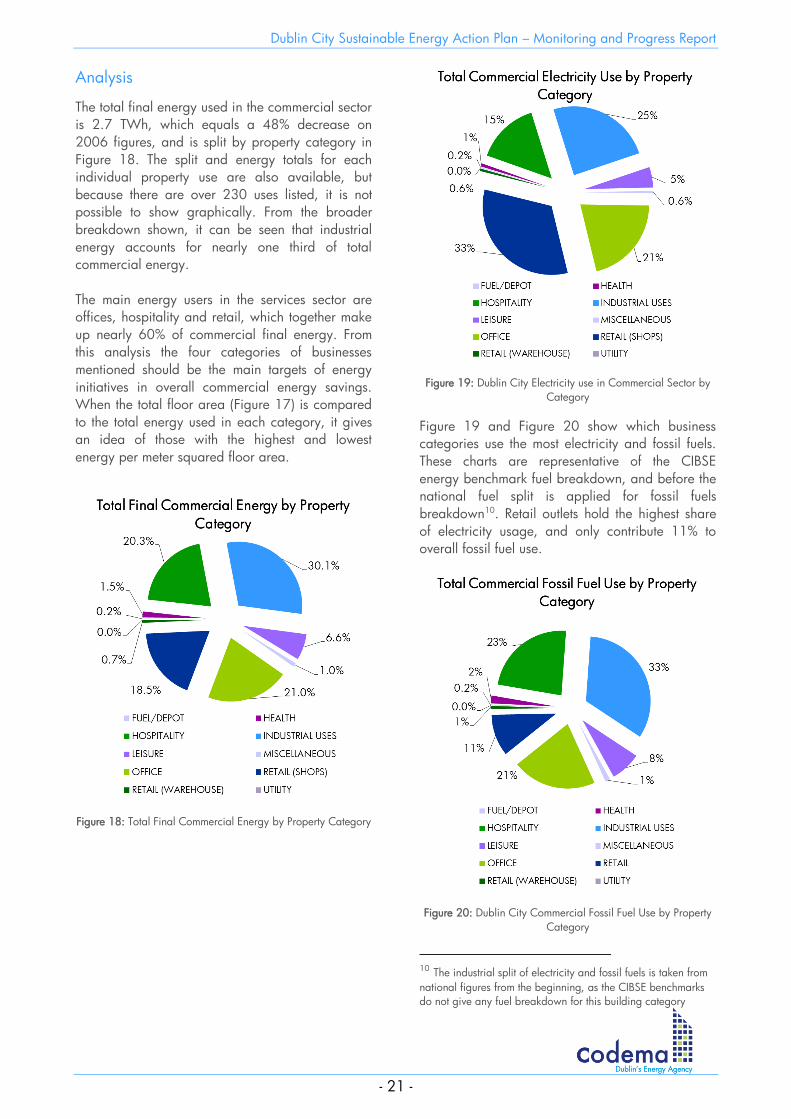
Analysis
The total final energy used in the commercial sector
is 2.7 TWh, which equals a 48% decrease on
2006 figures, and is split by property category in
Figure 18. The split and energy totals for each
individual property use are also available, but
because there are over 230 uses listed, it is not
possible to show graphically. From the broader
breakdown shown, it can be seen that industrial
energy accounts for nearly one third of total
commercial energy.
The main energy users in the services sector are
offices, hospitality and retail, which together make
up nearly 60% of commercial final energy. From
this analysis the four categories of businesses
mentioned should be the main targets of energy
initiatives in overall commercial energy savings.
When the total floor area (Figure 17) is compared
to the total energy used in each category, it gives
an idea of those with the highest and lowest
energy per meter squared floor area.
Figure 18: Total Final Commercial Energy by Property Category
Figure 19: Dublin City Electricity use in Commercial Sector by
Category
Figure 19 and Figure 20 show which business
categories use the most electricity and fossil fuels.
These charts are representative of the CIBSE
energy benchmark fuel breakdown, and before the
national fuel split is applied for fossil fuels
breakdown10. Retail outlets hold the highest share
of electricity usage, and only contribute 11% to
overall fossil fuel use.
Figure 20: Dublin City Commercial Fossil Fuel Use by Property
Category
10 The industrial split of electricity and fossil fuels is taken from
national figures from the beginning, as the CIBSE benchmarks
do not give any fuel breakdown for this building category

Dublin City Sustainable Energy Action Plan – Monitoring and Progress Report
- 22 -
This is likely due to the widespread use of electric
air heating/cooling ventilation systems and high
volume of lighting required in retail units. Industrial
building and process related energy use a high
share of both electricity and fossil fuel use. The
main industrial property uses in Dublin City are
factories, stores, workshops and warehouses. There
are six data centres also listed under industrial
uses. From this analysis, the top three energy users
in the industrial sector are a large factory, a
pharmaceutical plant, and a flour mill. The biggest
energy users in the services sector are hospitals,
hotels and large entertainment theatres11.
Figure 21: Dublin City Industrial Energy by Fuel Type
11 Theatre energy use is probably over estimated as the
occupancy rate would be much lower than other service types,
but as stated in the methodology, the occupancy rates cannot
be adjusted
Figure 22: Dublin City Service Sector Energy by Fuel Type
For the purposes of the Covenant of Mayors
requirements, the fuel used has been broken down
further, using the national level fuel split for the
industrial and services sectors respectively, as seen
in Figure 21 and Figure 22. In the case of the
service sector fuel breakdown, the electricity figure
calculated using CIBSE energy figures is used, and
only the remaining energy is split according to
national figures. The service sector is dominated by
electricity and heating oil, which together make up
over two thirds of the fuel used.
Natural gas makes up the majority of the
remaining fuel, but if the fuel split used was
specific to Dublin and not a national statistic, then
gas would probably hold a larger share than
heating oil, due to the prevalence of the gas grid
in the city. Unfortunately there is no data available
specific to Dublin City.
The industrial sector fuel split has a much lower
percentage of oil use, and instead uses a lot more
coal, LPG, and has a 7% use of biomass12.
12 Biomass includes the use of non-renewable waste as a fuel

Dublin City Sustainable Energy Action Plan – Monitoring and Progress Report
- 23 -
Indicators
There are indicators which can now be taken from
this analysis and used to monitor the SEAP
implementation in the commercial sector. There are
not as many indicators available for this sector due
to the lack of in-depth energy data available
specifically for Dublin City, but examples of
indicators which are available are;
Percentage of final energy consumption
from fossil fuel sources = 60%
Annual energy use per meter squared floor
area = 342 kWh/m2
Percentage of final industrial energy
consumption provided by coal = 6%
Results: Dublin City Monitoring Energy and Emissions Inventory for Commercial Sector
Table 2: Dublin City Commercial Monitoring Emissions Inventory; Final Energy and CO2 Emissions
Comparison of BEI and MEI
Methodologies
The methodology used for the 2006 BEI
calculations involved using census data to establish
the number of people working in each activity in
Dublin City, and coupling this with national figures
for energy consumption per employee working in
the related employment activity. This differs a lot
from the methodology used in this report, as the
MEI is based on kWh per meter squared, and not
per employee. It was decided to change to the
methodology used in the MEI as calculation by
meter squared floor area is also the basis for the
residential sector calculations, and this was the
original approach taken in the BEI, but was not
possible due to the lack of data available at the
time. Now, with the improved data from the
Valuation Office, the new methodology is greatly
improved in accuracy and also easier updated.
Also, the split into services and industrial activities
used in the 2006 BEI methodology cannot be
replicated in the MEI methodology. It is therefore
hard to compare these figures as they are based
on completely different data sources and
calculation methods, however, the figures should
represent commercial energy use from the
respective years with some degree of accuracy. It
is fair to say that a large part of the percentage
change in commercial energy from 2006 to 2011
is likely due to the disparity between the
methodologies, and therefore the percentage
decrease in energy levels is likely to be smaller in
reality. In saying this, other indicators mentioned
earlier such as GDP and unemployment rates show
that there would have been a substantial impact on
energy use in this sector between 2006 and 2011,
and so the percentage drop in energy should still
be significant.
Natural
gasLiquid gas
Heating
oilCoal
Other
fossil
fuels
Biofuel Other
biomassGeothermal
840,976 552,979 20,737 846,749 - - - 55,298 6,912 2,323,651
146,765 112,232 17,806 73,742 25,900 - 899 28,598 - 405,941
987,741 665,211 38,543 920,491 25,900 - 899 83,895 6,912 2,729,592
410,901 111,702 4,755 236,243 - - - 1,382 - 764,983
71,709 22,671 4,083 20,574 8,821 - 258 715 - 128,831
482,610 134,373 8,838 256,817 8,821 - 258 2,097 - 893,814 Total CO2
Industry CO2 Emissions (t )
Total
Industry Energy (MWh)
Services CO2 Emissions (t )
Services Energy (MWh)
Commercial SectorElectricity
Fossil fuels Renewable Energies
Total Energy

Dublin City Sustainable Energy Action Plan – Monitoring and Progress Report
- 24 -
Transport
There have been many improvements to the
sustainability of the transport system both nationally
and in Dublin. In 2008, the national vehicle road
tax system was revised so that it is now based on
CO2 emissions per kilometre rather than engine
size. This has had a significant impact on new cars
registered nationally since 2006; around 20% of
new cars were rated in the A and B CO2 based
road tax bands in 2006, whereas in 2011, over
90% of new cars registered were A and B classed
(SEAI, 2012, p. 67).
The national average fuel consumption of new cars
dropped 19% for petrol and 21% for diesel cars in
the same period (SEAI, 2012, p. 70). There has
been a major change in the ratio of petrol to diesel
cars registered, with a 74% petrol to 25% diesel
split in 2006, changing to 27% and 71%
respectively in 2011 (CSO, 2012), driven by the
economic benefits of diesel over petrol fuel use.
The overall number of new cars registered
nationally has dropped dramatically from 173,273
to 86,932, a decrease of 50% (CSO, 2012). The
total number of electric, hybrid, and biofuel
vehicles equate to less than 0.6% of the national
fleet in 2011 (DTTAS, 2011).
As stated in the introduction of this report, the
national road freight tonne-kilometres travelled has
decreased by 43% from 2006 to 2011 (CSO,
2011), which will have a large impact on the
energy and emissions from this sector. The Cycle to
Work scheme introduced by the government in
2009 resulted in over 90,000 bicycles bought in
its first 2 years (Shanahan, 2011).
In Dublin City, the DublinBike rental scheme was
launched by Dublin City Council in 2009, with
huge success. There are 44 bike stations in the
city, over 31,000 active long-term subscribers and
over five million journeys have been made on the
bikes since the launch (DublinBikes, 2013). In
2011, 1.5 million journeys were made on
DublinBikes, an increase of 26.7% compared to
2010 (CSO, 2012).
There were extensions of the LUAS tram system,
with the red line extending by 5km and the green
line by nearly 8km from 2006-2011 (CSO, 2012).
The RPA, who run the LUAS services, have
implemented a range of ongoing sustainability
actions which have so far seen their electricity
usage for trams reduced by 15.3% from 2010 to
2011 (RPA, 2011). Irish Rail has reduced their
total energy usage by 34% from 2007 to 2012,
giving savings of over €16m (Irish Rail, 2013).
The number of passengers on scheduled Dublin
City bus services dropped 20% from 146,292 in
2006 to 116,958 in 2011 (CSO, 2012).
Passenger numbers on national Irish Rail services
have also dropped by 18% from 2007 to 2011
(Iarnrod Eireann, 2011). The number of private
cars licensed in Dublin County grew by only 5%
between 2006 and 2011, and there was a large
decrease in the number of new vehicles registered
each year, as seen in Figure 23.
Figure 23: New Vehicles Registered in Dublin 2001 to 2011
The amount of traffic congestion on Dublin City
roads has reduced since the economic recession
(RPA, 2011), and this has had the adverse effect of
increasing the use of private cars in the city. There
has therefore been a slight modal switch from
certain public transport services to other means,
mainly private cars, cycling and walking. There
are 188km of national routes (motorways, dual
carriageway, single national roads) in Dublin
County, 42km of which are in Dublin City (CSO,
2012).
Methodology
The methodology involved in the transport sector is
much more complicated than other sectors due to
numerous different forms of transport used in
Dublin City and the differing associated energy use
for each mode. There is no data available that
accounts for all kilometres travelled by all modes of
traffic entering and leaving the region of Dublin

Dublin City Sustainable Energy Action Plan – Monitoring and Progress Report
- 25 -
City in 2011. Therefore it must be estimated based
on the best available data. In this case, the main
sources of information were the National Transport
Authority’s (NTA) National Household Travel
Survey 2012 and the Census population figures for
2011.
The travel survey results and special tabulations
specifically for Dublin and Dublin City were
provided by the NTA13. The travel survey provides
the mode of travel, the purpose of the trip, and the
distance travelled by those surveyed in Dublin. The
census provides the total number of people in
Dublin travelling to work or education and by
mode of travel, and the total population over the
age of 4 (Central Statistics Office, 2012).
Combining these two sets of data allowed the
calculation of total annual passenger kilometres
and total annual passenger journeys by each mode
of passenger transport.
The totals for both Dublin City and Dublin County
are calculated for two reasons; i) when the survey
results are narrowed down to the smaller region of
Dublin City alone, the number of observations
decline and therefore figures can become
unreliable, and ii) the previous BEI was calculated
based on figures for the entire Dublin County and
then divided by percentage population to obtain
Dublin City figures, so the same has been applied
here in order to increase comparability with the BEI
results.
There were 472 households surveyed in Dublin
City and 642 in the rest of Dublin County, with
over 14,000 trips recorded altogether (Mc Cabe,
2013). The methodology used here only accounts
transport energy used by the population of Dublin
City, and therefore excludes visitors. In order to
show how representative the travel survey results
are, Figure 24 shows a comparison of the
economic status (which will have the greatest
influence on travel frequency and mode) of the
survey participants versus the total census
population of Dublin City. There is high correlation
in the share of each status grouping, with slightly
more travel survey participants retired or working
at home, and slightly less working and attending
education. This high correlation suggests the travel
survey is fairly representative of the travel habits of
the population of Dublin City.
13 Source: (Mc Cabe, 2013)
Figure 24: Economic Status of Dublin City Census Population
Vs. Travel Survey Participants
To place an energy figure on to the total annual
passenger kilometres/journeys, an energy figure
for each mode of transport was obtained from a
variety of sources. Energy figures for Dublin Bus,
Irish Rail’s DART and Intercity services, and LUAS
were calculated in kWh/passenger journey, taken
from various online reports and email
correspondences14. The average fuel usage, in
litres/100km, for petrol and diesel cars by year of
manufacture is applied to the national age profile
of the car fleet to obtain an overall average
kWh/km energy usage of petrol and diesel cars15.
A city driving factor of 1.4 is applied to account
for less efficient driving in Dublin City16. Factors
are also applied to allow for the number of
passengers in each private car and taxi17. The
kWh/km energy usage by engine size for
motorbikes is taken from ‘Conversion Factors for
UK Reporting’, and applied to the Irish motorbike
fleet by engine size18. Fuel data for vans and
LGV’s was taken from the UK Dept. of Transport’s
‘Van Fuel Data’ online database19.
For freight transport, the main source of data was
the Road Freight Transport Survey 2011 (CSO,
2011). The tonne-kilometres travelled which
originate in Dublin were taken directly from the
report, and the energy is applied by calculating
energy/tonne-km. The kWh/tonne-km is calculated
14 Sources: (RPA, 2011) (Dublin Bus, 2013) (Irish Rail , 2011) 15 Sources: (CSO, n.d.) (DTTAS, 2011) 16 Same city driving factor as was applied in BEI transport
sector 17 Sources: (DEFRA UK, 2010) (Central Statistics Office, 2012) 18 Sources: (DEFRA UK, 2010) (DTTAS, 2011) 19 Source: (Dept. Transport UK, n.d.)

Dublin City Sustainable Energy Action Plan – Monitoring and Progress Report
- 26 -
using the total energy for road freight nationally in
2011, taken from the SEAI’s Energy in Ireland
1990-2011 report (SEAI, 2012), divided by total
tonne-km travelled nationally in 2011. Aviation
and port traffic are not included due to the
complicated nature of the calculations and difficulty
of assigning energy used specifically for Dublin
City. Rail freight energy figures are not included
due to lack of data available from Irish rail.
Municipal energy used for transport was taken
directly from the Dublin City Council energy
monitoring database.
Analysis
Firstly, the results of combining the travel survey
data and the census have produced the total
number of passenger journeys and passenger
kilometres, by mode of travel, as seen in Figure 25
and Figure 26. There were 468 million passenger
journeys taken in Dublin City in 2011, totalling
nearly 3 billion passenger kilometres travelled.
Over half of all trips taken were by private car,
and nearly a quarter by foot.
12% of all passenger kilometres travelled use no
fuel and create no carbon emissions. The Dart and
LUAS public transport systems are electrically
fuelled and all other modes of vehicular passenger
transport are petrol or diesel fuelled. 12% of
passenger journeys and 17% of passenger
kilometres travelled are by means of public
transport.
Figure 25: Number of Passenger Journeys in Dublin City by
Mode of Travel
Figure 26: Total Passenger Kilometres in Dublin City by Mode
of Travel
The overall number of passenger journeys has not
changed significantly, only a small increase of less
than 1%, but there has been a modal shift. Table 3
shows a comparison of 2006 and 2011 figures for
most modes of passenger transport20.
Table 3: Comparison of Passenger Journeys in Dublin City by
Mode 2006 to 2011
The largest modal change has been the increased
use of bicycles in the city, with an increase of 82%
on 2006 figures. This is largely due to the
previously mentioned Cycle to Work and Dublin
Bikes schemes, and the introduction of new cycle
pathways throughout the city. There has been an
increase in pedestrian journeys, from 95 to 108
million, and a 13% increase in private car
journeys. These increases have been offset by a
decrease in most public transport modes, with
commuter train journeys the only public transport
mode not adversely affected. Encouraging the
further use of public transport over private car use
should be the first target of further actions in this
20 There are no passenger journey figures for van & motorbike
modes from 2006 analysis.
Mode 2006 2011 Change
Pedestrian 95 108 13%
Bicycle 10 18 82%
Car 239 271 13%
Taxi 12 6 -48%
Bus 74 39 -48%
Luas 11 6 -46%
Dart 9 4 -53%
Commuter Train 5.6 6 7%
Total 456 458 0.5%
Number of Passenger Journeys (millions)

Dublin City Sustainable Energy Action Plan – Monitoring and Progress Report
- 27 -
sector. In terms of energy use, the switch to
walking and cycling has helped to reduce total
transport energy consumption.
It seems that independent means of transport such
as walking, cycling and driving are chosen over
public transport, and this could be due to numerous
issues such as costs and reliability. The fact that the
vast majority of passenger kilometres travelled are
by private car means there should be further
regulations introduced to discourage their use in
the city. An example of such regulation is the
Congestion Charge zone which has been
implemented successfully in London, and resulted in
a 6% increase in bus passengers (Transport for
London, n.d.).
Figure 27: Fuel Split in Dublin City Transport Sector21
Other sources of transport energy have also been
included in this analyses which are not passenger
related. There was over 1TWh of energy use in the
road freight sector in Dublin City in 2011. There
are 27GWh of energy use recorded for the Dublin
City Council (DCC) fleet. When all energy used in
the transport sector is amalgamated the resulting
fuel usage split shows the vast majority, nearly two
thirds of fuel used, is diesel, as seen in Figure 27.
Diesel emits 7% more CO2 per MWh than petrol22,
but has a better fuel economy than petrol, so
overall both fuels have practically identical CO2
emissions per kilometre23.
21 The term ‘Gasoline’ is used for Covenant of Mayors
purposes, but can also be called ‘Petrol’ 22 Based on CO2 emission factors given by the Covenant of
Mayors SEAP calculation template 23 Calculated using the average fuel usage in a new car in
2011
The biofuel use in transport is that used by the DCC
fleet. All electricity use is for LUAS and Dart
operations; the share of private electric and hybrid
vehicles in the Dublin fleet is so small they were not
included when calculating private car fuel usage.
Figure 28: Energy Split in Dublin City Transport Sector by Mode
Figure 29: Energy Split in Dublin City Transport Sector by
Category
The vast majority of energy use in this sector is for
freight and private car transport, as seen in Figure
28. Overall, private and commercial activities in
the transport sector amount to 88% of all energy
expended, as seen in Figure 29. Public transport
only accounts for 11% of energy use, and the
second highest mode of passenger transport,
walking, uses no fuel energy.

Dublin City Sustainable Energy Action Plan – Monitoring and Progress Report
- 28 -
Indicators
There are many indicators which can now be used
to easily monitor the progress of the SEAP in the
transport sector. Examples of these are;
Number of annual public transport
journeys = 61 million
Number of annual passenger journeys by
private car = 271 million
Percentage of fuel used by municipal fleet
which is renewable = 3%
Percentage of total journeys by bicycle =
4%
Results: Dublin City Monitoring Energy and Emissions Inventory for Transport Sector
Table 4: Dublin City Transport Monitoring Emissions Inventory; Final Energy and CO2 Emissions
Comparison of BEI and MEI
Methodologies
Both the MEI and the BEI methodology used the
travel survey results for pedestrian and cycling
journeys. The BEI used total passenger journeys
given by LUAS, Dublin Bus and Irish Rail, allocated
all to Dublin County, and then divided this by the
population of Dublin City to achieve figures for the
city alone. The MEI has instead used the travel
survey to calculate the number of passenger
journeys for these public transport modes, for the
reason that all passenger journey numbers
(walking, cycling, car, taxi, bus, etc.) would all be
from the same data source and therefore be easier
to update and would correlate better with one
another. In order to achieve greater comparison to
the 2006 BEI figures, the MEI also calculated the
journeys for all of Dublin County and then divided
by population of the city.
To ensure this method is reasonably accurate, a
comparison has been made to the total number of
passenger kilometres given by LUAS for 2011, and
the results show there is only a 7% difference
between the figures24.
A fraction of this 7% difference will be due to
visitors from outside Dublin, who would not have
been analysed in the travel survey, but use the
LUAS when visiting Dublin. This comparison shows
that there is a slight disadvantage to using the
24 Actual Kilometres travelled by passengers in 2011 by LUAS
138 million km (DTTAS, 2011), and kilometres by LUAS
calculated in this report is 149million km.
Renewable
Energies
Diesel Gasoline
Other
fossil
fuels
Biofuel
- 25,767 489 10 815 27,081
10,887 266,431 12,179 - - 289,497
- 1,508,408 916,618 - - 2,425,025
10,887 1,800,606 929,285 10 815 2,741,604
- 6,880 122 3 234 7,238
5,320 71,137 3,033 - - 79,489
- 402,745 228,238 - - 630,983
5,320 480,762 231,392 3 234 717,710
Public transport CO2 Emissions (t )
Private & Commercial Transport CO2 Emissions (t )
Total CO2
Fossil fuels
Electricity Total
Public transport Energy (MWh)
Private & Commercial Transport Energy (MWh)
Total Energy
Transport Sector
Municipal fleet Energy (MWh)
Municipal fleet CO2 Emissions (t )

Dublin City Sustainable Energy Action Plan – Monitoring and Progress Report
- 29 -
travel survey because it is based only on residents
of Dublin, and the passenger kilometres calculated
in the MEI are probably lower than reality when
visitors are accounted for.
In the 2006 BEI, private car and taxi journeys were
calculated based on the number registered in
Dublin multiplied by the average mileage of
vehicles from national car test data, and an
average fuel consumption calculated on cars
bought during the year 2000 applied. The
problem with this is, firstly, the total number of
vehicles used in the calculation is for vehicles
registered in Dublin, even though they may never
travel or travel very little inside Dublin County, and
the national average mileage applied will be
higher than that of vehicles used in Dublin.
Secondly, the distance travelled by car in 2006 is
based only on vehicles which have had to have a
national car test, and this figure is then applied to
a fuel consumption which is not representative of
the entire vehicle fleet. The total kilometres travelled
in 2011 by car is again taken from the travel
survey, and is seen to be more accurate than the
BEI methodology aforementioned. This change in
methodology means that there will be a part of the
decrease in energy used by private cars which is
due to this change, which, when looked at in
perspective, is a very small percentage of the total
transport energy calculation.
The methodology used to calculate freight energy
consumption is the same in both BEI and MEI. The
methodology used to calculate energy consumed
by the municipal fleet in the BEI was an estimate,
whereas now, for the MEI, we have exact data
from the DCC energy database. Therefore the
older BEI figures used are not comparable to the
new MEI figures, and the following section of this
report will show the actual 2006 municipal fleet
figures for an accurate comparison.

Dublin City Sustainable Energy Action Plan – Monitoring and Progress Report
- 30 -
Municipal
Since 2011, public sector bodies in Ireland are
required to report annually on their energy use,
and actions taken to reduce energy consumption
and emissions. This monitoring and reporting is
submitted to the SEAI’s online database, where
they can track the progress being made to 2020
targets of 33% reduction in the public sector. The
results of this monitoring and reporting can be seen
in Table 5.
Table 5: Dublin City Council Energy Consumption by Fuel,
2006-2011
These are actual energy figures accumulated by the
city council. The figures for municipal energy use
from the originally submitted 2006 BEI are not
used in this comparison as, because of the new
monitoring energy system, the figures are now real
instead of estimated, and the BEI figures will be
replaced by these new figures.
Between 2006 and 2011, there has been an
overall reduction of 22% energy consumed by the
municipality in buildings, facilities, public lighting,
and council fleet. This means Dublin City Council
are well on their way to meeting the overall 33%
reduction by 2020. DCC have successfully
integrated renewable energy as a fuel for energy
supply, with 120 MWh of heating coming from
solar technologies in 2011. Other renewable
sources of energy are landfill gas, hydro power (at
waterworks) and a small amount of wind.
There has been a huge decrease in the amount of
heating oil used, which has dropped 72%. Other
fossil fuel consumption, such as gas and diesel, has
also decreased. Overall there has been a drop in
CO2 emissions from 65271t to 55948t over the 5
year period, which is a 14% decrease. The use of
marked diesel has doubled in the same period. To
curb this trend, the use of marked diesel should be
investigated and reduced, and where possible
replaced by other cleaner fuel sources25.
Figure 30: Dublin City Council Energy Consumption (MWh) by
Sector 2006-2011
Figure 30 shows the different sectors within the
municipality and their respective energy
consumption. Council buildings and facilities used
over 153 GWh in 2006, which has been reduced
by 28% to just under 110 GWh in 2011.
Buildings and facilities together used two thirds of
the total municipal energy consumption in 2011.
Energy for public lighting26 has increased by 5% in
the same period. The council vehicle fleet has
reduced fuel consumption by 13%.
25 Marked diesel is used for generators, mobile plant,
agricultural and construction machinery. 26 Includes traffic lights.
Fuel 2006 2011 % Change
Electricity 68799 70432 2%
Natural Gas 102483 64840 -37%
Heating Oil 9464 2622 -72%
Diesel 30687 25767 -16%
Petrol 479 489 2%
Marked Diesel 5 10 128%
Solar (Thermal) 0 120 N/A
Non-Fuel/Landfill Gas RE 0 1009 N/A
Biofuels 0 815 N/A
Total 211916 166104 -22%
Energy Consumption MWh/yr

Dublin City Sustainable Energy Action Plan – Monitoring and Progress Report
- 31 -
The highest share of fuel used by DCC is electricity
at 43%, followed by gas at 39%, as seen in Figure
31. Solar and biofuel energy together only amount
to just over half a percent of the total fuel used.
This analysis shows the main target area for further
reductions in DCC energy consumption is in
electricity and gas use in buildings and facilities,
and increasing the use of renewable energy
sources.
Figure 31: Dublin City Council Breakdown of Fuel Consumption
2011
Results: Dublin City Monitoring Energy and Emissions Inventory for Municipal Sector
Table 6: Dublin City Council's Monitoring Emissions Inventory; Energy and CO2 Emissions
Natural
gas
Heating
oilDiesel Gasoline
Other fossil
fuelsBiofuel
Solar
thermal
42,407 64,840 2,622 - - - - 120 109,988
29,035 - - - - - - - 29,035
- - - 25,767 489 10 815 - 27,081
71,441 64,840 2,622 25,767 489 10 815 120 166,104
20,720 13,098 732 - - - - - 34,549
14,186 - - - - - - - 14,186
- - - 6,880 122 3 234 - 7,238
34,906 13,098 732 6,880 122 3 234 - 55,974
Total Energy(MWh)
Municipal Buildings/Facilit ies (MWh)
Public Lighting (MWh)
Municipal Fleet (MWh)
Fossil fuelsMunicipal Sector Electricity
Municipal Fleet CO2 (t )
Total CO2 (t )
Municipal Buildings/Facilit ies CO2 (t )
Public Lighting CO2 (t )
Total
Renewable energies

Dublin City Sustainable Energy Action Plan – Monitoring and Progress Report
- 32 -
Summary of Monitoring Report
The overall energy consumption and emissions for
Dublin City have decreased substantially over the 5
year period analysed. This decrease has been due
to numerous factors, such as energy awareness,
higher energy efficiency (lighting, cars, white
goods, boilers etc.), economic recession, energy
grants, increased regulation, and reduced CO2
levels in the electricity supply. It can be difficult to
place exact figures on how much each of these
actions have had on overall energy figures, as
some, like awareness and education campaigns,
can only be described qualitatively.
Data Sources
The data which is now available for calculating the
MEI is far superior in accuracy to the previous
methodologies used in the BEI. A comparison has
been made between both methodologies, and
there are differing degrees of disparity between the
methodologies used in each sector.
The new municipal energy figures are
actual monitored energy figures, and can
now be easily monitored and updated in
the future.
The residential sector uses actual BERs
from a public database, and can again be
easily updated at any time.
The commercial sector methodology is the
best available, but there needs to be more
publicly available energy data for this
sector in order to gain greater accuracy.
Transport is the most difficult sector to
account for, as there are so many different
types of road and rail users, which means
multiple data sources need to be
amalgamated, and thus, it is not as easily
updatable as the other sectors.
A difficulty for all sector’s energy monitoring
(except municipality sector) is the availability of the
same data sources in the future, as majority are
from outside agencies.

Dublin City Sustainable Energy Action Plan – Monitoring and Progress Report
- 33 -
Action Report
The tables27 on the following pages show the
complete, ongoing and planned actions which
have a direct impact on the energy and emissions
of Dublin City. As much detail as possible has
been included in these tables, including estimated
costs, energy savings and CO2 reductions. For
many of the actions it has not been possible to
attribute figures for every category listed. For
example, the extensions to the LUAS system have
added to the number of passengers using this
mode of transport, but it is hard to translate this
figure into energy savings as it would require many
assumptions about the mode of travel these
passengers would have taken had they not
decided to use the new LUAS services. It is also
near impossible to put an exact figure on the
overall costs and energy savings involved in the
roll out of national building energy regulations,
however, as shown in the analysis of the residential
sector, dwellings built after the introduction of such
regulations do consume less energy, and so there
is evidence of direct energy savings.
There are many sustainable energy initiatives
which have had huge success in Dublin City. From
the analysis of the transport sector in the previous
chapter we can see that there has been a large
increase in the number of citizens choosing to
cycle in the city. This is directly linked to many
local and national actions dedicated to make
cycling a popular choice for commuting in the city,
such as the Dublin Bikes scheme. This bike rental
scheme was introduced in 2009 by Dublin City
Council, and now has over 36,000 long term
subscribers (Kelly, 2013). There have been over 6
million journeys taken on the 450 bicycles
provided since the scheme was introduced, and its
popularity has meant the council are now planning
and building a larger network of stations (Kelly,
2013). Dublin City Council have also opened new
cycle routes, offer free secure parking for bikes in
city centre car parks and have a website dedicated
to cycling in the city (Dublin City Council, 2013).
The Department of Transport’s Cycle to Work
scheme, introduced in 2009, is a tax incentive
scheme which has seen 90,000 new bikes being
used to commute to work in Ireland. These actions,
27 CO2 estimates in these tables are based on the energy
savings calculated with 2011 electricity and gas emission
factors
combined with knock-on effects of other actions
such as road safety, have greatly contributed to the
sustainability of Dublin’s transport sector.
In the residential sector, the SEAI’s Greener Energy
Homes grant scheme led to the installation of over
2750 renewable energy systems in Dublin alone
from 2006 to 2011. These systems, when
combined, are estimated to provide over 23,000
MWh of heat per year (Codema, 2013). The
highest uptake of the SEAI’s Better Energy Homes
scheme, so far, is in Dublin, where over 33,000
applications have been approved. This scheme
provides grants for home owners to make
improvements to their heating systems and
insulation to increase energy efficiency for space
heating requirements. The overall energy savings
from such initiatives have had a substantial impact
on the energy consumed in the residential sector.
The following tables contain sustainable energy
actions divided into relevant sectors. Although
there has been an effort to try to include all actions
relating to Dublin City energy, there are
undoubtedly actions, mainly in the private sector,
which have been overlooked.

D
ublin
City
Sust
ain
able
Energ
y A
ctio
n P
lan –
Monitoring a
nd P
rogre
ss R
eport
- 3
4 -
Table
s of A
ctio
ns
* =
Com
ple
te (C
) O
ngoin
g (O
) Pla
nned (P) *
* =
Exa
ct q
uantity
unkn
ow
n
*** =
Calc
ula
tions
in p
rogre
ss *
*** =
Cannot be c
alc
ula
ted for
this
act
ion
Est
ima
ted
Co
st (
€)
Energ
y
Sa
vin
gs
MW
h/
a
RE
pro
ducti
on
MW
h/
a
CO
2
red
ucti
on
(t)/
a
Sw
itch O
ff C
am
paig
nSuzanne M
org
an,
Codem
a2
00
9-2
01
1C
Ele
ctrici
ty D
em
and
Aw
are
ness
/Educa
tion
Local
12
,50
0
1
06
N/A
52
Dis
pla
y Energ
y C
ertific
ate
sBrian C
onnolly
, C
odem
a2
00
9-2
02
0O
Ele
ctrica
l/H
eat D
em
and in B
uild
ings
Regula
tion
Local
***
****
****
****
Kilb
arr
ack
Fire S
tatio
n -
Sust
ain
abili
ty P
ilot
Fire
Dept.,
DC
C2
00
9-2
01
2C
Carb
on N
eutral
Financi
al
Local
16
3,2
15
6
35
**
17
2
Civ
ic O
ffic
es
energ
y upgra
de
Corp
ora
te S
erv
ices,
DC
C2
00
9-2
01
2C
Lightin
g &
Serv
er
Virtu
alis
atio
nFi
nanci
al
Local
31
3,3
06
8
87
N/A
43
4
Centralis
ed E
nerg
y D
ata
base
Joe
Hayd
en,
Codem
a2
00
9-2
01
0C
Utilit
y Ratio
nalis
atio
nFi
nanci
al
Local
***
****
****
****
Mansi
on H
ouse
Refu
rbis
hm
ent
City
Arc
hite
cts,
DC
C2
01
0-2
01
2C
Ele
ctrica
l/H
eat D
em
and in B
uild
ings
Financi
al
Local
32
7,0
00
1
23
N/A
33
Fairvi
ew
Park
Sports
faci
lity
City
Arc
hite
cts
20
11
-20
12
CH
eat D
em
and R
educt
ion/RE
Financi
al
Local
**
**
8.6
52
Thin
k Energ
y A
ware
ness
Cam
paig
nV
ere
na W
agner,
Codem
a/D
CC
20
13
-20
14
O
Ele
ctrici
ty D
em
and
Rais
ing A
ware
ness
Local
9,4
01
***
N/A
***
Energ
y Perform
ance
Contract
ing in L
eis
ure
Cente
rsJo
e H
ayd
en,
Codem
a2
01
3-
OEle
ctrica
l/H
eat D
em
and in B
uild
ings
EPC
Local
***
***
***
***
Dublin
City
Fire B
rigade
Fire
Dept.,
DC
C2
01
3-
OEle
ctrica
l/H
eat D
em
and in B
uild
ings
Financi
al
Local
***
***
***
***
Energ
y M
anagem
ent Sys
tem
in L
eis
ure
Cente
rsC
om
munity
and R
ecr
eatio
n,
DC
C2
01
4-
PEle
ctrica
l/H
eat D
em
and in B
uild
ings
Rais
ing A
ware
ness
Local
**
**
**
**
Hugh L
ane G
alle
ry
City
Arc
hite
cts,
DC
C2
01
4-
PEle
ctrica
l/H
eat D
em
and in B
uild
ings
Regula
tion
Local
***
***
***
***
SEA
I Exe
mpla
r Pro
ject
: Fo
ur
Seaso
ns
Hote
l Retrofit
Four
Seaso
ns
Hote
l2
01
3-
OEle
ctrica
l/H
eat D
em
and in B
uild
ings
EPC
Local
***
***
***
***
Bette
r Energ
y W
ork
pla
ces:
DC
U R
etrofit
DC
U/E3
Bure
au/SEA
I2
01
0C
Ele
ctrica
l/H
eat D
em
and in B
uild
ings
Financi
al
Local
11
6,2
16
(gra
nt)
85
1.7
**
23
1
Roya
l V
icto
ria E
ye a
nd E
ar
Hosp
ital
SEA
I/2
01
1C
Ele
ctrica
l/H
eat D
em
and in B
uild
ings
Financi
al
Local
33
0,0
00
1
34
5**
29
4
Build
ing R
egula
tions
20
08
Dept. o
f Envi
ronm
ent, C
om
munity
& L
ocal
Gove
rnm
ent
20
08
OEnerg
y Effic
iency
/RE in B
uild
ings
Legis
lativ
eN
atio
nal
****
****
****
****
Build
ing R
egula
tions
20
11
Dept. o
f Envi
ronm
ent, C
om
munity
& L
ocal
Gove
rnm
ent
20
11
OEnerg
y Effic
iency
/RE in B
uild
ings
Legis
lativ
eN
atio
nal
****
****
****
****
Sm
art M
ete
ring
CER
20
16
PEle
ctrica
l D
em
and in B
uild
ings
Info
rmatio
n/Educa
tion
Natio
nal
1,0
00
,00
0,0
00
***
***
***
Munic
ipa
l B
uil
din
gs,
eq
uip
ment/
facil
itie
s
Tert
iary
(no
n m
unic
ipa
l) B
uil
din
gs,
Eq
uip
ment/
Fa
cil
itie
s
Imp
lem
enta
tio
n
Sta
rt/
End
Tim
e
Resp
onsi
ble
Pers
on/
Dep
art
ment
Key A
cti
ons
Est
ima
ted
Im
pa
cts
of
Acti
ons
Ori
gin
Of
Acti
on
Po
licy I
nst
rum
ent
Are
a o
f In
terv
enti
on
Sta
tus*

D
ublin
City
Sust
ain
able
Energ
y A
ctio
n P
lan –
Monitoring a
nd P
rogre
ss R
eport
- 3
5 -
Est
ima
ted
Co
st (
€)
Energ
y
Sa
vin
gs
MW
h/
a
RE
pro
ducti
on
MW
h/
a
CO
2
red
ucti
on
(t)/
a
Energ
y Sm
art C
om
munity
pro
ject
Joe
Hayd
en,
Codem
a2
00
9-2
01
2C
Energ
y Effic
iency
/RE in B
uild
ings
Financi
al
Local
20
,22
0
**
**
**
Socia
l H
ousi
ng A
ctio
n P
lan
Joe
Hayd
en,
Codem
a/H
ousi
ng D
ept D
CC
20
09
-20
10
OEnerg
y Effic
iency
/RE in B
uild
ings
Financi
al
Local
****
****
****
****
Energ
y re
trofit of vo
id s
ocia
l housi
ng
Housi
ng D
ept, D
CC
20
09
-20
20
OEnerg
y Effic
iency
/RE in B
uild
ings
Regula
tion
Local
**
**
**
**
Min
imum
BER s
pec
for
New
Lease
housi
ng
Housi
ng D
ept, D
CC
20
09
-20
10
OEle
ctrica
l/H
eat D
em
and in B
uild
ings
Regula
tion
Natio
nal
**
**
**
**
House
of To
morr
ow
, Bunra
tty R
dEdel G
iltenane,
Codem
a/H
ousi
ng D
ept, D
CC
20
08
-20
09
CEle
ctrica
l/H
eat D
em
and in B
uild
ings
Exe
mpla
r Pro
ject
Local
86
9,3
46
5
54
44
11
9
House
of To
morr
ow
, York
Street
Edel G
iltenane,
Codem
a/H
ousi
ng D
ept, D
CC
20
07
-20
09
CEle
ctrica
l/H
eat D
em
and in b
uild
ings
Exe
mpla
r Pro
ject
Local
1,5
00
,00
0
**
**
**
Bally
mun R
egenera
tion,
Phase
4BRL/
DC
C2
00
9-2
01
2C
Energ
y Effic
iency
/RE in B
uild
ings
Land u
se p
lannin
gLo
cal
55
0,1
60
5
41
6**
**
Energ
y upgra
de,
Glo
ver
Court
City
Arc
hite
cts,
DC
C2
00
9-2
01
2O
Ele
ctrica
l/H
eat D
em
and in b
uild
ings
Financi
al (g
rant)
Local
***
***
***
***
Gre
ener
Energ
y H
om
es
Sch
em
eSEA
I2
00
6-2
01
1C
Renew
able
Energ
yFi
nanci
al (g
rant)
Natio
nal
74
,74
4,5
53
**
**
**
Low
Carb
on H
om
es
Sch
em
eSEA
I2
00
6-
CC
O2
Reduct
ions
Financi
al (g
rant)
Natio
nal
**
**
**
**
Best
Pra
ctic
e D
esi
gn for
Socia
l H
ousi
ng
SEA
I2
00
7-
OA
ware
ness
/Energ
y D
em
and
Info
rmatio
n/Educa
tion
Natio
nal
**
**
**
**
Boile
r Effic
iency
Cam
paig
nSEA
I2
00
8-
OH
eat D
em
and in B
uild
ings
Info
rmatio
n/Educa
tion
Natio
nal
**
**
**
**
Bette
r Energ
y H
om
es
Sch
em
eSEA
I2
00
9-
OH
eat D
em
and in B
uild
ings
Financi
al (g
rant)
Natio
nal
14
7,4
10
,00
0
**
**
**
Public
lig
htin
g e
nerg
y effic
iency
Engin
eering D
ept, D
CC
2
01
1-2
01
4
OEnerg
y Effic
iency
Fi
nanci
al
Local
***
***
***
***
Gre
en Innova
tion p
roje
ct
Joe
Hayd
en,C
odem
a/IN
TERREG
IV
B N
EW
20
10
-20
13
OO
ther
Info
rmatio
n/Educa
tion
Local
****
****
****
****
Roundw
ood W
ate
rwork
s 9
0kW
Hyd
ro-tu
rbin
eEngin
eering D
ept, D
CC
20
07
-20
09
CRES
Exe
mpla
r RE P
roje
ctLo
cal
**
**
***
**
Fr
Colli
ns
Park
, 5
X5
0kW
Win
d T
urb
ines
Park
s D
ept, D
CC
20
07
-20
09
CRE/lo
wer
carb
on e
mis
sions
Exe
mpla
r RE P
roje
ctLo
cal
1,1
50
,00
09
62
46
12
0
Sola
r PV
, Em
era
ld p
roje
ct,
Bally
mun
Sole
arth/C
LUID
20
09
-20
11
ORE/lo
wer
carb
on e
mis
sions
Financi
al
Local
**
**
**
**
Dublin
Dis
tric
t H
eatin
g s
chem
eEngin
eering D
ept, D
CC
20
11
-20
13
PC
O2
Reduct
ion/Fo
ssil
Fuel U
se R
educt
ion
Financi
al
Local
**
**
**
**
Poolb
eg W
ast
e W
ate
r Tr
eatm
ent ext
ensi
on
Engin
eering D
ept, D
CC
20
11
-20
14
CRE/lo
wer
carb
on e
mis
sions
Financi
al
Local
**
**
**
**
Loca
l Ele
ctr
icit
y P
rod
ucti
on
Key A
cti
ons
Resp
onsi
ble
Pers
on/
Dep
art
ment
Imp
lem
enta
tio
n
Sta
rt/
End
Tim
eS
tatu
s*A
rea
of
Inte
rventi
on
Po
licy I
nst
rum
ent
Ori
gin
Of
Acti
on
Est
ima
ted
Im
pa
cts
of
Acti
ons
Resi
denti
al
Buil
din
gs
Munic
ipa
l Pub
lic L
ighti
ng
Ind
ust
ries
Loca
l H
ea
t/C
old
Pro
ducti
on
Oth
er

D
ublin
City
Sust
ain
able
Energ
y A
ctio
n P
lan –
Monitoring a
nd P
rogre
ss R
eport
- 3
6 -
Est
ima
ted
Co
st (
€)
Energ
y
Sa
vin
gs
MW
h/
a
RE
pro
ducti
on
MW
h/
a
CO
2
red
ucti
on
(t)/
a
Dublin
Bik
es
Ext
ensi
on
JC D
ece
reux/
DC
C2
01
2-2
01
4O
Modal Shift
Sust
ain
able
Tra
nsp
ort P
lannin
g
Local
35
,00
0,0
00
**
N/A
**
Work
pla
ce T
rave
l Pla
ns
Em
ma C
olli
ns,
Codem
a/D
CC
20
09
-20
20
CM
odal Shift
Work
ing w
ith C
itizens
Local
**
****
N/A
****
Cyc
le O
ffic
er
DC
C2
00
8-2
02
0O
Modal Shift
Work
ing w
ith C
itizens
Local
**
****
N/A
****
Metro N
orth to D
ublin
Airport &
Sw
ord
sTr
ansp
ort 2
1/RPA
20
10
-20
14
PM
odal Shift
Sust
ain
able
Tra
nsp
ort P
lannin
g
Regio
nal
***
***
N/A
***
Metro W
est
orb
ital
Transp
ort 2
1/RPA
-P
Modal Shift
Sust
ain
able
Tra
nsp
ort P
lannin
g
Regio
nal
***
***
N/A
***
LUA
S L
ine A
1 –
City
West
Ext
ensi
on
Transp
ort 2
1/RPA
20
09
-20
11
CM
odal Shift
Sust
ain
able
Tra
nsp
ort P
lannin
g
Regio
nal
19
3,0
00
,00
0**
N/A
**
LUA
S L
ine B
1 –
Sandyf
ord
to C
herr
ywood
Transp
ort 2
1/RPA
20
08
-20
10
CM
odal Shift
Sust
ain
able
Tra
nsp
ort P
lannin
g
Regio
nal
31
9,0
00
,00
0**
N/A
**
LUA
S L
ine B
2 –
Cherr
ywood to B
ray
Transp
ort 2
1/RPA
-P
Modal Shift
Sust
ain
able
Tra
nsp
ort P
lannin
g
Regio
nal
20
0,0
00
,00
0**
N/A
**
LUA
S L
ine B
XD
to B
room
bridge
Transp
ort 2
1/RPA
20
09
-20
14
OM
odal Shift
Sust
ain
able
Tra
nsp
ort P
lannin
g
Regio
nal
38
6,0
00
,00
0**
N/A
***
LUA
S L
ineC
1 –
Dockl
ands
Ext
ensi
on
Transp
ort 2
1/RPA
20
08
-20
09
CM
odal Shift
Sust
ain
able
Tra
nsp
ort P
lannin
g
Regio
nal
10
8,0
00
,00
0**
N/A
**
LUA
S L
ine F
to L
uca
nTr
ansp
ort 2
1/RPA
20
08
-P
Modal Shift
Sust
ain
able
Tra
nsp
ort P
lannin
g
Regio
nal
***
**
N/A
**
DA
RT
underg
round inte
rconnect
or
Transp
ort 2
1/RPA
20
11
-20
15
Defe
rred
Modal Shift
Sust
ain
able
Tra
nsp
ort P
lannin
g
Regio
nal
***
***
N/A
***
Iris
h R
ail
Energ
y Effic
iency
Measu
res
Iris
h R
ail
20
07
-20
12
CC
O2
Reduct
ion/Fo
ssil
Fuel U
se R
educt
ion
Financi
al
Regio
nal
**
26
6,6
00
N
/A
**
LUA
S S
ust
ain
abili
ty P
lan 2
01
1-2
01
5LU
AS E
nvi
ronm
enta
l Im
pact
Ste
ering G
roup
20
11
-20
15
OEle
ctrici
ty a
nd F
F U
se R
educt
ion
Sust
ain
able
Tra
nsp
ort P
lannin
g
Regio
nal
**
3,3
56
N
/A
15
74
Dublin
Bus
Energ
y Savi
ng Initi
ativ
es
Dublin
Bus
20
12
-O
Ele
ctrici
ty a
nd F
F U
se R
educt
ion
Energ
y M
anagem
ent
Regio
nal
***
21
,42
3
N
/A
**
Dublin
Bus
Bette
r Energ
y W
ork
pla
ces
20
11
Dublin
Bus/
SEA
I2
01
1C
Ele
ctrici
ty a
nd F
F U
se R
educt
ion
Energ
y M
anagem
ent
Regio
nal
92
,12
3 (
gra
nt)
13
,27
2
N
/A
**
Cyc
le to W
ork
Sch
em
eD
ept. o
f Tr
ansp
ort
20
09
-O
Modal Shift
Sust
ain
able
Tra
nsp
ort P
lannin
g
Natio
nal
34
,20
0,0
00
**
N/A
**
"Cyc
le D
ublin
" G
reenw
ays
for
cycle
route
sD
CC
20
13
-O
Modal Shift
Sust
ain
able
Tra
nsp
ort P
lannin
g
Regio
nal
**
**
N/A
**
Gre
en e
Motion:
EV
charg
ing infrast
ruct
ure
Suzanne M
org
an,
Codem
a/ D
ublin
Local
Auth
oritie
s/ESB/FP
72
01
0-2
02
0O
EV
Sust
ain
able
tra
nsp
ort
Local
***
***
***
***
Ele
ctric
Vehic
le G
rant Sch
em
eSEA
I/D
oT
20
11
-20
13
OEV
Sust
ain
able
Tra
nsp
ort P
lannin
g
Natio
nal
***
***
N/A
***
Eco
Drivi
ng C
am
paig
nSuzanne M
org
an,
Codem
a2
00
9-2
01
0C
CO
2 R
educt
ion/Fo
ssil
Fuel U
se R
educt
ion
Work
ing w
ith C
itizens
Local
92
50
86
3N
/A
**
Key A
cti
ons
Resp
onsi
ble
Pers
on/
Dep
art
ment
Imp
lem
enta
tio
n
Sta
rt/
End
Tim
eS
tatu
s*A
rea
of
Inte
rventi
on
Po
licy I
nst
rum
ent
Ori
gin
Of
Acti
on
Est
ima
ted
Im
pa
cts
of
Acti
ons
Pub
lic T
ransp
ort
Pri
va
te a
nd
Co
mm
erc
ial
Tra
nsp
ort
Munic
ipa
l Fle
et

D
ublin
City
Sust
ain
able
Energ
y A
ctio
n P
lan –
Monitoring a
nd P
rogre
ss R
eport
- 3
7 -
Monito
ring E
mis
sions
Inve
nto
ry
Ove
rvie
w o
f Fi
nal Energ
y C
onsu
mption
Na
tura
l
ga
sLi
quid
ga
sH
ea
ting
oil
Die
sel
Ga
soline
Lig
nit
eC
oa
lO
ther
foss
il
fuels
Pla
nt
oil
Bio
fuel
Oth
er
bio
ma
ss
Sola
r
therm
al
Geoth
erm
al
42407
064840
02622
00
00
00
00
120
01
09
98
9
840976
0552979
20737
846749
00
00
00
055298
06912
23
23
65
1
1182997
02989232
4697
294023
00
967
14798
40310
06
3557
00
45
30
58
7
29035
00
00
00
00
00
00
00
29
03
5
No
n-E
TS
146765
0112232
17806
73742
00
025900
00
899
28598
00
40
59
41
ETS
(no
t re
co
mm
end
ed
)0
00
00
00
00
00
00
00
0
22
42
17
90
37
19
28
34
32
40
12
17
13
60
09
67
40
69
84
03
10
09
05
87
45
21
20
69
12
73
99
20
2
00
00
025767
489
00
10
0815
00
02
70
81
10887
00
00
266431
12179
00
00
00
00
28
94
97
00
00
01508408
916618
00
00
00
00
24
25
02
5
10
88
70
00
01
80
06
06
92
92
85
00
10
08
15
00
02
74
16
04
00
00
00
00
00
00
00
00
22
53
06
60
37
19
28
34
32
40
12
17
13
61
80
06
06
92
92
85
96
74
06
98
40
32
00
17
20
87
45
21
20
69
12
10
14
08
06
Tert
iary
(no
n m
unic
ipa
l) b
uil
din
gs,
eq
uip
ment/
facil
itie
s )
Resi
denti
al
buil
din
gs
Pub
lic t
ransp
ort
TO
TA
L
Pri
vate
and
co
mm
erc
ial
tra
nsp
ort
Sub
tota
l
OTH
ER
B
UIL
DIN
GS
, E
QU
IPM
EN
T/
FA
CIL
ITIE
S A
ND
IN
DU
STR
IES
Munic
ipa
l b
uil
din
gs,
eq
uip
ment/
facil
itie
s
Sub
tota
l
Munic
ipa
l fl
eet
TR
AN
SPO
RT
Pub
lic l
ighti
ng
Ind
ust
ry
Secto
r
FIN
AL
EN
ERG
Y C
ON
SU
MPTIO
N [
MW
h]
Ele
ctr
icit
yH
ea
t/cold
Fo
ssil
fuels
Renew
ab
le e
nerg
ies
To
tal
Ag
ricult
ure
, Fo
rest
ry,
Fis
heri
es

D
ublin
City
Sust
ain
able
Energ
y A
ctio
n P
lan –
Monitoring a
nd P
rogre
ss R
eport
- 3
8 -
Ove
rvie
w o
f C
O2 E
mis
sions
Na
tura
l
ga
sLi
quid
ga
sH
ea
ting
Oil
Die
sel
Ga
soline
Lig
nit
eC
oa
lO
ther
foss
il
fuels
Pla
nt
oil
Bio
fuel
Oth
er
bio
ma
ss
Sola
r
therm
al
Geoth
erm
al
20720
013098
0732
00
00
00
00
00
34
54
9
410901
0111702
4755
236243
00
00
00
01382
00
76
49
83
578012
0603825
1077
82032
00
362
5040
11650
02
89
00
12
82
08
9
14186
00
00
00
00
00
00
00
14
18
6
No
n-E
TS
71709
022671
4083
20574
00
08821
00
258
715
00
12
88
31
ETS
(n
ot
rec
om
me
nd
ed
)0
00
00
00
00
00
00
00
0
10
95
52
90
75
12
95
99
15
33
95
81
00
36
21
38
62
11
65
00
26
02
18
60
02
22
46
39
00
00
06880
122
00
30
234
00
07
23
8
5320
00
00
71137
3033
00
00
00
00
79
48
9
00
00
0402745
228238
00
00
00
00
63
09
83
53
20
00
00
48
07
62
23
13
92
00
30
23
40
00
71
77
10
00
00
00
00
00
00
00
00
12
79
63
40
00
0
11
00
84
80
75
12
95
99
15
33
95
81
48
07
62
23
13
92
36
21
38
62
11
65
30
49
42
18
60
02
94
23
49
CO
2 E
mis
sio
ns
[t]/
CO
2 E
quiv
ale
nt
Em
issi
ons
[t]
Ele
ctr
icit
yH
ea
t/cold
Fo
ssil
fuels
Renew
ab
le e
nerg
ies
To
tal
Secto
r
Sub
tota
l
TR
AN
SPO
RT
Munic
ipa
l fl
eet
Pub
lic t
ransp
ort
OTH
ER
TO
TA
L
Pri
vate
and
co
mm
erc
ial
tra
nsp
ort
Sub
tota
l
OTH
ER
NO
N-E
NE
RG
Y R
ELA
TE
D
Wa
ste m
ana
gem
ent
Munic
ipa
l p
ub
lic l
ighti
ng
Ag
ricult
ure
, Fo
rest
ry,
Fis
heri
es
BU
ILD
ING
S,
EQ
UIP
MEN
T/FA
CIL
ITIE
S A
ND
IN
DU
STRIE
S
Munic
ipa
l b
uil
din
gs,
eq
uip
ment/
facil
itie
s
Tert
iary
(no
n m
unic
ipa
l) b
uil
din
gs,
eq
uip
ment/
facil
itie
s
Resi
denti
al
buil
din
gs
Wa
ste w
ate
r m
ana
gem
ent
Oth
er
no
n-e
nerg
y r
ela
ted
Ind
ust
ries

D
ublin
City
Sust
ain
able
Energ
y A
ctio
n P
lan –
Monitoring a
nd P
rogre
ss R
eport
- 3
9 -
Loca
l and D
istrib
ute
d E
lect
rici
ty a
nd H
eat Pro
duct
ion
Renew
ab
le
ele
ctr
icit
y
pro
duced
[MW
h]
CO
2 e
mis
sio
n
facto
r [t
/M
Wh
pro
duced
]
CO
2 /
CO
2
eq
.
em
issi
ons
[t]
47
30
0
54
00
0
66
00
65
12
00
75
91
0
Loca
l re
new
ab
le e
lectr
icit
y p
lants
(exclu
din
g l
arg
e-s
ca
le p
lants
> 2
0
MW
e)
Win
d
Hyd
roele
ctr
ic
Pho
tovo
lta
ics
TO
TA
L
Geo
therm
al
Tota
l
from
renew
ab
le
sourc
es
Na
tura
l g
as
Liq
uid
ga
sH
ea
ting
oil
Lig
nit
eC
oa
lFoss
il
sourc
es
Renew
ab
le
sourc
es
14
20
00
0153777
07323
02092
00
2092
00
33
81
95
2
00
00
00
00
00
00
00
14
20
00
01
53
77
70
73
23
02
09
20
02
09
20
03
38
19
52
Co
mb
ined
Hea
t a
nd
Po
wer
Oth
er
TO
TA
L
Loca
l ele
ctr
icit
y p
rod
ucti
on p
lants
(exclu
din
g E
TS
pla
nts
and
la
rge-
sca
le p
lants
> 2
0 M
W)
Ele
ctr
icit
y p
rod
uced
[MW
h]
E
nerg
y c
arr
ier
inp
ut
[MW
h]
CO
2 /
CO
2 e
q.
em
issi
ons
[t]
Foss
il f
uels
Wa
ste
Pla
nt
oil
Oth
er
bio
ma
ss
Oth
er
renew
ab
leO
ther
Tota
l
from
renew
ab
le
sourc
es
Na
tura
l g
as
Liq
uid
ga
sH
ea
ting
oil
Lig
nit
eC
oa
lFoss
il
sourc
es
Renew
ab
le
sourc
es
24
20
00
0261836
012468
03562
00
3562
00
57
58
38
9
00
00
00
00
00
00
00
00
00
00
00
00
00
00
24
20
00
02
61
83
60
12
46
80
35
62
00
35
62
00
57
58
38
9
Co
mb
ined
Hea
t a
nd
Po
wer
Oth
er
TO
TA
L
Dis
tric
t hea
ting
(hea
t-o
nly
)
E
nerg
y c
arr
ier
inp
ut
[MW
h]
CO
2 /
CO
2 e
q.
em
issi
on
s
[t]
Foss
il f
uels
Wa
ste
Pla
nt
oil
Oth
er
bio
ma
ss
Oth
er
renew
ab
leO
ther
Loca
l hea
t/co
ld p
rod
ucti
on p
lants
Hea
t/co
ld p
rod
uced
[MW
h]

Dublin City Sustainable Energy Action Plan – Monitoring and Progress Report
i
Appendix I
Acknowledgements
Codema would like to thank all the organisations and individuals consulted for the time they have taken
to contribute to this work, in particular;
Frank Mc Cabe, National Transport Authority
South Dublin County Council
The Valuations Office
CSO
SEAI
CO2 figures used for 2011
Note: The national electricity and peat figures for 2011 are from the SEAI. The other emission figures are provided by the
Covenant of Mayors calculations template.
Comparison Tables: 2006 to 2011
An overview of the energy and CO2 emissions
for Dublin City 2006 to 2011 are shown in
Table 7 and Table 828. There are a number of
caveats which concern the validity of the
percentage decreases in each sector. As stated
earlier, it is now evident that the methodologies
used to calculate the 2006 BEI were overly
conservative due to the lack of accurate data
that was available. Because the 2006 energy
inventory is likely overestimated, it has therefore
amplified the change in energy consumption
over the 5 year period. There is also a margin
of error which is applicable to the new 2011
MEI figures, as these figures are not from actual
energy readings, and all calculations have
included assumptions in one form or other.
28 These tables do not include municipal energy; see Table
5 for municipal energy figures.
Table 7: Total Energy Consumption 2006-2011
Table 8: Total CO2 Emissions 2006-2011
The only change which is as close to reality as
possible is the municipality sector decrease of
22% in energy consumption, shown in Table 5,
page 24, as this is based on actual energy
billing information, and calculated the same
way for both years. It is not possible to update
the other sector’s original 2006 figures to
match the new methodologies used for 2011,
as the same information is not available for
2006.
Electricity
NationalNatural
gas
Liquid
gas
Heating
oilDiesel Gasoline Peat Coal
Other fossil
fuelsPlant oil Biofuel
Other
biomass
0.489 0.202 0.229 0.279 0.267 0.249 0.374 0.341 0.289 0.287 0.255 0.025
Fossil fuels Renewable energies
Sector 2006 2011 % Change
Residential 5.9 4.5 -23%
Commercial 5.3 2.7 -48%
Transport 4.5 2.7 -40%
Total 15.7 10.0 -37%
Energy Consumption TWh/yr
Sector 2006 2011 % Change
Residential 1721 1282 -25%
Commercial 2162 894 -59%
Transport 1172 710 -39%
Total 5054 2886 -43%
CO2 Emissions kt/yr

Dublin City Sustainable Energy Action Plan – Monitoring and Progress Report
ii
Assumptions
Residential Sector
In the CoM table, the heading ‘Lignite’
is used to cover Peat use, as there is no
specific column for this fuel, and its use
is prevalent in some sectors in Ireland.
Therefore the CO2 emissions factor for
‘Lignite’ is replaced with the CO2 factor
for Peat.
Commercial Sector
All energy figures used are ‘Typical
Practice’ figures as described by
CIBSE.
Retail energy use in based on sales
floor area, therefore no energy
allocated for storage or back of house
uses.
All offices are taken as ‘Naturally
Ventilated Open Plan’ as described in
CIBSE
Hairdressing/salons taken as ‘High
Street Agencies’ due to higher energy
usage than ‘General Retail’.
Any properties without a specific
property use are taken as ‘General
Retail’
Advertising stations listed by the
valuation office are not included
All car parks listed by the valuation
office are given a zero floor area, and
therefore an energy figure could not be
applied.
An 80% space efficiency is assumed
for conversion from net internal area to
gross internal area (Source:
Employment Density Guide).
The difference between gross external
area and gross internal area is
perimeter wall thickness, and general
conversion could not be found, so
therefore this has been left as the larger
gross external area and therefore
energy applied will be overestimated.
All treated floor area to gross floor
area conversions are based on the
conversion factor of 95% given by
CIBSE for ‘Offices Naturally
Ventilated’.
Dublin City Council properties are not
included in this sector calculation.
Transport
It is assumed that all passenger
journeys by bus use Dublin Bus
services.
It is assumed that the age profile of the
Dublin car fleet is mirrored in national
figures
All tonne-km for freight transport which
originates in Dublin is said to be
accountable to Dublin energy use.
All private cars are said to use petrol
or diesel, as only a minute fraction use
other fuel types and therefore not worth
the calculation.
Only the population over the age of
four in Dublin are used for the analysis

Dublin City Sustainable Energy Action Plan – Monitoring and Progress Report
iii
Appendix II

Dublin City Sustainable Energy Action Plan – Monitoring and Progress Report
iv

Dublin City Sustainable Energy Action Plan – Monitoring and Progress Report
v

Dublin City Sustainable Energy Action Plan – Monitoring and Progress Report
vi
Works Cited
Central Statisitcs Office, 2012. Household Budget Survey 2009-2010, Dublin: Stationery Office.
Central Statistics Office, 2006, 2011. Live Register June 2006 and June 2011, Dublin: Stationery
Office.
Central Statistics Office, 2007, 2012. Transport 2006 & Transport 2011, Dublin: Stationery Office.
Central Statistics Office, 2012. Census 2011 SAPMAP Viewer. [Online]
Available at: http://census.cso.ie/sapmap/
[Accessed October 2013].
Central Statistics Office, 2012. Profile 4: The Roof Over Our Heads, Dublin: Stationery Office.
Central Statistics Office, 2012. Road Freight Transport Survey, Dublin: Stationary Office.
Central Statistics Office, 2013. Private households in permanent housing units in the Greater Dublin
area, classified by type of accommodation and period in which built. Dublin: By request of Codema.
CIBSE, 2012. Guide F: Energy Efficiency in Buildings. 3rd ed. London: CIBSE Publications.
Codema, 2013. Renewable Energy in Dublin: Market Assessment, Dublin: Codema.
CSO, 2011. Road Freight Transport Survey 2011, Dublin: Stationery Office.
CSO, 2012. Transport Omnibus 2011, Dublin: Stationery Office.
CSO, n.d. SEI07: Average Fuel Consumption and Distance Travelled for Private Cars by Engine
Capacity cc, Type of Fuel, Year and Statistic,
http://www.cso.ie/px/pxeirestat/Statire/SelectVarVal/Define.asp?Maintable=SEI07&Planguage=0:
SEAI Energy Statistics Databank.
DEFRA UK, 2010. Conversion Factors for Company Reporting: Methodology Paper for Emission
Factors, London: Department for Environment, Food and Rural Affairs UK.
Dept. of Energy & Climate Change UK, 2012. Local Authority CO2 emissions estimates 2011:
Statistical Summary, London: Dept. of Energy & Climate Change UK.
Dept. Transport UK, n.d. Van CO2 and Fuel Consumption database. [Online]
Available at: http://vanfueldata.dft.gov.uk/Default.aspx
[Accessed September 2013].
DTTAS, 2011. Irish Bulletin of Vehicle and Driver Statistics, Dublin: Department of Transport, Tourism
and Sport.
Dublin Bus, 2013. Email Correspondence with Dublin Bus Representative. 17th Setember 2013: s.n.
DublinBikes, 2013. dublinbikes expansion. [Online]

Dublin City Sustainable Energy Action Plan – Monitoring and Progress Report
vii
Available at: http://www.dublinbikes.ie/Magazine/News/dublinbikes-expansion
[Accessed 5 December 2013].
Dubuisson, X., 2013 . Kerry Sustainable Energy Community Roadmap (Draft Report), Kerry: Transition
Kerry, Kerry County Council.
Iarnrod Eireann, 2011. 2030 Rail Network Strategy Review, s.l.: AECOM.
IMF, 2013. Key Indicators for Ireland, s.l.: International Monetary Fund.
Irish Independent, 2011. The terrible toll of recession: 47,000 Irish firms closed. Irish Independent
Newspaper, 1 December.
Irish Rail , 2011. Irish Rail’’s energy & environmental management initiatives. Dublin, European Green
Transport Conference Dublin 2011.
Irish Rail, 2013. Changes in train fleet utilisation to save energy costs. [Online]
Available at: http://www.irishrail.ie/cat_news.jsp?i=4918&p=116&n=237
[Accessed 25 September 2013].
Mc Cabe, F., 2013. Email Correspondence with Frank Mc Cabe from Sept - Nov 2013. s.l.:National
Transport Authority.
Mitchell-Jackson, J., Koomey, J., Nordman, B. & Blazek, M., 2003. Data center power requirements:
measurements from Silicon Valley. Energy, Volume 28, pp. 837-850.
RPA, 2011. Dublin Light Rail Annual Sustainability Report 2011, Dublin: Rail Procurement Agency.
RPA, 2011. Dublin Light Rail Sustainability Report 2011, s.l.: Rail Procurement Agency.
SEAI, 2012. Energy Balances 1990-2011. [Online]
Available at:
http://www.seai.ie/Publications/Statistics_Publications/Energy_Balance/Previous_Energy_Balances/
[Accessed 10 October 2013].
SEAI, 2012. Energy in Ireland 1990-2011, Dublin: SEAI.
SEAI, 2012. Greener Homes Scheme Statistics. [Online]
Available at: http://www.seai.ie/Grants/GreenerHomes/Scheme_Statistics/
[Accessed 21 November 2013].
SEAI, 2013. BER Research Tool User Information Guide: Version 1.0, Dublin: SEAI.
SEAI, 2013. Emission Factors. [Online]
Available at: http://www.seai.ie/Publications/Statistics_Publications/Emission_Factors/
[Accessed 14 November 2013].
SEAI, 2013. Energy in the Residential Sector: 2013 Report, Dublin: SEAI.
SEAI, 2013. National BER Research Tool Online. [Online]

Dublin City Sustainable Energy Action Plan – Monitoring and Progress Report
viii
Available at: http://www.seai.ie/Your_Building/BER/National_BER_Research_Tool/
[Accessed 29 August 2013].
SEAI, n.d. Commercial Buildings Special Working GroupTechnical Panel: Applying Current Known
Internatinal Benchmarks for Buildings in an Irish Context. [Online]
Available at:
http://www.seai.ie/Your_Business/Large_Energy_Users/Special_Initiatives/Special_Working_Groups/
Commercial_Buildings_Special_Working_Group_Spin_I/
[Accessed 27 November 2013].
SEAI, n.d. What Does the BER Certificate Look Like?. [Online]
Available at:
http://www.seai.ie/Your_Building/BER/BER_FAQ/FAQ_BER/Homeowners/BER_Cert_with_explainati
on.pdf
[Accessed 19 november 2013].
Shanahan, C., 2011. Cycle to Work scheme gets us on our bikes. [Online]
Available at: http://www.irishexaminer.com/ireland/cycle-to-work-scheme-gets-us-on-our-bikes-
169648.html
[Accessed 6 December 2013].
Transport for London, n.d. Benefits. [Online]
Available at: www.tfl.gov.uk/roadusers/congestioncharging/6723.aspx
[Accessed 7 December 2013].
Valuation Office Ireland, 2009. Code of Measuring Practice for Rating Purposes, Dublin: Valuation
Office.
Valuation Office, 2013. Commercial Premises Statistics for Dublin City. Dublin: Valuation Office.
Valuation Office, 2013. Excel Database of Dublin City Commercial Properties. Dublin: Email
Correspondence.

Dublin City Sustainable Energy Action Plan – Monitoring and Progress Report
ix
List of Figures
Figure 1: Steps involved in Covenant of Mayors ........................................................................................................... - 8 -
Figure 2: Progress made in Covenant of Mayors ........................................................................................................... - 8 -
Figure 3: Final Energy Consumption in Dublin City 2006 ............................................................................................. - 11 -
Figure 4: Final Energy Consumption for Dublin City 2011 ............................................................................................ - 11 -
Figure 5: Dublin City Total Housing Stock 2011 by Type and Period Built ....................................................................... - 12 -
Figure 6: Total Dublin City Housing 2011 by Dwelling Type ......................................................................................... - 12 -
Figure 7: Sample BER Certificate. Source: (SEAI, n.d.) ................................................................................................. - 13 -
Figure 8: Representation of Dublin City Housing in BER Database ................................................................................. - 13 -
Figure 9: Shares of Total Energy Use, Floor Area, and Number of Dwellings for Each Dwelling Type in Dublin City .............. - 14 -
Figure 10: Energy Demand in Dublin City Residential Sector......................................................................................... - 14 -
Figure 11: Final Energy Consumption Fuel Mix ........................................................................................................... - 15 -
Figure 12: Residential Electricity Used Annually For Each Purpose ................................................................................. - 15 -
Figure 13: Dublin City Residential Sector Final Electricity Use........................................................................................ - 15 -
Figure 14: Building Energy Ratings for All Dublin City Housing Stock ............................................................................. - 16 -
Figure 15: Percentage Low Energy Lighting by Building type and Period Built .................................................................. - 17 -
Figure 16: Dublin City Commercial Properties by Category .......................................................................................... - 19 -
Figure 17: Total Commercial Floor Area by Category .................................................................................................. - 20 -
Figure 18: Total Final Commercial Energy by Property Category ................................................................................... - 21 -
Figure 19: Dublin City Electricity use in Commercial Sector by Category ........................................................................ - 21 -
Figure 20: Dublin City Commercial Fossil Fuel Use by Property Category ....................................................................... - 21 -
Figure 21: Dublin City Industrial Energy by Fuel Type .................................................................................................. - 22 -
Figure 22: Dublin City Service Sector Energy by Fuel Type ........................................................................................... - 22 -
Figure 23: New Vehicles Registered in Dublin 2001 to 2011 ....................................................................................... - 24 -
Figure 24: Economic Status of Dublin City Census Population Vs. Travel Survey Participants .............................................. - 25 -
Figure 25: Number of Passenger Journeys in Dublin City by Mode of Travel ................................................................... - 26 -
Figure 26: Total Passenger Kilometres in Dublin City by Mode of Travel ......................................................................... - 26 -
Figure 27: Fuel Split in Dublin City Transport Sector .................................................................................................... - 27 -
Figure 28: Energy Split in Dublin City Transport Sector by Mode ................................................................................... - 27 -
Figure 29: Energy Split in Dublin City Transport Sector by Category .............................................................................. - 27 -
Figure 30: Dublin City Council Energy Consumption (MWh) by Sector 2006-2011.......................................................... - 30 -
Figure 31: Dublin City Council Breakdown of Fuel Consumption 2011 ........................................................................... - 31 -
List of Tables
Table 1: Dublin City Residential Monitoring Emissions Inventory; Final Energy and CO2 Emissions ..................................... - 17 -
Table 2: Dublin City Commercial Monitoring Emissions Inventory; Final Energy and CO2 Emissions .................................... - 23 -
Table 3: Comparison of Passenger Journeys in Dublin City by Mode 2006 to 2011 ........................................................ - 26 -
Table 4: Dublin City Transport Monitoring Emissions Inventory; Final Energy and CO2 Emissions ....................................... - 28 -
Table 5: Dublin City Council Energy Consumption by Fuel, 2006-2011 ......................................................................... - 30 -
Table 6: Dublin City Council's Monitoring Emissions Inventory; Energy and CO2 Emissions ............................................... - 31 -
Table 7: Total Energy Consumption 2006-2011 ............................................................................................................... i
Table 8: Total CO2 Emissions 2006-2011 ....................................................................................................................... i

Dublin City Sustainable Energy Action Plan – Monitoring and Progress Report
x
Author Donna Gartland Energy Management
Ms Donna Gartland recently received a first class honours Master of Science (MSc)
Degree in Sustainable Energy Planning and Management from Aalborg University,
Denmark. Donna also holds a Bachelor of Engineering (BEng) Degree in Energy
and Environmental Engineering from the Institute of Technology Tallaght, and
started her career as a qualified electrician. Donna is currently working with the
energy management team on energy planning projects, with particular expertise in the area of District
Heating.

Dublin City Sustainable Energy Action Plan – Monitoring and Progress Report
xi
Notes

Dublin City Sustainable Energy Action Plan – Monitoring and Progress Report
xii
Notes


The Loft, 2-4 Crown Alley, Temple Bar, Dublin 2. T. 01 707 9818 E. [email protected] W. www.codema.ie
Top Related