


Languages
Pages
Legal


Dr. Heather Miller Coyle
People v. Jaquan Collins
People v. Andrew Peaks
Nov. 8, 2013

Validation Purpose of validation
To ensure a method is reliable and robust and reproducible for use in casework
Requisite for new methodologies
Reliable method defined as one where results are accurate and reflect the sample being tested
Reproducible method defined as the same or very similar results obtained each time tested

Validation Purpose of validation Developmental validation – method development Internal validation – a method validated in-house
in a lab means it is generally accepted in the lab but not necessarily accepted by the scientific community as reliable If accepted by scientific community, general
use by all laboratories would follow Low copy number (LCN) is problematic and not
generally used in criminal casework across the United States

Scope of Peer Review1. Peer review is open scientific evaluation by appropriate
scientific community as a step toward general acceptance or rejection of method
Dr. Caragine’s testimony: Question: And then when an article is published in the peer
review journal, what does that mean? Answer: It means that your results have been accepted by
the sci-by the your peers, by the scientific community. Publication in a peer reviewed journal does not equal
general acceptance Publication in peer reviewed journal does not equal
exhaustive peer review since all of the data was not submitted to journal (summary)
Auditing Is Not Peer Review Auditing is a quality assurance/quality
control process It is aimed at ensuring that a laboratory
follows protocols and the DNA Advisory Board standards and is not primarily aimed at ensuring that the underlying scientific methodology is reliable

What is Low Copy Number Testing? Methodology employing increased sensitivity techniques on
low template samples (<100 pg) Generally accepted forensic DNA tests employ 28 cycles of
a PCR method LCN uses 31 cycles of PCR (cycle enhancement) and
different interpretation criteria for samples and controls (not the same method)
Samples and controls should be reproducible from PCR amplification to PCR amplification but are not due to low template concentrations of DNA (<100pg) (stochastic effects)

Characteristics of Low Copy Number DNA Testing: Stochastic Effects
Stochastic effects: Increased heterozygote peak imbalance “Drop-out” (extreme form of PHI) Increased baseline Increased stutter (artifactual PCR peaks) Increased “drop-in” or contamination “Drop-in” and “drop-out” confounds the ability to
determine with accuracy the true number of contributors (source attribution error in LCN)

Increased Peak Height Imbalance
Balanced at 1ng
Not balanced at<100 pg
Cannot accuratelyestablish majorcontributor to amixture

Increased Peak Height Imbalance “Drop out” is an extreme example
Drop out rate is especially variable in the stochastic range of under 100 pg, particularly below 50 pg
Affects interpretation of results how False homozygote Difficulty in deconvoluting mixtures with
accuracy May incorrectly conclude two peaks are
“sisters”, masking Error rates or false inclusion rate is high


Characteristics of Low Copy Number DNA Testing: “Drop-In”
“Drop-In” is contamination OCME defines as “drop-in” as observation of a single DNA
peak once in triplicate amplifications; “contamination” is if DNA peak is observed more than once
Problematic to distinguish between authentic DNA representative of sample and contamination from an outside source
Clean facilities and UV treatment of tubes still yields 8-11% extraneous DNA in negative controls
Extremely confounding when interpreting DNA results
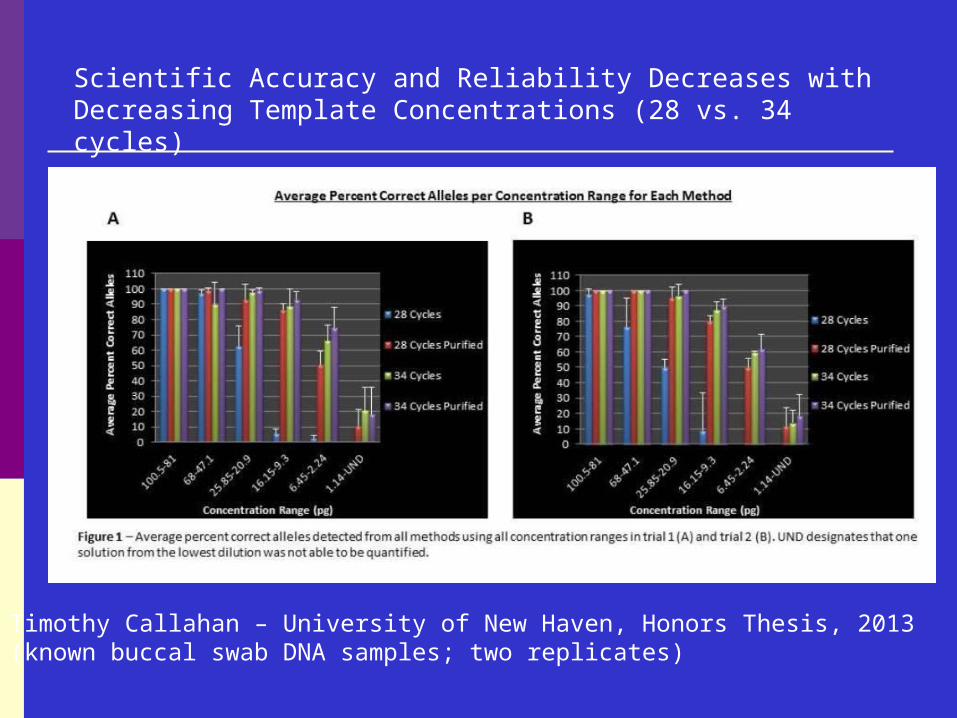
Timothy Callahan – University of New Haven, Honors Thesis, 2013(known buccal swab DNA samples; two replicates)
Scientific Accuracy and Reliability Decreases with Decreasing Template Concentrations (28 vs. 34 cycles)
Complex Mixtures Add Another Layer of Uncertainty
Complex mixture interpretation is difficult enough at 28 cycle, high template DNA testing
Controversy in scientific community about how to interpret and report complex DNA mixtures
Low level LCN testing is that much worse Stochastic effects make it difficult to establish
number of true contributors and major donors Coincidental matching makes it difficult to
identify which DNA fragments go to which individual

Consequence of Underestimating # of Contributors and/or Deconvoluting Mixtures
Underestimating number of contributors increases the source attribution error (force fit of data)
Source attribution error = deducing profiles (major donor) from a mixture is not valid in stochastic range
Both result in scientific unreliability or scientific inaccuracy of a result

Negative Control Contamination Purpose of negative controls is to establish whether
extraneous DNA is present that was not originally in the sample
OCME-NYC allows up to 9 spurious alleles in the negative controls before contamination is at an unacceptable level
LCN validation data shows different injections, resulting in different alleles detected in negative controls
Not generally accepted to have contamination in negative controls

OCME Performed Ten Touch Studies Six clean studies (used various items: hands,
pens, CD case, lunch box, etc.) These six studies were performed using two-, three-, and
four-person touched items. Two studies were mixed (clean and dirty)
One study was performed using three-person touched items; the second study used four-person touched items.
These studies had nine clean items and nine dirty items. One study used dirty items
These were two person touched items. One study was performed on degraded items

Clean Touch Studies Examined 85 clean touch samples when
calculating alleles that were unaccounted for by the known contributors. ID 28 = 41 samples ID 31 = 44 samples
Summaries 19, 20, and 21: designed to replicate case work protocols followed in cleaning items before items were touched.
OCME cleaning protocols unable to eliminate contamination.
Analysis Determined the number of unaccounted
alleles in 28 cycles 31 cycles
Total # of unaccounted alleles/(# samples x # of replicates x # loci) =
% of detected alleles that did not come from a known contributor
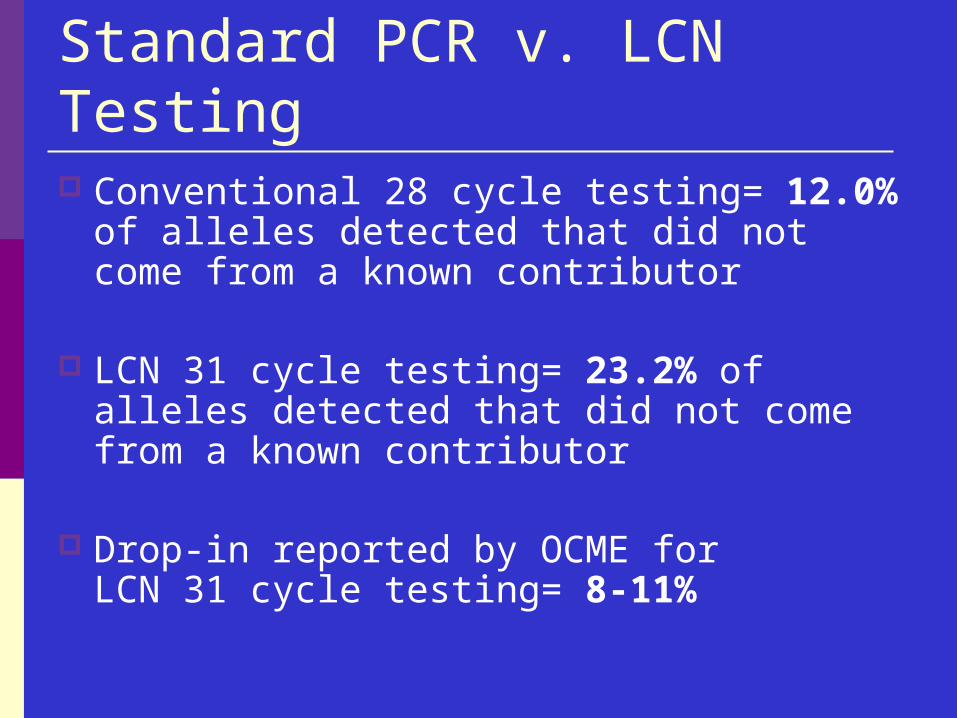
Standard PCR v. LCN Testing Conventional 28 cycle testing= 12.0% of
alleles detected that did not come from a known contributor
LCN 31 cycle testing= 23.2% of alleles detected that did not come from a known contributor
Drop-in reported by OCME for LCN 31 cycle testing= 8-11%

Contamination Percentage for Total Allele Count Calculated the percentage of contaminant
alleles to the total allele count for each mixture.

Studies 2A and 2B (estimated % contaminant alleles) ID31 ID28 Hand2 7.6% Hand3 0% Hand4 35.0% Hand9 2.4% Hand5 26.0% Hand10 2.7% Hand1830.0% Hand11 4.4% 2P PenD 8.9% Hand14 16.8% 2P PenE 11.9% Hand15 3.7% 2P PenG 0.0% Hand16 0% 2P PenH 7.6% 2P Stapler 1.7% 2P PenJ 16.5% 2P CD case 0% 2P Mouse 21.4% 2P plastic cover 0% Ave. %: 16.0% Ave. %: 2.3%
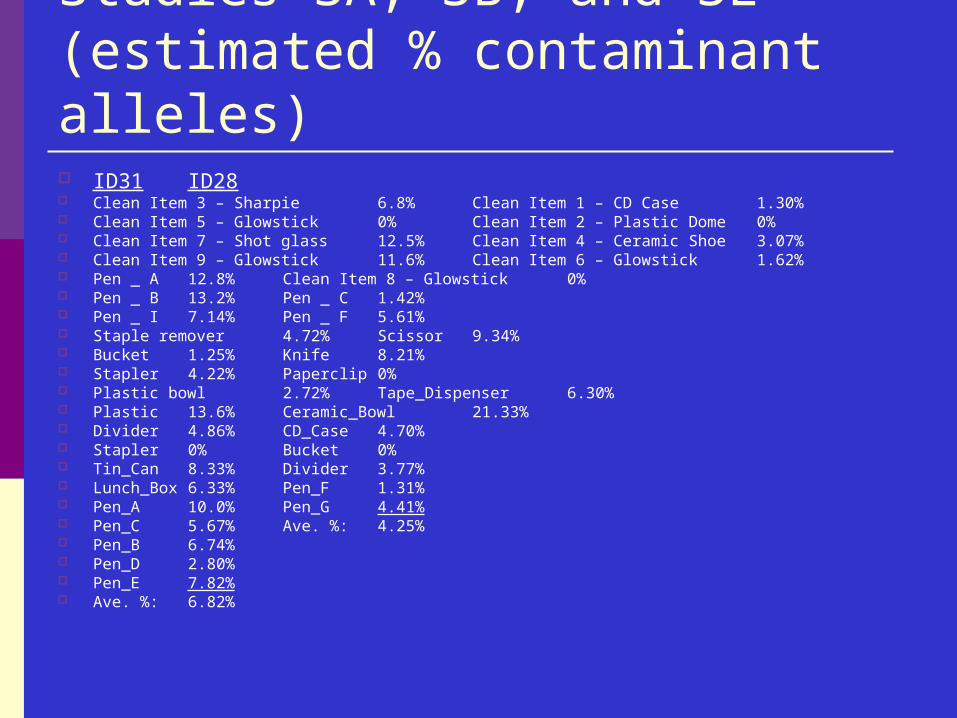
Studies 3A, 3B, and 3E (estimated % contaminant alleles) ID31 ID28 Clean Item 3 – Sharpie 6.8% Clean Item 1 – CD Case 1.30% Clean Item 5 – Glowstick 0% Clean Item 2 – Plastic Dome 0% Clean Item 7 – Shot glass 12.5% Clean Item 4 – Ceramic Shoe 3.07% Clean Item 9 – Glowstick 11.6% Clean Item 6 – Glowstick 1.62% Pen _ A 12.8% Clean Item 8 – Glowstick 0% Pen _ B 13.2% Pen _ C 1.42% Pen _ I 7.14% Pen _ F 5.61% Staple remover 4.72% Scissor 9.34% Bucket 1.25% Knife 8.21% Stapler 4.22% Paperclip 0% Plastic bowl 2.72% Tape_Dispenser 6.30% Plastic 13.6% Ceramic_Bowl 21.33% Divider 4.86% CD_Case 4.70% Stapler 0% Bucket 0% Tin_Can 8.33% Divider 3.77% Lunch_Box 6.33% Pen_F 1.31% Pen_A 10.0% Pen_G 4.41% Pen_C 5.67% Ave. %: 4.25% Pen_B 6.74% Pen_D 2.80% Pen_E 7.82% Ave. %: 6.82%

Studies 4A and 4B (estimated % contaminant alleles) ID31 ID28 Clean Item 2 – Glowstick 2 8.3% Clean Item 1 – Glowstick 1 11.8% Clean Item 3 – Glowstick 3 7.3% Clean Item 5 – blueshoe 3.8% Clean Item 4 – Glowstick 4 10.6% Clean Item 6 – Shotglass 1 1.2% Clean Item 7 – Shotglass 2 7.5% Clean Item 8 – Plastic dome 18.1% 4P_Pen_A 11.7% Clean Item 9 – CD Case 19.8% 4P_Pen_C 7.3% 4P_Pen_B 2.2% 4P_Sharpie_C 0% 4P_Pen_D 0% 4P_Sharpie_D 3.7% 4P_Pen_E 7.5% 4P_Marker 2.9% 4P_Sharpie_A 1.1% 4P_Glowstick_A 7.7% 4P_Sharpie_B 0.9% 4P_Glowstick_C 2.2% 4P_Glowstick_B 0% 4P_Glowstick_D 7.2% 4P_Paperclip 0% 4P_Sharpie_E 8.2% 4P_ceramic 0% Avg. %: 6.5% 4P_Plastic 12%
Avg.%5.6%

Conclusion: LCN DNA Testing is Unreliable and Not Reproducible for Criminal Casework
Study: Timothy Callahan, University of New Haven
Increased cycle numbers also increased artifacts and confounded interpretation (low % correct alleles)
Study: Mesha Smithen, University of New Haven Cellular basis of DNA from thumbprints on a
smooth surface, 30 seconds of pressure, variable results, could generate artificial composite DNA profiles confounding interpretation of a true contributor (source attribution error)
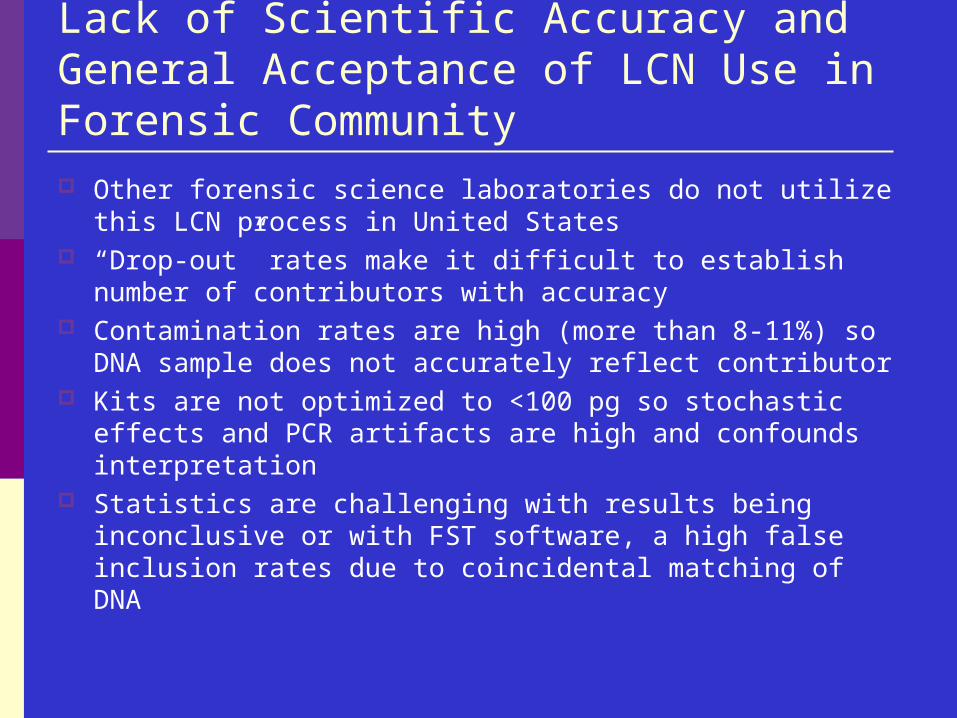
Lack of Scientific Accuracy and General Acceptance of LCN Use in Forensic Community Other forensic science laboratories do not utilize this LCN
process in United States “Drop-out” rates make it difficult to establish number of
contributors with accuracy Contamination rates are high (more than 8-11%) so DNA
sample does not accurately reflect contributor Kits are not optimized to <100 pg so stochastic effects and
PCR artifacts are high and confounds interpretation Statistics are challenging with results being inconclusive or
with FST software, a high false inclusion rates due to coincidental matching of DNA