


Languages
Pages
Legal


DOUG – Technology Day
Tuning Seminar by Nitin Vengurlekar

Nitin Vengurlekar
• 18 Years with Oracle
6 years with Oracle Support
9 years with RAC Product Management
3 years a “Private Database Cloud” Evangelist• Worked with numerous customers on consolidation, rationalization
planning. • Taking these key customers to reference-ability• Developed white papers and Best Practices for Application/Database
High Availability and Consolidation
• Follow me on Twitter: dbcloudshifu
2

RAC FUNDAMENTALS AND INFRASTRUCTURE SUPPORT

Content ContributorsThanks to all the past Content Contributors
• Michael Zoll• Markus Michalewicz• Barb Lundhild• Saar Moaz• John McHugh• My “former past” Nitin Vengurlekar (circa 2009)

Objectives
• Not gonna give you scripts or queries – You can find that on the InterWeb
• Gonna cover basics of buffer/block management in RAC– So you know what is happening when happens
• Review key metrics/waits and its dependencies– So you know [starting point] causality
• Check out next session on RAC Buffer Cache Internals for more deep dive
AgendaUnderstanding RAC Cache Fusion for Practical RAC Performance Analysis
• RAC Fundamentals and Infrastructure • Common Problems and Symptoms• Application and Database Design• Diagnostics and Problem Determination • Summary: Practical Performance Analysis
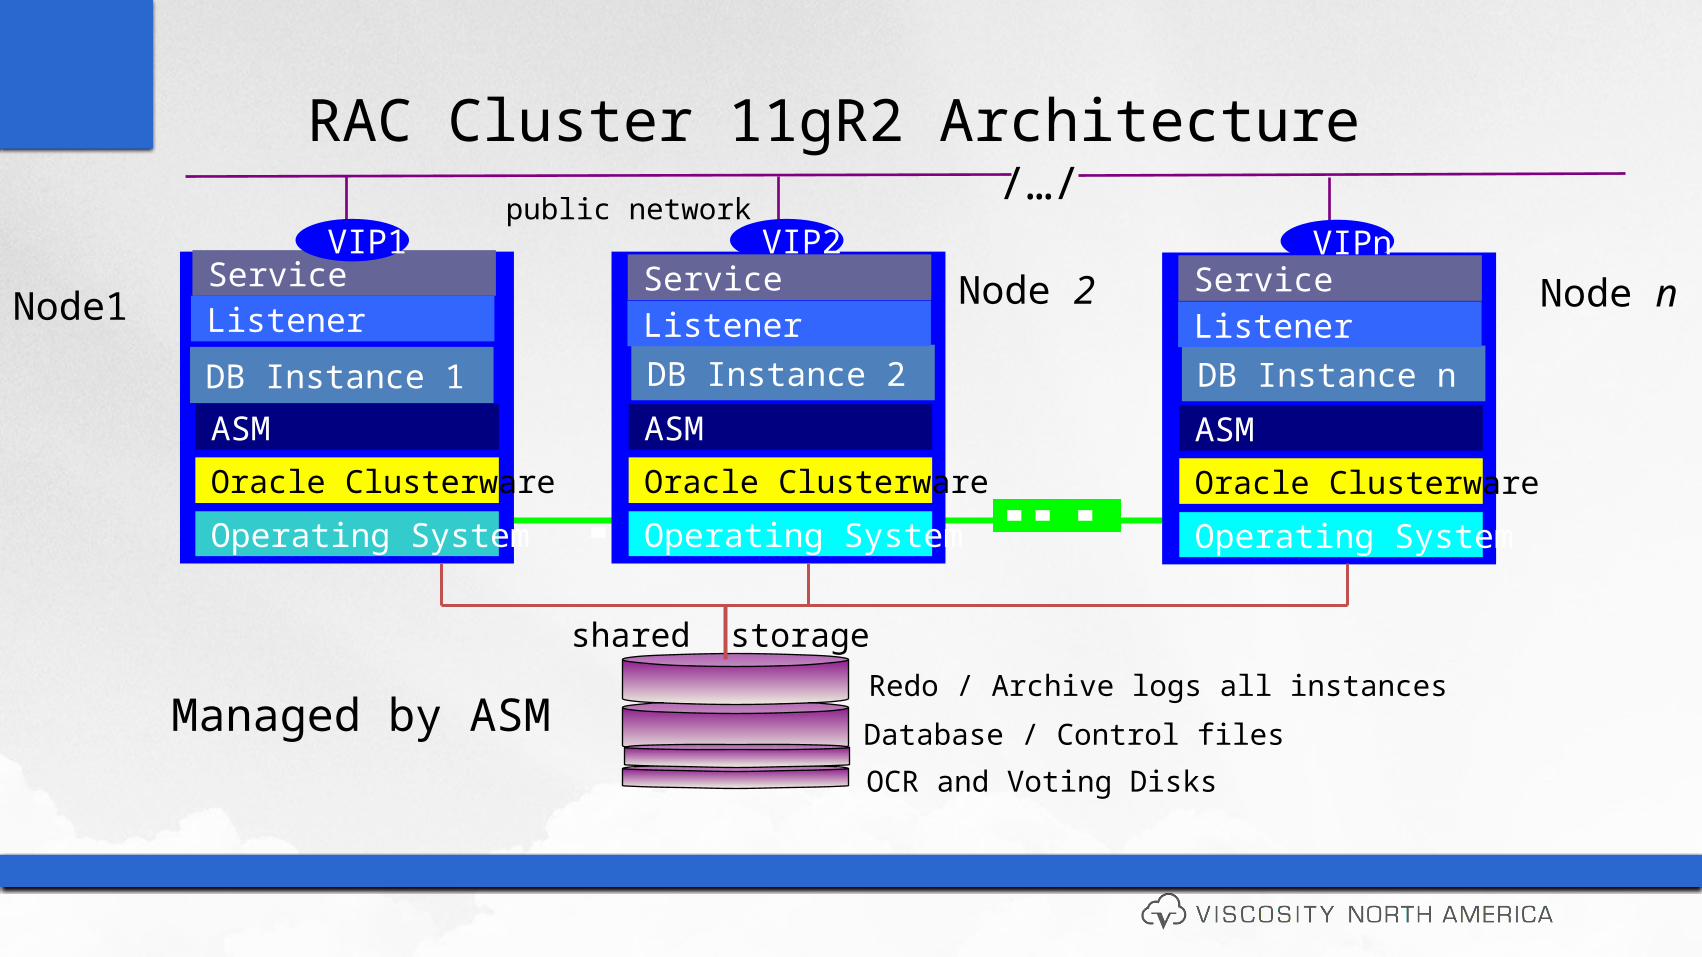
Service
RAC Cluster 11gR2 Architecture public network
Node1
Operating System
Oracle Clusterware
DB Instance 1
ASM
VIP1
ListenerNode 2
Operating System
Oracle Clusterware
DB Instance 2
ASM
VIP2
ListenerService Node n
Operating System
Oracle Clusterware
DB Instance n
ASM
VIPn
ListenerService
/…/
Redo / Archive logs all instances
shared storage
Database / Control files
OCR and Voting Disks
Managed by ASM

Under the Covers
Redo Log Files
Node nNode 2
Data Files and Control Files
Redo Log Files Redo Log Files
DictionaryCache
Log buffer
LCK0 LGWR DBW0
SMON PMON
LibraryCache
Global Resoruce Directory
LMS0
Instance 2SGA
Instance n
Cluster Private High Speed Network
Buffer Cache
LMON LMD0 DIAG
Dictionary Cache
Log buffer
LCK0 LGWR DBW0
SMON PMON
Library Cache
Global Resoruce Directory
LMS0
Buffer Cache
LMON LMD0 DIAG
Dictionary Cache
Log buffer
LCK0 LGWR DBW0
SMON PMON
Library Cache
Global Resoruce Directory
LMS0
Buffer Cache
LMON LMD0 DIAG
Instance 1
Node 1
SGA SGA
LMHB LMHB LMHB
Two Keys Components – Cache Fusion
• Global Cache Service (GCS)
• Global Enqueue Services (GES)
• Global Resource Directory (GRD)

Global Enqueue Service (GES)
• GES maintains synchronization dictionary cache, library cache, transaction locks, and DDL locks.– Easier just to say “GES manages enqueues other than data blocks” – LCK and LMD are processes that manage GES
• Maintains local and global enqueue – V$ENQUEUE_STATISTICS displays enqueues with the highest impact.– GV$LOCK – global view of local locks– GV$GES_ENQUEUES – global view of global locks that are blocking or being blocked– TX, TM, SQ, TA, US are typical enqueues

Global Enqueue Service (GES) - Example
• A process is trying to acquire a HW enqueue• Sends a BAST (Blocking Asynchronous Trap) message to LCK process• LCK constructs the message
– Message includes lock pointer, resource pointer, and resource name
• If resource is not available, then the LCK process sends a message to the lock holder for a lock downgrade.– Can be seen as ‘DFS lock handle’ waits

Global Cache Services (GCS)
• Guarantees cache coherency– Ensures that instances acquire a resource cluster-wide before modifying or reading a
database block
• Minimizes access time to data which is not in local cache and would otherwise be read from disk or rolled back– Synchronize global cache access – PCM ;-)
• Implements direct memory access over interconnect• Uses an efficient and scalable messaging protocol
– skgxp

Global Resource Directory (GRD)
• GRD records information about current status of the data blocks, resources and enqueues.
• GRD is managed and maintained by GES and GCS.• Each running instance stores a portion of the directory. • LMON recovers the GRD during instance recovery

Global Cache Resource Relationship
8k on-disk block
8k buffer header (x$bh)200 bytes
Lock Element (LE) – x$le
DLM Lock (x$kjbl)
DLM Resource(x$kjbr)

Three Players in this Chess[RAC]-Match
• Requestor– Session [from an Instance] who is making the request for the buffer/block
• Master (kjblmaster)– Instance that has that buffer mastered – Maintains grant and convert queues– Buffer [ranges] are mastered by different instances. Provides even distribution of
mastered locks– Block re-mastering can change for various reasons (gms changes, DRM, manually
using event)
• Holder (kjblowner)– Instance that has the buffer cached

Buffer Blocks BasicsA word on Current and CR blocks
• Oracle includes block multi-versioning architecture– RAC extends that to multi-nodal multi-versioning
• Block can be either a current data block or a consistent read (CR) versions of a block. – Current block contains changes for all committed and uncommitted transactions. All DML gets on
a block are made in this mode – Consistent read (CR) version of a block represents a consistent snapshot of the data at a
previous point in time. Select read requests made in this mode
• Oracle applies undo segments to current blocks to produce to appropriate CR versions of a block. not RAC specific !
• Both the current and consistent read blocks are managed by the GCS.

Cache Fusion – 1,2,and 3 ways
• 1-way block transfer No block transfer at all. Requestor, Holder, and Master is the local instance. Close to single instance performance.
• 2-way block transferNode A performs hash/directory lookup, and finds out another node is the master of this block; eg, node B. Node A send a message to B for that block. Node B found no other nodes hold that block and messages back node A
• 3-way block transferNode A requests for block, via lookup, determines Node B is master, but finds that node C is currently holding that block. NodeB sends a message to node C, and then node C send the block to node A. That’s 3-way.

GCS Coordination Example 1
–Assume data block C has been read and and dirtied by InstanceA.
–Only one copy of the block exists clusterwide and represented by its SCN
•1. InstanceB attempting to modify the block submits a request to LMS.
•2. LMS transmits the request to the holder, InstanceA
•3. InstanceA receives the message, flushes the redo associated with dirtied buffer and sends the block to the InstanceB
•4. InstanceA retains the dirty buffer for recovery purposes. This dirty image of the block is called a past image (PI) of the block. A PI block cannot be modified further.
•5. On receipt of the block, the , InstanceB informs GCS that it holds the block.
–Note: The data block is not written to disk before the resource is granted , InstanceB

GCS Coordination Example 2Write to Disk Coordination
–In this scenario, assume that InstanceA is holding a past image buffer, requests that Oracle writes the buffer to disk:
•1. InstanceA sends a write request to the GCS.
•2. The GCS forwards the request to the InstanceB, the holder of the current version of the block.
•3. InstanceB receives the write request and writes the block to disk.
•4. InstanceB records the completion of the write operation with the GCS.
•5. After receipt of the notification, the GCS orders all past image holders to discard their past images. These past images are no longer needed for recovery.
–Note: In this case, only one I/O is performed to write the most current version of the block to disk.

GCS Coordination Example 2Write to Disk Coordination
– This scenario illustrates what happens when an instance invokes a checkpoint or cache clean buffers due to free buffer requests.
– Because multiple versions of the same data block with different changes can exist in the caches of instances in the cluster, a write protocol managed by the GCS ensures that only the most current version of the data is written to disk.
– Disk block writes are only required for cache replacement. A past image (PI) of a block is kept in memory before the block is sent if it is a dirty block. In the event of failure, Oracle reconstructs the current version of the block by reading the PI blocks.

Key Layers that Affect RAC Performance
• Local disk block or buffer access is ‘same-ol-same-ol’• A remote cache access driven by round-trip time• Latency variation (and CPU cost ) correlates with
– Block transfer (“wire time”)– Block Contention– Block Access Cost – block preparation– Delayed log flushes– CPU saturation/LMS scheduling– IO latency

Network Path
• Wire latency is very small– ~ 50% of fixed overhead is in kernel– Protocol ( e.g. UDP, RDS ) dependent
• IPC queue lengths are variable– Depends on incoming rate and service time
• Context switch and scheduling delay (CPU queue ) are variable
– Depends on process concurrency & CPU load
• Hence: time in queues can vary under load Performance of immediate message transfers depends practically on minimizing queue and context switch time
• Transfer Path Length
usersys
Context switchNIC
Driver and IP stack IPC
Global Cache (RDBMS)
Wire
CPU SocketPackets
Packet Headers
Queues
Time

Block transfer TimeInterconnect and IPC processing – “Wire-Time”
Message:~200 bytes
Block: e.g. 8K
LMS
Initiate send and wait
Receive
Process block
Send
Receive 8192 bytes/(1 Gb/sec)
Total access time: e.g. ~360 microseconds (UDP over 10GBE)Network propagation delay ( “wire time” ) is a minor factor for roundtrip time
( approx.: 6% , vs. 52% in OS and network stack )

Block Access Cost
Cost determined by •Block server process load
•Message Propagation Delay
•Operating system scheduling
• IPC CPU
• Block Access Cost = message propagation delay + IPC CPU + Operating System Scheduling + Block Server Load
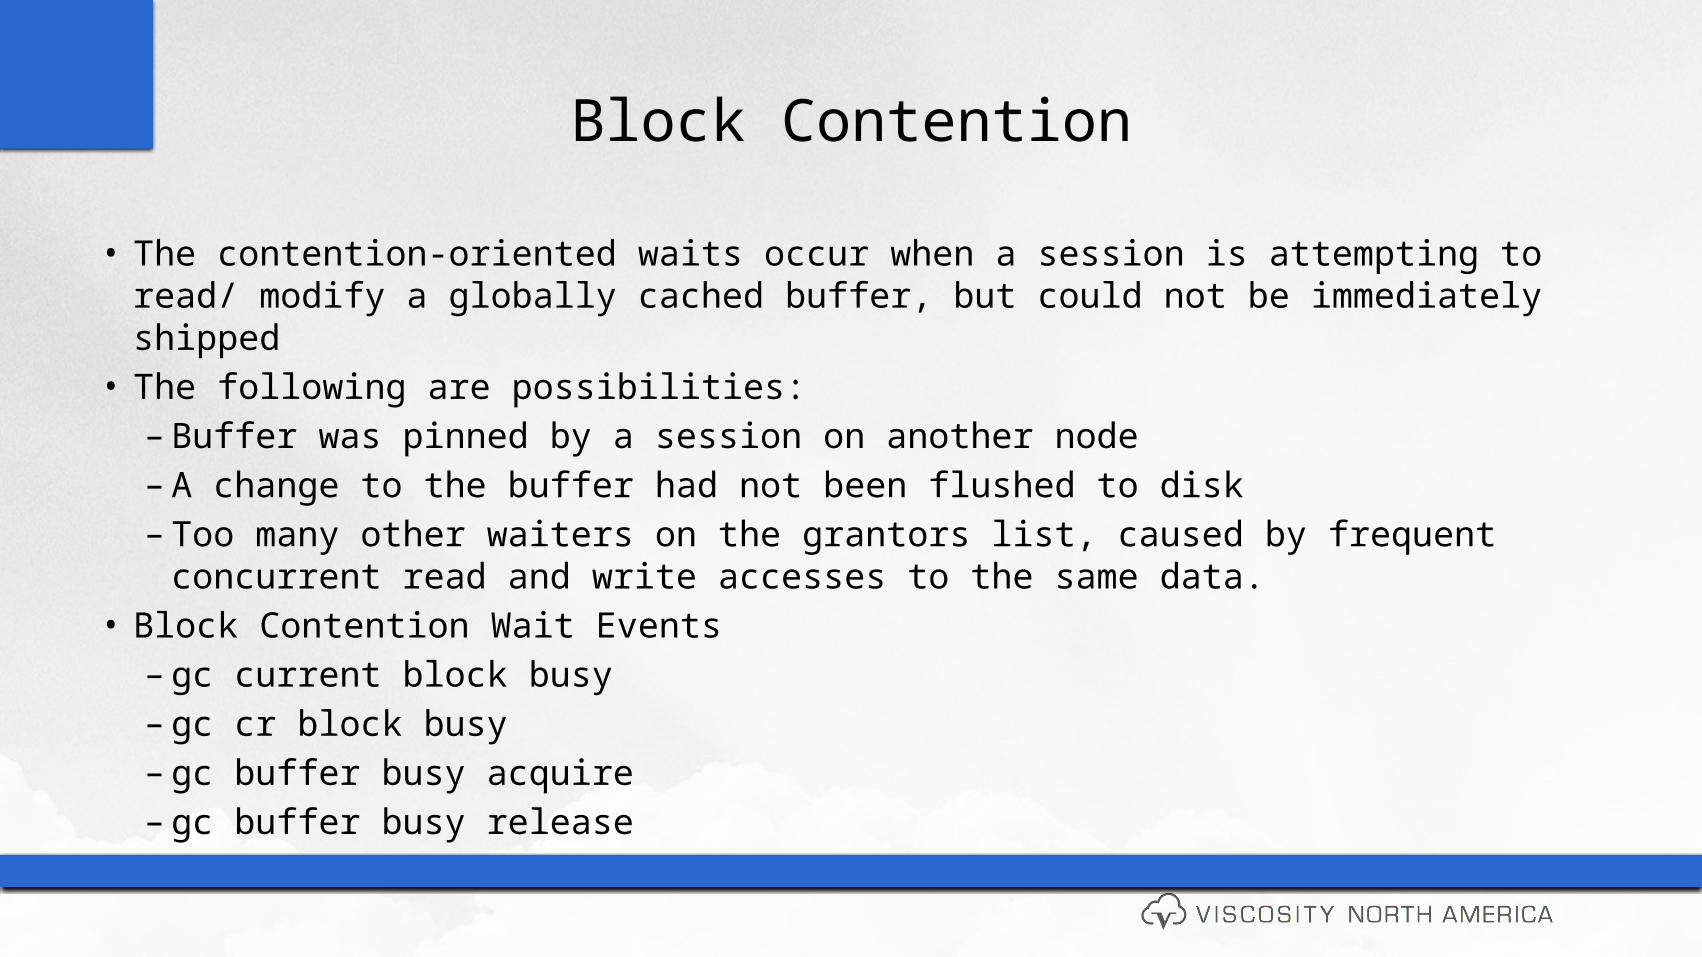
Block Contention
• The contention-oriented waits occur when a session is attempting to read/ modify a globally cached buffer, but could not be immediately shipped
• The following are possibilities:– Buffer was pinned by a session on another node– A change to the buffer had not been flushed to disk– Too many other waiters on the grantors list, caused by frequent concurrent read
and write accesses to the same data.• Block Contention Wait Events
– gc current block busy– gc cr block busy– gc buffer busy acquire– gc buffer busy release

Block Access CostPrepare, Build to ship
• Two key factors of Cache Fusion Latency
• CR block request time = build time + flush time + send time• Current block request time = pin time + flush time + send time
• Always refer send times too from other instances

Infrastructure: Cache Fusion Latency
• Average Prepare Latency = – Blocks Served Time/Blocks Served
• Blocks Server Time =– gc cr block build time +– gc cr block flush time +– gc current block pin time +– gc current block flush time +– gc current send time +– gc cr send time +
• Blocks Served = – gc cr blocks served + gc current blocks served

Identifying Issues
• Factors Affecting Performance of Immediate Global Cache Access
– Machine Load
• Process concurrency for CPU
• Scheduling
• CPU utilization
– Interconnect Bandwidth
• Total bandwidth utilization for the database(s)
– LMS processes
• Real time
• CPU busy
• No application tuning required
No contention Global Cache Access – how it looks in AWR
Accurate average: 100 µsecs
• Latency in Cluster has small impact
• Average Performance is good

Identifying Issues
• Factors Affecting Performance with Application Contention on Data
– Log File IO latency
– LGWR responsiveness
• Schema tuning may be required
– If the application response time or throughput do not meet objectives
Global Cache Access with application contention – how it looks in AWR
Impact of Application ContentionIndex
Contention
Block on the way from another instance
Block on the way from another instance
Transfer delayed by log flush on other node(s)

Identifying IssuesSQL and Schema Optimization: Identifying SQL incurring highest Cluster Wait Time
Indexes with High Contention, 1 accounting for 84%

Identifying IssuesCause and Effect are distributed – How to read the Global Impact
ISHAN
racdb1_1A
Local sessions waiting for transfer
Block pinged out; sessions waiting for its return
Transfer delayed by log flush on other node(s)
Global cache wait events: 35% significant higher than expected
NISHA
racdb1_3B
Variance and Outliers indicateThat IO to the log file disk group affects performance In the cluster
26.1 / 73.1

Cluster Cache Efficiency - AWR

Cluster Cache Efficiency - AWR

Cluster Cache Efficiency - AWR

COMMON PROBLEMS AND SYMPTOMS

Misconfigured or Faulty Interconnect Can Cause:
• Dropped packets/fragments• Buffer overflows• Packet reassembly failures or timeouts• Ethernet Flow control kicks in• TX/RX errors
“lost blocks” at the RDBMS level, responsible for 64% of escalations

“Lost Blocks”: NIC Receive Errors
ifconfig –a:eth0 Link encap:Ethernet HWaddr 00:0B:DB:4B:A2:04 inet addr:130.35.25.110 Bcast:130.35.27.255 Mask:255.255.252.0 UP BROADCAST RUNNING MULTICAST MTU:1500 Metric:1 RX packets:21721236 errors:135 dropped:0 overruns:0 frame:95 TX packets:273120 errors:0 dropped:1105 overruns:0 carrier:0
…

“Lost Blocks”: IP Packet Reassembly Failures
netstat –s
Ip: 84884742 total packets received … 1201 fragments dropped after timeout … 3384 packet reassembles failed

Top 5 Timed Events Avg %Total~~~~~~~~~~~~~~~~~~ wait CallEvent Waits Time(s)(ms) Time Wait Class----------------------------------------------------------------------------------------------------log file sync 286,038 49,872 174 41.7 Commitgc buffer busy 177,315 29,021 164 24.3 Clustergc cr block busy 110,348 5,703 52 4.8 Clustergc cr block lost 4,272 4,953 1159 4.1 Clustercr request retry 6,316 4,668 739 3.9 Other
Finding a Problem with the Interconnect or IPC
Should never be here

CPU Saturation or Memory Depletion
Top 5 Timed Events Avg %Total ~~~~~~~~~~~~~~~~~~ wait Call Event Waits Time(s)(ms) Time Wait Class----------------- --------- ------- ---- ----- ----------db file sequential 1,312,840 21,590 16 21.8 User I/Oread gc current block 275,004 21,054 77 21.3 Clustercongestedgc cr grant congested 177,044 13,495 76 13.6 Clustergc current block 1,192,113 9,931 8 10.0 Cluster2-waygc cr block congested 85,975 8,917 104 9.0 Cluster
“Congested”: LMS could not dequeue messages fast enoughCause : Long run queueus and paging on the cluster nodes

Impact of IO capacity issues or bad SQL execution on RAC
• Log flush IO delays can cause “busy” buffers• “Bad” queries on one node can saturate the link • IO is issued from ALL nodes to shared storage ( beware of one-node
“myopia” )
Cluster-wide impact of IO or query plan issues responsible for 23% of escalations

SummaryLook for: • High impact of “lost blocks” , e.g.gc cr block lost
• IO capacity saturation , e.g. gc cr block busy
• Overload and memory depletion, e.ggc current block congested
All events with these tags are potential issue, if their % of db time is significant.Compare with the lowest measured latency ( target , c.f. SESSION HISTORY reports or SESSION HISTOGRAM view )

INFRASTRUCTURE BEST PRACTICES AND CONFIGURATION

Infrastructure: Interconnect Bandwidth
• Interconnect must be private (can be VLAN)– Should not roll up to distribution switch (keep in layer 2 domain)
• Network Cards– Use Fast interconnect 10GbE (with jumbo frames) or Infiniband– Multiple NICs generally not required for performance and scalability
• Bandwidth requirements depend on – CPU power per cluster node– Application-driven data access frequency – Number of nodes and size of the working set– Data distribution between PQ slave

Infrastructure: IPC configuration
• Settings:– Socket receive buffers ( 256 KB – 4MB )– Negotiated top bit rate and full duplex mode – NIC ring buffers– Ethernet flow control settings– CPU(s) receiving network interrupts
• Verify your setup:– CVU does checking – Load testing eliminates potential for problems

Infrastructure: IO capacity
• Disk storage is shared by all nodes, i.e the aggregate IO rate is important
• Log file IO latency can be important for block transfers– Log file sync that exceed 500 ms are logged
• Parallel Execution across cluster nodes requires a well-scalable IO subsystem
– Disk configuration needs to be responsive and scalable
– Test with Calibrate I/O or Orion or SLOB2

<Insert Picture Here>
APPLICATION AND DATABASE DESIGN

Application Considerations
• Scheduling delays on high context switch rates on busy systems may increase the variation in the cluster traffic times
• Latch and mutex contention can cause priority inversion issues for critical background procs.
• More processes imply higher memory utilization and higher risk of paging
• Control the number of concurrent processes
– Use connection pooling
– Avoid connection storms (pool and process limits )
• Ensure that load is well-balanced over nodes
How to avoid Resource Contention in applications
vixencomet
racdb1_3 racdb1_4
Connection Pool
Oracle GI Oracle RAC
Oracle GI Oracle RAC

Services
• Application Workloads can be defined as Services– Workload Management– Do not ever ever use instance names
• Individually managed and controlled• On instance failure, automatic re-assignment• Service Performance is individually tracked• Finer Grained Control with Resource Manager• Integrated with Other Tools – i.e. Scheduler, Streams• Managed by Oracle Clusterware• Several services created and managed by the database

Scalability Pitfalls
• Serializing contention on a small set of data/index blocks
–monotonically increasing key –frequent updates of small cached tables–segment without ASSM or Free List Group (FLG)
• Full table scans• Frequent hard parsing• Concurrent DDL ( e.g. truncate/drop )
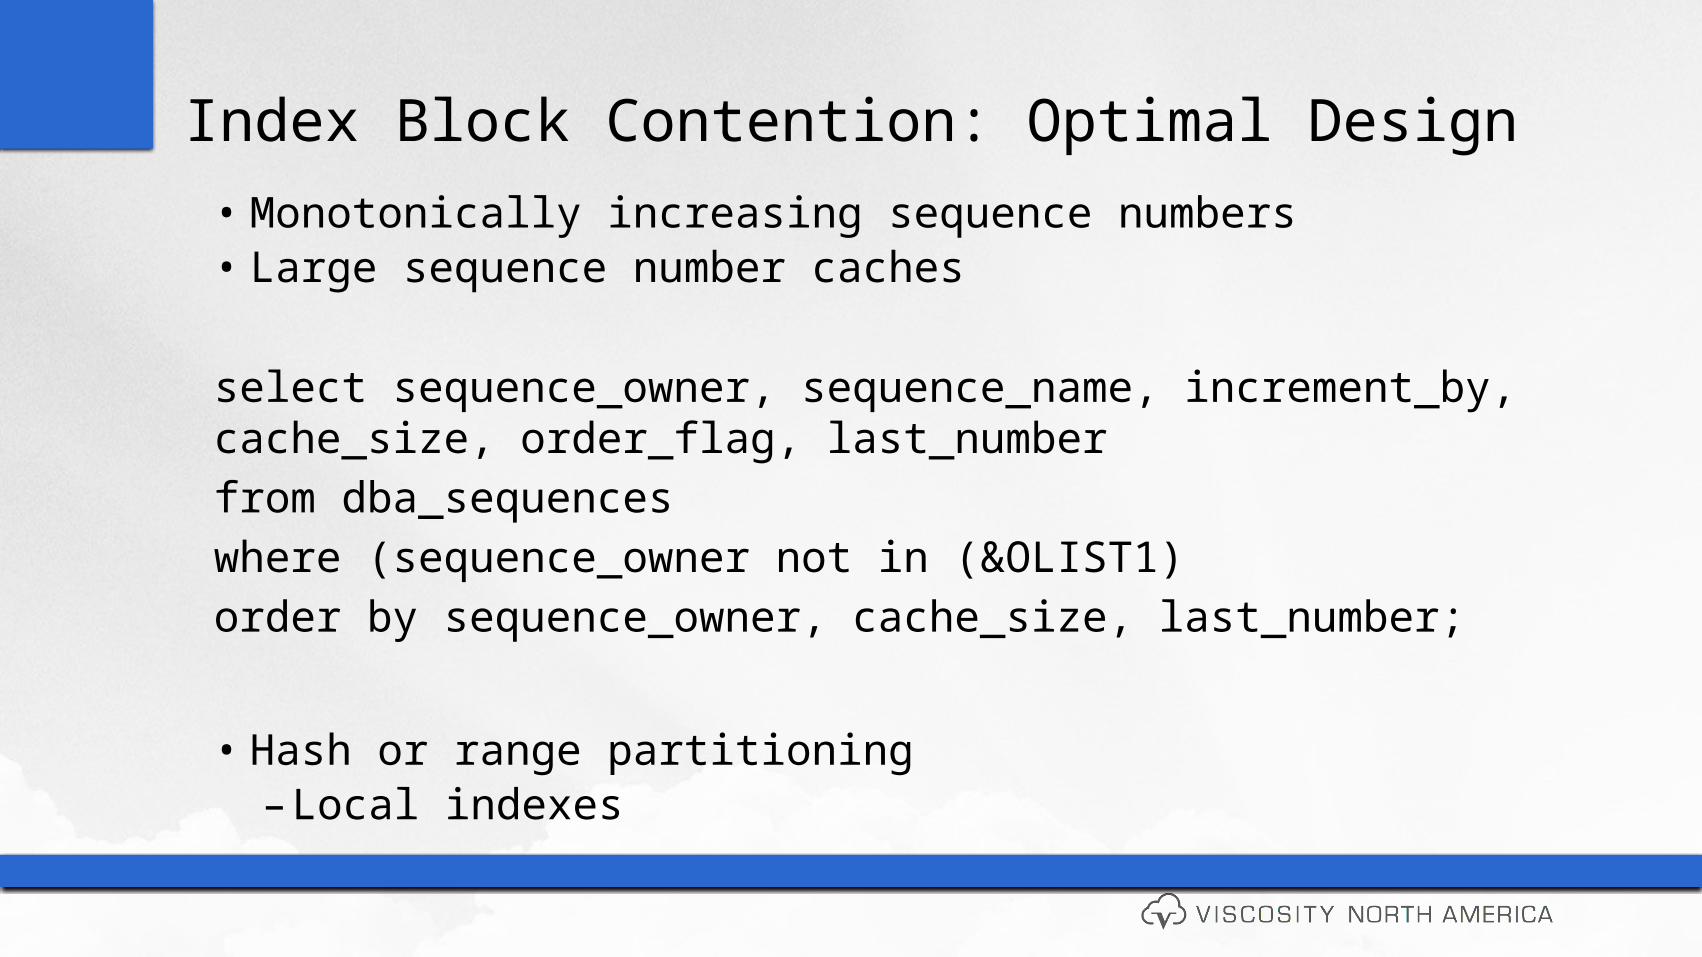
Index Block Contention: Optimal Design
• Monotonically increasing sequence numbers• Large sequence number caches
select sequence_owner, sequence_name, increment_by, cache_size, order_flag, last_numberfrom dba_sequenceswhere (sequence_owner not in (&OLIST1) order by sequence_owner, cache_size, last_number;
• Hash or range partitioning– Local indexes

Data Block ContentionOptimal Design
• Small tables with high row density and frequent updates and reads can become “globally hot” with serialization e.g.– Queue tables– session/job status tables– last trade lookup tables
• Higher PCTFREE for table reduces # of rows per block

Summary
Look for:• Indexes with right-growing characteristics
– Eliminate indexes which are not needed
• Frequent updated and reads of “small” tables– “small”=fits into a single buffer cache
• SQL which scans large amount of data– Bad execution plan– More efficient when parallelized

<Insert Picture Here>
SUMMARY: PRACTICAL PERFORMANCE ANALYSIS

Global Cache Event Semantics
All Global Cache Events will follow the following format:GC …• CR, current
– Buffer requests and received for read or write• block, grant
– Received block or grant to read from disk• 2-way, 3-way
– Immediate response to remote request after N-hops• busy
– Block or grant was held up because of contention• congested
– Block or grant was delayed because LMS was busy or could not get the CPU

What to Look For
Look for:• Gc [current/cr] [2/3]-way -Monitor if average ms > 1ms or close to Disk I/O latency. Look at
reducing latency
• Gc [current/cr] grant 2-way – Permission to read from disk. Monitor disk I/O
• Gc [current/cr][block/grant] congested – Long Block access cost. Review CPU/memory utilization
• Gc [current/cr] block busy – Review block contention
• Gc [current/cr][failure/retry] – Review private interconnect, network errors or hardware problems

Cluster Cache Coherency - EM

Cluster Database - EM

General RAC Principles
• Performance Monitoring & Diagnosis tools for RAC• AWR captures data from all active instances of RAC• ADDM presents data in cluster wide perspective• ASH reports statistics for all active sessions of all active instances• Enterprise manager is RAC aware • No fundamentally different design and coding practices for RAC• Badly tuned SQL and schema will not run better • Serializing contention makes applications less scalable• Standard SQL and schema tuning solves > 80% of performance problems

More detailed information is available at
viscosityna.com or by talking to a real
person at 469.444.1380
65