


Languages
Pages
Legal


© Copyright 2015 OSIsoft, LLC
Presented by
DOE/ComEd Microgrid Project at
Illinois Institute of Technology
Mohammad Shahidehpour, Illinois Institute of Technology; Chuck Wells, OSIsoft, LLC

2
Building Block of Smart Grid: Microgrids
Protect critical infrastructure from power losses in the event of physical or cyber
disruptions to the bulk electric grid.
Locally integrate renewables and other distributed generation sources and provide
reliable power to customers.
Ensure that critical operations can be sustained during prolonged utility power outages.
Power grid will be the “grid of grids” in the future.

DOE Project Objectives
Demonstrate higher reliability introduced by the microgrid system at IIT
Demonstrate the economics of microgrid operations
Demonstrate value of ancillary services to the grid
Allow for a decrease of fifty percent (50%) of grid electricity load via internally
generated power
Create a permanent twenty percent (20%) decrease in peak load from 2007
level
Defer planned substation through load reduction
Offer a distributed system design that can be replicated in urban
communities. 3

Boundaries of IIT Microgrid
4
IIT Microgrid is located 2.5 miles south of
downtown of Chicago and is bounded by
major streets, highways, and railroads.
• Funded by the Department of Energy
• Located at IIT
• Involves the entire campus
“The perfect power system will
ensure absolute and universal
availability of energy in the
quantity and quality necessary
to meet every consumer’s
needs. It is a system that never
fails the consumer.” Bob Galvin

5
North
substation
South
substation4.16kV
12.47kV
4.16kV
PCC
Utility grid
Vis
ta1E
Battery
Gas-turbine
Synchronous
Generators
Loo
p 1
Loo
p 3
Loo
p 7
PV
Loo
p 2
S
S
S
PV
S
PV
PV
S
Eng.1
Vis
ta1D
Wind
Vis
ta1BLS
Stuart
VanderCook
Machinery
CTA1
CTA2
Vis
ta1A
Vista1C
IIT Microgrid Overview
6
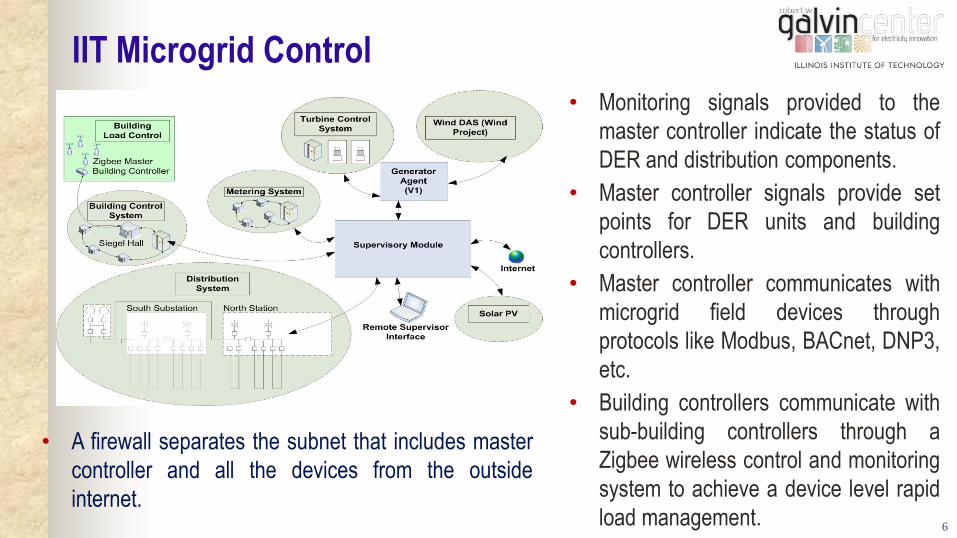
IIT Microgrid Control
• Monitoring signals provided to the
master controller indicate the status of
DER and distribution components.
• Master controller signals provide set
points for DER units and building
controllers.
• Master controller communicates with
microgrid field devices through
protocols like Modbus, BACnet, DNP3,
etc.
• Building controllers communicate with
sub-building controllers through a
Zigbee wireless control and monitoring
system to achieve a device level rapid
load management.
• A firewall separates the subnet that includes master
controller and all the devices from the outside
internet.

7
Microgrid Communication
• Complex communication (i.e. multiple
protocols) means more potential
vulnerabilities and unintentional errors.
• Linking to the Internet may introduce
common vulnerabilities..
• Wireless communication (e.g. Zigbee)
may incur more potential vulnerabilities.
• More network nodes means more
exploitable entry points and vectors.
• Extensive data gathering and two-way
information flows may broaden potential
for compromises of data confidentiality.

8

Cost of the IIT Microgrid
Total project cost: $13.6M $7.6M from DOE, $6M Cost Share
$9.5M Implementation, $4.1M Research and Development
Deferred Investment Cost at IIT Microgrid The IIT Microgrid project has deferred $7,000,000.
Reduction in total annual marginal CO2 emissions (%) = 1 - (49,078,224.44/52,536,042.84) = 6.58%
The total annual saving at IIT Microgrid is $1,171,878.60.
9

10
Community Microgrid

Community Microgrid at IIT
11

DC Microgrid at IIT
12

CSMART: (Center for Smart-Grid Applications, Research, and Technology)
13

Project Objectives
Demonstrate higher reliability introduced by the
microgrid system at IIT
Demonstrate the economics of microgrid operations
Demonstrate value of ancillary services to the grid
Allow for a decrease of fifty percent (50%) of grid
electricity load via internally generated power
Create a permanent twenty percent (20%) decrease in
peak load from 2007 level
Defer planned substation through load reduction
Offer a distributed system design that can be
replicated in urban communities. 14

A commercial grade replicable microgrid system
Key attributes:
Easy to configure
Easy to maintain
Integration with any network flow model
Easy for new users to understand
Able to control frequency and voltage in both connected and island mode
Seamlessly connect and disconnect from the grid
Able to control direction of power internally for Conservation Voltage Reduction
Able to sell ancillary services to the connected grid (fast regulation, curtailment,
etc.)
Able to provide uninterruptable power to critical loads inside the microgrid
15

Why Standards and Standards-based Models?
Avoid “spaghetti” software between applications
Avoid multiple copies of same data in multiple formats from different vendors
Use a single copy of the data that is compatible with all applications
CIM and IEC 61850 are global standards that provide 90% of what is required for a microgrid information
model
Need a highly detailed model of the power system
Standard file format
A model that power system software vendors will adopt
CIM and IEC 61850 provide standard mechanisms for expansion, thereby allowing the microgrid solution
to be developed and commercialized.
16
16

How does the IEC Modeling
Process Work?
Edit the model in standard
UML and start from base
model from IEC
Choose the appropriate
subset
Creates and manages AF
Library
Manages AF Elements and
Relationships
Instances Changes Standardized
XML File Formats
• Model maintenance tooling chosen by IEC
• File formats are standard
• Creates documentation as model is maintained
• CIM Adapter translates model information into AF
Recognized Process
17

OSIsoft, LLC Common Information Model
Objectives:
Low cost method of configuring AF database
Efficient method to configure the network flow model
Ease of migration to other microgrids
Automatic tagname creation per IEC 61850 standard
Automatic tag configuration using OSIsoft 61850 “connector”
Easy to modify and maintain via CIM incremental updates
CIM messages to the network model
Interoperable with any network model accepting CIM XML
Share information with other microgrids and the area electric power system
18

Microgrid Extensions to IEC 61970 CIM standard
Microgrid
PMU
AC lines with PMU
Breakers/switches with PMU
Transformers with PMU
DERs (PV, Battery, EV charging with PMUs)
CHP with PMU
Caps and reactors with PMUs
19

20
MicroGrid Specific AF Templates
20

21
MicroGrid data structure AF Templates
21

Added AF Templates
Unwrapped angle
Angle differences
Event detection
Grid Failure detection
FFT
System model identification (Realization)
22

Example of Unwrapping Angles
23
Angles at IIT Microgrid

Angle differences, using Element Relative displays
24

PI ProcessBook automatic GIS display from AF
25

Example Waterfall chart for the FFT
26

Cyber Secure Synchrophasor Platform (CSSP)
HA running on two SEL 3355 substation hardened
servers
Hot failover interfaces (IEC 61850, C37.118, Modbus,
DNP3, OPC)
PI FFT for grid failure detection
Configuration tested at Idaho National Laboratory
27
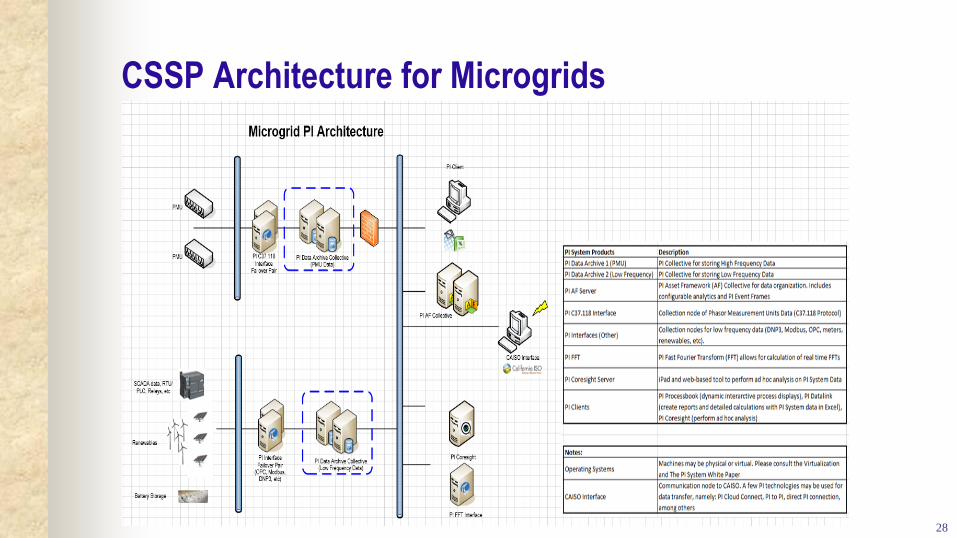
CSSP Architecture for Microgrids
28

SEL 3355 Substation hardened PCs – Microgrid Controller
29
Operating System:
Microsoft Windows Server 2012 R2 l (64-bit)
Chassis and Mounting:
3U Horizontal Rack-Mount
Processor:
Intel i7-3612QE Quad Core 2.1 GHz
Temperature Range:
–40° to +60°C
Expansion Slots:
5 Slots: 1 PCI, 2 PCIe-x1, 2 PCIe-x4
Power Supply A:
High Voltage: 125/250 Vdc or 120/240 Vac
Power Supply B:
High Voltage: 125/250 Vdc or 120/240 Vac
RAM Slot 1:
8 GB DDR3 1333 MHz ECC Mini-UDIMM
RAM Slot 2:
8 GB DDR3 1333 MHz ECC Mini-UDIMM
SSD Slot 1:
120 GB Industrial-Grade SLC SSD
SSD Slot 2:
120 GB Industrial-Grade SLC SSD
List price = $8085

Dynamic Event Triggering and Power Oscillation Modeling from Phasor Data
Raymond A. de Callafon (UCSD) & Charles H. Wells (OSIsoft)
PMU: device which measures waveforms of
alternating current (AC) electricity in a phasor
representation using a common time source (GPS
clock) for synchronization.
Power Oscillation Modeling Formulate Dynamic Models from Event
Data
Phasor Measurement Unit Detailed Information on Power Flow
Software Development and Results A preliminary of active management
Dynamic Event Triggering Mark Events in PMU Data in Real-Time
Summary
Detection of events via Filtered Rate of Change
(FRoC)
Allows for automatic real-time event detection
Modeling of events via Parallel FFT and
Realization
Allows for
• Real-time visual conformation of event and
• Formulation of linear low order dynamic models
Main Matlab GUI Event Detection and Analysis Modeling with Realization
Synchronized and real-time measurements
of:
• Phase angle (for power flow)
• Frequency [Hz]
• Real Power [W] and Reactive Power [VAR]
• Dynamic behavior of power flow!
Single PMU can produce
more than a dozen signals
at 60Hz
Contribution:
automatically
detect an event
(identify timing & trigger)
Fast sampling (60 or even 120Hz) of many
signals
• Demand on data/storage
• Data management
Approach:
• Auto Regressive Moving Average
(ARMA) filter for ambient data
• Rate-of-Change filter to create
FRoC signal 𝑓(𝑡) for detection
End Result:
• 𝑓(𝑡) has minimum variance
• 𝑓(𝑡) can be used for detection
• 𝑓(𝑡) computed real-time
1/Go
Ho/Go
_ Go/Ho Go/Ho
G()
H()
When event occurs, one
must
identify event and
dynamics.
Contribution:
automatically
characterize an event
(identify dynamics) Approach:
• For sustained oscillations: fixed length Parallel
FFT (PFFT) on downsampled data for high freq.
resolution
• For damped oscillations: estimation of linear
finite
order model with automatic reallization algorithm
End Result:
• Heat plots for observing change in frequency
• Linear finite order models for power flow
dynamics
• Models can be used for simulaton/damping
control
Data management of synchronized PMU data in
OSIsoft PI server and interface to Matlab GUI for
analysis, plotting, event detection and dynamic
modeling
Automatic event detection implemented in Matlab
GUI
Real-time event detection development PI template
Dynamic modeling via realization in Matlab GUI
[email protected] [email protected]
30

Income from sales of ancillary
services
Income from carbon credits
Allows Utility to integrate more
renewable
Lower cost of distribution inside
grid
Solution(s) Results and Benefits
Commercial microgrid Summary
Business Challenges
A. Provide uninterruptable
power to critical loads
B. Rapid restoration after storms
or disasters
C. Lower carbon emissions
A. Build a standards based
solution
B. Implement in AF
C. Application of advanced
decoupled control with PMUs
as measurement devices
The US Department of Energy selected
ComED/IIT/OSIsoft to demonstrate
commercial grade microgrid controllers in a
highly competitive bidding process.
31
North
substation
South
substation4.16kV
12.47kV
4.16kV
PCC
Utility grid
Vis
ta1
E
Battery
Gas-turbine
Synchronous
Generators
Lo
op
1
Lo
op
3
Lo
op
7
PV
Lo
op
2
S
S
S
PV
S
PV
PV
S
Eng.1
Vis
ta1
D
Wind
Vis
ta1
B
LS
Stuart
VanderCook
Machinery
CTA1
CTA2
Vis
ta1
A
Vista1C
Argonne Labs, University of Denver, S&C, AlstomGrid, and Schneider Electric are also involved
31

© Copyright 2015 OSIsoft, LLC
Mohammad Shahidehpour Chuck Wells
[email protected] [email protected]
Principal Investigator Industry Principal
ComEd/IIT OSIsoft, LLC
32

© Copyright 2015 OSIsoft, LLC
Questions
33
Please wait for the microphone before asking your questions State your name & company

© Copyright 2015 OSIsoft, LLC
Top Related