


Languages
Pages
Legal


Document of
The World Bank
FOR OFFICIAL USE ONLY
Report No. 51738-BR
INTERNATIONAL BANK FOR RECONSTRUCTION AND DEVELOPMENT
PROGRAM DOCUMENT
FOR A PROPOSED LOAN
IN THE AMOUNT OF US$195.450 MILLION
TO
THE STATE OF ALAGOAS, BRAZIL
WITH THE GUARANTEE OF THE FEDERATIVE REPUBLIC OF BRAZIL
FOR AN
ALAGOAS FISCAL AND PUBLIC SECTOR REFORM DEVELOPMENT POLICY LOAN
November 17, 2009
Poverty Reduction and Economic Management Brazil Country Management Unit Latin America and the Caribbean Region
This document has a restricted distribution and may be used by recipients only in the performance of their official duties. Its contents may not otherwise be disclosed without World Bank authorization.
Pub
lic D
iscl
osur
e A
utho
rized
Pub
lic D
iscl
osur
e A
utho
rized
Pub
lic D
iscl
osur
e A
utho
rized
Pub
lic D
iscl
osur
e A
utho
rized
Pub
lic D
iscl
osur
e A
utho
rized
Pub
lic D
iscl
osur
e A
utho
rized
Pub
lic D
iscl
osur
e A
utho
rized
Pub
lic D
iscl
osur
e A
utho
rized
ii
BRAZIL - GOVERNMENT FISCAL YEAR
January, 1 – December, 31
CURRENCY EQUIVALENTS
(Exchange Rate as of November, 16)
Currency Unit Real (R$) US$1.00 R$ 1.71
WEIGHTS AND MEASURES
Metric System
ABBREVIATION AND ACRONYMS AAA Analytic and Advisory Activity Atividade de Análise e Consultiva AFAL Alagoas’s Promotion Agency Agência de Fomento do Estado de Alagoas AL Alagoas Alagoas AL-Previd. Alagoas’s Social Security Institute Instituto de Previdência de Alagoas AMGESP Agency for the Modernization of Process
Management Agencia de Modernização da Gestão de Processos
BB Bank of Brazil Banco do Brasil BCB Central Bank of Brazil Banco Central do Brasil BMFSA Budgeting and Financial Systems
Assessment Avaliação dos Sistemas Orçamentários e Financeiros
BM&F Brazilian Mercantile and Futures Exchange Bolsa de Mercadorias e Futuros BNB Bank of the Northeast Region Banco do Nordeste BNDES National Bank of Economic and Social
Development Banco Nacional de Desenvolvimento Econômico e Social
BFP Bolsa Familia Program Programa Bolsa Família BPC Cash Tranfer to Elderly and Handicapped
People Benefício de Prestação Continuada
BRL Brazilian Real Real Brasileiro CARHP State Company of Human Resources and
Asset Management Companhia de Administração de Recursos Humanos e Patrimônio
CAS Country Assistance Strategy Estratégia de Assistência para o País CEF Federal Severance Bank Caixa Econômica Federal CEM Country Economic Memorandum Documento Econômico do País CGE State’s General Controller Controladoria Geral do Estado CGU Union’s General Controller Controladoria Geral da União CPMF Provisional Contribution on Financial
Transactions Contribuição Provisória sobre Movimentação Financeira
CPOF Committee for Budgetary and Financial Programming
Comité de Programação Orçamentária e Financeira
CPS Country Partnership Strategy Estratégia de Parceria para o País CRP Social Security Regularity Certification Certificado de Regularidade Previdenciária CVM Securities and Exchange Commission Comissão de Valores Mobiliários DPL Development Policy Loan Empréstimo para Políticas de
Desenvolvimento DSA Debt Sustainability Analysis Análise de Sustentabilidade da dívida EC41 Constitutional Amendment No 41 Emenda Constitucional No 41 EMBI Emerging Markets Bond Index Índice de Títulos da Dívida de Mercados

FOR OFFICIAL USE ONLY
This document has a restricted distribution and may be used by recipients only in the performance of their official duties. Its contents may not be otherwise disclosed without World Bank authorization.
iii
Emergentes ENAP National School of Public Administration Escola Nacional de Administração Pública EOP End of Period Fim de Período ESW Economic Sector Work Estudos em Economia e Setoriais FDI Foreign Direct Investment Investimento Estrangeiro Direto FG Federal Government Governo Federal FFS Fully Funded System Sistema de Capitalização FPE State Participation Fund Fundo de Participação dos Estados FRL Fiscal Responsibility Law Lei de Responsabilidade Fiscal FUNDEB Fund for Maintenance and Development of
Basic Education and of Teacher’s Valorization
Fundo de Manutenção e Desenvolvimento do Ensino Básico
FUNDEF Fund for Maintenance and Development of Primary Education and of Teacher’s Valorization
Fundo de Manutenção e Desenvolvimento do Ensino Fundamental
GDP Gross Domestic Product Produto Interno Bruto GFS Government Financial Statistics Estatísticas Financeiras do Governo GMR Matrix Management of Revenues Gerenciamento Matricial de Receitas GoA State Government of Alagoas Governo do Estado de Alagoas HDI Human Development Índex Índice de Desenvolvimento Humano HR Human Resources Recursos Humanos IASB International Accounting Standards Board Diretoria de Normas de Contabilidade
Internacional IBGE Brazilian Institute of Geography and
Statistics Instituto Brasileiro de Geografia e Estatística
IBOVESPA São Paulo Stock Market Index Índice da Bolsa de São Paulo IBRD International Bank for Reconstruction and
Development Banco Internacional para Reconstrução e Desenvolvimento
ICMS Brazilian State Value Added Tax Imposto sobre Circulação de Mercadorias e Serviços
IADB Inter-American Development Bank Banco Inter-Americano de Desenvolvimento IEG Independent Evaluation Group Grupo de Avaliação Independente IFI International Financial Institution Instituições Financeiras Internacionais IFRS International Financial Reporting Standards Normas de Relatórios Financeiros
Internacionais IGP General Price Index Índice Geral de Preços IMF International Monetary Fund Fundo Monetário Internacional INDG Institute for Managerial Development Instituto de Desenvolvimento Gerencial IPCA Consumer Price Index Índice de Preços ao Consumidor Amplo IPI Tax on Industrial Products Imposto sobre produtos Industriais IPVA Tax on Motor Vehicle Property Imposto sobre a Propriedade de Veículos
Automotores IR Income Tax Imposto de Renda IT Information Technology Tecnologia da Informação LDO Law of Budgetary Guidelines Lei de Diretrizes Orçamentárias LDP Letter of Development Policy Carta de Política de Desenvolvimento LOA Annual Budget Law Lei Orçamentária Anual LOAS Social Assistance Law Lei Orgânica da Assistência Social MBC Movement Brazil Competitive Movimento Brasil Competitivo MDS Ministry of Social Development Ministério de Desenvolvimento Social MIC Middle Income Country País de Renda Média MPOG Ministry of Planning, Budgeting and
Management Ministério de Planejamento, Orçamento e Gestão
MPS Ministry of Social Security Ministério da Previdência Social MTEF Medium Term Expenditure Framework Arcabouço Fiscal de Médio Prazo
iv
NCD Net Consolidated Debt Dívida Consolidada Líquida NCR Net Current Revenue Receita Corrente Líquida NFE Electronic Invoice Nota Fiscal Eletrônica NPL Non-Performing Loans Empréstimos com Desempenho Ruim NPV Net Present Value Valor Presente Líquido NRR Net Real Revenue Receita Líquida Real PAC Growth Acceleration Program Programa de Aceleração do Crescimento PAF Program of Fiscal Adjustment Programa de Ajuste Fiscal PARSEP State Pension Reform Technical Assistance
Project Projeto de Assistência as Reformas da Previdência
PEA Active Economic Population População Economicamente Ativa PEFA Public Expenditure and Financial
Accountability Avaliação de execução da despesa pública e gerenciamento financeiro
PER Public Expenditure Review Revisão de Despesas Públicas PFE State Finance Attorney Procuradoria da Fazenda do Estado PFM Public Finance Management Gestão de Finanças Públicas PME Employment Montlhy Survey Pesquisa Mensal de Emprego PNAD National Household Survey Pesquisa Nacional por Amostra de
Domicílios PNAFE National Program for State Finance
Secretariats Programa Nacional de Apoio às Secretarias Estaduais da Fazenda
PPA Multi-year Plan Plano Plurianual PPP Public-Private Partnership Parceria Público-Privada PRODETUR Tourism Development Promotion Program Programa de Desenvolvimento do Turismo PROES Program of States’ Banks Restructuring Programa de Reestruturação de Bancos
Estaduais PROFISCO National Program for Fiscal Modernization Programa de Apoio à Modernização dos
Fiscos Estaduais PSDB Brazilian Social Democratic Party Partido Social Democrata do Brasil PSIA Poverty and Social Impact Assessment Avaliação de Impactos Sociais e de Pobreza PYAG Pay as You Go system Sistema de Repartição Simples RBM Result Based Management Gestão por Resultados RGPS General System of Social Security Regime Geral da Previdência Social RPPS Pension System for the Public Sector
Employees Regime Próprio de Previdência Social
SEFAZ State Secetariat of Finance Secretaria de Estado da Fazenda SEGESP State Secetariat of Public Management Secretaria de Estado de Gestão Pública SELIC Headline interest rate from Central Bank
(Clearance and Trustee System) Taxa básica de Juros do Banco Central (Sistema Especial de Liquidação e Custódia)
SEPLAN State Secretariat of Planning Secretaria de Estado de Planejamento SIPREVI Social Security Information System Sistema de Informações da Seguridade
Social SISAP Integrated Personnel Data System Sistema de Administração de Pessoal SISBACEN Central Bank Information System Sistema de Informações do Banco Central SISOBI Obituary Information System Sistema Integrado de Registro de Óbitos SOF Federal Budget Secretariat Secretaria Federal de Orçamento SRE State Revenue Department Superintendência da Receita Estadual SS Social Security Previdência Social STE State Treasury Department Superintendência do Tesouro Estadual STN National Treasury Secretariat Secretaria do Tesouro Nacional SUDENE Northeast Development Agency Superintendência de Desenvolvimento do
Nordeste SUS National Health System Sistema Único de Saúde SWAp Sector Wide Approach Abordagem Setorial Ampla TA Technical Assistance Assistência Técnica TCE State Court of Accounts Tribunal de Contas do Estado

v
UNDP United Nations Development Program Programa das Nações Unidas para o Desenvolvimento (PNUD)
USD American Dollar Dolar Americano VAT Value Added Tax Imposto sobre o Valor Agregado (IVA) WPS Working Paper Series Serie de Documentos de Trabalho
Vice President: Pamela Cox Country Director: Makhtar Diop
Sector Manager: Rodrigo A. Chaves Sector Leader: Pablo Fajnzylber
Task Team Leader: Fernando Blanco


vi
BRAZIL
BR-ALAGOAS FISCAL AND PUBLIC SECTOR REFORM LOAN
LOAN AND PROGRAM SUMMARY........................................................................................................... vii I. INTRODUCTION ............................................................................................................................................... 1 II. COUNTRY CONTEXT ....................................................................................................................................... 4
RECENT ECONOMIC DEVELOPMENTS IN BRAZIL UP TO THE OUTSET OF THE GLOBAL CRISIS IN 2008 .......................................................................................................................................................................... 4 MACROECONOMIC OUTLOOK AND DEBT SUSTAINABILITY .................................................................... 7 ALAGOAS: ECONOMIC AND SOCIAL DEVELOPMENT ............................................................................... 13 THE PERFOMANCE OF ALAGOAS STATE GOVERNMENT (GoA) ............................................................. 20
III. THE GOVERNMENT PROGRAM ............................................................................................................... 26 FISCAL ADJUSTMENT........................................................................................................................................ 28 HUMAN RESOURCE MANAGEMENT .............................................................................................................. 32 SOCIAL SECURITY ............................................................................................................................................. 33 PUBLIC SECTOR MANAGEMENT .................................................................................................................... 36
IV. BANK SUPPORT TO THE GOVERNMENT’S PROGRAM ...................................................................... 38 LINK TO CPS ........................................................................................................................................................ 38 COLLABORATION WITH THE IMF AND OTHER DONORS ......................................................................... 39 RELATIONSHIP TO OTHER BANK OPERATIONS ......................................................................................... 40 LESSONS LEARNED ........................................................................................................................................... 41 ANALYTICAL UNDERPINNINGS ..................................................................................................................... 44
V. THE PROPOSED OPERATION ....................................................................................................................... 44 OPERATION DESCRIPTION ............................................................................................................................... 44 POLICY REFORM AREAS ................................................................................................................................... 49 OVERALL IMPACT AND DEBT SUSTAINABILITY ANALYSIS .................................................................. 60
VI. OPERATION IMPLEMENTATION ............................................................................................................. 68 POVERTY AND SOCIAL IMPACTS ................................................................................................................... 68 IMPLEMENTATION, MONITORING AND EVALUATION ............................................................................. 72 FIDUCIARY ASPECTS ......................................................................................................................................... 72 DISBURSEMENT AND AUDITING .................................................................................................................... 74 ENVIRONMENTAL ASPECTS ............................................................................................................................ 74 RISKS AND RISK MITIGATION......................................................................................................................... 75
ANNEX 1: MACROECONOMIC OUTLOOK: THE GLOBAL CRISIS EFFECTS ON THE BRAZILIAN ECONOMY ................................................................................................................................................................. 77 ANNEX 2: OPERATION POLICY MATRIX: Alagoas - Fiscal and Public Sector Reforms DPL ............................ 85 ANNEX 3: FISCAL SUSTAINABILITY ANALYSIS AND DPL PROGRAM IMPACTS ..................................... 95 ANNEX 4: FUND RELATIONS NOTE ................................................................................................................... 123 ANNEX 5: BRAZIL AT A GLANCE ...................................................................................................................... 124
The Alagoas Fiscal and Public Sector Reforms Loan was prepared by an IBRD team consisting of Fernando Blanco, William Dillinger, Anderson Caputo Silva, Antonio Paulo Vogel, Miguel Navarro-Martin, Evelyn Levy, Juliana Wenceslau Biriba, Tarsila Velloso, Luciano Wuerzius, Teresa Genta-Fons, Isabella Micali Drossos, Ngoc-Bich Tran, Raul Velloso, Chris Parel, Marcelo Caetano, Mario Rattes, José Gil Diaz, Regis Cunningham, Luiz Nerosky, Cícero Péricles de Carvalho, Samuel Franco, Zelia Brandt de Oliveira and Flavia Nahmias.

vii
BRAZIL BR-ALAGOAS FISCAL AND PUBLIC SECTOR REFORM LOAN
LOAN AND PROGRAM SUMMARY
Borrower State of Alagoas, Brazil with the Guarantee of the Federative Republic of Brazil Implementing Agency
State Secretariat of Finance
Financing Data IBRD Loan Amount: US$195.450 million
Terms: IBRD Flexible Loan with a Variable Spread Operation Type DPL Two-tranche operation. First tranche amounting toUS$120,000,125 to be disbursed
upon effectiveness and second tranche amounting to US$74.961,250 expected to be disbursed in FY2010. Front-End Fee amounting to US$488,625 (capitalized and included in the first tranche).
Main Policy Areas
The proposed Loan will support reforms in key areas of public administration, namely:
i. Fiscal adjustment
ii. Human resource management
iii. Social security system for civil servants.
iv. Public sector management Key Outcome Indicators (by 2011)
The goal of the proposed operation is to support the efforts of the State of Alagoas (GoA) in implementing cross cutting reforms that will contribute to the State’s broad objectives of reducing poverty and increasing growth to levels at least comparable to the average of northeastern states in Brazil.
The proposed program aims at four specific objectives:
i. Consolidating the State’s fiscal adjustment and enlarging the fiscal space for government investments.
Key Outcome Indicators: Net Consolidated Debt to Net Current Revenue Ratio of 1.75 in 2010 (from 1.97 in 2008 and 2.20 in 2007), Primary Balance to net Current Revenue Ratio of 0.15 in 2010 (from 0.13 in 2008 and 0.19 in 2007) and Net Operating Balance to Net Current Revenue ratio of 0.24 in 2010 (from 0.21 in 2008 and 0.19 in 2007).
ii. Enhancing the State’s human resource management to rationalize personnel expenses and improve service delivery.
Key Outcome Indicators: Personnel Expenditures to Net Current Revenue Ratio of 0.56 in 2010 (from 0.56 in 2008 and 0.58 in 2007), completion of the payroll audit in 2010 and adoption of corrective measures.
iii. Reducing the deficits generated by the social security system for civil servants.
Key Outcome Indicators: Social Security Deficit of the state RPPS of R$500 million in 2010 (from R$468 million in 2008), Application of Constitutional Amendment 41 parametric measures (from no application), net asset position of Social Security Fund of R$ 120 million (from 0 in 2009).
iv. Improving public sector management through better planning, budgeting, and expenditure execution cycles.
Key Outcome Indicators (BFMA Scores): Aggregate expenditure out-turn compared with original approved budget = A-B (from C in 2009), definition of planning competencies between central and line secretariats = A-B (from D in 2009) and Guidelines for preparation of PPA, LDO and LOA = A-B from C in 2009 and Macro-Fiscal programming = B (from C in 2009).

viii
Program Development Objectives and Contribution to CPS
The proposed loan will support significant and sustainable reforms in key areas of public administration. These reforms would expand fiscal space for public investments. They will also allow the State to use more effectively its own resources and those transferred by the Federal Government to undertake a program of targeted capital investments and improve its management capability. Such improvements are a necessary condition for eventually meeting the high order objectives of reducing poverty levels and achieving levels of economic growth comparable to those of other states in the region. In addition, the proposed loan will help the State to comply with the Federal Fiscal Responsibility Law (FRL), a purpose shared by Brazil’s Federal Authorities. The proposed operation is fully consistent with and closely linked to the objectives of the Brazil Country Partnership Strategy (CPS), 2008-2011. Sound macroeconomic management, fiscal reform, efficient public sector management, and good governance are key pillars of the CPS strategy for achieving inclusive economic growth in Brazil. The CPS also identifies support for the states (under results-oriented public sector reforms) and improvement in fiscal management as two of the most important areas of Bank engagement.
Risks and Risk Mitigation
The risks associated with this operation are substantial and include:
i. Political Economy. Some of the reforms supported by the DPL will be likely opposed by entrenched interest groups. Public employee unions, in particular, are powerful and have responded to previous efforts to reduce payroll costs with extended strikes. Nonetheless, the political environment is currently more propitious. The administration is strongly committed to reform as evidenced by important policy actions undertaken during loan preparation. The operation is also strongly supported by the Federal Government.
ii. Timetable. The current Governor’s term ends in December 2010. To succeed, reforms should therefore be implemented rapidly. In fact, the most difficult actions in each of these areas are currently being implemented and will be prior actions for the first tranche. Second tranche actions will be follow up measures that are expected to be in place during the current administration’s mandate.
iii. Technical and Implementation Capacity. Lack of a professional civil service complicates the design and implementation of public policies. During project preparation intense technical assistance was provided in critical areas such as human resource management, social security and investment management. Moreover some of the main reforms to be supported in the area of public sector management comprise procedural and administrative improvements that will be self-sustaining.
iv. The Global Crisis. There is considerable risk that the fiscal repercussions of the global economic crisis could partially offset the gains made in the last two years. In 2009, revenues have fallen substantially, specially the transfers from the Federal Government--the most important revenue source for the State. Falling revenues, however, increase the importance of implementing further reforms aimed at rationalizing Government’s expenditures.
The risks associated with the program need to be weighed against the alternative of continued inertia. Alagoas is one of the poorest states in Brazil. Failure to address the state’s problems may contribute to maintaining the conditions of poverty currently suffered by half of its population—about 1.5 million people.
Project ID Number PE-P103770-LEN-BB


1
PROGRAM DOCUMENT FOR A PROPOSED: ALAGOAS - FISCAL AND PUBLIC SECTOR REFORM DEVELOPMENT
POLICY LOAN TO THE STATE OF ALAGOAS, BRAZIL
I. INTRODUCTION
1. This program document presents a proposed two-tranche Development Policy Loan (DPL) in the amount of US$ 195.450 million to the State of Alagoas, Brazil. The proposed operation is designed to assist the Government of Alagoas (GoA) in the initial stages of implementing a process of financial and management reform. The DPL will support significant improvements in key areas of public administration. In this process, the DPL will assist in providing the basis for long term fiscal sustainability and enhanced public service delivery—important requisites for reducing poverty and increasing growth.
2. Alagoas is one of the poorest states in Brazil. It has the highest poverty rate in the country, with half the population living below the poverty line. It ranks second-lowest in the Human Development Index (HDI). If it were a sovereign country Alagoas’ HDI would rank 120th among the 185 countries members of the United Nations. In 2006, its per capita Gross Domestic Product (GDP) was US$ 2,200, the third lowest in the country, and only 40 percent of the national average. While Brazil and the Northeast in particular have managed to seize new economic opportunities in recent years, Alagoas has not. Its economic growth over the last decade has lagged both the regional and national averages. Social and economic stagnation are likely to persist unless major reforms are undertaken.
3. The State government is a key factor in the state’s social and economic development. It is the principal provider of education, health, police, transport and basic infrastructure services. Chronic fiscal crises, poor policy choices, and bureaucratic inefficiency have prevented the State from performing these functions well. As a result of excessive borrowing in the past, the State is highly indebted and must allocate a significant proportion of its revenues to servicing its debts. Much of its remaining revenues are devoted to paying the wages of public employees who tend to be inefficiently allocated among government responsibilities, under-motivated, and in some cases, overpaid relative to public employees in other Brazilian states. Payments to retired state employees are also a significant drain on resources, exacerbated by the State’s failure to keep accurate pension records or take advantage of recent national social security reform which mandates the adoption of a set of measures to reduce pensions and improve the administration of civil service social security systems to be applied by the federal, states and municipal governments. The budget proposals of the State secretariats are only loosely related to the State Government’s priorities. Expenditure execution is slow and inefficient which is reflected in poor quality of public goods and services.
4. Relative to this poor state of affairs, the current administration has made significant reform efforts, particularly in the fiscal area. On taking office in 2007, the administration inherited i) a Net Consolidated Debt (NCD) equal to 2.22 times the State’s Net Current Revenue (RCL) and ii) substantial public wage increases granted by the previous administration at the end of its term. The government immediately responded by stepping up enforcement on the
2
collection of the State’s Value Added Tax (VAT), the so called, Imposto sobre a Circulação de Mercadorias e Servícios (ICMS), reducing discretionary operating costs by 20 percent, negotiating a rollback in the wage increases granted by the previous government, and by making sharp cuts in investment expenditures.
5. As a result of these measures and growth acceleration in 2007 and 2008, the State’s fiscal performance improved considerably. The GoA increased its primary and gross operating surpluses, obtained two consecutive positive overall balances (in 2007 and 2008) and reduced the ratio of consolidated debt to net current revenue from 2.22 in January 2007 to 1.85 in August 2009. These measures also permitted increases in capital investments in 2008.
6. These achievements, however, are now threatened by the global economic crisis, which is reducing State revenues, mainly constitutional federal revenue-sharing transfers that are the most important GoA’s revenue source. Federal tax revenues have experienced a strong fall due to the national economic slowdown and the adoption of countercyclical fiscal policies that temporarily reduced rates on the taxes that are shared with sub-national governments. This has affected all Brazilian states and municipalities, but especially those more dependent on federal transfers such as the GoA. Facing a strong revenue fall, the State administration recognizes that further adjustment measures will be required, especially with regard to the containment of current expenditures.
7. To preserve the fiscal adjustment initiated in 2007, the Government has adopted additional decisive actions to reduce current expenses, in particular personnel expenditures, the most important and persistent source of fiscal disequilibria. While federal legislation prohibits the dismissal of civil servants, the State has now completed a census of personnel in order to identify “ghost” workers and is performing an audit of the State payroll to identify irregularities in the compensation of active employees, pensioners, and dependent survivors. The State has also submitted to the State assembly a wide-ranging reform in the pension system for State employees, incorporating administrative, parametric and structural changes to the system. To reduce expenditures on government purchases of goods and services, the GoA has been implementing reforms in its procurement system to generate additional savings.
8. In this context, the GoA has sought Bank’s assistance in fine tuning its own program of fiscal and public management reforms. The proposed DPL envisions the consolidation of the State’s fiscal adjustment, the creation of additional fiscal space for public investment, and the improvement of public sector efficiency. This program has been structured around the four components of Alagoas’s medium term strategy for the enhancement of its fiscal accounts and the improvement of public sector management:
• The fiscal adjustment component;
• The human resource management component;
• The social security component; and
• The planning, budget and expenditure management component.
9. The program is strongly supported by the Federal Government. The components of the program have been defined in consultation with the National Treasury Secretariat (STN), which is the State’s principal creditor. STN is also responsible for managing a national program of state fiscal adjustment, in which Alagoas participates. The proposed World Bank operation would incorporate the PAF targets and would assist the GoA in achieving them.

3
10. The proposed operation and associated Bank support meet the criteria for engagement with sub-national governments agreed under the Country Partnership Strategy (CPS) for 2008-2011. As specified in the CPS, the level of Bank lending must be consistent with the credit ceilings specified in each State’s Program of Fiscal Adjustment (PAF) and must be approved by the STN. The proposed operation has been developed on the basis of key principles of engagement: i) a shared understanding of the fiscal and managerial challenges facing the State, ii) State ownership of the program, with policy measures emerging from the authorities own initiatives and designed in consultation with Bank staff; and iii) political commitment at the highest levels.
11. The risks associated with this operation are considerable. Reform will likely be opposed by entrenched political interests. The technical capacity of the State bureaucracy is weak. The window of opportunity for reform is short. These risks are mitigated, however, by at least three factors. First, the hard budget constraint confronting the State provides an impetus for reform, which helps offset internal opposition. Second, the specific Government actions that would be supported under the proposed operation have been designed to be technically and politically feasible within the available time frame. Third, as part of its reform program, the Government is implementing two strategic programs aimed at building additional technical capacity and strengthening the State’s management systems in the critical areas of human resources, procurement, and planning, budgeting and expenditure execution. These programs are part of the GoA’s portfolio of priority projects, which should help guarantee their sustained budgetary funding.
12. Finally, there is also a considerable risk that the fiscal repercussions of the global economic crisis could partially offset the gains made through the fiscal reforms supported by the proposed operation and thus call for further adjustment efforts. The fiscal performance of the State will therefore be closely monitored throughout the disbursement period and the need for further adjustments in order to meet the project’s fiscal targets will be regularly discussed with the Government.
13. All of the risks associated with the project should, of course, be weighed against the alternative of not supporting Alagoas. In this respect, if the GoA were to fail in its efforts to address the state’s fiscal problems the hopes of 1.5 million people—half the state’s population—to one day come out of poverty could have to be postponed once again.
4
II. COUNTRY CONTEXT
RECENT ECONOMIC DEVELOPMENTS IN BRAZIL UP TO THE OUTSET OF THE GLOBAL
CRISIS IN 2008
14. Following the episodes of the Southeast Asian and Russian crises in the late 1990s and which hit the Brazilian economy hard, the country economic policy efforts have focused on the establishment of a consistent and credible macroeconomic framework. The combination of sound macroeconomic management and the favorable external environment of the last decade, prior to the on-going global crisis, allowed Brazil to maintain macroeconomic stability, increase growth, reduce poverty and enhance its resilience to external shocks (see Table 1 below).
15. This framework consisted in the adoption of a strong fiscal discipline, an inflation targeting regime and a flexible exchange rate. On the fiscal side, the government pursued a policy of primary fiscal-balance targets to reduce public debt. Primary balances of about 4 percent of GDP achieved annually since 1999 resulted in a declining public debt path and contributed to continuous improvement in credit ratings and the achievement of investment grade in 2008. In addition, through effective debt management, the Brazilian government also improved the composition of public debt thereby lessening vulnerabilities associated with exchange rate and interest rate shocks.
16. Fiscal discipline was also pursued by sub-national governments. Until a decade ago, the fiscal behavior and indebtedness of state and municipal governments were a major source of macroeconomic instability. In 1997, the Federal Government assumed the debts of 25 of the 27 states that were unable to service their debt1. As part of the agreement, the Federal Government negotiated structural adjustment programs with the states. The so called Programs of Fiscal Adjustment (PAF) set annual targets over three year “rolling” periods on indebtedness, primary balances, personnel spending, tax revenue and public investment2 aimed at guaranteeing a gradual decline in their indebtedness3. In 2000, the controls on sub-national fiscal performance were strengthened by the Fiscal Responsibility Law (FRL). The FRL explicitly prohibits debt refinancing operations between different levels of government, which moderates the moral hazard problem in intergovernmental fiscal relations derived from sequential bailouts by setting limits on personnel costs, borrowing, and indebtedness.
17. Results were immediate and impressive. Sub-national governments have accompanied the adjustment efforts of the Federal Government and generated robust primary surpluses, which have in turn contributed to the overall improvement in Brazil’s fiscal accounts and lessened debt sustainability-related uncertainty. Furthermore, the FRL may serve as a good model for other federative countries contemplating imposing fiscal discipline at various levels of government.
18. The inflation targeting regime has also been very successful in anchoring inflation expectations. Operationally independent, the Central Bank of Brazil (BCB) has been able to
1 Alagoas was one of the 25 states that refinanced their debt under this bail-out program. 2 . PAFs are negotiated annually. 3 For a more detailed description of Brazil’s institutional framework for sub-national fiscal discipline, see the recent ESW report “Brazil: Topics in Fiscal Federalism”.
5
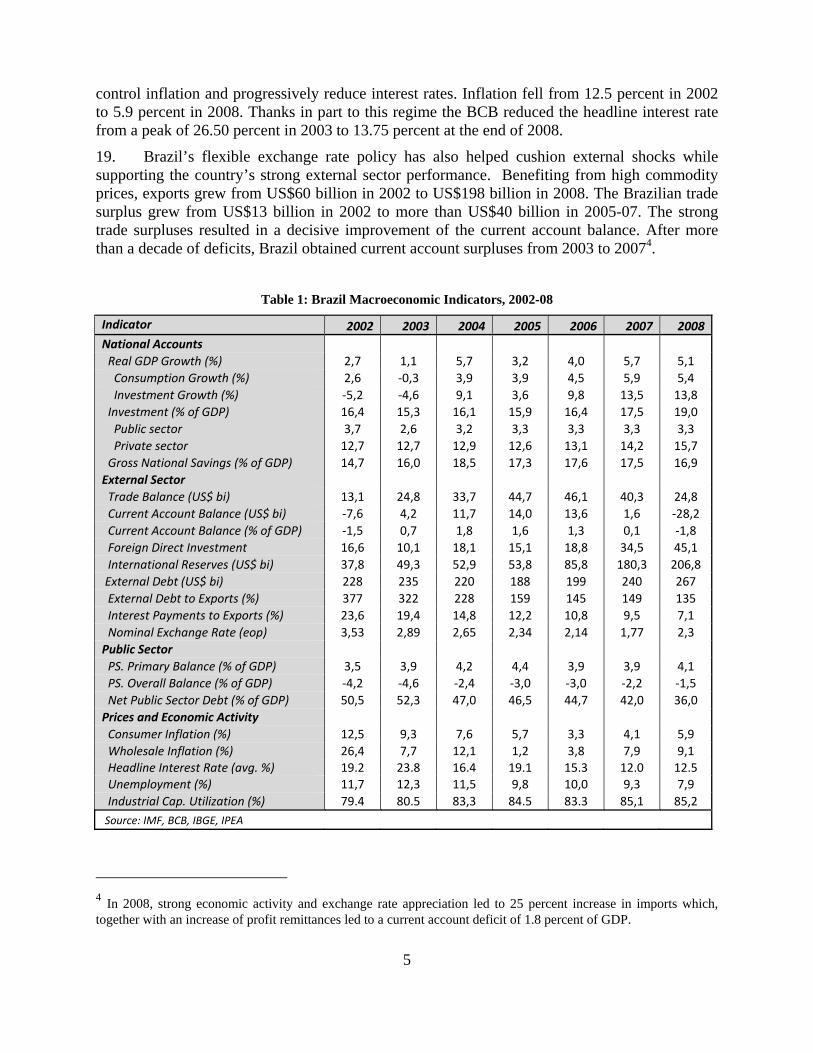
control inflation and progressively reduce interest rates. Inflation fell from 12.5 percent in 2002 to 5.9 percent in 2008. Thanks in part to this regime the BCB reduced the headline interest rate from a peak of 26.50 percent in 2003 to 13.75 percent at the end of 2008.
19. Brazil’s flexible exchange rate policy has also helped cushion external shocks while supporting the country’s strong external sector performance. Benefiting from high commodity prices, exports grew from US$60 billion in 2002 to US$198 billion in 2008. The Brazilian trade surplus grew from US$13 billion in 2002 to more than US$40 billion in 2005-07. The strong trade surpluses resulted in a decisive improvement of the current account balance. After more than a decade of deficits, Brazil obtained current account surpluses from 2003 to 20074.
Table 1: Brazil Macroeconomic Indicators, 2002-08
Indicator 2002 2003 2004 2005 2006 2007 2008National Accounts Real GDP Growth (%) 2,7 1,1 5,7 3,2 4,0 5,7 5,1 Consumption Growth (%) 2,6 -0,3 3,9 3,9 4,5 5,9 5,4 Investment Growth (%) -5,2 -4,6 9,1 3,6 9,8 13,5 13,8 Investment (% of GDP) 16,4 15,3 16,1 15,9 16,4 17,5 19,0 Public sector 3,7 2,6 3,2 3,3 3,3 3,3 3,3 Private sector 12,7 12,7 12,9 12,6 13,1 14,2 15,7 Gross National Savings (% of GDP) 14,7 16,0 18,5 17,3 17,6 17,5 16,9 External Sector Trade Balance (US$ bi) 13,1 24,8 33,7 44,7 46,1 40,3 24,8 Current Account Balance (US$ bi) -7,6 4,2 11,7 14,0 13,6 1,6 -28,2 Current Account Balance (% of GDP) -1,5 0,7 1,8 1,6 1,3 0,1 -1,8 Foreign Direct Investment 16,6 10,1 18,1 15,1 18,8 34,5 45,1 International Reserves (US$ bi) 37,8 49,3 52,9 53,8 85,8 180,3 206,8 External Debt (US$ bi) 228 235 220 188 199 240 267 External Debt to Exports (%) 377 322 228 159 145 149 135 Interest Payments to Exports (%) 23,6 19,4 14,8 12,2 10,8 9,5 7,1 Nominal Exchange Rate (eop) 3,53 2,89 2,65 2,34 2,14 1,77 2,3 Public Sector PS. Primary Balance (% of GDP) 3,5 3,9 4,2 4,4 3,9 3,9 4,1 PS. Overall Balance (% of GDP) -4,2 -4,6 -2,4 -3,0 -3,0 -2,2 -1,5 Net Public Sector Debt (% of GDP) 50,5 52,3 47,0 46,5 44,7 42,0 36,0 Prices and Economic Activity Consumer Inflation (%) 12,5 9,3 7,6 5,7 3,3 4,1 5,9 Wholesale Inflation (%) 26,4 7,7 12,1 1,2 3,8 7,9 9,1 Headline Interest Rate (avg. %) 19.2 23.8 16.4 19.1 15.3 12.0 12.5 Unemployment (%) 11,7 12,3 11,5 9,8 10,0 9,3 7,9 Industrial Cap. Utilization (%) 79.4 80.5 83,3 84.5 83.3 85,1 85,2 Source: IMF, BCB, IBGE, IPEA
4 In 2008, strong economic activity and exchange rate appreciation led to 25 percent increase in imports which, together with an increase of profit remittances led to a current account deficit of 1.8 percent of GDP.

6
20. Such robust external performance led to strong accumulation of international reserves, which grew to US$206 in December 2008 from US$37 billion in 2002. The growing strength of Brazil’s external position allowed the country to make an early repayment of its outstanding obligations to the International Monetary Fund (IMF) in December 2005 and to the Paris Club in 2006, as well as the retirement of its Brady Bonds in 2006. As a result, Brazilian public sector net external debt is now negative, and Brazil’s external debt sustainability indicators have improved noticeably. Strong exports reduced the interest payments-to-exports ratio from 24 percent in 2002 to 7.1 percent in 2008. Similarly, there was a significant decrease in the debt-to-exports ratio from 350 percent in 2002 to 100 percent in 2008.
21. GDP growth rates have also increased. Between 2004 and 2008 the economy grew on average 4.7 percent, well above the average annual rate of just below 2.5 percent of the previous two decades. The increase in growth was driven by domestic consumption and more recently by the acceleration of capital formation, both fostered by vigorous credit expansion.
22. Higher growth coupled to improvements in social policies resulted in pronounced poverty and income inequality reductions. The poverty rate dropped to 21.6 percent in 2008 from 32.9 percent in 2002. The drop was due mainly to higher economic growth, real increase in the minimum wage, well targeted conditional cash transfer programs (such as Bolsa Familia- PBF), increases in labor income and a decline in unemployment from over 12 percent in 2003 to below 9 percent in 2008. The Gini index also fell to 0.55 in 2008 from 0.59 in 2002.
23. Despite these remarkable improvements, the Brazilian economy still faces a number of structural challenges. Capital formation is still low, inferior to 20 percent of GDP, and may be an obstacle to more robust and sustained growth. In addition, high taxation and government consumption limit Brazil’s growth potential.
Box 1. Brazilian Fiscal Federalism and the Control of Sub-National Fiscal Performance
The fiscal stance of Brazilian states has always been an important element in macroeconomic management in Brazil. Until the late 1990s, the expansionary fiscal policies by the states and the lack of effective controls over their indebtedness resulted in frequent sub-national debt crises. In three different occasions (1989, 1993 and 1997) the Federal Government had to assume and reschedule the debts of the states. The largest operation occurred in 1997, under Law 9496, when the Federal Government restructured R$ 200 billion (12 percent of national GDP) of the debts owed by the states.
In the 1997 refinancing operation, the debts were refinanced for 30 years. This refinanced debt, so called intra-limite debt, carries a real interest rate of 6 percent, with the nominal value of the debt rising by inflation. An interesting feature of the agreement was the capping of the debt service at 13 percent of states’ net current revenues. Any debt service above the 13 percent cap is recapitalized and added to the intra-limite debt stock. At the end of the contracts (in 2028), if there are residual debt balances, the state must pay off the remainder within 10 years
The 1997 bailout was conditioned upon the state’s compliance with medium-term fiscal adjustment and structural reform programs. In exchange for the rescue package, the debt renegotiation contracts mandate the implementation of three-year rolling Programs of Fiscal Adjustment (PAFs) to be agreed upon by the National Treasury Secretariat and the 25 states that had their debt rescued by the STN during the period of the contract. The PAFs set annual targets on indebtedness, primary balances, personnel spending, tax revenue and public investment, in order to guarantee a gradual decline in indebtedness. In addition, the PAFs include structural reforms such as privatization or other public sector modernization initiatives.
The controls on sub-national fiscal performance were further strengthened by the approval of the Fiscal Responsibility Law (Lei de Responsabilidade Fiscal – LRF) in 2000. The LRF institutionalized fiscal discipline at all levels of government, incorporating hard budget constraints into a single unifying framework. It explicitly prohibits

7
debt refinancing operations between different levels of government, thereby addressing the moral hazard problem in intergovernmental fiscal relations caused by sequential bailouts. Complementary Senate resolutions also prohibit borrowing if: (i) the net consolidated debt exceeds twice net current revenue (RLC – Receita Liquida Corrente); 5 (ii) new credit operations exceed 16 percent of RLC, and (iii) debt service exceeds 11.5 percent of RLC. Borrowing is also prohibited if it violates the debt reduction schedules set by the debt renegotiation contracts under the Law 9496. Finally, emission of sub-national governments bonds is generally prohibited through 2016; however, states whose net debt is less than net current revenue can issue bonds after 2011, although even here the Federal Government retains to the option to review the decision to issue bonds.
This system of controls has resulted in a substantial macroeconomic adjustment as evidenced by repeated state and municipal surpluses and control of sub-national indebtedness. In addition, this system has also favored the adoption of appropriate expenditure programs by sub-national governments. Other FRL requirements improved transparency, strengthening of budgetary practices and the application of the golden rule at the subnational level favoring the improvement of public expenditure quality.
Transparency. Budget outturns and compliance with the LRF—including a statement of corrective measures if the relevant provisions are breached—are reported on a regular basis. Municipalities and states are also required to report the fiscal outturns of the previous year to the Ministry of Finance. The legislative branch of each level of government, aided by their respective Court of Accounts, monitors observance with the fiscal targets and ceilings. Reports on constitutional requirements for minimum expenditure levels in education and health are also published by sub-nationals.
Budget Institutions. The FRL introduces more stringent requirements on fiscal targets in the preparation of the Budget Guidelines Law (Lei de Diretrizes Orcamentárias – LDO), strengthening its role in budget preparation and fiscal management in general. The LRF also calls for a detailed assessment of the government’s contingent liabilities and strengthens the link between the Annual Budget Law (Lei de Orçamento Anual – LOA) and the LDO. A complementary Fiscal Crime Law is applied to all levels of the public administration, with the possibility of detention for those public officials not complying with the FRL.
Golden rule. To prevent financing of current spending by borrowing, the amount of new loans contracted is limited to the amount of the capital expense. In practice, it means that any loans contracted will only be destined to expenses related to investments.
In summary, after ten years of consolidating macroeconomic credibility, the sub-national fiscal discipline framework has generated the requirements and incentives for the adoption of adequate expenditure programs.
MACROECONOMIC OUTLOOK AND DEBT SUSTAINABILITY6
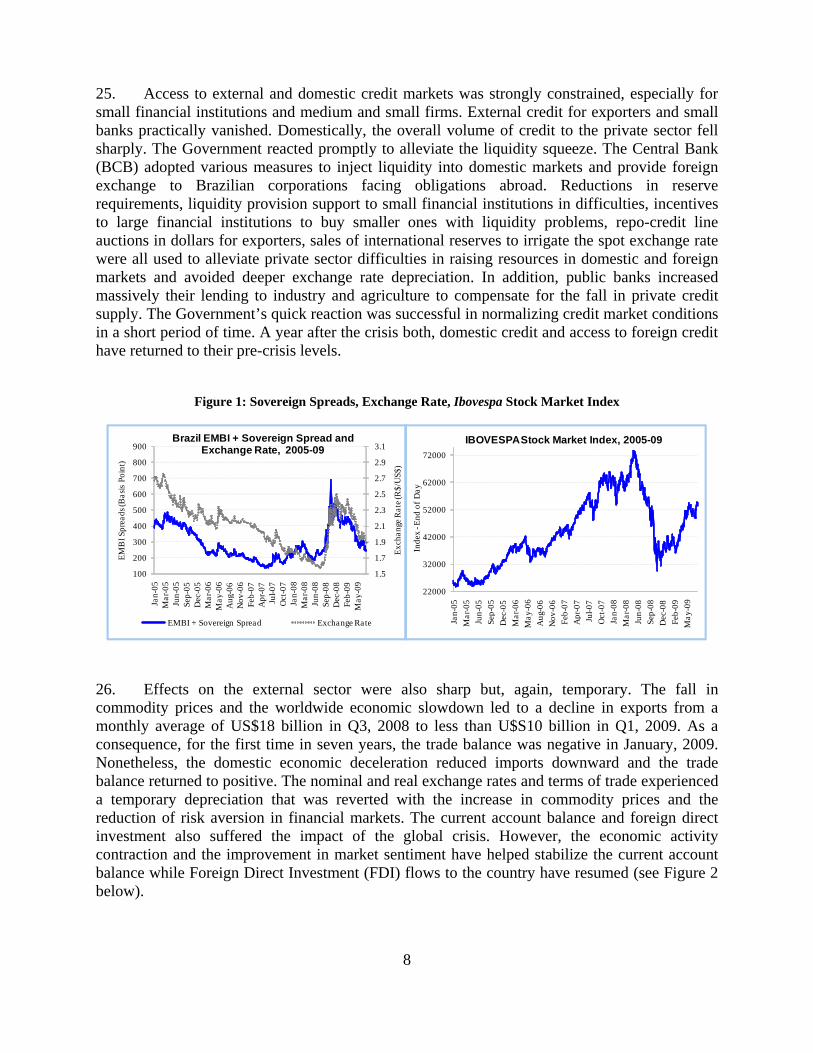
24. Despite its increased resilience, the global financial crisis has hit Brazil hard. The impacts of the global downturn on the Brazilian economy can be divided into three categories according to their timing and affected sectors. First round effects encompassed contagion in financial markets, fall in commodity prices, exchange rate depreciation, external credit curtailment and a liquidity squeeze for Brazilian firms. From September through December, 2008 the São Paulo Stock Market Index (Ibovespa) fell 32 percent, sovereign spreads increased by 78 percent, the main Brazilian commodity exports prices fell by more than 30 percent and the Brazilian Real (BRL) depreciated by 35 percent (see Figure 1 below).
5 The net real revenue (RLR) is defined as the total revenue less credit operations, asset sales, capital transfers, transfers to municipalities, FUNDEF contributions, and the social security contributions of civil servants that opt out of the state system. RLR is smaller than the RLC used in the PAF. Also, the debt contracts cover only the central state governments while the LRF includes the consolidated state public sector. In the same vein, the debt renegotiation contracts use gross debt for state indebtedness while the LRF uses the net consolidated debt. 6 Annex 2 contains a more detailed description of the Global Crisis effects on Brazil.
8
25. Access to external and domestic credit markets was strongly constrained, especially for small financial institutions and medium and small firms. External credit for exporters and small banks practically vanished. Domestically, the overall volume of credit to the private sector fell sharply. The Government reacted promptly to alleviate the liquidity squeeze. The Central Bank (BCB) adopted various measures to inject liquidity into domestic markets and provide foreign exchange to Brazilian corporations facing obligations abroad. Reductions in reserve requirements, liquidity provision support to small financial institutions in difficulties, incentives to large financial institutions to buy smaller ones with liquidity problems, repo-credit line auctions in dollars for exporters, sales of international reserves to irrigate the spot exchange rate were all used to alleviate private sector difficulties in raising resources in domestic and foreign markets and avoided deeper exchange rate depreciation. In addition, public banks increased massively their lending to industry and agriculture to compensate for the fall in private credit supply. The Government’s quick reaction was successful in normalizing credit market conditions in a short period of time. A year after the crisis both, domestic credit and access to foreign credit have returned to their pre-crisis levels.
Figure 1: Sovereign Spreads, Exchange Rate, Ibovespa Stock Market Index
1.5
1.7
1.9
2.1
2.3
2.5
2.7
2.9
3.1
100
200
300
400
500
600
700
800
900
Jan-
05M
ar-0
5Ju
n-05
Sep-
05D
ec-0
5M
ar-0
6M
a y-0
6A
u g-0
6N
ov-0
6Fe
b-07
Apr
-07
Jul-0
7O
ct-0
7Ja
n-08
Mar
-08
Jun-
08Se
p-08
Dec
-08
Feb-
09M
a y-0
9
Exc
hang
e R
ate
(R$/
US$
)
EM
BI S
prea
ds (B
asis
Poi
nt)
Brazil EMBI + Sovereign Spread and Exchange Rate, 2005-09
EMBI + Sovereign Spread Exchange Rate
22000
32000
42000
52000
62000
72000Ja
n-05
Mar
-05
Jun-
05
Sep-
05
Dec
-05
Mar
-06
May
-06
Aug
-06
Nov
-06
Feb-
07
Apr
-07
Jul-0
7
Oct
-07
Jan-
08
Mar
-08
Jun-
08
Sep-
08
Dec
-08
Feb-
09
May
-09
Inde
x -E
nd o
f D
ay
IBOVESPA Stock Market Index, 2005-09
26. Effects on the external sector were also sharp but, again, temporary. The fall in commodity prices and the worldwide economic slowdown led to a decline in exports from a monthly average of US$18 billion in Q3, 2008 to less than U$S10 billion in Q1, 2009. As a consequence, for the first time in seven years, the trade balance was negative in January, 2009. Nonetheless, the domestic economic deceleration reduced imports downward and the trade balance returned to positive. The nominal and real exchange rates and terms of trade experienced a temporary depreciation that was reverted with the increase in commodity prices and the reduction of risk aversion in financial markets. The current account balance and foreign direct investment also suffered the impact of the global crisis. However, the economic activity contraction and the improvement in market sentiment have helped stabilize the current account balance while Foreign Direct Investment (FDI) flows to the country have resumed (see Figure 2 below).

9
Figure 2: Commodity prices, Exports, Trade and Current Account Balances
Monthly Trade Balance, Exports, and Imports, 2002-09 (US$ Billions)
-2,0
3,0
8,0
13,0
18,0
23,0
jan/
02
jun/
02
nov/
02
abr/
03
set/
03
fev/
04
jul/0
4
dez/
04
mai
/05
out/0
5
mar
/06
ago/
06
jan/
07
jun/
07
nov/
07
abr/
08
set/
08
fev/
09
Exports Imports Trade Balance
Current Account and Foreign Direct Investment, 2002-09 (12 Months accumulated flows)
-5
-3
-1
1
3
5
jan/
02
jun/
02
nov/
02
abr/
03
set/0
3
fev/
04
jul/0
4
dez/
04
mai
/05
out/
05
mar
/0
ago/
0
jan/
07
jun/
07
nov/
07
abr/
08
set/0
8
fev/
09
% o
f GD
P
Current Account Foreign Direct Investment
Exports and Commodity Prices, 2002-09
-2,0
3,0
8,0
13,0
18,0
23,0
jan/
02m
ai/0
2se
t/02
jan/
03m
ai/0
3se
t/03
jan/
04m
ai/0
4se
t/04
jan/
05m
ai/0
5se
t/05
jan/
06m
ai/0
6se
t/06
jan/
07m
ai/0
7se
t/07
jan/
08m
ai/0
8se
t/08
jan/
09m
ai/0
9
Exp
orts
(U
S$
Bi)
0
50
100
150
200
250
300
350
400
Co
mm
Pri
ces
2002
=1
00
Exports (US$ millions) Commodity Prices
Commodity Prices, Terms of Trade and Real Exchange Rate, 2002-09
0
50
100
150
200
250
300
350
400
jan/
02
mai
/02
set/
02
jan/
03
mai
/03
set/
03
jan/
04
mai
/04
set/
04
jan/
05
mai
/05
set/
05
jan/
06
mai
/06
set/
06
jan/
07
mai
/07
set/
07
jan/
08
mai
/08
set/
08
jan/
09
mai
/09
Co
mm
.Pri
ce 2
002
=1
00
60
70
80
90
100
110
120
130
140
Exc
ha
ng
e R
ate
& T
erm
s o
f T
rad
e
Commodity Prices Terms of Trade Real Exchange Rate
27. Second round effects were also quite strong and were felt immediately in the real economy. The financial turmoil interrupted 21 consecutive quarters of GDP expansion (from Q2, 2003 to Q3, 2008). Indeed, Brazilian GDP contracted in Q4, 2008 by 3.6 percent (qoq) and in Q1, 2009 by 0.9 (qoq), driven by a strong drop in investment. Consumption continued to grow while the external sector had a neutral contribution to growth. Industrial production plummeted (especially capital goods and car vehicle production), falling by 16 percent from September 2008 to March 2009. Industrial capacity utilization fell from 87 percent in September to 78 percent in March 2009, while unemployment rose from 7.6 percent in September, 2008 to 9 percent in March, 2009. Market GDP growth forecasts for 2009 were revised downward from a positive 2 percent in December-January to a negative 0.5 to 1.5 percent in May-June. (see Figure 3 below)
28. On the positive side, the economic slowdown and the fall in commodity prices also lessened pressures on inflation and opened space for monetary easing. Twelve month accumulated inflation fell from 6.3 percent in September 2008 to 5.5 percent in March 2009 and hit the center of the BCB target zone at 4.5 percent in July, 2009. Inflation expectations for 2009 fell from 5.5 percent in September 2008 to 4.5 percent in March and to 4.3 in July 2009. Consistent with the inflation targeting regime, and drawing on the credibility earned in the last decade, the BCB initiated a consistent interest rate reduction cycle from 13.75 percent in December, 2008 to 11.25 percent in March, 2009 and to 8.75 percent in July, 2009 (its historical lowest level).

10
29. Third round effects are related to the accentuated deterioration of public finances and government policy reaction. The sharp fall in revenues during the first semester of 2009 and the aggressive expansion of government expenditures – mainly current expenses, especially social security and public sector salaries - resulted in the reduction of the Consolidated Public Sector’s primary surplus, which decreased to 2.4 percent of GDP in January-June, 2009 from 5.9 percent of GDP in the same period in 2008. Indeed, the total deficit increased to 3 percent of GDP in the first semester of 2009 from 0.5 percent of GDP in the same period of 2008. As a result, net public debt grew from 41 percent of GDP in June, 2008, to 43 percent in June, 2009.
Figure 3: GDP Growth, Industrial Production, Unemployment and Inflation
12 - Month Accumulated Inflation, 2002-09
-2
3
8
13
18
23
28
33
fev/
02
ago/0
2
fev/
03
ago/0
3
fev/
04
ago/0
4
fev/
05
ago/0
5
fev/
06
ago/0
6
fev/
07
ago/0
7
fev/
08
ago/0
8
fev/
09
Consumer Price Index (IPCA) Wholesale Price Index, IPG-M.
Industrial Activity Index and Capacity Utilization, 2002-09
90
95
100
105
110
115
120
125
130
135
jan/
02
jul/0
2
jan/
03
jul/0
3
jan/
04
jul/0
4
jan/
05
jul/0
5
jan/
06
jul/0
6
jan/
07
jul/0
7
jan/
08
jul/0
8
jan/
09
(Cap
acit
y U
tiliz
atio
n %
)
75
76
77
78
79
80
81
82
83
84
(In
du
stry
Ac
tivi
ty In
de
x)
Industrial Production Index CNI Percentage of Total Capacity
Unemployment Rate (%), 2002-09
6
7
8
9
10
11
12
13
14
fev/
02
ago
/02
fev/
03
ago
/03
fev/
04
ago
/04
fev/
05
ago
/05
fev/
06
ago
/06
fev/
07
ago
/07
fev/
08
ago
/08
fev/
09
Quarterly GDP Growth and Demand Components Contributions, 2002-09
-6,0
-4,0
-2,0
0,0
2,0
4,0
6,0
8,0
Q1 2002 Q1 2003 Q1 2004 Q1 2005 Q1 2006 Q1 2007 Q1 2008 Q1 2009
Consumption Investment External Sector GDP Growth Rate
30. The fall in federal tax revenue resulting from the economic slowdown and from temporary tax breaks adopted as part of the fiscal stimulus package has substantially impacted sub-national governments through the reduction of federal revenue sharing transfers. This effect has been particularly strong in the case of states and municipal governments that depend heavily on federal transfers. Alagoas was one of the most affected states as federal transfers represent 60 percent of its revenues.
31. Another important component of the government’s expansionary policy was the significant increase in credit supply from public financial institutions. It is estimated that the quasi-fiscal stimulus associated with increased lending from public banks reached 3 percent of GDP. In fact, credit by public banks grew 25 percent in the year since September 2008, while

11
credit form private institutions grew only 3 percent. The expansion of finance from public banks included credit to exporters, the agricultural sector, for housing and for durable goods consumption. As a result, the share of public banks in total outstanding credit grew to 39 percent in June 2009 from 34 percent in September 2008. In addition, the government has also encouraged large private banks to increase lending and buy small banks that faced liquidity problems.
32. Strong monetary easing, expansionary fiscal policy, the expansion of credit supply from public banks, and the recovery of commodity prices have allowed a quick and strong economic activity recovery. Indeed, in Q2 2009 GDP growth achieved an impressive 1.9 percent (qoq). Information on industrial production, job creation, unemployment in metropolitan areas and labor income provides clear signals of an ongoing consolidation of GDP recovery in Q3 2009 indicating that GDP decline in 2009 will be less accentuated than expected and should be followed by a strong acceleration in 2010.7
33. Projections for the coming quarters indicate a strong GDP recovery that should vary between 4.5 percent and 5.5 percent8. Figure 3 shows that the initial recovery would be driven by the increase in capacity utilization followed by the resumption of total factor productivity growth. Increases in capital accumulation and employment are expected to accelerate in 2010.
Figure 4: GDP Growth Decomposition, 2003-2010 (quarterly figures)
-4
-3
-2
-1
0
1
2
3
Labor
Ind. Capacity Util.
Capital
TFP
GDP
7 Accordingly, market forecasts for growth in 2009 increased to 0 percent in September (from -1.5 percent in April). For 2010 there was also an improvement in market projections that in September indicated a growth rate of 4.5 percent (from 3 percent in April). 8 There is an statistical carry out effect on these numbers as Q4 2008 and Q1 and Q2 2009 levels are low, therefore the comparison base will favor Q 4 2009 and 2010.

12
34. Financial markets are also exhibiting a robust recovery. From March to September, the Ibovespa stock market index grew 48 percent, sovereign spreads returned to their pre-global crisis levels of about 250 basis points and the BRL appreciated by 23%, also returning to its pre-global crisis level. Capital inflows resumed their pre-global crisis trend and the country international reserves reached US225 billion in September, level well above the pre-global crisis highest level of US$205 billion recorded in August 2008.
35. In this context, two scenarios with growth rates of 0 percent (scenario A) and -1.5 percent (scenario B) in 2009 are presented in Table 2 below. Growth assumptions for 2010 and 2011 are the same and depict a gradual growth recovery to 3.5 percent in 2010 and 4 percent for 2011.
Table 2: Macroeconomic Outlook, 2008-2011
Indicator 2008 2009 2010 2011 (A) (B) (A) (B) (A) (B)
National Accounts Real GDP Growth (%) 5.1 0.0 -1.5 3.5 3.5 4.0 4.0 Consumption Growth (%) 5.4 3.5 2.5 3.2 3.9 5.4 4.7 Investment Growth (%) 13.8 -6.5 -11.5 4.7 4.7 8.1 8.2 Investment (% of GDP) 19.0 17.7 17.0 17.9 17.2 18.6 17.9 Public sector 3.3 3.8 3.8 3.5 3.5 3.6 3.6 Private sector 15.7 13.9 13.2 14.4 13.7 15.0 14.3 Gross National Savings 16.9 16.3 16.1 16.4 15.7 16.3 16.5
External Sector Trade Balance (US$ bi) 24.8 22.4 28.9 24.2 20.0 11.8 19.0 Current Account Balance (US$ bi) -28.2 -22.3 -13.5 -28.9 -26.1 -44.8 -31.1 Current Account Balance (% of GDP) -1.8 -1.3 -0.8 -1.8 -1.5 -2.7 -2.0 Foreign Direct Investment 45.1 30.0 25.0 35.0 30.0 40.0 40.0 International Reserves (US$ bi) 207 219 220 223 227 234 232 Debt Service to Exports (%) 19.0 18.1 18.0 11.8 12.0 12.9 13.5 Interest Payments to Exports (%) 7.1 4.3 4.3 4.3 4.4 4.1 4.3 Nominal Exchange Rate (eop) 2.3 1.9 1.8 2.09 2.05 2.2 2.2
Public Sector PS. Primary Balance (% of GDP) 4.1 2.0 1.5 3.5 3.2 3.5 3.5 PS. Overall Balance (% of GDP) -1.5 -3.0 -3.4 -1.8 -2.5 -1.5 -1.8 Net Public Sector Debt (% of GDP) 36.0 42.5 44.0 41.0 42.5 39.5 41.0 Gross Gen. Gov. Debt (% of GDP) 58.6 64.0 65.5 62.2 63.6 61.2 62.5
Prices and Economic Activity Consumer Inflation (%) 5.9 4.4 4.0 4.5 4.5 4.5 4.5 Wholesale Inflation (%) 9.1 3.0 2.5 4.5 4.5 4.5 4.5 Headline Interest Rate (% eop) 13.8 8.8 8.8 8.5 8.5 9.0 9.0 Unemployment (%) 7.9 8.5 9.0 8.2 8.7 8.0 8.5 Industrial Cap. Utilization (%) 82.6 78.5 76.6 79.5 79.0 81.5 80.5
Source: IMF, BCB, IBGE, Bank Staff Calculation
13
In summary, the country’s macroeconomic framework is deemed appropriate for this proposed DPL in that solid macroeconomic fundamentals built in the last decade have allowed Brazil to smooth the effects of the financial turmoil with relative speed. The government has been using its increased fiscal and external solvency and its enhanced credibility to adopt expansionary fiscal and monetary policies.
ALAGOAS: ECONOMIC AND SOCIAL DEVELOPMENT9
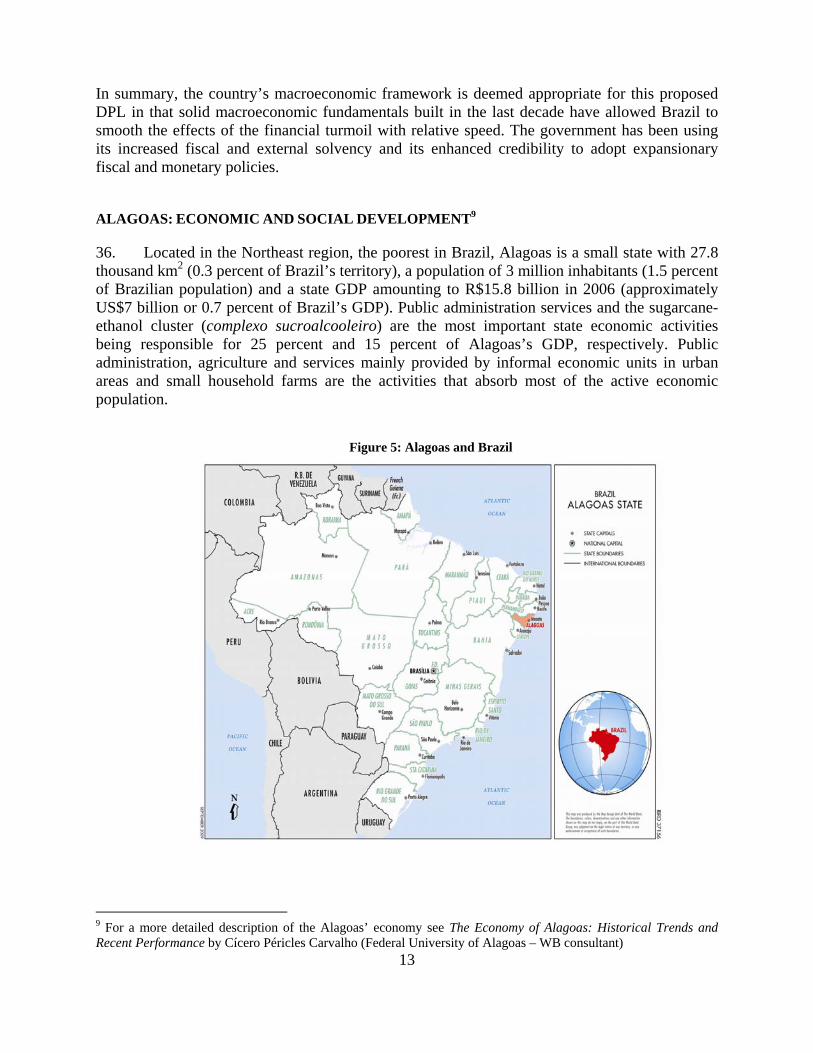
36. Located in the Northeast region, the poorest in Brazil, Alagoas is a small state with 27.8 thousand km2 (0.3 percent of Brazil’s territory), a population of 3 million inhabitants (1.5 percent of Brazilian population) and a state GDP amounting to R$15.8 billion in 2006 (approximately US$7 billion or 0.7 percent of Brazil’s GDP). Public administration services and the sugarcane-ethanol cluster (complexo sucroalcooleiro) are the most important state economic activities being responsible for 25 percent and 15 percent of Alagoas’s GDP, respectively. Public administration, agriculture and services mainly provided by informal economic units in urban areas and small household farms are the activities that absorb most of the active economic population.
Figure 5: Alagoas and Brazil
9 For a more detailed description of the Alagoas’ economy see The Economy of Alagoas: Historical Trends and Recent Performance by Cícero Péricles Carvalho (Federal University of Alagoas – WB consultant)
14
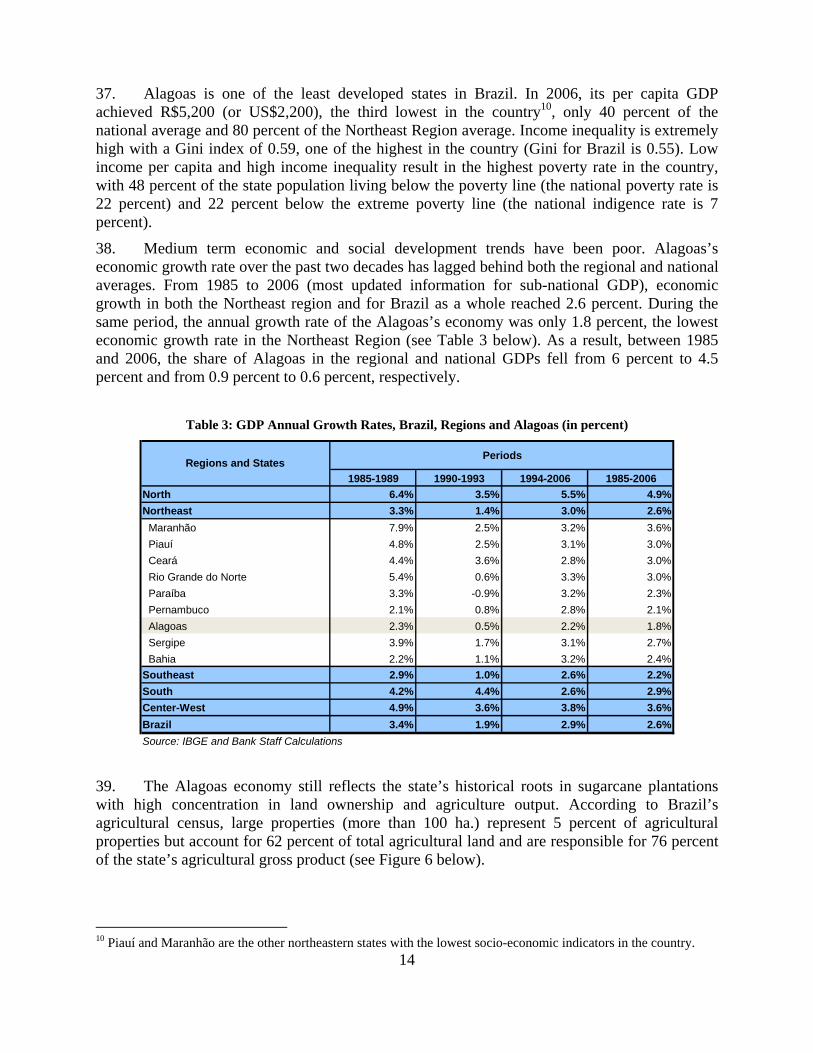
37. Alagoas is one of the least developed states in Brazil. In 2006, its per capita GDP achieved R$5,200 (or US$2,200), the third lowest in the country10, only 40 percent of the national average and 80 percent of the Northeast Region average. Income inequality is extremely high with a Gini index of 0.59, one of the highest in the country (Gini for Brazil is 0.55). Low income per capita and high income inequality result in the highest poverty rate in the country, with 48 percent of the state population living below the poverty line (the national poverty rate is 22 percent) and 22 percent below the extreme poverty line (the national indigence rate is 7 percent).
38. Medium term economic and social development trends have been poor. Alagoas’s economic growth rate over the past two decades has lagged behind both the regional and national averages. From 1985 to 2006 (most updated information for sub-national GDP), economic growth in both the Northeast region and for Brazil as a whole reached 2.6 percent. During the same period, the annual growth rate of the Alagoas’s economy was only 1.8 percent, the lowest economic growth rate in the Northeast Region (see Table 3 below). As a result, between 1985 and 2006, the share of Alagoas in the regional and national GDPs fell from 6 percent to 4.5 percent and from 0.9 percent to 0.6 percent, respectively.
Table 3: GDP Annual Growth Rates, Brazil, Regions and Alagoas (in percent)
Periods
1985-1989 1990-1993 1994-2006 1985-2006
North 6.4% 3.5% 5.5% 4.9%
Northeast 3.3% 1.4% 3.0% 2.6%
Maranhão 7.9% 2.5% 3.2% 3.6%
Piauí 4.8% 2.5% 3.1% 3.0%
Ceará 4.4% 3.6% 2.8% 3.0%
Rio Grande do Norte 5.4% 0.6% 3.3% 3.0%
Paraíba 3.3% -0.9% 3.2% 2.3%
Pernambuco 2.1% 0.8% 2.8% 2.1%
Alagoas 2.3% 0.5% 2.2% 1.8%
Sergipe 3.9% 1.7% 3.1% 2.7%
Bahia 2.2% 1.1% 3.2% 2.4%
Southeast 2.9% 1.0% 2.6% 2.2%
South 4.2% 4.4% 2.6% 2.9%
Center-West 4.9% 3.6% 3.8% 3.6%
Brazil 3.4% 1.9% 2.9% 2.6%
Source: IBGE and Bank Staff Calculations
Regions and States
39. The Alagoas economy still reflects the state’s historical roots in sugarcane plantations with high concentration in land ownership and agriculture output. According to Brazil’s agricultural census, large properties (more than 100 ha.) represent 5 percent of agricultural properties but account for 62 percent of total agricultural land and are responsible for 76 percent of the state’s agricultural gross product (see Figure 6 below).
10 Piauí and Maranhão are the other northeastern states with the lowest socio-economic indicators in the country.

15
40. Sugarcane plantations are the dominant agricultural activity responsible for 65 percent of the total cultivated area. As shown in Table 4, the sugarcane-ethanol cluster (complexo sucroalcooleiro) is responsible for the generation of more than 15 percent of the state GDP. After a long period of stagnation in the eighties and nineties the sugarcane-ethanol cluster has experienced a rapid increase in productivity. Exports amount to more than US$800 million. However, given that production is based on massive use of machinery, job generation capacity is quite limited and the sector accounts for less than 3 percent of total employment in the state.
Figure 6: Land Property Structure
AL: Land Property Stucture by Size (ha)
1-1082%
+ de 1005%
10-10013%
AL: Occupied Area by Property size (ha)
10062%
10-10027%
1-1011%
Source: IBGE and Bank Staff Calculations
41. Other agriculture activities developed on small farms cultivating traditional cultures such as rice, beans, cotton and manioc generate less than 5 percent of state GDP and occupy only 15 percent of cultivated area. These non-sugar cane agricultural activities are the largest employer in Alagoas with 45 percent of total employment. The rest of the agricultural sector comprises live-stock activities that represent 2 percent of state GDP.
Table 4: Sugarcane - Ethanol Cluster Production and Exports
Crop/Production 1999/2000 2007/2008
Sugar Cane (tons) 19.315.230 29.834.510 Cultivated area (ha) 450.000 412.000 Sugar (bags 50 kg) 24.309.380 51.962.970
Ethanol (m³) 550.514 852.676 Exports (US$) 183.393.219 816.665.485
Source: IBGE. SECEX
42. The state’ industrial sector is small and highly concentrated in sugarcane-ethanol transformation. This accounts for 40 percent of industrial GDP. Public utilities (electricity, telecommunications, water supply and sanitation) and civil construction generate 50 percent of industrial GDP while mining and other extractive activities respond for the remaining 10 percent.
43. Alagoas’ economy is highly dependent on public sector activities11. The weight of the public administration sector in the state economy (25 percent) is one of the highest among state
11 Public administration in AL encompasses the activities of the state government and 101 local governments.

16
governments-- the national average is 15 percent. Public administration accounts for more than 18 percent of the state’s formal employment and public employee salaries are significantly higher than in the rest of the economy. Therefore, government activities have a strong importance not only as the principal provider of economic infrastructure and social services but also as the main income generation source in the state. Furthermore, Federal Government’s social security and social protection transfers are an important income source for a large part of the Alagoas population. In fact, 355 thousand families in Alagoas -out of the 780 thousand in the state are beneficiaries of the federal conditional cash transfer program (Bolsa Familia Program), 95 thousand individuals are beneficiaries of rural pensions and 68 thousand of other social protection benefits.
44. Other important services activities are commerce, maintenance and real estate. In recent years, tourism has also experienced a rapid increase representing about 2 percent of the state GDP. It is becoming an important source of employment generation in urban areas.
45. Given the state’s economic structure and lack of dynamism, the labor market has been characterized by high unemployment and informality. From 1992 to 2007, average unemployment in Alagoas was 9.2 percent, while the Northeast rate was 7.9 percent and Brazil was 8.3 percent. The informal economy employs 66 percent of the state’s active economic population. Precarious employment conditions are reflected in low labor income. Half of the active economic population (AEP) receives less than one minimum wage (about US$200 in 2007), 20 percent receive between one and two times the national minimum wage, 7 percent receive between 2 and 5 times the national minimum wage and only 4 percent receive more than 5 times the national minimum wage. Some 22 percent do not receive any labor income.
46. The active economic population’s limited educational attainment is one of the reasons for the low labor income. More than 25 percent of the active population has no education, 43 percent has between 1 and 7 years, 25 percent has between 8 and 14 years and only 7 percent has more than 14 years of education. Furthermore, the quality of education is very poor. Alagoas students have consistently ranked last in national educational tests since 1998.
47. The state’s poor economic performance is also reflected in social development indicators. Alagoas is the state with the highest poverty and inequality rates. In addition, education and health indicators and the access of the population to basic services are also among the lowest in the country. Literacy and enrollment rates and average years of schooling in Alagoas are among the 3 lowest in the country. Infant mortality is the highest in Brazil and life expectancy is the second lowest. As a result the Human Development Index in Alagoas is the second lowest among Brazilian states - only Maranhão is lower. This is also reflected at the municipal level. Figure 6 shows that 80 out of the 101 municipalities in the state fall in the lowest HDI quintile of Brazilian municipalities.
48. The comparative evolution of Alagoas’s social indicators has also not been favorable (see Figure 7). In 1980, Alagoas’s Human Development Index (HDI) was the fourth lowest among the 27 Brazilian states. By 2000, it had fallen to the second lowest. Particularly worrisome is the comparison within the Northeast Region. At the beginning of the nineties, Alagoas enjoyed better economic and social conditions than most of its peers in the region. Alagoas’s per capita GDP was the fourth highest in the region while poverty, education and health indicators ranked

17
the three highest in the region. In 2006, the state per capita GDP ranked seventh and social indicators place Alagoas among the three least developed states in the region.12
Figure 7: Brazil and Alagoas HDI distribution by municipalities (quintiles), 2000
0%1% 1%
18%
80%
0%
20%
40%
60%
80%
100%
Brazil Alagoas
Municipalities with the highest HDI
Municipalities with the lowest HDI
Source: UNDP Brazil Program
49. Only in the last few years, due to the expansion of social policies by the Federal Government and national economic growth acceleration, have the Alagoas economic and social indicators improved. From 2004 to 2006 Alagoas annual economic growth rate of 4.1 has been higher than the 3.6 percent national average but still lower than the Northeast Region’s GDP growth rate (4.4 percent). Increased intergovernmental transfers to state and local governments and the increase of domestic consumption, especially low income groups, fostered by redistributive policies promoted by the Federal Government, explain Alagoas’s improved performance over this period.
50. Federal transfers to the State government and direct investments by the Federal Government have contributed to the recent improvement of Alagoas’ socioeconomic conditions. Table 5 shows that intergovernmental transfers to the State government and municipalities increased by 70 percent in the last four years reaching R$4.9 billion in 2008 (in 2006 they represented 16 percent of Alagoas GDP). Apart from the constitutionally mandated revenue–sharing which increased at the same rhythm as federal tax collection, the increase in voluntary transfers to finance State investment projects and locally executed federal programs reflects renewed federal administration interest in improving economic and social conditions in the Northeast Region and especially in Alagoas. Nonetheless, difficult financial conditions and weak
12 Non-official statistics indicate that Alagoas’s HDI in 2006 was already the lowest in Brazil.
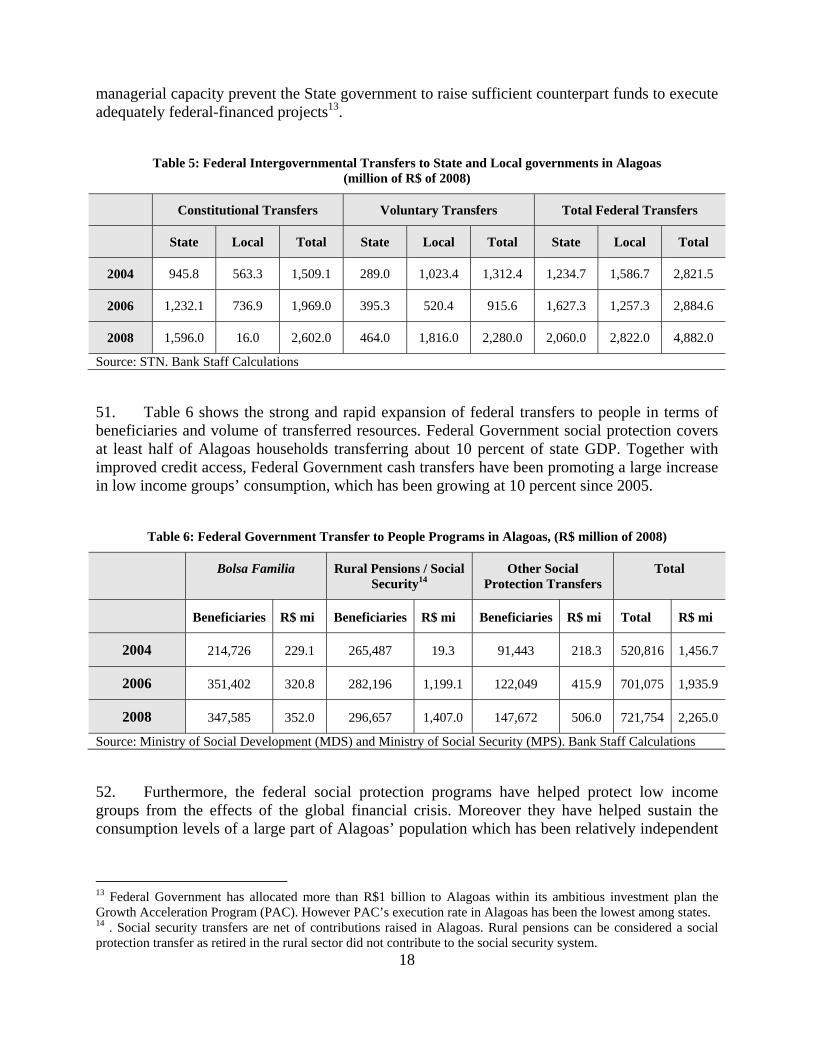
18
managerial capacity prevent the State government to raise sufficient counterpart funds to execute adequately federal-financed projects13.
Table 5: Federal Intergovernmental Transfers to State and Local governments in Alagoas (million of R$ of 2008)
Constitutional Transfers Voluntary Transfers Total Federal Transfers
State Local Total State Local Total State Local Total
2004 945.8 563.3 1,509.1 289.0 1,023.4 1,312.4 1,234.7 1,586.7 2,821.5
2006 1,232.1 736.9 1,969.0 395.3 520.4 915.6 1,627.3 1,257.3 2,884.6
2008 1,596.0 16.0 2,602.0 464.0 1,816.0 2,280.0 2,060.0 2,822.0 4,882.0
Source: STN. Bank Staff Calculations
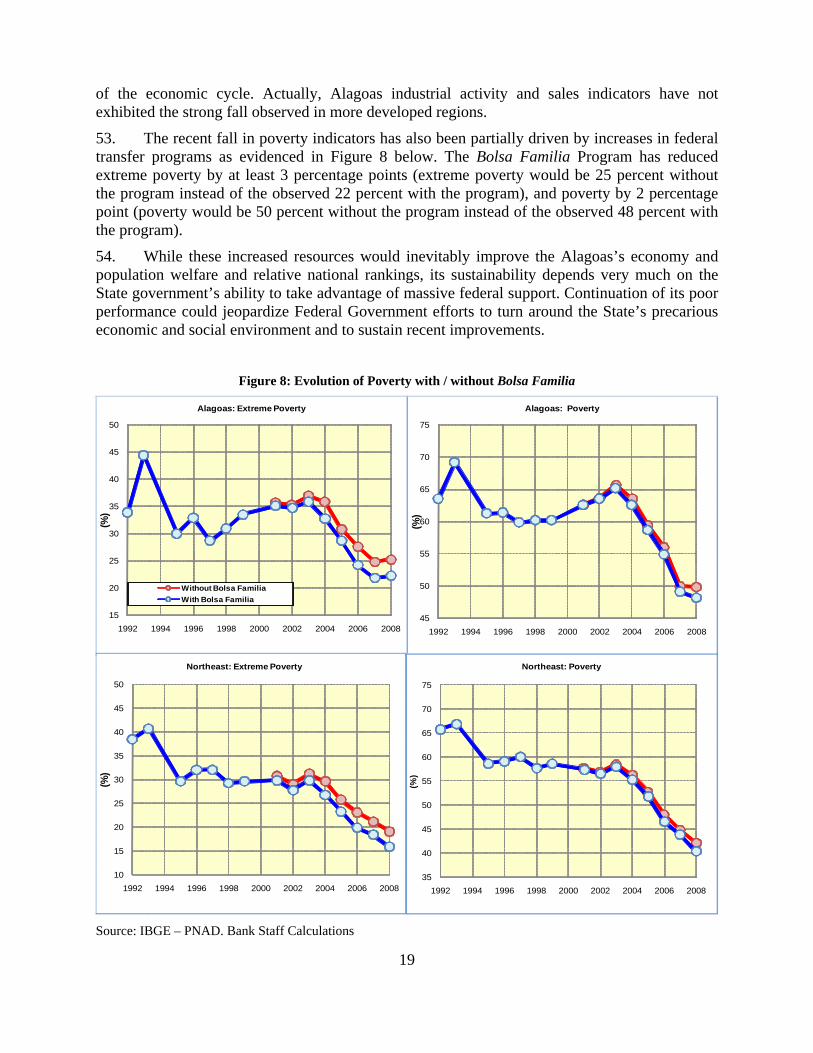
51. Table 6 shows the strong and rapid expansion of federal transfers to people in terms of beneficiaries and volume of transferred resources. Federal Government social protection covers at least half of Alagoas households transferring about 10 percent of state GDP. Together with improved credit access, Federal Government cash transfers have been promoting a large increase in low income groups’ consumption, which has been growing at 10 percent since 2005.
Table 6: Federal Government Transfer to People Programs in Alagoas, (R$ million of 2008)
Bolsa Familia Rural Pensions / Social Security14
Other Social Protection Transfers
Total
Beneficiaries R$ mi Beneficiaries R$ mi Beneficiaries R$ mi Total R$ mi
2004 214,726 229.1 265,487 19.3 91,443 218.3 520,816 1,456.7
2006 351,402 320.8 282,196 1,199.1 122,049 415.9 701,075 1,935.9
2008 347,585 352.0 296,657 1,407.0 147,672 506.0 721,754 2,265.0
Source: Ministry of Social Development (MDS) and Ministry of Social Security (MPS). Bank Staff Calculations
52. Furthermore, the federal social protection programs have helped protect low income groups from the effects of the global financial crisis. Moreover they have helped sustain the consumption levels of a large part of Alagoas’ population which has been relatively independent
13 Federal Government has allocated more than R$1 billion to Alagoas within its ambitious investment plan the Growth Acceleration Program (PAC). However PAC’s execution rate in Alagoas has been the lowest among states. 14 . Social security transfers are net of contributions raised in Alagoas. Rural pensions can be considered a social protection transfer as retired in the rural sector did not contribute to the social security system.
19
of the economic cycle. Actually, Alagoas industrial activity and sales indicators have not exhibited the strong fall observed in more developed regions.
53. The recent fall in poverty indicators has also been partially driven by increases in federal transfer programs as evidenced in Figure 8 below. The Bolsa Familia Program has reduced extreme poverty by at least 3 percentage points (extreme poverty would be 25 percent without the program instead of the observed 22 percent with the program), and poverty by 2 percentage point (poverty would be 50 percent without the program instead of the observed 48 percent with the program).
54. While these increased resources would inevitably improve the Alagoas’s economy and population welfare and relative national rankings, its sustainability depends very much on the State government’s ability to take advantage of massive federal support. Continuation of its poor performance could jeopardize Federal Government efforts to turn around the State’s precarious economic and social environment and to sustain recent improvements.
Figure 8: Evolution of Poverty with / without Bolsa Familia
15
20
25
30
35
40
45
50
1992 1994 1996 1998 2000 2002 2004 2006 2008
(%)
Alagoas: Extreme Poverty
Without Bolsa Familia
With Bolsa Familia
45
50
55
60
65
70
75
1992 1994 1996 1998 2000 2002 2004 2006 2008
(%)
Alagoas: Poverty
10
15
20
25
30
35
40
45
50
1992 1994 1996 1998 2000 2002 2004 2006 2008
(%)
Northeast: Extreme Poverty
35
40
45
50
55
60
65
70
75
1992 1994 1996 1998 2000 2002 2004 2006 2008
(%)
Northeast: Poverty
Source: IBGE – PNAD. Bank Staff Calculations
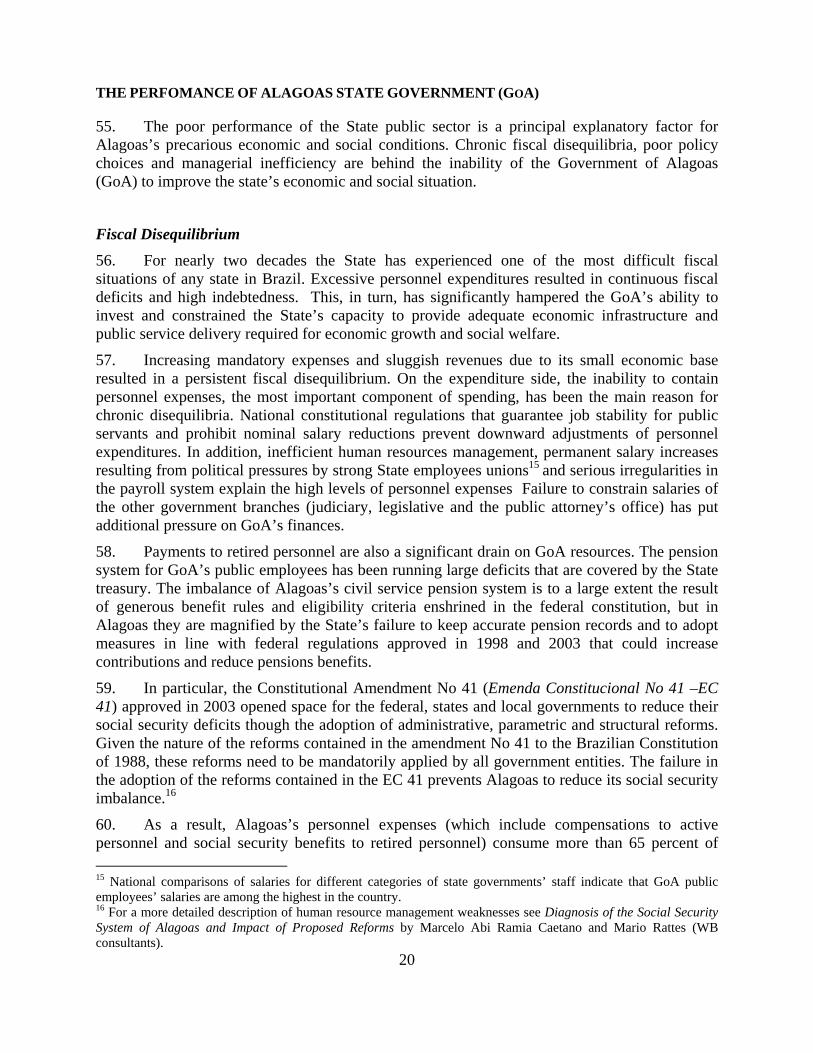
20
THE PERFOMANCE OF ALAGOAS STATE GOVERNMENT (GOA)
55. The poor performance of the State public sector is a principal explanatory factor for Alagoas’s precarious economic and social conditions. Chronic fiscal disequilibria, poor policy choices and managerial inefficiency are behind the inability of the Government of Alagoas (GoA) to improve the state’s economic and social situation.
Fiscal Disequilibrium
56. For nearly two decades the State has experienced one of the most difficult fiscal situations of any state in Brazil. Excessive personnel expenditures resulted in continuous fiscal deficits and high indebtedness. This, in turn, has significantly hampered the GoA’s ability to invest and constrained the State’s capacity to provide adequate economic infrastructure and public service delivery required for economic growth and social welfare.
57. Increasing mandatory expenses and sluggish revenues due to its small economic base resulted in a persistent fiscal disequilibrium. On the expenditure side, the inability to contain personnel expenses, the most important component of spending, has been the main reason for chronic disequilibria. National constitutional regulations that guarantee job stability for public servants and prohibit nominal salary reductions prevent downward adjustments of personnel expenditures. In addition, inefficient human resources management, permanent salary increases resulting from political pressures by strong State employees unions15 and serious irregularities in the payroll system explain the high levels of personnel expenses Failure to constrain salaries of the other government branches (judiciary, legislative and the public attorney’s office) has put additional pressure on GoA’s finances.
58. Payments to retired personnel are also a significant drain on GoA resources. The pension system for GoA’s public employees has been running large deficits that are covered by the State treasury. The imbalance of Alagoas’s civil service pension system is to a large extent the result of generous benefit rules and eligibility criteria enshrined in the federal constitution, but in Alagoas they are magnified by the State’s failure to keep accurate pension records and to adopt measures in line with federal regulations approved in 1998 and 2003 that could increase contributions and reduce pensions benefits.
59. In particular, the Constitutional Amendment No 41 (Emenda Constitucional No 41 –EC 41) approved in 2003 opened space for the federal, states and local governments to reduce their social security deficits though the adoption of administrative, parametric and structural reforms. Given the nature of the reforms contained in the amendment No 41 to the Brazilian Constitution of 1988, these reforms need to be mandatorily applied by all government entities. The failure in the adoption of the reforms contained in the EC 41 prevents Alagoas to reduce its social security imbalance.16
60. As a result, Alagoas’s personnel expenses (which include compensations to active personnel and social security benefits to retired personnel) consume more than 65 percent of 15 National comparisons of salaries for different categories of state governments’ staff indicate that GoA public employees’ salaries are among the highest in the country. 16 For a more detailed description of human resource management weaknesses see Diagnosis of the Social Security System of Alagoas and Impact of Proposed Reforms by Marcelo Abi Ramia Caetano and Mario Rattes (WB consultants).

21
State net current revenues and it is one of the highest among Brazilian states. In addition, the lack of adequate supplies, purchase and procurement systems results in high government operating costs. Finally, constitutional earmarking of revenues has introduced additional rigidities limiting expenditure reallocations and fiscal adjustment efforts.
61. High levels of current expenses and lack of access to credit in the last decade have led to a strong dependence on Federal Government capital transfers to finance investment spending. Capital transfers are not mandatory hence tend to be very volatile resulting in GoA investments also being volatile (see Figure 9). These fiscal constraints are leading to a downward spiral whereby weak State capacity leads to a reduction in the quality of public services, lower economic growth, which in turn leads to lower revenues and a more precarious fiscal equation.
Figure 9: Debt, Debt Service, Personnel expenses and Investments (percent of net current revenue)
50%
100%
150%
200%
250%
300%
1994
1995
1996
1997
1998
1999
2000
2001
2002
2003
2004
2005
2006
2007
2008
Deb
t
8%
12%
16%
20%
24%
28%
Deb
t Ser
vice
Consolidated Debt Debt Service
40%
50%
60%
70%
80%
90%
100%
110%
199
4
199
5
199
6
199
7
199
8
199
9
200
0
200
1
200
2
200
3
200
4
200
5
200
6
200
7
200
8
Pers
onne
l
2%
4%
6%
8%
10%
12%
14%
16%
Inve
stm
ent
Personnel Expenses Investment
Source: GoA-SEFAZ. Bank Staff Calculations
62. On the revenue side, low economic growth, a fragile economic base, informality, the inefficient tax collection administration and the generous tax incentive system to attract investments to the State (a pervasive practice engendered by the ‘fiscal war’ among Brazilian states) explain the low capacity to raise tax revenues17.
17 In fact, the most important sectors--public administration and the activities related to the sugar-cane ethanol cluster--are exempted and service sectors are predominantly driven by small firms and families. Hence, the tax

22
63. Given the low tax collection capacity, GoA finances are highly dependent on federal transfers. Indeed, transfers from the Federal Government are the most important GoA revenue source representing about 60 percent of Alagoas current revenues. At the same time, the importance of transfers vis a vis GoA own tax revenues discourages the State tax collection effort and stimulates the use of tax incentives. In recent years, the dependence on federal transfers has deepened as capital transfers from the Federal Government became the exclusive financing source of GoA investment programs in a context of no access to credit and low capacity to generate current savings.
64. Permanent budget deficits resulted in high indebtedness. At present, with a debt amounting to R$7 billion that represents 1.95 times the State’s net current revenue, Alagoas and Rio Grande do Sul (RGS) have been, until 2008, the two outliers whose debt indicators fail to meet the (FRL) requirements since its enactment in 2000. Numerous conditions exacerbate Alagoas debt dynamics including automatic capitalization of part of the deferred interest on debt owed to the STN18, wholesale price shocks (debt stock is corrected by wholesale prices), the higher interest rate paid to STN by Alagoas compared with other states19, modest revenue performance (as debt service payments are linked to revenue) and contingent liabilities from the operation of indirect administration entities.
65. High indebtedness means high debt service. GoA allocates more than 13 percent of its net current revenues to pay debt service obligations, a level above the FRL ceiling of 11.5 percent of net current revenues20.
Poor Public Sector Performance
66. The unsustainable fiscal position has been the clearest and the most worrisome sign of GoA’s institutional dysfunction. Inefficiencies in public expenditure management have not only aggravated the impact of resource scarcity on the quality of public service delivery but also worsened GoA’s difficult fiscal condition.
67. Notable inefficiencies in public sector management include: a weak planning, budgeting and expenditure execution system; weak human resource management and government purchase systems; and fragile institutional mechanisms for internal and external control that leave the State administration vulnerable to corruption, rent seeking, state capture and corporative pressures.
68. Weaknesses in the planning, budgeting and implementation cycle exist within each phase and moving from one to the other.21 Low technical and institutional capacities complicate the base of the state VAT in Alagoas is concentrated in few sectors: energy, telecommunications, oil plus a few industrial activities 18 In the debt renegotiation agreement of 1997, the Federal Government agreed to cap debt service payments on the restructured debt to 15 percent of state net real revenues (the rest of the states paid 13 percent of their revenues). Unpaid interest has to be capitalized and moved to a “residual” account, which is to be paid off over ten years at the end of the 30-year period. 19 While STN charges 6 percent plus wholesale inflation for the debt refinanced to most other state governments, Alagoas pays 7.5 percent plus wholesale inflation. 20 Prior to 2009, non-compliance with the FRL requirement on debt service has prevented GoA to contract new lending operations since 2000. 21 For a more detailed description of planning-budgeting-expenditure execution problems see “Alagoas: Diagnosis of Budgetary and Financial Management” by Luiz Carlos Nerosky (consultant) and “Strenghthening Public Sector

23
design, appraisal and evaluation of public programs and lead to the inefficient selection of projects and corresponding wasteful use of Government resources. Last but not least, fiscal difficulties have eroded the GoA’s ability to plan and prioritize. Resource scarcity and fiscal rigidities have resulted in budgetary unpredictability and expenditure cuts primarily in sectors with weaker political resistance. Reductions have been mostly on programs that can be easily cut and not necessarily on those that should be cut. Hence, government strategies and programs defined in the planning phase usually are not carried out.
69. In fact, government priorities and resource allocations defined in the planning phase through the multi-year plans (PPAs) do not guide annual budget formulation. This is shown by the inconsistency between the allocations to the programs included in the PPAs and those set in the Government’s annual budget proposals and the Annual Budget Laws (LOAs) approved by the legislative branch. This inconsistency has several roots including: technical imperfections in medium-term revenue forecasting and program costing, fragmented administrative structures that favor the proliferation of sectoral programs that are not aligned to Government priorities, the vulnerability of the capital budget to legislative amendments and the discretionary management of expenditure execution by the Executive in a context of severe financial constraints.
70. Deficiency in resource availability forecasts has been also present in the annual budget process undermining the connection between the budgeting and implementation phases of the budget. Frequently, the legislature approves an annual budget law that overestimates revenues. In turn, the Executive issues decrees setting financial ceilings for the programs which generate inconsistencies between budgeting and financial programming. Inconsistencies between budget and financial programming result in delays in the physical execution of public works due to the irregularity in resource flows.
71. Uncertainty about resource availability, which usually generates indiscriminate budget cuts, also undermines cooperation by line secretaries. Their focus has been to protect their budgets; executing non-priority programs in the expectation that central secretaries (Finance and Planning) will need to release resources for Government priority programs executed by the line secretaries and for their basic operation and maintenance costs. As a result, a reversal of budget priorities frequently occurs with cuts in investment programs and contingent liabilities generated by expenditure commitments made by the line secretariats out of approved budgets.
72. In this context of within-the-year budget cuts and arbitrary changes in financial ceilings, the role of the legislature does not end at the budget preparation and approval stage but also extends into the expenditure execution stage where intense political negotiations influence the release of resources for the execution of specific programs. Finally, budget execution is also affected by the inefficient government purchase system and the weak institutional capacity of secretariats, especially with regard to budgeting and financial programming, purchasing goods and services, and contract design and management.
73. The GoA purchasing system is not well developed and has been imposing higher than necessary government costs and contributing to the inefficient expenditure management system. Most Government purchases are not competitively procured and are directly contracted by line secretariats--only 27 percent of Government purchases are implemented by electronic reverse auction or competitive selection processes performed by the Public Management Modernization
Management, Procurement and Investment Systems in GOA” by Juliana Wenceslau, Luciano Wuerzius and Tarsila Velloso (World Bank).
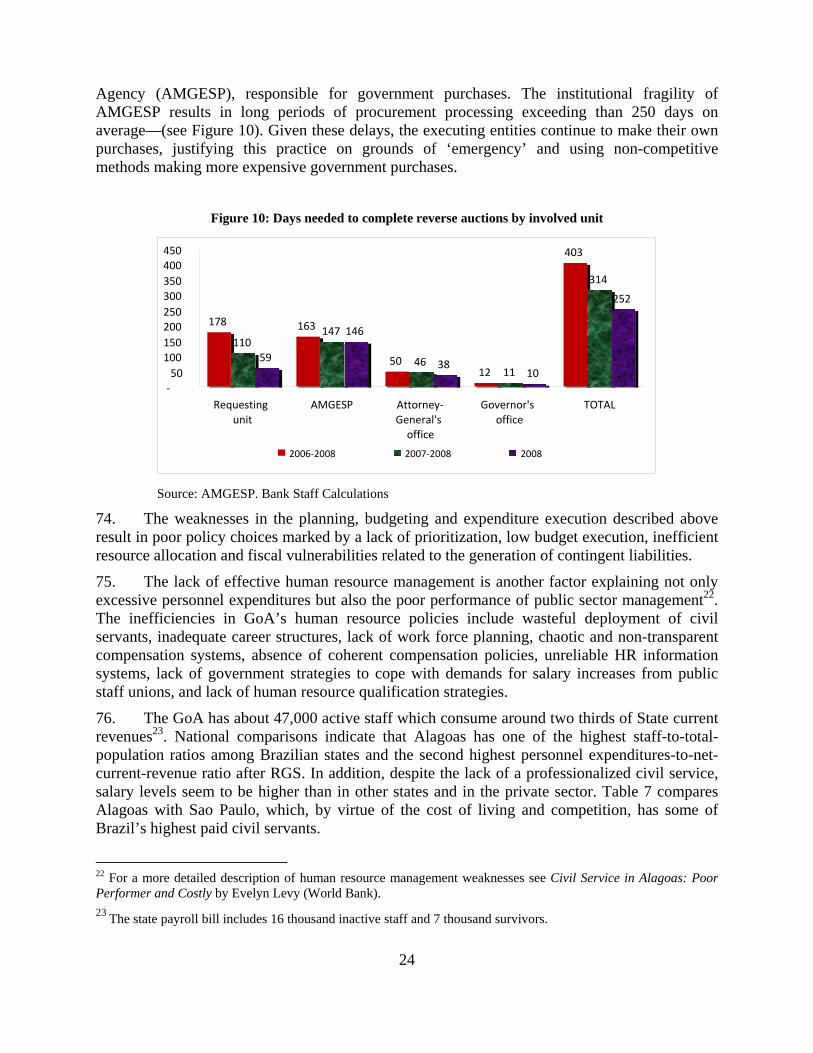
24
Agency (AMGESP), responsible for government purchases. The institutional fragility of AMGESP results in long periods of procurement processing exceeding than 250 days on average—(see Figure 10). Given these delays, the executing entities continue to make their own purchases, justifying this practice on grounds of ‘emergency’ and using non-competitive methods making more expensive government purchases.
Figure 10: Days needed to complete reverse auctions by involved unit
Source: AMGESP. Bank Staff Calculations
74. The weaknesses in the planning, budgeting and expenditure execution described above result in poor policy choices marked by a lack of prioritization, low budget execution, inefficient resource allocation and fiscal vulnerabilities related to the generation of contingent liabilities.
75. The lack of effective human resource management is another factor explaining not only excessive personnel expenditures but also the poor performance of public sector management22. The inefficiencies in GoA’s human resource policies include wasteful deployment of civil servants, inadequate career structures, lack of work force planning, chaotic and non-transparent compensation systems, absence of coherent compensation policies, unreliable HR information systems, lack of government strategies to cope with demands for salary increases from public staff unions, and lack of human resource qualification strategies.
76. The GoA has about 47,000 active staff which consume around two thirds of State current revenues23. National comparisons indicate that Alagoas has one of the highest staff-to-total-population ratios among Brazilian states and the second highest personnel expenditures-to-net-current-revenue ratio after RGS. In addition, despite the lack of a professionalized civil service, salary levels seem to be higher than in other states and in the private sector. Table 7 compares Alagoas with Sao Paulo, which, by virtue of the cost of living and competition, has some of Brazil’s highest paid civil servants.
22 For a more detailed description of human resource management weaknesses see Civil Service in Alagoas: Poor Performer and Costly by Evelyn Levy (World Bank). 23 The state payroll bill includes 16 thousand inactive staff and 7 thousand survivors.
178 163
5012
403
110 147
4611
314
59
146
3810
252
- 50
100150200250300350400450
Requesting unit
AMGESP Attorney-General's
office
Governor'soffice
TOTAL
2006-2008 2007-2008 2008

25
77. The excessive staffing and generous compensation that result in high personnel expenses are not matched by the quality and coverage of public services. The quality of GoA services such as education, health and security are among the worst in the country which is reflected in the poor performance on social and economic indicators. In fact, inflexible human resource management derived from legal protection mechanisms that grant stability to public staff has resulted in an inefficient deployment of public servants expressed in the excess of staff in some sectors and shortages in others. Inflexibility is also generated by the rigid and very specific career structure which severely limits the Government’s ability to reallocate its human resources according to changing needs and priorities. Finally, related to the inefficient distribution of staff, the lack of work force planning is another cause that explains the mismatches between Government strategies and priorities, service delivery and staffing.
Table 7: Average Wages paid by the state governments of Alagoas and Sao Paulo
Alagoas São Paulo
Education 1,318 1,552
Health 1,548 1,684
Civil Police 2,973 2,786
Military Police 2,727 2,786
Attorney General 8,051 9,078
Public Defender’s Office 5,620 8,216
Finance 6,481 6,192
Traffic Dept. 2,570 -------
Planning 2,845 1,399
Source: Governments of Alagoas and São Paulo, August 2008
78. The existence of a myriad of contractual and compensation regimes, complex compensation systems with different salary components (subsidies, bonuses, etc) and the lack of consistent parameters, result in a chaotic, unreliable and nontransparent compensation system where similar jobs and responsibilities are remunerated very differently. This compensation system is also not related to performance and distorts career incentives.
79. The multiplicity of compensation regimes is also related to the lack of an integrated system for staff management. GoA has at least four human resource (HR) management systems that are precarious and not interconnected.24 The unreliability of the HR information system not only erodes the Government’s ability to effectively manage its staff but also opens opportunities for duplication, fraudulent compensation, irregularities, etc.
80. GoA salary policies are highly influenced by the corporative pressures of staff unions. Conflict governs labor relations between the State and public servants. In 2007-08, civil servants’ strikes for higher wages included: health sector workers (90 days), teachers (120 days), police (60 days) and other indirect administration workers.
24 The executive, legislative and judiciary branches have different HR management systems and indirect administration entities have their own systems.

26
81. To conclude, the fragility of the State’s institutional systems described above and the deficient oversight and control framework result in a weak accountability framework in the government’s core administrative functions. This situation results in poor policy decisions and inefficiencies in the use of public resources, and it also makes public sector management and government spending more prone to corrupt practices.
III. THE GOVERNMENT PROGRAM
82. Governor Teotônio Vilella Filho, inaugurated in January 2007, undertook a diagnosis upon assuming office that found a close link between the weakened functioning of the Alagoas State public sector and poor economic and social performance. The Governor consequently set an agenda prioritizing three reform pillars: the renewal of the public sector, recovery of State public finances and reversal of the deteriorating trend of social and economic indicators. The Governor aspired to leading a government “that established a responsible, efficient and ethical administration, that promoted economic development with environmental sustainability and interrupted the cycle of illiteracy and misery while improving the quality of life of the Alagoan people and rescuing its self-esteem”.
83. In line with this view, the current administration defined the improvement of economic development and social welfare as its medium term objective and framed its Multi-year Budget Plan (PPA) for the period 2008-2011 accordingly. Figure 11 shows the government’s strategy built upon six interrelated areas or “axes”: i) economic growth and diversification; ii) poverty and inequality reduction; iii) human capital development; iv) integration between State and population; v) improvement of the quality of life and; vi) modern institutions, fiscal adjustment and public sector strengthening.
84. The Economic Growth and Diversification Axis aims at turning the prevailing stagnant, concentrated and exclusionary economic model into a more dynamic, diversified and inclusive platform for economic growth. The main actions proposed under this umbrella will accelerate state economic growth and spread it among economic activities, regions and the poor. These will include improvement of public infrastructure in roads and irrigation, support to local economic clusters expansion and consolidation of the tourism sector, increase of the value added generated in the sugar cane-ethanol industry, support to small and family agriculture to enhance its productivity and overall improvement in the state’s investment climate.
85. The Poverty Reduction Axis includes actions to reduce illiteracy and increase childhood schooling, and increase the coverage and quality of health programs targeting especially reduced infant and maternity mortality. The State will also undertake to mobilize federal transfers by improving access of eligible populations to conditional cash transfer programs such as the Bolsa Familia Program (PBF), the Rural Pension Program and the Beneficio de Prestação Continuada (BPC) and other federal transfer programs.
86. The Human Development Axis focuses on education. This axis comprises programs to evaluate and improve the quality of State education services, support to municipalities -the most important provider of basic education, guarantee access and continuation of children in school and expand secondary and technical education.

27
87. The Integration between State and Population Axis comprises programs directed at promoting a better integration between society and government and to improve the self esteem of Alagoans. These programs include ‘moralization and transparency campaigns’ to improve the Alagoan populace’s perception of the State public sector that has been damaged by recurrent problems of corruption and mismanagement. In addition, the Valorization campaign encompasses actions to promote Alagoas’s rich cultural heritage and to reinvigorate its role in the national scenario.
88. The Quality of Life Axis encompasses programs to expand the provision of housing, sanitation and water services for the population as well as programs to reduce crime and violence in the state. The axis also comprises programs to rationalize and improve the efficiency of public hospitals and clinics. In budgetary terms, this Axis is the most important responding for more than 50 percent of government projected expenditures in the period 2008-11.
Figure 11: Alagoas Multi-year Plan (PPA) Strategic Objectives
Alagoas: Medium Term Strategy
Image and Cultural Valorization
Growth and Economic Activity
Modern Institutions, Fiscal Adjustment
and Public Management
Renewal
Reduction of Poverty, Extreme
Poverty and Inequality
Human Capital Development
Improvement of the Quality of Life
Economic Development and
Social Welfare
State Government of Alagoas
89. The Fiscal Adjustment and Public Sector Renewal Axis includes the implementation of a broad ranging administrative reform, recovery of public finances though consolidation of the ongoing fiscal adjustment, strengthening of public management efficiency, and better use of information technology tools in public sector activities. The Axis promotes enhancement of internal controls and transparency through targeted reforms. And it provides support to municipal governments that are responsible for essential social services delivery in the state.
90. It is important to highlight the strong linkages between all six of the reform Axes comprising the Government’s strategy. However, the last above mentioned axis is perhaps the most relevant for achieving the medium term development objectives of the proposed operation and this axis focuses on improving GoA’s ability to restore fiscal solvency while reforming the inefficient and demoralized public sector apparatus. From its inauguration in 2007, the State administration perceived that the corresponding challenges were among the greatest impediment to turning around the state.

28
91. With this in mind, the GoA strategy in the first two years consisted primarily of setting priorities for the Fiscal and Public Sector Renewal Axis. These reforms were seen as a necessary condition for the successful implementation of the programs included in the other five axes. In pursuing this course, the GoA is following a course of action similar to the one adopted successfully in other Brazilian states over the last few years.25 Consequently, Alagoas is aiming for drastic fiscal adjustments, administrative reforms, rationalization of government processes, introduction of result-based management, prioritization of State programs and the enhancement of human resource management.
FISCAL ADJUSTMENT
92. Faced with extremely adverse fiscal conditions upon assuming office in 2007, the government initiated an aggressive fiscal adjustment effort to reduce its indebtedness. The adjustment measures encompassed initiatives focusing on both increasing State tax revenues and restraining expenses. On the revenue side, government measures concentrated on the enhancement of tax collection efficiency through the introduction of data base integration to attack tax evasion on the State VAT, the so called ICMS. A ‘matrix managerial model’ was introduced based on the use of tax collection information from sectors and regions to detect evasion. This effort was crowned by the signature of a ‘results based contract’ with the Secretary of Finance’s State Revenue Department (Superintendência de Receita Estadual - SRE).
93. On the expenditure side, the government adopted a set of emergency measures. First, an administrative reform reduced significantly the number of State secretariats from 37 to 17 and eliminated several indirect administration entities.26 Second, a budgetary and financial management programming committee, called Comité de Programação Orçamentária e Financeira (CPOF) was created to set budgetary ceilings for spending by State Secretariats to reduce the number of expenditure commitments without resource availability and to assert strict cash management controls. This Committee is also responsible for reviewing and approving all policy decisions with fiscal implications. As a result, the government managed to reassert control over spending. Third, a sharp reduction in operating costs of about 20 percent was achieved through the imposition of controls on State entities’ use of energy, telecom, water and other maintenance supplies. Fourth, the government negotiated a rollback in the wage increases granted by the previous government to the civil service. The hard salary adjustment negotiations and the government’s resistance to pressure from powerful civil servant unions resulted in a large number of strikes affecting public service delivery in 2007. Agreements reached with the unions defined a chronogram for salary adjustments covering the second half of 2007 through 2009. Fifth, given the expenditure rigidities the GoA was obliged to reduce by more than 25 percent its investment expenses compared to 2006.
25 Of particular importance are the public sector reforms undertaken by the states of Minas Gerais and Rio Grande do Sul. 26 The administrative reform was instituted through the following legislation: Decree No. 4542, January 1, 2007, Delegate Law No. 43, June 28, 2007.

29
Table 8: GoA Fiscal Balances, 2003-08
(Million of Reais of 2008) 2003 2004 2005 2006 2007 2008 I. REVENUE 2,789 2,942 3,501 3,582 3,999 4,352 Taxes 1,037 1,179 1,297 1,448 1,518 1,609 Social Contributions 88 110 115 126 156 162 Transfers 1,497 1,552 1,885 1,916 2,075 2,325 Other Revenues 167 102 205 92 250 256 II. EXPENSE 2,471 2,609 2,879 3,115 3,328 3,615 Compensation of Employees 1,037 1,070 1,169 1,291 1,447 1,587 Goods and Services 485 518 620 627 516 604 Interest Payments (paid) 172 183 187 159 207 164 Transfers to Municipalities 318 338 366 450 480 528 Pensions 458 501 537 588 678 731 III GROSS OPERATING BALANCE (I - II) 318 333 622 467 670 736 IV. TRANSACTIONS IN NON FINANCIAL ASSETS – INVESTMENTS 274 250 439 244 172 370 V.PRIMARY BALANCE (VI + Int. Payments) 181 253 355 361 675 466 VI. NET LENDING / BORROWING (III - IV) 44 84 183 223 498 366 VII. TRANSACTIONS IN FINANCIAL ASSETS AND LIABILITIES -129 -132 -240 -160 -299 -330 New Loans 16 12 1 0 0 4 Amortizations net 145 145 242 228 300 334 Asset sales 0 1 0 68 1 0 TOTAL BALANCE -85 -48 -57 63 199 37 Memo Items: Operating Balance / Net Current Revenue 0.15 0.12 0.19 0.14 0.19 0.21 Primary Balance / Net Current Revenue 0.09 0.09 0.11 0.11 0.19 0.13 Net Lending (Borrowing) / Net Current Revenue 0.02 0.03 0.06 0.07 0.14 0.10 Investment / Net Current Revenue 0.13 0.09 0.14 0.07 0.05 0.10 Source: RGS Secretariat of Finance (SEFAZ). Calculations by Bank staff.
94. Favored by the good performance of State revenues in 2007-08 and the containment of government expenses, GoA has obtained impressive improvements in fiscal balances and debt reduction. Table 7 shows that from 2006 to 2008, State revenues grew by 20 percent. Fostered by the acceleration of national economic activity the federal tax revenue sharing transfers to the State increased by 21 percent in real terms. Better regional growth performance as well as the stringent measures taken to improve taxpayers’ compliance resulted in State tax collection growth of 12 percent in the last two years.
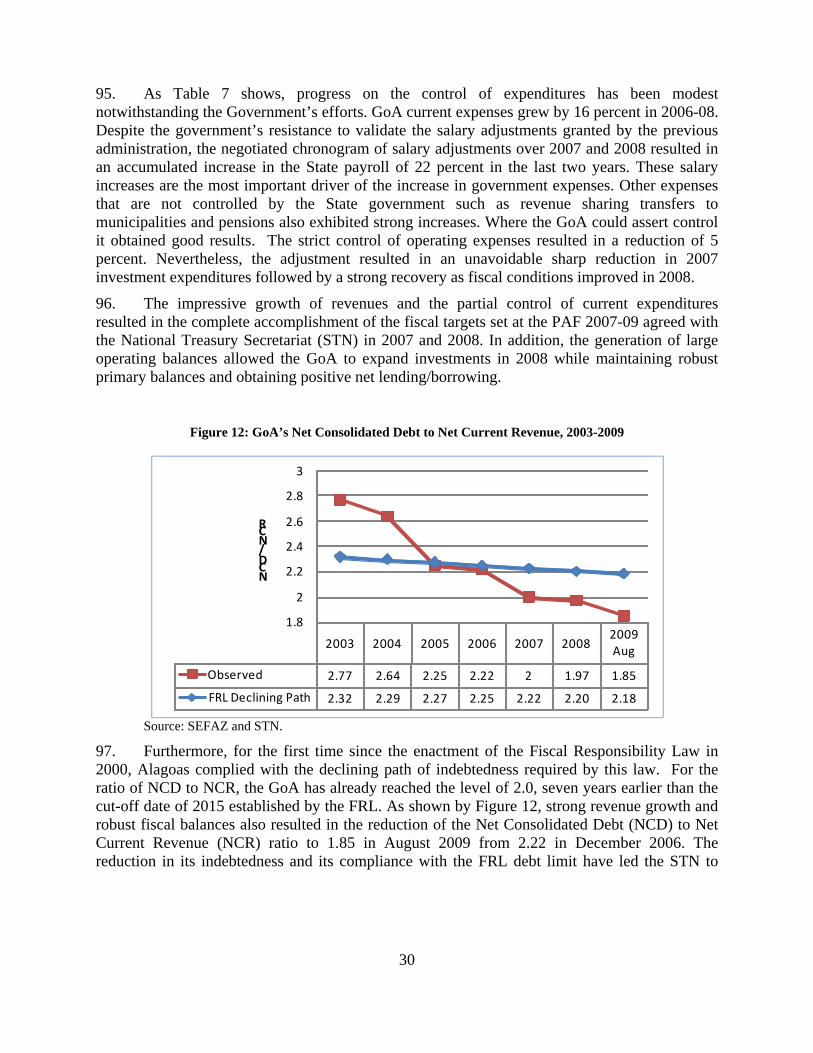
30
95. As Table 7 shows, progress on the control of expenditures has been modest notwithstanding the Government’s efforts. GoA current expenses grew by 16 percent in 2006-08. Despite the government’s resistance to validate the salary adjustments granted by the previous administration, the negotiated chronogram of salary adjustments over 2007 and 2008 resulted in an accumulated increase in the State payroll of 22 percent in the last two years. These salary increases are the most important driver of the increase in government expenses. Other expenses that are not controlled by the State government such as revenue sharing transfers to municipalities and pensions also exhibited strong increases. Where the GoA could assert control it obtained good results. The strict control of operating expenses resulted in a reduction of 5 percent. Nevertheless, the adjustment resulted in an unavoidable sharp reduction in 2007 investment expenditures followed by a strong recovery as fiscal conditions improved in 2008.
96. The impressive growth of revenues and the partial control of current expenditures resulted in the complete accomplishment of the fiscal targets set at the PAF 2007-09 agreed with the National Treasury Secretariat (STN) in 2007 and 2008. In addition, the generation of large operating balances allowed the GoA to expand investments in 2008 while maintaining robust primary balances and obtaining positive net lending/borrowing.
Figure 12: GoA’s Net Consolidated Debt to Net Current Revenue, 2003-2009
2003 2004 2005 2006 2007 20082009 Aug
Observed 2.77 2.64 2.25 2.22 2 1.97 1.85
FRL Declining Path 2.32 2.29 2.27 2.25 2.22 2.20 2.18
1.8
2
2.2
2.4
2.6
2.8
3
NCD / NCR
Source: SEFAZ and STN.
97. Furthermore, for the first time since the enactment of the Fiscal Responsibility Law in 2000, Alagoas complied with the declining path of indebtedness required by this law. For the ratio of NCD to NCR, the GoA has already reached the level of 2.0, seven years earlier than the cut-off date of 2015 established by the FRL. As shown by Figure 12, strong revenue growth and robust fiscal balances also resulted in the reduction of the Net Consolidated Debt (NCD) to Net Current Revenue (NCR) ratio to 1.85 in August 2009 from 2.22 in December 2006. The reduction in its indebtedness and its compliance with the FRL debt limit have led the STN to
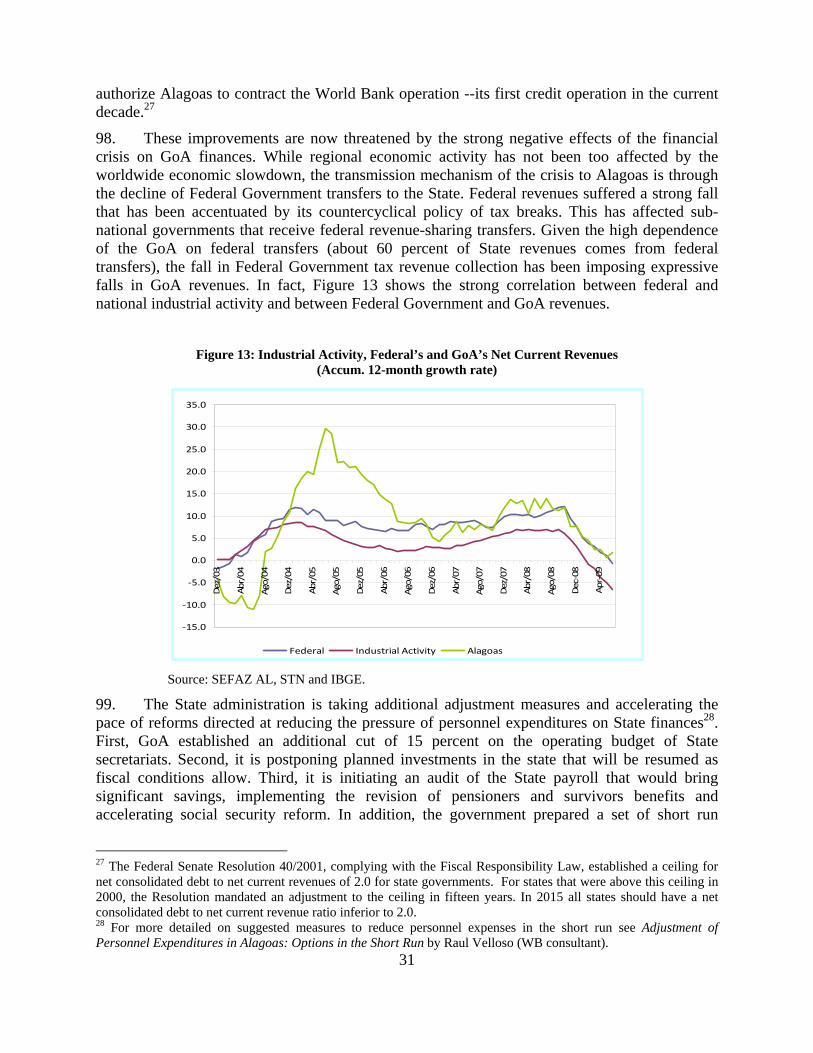
31
authorize Alagoas to contract the World Bank operation --its first credit operation in the current decade.27
98. These improvements are now threatened by the strong negative effects of the financial crisis on GoA finances. While regional economic activity has not been too affected by the worldwide economic slowdown, the transmission mechanism of the crisis to Alagoas is through the decline of Federal Government transfers to the State. Federal revenues suffered a strong fall that has been accentuated by its countercyclical policy of tax breaks. This has affected sub-national governments that receive federal revenue-sharing transfers. Given the high dependence of the GoA on federal transfers (about 60 percent of State revenues comes from federal transfers), the fall in Federal Government tax revenue collection has been imposing expressive falls in GoA revenues. In fact, Figure 13 shows the strong correlation between federal and national industrial activity and between Federal Government and GoA revenues.
Figure 13: Industrial Activity, Federal’s and GoA’s Net Current Revenues (Accum. 12-month growth rate)
-15.0
-10.0
-5.0
0.0
5.0
10.0
15.0
20.0
25.0
30.0
35.0
Dez
/03
Abr/
04
Ago/
04
Dez
/04
Abr/
05
Ago/
05
Dez
/05
Abr/
06
Ago/
06
Dez
/06
Abr/
07
Ago/
07
Dez
/07
Abr/
08
Ago/
08
Dec
-08
Apr
-09
Federal Industrial Activity Alagoas
Source: SEFAZ AL, STN and IBGE.
99. The State administration is taking additional adjustment measures and accelerating the pace of reforms directed at reducing the pressure of personnel expenditures on State finances28. First, GoA established an additional cut of 15 percent on the operating budget of State secretariats. Second, it is postponing planned investments in the state that will be resumed as fiscal conditions allow. Third, it is initiating an audit of the State payroll that would bring significant savings, implementing the revision of pensioners and survivors benefits and accelerating social security reform. In addition, the government prepared a set of short run
27 The Federal Senate Resolution 40/2001, complying with the Fiscal Responsibility Law, established a ceiling for net consolidated debt to net current revenues of 2.0 for state governments. For states that were above this ceiling in 2000, the Resolution mandated an adjustment to the ceiling in fifteen years. In 2015 all states should have a net consolidated debt to net current revenue ratio inferior to 2.0. 28 For more detailed on suggested measures to reduce personnel expenses in the short run see Adjustment of Personnel Expenditures in Alagoas: Options in the Short Run by Raul Velloso (WB consultant).

32
options to reduce personnel expenditures that would be used in case of revenue fall persistence. Finally, the Federal Government is implementing a compensation support program to sub-national governments that experienced intergovernmental transfers fall. Alagoas has been included in this compensation package.
Procurement Reform
100. Given the potential short run gains from the introduction of electronic reverse auctions (pregão eletrônico) and electronic price registration, the GoA is also expanding these procurement methods for State purchases. In 2007 the GoA issued a Decree mandating the use of reverse auctions, preferably in electronic form, for the procurement of goods and common services. In 2008 the GoA purchased 635 items under the electronic price registration and obtained savings equivalent to R$50 million or (28 percent of the estimated amount).
101. To further expand the use of electronic auctions, the GoA will need to reduce the long processing times29. It is unreasonable to oblige government units to carry huge stocks or wait for long periods to replenish stocks or to operate without essential materials. This is one reason the government has frequently resorted to direct contracting justified on the basis of emergency situation and/or small quantities. In 2008, 59.32 percent of the total amount contracted in Alagoas was procured directly by government entities. To favor the use of electronic reverse auctions, the government prepared a decree regulating procedures and establishing maximum processing periods for public procurement steps to reduce processing times. With reduced processing periods, the government envisages the expansion of electronic price registration in government purchases which has demonstrated an even greater savings potential than the electronic reverse auction.
HUMAN RESOURCE MANAGEMENT
102. The effects of the international financial crisis on State public finances also reinforced the need for fundamental reforms directed to containing current expenditures in response to declines in revenues. Recognizing that personnel expenses are the driving factor contributing to fiscal disequilibria, the government initiated essential human resource management initiatives. The enhancement of human resource management under the government strategy entails two sequential sets of actions. The first is the improvement of the existing unreliable information systems regulating staffing, individual remuneration and overall payroll.
103. At the beginning of 2009, the government completed a census of civil servants (active, pensioners and survivors). It is currently performing an audit of the payroll that will be followed by the acquisition of a new human resource system that will consolidate the information generated by the census and the audit and will allow better control of personnel expenses. The expected benefits of the civil service census, the payroll audit and the new HR system are substantial. The combined effect of the three actions would be a reduction of about 5 percent of the GoA payroll. As the payroll covering active civil servants, pensioners and survivors amounts 29 From July 2007 until December 2008, the state agency responsible for government purchases AMGESP received 230 purchase requests, but it processed and completed only 66. To complete these 66 processes, it took AMGESP an average of 259 days. The data collected showed a much worse scenario for the remaining 164 processes: an average of 379 days had already passed without AMGESP completing them.

33
to R$ 2.2 billion, the savings generated by the improvement of information systems would amount to R$110 million.30
104. The second stage of the GoA’s human resource management enhancement strategy is the creation of institutional and technical capacity for the design and implementation of effective Human Resources policies. With a more reliable information system, the GoA intends to implement more complex reforms including HR planning, compensation policies, career restructuring and introduction of performance evaluation. In order to design and implement HR policies the government will create a Quality of HR Management Committee led by the Secretariat of Public Management. Given the fiscal and budgetary dimensions of HR policies, the secretariats of Finance and Planning will also be part of the Committee that will be responsible for the control of personnel expenditures, and for appraising HR decisions such as establishing new positions, creating new career paths, revising rules governing promotion, and designing capacity building activities for civil service, among others.
SOCIAL SECURITY
105. To a great extent, the difficult financial situation of the civil service pension scheme in Alagoas and other states is the result of generous benefit rules and eligibility criteria enshrined in the Federal Brazilian Constitution and in other federal legislation. However, deep federal reform is unlikely and a possible reduction in the imbalances of the GoA’s Social Security System for Public Employees (Regime Próprio da Previdência Social – RPPS) will depend on reforms which can be implemented by the State within the existing federal legislation.
106. Recognizing the pervasive and debilitating short and long run impact of the growing deficits of the GoA’s RPPS, government efforts have been directed to the preparation of a bold social security reform. This reform encompasses administrative, parametric and structural reforms.
107. Among the first group, the most important is the creation of a single administrator of the State pension system (Gestor Único da Previdência) to regulate the concession of benefits of all government branches. With this reform, the Executive will for the first time exert control on the benefits of the Legislative, Judiciary, State Accounting Court and General Attorney Office branches which have so far resisted reforms and audits. In addition, the GoA expects to reap significant administrative economies of scale from reducing replication of work across branches and reducing irregular benefit payments.
108. The creation of the Single Administrator for managing pensions is a crucial action to control the concession of benefits in all government branches. Currently in the State of Alagoas –and also in many others states and municipalities – pension administration is fragmented with different entities handling different branches of government, and pensions are granted separately by each branch and despite the need for uniform rules set by the Federal Government, administrators are under no obligation to conform to State policies. The establishment of a single entity for pension management is now permitted by law and encouraged by the Federal Government. The result could be significant administrative economies of scale and synergies. Furthermore, audits and other reforms could be carried out and policy targets could be imposed 30 The census identified 450 ghosts among the civil service (0.8 percent of active employees, pensioners and survivors). Similar auditing of payroll performed in other states generated savings that vary between 5 to 10 percent.

34
such as the establishment of a minimum performance rate for pension assets, maximum deadlines for benefits’ grants and revisions, and an independent governance body comprised of fixed term members
109. In addition, GoA’s administrative measures to reduce social security deficits include the crosschecking of federal data bases for obits and beneficiaries of other national social security systems (federal and sub-national ones) against Alagoas State’s payroll. This would make it possible to eliminate many cases of fraud such as the continuation of pension payments to deceased persons or to employees said to be employed in the federal government, in different states or in the private sector.
110. It is important to mention that the audit of the payroll in the HR component also includes the payroll of pensioners and survivors. Rough estimates by the Secretary of Public Management indicate that potential errors for pensioners and survivors are bigger than what can be found in the payroll for active civil servants.
111. As for parametric reforms their scope at the sub-national level is limited since many rules are established in the Brazilian Constitution and in federal laws. However, as the State of Alagoas still needs to comply with a number of changes introduced by Constitutional Amendment 41 of 2003 (see below), there is ample space for the adoption of parametric reforms that could address the financial difficulties of the GoA’s RPPS. The government is assessing the adoption the following parametric measures to its RPPS. The first item is the adoption of survivors benefit indexation according to price inflation, and not to wages of active employees as it is applied now in Alagoas. Constitutional Amendment 41 stipulates that survivor benefits awarded after 2003 should be indexed to inflation. However, the State continues to index all of these benefits to wages of active personnel. The cost of this practice of wage indexation for survivor pensions is high as wages increases in Alagoas tend to exceed inflation. The high cost of wage indexation might even force the State to freeze wages in order to contain expenditures with survivors’ benefits.
112. The second parametric reform is the application of the correct replacement rate for survivor benefits. Constitutional Amendment 41 also determines that a marginal replacement rate of 70 percent above the General Regime of Social Security (Regime Geral da Previdência Social – RGPS) cap should be applied to survivor benefits granted from 2004 onwards. However, the State still replaces 100 percent of the pension received by the deceased.
113. The third item is the adoption of benefit formulas for pensions based upon the average work-life wage and not on the last wage. Constitutional Amendment 41 stipulates that the benefit formula should be based upon average wages, not on the higher last wage. Alagoas does not apply average wage pension formulas in calculating benefits which results in a far larger and unnecessary cost to its pension system, especially considering that civil servants benefit from a seniority increase in their wage calculation.
114. The fourth item is the adoption of a correct definition of special treatment for the purpose of determining the contributions of retirees and survivors. These must still contribute to the pension system. Special deductions apply for certain kinds of illnesses. However, definition of the situations that give rise special treatment is in Alagoas the same that is applied for Federal Income Tax (IR) purposes. As this definition is different and more generous than that applied for pensions, the use of the social security legislation regarding exemptions for pensioners and survivors contributions would bring additional revenues.

35
115. Finally, the government will extinguish the application of the parity adjustments among salaries of active employees and pensioners benefits. Current practice in Alagoas is to apply parity to inactive employees for all readjustments of benefits conceded for active employees regardless of the regulations. As allowed by federal legislation, the social security reform being implemented by GoA will eliminate this parity.
116. Savings from the application of the above parametric measures are significant (see Figure 14 below). The annual net present value of these savings amount to R$42.5 million or 6 percent of total social security payments. Given the accelerated deterioration of public finances in 2009, the government will speed up the adoption of the above measures and it is expected that they will be in place still in this years.
Figure 14: Simulation of Impact of Parametric Reforms on RPPS Deficits, 2009-58
(3.000)
(2.500)
(2.000)
(1.500)
(1.000)
(500)
-
20092012
20152018
20212024
20272030
20332036
20392042
20452048
20512054
2057
Mill
ions
Current Pension (70%) BW = CW Average Inflation Indexation All
117. Finally, the State government also prepared a draft law proposal (already sent to the State assembly) to restructure its social security system. This reform consists in the gradual transformation of the current as pay as you go system (PAYG) into a fully funded system (FFS). The biggest problem with this change is that it imposes huge transitional costs. The contributions paid by younger civil servants would not be used to pay the benefits of current retirees and survivors. Rather, their contributions would be converted into assets that in the future would be used to pay their pensions. However, current pension outlays would remain the same since current retirees have accumulated no assets and the value of their pensions is unchanged. For this reason, there must be a managed transition from PAYG to a funded system in order to mitigate transition costs. The transition alternative that this operation is supporting is the segmentation of the RPPS participants and the temporary coexistence of PAYG and fully funded systems31.
31 Another option would be the creation of a complementary fund. The Bank team assessed feasibility of this option and recommended the adoption of the segmentation alternative.

36
118. The government’s gradualist strategy consists in the segmentation of civil servants into two groups. The first group is composed of current retirees, survivors and older staff in active service. These individuals would continue to be in a PAYG system funded by general government revenues as they have not accumulated enough assets to finance their pensions. They also have not enough time remaining in their active career to save for the financing of their retirement. Within this group under the PAYG system, the government decided to separate the military staff as they have particularities that call for a differentiated social security treatment. The second group comprises younger, active workers. This group has enough time to save in order to finance a fully funded system.
119. This strategy mitigates the transition cost problem since the contributions of older generations will still be used to finance current retires. Because of the magnitude of the transition costs and the difficult financial situation of the State, the government set 2007 as the cut-off date for the participants’ segmentation. While there will still be significant transition costs in the short and medium term, this structural reform will ensure that pension costs will be independent of the government budget in the long run32.
PUBLIC SECTOR MANAGEMENT
120. Public sector reforms have moved less rapidly. The Government had hoped to aggressively implement ground-breaking reforms similar to those adopted by other high-performing states (e.g Minas Gerais). After a more realistic assessment of the various obstacles to the implementation of those reforms – e.g associated to the State’s institutional framework, technical and implementation capacity and political context - the focus of the public sector management reform agenda has evolved to the gradual implementation of basic improvements in planning, budgeting and financial execution. In addition, the GoA is also cautiously piloting results based management tools in a sub-set of government priority programs with the aim of replicating them gradually to other government programs.
a) Planning, Budgeting and Budget Execution
121. The government’s priority reform agenda includes addressing of the weaknesses identified in the planning, budgeting, expenditure execution cycles. Failures at all these levels result in poor policy choices marked by inefficient resource allocation and lack of prioritization, dispersion of government resources in a large number of programs, low budget and financial execution of the great majority of programs and fiscal vulnerabilities related to the generation of contingent liabilities as well as corruption, rent seeking and state capture.
122. The government has taken the first steps for improving the planning-budgeting-execution cycles. In April 2009, the GoA signed a technical cooperation agreement with the federal Ministry of Planning and Budgeting and Management (MPOG) for capacity building of State agencies in planning, budgeting and financial management. In addition, per suggestion of the Bank team, it included articles in the Budgetary Guidelines Law (LDO) for 2009-11 to simplify
32 Earlier cut-off dates would impose higher short run costs. Nonetheless, this also means that State Treasury contributions to the RPPS will end later.

37
budget classification, allow more flexibility for budget reallocation and set budget ceilings by secretariats in Annual Budget Law (LOA) 2010.
123. In order to improve government resource allocation and expenditure execution, a joint GoA and Bank diagnostic identified and measured the main performance indicators governing planning, budgeting, expenditure execution and control. The purpose of this exercise was to create a baseline, formulate an action plan for improvement and provide GoA with a roadmap for implementation. The plan encompasses clearer definition of attributions and responsibilities for central and line secretaries in the planning, budgeting and financial management areas, plus capacity building activities for carrying out the budget cycle.
124. The action plan consists of a set of policy measures addressing the most urgent and important limitations identified in the diagnostic work. The actions and areas were selected according to their relevance, the getting of poor ratings in the diagnosis (areas that obtained scores C and D) and implementation feasibility in the coming years. Using these criteria, the activities that were included in the action plan are:
• formal definitions of roles and responsibilities of central and line agencies in the planning, budgeting and financial management system;
• definition of formal rules and chronograms for the preparation of budgetary pieces;
• capacity building activities for planning staff in central and line agencies in macro fiscal programming, program formulation;
• budget programming; and
• strengthening the internal control agency (CGE).
b) Prioritization and Introduction of Intensive Project Management tools
125. Finally, given resource scarcity, the GoA is taking steps to allocate resources to priority undertakings and avoid fragmentation. Hence in 2009, a portfolio of priority projects has been selected that will receive differentiated treatment during budget preparation and execution and be intensively monitored to improve budget and project execution.
126. A unit inside the Planning Secretariat has taken on the responsibilities of a project management office and innovative project management techniques are being used to administer this strategic portfolio program. Each project is led by an assigned project manager who is being trained in project management techniques and will be accountable for project performance. It is expected that these measures will enhance budget predictability and facilitate faster corrective measures to assure that projects are implemented and results are achieved. The introduction of these managerial tools constitutes the GoA’s first steps in delivering results in an efficient and effective manner.

38
IV. BANK SUPPORT TO THE GOVERNMENT’S PROGRAM
LINK TO CPS
127. The proposed operation is fully consistent with and closely linked to the objectives of the Brazil Country Partnership Strategy (CPS), 2008-2011. Sound macroeconomic management, fiscal reform, efficient public sector management, and good governance are key pillars of the CPS strategy for achieving inclusive economic growth in Brazil. The CPS also identifies support for the states (under results-oriented public sector reforms) and improvement in fiscal management as two of the most important areas of Bank engagement over the next four years. Furthermore, the current partnership strategy was developed in close consultation with the Federal authorities, who see Bank support to the states as central to their efforts to improve fiscal management and the provision of public services.
128. The proposed loan meets all of the CPS criteria for a ‘priority operation’. It helps reinforce fiscal discipline. It supports public sector management reforms and improved governance. It helps strengthen federal-state relations. It responds in a flexible and timely fashion both to the state needs and requests by the National Treasury.
129. The proposed operation also reinforces the FRL and fiscal discipline. Alagoas has not yet been able to meet many FRL requirements. The State had been exceeding legal limits on debt, debt service, and personnel expenditures. As a result of the strong fiscal adjustment and good revenue performance, in 2008 Alagoas reached the FRL limit on indebtedness and met all of the targets under the three-year rolling Fiscal Adjustment Programs (PAF) for the period 2007-2009. The proposed operation became possible because good fiscal performance over the past two years opened space for new borrowing. Moreover, the loan supports measures that will increase the State’s ability to satisfy FRL restrictions and the requirements of the debt renegotiation contract signed with the National Treasury Secretariat (STN).
130. It is also noteworthy that by working with the State of Alagoas the Bank is assisting in addressing poverty and management problems prevalent in numerous other poor Brazilian states. These states have more in common with the Bank's poorer client countries than with Brazil, a Middle Income Country (MIC). Brazil has attained MIC status by virtue of the dynamism of its Southern states: Sao Paulo, Rio de Janeiro, Minas Gerais, Rio Grande do Sul, Paraná and Santa Catarina. Sao Paulo alone accounts for 34 percent of Brazil’s GDP and if it were a sovereign country would rank third in the LAC region with a GDP of US$550 billion (behind only Brazil and Mexico) and a per capita GDP of US$9,000.
131. The Northeast, on the other hand, lags far behind in income and most other well-being indicators and Alagoas is among the 2-3 poorest and worst scoring Brazilian states. In 2006 the state’s per capita income was US$ 2,200, only 40 percent of the Brazilian average, and the third lowest in the country losing only to Piauí and Maranhão. In an international perspective Alagoas ranks among the bottom group of middle income countries. Its HDI place Alagoas in the 120th position among 185 countries (Brazil ranks 65th).
132. Consequently, this operation will be mobilizing good case loan design and experience to address one of Brazil’s and the world's poorer states —one that is less akin to a MIC than a much poorer client country. Hence, this DPL is not only addressing some of the world’s poorer

39
populations but it presents a prototype that might well serve as an example for subsequent operations in the Northeast and elsewhere in the world.
133. By supporting one of the poorest sub-national governments in Brazil, the proposed operation is also responding to a recent IEG study which assessed the Bank’s engagement with sub-national governments in large federal client countries. IEG recommended that the Bank deepen its involvement in the lesser developed sub-nationals to enhance operations’ poverty impact, to provide the Bank with tested prototypes and to create desirable demonstration effects for the broader community of lagging states. The Alagoas loan is addressing all three of IEG’s recommendations.
134. The operation will also draw upon successful good practice reform experiences in other states which will bolster the reform program’s credibility. Examples include the design and implementation of human resource management reforms, improvements in State’s procurement system, reforms of civil service pension systems and successful experiences in reforming planning, budgeting and financial management systems. The advice provided by Bank staff during the preparation stage on the potential for adapting these experiences to Alagoas has already delivered significant results. These have been reflected in the GoA’s recent performance and in the development of the government’s reform program supported by this operation.
COLLABORATION WITH THE IMF AND OTHER DONORS
135. Given its history of non-compliance with the Fiscal Responsibility Law and high indebtedness, Alagoas has not been able to access credit since 2000. Currently Alagoas has an external debt amounting to US$3 million with the Inter American Development Bank (IADB) that corresponds to a loan for the promotion of the tourism sector (Programa de Desenvolvimento do Turismo – PRODETUR) signed in 1998. In addition, Alagoas participates in two national programs of technical assistance provided by the IADB with resources being channeled through the Federal Government. The first is the National Program for the Support of State Finance Secretariats (Programa Nacional de Apóio para a Administração Fiscal dos Estados Brasileiros, PNAFE) and the second is the forthcoming National Program for Fiscal Modernization (Programa Nacional de Modernização Fiscal - PROFISCO). The State has been using the funds from the PNAFE program, available to all states, to promote improvements in the State tax administration. In the same line, the PROFISCO program will finance technical advisory services and IT systems to support the implementation of the Electronic Invoice (Nota Fiscal Eletrônica) for the collection of the State VAT – ICMS and for general improvements in the State’s financial management systems. It is worth to mention that there is a strong complementarity between the Bank’s proposed DPL and the PROFISCO program financed by IADB.
136. Even though the proposed loan is to a sub-national government rather than the Federal Government, the team has maintained a regular policy dialogue with the IMF. This dialogue has been focused has been maintained on fiscal issues and on the role played by the Bank’s sub-national lending program including the proposed operation in strengthening the institutional framework for fiscal discipline at the sub-national level33.
33 As discussed in the Staff report for the 2009 IMF Article IV Consultation, Brazil fiscal responsibility legislation, together with its inflation targeting and flexible exchange rate regimes have built a strong macroeconomic
40
137. The preparation of the proposed operation also entailed strong collaboration with national development partners. The most important has been the Federal Government of Brazil who defined the improvement of Alagoas social and economic conditions as one of its priorities. In the last four years Alagoas has received strong support from the Federal Government. The support consists in sizeable capital transfers to the GoA, large federal investments in the state under the Program of Growth Acceleration (Programa de Aceleração do Crescimento – PAC) and technical assistance support. The technical assistance activities provided by the Federal Government are complementary to the reform program supported by the proposed operation. For example, the Federal Government is supporting the State Secretary of Planning to improve planning and budgeting systems. This is fully consistent with the main objective of the loan’s component on Strengthening Public Sector Management which is to improve the GoA’s capacity to manage budget resources and take full advantage of federal transfers to the capital budget. Federal technical assistance activities also encompass support to the State Secretariat of Education for the development of evaluation systems to improve the performance of Alagoas public schools. Last but not the least, the federal social programs of direct cash transfers such as Bolsa Familia, Beneficio de Prestação Continuada and the Rural Pension benefit a huge proportion of the state population. They have been critical factors contributing to the recent poverty reduction trend observed in the state (see chapters II and VI for more detailed reference).
138. The private sector has also assisted the government in the design and implementation of the reform program supported by the proposed operation through the Brazil Competitive Movement (Movimento Brasil Competitivo- MBC), a private sector organization dedicated to reducing Brazil’s tax burden by improving the efficiency in public spending. The MBC has drawn on private-sector funding to hire the well recognized National Institute of Managerial Development (Instituto Nacional de Desenvolvimento Gerencial-INDG)34 to advise the government of Alagoas on cutting-edge techniques for data base integration targeting tax evasion (matrix management of State tax revenue collection). During loan preparation, the INDG has also been an important source of information for the Bank regarding the Government’s progress in improving institutional efficiency at the Secretariat of Finance and Planning. As part of loan preparation the Bank organized a workshop on project management with INDG for the managers of priority projects. MBC is expected to finance subsequent rounds of the workshop targeting a broader audience of public servants from the Planning and line secretariats responsible for carrying out other government projects.
RELATIONSHIP TO OTHER BANK OPERATIONS
139. The Bank’s interaction with Alagoas has been limited over recent years owing to Alagoas’s borrowing constraints. The last direct investment lending operation with the State was prepared in 1993 amounting to US$38 million. Alagoas fully repaid it in December 2008. This
framework. Thus Brazil is in a favorable position to weather the effects of the financial turmoil. This is illustrated by the fact that after a sharp decline in activity in the last quarter of 2008 and the first quarter of 2009, the Brazilian economy appears headed toward a gradual recovery 34 Sponsored by the MBC, the INDG has been selling advisory services directed to improve the efficiency of governmental processes to the states of Minas Gerais, Rio Grande do Sul, and the municipality of Rio de Janeiro among others. A recent Financial Times article (July 6, 2009) highlighted the successful experience of private sector support for public sector reforms.
41
investment loan, “Brazil – State Highway Management (Loan No 3547-BR),” supported highway maintenance and rehabilitation programs in several states. The objective of the project was to reduce the deterioration of the states’ road networks and to improve their condition. Because of the substantial reduction in the scope of the rehabilitation component in Alagoas due to scarce counterpart funds, the project was only able to prevent the road network from deteriorating further. Improvements were marginal. While the overall rating of the project was satisfactory, in the case of Alagoas its sustainability was questioned owing to limited technical capacity and political interference in the decision making process.
140. In 2002, Alagoas non-compliance with the FRL caused the cancelation of a Rural Poverty Reduction Project – Alagoas (P074803) loan. This project was part of a series of rural poverty alleviation programs that benefited the northeastern states. Alagoas was the only State in the region that did not receive such a loan.
141. While the Bank’s engagement in Alagoas was limited, the proposed DPL has benefited considerably from recent similar Bank operations with other state governments. In fact, the DPLs to the states of Minas Gerais (Partnership for Development) in 2006 and Rio Grande do Sul (Fiscal Sustainability for Growth) in 2008 provided strong foundations for this operation in two ways. First, during the preparation and supervision of both operations the Bank acquired substantial experience in sub-national fiscal and public sector management reforms that are similar to those being implemented in Alagoas. Second, the success of both operations enhanced the Bank’s reputation and led the Federal Government and the State Government of Alagoas to request a similar operation.
142. In addition, other Bank projects in the less developed states of the Northeast and North regions provide valuable experience regarding the challenges associated with supporting economic reforms in precarious institutional environments with severe technical and implementation capacity constraints. At the same time, the Bank’s successful interventions in the Northeast, especially in Ceará, nourish the perception that a more efficient public sector is both necessary and possible in less developed states and thus create a positive environment for the implementation of the GoA’s reform program.
143. Finally it is worth mentioning that several federal projects financed by the Bank have directly impacted Alagoas. In the 1990s, the first phase of the Rural Poverty Reduction Projects consisted in an umbrella loan to the Federal Government that benefited the nine northeastern states. The second phase of this project consisted in direct loans to the northeastern states in which Alagoas did not participate due to its difficult financial situation. Existing investment lending operations approved since 2004 that have benefitted Alagoas include: Family Health, Aids and STD Control, VIGISUS (health), Fundescola III (education), Bolsa Familia Program, PARSEP (social security), and Proagua (water resource management). Undoubtedly, Bolsa Familia Program is the most important of these, due to the very large number of beneficiaries among Alagoas’ population.
LESSONS LEARNED
144. The design of the proposed operation reflects several lessons from the recent experience with state DPLs in Brazil. Most important is the need for client ownership of the reform program. The State’s commitment to reform was explored in the initial identification mission and
42
has clearly been in evidence since. As soon as it took office, the Alagoas government authorities prepared an emergency fiscal adjustment package to stop the growth in the State’s deficits and initiate a strong fiscal turnaround. As part of this package, the Government immediately stepped up enforcement of the State’s principal tax (a VAT), reduced discretionary operating costs, made sharp cuts in investment expenditures and negotiated a rollback in the wage increases granted by the previous government.
145. The project’s time frame and disbursement mechanism have been designed to reduce the risk of wavering political commitment in the future. The project would disburse entirely within the term of the current administration. It focuses on procedural and administrative reforms that will be self-sustaining. As elaborated in the section on risks, it would disburse in two tranches. A tranched, rather than programmatic approach, was chosen in order to prompt the Bank and the Government to agree on conditions for both tranche disbursements at the outset, rather than leaving longer term reforms for a subsequent operation.
146. A second important lesson is the need for close dialogue with the State during the project preparation. The team has been providing technical advice for the design and implementation of reform measures. The fiscal targets for reform have been jointly developed by the State and Federal administrations. The team provided technical support to the Secretary of Public Management (SEGEP) on the preparation of the census of State personnel (which has now been completed) and the follow-on audit of personnel (which is now ongoing and expected to be completed in November). Bank dialogue has also helped the Government prepare a wide-ranging reform in the pension system for State employees, to design an action plan for procurement reform. During project preparation, the Bank also supported the State Secretariat of Planning (SEPLAN) in the enhancement of planning, budgeting and expenditure execution cycles. To that end, the Bank organized workshops on public investment systems, cost-benefit analysis and project management for the staff of SEPLAN. In addition, the Bank team organized visits for the staff of the Planning Secretariat to the states of Minas Gerais and Rio Grande do Sul, so as to learn their experiences in the reforms of investment management systems.
147. The third lesson is the need for realism in the definition of reform targets. The technical capacity of the Alagoas government is particularly weak and the political constraints on reform, particularly formidable. The targets for reform have been designed to take these constraints into account. Efforts to reduce the wage bill, for example, focus on correcting errors in personnel records, rather than wage reductions. By the same token, a variety of arrangements for technical support would be incorporated in the project. These include technical assistance for budget formulation to be provided by the Federal budget secretariat, site visits to the states of Minas Gerais and Rio Grande do Sul (where similar reforms have been recently implemented) and access to privately provided technical assistance.
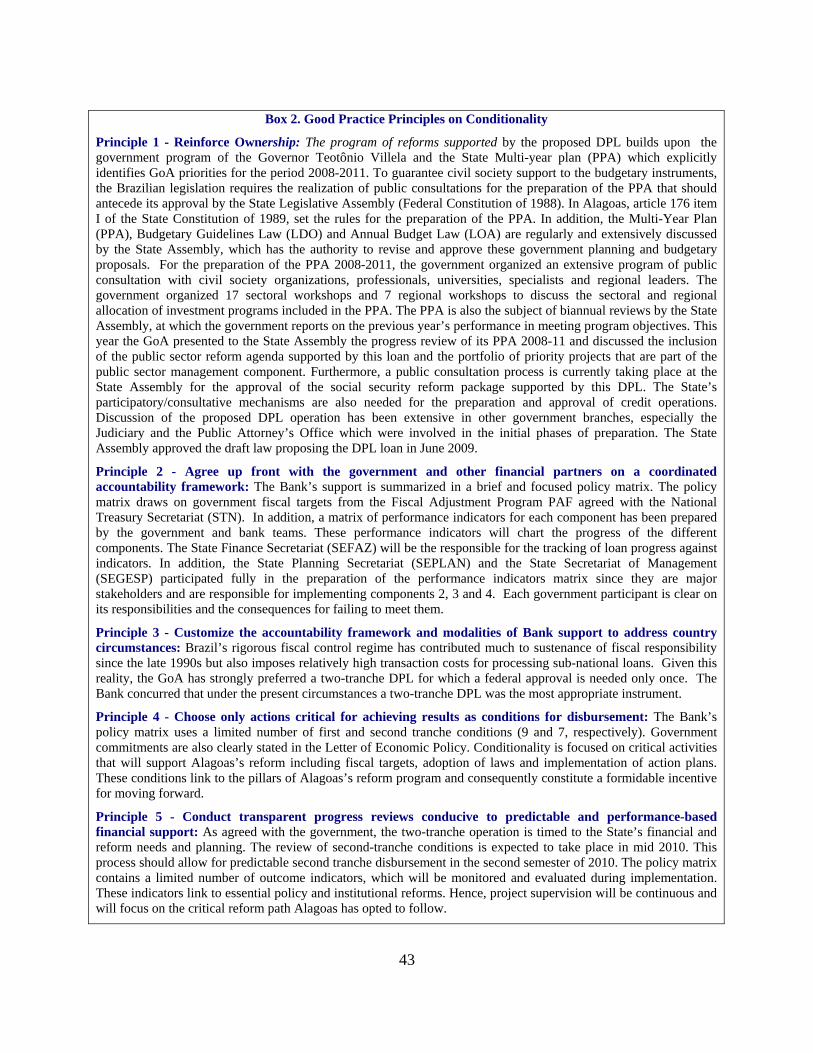
43
Box 2. Good Practice Principles on Conditionality
Principle 1 - Reinforce Ownership: The program of reforms supported by the proposed DPL builds upon the government program of the Governor Teotônio Villela and the State Multi-year plan (PPA) which explicitly identifies GoA priorities for the period 2008-2011. To guarantee civil society support to the budgetary instruments, the Brazilian legislation requires the realization of public consultations for the preparation of the PPA that should antecede its approval by the State Legislative Assembly (Federal Constitution of 1988). In Alagoas, article 176 item I of the State Constitution of 1989, set the rules for the preparation of the PPA. In addition, the Multi-Year Plan (PPA), Budgetary Guidelines Law (LDO) and Annual Budget Law (LOA) are regularly and extensively discussed by the State Assembly, which has the authority to revise and approve these government planning and budgetary proposals. For the preparation of the PPA 2008-2011, the government organized an extensive program of public consultation with civil society organizations, professionals, universities, specialists and regional leaders. The government organized 17 sectoral workshops and 7 regional workshops to discuss the sectoral and regional allocation of investment programs included in the PPA. The PPA is also the subject of biannual reviews by the State Assembly, at which the government reports on the previous year’s performance in meeting program objectives. This year the GoA presented to the State Assembly the progress review of its PPA 2008-11 and discussed the inclusion of the public sector reform agenda supported by this loan and the portfolio of priority projects that are part of the public sector management component. Furthermore, a public consultation process is currently taking place at the State Assembly for the approval of the social security reform package supported by this DPL. The State’s participatory/consultative mechanisms are also needed for the preparation and approval of credit operations. Discussion of the proposed DPL operation has been extensive in other government branches, especially the Judiciary and the Public Attorney’s Office which were involved in the initial phases of preparation. The State Assembly approved the draft law proposing the DPL loan in June 2009.
Principle 2 - Agree up front with the government and other financial partners on a coordinated accountability framework: The Bank’s support is summarized in a brief and focused policy matrix. The policy matrix draws on government fiscal targets from the Fiscal Adjustment Program PAF agreed with the National Treasury Secretariat (STN). In addition, a matrix of performance indicators for each component has been prepared by the government and bank teams. These performance indicators will chart the progress of the different components. The State Finance Secretariat (SEFAZ) will be the responsible for the tracking of loan progress against indicators. In addition, the State Planning Secretariat (SEPLAN) and the State Secretariat of Management (SEGESP) participated fully in the preparation of the performance indicators matrix since they are major stakeholders and are responsible for implementing components 2, 3 and 4. Each government participant is clear on its responsibilities and the consequences for failing to meet them.
Principle 3 - Customize the accountability framework and modalities of Bank support to address country circumstances: Brazil’s rigorous fiscal control regime has contributed much to sustenance of fiscal responsibility since the late 1990s but also imposes relatively high transaction costs for processing sub-national loans. Given this reality, the GoA has strongly preferred a two-tranche DPL for which a federal approval is needed only once. The Bank concurred that under the present circumstances a two-tranche DPL was the most appropriate instrument.
Principle 4 - Choose only actions critical for achieving results as conditions for disbursement: The Bank’s policy matrix uses a limited number of first and second tranche conditions (9 and 7, respectively). Government commitments are also clearly stated in the Letter of Economic Policy. Conditionality is focused on critical activities that will support Alagoas’s reform including fiscal targets, adoption of laws and implementation of action plans. These conditions link to the pillars of Alagoas’s reform program and consequently constitute a formidable incentive for moving forward.
Principle 5 - Conduct transparent progress reviews conducive to predictable and performance-based financial support: As agreed with the government, the two-tranche operation is timed to the State’s financial and reform needs and planning. The review of second-tranche conditions is expected to take place in mid 2010. This process should allow for predictable second tranche disbursement in the second semester of 2010. The policy matrix contains a limited number of outcome indicators, which will be monitored and evaluated during implementation. These indicators link to essential policy and institutional reforms. Hence, project supervision will be continuous and will focus on the critical reform path Alagoas has opted to follow.

44
148. Finally, the Bank’s experience with state DPLs has demonstrated the importance of coordination with the Federal Government. The Alagoas project was initiated with the concurrence of the STN. The team regularly briefed STN during the course of project preparation and would continue to do so during project supervision.
ANALYTICAL UNDERPINNINGS
149. The proposed operation builds on a number of reports produced by the Bank task team. GoA authorities of the secretariats of Finance (SEFAZ), Planning (SEPLAN), Public Management (SEGESP), Agency for Modernization of Process Management (AMGESP) and the AL Social Security Entity (AL-Previdência) provided valuable information for the preparation of this operation. The Bank team diagnostic studies include:
1. The Economy of Alagoas: Historical Trends and Recent Performance (August, 2009)
2. Alagoas: Fiscal Sustainability Analysis and Impacts of the World Bank Program (July, 2009)
3. Civil Service in Alagoas: Poor Performer and Costly (June, 2009)
4. Diagnosis of the Social Security System of Alagoas and Impact of Proposed Reforms (June, 2009)
5. Adjustment of Personnel Expenditures in Alagoas: Options in the Short Run (June, 2009)
6. Alagoas: Diagnosis of Budgetary and Financial Management (July, 2009)
7. Strenghtening Public Sector Management, Procurement and Investment Systems in GoA (June, 2009)
8. Assessment of Debt Restructuring Options for Alagoas (November, 2008)
150. In addition to the pieces above, the Bank has produced recently a report entitled, “Topics in Fiscal Federalism” (November, 2008) that describes the existing system of controls of sub-national governments’ and highlights its achievements and limitations. This study provided background material for the assessment of the State debt profile and options for its restructuring.
151. Finally, the ESW report entitled “Brazil: Improving Fiscal Conditions for Growth” (April 2007) addresses important policy issues relating to budget rigidity and expenditure management that contributed to the assessment of fiscal and public sector management challenges faced by the GoA.
V. THE PROPOSED OPERATION
OPERATION DESCRIPTION
152. The proposed Development Policy Loan (DPL) aims at supporting the government’s overall objective of economic development with social welfare. In particular, the operation is supporting the fiscal adjustment and public management renewal axis as the Bank considers that the consolidation of fiscal adjustment and the enhancement of public sector management are necessary conditions to improve the difficult Alagoas’s socioeconomic conditions. The operation comprises four key components: fiscal adjustment, human resource management, social security reform and public sector management reform. The selection of the four key DPL components

45
responds to the government and Bank team’s shared assessment on their relevance to the government’s development objectives, feasibility and the value added that the Bank can bring to the GoA reform agenda.
153. The four DPL components are described in detail below and in Annex 3, which contains the operation policy matrix. The components are:
• Consolidating the Fiscal Adjustment and Creating Fiscal Space for Investment
• Improving Human Resource Management
• Reducing State Social Security Deficits
• Strengthening Public Sector Management
Figure 15: AL: Fiscal and Public Sector Reforms – DPL Program
154. These four components are intended to restore fiscal sustainability, improve the management of State human resources, reduce social security deficits and improve public sector efficiency. They are fully consistent with the CPS objectives of strengthening macroeconomic fundamentals and public sector management. This operation is one of a number of sub-national DPLs and SWAps designed to reinforce public sector management as an integral part of the
Enhance the GOA’s Capacity to
Promote Economic Development and
Social Welfare

46
Bank’s public sector governance strategy in Brazil35.The proposed operation is a two-tranche Development Policy Loan totaling US$195.450 million. The primary reason for choosing a single Bank operation, instead of two or more programmatic loans, is the considerable transaction costs and delays involved in processing sub national loans in Brazil. The complex and strict system of fiscal control of sub-national governments’ finances makes it very difficult to process sequential operations. Each loan would have to go through a time consuming process of multiple reviews and approvals by Federal Government agencies, a process that could take months or even years.
35 Bank support for public sector management in Brazil’s sub-national governments includes the states of Minas Gerais (Partnership for Development I (DPL) and II (SWAp), Rio Grande do Sul (Fiscal Sustainability for Growth (DPL) and Ceara (Multi-sector SWAps I and II).
Box 3. Alagoas: Fiscal and Public Sector Reforms DPL
Prior Actions for First Tranche Disbursement
Consolidating Fiscal Adjustment
• Prior Action 1: Adoption of a system aimed at achieving GoA’s revenue collection targets through the establishment of an integrated data base (Gestão Matricial da Receita - GMR) to facilitate the identification of tax evasion and the establishment of a remuneration schedule for the staff of the Secretariat of Finance (SEFAZ) linked to specific tax collection targets.
• Prior Action 2: Introduction of a series of reforms aimed at modernizing the Borrower’s public procurement system, including the implementation of an electronic price registration system for the purchasing of 635 items during 2008 and the establishment of time limits to complete each procedure under said system.
Improving Human Resources Management
• Prior Action 3: The completion of the Census of the civil service staff and the carrying out of remedial measures, including the elimination of about 450 staff from the registry of active public servants.
• Prior Action 4: Launching the audit of the state payroll including compensation for active employees and pensioners and survivors benefits which includes the contract with the auditing firm, the approval of its working plan and first progress report confirming the conclusion of the Audit first phase.
Reducing the State Social Security Deficits
• Prior Action 5: Approval by the State Assembly of the Law 7114/2009 establishing the Single Administrator (Gestor Único) for the Government of Alagoas’s (RPPS) pension system and the restructuring of the State Social Security System directed to a gradual transition to a fully funded system, through the segmentation of participants in said system into different beneficiary groups and the establishment of corresponding funding mechanisms, including : (i) a fully-funded system (Fundo Previdenciário) for the civil service staff contracted after December 31. 2006); (ii) a pay as you go funding mechanism (Fundo Financeiro) for the civil service staff contracted before December 31, 2006; and (iii) a pay as you go funding mechanism (Fundo dos Militares) for the military staff.
Strengthening Public Sector Management
• Prior Action 6: Approval of an action plan detailing the measures required for the improvement of the Borrower’s capabilities for budget formulation and financial execution, including the establishment of a task force (Grupo Gestor) responsible for the implementation of the action plan.
• Prior Action 7: Establishment and staffing of the Project Management Office at the Secretary of Planning (SEPLAN) responsible for the definition of rules governing the execution of the portfolio of priority projects and for their and their monitoring.
• Prior Action 8: Approval by the State Assembly of an amendment to the Multi-Year Plan 2008-11, including the State priority programs “Strengthening of Public Management” and “Strengthening of Planning” with a budget allocation of R$7.8 million and R$7.2 million, respectively.

47
155. A two-tranche DPL is also congruent with the State authorities’ interest in drawing on the Bank’s advice in program implementation. Hence, the agreements made under the loan are viewed as important signals of their commitment to carry out the proposed reforms. Finally, the two-tranche design reinforces the continuity of the government reform efforts, something a single tranche DPL may not be able to do as effectively. Indeed, the second tranche conditions are follow-up actions of government prior actions to be completed by loan signature. Accordingly, a two-tranche DPL provides superior incentives for completing, consolidating and sustaining the reform agenda launched by the current administration.
Box 4. Alagoas: Fiscal and Public Sector Reform DPL
Second Tranche-release Conditions
The government has agreed on the following actions as conditions for releasing the second tranche:
Consolidating Fiscal Adjustment
• Condition 1: Maintenance of good fiscal status under the Brazil’s Fiscal Responsibility Law.
Improving Human Resources Management
• Condition 2: Completion of the payroll audit and implementation of remedial legal, administrative and accounting measures.
• Condition 3: Crosschecking of the information on the social security system with the National Registry of Obits (SISOBI) to identify deceased beneficiaries that are still receiving pensions and with National Registry of Social Security System Participants (SIPREV) and implementation of remedial legal, administrative and accounting measures.
Reducing the State Social Security Deficits
• Condition 4: Application of federal social security legislation including: (a) public sector entities should pay 100 percent of survivors benefits up to the RGPS ceiling plus 70 percent of the value that exceed this ceiling (Art. 40.7.1 of the Constitutional Amendment 41); (b) public entities should calculate pensions using the average of the 180 previous salaries before retirement and not anymore the exit salary (Art. 40.3 of the Constitutional Amendment 41); and (c) public entities need to use specific social security exemptions legislations to be applied to pensioners and survivors contributions in excess to the RGPS ceiling and not the legislation used by the income tax legislation (Art. 40.21 of the Constitutional Amendment 41).
• Condition 5: Adoption of administrative, legal and regulatory instruments required to fully implement the provisions of the Social Security Law, including: (i) the issuance of the statutes of the Single Administrator, the staffing of the governing bodies and appointment of officials and key technical staff of the Single Administrator, the approval of its financing plan; (ii) the segregation of the three funding and the (iii) the capitalization of the funding of an amount of at least R$122.5 million in 2010.
• Prior Action 6: Completion of all legal, technical and administrative conditions required for the issuance of the CRP issued by the Social Security Secretariat at the Ministry of Social Security.
Strengthening Public Sector Management
• Condition 7: Satisfactory implementation of the Action Plan to improve planning, budgetary, financial management and internal control systems. The criteria for satisfactory implementation would be the implementation of at least 5 out of the 9 actions included in the Action Plan.
• Condition 8: Satisfactory implementation of the State priority programs “Strengthening of Public Management” and “Strengthening Planning”. The criteria for satisfactory implementation would be the government expenditure of at least R$5 million committed expenditures (or 30 percent of budget allocations) in these programs.
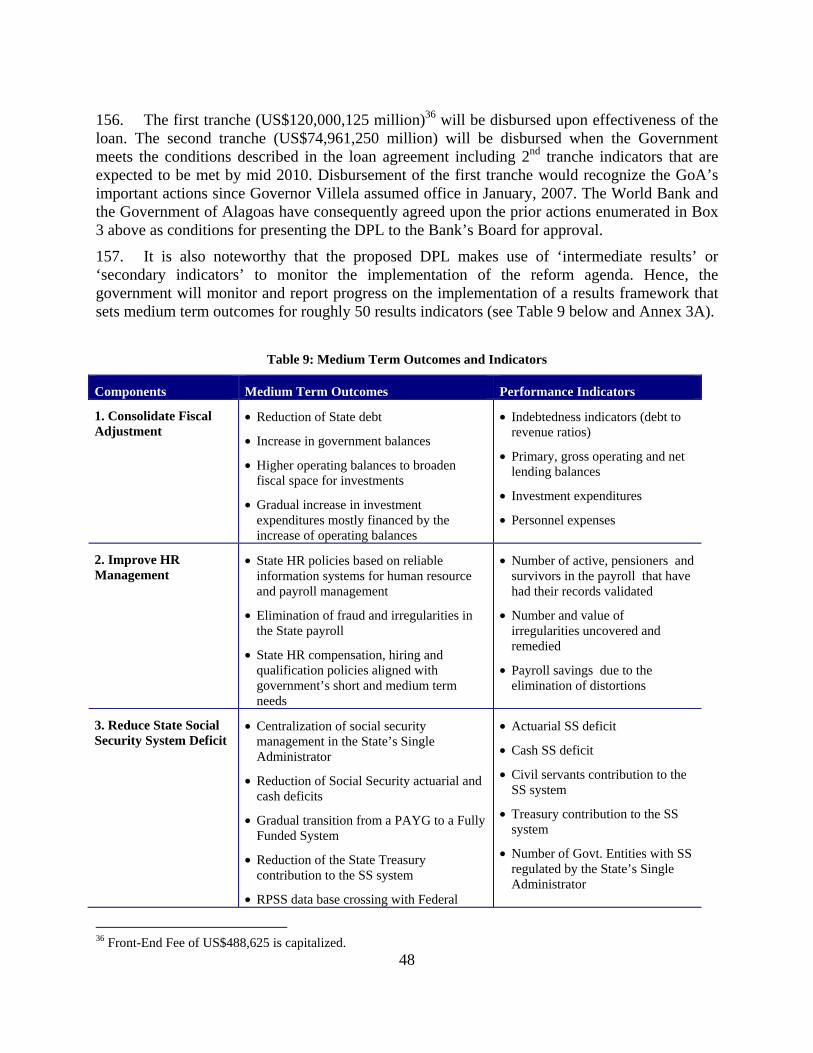
48
156. The first tranche (US$120,000,125 million)36 will be disbursed upon effectiveness of the loan. The second tranche (US$74,961,250 million) will be disbursed when the Government meets the conditions described in the loan agreement including 2nd tranche indicators that are expected to be met by mid 2010. Disbursement of the first tranche would recognize the GoA’s important actions since Governor Villela assumed office in January, 2007. The World Bank and the Government of Alagoas have consequently agreed upon the prior actions enumerated in Box 3 above as conditions for presenting the DPL to the Bank’s Board for approval.
157. It is also noteworthy that the proposed DPL makes use of ‘intermediate results’ or ‘secondary indicators’ to monitor the implementation of the reform agenda. Hence, the government will monitor and report progress on the implementation of a results framework that sets medium term outcomes for roughly 50 results indicators (see Table 9 below and Annex 3A).
Table 9: Medium Term Outcomes and Indicators
Components Medium Term Outcomes Performance Indicators
1. Consolidate Fiscal Adjustment
• Reduction of State debt
• Increase in government balances
• Higher operating balances to broaden fiscal space for investments
• Gradual increase in investment expenditures mostly financed by the increase of operating balances
• Indebtedness indicators (debt to revenue ratios)
• Primary, gross operating and net lending balances
• Investment expenditures
• Personnel expenses
2. Improve HR Management
• State HR policies based on reliable information systems for human resource and payroll management
• Elimination of fraud and irregularities in the State payroll
• State HR compensation, hiring and qualification policies aligned with government’s short and medium term needs
• Number of active, pensioners and survivors in the payroll that have had their records validated
• Number and value of irregularities uncovered and remedied
• Payroll savings due to the elimination of distortions
3. Reduce State Social Security System Deficit
• Centralization of social security management in the State’s Single Administrator
• Reduction of Social Security actuarial and cash deficits
• Gradual transition from a PAYG to a Fully Funded System
• Reduction of the State Treasury contribution to the SS system
• RPSS data base crossing with Federal
• Actuarial SS deficit
• Cash SS deficit
• Civil servants contribution to the SS system
• Treasury contribution to the SS system
• Number of Govt. Entities with SS regulated by the State’s Single Administrator
36 Front-End Fee of US$488,625 is capitalized.

49
Components Medium Term Outcomes Performance Indicators SISOB and SIPREV systems to identify and eliminate irregularities • Savings generated by
crosschecking with federal data bases
4. Strengthen Public Sector Management
• Better integration between planning, budgeting and financial management
• Improved predictability of budget
• Enhancement of planning and budgeting capacities at the sector secretariats
• Increased focus of government programs / reduce dispersion of government. Resources
• Scores on Planning, Budgeting and Financial Execution Assessments
• Rate of execution of Priority Programs
158. In addition to its expected positive effects, the proposed operation would have impacts at the state and national levels in other important ways. At the state level, the two tranches of the operation would be relieving serious short-term liquidity constraints and supporting the reform agenda.
159. Also at the state level, knowledge transfer is another important benefit. Hence, during project implementation the Bank will advise the government on technical aspects of policy design such as social security, human resource management and improvements in the State planning-budgeting-execution cycle drawing upon results-based management tools.
160. The proposed operation would also provide benefits at the national level. First, it will reinforce the importance and feasibility of addressing sub-national fiscal discipline with an appropriate institutional framework. The demonstration effect would be especially instructive in Alagoas where public finances have been consistently precarious. Second, it will demonstrate that a turnaround in fiscal, economic and social conditions is possible even in a previously poorly performing and poorly managed State.
POLICY REFORM AREAS
161. The proposed operation would support essential policy reforms and institutional strengthening actions in ten areas within four broad components of the government program: fiscal adjustment, human resource management, social security and public sector modernization. These policy reforms are described in detail below.
Component 1: Consolidating Fiscal Adjustment and Creating Fiscal Space for Investment
162. This component comprises government actions directed at:
• guaranteeing the financial sustainability of Alagoas;
• reinforcing the decreasing path of State indebtedness;

50
• complying with the federal fiscal discipline framework; and
• expanding fiscal space for investments.
163. As mentioned in Section III, since 2007, the GoA has obtained robust fiscal balances and reduced consistently its indebtedness. Furthermore, for the first time since the enactment of the FRL in 2000, the State is in compliance with the indebtedness ceiling defined in the FRL. In addition the GoA has managed to meet the targets for primary balances, debt, own tax revenue collection and personnel expenses agreed in the PAF 2007-09 in 2007 and again in 2008.
164. The Debt Sustainability Assessment (DSA) performed by the Bank team indicates the need to deepen the strong fiscal discipline exhibited by the GoA since 2009. In addition, the use of the Government Financial Statistics (GFS) framework suggests that the underlying adjustment relied upon the reduction of investment expenditures which are also highly dependent on federal capital transfers. Reducing investments will invariably slow growth and should not be relied upon unless there is no other recourse available. Furthermore, Alagoas and other states are confronting a reduction in federal transfers owing to the current economic recession. Therefore, Alagoas will need to increase its net operating balances to finance with its own sources the expansion of investments and reduce its dependence on federal capital transfers.
165. Consistent with this assessment, the proposed operation supports the increase of government fiscal balances, the reduction of indebtedness, improvements in tax collection and the control of current expenses. Therefore, the accomplishment of the targets for primary balance, financial debt to net real revenue ratio, own revenue collection and personnel expenditures to net current revenue ratio in 2007 and 2008 defined in the Program of Fiscal Adjustment (PAF) agreed with the National Treasury Secretariat for the period 2007-09 represent the standard DPL requirement that consists in the maintenance of an appropriate macroeconomic and expenditure program and fiscal arrangements with the Guarantor. In addition, second tranche conditions reinforce macroeconomic and expenditure appropriateness by requiring achieving the targets for the primary surplus, financial debt to net real revenue ratio, own revenue collection and personnel expenditures to net current revenue ratio in 2009 defined in the Program of Fiscal Adjustment (PAF) agreed with the National Treasury Secretariat (STN) for the period 2008-10.
166. Furthermore, the deepening of the fiscal adjustment and the recovery of State capacity to finance investments with its own resources depends on the ability of the GoA to maintain a good tax revenue performance through the strengthening of revenue collection efficiency and tightening control of current expenditures. On the revenue side the program supports, in addition to the achievement of the target for own revenue collection in 2007 and 2008 defined in the Program of Fiscal Adjustment (PAF) agreed with the National Treasury Secretariat (STN) for the period 2007-09, the introduction of an IT integrated data base system (Gerenciamento Matricial de Receitas – GRM) to reduce tax evasion and the establishment of a remuneration schedule for the staff of the Secretariat of Finance (SEFAZ) linked to specific tax collection targets37.
167. On the expenditure side, the program supports the control of personnel expenditures -the single most important disequilibrium factor - and improvements in the State procurement system
37 The GoA submitted to the Bank a communication (Ofício) GSEF No. 519/2009 dated on October 7th describing the adoption of the GMR and the Laws No 6951 of July 2008 and No 7001 Of December 2008 establishing the targets and parameters for the remuneration of SEFAZ staff.

51
directed at reducing irregularities and generating savings in the purchase of goods and services38. Apart from the achievement of the target for personnel expenditures to net current revenue in 2007 and 2008 defined in the Program of Fiscal Adjustment (PAF), prior actions completed in this area for the first tranche disbursement would consist in the introduction of a series of reforms aimed at modernizing the Borrower’s public procurement system, including the implementation of an electronic price registration system for the purchasing of 635 items during 2008 and the establishment of time limits to complete each procedure under said system.
Table 10: Consolidating the Fiscal Adjustment and Creating Fiscal Space for Investment39
Area/ Objectives Challenges Government Actions Completed (October 09)
Second Tranche Actions (June 2010)
1.Fiscal Balances
Achieve long run fiscal sustainability
Create fiscal space for public investments
Maintain compliance with federal fiscal discipline legal framework
Guarantee the generation of positive and robust fiscal balances to maintain declining path of indebtedness Increase operating balances to finance the expansion of investment
Achievement of targets for primary balances, financial debt to net real revenue ratio, own revenue collection and personnel expenditures to net current revenue ratio in 2007 and 2008 defined in the Program of Fiscal Adjustment (PAF) agreed with the National Treasury Secretariat (STN) for the period 2007- 2009.
Increased net operating balances in 2007 and 2008.
Achievement of targets for primary balances, financial debt to net real revenue ratio, own revenue collection and personnel expenditures to net current revenue ratio in 2009 defined in the Program of Fiscal Adjustment (PAF) agreed with the National Treasury Secretariat (STN) for the period 2008- 2010. Maintenance of good fiscal status under the Brazil’s Fiscal Responsibility Law. Net operating balance of at least R$600 million.
2.Revenue
Improve tax revenue performance to support fiscal adjustment
Increase the fiscal space for investment through the increase in own resources
Modernization of State tax collection methods and systems administration
Reduction of tax evasion
Efficiency in the recovery of tax in arrears
Adoption of a system aimed at achieving GoA’s revenue collection targets through the establishment of an integrated data base (Gestão Matricial da Receita - GMR) to facilitate the identification of tax evasion and the establishment of a remuneration schedule for the staff at the Secretariat of Finance (SEFAZ) linked to specific tax collection targets.
Maintain system of data base integration and renew the results agreement contract with SEFAZ for 2010.
3.Expenses
Reduce the pressure of personnel and other recurrent
Maintain personnel expenditures below the FRL ceiling
Expand the use of modern procurement
Introduction of a series of reforms aimed at modernizing the Borrower’s public procurement system, including the
Increase to 1,000 in the number of items to be purchased through electronic price registration.
38 It is worth mentioning that specific actions for the control of personnel expenditures are contained in Components 2 (Improving HR Management) and 3 (Reducing the State Social Security Deficits). 39 Prior actions for first tranche disbursement and second tranche conditions are bolded.
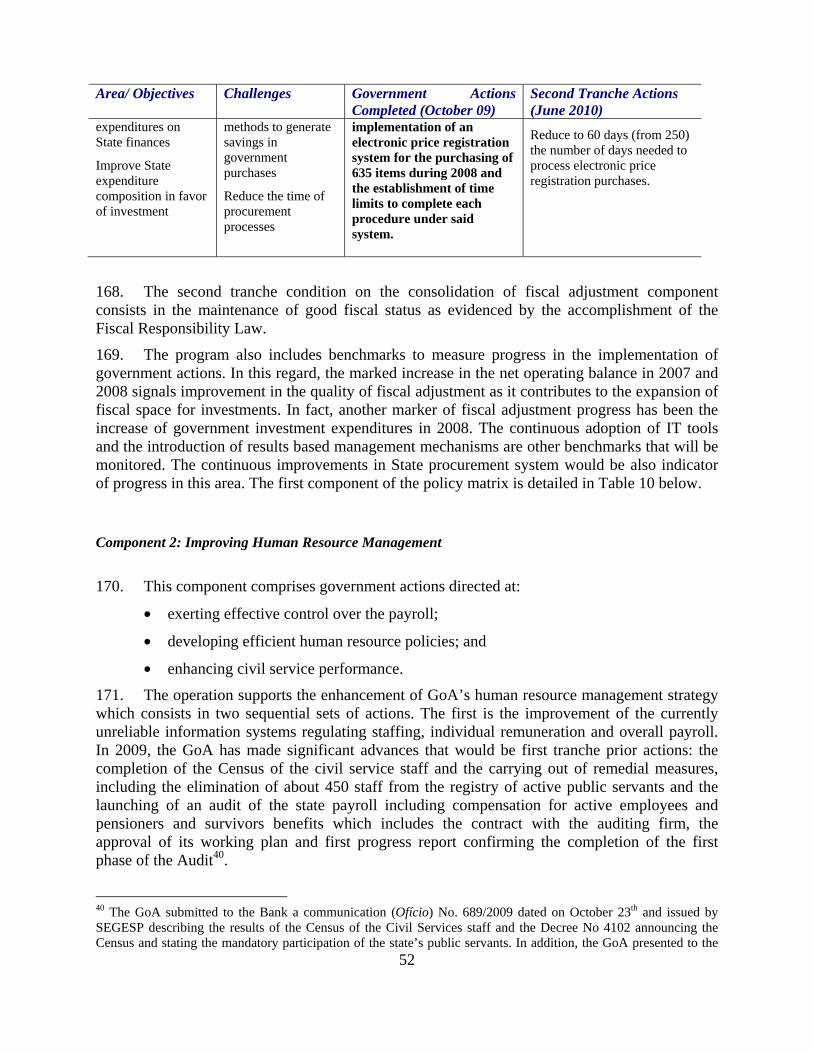
52
Area/ Objectives Challenges Government Actions Completed (October 09)
Second Tranche Actions (June 2010)
expenditures on State finances
Improve State expenditure composition in favor of investment
methods to generate savings in government purchases
Reduce the time of procurement processes
implementation of an electronic price registration system for the purchasing of 635 items during 2008 and the establishment of time limits to complete each procedure under said system.
Reduce to 60 days (from 250) the number of days needed to process electronic price registration purchases.
168. The second tranche condition on the consolidation of fiscal adjustment component consists in the maintenance of good fiscal status as evidenced by the accomplishment of the Fiscal Responsibility Law.
169. The program also includes benchmarks to measure progress in the implementation of government actions. In this regard, the marked increase in the net operating balance in 2007 and 2008 signals improvement in the quality of fiscal adjustment as it contributes to the expansion of fiscal space for investments. In fact, another marker of fiscal adjustment progress has been the increase of government investment expenditures in 2008. The continuous adoption of IT tools and the introduction of results based management mechanisms are other benchmarks that will be monitored. The continuous improvements in State procurement system would be also indicator of progress in this area. The first component of the policy matrix is detailed in Table 10 below.
Component 2: Improving Human Resource Management
170. This component comprises government actions directed at:
• exerting effective control over the payroll;
• developing efficient human resource policies; and
• enhancing civil service performance.
171. The operation supports the enhancement of GoA’s human resource management strategy which consists in two sequential sets of actions. The first is the improvement of the currently unreliable information systems regulating staffing, individual remuneration and overall payroll. In 2009, the GoA has made significant advances that would be first tranche prior actions: the completion of the Census of the civil service staff and the carrying out of remedial measures, including the elimination of about 450 staff from the registry of active public servants and the launching of an audit of the state payroll including compensation for active employees and pensioners and survivors benefits which includes the contract with the auditing firm, the approval of its working plan and first progress report confirming the completion of the first phase of the Audit40.
40 The GoA submitted to the Bank a communication (Ofício) No. 689/2009 dated on October 23th and issued by SEGESP describing the results of the Census of the Civil Services staff and the Decree No 4102 announcing the Census and stating the mandatory participation of the state’s public servants. In addition, the GoA presented to the
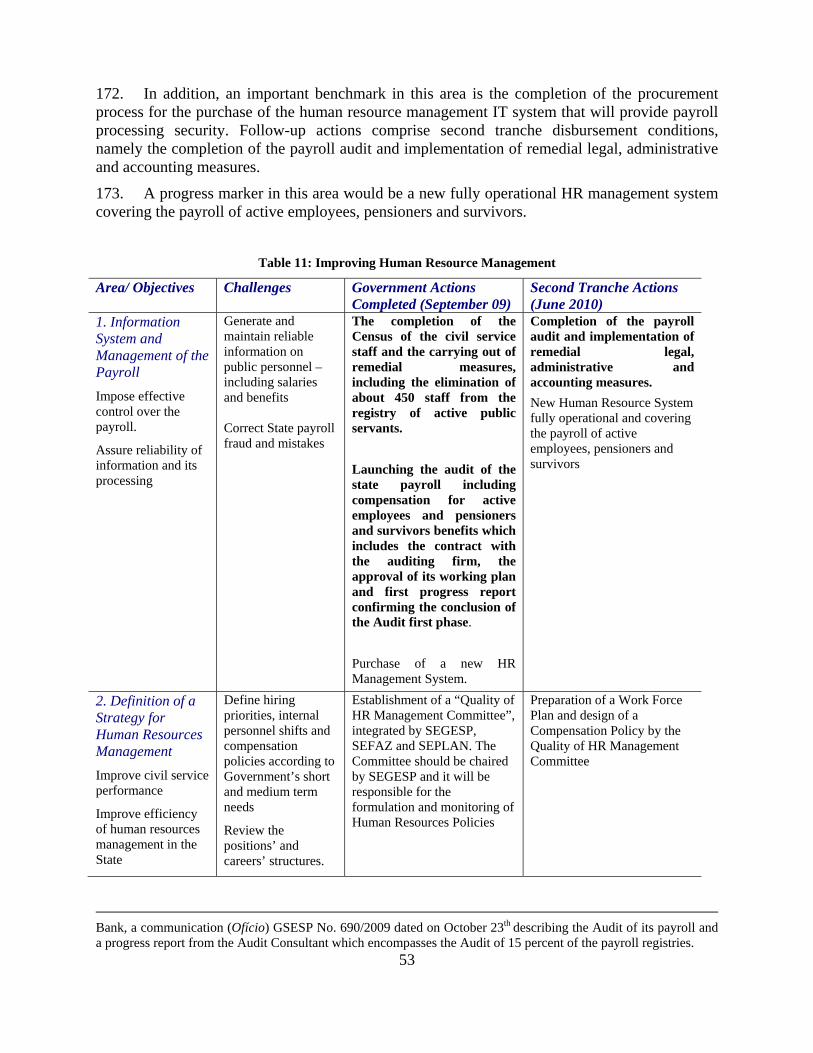
53
172. In addition, an important benchmark in this area is the completion of the procurement process for the purchase of the human resource management IT system that will provide payroll processing security. Follow-up actions comprise second tranche disbursement conditions, namely the completion of the payroll audit and implementation of remedial legal, administrative and accounting measures.
173. A progress marker in this area would be a new fully operational HR management system covering the payroll of active employees, pensioners and survivors.
Table 11: Improving Human Resource Management
Area/ Objectives Challenges Government Actions Completed (September 09)
Second Tranche Actions (June 2010)
1. Information System and Management of the Payroll
Impose effective control over the payroll.
Assure reliability of information and its processing
Generate and maintain reliable information on public personnel –including salaries and benefits Correct State payroll fraud and mistakes
The completion of the Census of the civil service staff and the carrying out of remedial measures, including the elimination of about 450 staff from the registry of active public servants.
Launching the audit of the state payroll including compensation for active employees and pensioners and survivors benefits which includes the contract with the auditing firm, the approval of its working plan and first progress report confirming the conclusion of the Audit first phase.
Purchase of a new HR Management System.
Completion of the payroll audit and implementation of remedial legal, administrative and accounting measures. New Human Resource System fully operational and covering the payroll of active employees, pensioners and survivors
2. Definition of a Strategy for Human Resources Management
Improve civil service performance
Improve efficiency of human resources management in the State
Define hiring priorities, internal personnel shifts and compensation policies according to Government’s short and medium term needs
Review the positions’ and careers’ structures.
Establishment of a “Quality of HR Management Committee”, integrated by SEGESP, SEFAZ and SEPLAN. The Committee should be chaired by SEGESP and it will be responsible for the formulation and monitoring of Human Resources Policies
Preparation of a Work Force Plan and design of a Compensation Policy by the Quality of HR Management Committee
Bank, a communication (Ofício) GSESP No. 690/2009 dated on October 23th describing the Audit of its payroll and a progress report from the Audit Consultant which encompasses the Audit of 15 percent of the payroll registries.

54
174. The Bank also supports a second set of actions to enhance GoA’s capacity to design and implement Human Resource Management policies. The creation of a Quality of HR Management Committee led by the Secretariat of Public Management would be a benchmark indicator of progress on this area. Given the fiscal and budgetary dimensions of HR policies, the secretariats of Finance and Planning will also be part of the Committee which will be responsible for the control of personnel expenditures, and for appraising important HR decisions. These would include establishing new positions, creating new career paths, revising rules governing promotion, and designing capacity building activities for the civil service, among others.
175. The corresponding indicative benchmark for the second tranche disbursement consists in the development of the activities assigned to the Committee such as the preparation of workforce planning, proposals for simplification of HR legislation, revision of career structures, review of compensation policies and the development of training strategies.
Component 3: Reducing the State Social Security Deficits
176. This component comprises government actions directed at:
• improving the managerial control of the State social security system
• reducing the cash and actuarial deficits of the State social security system; and
• reducing the contribution of the State Treasury to the social security system through the gradual transition from a PAYG system to a fully funded system.
177. As described above, the GoA social security system is one of the main sources of disequilibrium of State public finances. In 2008, the deficit of the GoA’s RPPS reached R$430 million or 15 percent of its net current revenues. Projections performed for the preparation of this operation indicate that the RPPS’s financial disequilibrium will be aggravated over time resulting in a significant increase in the financial burden unless steps are taken. This is in large measure due to an expected increase in pensioners and survivors relative to active public servants. Therefore, social security reform comprises an essential pillar of the effort to reduce the State fiscal disequilibrium.
178. The administrative and structural reforms to be supported by this proposed DPL (Table 12) which are prior actions for first tranche disbursement are the approval by the State Assembly of the Law No 7114/2009 establishing the Single Administrator (Gestor Único) for the Government of Alagoas’s (RPPS) pension system and the restructuring of the State Social Security System directed to a gradual transition to a fully funded system, through the segmentation of participants in said system into different beneficiary groups and the establishment of corresponding funding mechanisms, including: (i) a fully-funded system (Fundo Previdênciário) for the civil service staff contracted after December 31. 2006; (ii) a pay as you go funding mechanism (Fundo Financeiro) for the civil service staff contracted before December 31, 2006; and (iii) a pay as you go funding mechanism (Fundo dos Militares) for the military staff (see Table 12)41.
41 The GoA presented to the Bank the draft Law proposal sent to the State Assembly on October 6, 2009 reforming its social security system. The CRP will be obtained with the Federal Government as soon as the Social Security Reform Law is enacted by the State Assembly.
55
179. The second tranche conditions on administrative reforms to the State social security system are the crosschecking of the information on the social security system with the National Registry of Obits (SISOBI) to identify deceased beneficiaries that are still receiving pensions and with National Registry of Social Security System Participants (SIPREV) and implementation of remedial legal, administrative and accounting measures.
180. In addition, the DPL supports the GoA’s parametric reforms directed at reducing the State social security deficit. In particular, the loan is supporting the application of federal social security legislation including the payment of 100 percent of survivors benefits up to the RGPS ceiling plus 70 percent of the value that exceed this ceiling, the calculation of pensions using the average of the 180 previous salaries before retirement and the use specific social security exemptions legislations to be applied to pensioners and survivors contributions in excess to the RGPS ceiling. Potential savings from the adoption of the federal legislation are significant. Figure 16 below shows the potential gains to be obtained in the next 50 years.
181. The second administrative action for the second tranche disbursement is the completion of all legal, technical and administrative conditions required for the issuance of the CRP issued by the Social Security Secretariat at the Ministry of Social Security. The Social Security Ministry issues a pension certification to states and municipalities if they comply with certain rules that reflect sound pension management including, inter alia, adequate legislative frameworks, actuarial analysis and audits. Currently Alagoas does not hold the CRP due to its non-compliance with a number of requirements. For example, even required basic reports are not sent to the Social Security Ministry. Hence, obtaining pension certification by complying with the Federal Government rules is an essential step in demonstrating commitment to pension reform and professionalizing pension management.
182. It is important to mention that the audit of the payroll in the HR component also includes the payroll of pensioners and survivors. Rough estimates by the Secretary of Public Management indicate that potential errors for pensioners and survivors are bigger than what can be found in the payroll for active civil servants. The government has also committed to adopt additional administrative measures to correct data inconsistencies that were found by the Bank team. These are related to irregularities affecting more than 700 old-age retirees and survivor family relationships. These inconsistencies constitute a significant management challenge but the correction of corresponding irregularities and frauds should generate significant savings.
183. The second tranche condition regarding the administrative and structural reform to the State social security system is a follow up action to the approval of the State RRPS which corresponds to adoption of administrative, legal and regulatory instruments required to fully implement the provisions of the Social Security Law, including: (i) the issuance of the statutes of the Single Administrator, the staffing of the governing bodies and appointment of officials and key technical staff of the Single Administrator, the approval of its financing plan; (ii) the segregation of the three funding and the (iii) the capitalization of the funding of an amount of at least R$122.5 million in 2010.
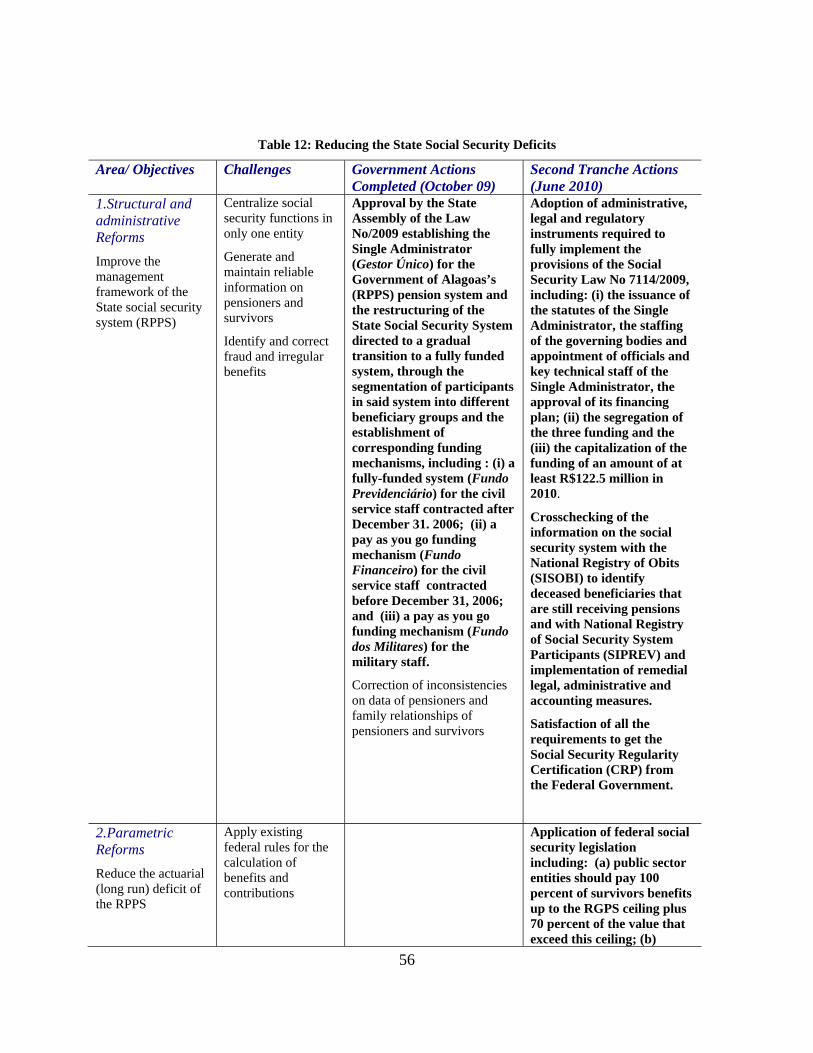
56
Table 12: Reducing the State Social Security Deficits
Area/ Objectives Challenges Government Actions Completed (October 09)
Second Tranche Actions (June 2010)
1.Structural and administrative Reforms
Improve the management framework of the State social security system (RPPS)
Centralize social security functions in only one entity
Generate and maintain reliable information on pensioners and survivors
Identify and correct fraud and irregular benefits
Approval by the State Assembly of the Law No/2009 establishing the Single Administrator (Gestor Único) for the Government of Alagoas’s (RPPS) pension system and the restructuring of the State Social Security System directed to a gradual transition to a fully funded system, through the segmentation of participants in said system into different beneficiary groups and the establishment of corresponding funding mechanisms, including : (i) a fully-funded system (Fundo Previdenciário) for the civil service staff contracted after December 31. 2006; (ii) a pay as you go funding mechanism (Fundo Financeiro) for the civil service staff contracted before December 31, 2006; and (iii) a pay as you go funding mechanism (Fundo dos Militares) for the military staff.
Correction of inconsistencies on data of pensioners and family relationships of pensioners and survivors
Adoption of administrative, legal and regulatory instruments required to fully implement the provisions of the Social Security Law No 7114/2009, including: (i) the issuance of the statutes of the Single Administrator, the staffing of the governing bodies and appointment of officials and key technical staff of the Single Administrator, the approval of its financing plan; (ii) the segregation of the three funding and the (iii) the capitalization of the funding of an amount of at least R$122.5 million in 2010.
Crosschecking of the information on the social security system with the National Registry of Obits (SISOBI) to identify deceased beneficiaries that are still receiving pensions and with National Registry of Social Security System Participants (SIPREV) and implementation of remedial legal, administrative and accounting measures.
Satisfaction of all the requirements to get the Social Security Regularity Certification (CRP) from the Federal Government.
2.Parametric Reforms
Reduce the actuarial (long run) deficit of the RPPS
Apply existing federal rules for the calculation of benefits and contributions
Application of federal social security legislation including: (a) public sector entities should pay 100 percent of survivors benefits up to the RGPS ceiling plus 70 percent of the value that exceed this ceiling; (b)
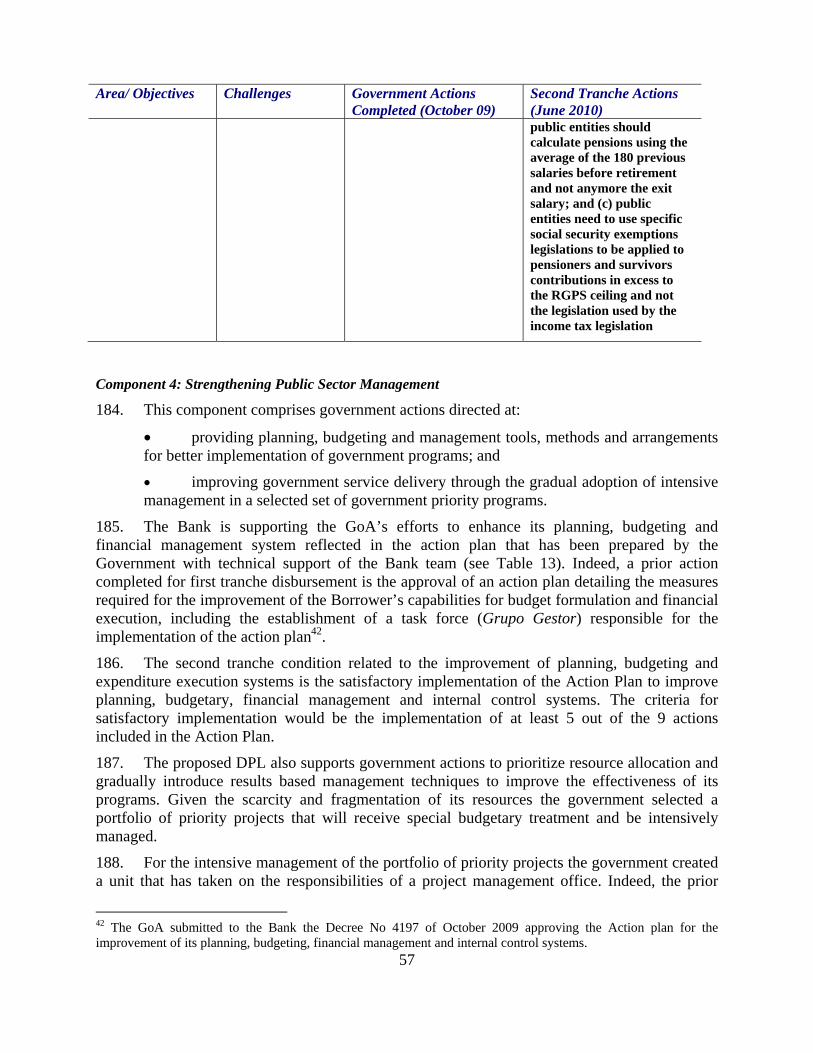
57
Area/ Objectives Challenges Government Actions Completed (October 09)
Second Tranche Actions (June 2010) public entities should calculate pensions using the average of the 180 previous salaries before retirement and not anymore the exit salary; and (c) public entities need to use specific social security exemptions legislations to be applied to pensioners and survivors contributions in excess to the RGPS ceiling and not the legislation used by the income tax legislation
Component 4: Strengthening Public Sector Management
184. This component comprises government actions directed at:
• providing planning, budgeting and management tools, methods and arrangements for better implementation of government programs; and
• improving government service delivery through the gradual adoption of intensive management in a selected set of government priority programs.
185. The Bank is supporting the GoA’s efforts to enhance its planning, budgeting and financial management system reflected in the action plan that has been prepared by the Government with technical support of the Bank team (see Table 13). Indeed, a prior action completed for first tranche disbursement is the approval of an action plan detailing the measures required for the improvement of the Borrower’s capabilities for budget formulation and financial execution, including the establishment of a task force (Grupo Gestor) responsible for the implementation of the action plan42.
186. The second tranche condition related to the improvement of planning, budgeting and expenditure execution systems is the satisfactory implementation of the Action Plan to improve planning, budgetary, financial management and internal control systems. The criteria for satisfactory implementation would be the implementation of at least 5 out of the 9 actions included in the Action Plan.
187. The proposed DPL also supports government actions to prioritize resource allocation and gradually introduce results based management techniques to improve the effectiveness of its programs. Given the scarcity and fragmentation of its resources the government selected a portfolio of priority projects that will receive special budgetary treatment and be intensively managed.
188. For the intensive management of the portfolio of priority projects the government created a unit that has taken on the responsibilities of a project management office. Indeed, the prior
42 The GoA submitted to the Bank the Decree No 4197 of October 2009 approving the Action plan for the improvement of its planning, budgeting, financial management and internal control systems.
58
actions for the first tranche disbursement would be establishment and staffing of the Project Management Office at the Secretary of Planning (SEPLAN) responsible for the definition of rules governing the execution of the portfolio of priority projects and for their monitoring and the approval by the State Assembly of an amendment to the Multi-Year Plan 2008-11, including the State priority programs “Strengthening of Public Management” and “Strengthening of Planning” with a budget allocation of R$7.8 million and R$7.2 million, respectively. The selection of the portfolio can be considered as a benchmark action that indicates the willingness of the government to focus its resources on a small set of high priority programs and deliver results through their intensive management. If successful, this pilot experience could be replicated in other government programs43.
189. Finally, to guarantee the implementation of the GoA’s priority programs in the area of institutional enhancement, the second tranche disbursement condition on this area would be the satisfactory implementation of the State priority programs “Strengthening of Public Management” and “Strengthening Planning”. The criterion for satisfactory implementation is defined as the government spending effectively at least R$5 million of committed expenditures (or 30 percent of budget allocations) to these programs.
190. The Bank provided technical advice to the government on the analysis of policy proposals in a number of reform areas such as social security, human resources and public sector management. The Bank will continue to provide technical advice as the government implements its reform program. The approval of the amendment to the State Budget including allocations for the strengthening of public management and planning signals the GoA’s commitment to guarantee resources for capacity building activities in the policy areas supported by the DPL.
191. In addition, as mentioned in Section IV the GoA is currently receiving technical assistance from the private sector, the IADB and the Federal Government. The private sector in particular, is financing through the MBC, technical assistance activities in the areas of tax administration and project management. These organizations are assisting with the implementation of actions corresponding to components 1 and 4. For components 2 and 3, with Bank support, the GoA has designed with a program on public sector modernization that has been included in the portfolio of priority programs. This program includes the census of the civil service, the audit of the payroll, the new HR IT system and the design of the social security reform proposal. While the Bank will not finance this work, it can provide technical advice during project supervision. Furthermore, a second tranche condition is the satisfactory implementation of the “Strengthening Public of Management” and “Strengthening of Planning” programs included in the portfolio of GoA´s priority programs.
43 The GoA submitted to the Bank the Decree No. 4198 establishing the Project Management Office at SEPLAN and the Law No. 7089 approving the budget allocations in the State Budget (for FY 2009 and FY 2010) to finance the implementation of the strengthening of the public management system priority programs “Fortalecimento do Sistema de Gestão Pública” and “Fortalecimento do Planejamento”.
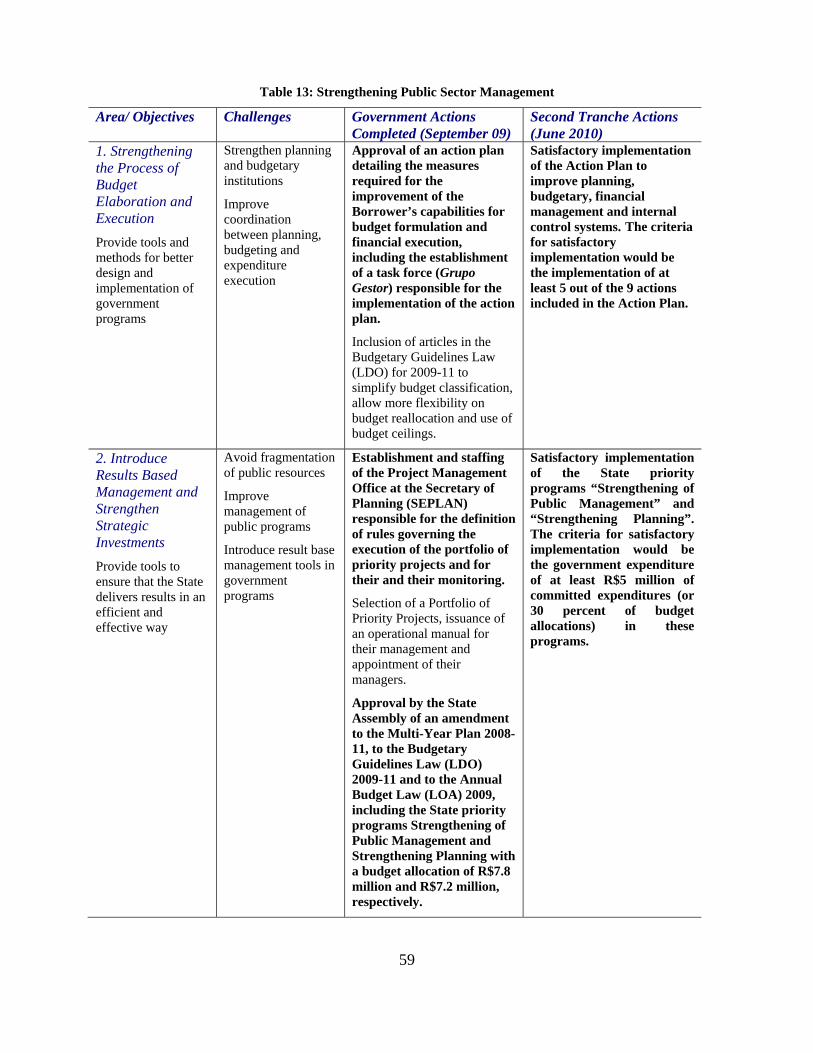
59
Table 13: Strengthening Public Sector Management
Area/ Objectives Challenges Government Actions Completed (September 09)
Second Tranche Actions (June 2010)
1. Strengthening the Process of Budget Elaboration and Execution
Provide tools and methods for better design and implementation of government programs
Strengthen planning and budgetary institutions
Improve coordination between planning, budgeting and expenditure execution
Approval of an action plan detailing the measures required for the improvement of the Borrower’s capabilities for budget formulation and financial execution, including the establishment of a task force (Grupo Gestor) responsible for the implementation of the action plan.
Inclusion of articles in the Budgetary Guidelines Law (LDO) for 2009-11 to simplify budget classification, allow more flexibility on budget reallocation and use of budget ceilings.
Satisfactory implementation of the Action Plan to improve planning, budgetary, financial management and internal control systems. The criteria for satisfactory implementation would be the implementation of at least 5 out of the 9 actions included in the Action Plan.
2. Introduce Results Based Management and Strengthen Strategic Investments
Provide tools to ensure that the State delivers results in an efficient and effective way
Avoid fragmentation of public resources
Improve management of public programs
Introduce result base management tools in government programs
Establishment and staffing of the Project Management Office at the Secretary of Planning (SEPLAN) responsible for the definition of rules governing the execution of the portfolio of priority projects and for their and their monitoring.
Selection of a Portfolio of Priority Projects, issuance of an operational manual for their management and appointment of their managers.
Approval by the State Assembly of an amendment to the Multi-Year Plan 2008-11, to the Budgetary Guidelines Law (LDO) 2009-11 and to the Annual Budget Law (LOA) 2009, including the State priority programs Strengthening of Public Management and Strengthening Planning with a budget allocation of R$7.8 million and R$7.2 million, respectively.
Satisfactory implementation of the State priority programs “Strengthening of Public Management” and “Strengthening Planning”. The criteria for satisfactory implementation would be the government expenditure of at least R$5 million of committed expenditures (or 30 percent of budget allocations) in these programs.

60
Table 14: Evidence of Compliance with Prior Actions in the Policy Matrix
Component / Prior Action Evidenced Presented Consolidating Fiscal Adjustment and Creating Fiscal Space for Investment Adoption of the integrated data base (Gestão Matricial da Receita - GMR) and the establishment of a remuneration schedule for the staff at the SEFAZ.
Ofício GSEF No. 519/2009 describing the implementation of GMR. Laws No 6951 and No 7001 establishing the variable remuneration system at SEFAZ.
Implementation of the electronic price registration system for the purchasing of 635 items and the establishment of time limits to complete each procedure under said system.
Ofício No. 692 reporting the purchase of 635 items through electronic price registration. Decrees No. 4163 and No. 4164 establishment of specific time limits for the completion of the various procedures.
Improving Human Resource Management The completion of the Census of the civil service staff and the carrying out of remedial measures
Oficio No. 689 describing the implementation of the Census of Civil Service and the corrective measures already taken. Decree No 4102 setting rules for the Census.
Launching the audit of the state payroll including compensation for active employees and pensioners and survivors’ benefits.
Oficio No. 690 informing the status of the payroll Audit and a progress report from the Audit Consultant.
Reducing the State Social Security Deficits Approval by the State Assembly of the Law No/2009 establishing the Single Administrator (Gestor Único) for the Government of Alagoas’s (RPPS) pension system and the restructuring of the State Social Security System.
Draft Law sent to the State Assembly.
Satisfaction of all the requirements to get the Social Security Regularity Certification (CRP) from the Federal Government.
CRP Issued by the Federal Government (to be provided during negotiations).
Strengthening Public Sector Management Approval of an action plan detailing the measures required for the improvement of the Borrower’s capabilities for budget formulation and financial execution.
Decree No. 4197, approving the Action Plan.
Establishment and staffing of the Project Management Office at the Secretary of Planning (SEPLAN).
Decree No. 4198, establishing the Project Management Unit at SEPLAN.
Approval of budget allocations in the State Budget (for FY 2009 and FY 2010) to support the implementation of the program “Fortalecimento do Sistema de Gestão Pública” and “Fortalecimento do Planejamento”
Law No 7089, amending Multi-year Plan (PPA) 2008-11 with the inclusion of both programs and their respective budget allocations for FY09 and FY2010.
OVERALL IMPACT AND DEBT SUSTAINABILITY ANALYSIS
192. The impact of the measures supported by the proposed Bank operation has been assessed in a debt sustainability analysis presented in detail in Annex 4. Two scenarios were developed. The first scenario was based upon the revenue and expenditure trends observed prior to the measures taken by the government in 2007 and 2008. The second scenario took into account the continuity and strengthening of the adjustment measures adopted in 2008-09 supported by the operation. The study projects the evolution of the government balances, the civil service pension deficit, and the key Fiscal Responsibility Law indicators of total debt, debt service, and personnel expenditures.
61
193. The assumptions under the two scenarios are as follows.
a. Revenue collection efficiency measures such as the adoption of the system of data base integration to discover evasion, introduction of results-based management mechanisms at the Secretary of Finance (SEFAZ) matrix management model and the electronic invoice should lead to tax collection increases that would be 5 percent higher than projected in the baseline scenario where the growth rate of the ICMS is projected to follow GDP growth and inflation.
b. Payroll census, audit and the new HR system will generate a once for all decrease of 3 percent of the payroll registered in 2009 under the reform scenario. In addition, a new compensation rule would be established to limit the payrolls real increase to 85 percent of the GDP real growth. The baseline scenario implies that payroll will grow with GDP and inflation.
c. Social security reforms consisting of audit of pensioners and survivors payroll and crosschecking with federal data base information and corrections will generate a one time decrease of 6 percent. Parametric measures will generate savings that amount to R$800 million in 20 years. The baseline scenario implies that pensions grow with population, national GDP and inflation.
d. Reforms in procurement with the introduction of electronic price registration and electronic reverse auction will generate savings of 10 percent in 2010 of government purchases of goods and services. Thereafter expenditures on goods and services will grow at the same rate as inflation and GDP in both scenarios.
e. Improvements in public sector management and the strengthening of government strategic investments will result in an increase of 10 percent in the real GDP growth rate compared to the baseline scenario. In addition, the reform scenario assumes higher investment expenditures financed by increased net operating balances that will result from the reforms on current revenues and expenses, and
f. World Bank loan of US$195.450 and would have the following financial conditions: 30 years, 0-grace period, Libor + 11 b.p.
194. Figures 16 and 17 show the projected scenarios with and without reforms. The exercise shows that revenue gains are limited and that the bulk of the adjustment relies on the expenditure side, in particular on the reduction of personnel expenses and social security deficits. Both the Census and the Audit economies will keep Alagoas below the Fiscal Responsibility Law ceiling for personnel expenses (at 60 percent of Net Current Revenues). The application of the compensation rule contains the payroll increase in the medium term. Together with the gains on the purchase of goods and services, the reforms on the expenditure side enable the GoA to expand the fiscal space for investment. Indeed investment expenditures to net current revenues under the reform program are 2 percentage points higher than what is projected without reforms.

62
Figure 16: Net Current Revenues, Personnel Expenditures, Gross Operating and Investment, 2008-20
195. Higher investment expenditures do not reduce primary and overall balances. Only in the first year are the projected primary and overall balances lower under the reform scenario because the Bank loan is allocated to investments. From 2010 onwards, projected fiscal balances are higher and thus the debt reduction path is accelerated. It is worth noting that the projection for debt services (amortization plus interest payments) reflects the prepayment of a high cost debt. Part of the DPL proceeds would be allocated to pay this debt that amounts R$106.8 million and must be paid in 2012.
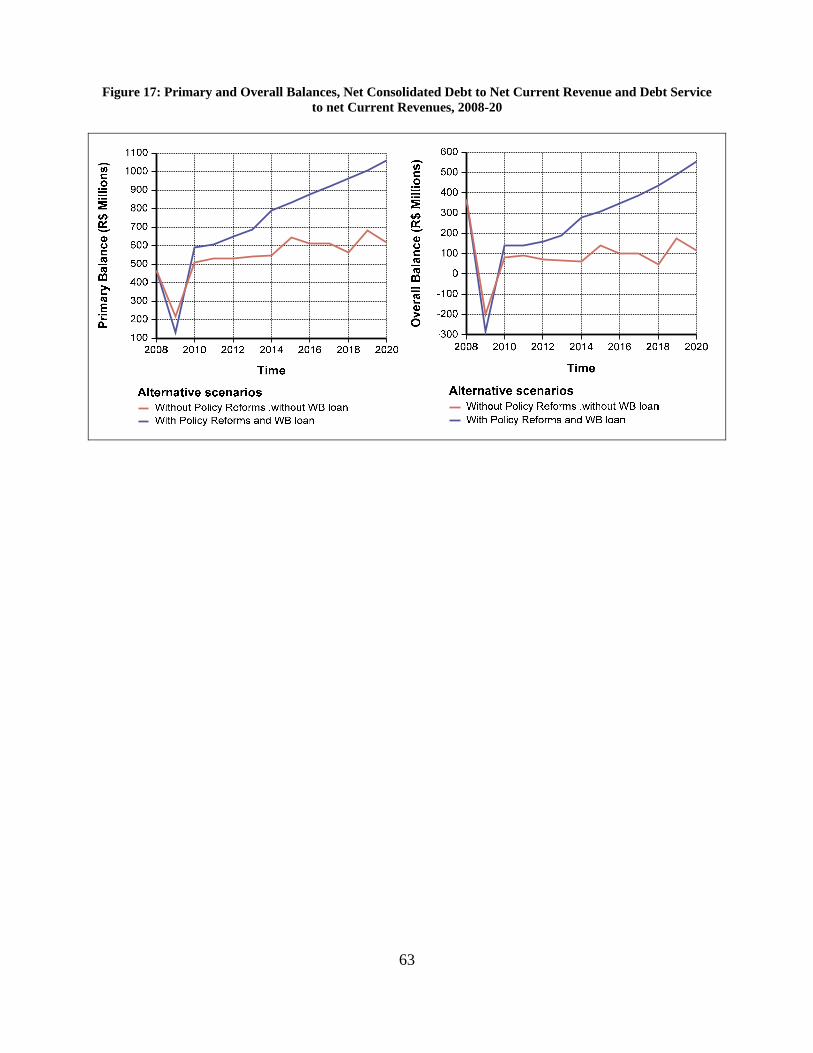
63
Figure 17: Primary and Overall Balances, Net Consolidated Debt to Net Current Revenue and Debt Service to net Current Revenues, 2008-20
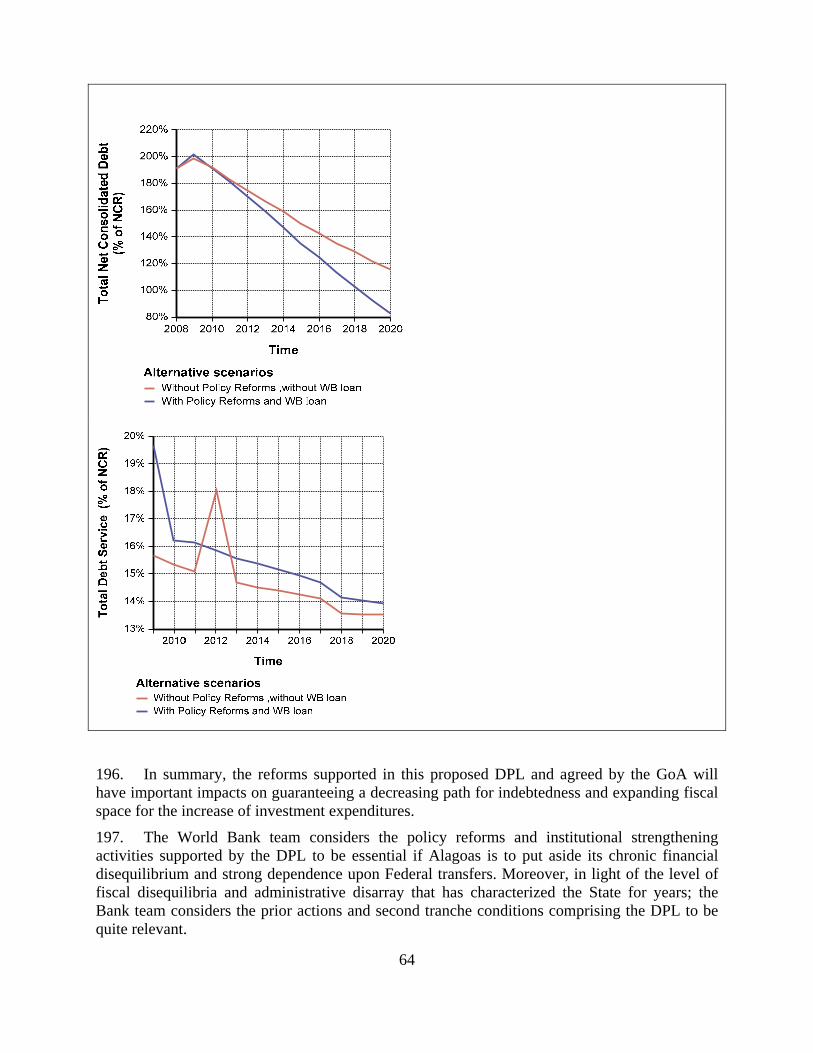
64
196. In summary, the reforms supported in this proposed DPL and agreed by the GoA will have important impacts on guaranteeing a decreasing path for indebtedness and expanding fiscal space for the increase of investment expenditures.
197. The World Bank team considers the policy reforms and institutional strengthening activities supported by the DPL to be essential if Alagoas is to put aside its chronic financial disequilibrium and strong dependence upon Federal transfers. Moreover, in light of the level of fiscal disequilibria and administrative disarray that has characterized the State for years; the Bank team considers the prior actions and second tranche conditions comprising the DPL to be quite relevant.

65
198. The strong effects of the global financial crisis on the GoA’s public finances suggest the need for a deeper analysis to assess the effect of some of the shocks in the most important determinants of fiscal sustainability, namely economic growth at the state and especially at the national level. On the revenue side, the most important risk is a sharp reduction in transfers from the federal government, which represented 60 percent of total revenues in 2008. Transfers from the federal government are associated to national tax collection which in turn depends on national GDP growth. Own tax collection is the second most important source of revenue and depends on the State GDP growth rate44.
199. Using the World Bank lending operation as the baseline, a sensitivity analysis exercise was performed using a more pessimistic growth scenario than the used in the simulations above. Table below shows the growth rate for the baseline and alternative scenarios.
Table 15: Different Growth Scenarios
2008 2009 2010 2011 2012 2013-2020
Baseline 0% -0.50% 3% 3.50% 4% 4.50%Lower GDP Growth rate 0% -1.50% 3% 3.50% 4% 4.50%
200. Results are exibited in Figure 18 below. Given the temporary nature of the negative shock on the GDP growth rate, there is a temporary shift in the declining trend observed for the net consolidated debt to net current revenue. Indeed, in 2009 and 2010 Alagoas’s debt may return to above the FRL ceiling of 200 percent. Personnel expenses to net current revenue should be much higher than the FRL limit of 60 percent. Nonetheless, better growth prospects for 2010 onwards should help Alagoas to resume the improvement of its fiscal accounts.
Figure 18: GoA’s Indebtedness and Personnel Expenses under Different Growth Assumptions
201. The probabilistic approach indicates that the effect of the ensuing reforms supported by the loan have a measurable impact towards improving debt sustainability and the probabilities of compliance with the FRL.
44 See Annex 4 for more detailed information on the DSA sensitivity and risk analyses for the GoA.

66
202. Besides the sensitivity analysis for each variable, risk analyses were conducted to observe simultaneous random shocks in a set of variables and their impact on the state’s financial situation. A random error was added to each of the following variables: tax revenues, federal government transfers, state government transfers, personnel expenditures and pension fund contributions, other current expenditures (including goods and services), and the exchange rate45. Results from Monte-carlo simulations are depicted in Figures 19 and 20. Right hand panels correspond to the scenario without reforms while left hand panels correspond to the reform scenario.
Figure 19: Total Net Consolidated Debt as % of NCR
Figure 20: Debt Service as % of NCR
45 For each variable, a random error affected its growth of rate. Random errors were assumed to follow a zero-mean normal distribution.
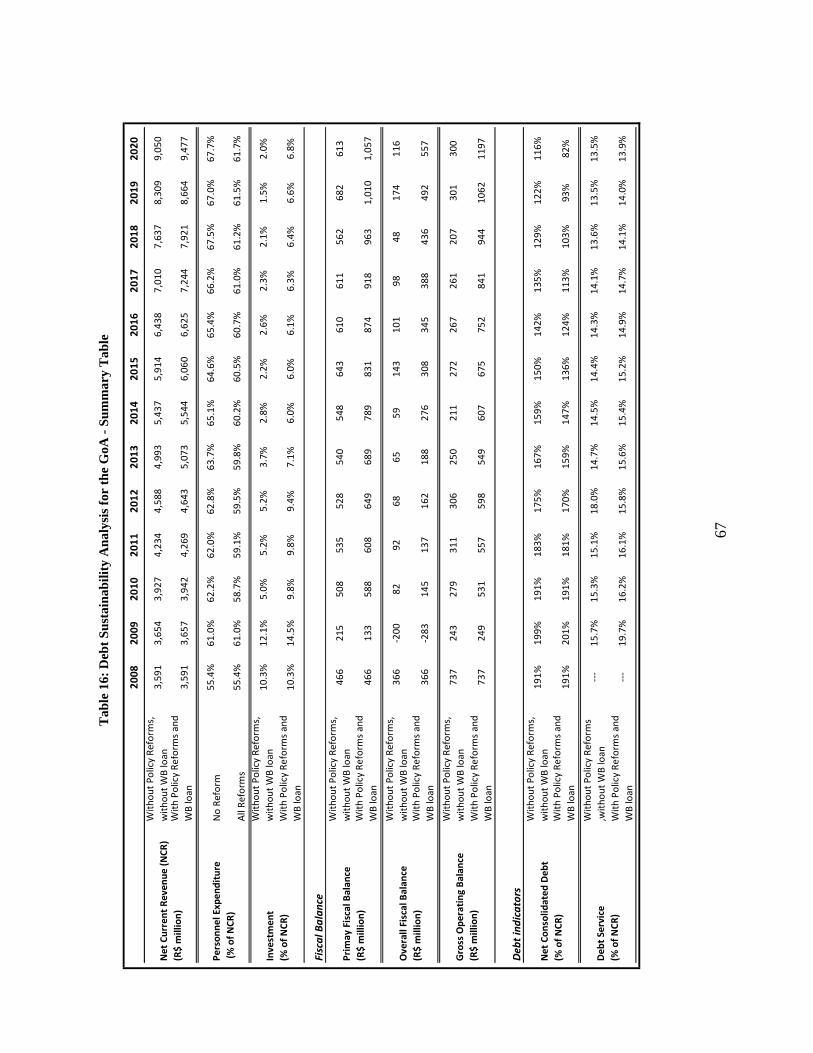
67
Tab
le 1
6: D
ebt
Su
stai
nab
ilit
y A
nal
ysis
for
th
e G
oA -
Su
mm
ary
Tab
le
2008
2009
2010
2011
2012
2013
2014
2015
2016
2017
2018
2019
2020
With
out P
olic
y Re
form
s,
with
out W
B lo
an3,
591
3,65
43,
927
4,23
44,
588
4,99
35,
437
5,91
46,
438
7,01
07,
637
8,30
99,
050
With
Pol
icy
Refo
rms
and
WB
loan
3,59
13,
657
3,94
24,
269
4,64
35,
073
5,54
46,
060
6,62
57,
244
7,92
18,
664
9,47
7
No
Refo
rm55
.4%
61.0
%62
.2%
62.0
%62
.8%
63.7
%65
.1%
64.6
%65
.4%
66.2
%67
.5%
67.0
%67
.7%
All
Refo
rms
55.4
%61
.0%
58.7
%59
.1%
59.5
%59
.8%
60.2
%60
.5%
60.7
%61
.0%
61.2
%61
.5%
61.7
%
With
out P
olic
y Re
form
s,
with
out W
B lo
an10
.3%
12.1
%5.
0%5.
2%5.
2%3.
7%2.
8%2.
2%2.
6%2.
3%2.
1%1.
5%2.
0%
With
Pol
icy
Refo
rms
and
WB
loan
10.3
%14
.5%
9.8%
9.8%
9.4%
7.1%
6.0%
6.0%
6.1%
6.3%
6.4%
6.6%
6.8%
Fisc
al B
alan
ceW
ithou
t Pol
icy
Refo
rms,
w
ithou
t WB
loan
466
215
508
535
528
540
548
643
610
611
562
682
613
With
Pol
icy
Refo
rms
and
WB
loan
466
133
588
608
649
689
789
831
874
918
963
1,01
01,
057
With
out P
olic
y Re
form
s,
with
out W
B lo
an36
6-2
0082
9268
6559
143
101
9848
174
116
With
Pol
icy
Refo
rms
and
WB
loan
366
-283
145
137
162
188
276
308
345
388
436
492
557
With
out P
olic
y Re
form
s,
with
out W
B lo
an73
724
327
931
130
625
021
127
226
726
120
730
130
0
With
Pol
icy
Refo
rms
and
WB
loan
737
249
531
557
598
549
607
675
752
841
944
1062
1197
Deb
t in
dica
tors
With
out P
olic
y Re
form
s,
with
out W
B lo
an19
1%19
9%19
1%18
3%17
5%16
7%15
9%15
0%14
2%13
5%12
9%12
2%11
6%
With
Pol
icy
Refo
rms
and
WB
loan
191%
201%
191%
181%
170%
159%
147%
136%
124%
113%
103%
93%
82%
With
out P
olic
y Re
form
s ,w
ithou
t WB
loan
---
15.7
%15
.3%
15.1
%18
.0%
14.7
%14
.5%
14.4
%14
.3%
14.1
%13
.6%
13.5
%13
.5%
With
Pol
icy
Refo
rms
and
WB
loan
---
19.7
%16
.2%
16.1
%15
.8%
15.6
%15
.4%
15.2
%14
.9%
14.7
%14
.1%
14.0
%13
.9%
Prim
ay F
isca
l Bal
ance
(R
$ m
illio
n)
Ove
rall
Fisc
al B
alan
ce
(R$
mill
ion)
Gro
ss O
pera
ting
Bal
ance
(R
$ m
illio
n)
Pers
onne
l Exp
endi
ture
(% o
f NCR
)
Inve
stm
ent
(%
of N
CR)
Net
Con
solid
ated
Deb
t(%
of N
CR)
Net
Cur
rent
Rev
enue
(NCR
) (R
$ m
illio
n)
Deb
t Se
rvic
e (%
of N
CR)

68
VI. OPERATION IMPLEMENTATION
POVERTY AND SOCIAL IMPACTS
203. The proposed operation is not expected to have a significant direct impact on Alagoas’s poverty and social conditions. However, the indirect poverty and social impact of the reforms supported by the operation could be very positive. Indeed, the proposed DPL will complement the robust social protection network built up by the Federal Government in the last years. Improved public service delivery in education, health and access to basic infrastructure provided by the State Government will, as a result of the improvement of public finances, reinforce the gains derived from the federal conditional cash transfers programs.
204. Federal direct transfers to individuals benefit a large part of Alagoas’s population. Almost 350 thousand families or 47 percent of Alagoas families are beneficiaries of the Bolsa Familia. Figure 19 shows the incidence of the program by municipality. More than 50 percent of families in 80 municipalities (out of the 101 municipalities in the state) are Bolsa Familia beneficiaries. The average benefit per month is about R$80 which represents a significant part of the population’s income, especially in poor municipalities.
Figure 21: Percentage of Families Receiving Bolsa Familia by Municipality in Alagoas, 2008
-
10
20
30
40
50
60
70
80
Mac
eió
Satu
ba
Mat
riz d
e Ca
mar
agibe
Mar
echa
l Deo
doro
Sant
a Luz
ia do
Nor
te
São Jo
sé da La
je
São M
igue
l Dos
Mila
gres
Atalai
a
Coqu
eiro
Seco
Palm
eira
Dos
Índios
Carn
eiro
s
São Lu
ís do
Quitu
nde
Bata
lha
Taqu
aran
a
Major
Isid
oro
Mar
Ver
melho
Cam
pestre
Igre
ja Nov
a
São Br
ás
Caju
eiro
Mar
ibon
do
Jara
mat
aia
Flexe
iras
Dois R
iacho
s
Jund
iá
São Jo
sé da Ta
pera
Estre
la de
Alag
oas
Pão
de A
çúca
r
Cam
po G
rand
e
Oliven
ça
Sena
dor R
ui Palm
eira
Igac
i
Inha
pi
Joaq
uim G
omes
205. Other Federal Government direct transfers to the population are even larger than Bolsa Familia and target other vulnerable population segments. The Beneficio de Prestacao Continuada (BPC) benefits poor elderly and handicapped people regardless of their contributions to the social security system. The Rural Pension is another social security transfer for rural workers that were not covered by the general social security system (RGPS).
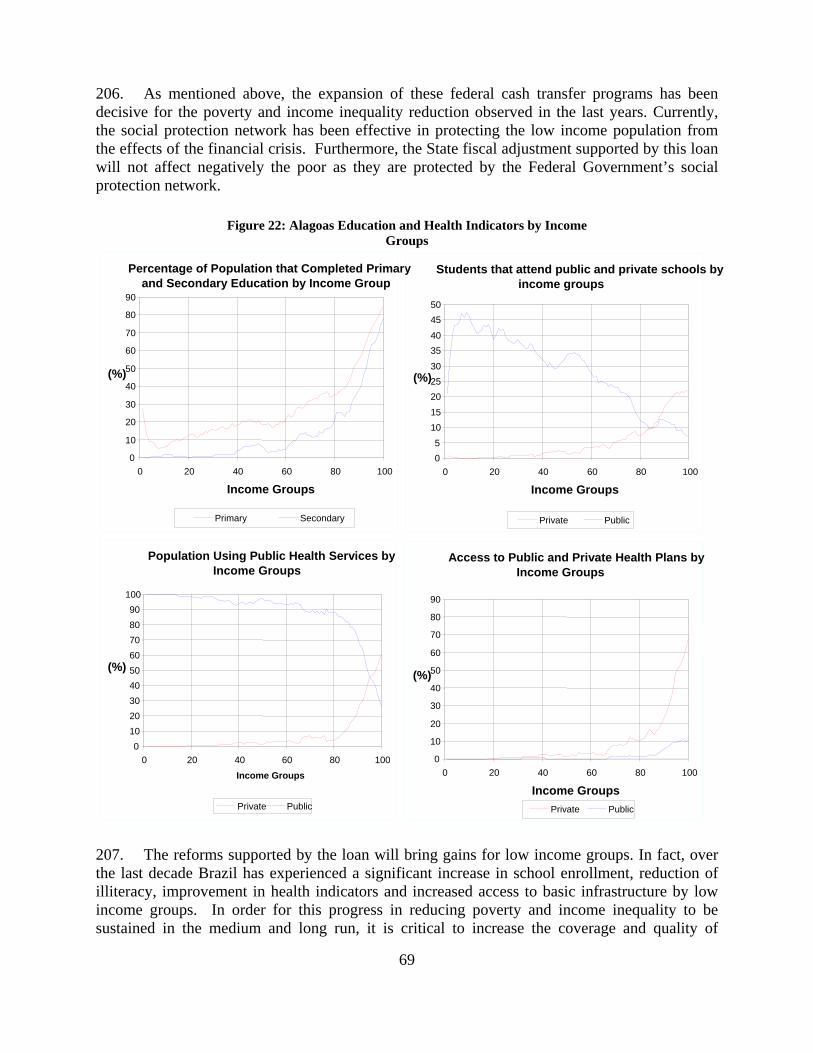
69
206. As mentioned above, the expansion of these federal cash transfer programs has been decisive for the poverty and income inequality reduction observed in the last years. Currently, the social protection network has been effective in protecting the low income population from the effects of the financial crisis. Furthermore, the State fiscal adjustment supported by this loan will not affect negatively the poor as they are protected by the Federal Government’s social protection network.
Figure 22: Alagoas Education and Health Indicators by Income
Groups
207. The reforms supported by the loan will bring gains for low income groups. In fact, over the last decade Brazil has experienced a significant increase in school enrollment, reduction of illiteracy, improvement in health indicators and increased access to basic infrastructure by low income groups. In order for this progress in reducing poverty and income inequality to be sustained in the medium and long run, it is critical to increase the coverage and quality of
Percentage of Population that Completed Primary and Secondary Education by Income Group
0
10
20
30
40
50
60
70
80
90
0 20 40 60 80 100
Income Groups
(%)
Primary Secondary
Students that attend public and private schools by income groups
0
5
10
15
20
25
30
35
40
45
50
0 20 40 60 80 100
Income Groups
(%)
Private Public
Population Using Public Health Services by Income Groups
0
10
20
30
40
50
60
70
80
90
100
0 20 40 60 80 100
Income Groups
(%)
Private Public
Access to Public and Private Health Plans by Income Groups
0
10
20
30
40
50
60
70
80
90
0 20 40 60 80 100
Income Groups
(%)
Private Public

70
education and health services as well as the access of the poor to basic infrastructure services, all of which are mainly provided through the State Government.
208. To the extent that the policy reforms supported by the proposed operation will increase the GoA’s fiscal space for increasing investments as well as enhance the efficiency of public expenditures, it should have a positive indirect impact on the State’s ability to increase access to and the quality of social and infrastructure services.
Figure 23: Alagoas Access to Public Services by Income Group
Access to Canned Water by Income Groups
0
10
20
30
40
50
60
70
80
90
100
0 20 40 60 80 100
Income Groups
(%)
1992 2007
Access to Sanitation Network by Income Groups
0
5
10
15
20
25
30
35
40
45
50
0 20 40 60 80 100
Income Groups
(%)
1992 2007
Access to Electricity by Income Groups
50
55
60
65
70
75
80
85
90
95
100
0 20 40 60 80 100
Income Groups
(%)
1992 2007
Access to Garbage Collection by Income Groups
0
10
20
30
40
50
60
70
80
90
100
0 20 40 60 80 100
Income Groups
(%)
1992 2007
209. Improvements in the coverage and quality of state-provided social services would benefit disproportionately the poor. As noted in Figure 20, low income groups (to the left on the income distribution axis) have lower education indicators and are the predominant users of public education and health services. Less than 20 percent and 10 percent of the first three quintiles of income distribution have completed primary and secondary education, respectively. Public schools are attended by about 40 percent of the low income groups compared to about 10 percent of high income groups which rely to a much larger extent on private schools. The same pattern is observed for public and private health services, which are used predominantly respectively by low and high income groups. Only high income groups have health plans provided by the private
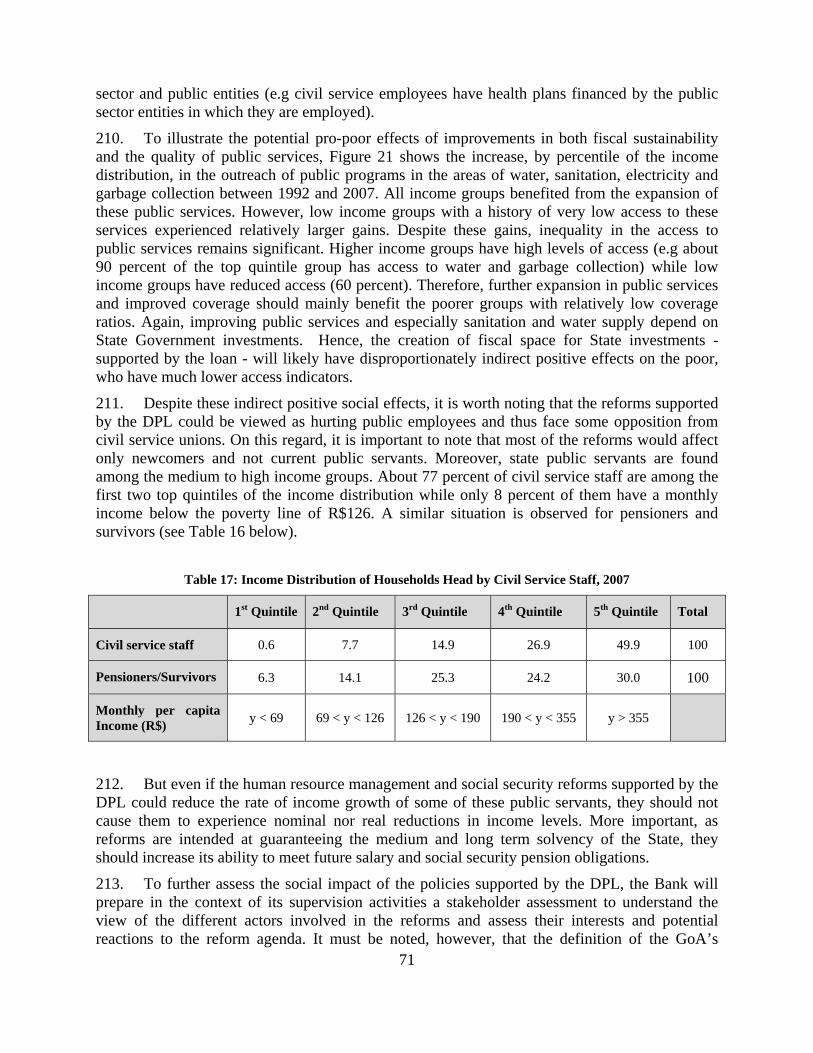
71
sector and public entities (e.g civil service employees have health plans financed by the public sector entities in which they are employed).
210. To illustrate the potential pro-poor effects of improvements in both fiscal sustainability and the quality of public services, Figure 21 shows the increase, by percentile of the income distribution, in the outreach of public programs in the areas of water, sanitation, electricity and garbage collection between 1992 and 2007. All income groups benefited from the expansion of these public services. However, low income groups with a history of very low access to these services experienced relatively larger gains. Despite these gains, inequality in the access to public services remains significant. Higher income groups have high levels of access (e.g about 90 percent of the top quintile group has access to water and garbage collection) while low income groups have reduced access (60 percent). Therefore, further expansion in public services and improved coverage should mainly benefit the poorer groups with relatively low coverage ratios. Again, improving public services and especially sanitation and water supply depend on State Government investments. Hence, the creation of fiscal space for State investments -supported by the loan - will likely have disproportionately indirect positive effects on the poor, who have much lower access indicators.
211. Despite these indirect positive social effects, it is worth noting that the reforms supported by the DPL could be viewed as hurting public employees and thus face some opposition from civil service unions. On this regard, it is important to note that most of the reforms would affect only newcomers and not current public servants. Moreover, state public servants are found among the medium to high income groups. About 77 percent of civil service staff are among the first two top quintiles of the income distribution while only 8 percent of them have a monthly income below the poverty line of R$126. A similar situation is observed for pensioners and survivors (see Table 16 below).
Table 17: Income Distribution of Households Head by Civil Service Staff, 2007
1st Quintile 2nd Quintile 3rd Quintile 4th Quintile 5th Quintile Total
Civil service staff 0.6 7.7 14.9 26.9 49.9 100
Pensioners/Survivors 6.3 14.1 25.3 24.2 30.0 100
Monthly per capita Income (R$)
y < 69 69 < y < 126 126 < y < 190 190 < y < 355 y > 355
212. But even if the human resource management and social security reforms supported by the DPL could reduce the rate of income growth of some of these public servants, they should not cause them to experience nominal nor real reductions in income levels. More important, as reforms are intended at guaranteeing the medium and long term solvency of the State, they should increase its ability to meet future salary and social security pension obligations.
213. To further assess the social impact of the policies supported by the DPL, the Bank will prepare in the context of its supervision activities a stakeholder assessment to understand the view of the different actors involved in the reforms and assess their interests and potential reactions to the reform agenda. It must be noted, however, that the definition of the GoA’s

72
development priorities, as embodied in the PPA, reflects not only rigorous technical analyses but also a genuinely participatory process of decision making defined in the State’s constitution. In particular, the preparation of the State Multi-Year Plan (PPA), Budgetary Guidelines Law (LDO) and Annual Budget Law (LOA) included the organization of public consultation sessions. As described in Box 2, the preparation of the PPA 2008-2011 encompassed the organization of seventeen workshops to discuss the sectoral and regional dimensions of the multi-year investment program. The corresponding government initiatives are regularly and extensively discussed by the State Assembly.46
214. The state’s participatory/consultative mechanisms were also present in the program design phases when the state government presented to the Bank a plan for public discussion of the program to be supported by the proposed DPL.
IMPLEMENTATION, MONITORING AND EVALUATION
215. The Secretariat of Finance (SEFAZ) will be responsible for the overall implementation of the proposed operation and for reporting progress and coordinating its actions with the Secretariats of Planning and Budget (SEPLAN) and Public Management (SEGESP). There will be two essential tasks: (i) providing evidence justifying the first and second disbursements, and (ii) overseeing and reporting progress towards completion of the second disbursement conditions including tracking individual conditions and facilitating the timely contracting and/or carrying out of the studies and activities required for meeting these conditions.
216. The Bank will vet the prior conditions for the first disbursement. The timing of this disbursement will depend upon the GoA’s ability to provide the Bank with evidence satisfactory to the Bank that the conditions have been met. While most of these conditions have been addressed already during project preparation, it will still be the responsibility of SEFAZ to present the information in a timely manner and format satisfactory to the Bank.
217. Similarly, SEFAZ will be responsible for marshalling the information necessary to demonstrate that the GoA has met satisfactorily the second tranche conditions and covenants. In the event that one or more conditions are not met or partially met SEFAZ will take the lead in identifying and explaining causes and determining what, if anything can be done to mitigate the corresponding risks.
218. A Project Implementation Committee comprising officials of the three State agencies directly involved in the policy reform agenda supported by the DPL will be identified to monitor project implementation including all technical assistance activities essential for its implementation.
FIDUCIARY ASPECTS
219. In general, public financial management (PFM) systems in Brazil are adequate for DPL lending.
46 For more details on public consultation mechanisms used for the preparation of the PPA 2008-2011 see: http://www.planejamento.al.gov.br/planejamento/planos-plurianuais-ppas/ppa-2008-2011/CAP%203%20METODOLOGIA.pdf.

73
Foreign Exchange Control Environment
220. The IMF Safeguards Assessment of the Central Bank of Brazil done in October 2002 and updated in March 2004 concluded that the Central Bank (BCB) does not present widespread vulnerabilities that could compromise the safeguarding of Fund resources. In particular, its audit is conducted by an internationally recognized audit firm, while its internal audit function contributes effectively to internal control systems.
221. As the IMF Safeguards Assessment of the Central Bank has not been updated in recent years, the Bank reviewed the comparative Financial Statements of the Central Bank for the years ended in December 31, 2006, 2007 and 2008, including the Explanatory Notes to the financial statements and the independent auditors’ report that included an unqualified (clean) opinion on the financial statements for all years. The financial statements for all years were prepared in accordance to the International Financial Reporting Standards (IFRS), issued by the International Accounting Standards Board (IASB), three years before the transition deadline date established by the Securities and Exchange Commission (Comissão de Valores Mobiliários – CVM) Instruction 457 and the CB’s Rule No. 14.259.
222. The Explanatory Notes, an integral part of the Financial Statements, provide an extensive explanation of the Central Bank’s risk management policies, including those related to financial instruments held to manage the international reserves. In relation to operational risks, the Notes state that the Central Bank “uses internal control systems, which are considered adequate for its activities.”
223. Based on the above, the control environment, procedures and regulations governing the Central Bank’s operations within which the foreign exchange from the operation would flow are considered adequate.
Public Financial Management of Budget Resources
224. The Good Practices Note on Financial Management Issues in Developing Policy Operations states that “No minimum standard of public financial management has been established which may be used as a precondition for development policy lending. Development policy operations could be provided in a country that has a weak public financial management environment but has committed itself to an adequate program of public financial management and there is reasonable evidence that improvements are occurring in a timely manner. Improved PFM performance may indeed be an outcome, rather than a precondition, of development policy lending.”
225. The Bank carried out a Budgetary and Financial Management Systems Assessment, review of external auditor opinions and other diagnostic review work of the State’s PFM (medium-term planning, budget, treasury, accounting, debt, funding agreements –“convênios”, internal controls and internal audit) with the assistance of a consultant. This review revealed that the State of Alagoas is emerging from weak public financial management inherited from previous administrations. On average, the State was evaluated solidly in the middle of B and C scores in PFM areas evaluated. Despite continuing weaknesses, the State has shown significant commitment to an adequate program of public financial management evidenced by substantive

74
improvements that result in acceptable risk levels and justify the operation. These improvements include:
• Maintenance of a core group of competent and committed financial managers;
• Completion of an independent payroll audit and procurement of a new personnel and payroll management system;
• An independent and active internal audit function whose work is supported and integrated with the Federal General Controller (Controladoria Geral da União- CGU);
• Strengthening of internal controls over convenios (financing agreements) and;
• Implementation of numerous accounting and revenue collection controls.
226. Desirable improvements are still needed but notable progress is being made. The Bank identified and discussed with State Finance officials opportunities for PFM improvements during preparation of the DPL operation and will support selected elements of the State’s PFM reform agenda through DPL disbursement conditions such as the satisfactory implementation of the action plan for the strengthening of the planning, budgeting, financial execution and internal control phases.
DISBURSEMENT AND AUDITING
227. Once the Bank formally notifies the borrower that the loan is available for withdrawal, the Borrower may submit a withdrawal application so that the proceeds of the loan would be deposited by the Bank into a local currency (Brazilian Real) account of the State Treasury, established at the Caixa Economica Federal - CEF, controlled by the federal government and one of the largest national banks, for the Borrower's use. The exchange transaction is expected to be done through the Central Bank of Brazil.
228. The Bank will disburse the two tranches of the loan proceeds into an account of the Central Bank denominated in USD, which forms part of the country’s official foreign exchange reserves. The Central Bank will immediately credit the disbursed amounts to the State’s Single Treasury Account, thus becoming available to finance budgeted expenditures. The National Treasury will then provide the Bank a written confirmation of the transaction. The same disbursement procedure will be followed for both tranches.
ENVIRONMENTAL ASPECTS
229. The specific actions supported under the proposed DPL are not likely to have significant positive or negative effects on the country’s environment, forests, and other natural resources. The loan comprises four components, all having to do with fiscal management and public sector management reform. There are no conditions that may trigger environmental concerns or that may affect environmental laws and regulations, their enforcement or associated organizational framework in Alagoas.

75
RISKS AND RISK MITIGATION
230. The risks associated with this operation are considerable namely: i) government ownership and political economy of reforms; ii) reform continuity; iii) low technical and institutional capacity; and iv) fiscal deterioration due to the financial crisis.
231. Government ownership and political economy of reforms: reforms are likely to be opposed by certain entrenched political interests. Public employee unions, in particular, are powerful and have responded to previous efforts to reduce payroll costs with extended strikes. Nonetheless, the current political environment is favorable. The current administration is strongly committed to reform. This is evident in the Governor’s response to the fiscal crisis he inherited and by his active support for this project. The broader political environment also favors reform. States to the south (e.g., Minas Gerais) and northeastern neighbors to Alagoas (e.g., Ceara, Sergipe, Pernambuco) have successfully undertaken major programs of state reform. Their administrations have been rewarded by the voters. Popular opinion in Alagoas increasingly expects better governance and can be expected to reward politicians who achieve it. Furthermore, the operation is strongly supported by the Federal Government.
232. The timetable for reform is also short. The current term of the Governor ends in two years. While the Governor can run for re-election, there is no guarantee that he will prevail. Reforms must therefore be implemented quickly and must be difficult to reverse. The policy measures supported by the project have been designed to lock in reforms while remaining technically and politically feasible within the term of the present administration. Most of the reforms are procedural and administrative and are likely to be self-sustaining. In addition, the project is strategically tranched. Several of the most politically sensitive reforms are included among the first tranche conditions, requiring them to be completed while the project has maximum fiscal leverage; i.e., before any funds are released. While a second tranche is required to permit more time-consuming conditions to be met, conditions for second tranche disbursement will be clearly specified in the project matrix and are mostly follow up measures likely to be implemented during the current administration term.
233. The technical capacity of the State bureaucracy is weak. Lack of a professionalized civil service complicates the design and implementation of public policies. Nonetheless, during project preparation intense technical assistance advice was provided by the Bank team. Moreover, capacity building activities are being institutionalized in government programs whose funding is a prior condition for this operation. Those capacity building activities cover critical areas such as human resource management, social security and investment management.
234. Impact of the financial crisis on GoA’s public finances. There is considerable risk that the fiscal repercussions of the global economic crisis could offset the gains made in the last two years. In 2009, revenues have experienced a strong fall, specially the transfers from the Federal Government that are the most important revenue source. The State administration is trying to attenuate the fall in transfers through a stronger own tax collection effort and the improvement in the recovery of tax arrears. The Federal Government is also creating financing mechanisms to compensate for the fall of its transfers to the states. Nonetheless, falling revenues may require further adjustment on the expenditure side. The fiscal performance of the State will therefore be closely monitored throughout the disbursement period and the need for further adjustments in order to meet the project’s fiscal targets will be regularly discussed with the Government. In

76
timing the reforms to fall within the term of the present administration, the project design ensures that reforms do not depend upon political continuity.
235. Finally, it is worth mentioning that fiscal risks are also limited by the strict the sub-national fiscal discipline framework. The hard budget constraint imposed by the Federal Government also provides an impetus for reform. The debt ceilings imposed by the Fiscal Responsibility Law, STN’s relentless enforcement of the PAFs, and the near-absence of discretionary transfers in Brazil’s system of intergovernmental fiscal relations limit the State’s ability to ‘borrow its way’ out of future financial difficulties. This creates strong incentives for maintaining the current government’s commitment to the reforms supported by the proposed operation.

77
ANNEX 1: MACROECONOMIC OUTLOOK: THE GLOBAL CRISIS EFFECTS ON THE BRAZILIAN ECONOMY
A1.1 Despite its increased resilience, the global financial crisis has hit Brazil hard. The impacts of the global downturn in the Brazilian economy can be divided into three according to their timing and sectors that affected. First round effects encompassed contagion in financial markets, fall in commodity prices, exchange rate depreciation, external credit curtailment and a liquidity squeeze for Brazilian firms. From September through December, 2008 the Sao Paulo Stock Market Index (Ibovespa) stock market fell 32 percent, sovereign spreads increased by 78 percent, the main Brazilian commodity exports prices fell by more than 30 percent and the BRL depreciated by 35%. Such movements reflected increasing risk aversion that affected worldwide markets, deep slowdown in economic activity of developed countries, relevance of commodity stocks in Ibovespa, and the fact that the BRL is a commodity currency (correlated with global economic activity). (see Figure A1.1 below)
Figure A1. 1: Sovereign Spreads, Exchange Rate, Stock Market Index and Commodity Prices
Sovereign Spreads: Brazil and LAC, 2005-09
0100
200
300
400
500600
700
800
900
1000
Jan-
05
Mar
-05
Jun-
05
Sep
-05
Dec
-05
Feb
-06
May
-06
Aug
-06
Nov
-06
Jan-
07
Apr
-07
Jul-0
7
Oct
-07
Dec
-07
Mar
-08
Jun-
08
Sep
-08
Dec
-08
Feb
-09
May
-09
Latin Brazil
Brazil EMBI + Sovereign Spread and Exchange Rate, 2005-09
100
200
300
400
500
600
700
800
900
Jan-
05M
ar-0
5Ju
n-05
Sep-
05D
ec-0
5M
ar-0
6M
ay-0
6A
ug-0
6N
ov-0
6Fe
b-07
Apr
-07
Jul-
07O
ct-0
7Ja
n-08
Mar
-08
Jun-
08Se
p-08
Dec
-08
Feb-
09M
ay-0
9
EM
BI
Spr
eads
(B
asis
Poi
nt)
1,5
1,7
1,9
2,1
2,3
2,5
2,7
2,9
3,1
Exc
hang
e R
ate
(R$/
US$
)
EMBI + Sovereign Spread Exchange Rate
IBOVESPA Stock Market Index, 2005-09
22000
32000
42000
52000
62000
72000Ja
n-05
Mar
-05
Jun-
05
Sep
-05
Dec
-05
Mar
-06
May
-06
Aug
-06
Nov
-06
Feb
-07
Apr
-07
Jul-
07
Oct
-07
Jan-
08
Mar
-08
Jun-
08
Sep
-08
Dec
-08
Feb
-09
May
-09
Inde
x -
End
of
Day
Commodity Prices, 2002-09(Jan 2002 = 100)
0
50
100
150
200
250
300
350
400
Jan
-02
May
-02
Sep
-02
Jan
-03
May
-03
Sep
-03
Jan
-04
May
-04
Sep
-04
Jan
-05
May
-05
Sep
-05
Jan
-06
May
-06
Sep
-06
Jan
-07
May
-07
Sep
-07
Jan
-08
May
-08
Sep
-08
Jan
-09
May
-09
Beef Soybeans General Minerals
A1.2 Access to external and domestic credit markets was strongly constrained, especially for small financial institutions and medium and small firms. External credit for exporters and small banks practically vanished. Domestically, the overall volume of credit to the private sector fell sharply. The Government reacted promptly to alleviate the liquidity squeeze. The BCB adopted different measures to inject liquidity into domestic markets and provide foreign exchange to

78
Brazilian corporations facing obligations abroad. Several reductions in reserve requirements, liquidity provision support to small financial institutions in difficulties, incentives to large financial institutions to buy smaller ones with liquidity problems, repo-credit line auctions in dollars for exporters, sales of international reserves to irrigate the spot exchange rate were all used to alleviate private sector difficulties in raising resources in domestic and foreign markets and avoiding deeper exchange rate depreciation. In addition, public banks increased massively their lending to industry and agriculture to compensate for the fall in private credit supply. The Government’s quick reaction has been successful in normalizing credit market conditions in a short period of time. Domestic credit and access to foreign credit have returned to the pre-crisis levels.
A1.3 Effects on the external sector were also sharp but again temporary. The fall in commodity prices and the worldwide economic slowdown led to a decline in exports from a monthly average of US$18 billion in Q3, 2008 to less than U$S10 billion in Q1, 2009. As a consequence, for the first time in seven years, the trade balance was negative in January, 2009. Nonetheless, the domestic economic deceleration reduced imports downward and the trade balance returned to positive. The nominal and real exchange rates and terms of trade experienced a temporary depreciation that was reverted with the increase in commodity prices and the reduction of risk aversion in financial markets confirming the strong correlation between commodity prices and the exchange rate. The current account balance and foreign direct investment also suffered temporary reductions, however, the economic activity contraction and the improvement in market sentiment have promoted the reduction of the current account balance and the resumption of Foreign Direct Investment (FDI) flows to the country. (see Figure A1.2 below)
Figure A1. 2: Commodity prices, Exports, Trade and Current Account Balances
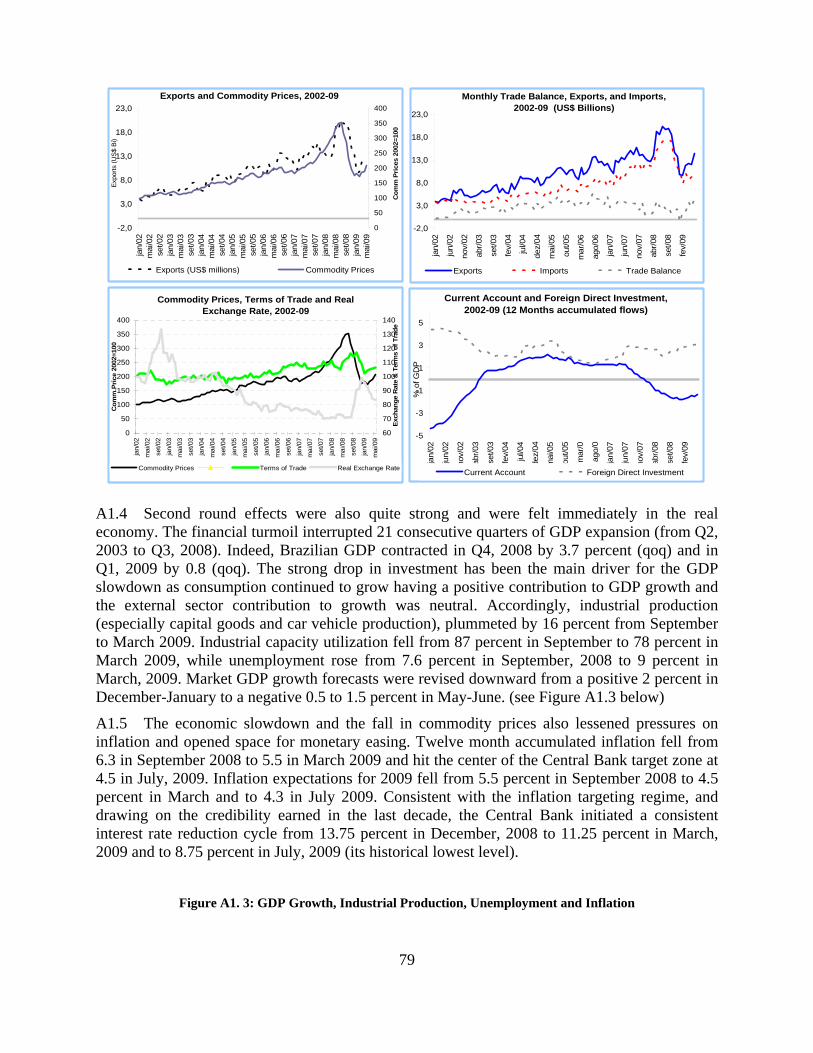
79
Monthly Trade Balance, Exports, and Imports, 2002-09 (US$ Billions)
-2,0
3,0
8,0
13,0
18,0
23,0
jan/
02
jun/
02
nov/
02
abr/
03
set/0
3
fev/
04
jul/0
4
dez/
04
mai
/05
out/0
5
mar
/06
ago/
06
jan/
07
jun/
07
nov/
07
abr/
08
set/0
8
fev/
09
Exports Imports Trade Balance
Current Account and Foreign Direct Investment, 2002-09 (12 Months accumulated flows)
-5
-3
-1
1
3
5
jan/
02
jun/
02
nov/
02
abr/
03
set/0
3
fev/
04
jul/0
4
dez
/04
mai
/05
out/0
5
mar
/0
ago/0
jan/
07
jun/
07
nov/
07
abr/
08
set/0
8
fev/
09
% o
f GD
P
Current Account Foreign Direct Investment
Exports and Commodity Prices, 2002-09
-2,0
3,0
8,0
13,0
18,0
23,0
jan/
02m
ai/0
2se
t/02
jan/
03m
ai/0
3se
t/03
jan/
04m
ai/0
4se
t/04
jan/
05m
ai/0
5se
t/05
jan/
06m
ai/0
6se
t/06
jan/
07m
ai/0
7se
t/07
jan/
08m
ai/0
8se
t/08
jan/
09m
ai/0
9
Exp
orts
(U
S$
Bi)
0
50
100
150
200
250
300
350
400
Co
mm
Pri
ces 2
002=
100
Exports (US$ millions) Commodity Prices
Commodity Prices, Terms of Trade and Real Exchange Rate, 2002-09
0
50
100
150
200
250
300
350
400
jan/
02
mai
/02
set/02
jan/
03
mai
/03
set/03
jan/
04
mai
/04
set/04
jan/
05
mai
/05
set/05
jan/
06
mai
/06
set/06
jan/
07
mai
/07
set/07
jan/
08
mai
/08
set/08
jan/
09
mai
/09
Co
mm
.Pri
ce 2
002=
100
60
70
80
90
100
110
120
130
140
Exc
han
ge
Rat
e &
Ter
ms
of
Tra
de
Commodity Prices Terms of Trade Real Exchange Rate
A1.4 Second round effects were also quite strong and were felt immediately in the real economy. The financial turmoil interrupted 21 consecutive quarters of GDP expansion (from Q2, 2003 to Q3, 2008). Indeed, Brazilian GDP contracted in Q4, 2008 by 3.7 percent (qoq) and in Q1, 2009 by 0.8 (qoq). The strong drop in investment has been the main driver for the GDP slowdown as consumption continued to grow having a positive contribution to GDP growth and the external sector contribution to growth was neutral. Accordingly, industrial production (especially capital goods and car vehicle production), plummeted by 16 percent from September to March 2009. Industrial capacity utilization fell from 87 percent in September to 78 percent in March 2009, while unemployment rose from 7.6 percent in September, 2008 to 9 percent in March, 2009. Market GDP growth forecasts were revised downward from a positive 2 percent in December-January to a negative 0.5 to 1.5 percent in May-June. (see Figure A1.3 below)
A1.5 The economic slowdown and the fall in commodity prices also lessened pressures on inflation and opened space for monetary easing. Twelve month accumulated inflation fell from 6.3 in September 2008 to 5.5 in March 2009 and hit the center of the Central Bank target zone at 4.5 in July, 2009. Inflation expectations for 2009 fell from 5.5 percent in September 2008 to 4.5 percent in March and to 4.3 in July 2009. Consistent with the inflation targeting regime, and drawing on the credibility earned in the last decade, the Central Bank initiated a consistent interest rate reduction cycle from 13.75 percent in December, 2008 to 11.25 percent in March, 2009 and to 8.75 percent in July, 2009 (its historical lowest level).
Figure A1. 3: GDP Growth, Industrial Production, Unemployment and Inflation

80
12 - Month Accumulated Inflation, 2002-09
-2
3
8
13
18
23
28
33
fev/
02
ago/
02
fev/
03
ago/
03
fev/
04
ago/
04
fev/
05
ago/
05
fev/
06
ago/
06
fev/
07
ago/
07
fev/
08
ago/
08
fev/
09
Consumer Price Index (IPCA) Wholesale Price Index, IPG-M.
Industrial Activity Index and Capacity Utilization, 2002-09
90
95
100
105
110
115
120
125
130
135
jan/
02
jul/0
2
jan/
03
jul/0
3
jan/
04
jul/0
4
jan/
05
jul/0
5
jan/
06
jul/0
6
jan/
07
jul/0
7
jan/
08
jul/0
8
jan/
09
(Ca
pa
city
Uti
liza
tio
n %
)
75
76
77
78
79
80
81
82
83
84
(In
du
stry
Act
ivit
y In
de
x)
Industrial Production Index CNI Percentage of Total Capacity
Unemployment Rate (%), 2002-09
6
7
8
9
10
11
12
13
14
fev/
02
ago
/02
fev/
03
ago
/03
fev/
04
ago
/04
fev/
05
ago
/05
fev/
06
ago
/06
fev/
07
ago
/07
fev/
08
ago
/08
fev/
09
Quarterly GDP Growth and Demand Components Contributions, 2002-09
-6,0
-4,0
-2,0
0,0
2,0
4,0
6,0
8,0
Q1 2002 Q1 2003 Q1 2004 Q1 2005 Q1 2006 Q1 2007 Q1 2008 Q1 2009
Consumption Investment External Sector GDP Growth Rate
A1.6 Third round effects are related to the accentuated deterioration of public finances and government policy reactions. The sharp fall in revenues during the first semester of 2009 and the aggressive expansionary impulse adopted by the government resulted in the reduction of the primary surplus which decreased to 2.4 percent of GDP in January-June, 2009 from 5.9 percent of GDP in the same period in 2008. In spite of the strong reduction of interest rates that reduced interest payments on public debt that fell to 5.5 percent of GDP in January-June, 2009 from 6.4 percent of GDP in the same period of 2008, the total deficit increased to 3 percent of GDP in January-June, 2009 from 0.5 percent of GDP in the same period in 2008. As a result, net public debt grew from 41 percent in June, 2008 to 43 percent in June, 2009. (see Figure A1.4 below)
Figure A1. 4: Government Fiscal Balances, Debt, Debt Maturity and Composition
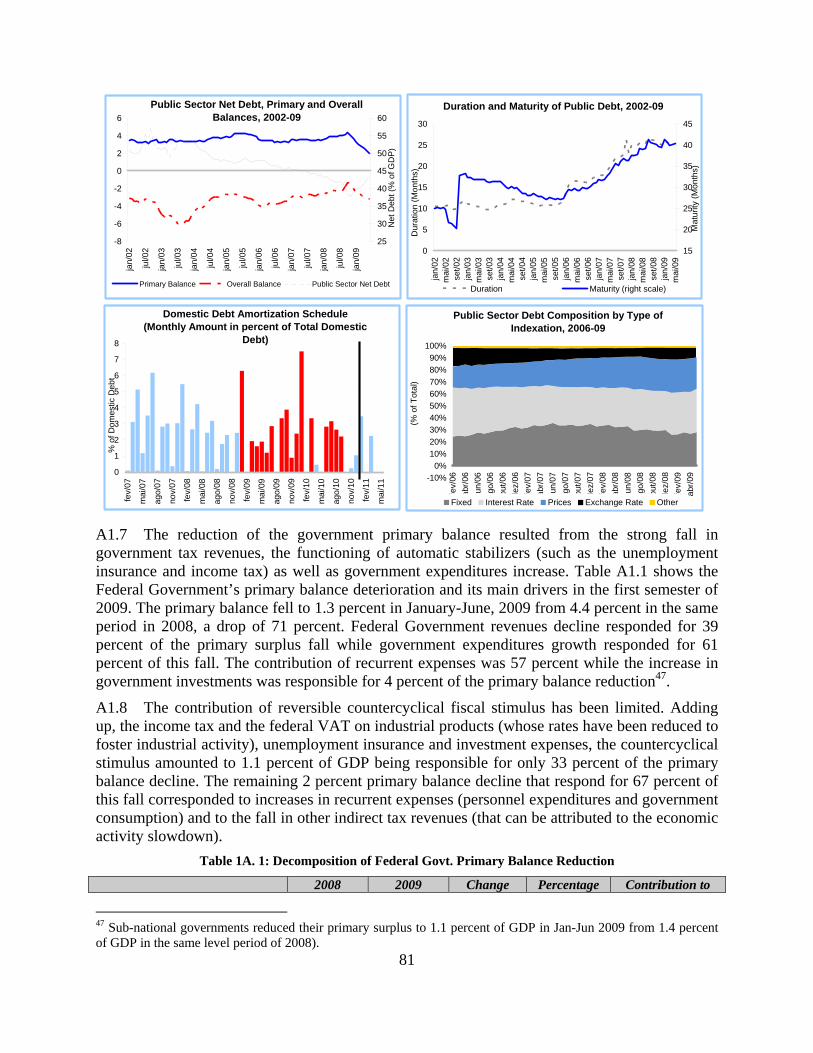
81
Domestic Debt Amortization Schedule(Monthly Amount in percent of Total Domestic
Debt)
0
1
2
3
4
5
6
7
8
fev/
07
mai
/07
ago/
07
nov/
07
fev/
08
mai
/08
ago/
08
nov/
08
fev/
09
mai
/09
ago/
09
nov/
09
fev/
10
mai
/10
ago/
10
nov/
10
fev/
11
mai
/11
% o
f Dom
estic
Deb
t
Public Sector Debt Composition by Type of Indexation, 2006-09
-10%
0%
10%
20%
30%
40%
50%
60%
70%
80%
90%
100%
fev/
06
abr/
06
jun/
06
ago/
06
out/0
6
dez/
06
fev/
07
abr/
07
jun/
07
ago/
07
out/0
7
dez/
07
fev/
08
abr/
08
jun/
08
ago/
08
out/0
8
dez/
08
fev/
09
abr/
09
(% o
f Tot
al)
Fixed Interest Rate Prices Exchange Rate Other
Public Sector Net Debt, Primary and Overall Balances, 2002-09
-8
-6
-4
-2
0
2
4
6ja
n/02
jul/0
2
jan/
03
jul/0
3
jan/
04
jul/0
4
jan/
05
jul/0
5
jan/
06
jul/0
6
jan/
07
jul/0
7
jan/
08
jul/0
8
jan/
09
Net
Deb
t (%
of G
DP
)
25
30
35
40
45
50
55
60
Primary Balance Overall Balance Public Sector Net Debt
Duration and Maturity of Public Debt, 2002-09
0
5
10
15
20
25
30
jan/
02m
ai/0
2se
t/02
jan/
03m
ai/0
3se
t/03
jan/
04m
ai/0
4se
t/04
jan/
05m
ai/0
5se
t/05
jan/
06m
ai/0
6se
t/06
jan/
07m
ai/0
7se
t/07
jan/
08m
ai/0
8se
t/08
jan/
09m
ai/0
9
Dur
atio
n (M
onth
s)
15
20
25
30
35
40
45
Mat
urity
(M
onth
s)
Duration Maturity (right scale)
A1.7 The reduction of the government primary balance resulted from the strong fall in government tax revenues, the functioning of automatic stabilizers (such as the unemployment insurance and income tax) as well as government expenditures increase. Table A1.1 shows the Federal Government’s primary balance deterioration and its main drivers in the first semester of 2009. The primary balance fell to 1.3 percent in January-June, 2009 from 4.4 percent in the same period in 2008, a drop of 71 percent. Federal Government revenues decline responded for 39 percent of the primary surplus fall while government expenditures growth responded for 61 percent of this fall. The contribution of recurrent expenses was 57 percent while the increase in government investments was responsible for 4 percent of the primary balance reduction47.
A1.8 The contribution of reversible countercyclical fiscal stimulus has been limited. Adding up, the income tax and the federal VAT on industrial products (whose rates have been reduced to foster industrial activity), unemployment insurance and investment expenses, the countercyclical stimulus amounted to 1.1 percent of GDP being responsible for only 33 percent of the primary balance decline. The remaining 2 percent primary balance decline that respond for 67 percent of this fall corresponded to increases in recurrent expenses (personnel expenditures and government consumption) and to the fall in other indirect tax revenues (that can be attributed to the economic activity slowdown).
Table 1A. 1: Decomposition of Federal Govt. Primary Balance Reduction
2008 2009 Change Percentage Contribution to
47 Sub-national governments reduced their primary surplus to 1.1 percent of GDP in Jan-Jun 2009 from 1.4 percent of GDP in the same level period of 2008).

82
Jan-Jun Jan-Jun Change the Primary Bal. Reduction
(In % of GDP)
(In % of GDP)
(In % of GDP)
(In %) (In %)
Total Revenue 24.7 23.5 -1.2 -4.9 38.9
Treasury 19.6 18.0 (-1.6) -8.3 51.4
Taxes 9.4 8.7 -0.7 -7.6 22.8 Of which: Income Tax 5.3 5.0 -0.3 -6.2 10.5 Federal VAT-IPI 1.0 0.7 -0.3 -32.9 10.5 Other revenues 10.3 9.4 -0.9 -8.7 28.6 Social Security Contributions 5.3 5.7 0.4 7.2 12.1 Expenditures 20.3 22.2 1.9 9.4 61.1 Current Expenditures 19.6 21.4 1.8 9.1 57.3 Personnel 4.3 5.0 0.7 16.3 22.4 Social Security Benefits 6.6 7.1 0.5
8.3 17.4
Intergovernmental Transfers 4.5 4.4 -0.1 -1.8 2.6 Operating costs 2.9 3.4 0.5 18.0 16.5 Unemployment Insurance 0.5 0.7 0.2 35.8 6.2 Soc. Protection (BPC, LOAS) 0.6 0.7 0.1 13.5 2.4 Subsidies 0.2 0 -0.2 -100 -5.8 Investment Expenditures 0.7 0.8 0.1 17.2 3.9 Primary Balance (4.4) (1.3) (3.1) 70.9 100 Source: STN and Bank Staff Calculations
A1.9 The main instrument of government expansionary stimulus has been increased credit supply from public financial institutions. It is estimated that the quasi-fiscal stimulus through increased lending from public banks reached 3 percent of GDP. In fact, credit by public banks grew 25 percent since September, 2008 while credit form private institutions grew only 3 percent. The expansion of finance from public banks included credit to exporters, for working capital, to the agricultural sector, for housing and for durable goods consumption. As a result, the share of public banks in total outstanding credit grew to 39 percent in June, 2009 from 34 percent in September, 2008. In addition to the expansion of public institutions’ credit supply, government has also stimulated large private banks to increase their participation in the market. In the aftermath of the crisis, government induced large banks to acquire smaller institutions facing liquidity problems. As a result, an increasing role of public banks and a strong concentration in the financial sector have also resulted from the financial turmoil. While the expansionary stimulus by public banks seems to be efficient in restoring credit supply, this stimulus could have pervasive effects on the balance sheet of the public financial institutions and that contingent liabilities may appear in the future.
A1.10 Strong monetary easing, expansion of credit supply from public banks, tax breaks for durables consumption and recovery of commodity prices seem to have smoothed the economic downturn. Furthermore, consistent recovery signals in Q2, 2009 in economic activity,

83
unemployment and labor income indicate that GDP decline in 2009 will be less accentuated than expected and should be followed by a strong acceleration in 2010. Market forecasts for growth in 2009 and 2010 are -0.4 percent and 3.5 percent respectively.
A1.11 Financial markets are also exhibiting a robust recovery. From January to July, 2009 sovereign spreads fell by 42 percent, Ibovespa stock market index grew by 45 percent recovering its pre-crisis levels while the Brazilian Real appreciated 20 percent in 2009. The recovery of commodity prices should be accompanied by exports growth and improvements in the trade balance. Current account deficit in 2009, should be smaller than that observed in 2008 and, given the strong expected GDP growth and the BRL appreciation should worsen in 2010. In 2009, FDI flows have been higher than the current account deficit. The financing of higher current account deficits in the medium term, to a great extent depends on how FDI performs. Nonetheless the solid external position of Brazil and the flexible exchange rate should allow the Brazilian economy to sustain a robust growth rate in the coming years.
A1.12 In this context, two scenarios with growth rates of 0 percent (scenario A) and -1.5 percent (scenario B) in 2009 are presented in A1.2 below. Growth assumptions for 2010 and 2011 are the same and depict a gradual growth recovery to 3.5 percent in 2010 and 4 percent for 2011.
A1.13 In summary, the solid macroeconomic fundamentals built in the last decade have allowed the country to smooth the effects of the financial turmoil with relative speed. Government has been using its enhanced fiscal and external solvency and its credibility to adopt expansionary fiscal and monetary policies. As the more intense effects of the crisis lose force and normality returns, Brazil still faces the same macroeconomic challenges of the pre-crisis period. Furthermore, medium term effects of the crisis and of some policy reactions that have been adopted to weather the effects of the crisis could prejudice country growth.
A1.14 The most important issue is the fiscal agenda. While the fall in the primary surplus should not put at risk fiscal solvency, the irreversible nature of the fiscal stimulus will accentuate the already high expenditure rigidity. With a higher level of recurrent mandatory expenses, fiscal policy options to resume the declining path of indebtedness will be restricted to further increases in taxation and lower levels of investments adversely effecting growth conditions. In addition, the irreversible fiscal stimulus would prejudice long run interest rates and private investments.
A1.15 The resumption of key structural reforms to increase the competitiveness of the country is another challenge that did not change with the crisis. This is the case of credit markets deepening, labor market reform and increasing the openness of the country. In this regard, while the strict regulation of financial markets, the low leverage of financial institutions and the large participation of public banks attenuated the effects of the worldwide credit squeeze, the development of capital markets would require liberalization of credit markets, reduction of public banks’ subsidized credit and increased private sector participation. Similar observations can be applied to reforms in labor markets and openness. The stricter regulation of labor markets could avoid a sharper increase in unemployment while the inherent dynamism and size of domestic markets may have alleviated the economic slump provoked by the financial crisis. Nonetheless, a more flexible labor market and an increased competitiveness in international trade are necessary conditions to mobilize country growth potential.
Table 1A. 2: Macroeconomic Outlook, 2008-2011

84
Indicator 2008 2009 2010 2011 (A) (B) (A) (B) (A) (B)
National Accounts Real GDP Growth (%) 5.1 0.0 -1.5 3.5 3.5 4.0 4.0 Consumption Growth (%) 5.4 3.5 2.5 3.2 3.9 5.4 4.7 Investment Growth (%) 13.8 -6.5 -11.5 4.7 4.7 8.1 8.2 Investment (% of GDP) 19.0 17.7 17.0 17.9 17.2 18.6 17.9 Public sector 3.3 3.8 3.8 3.5 3.5 3.6 3.6 Private sector 15.7 13.9 13.2 14.4 13.7 15.0 14.3 Gross National Savings 16.9 16.3 16.1 16.4 15.7 16.3 16.5
External Sector Trade Balance (US$ bi) 24.8 22.4 28.9 24.2 20.0 11.8 19.0 Current Account Balance (US$ bi) -28.2 -22.3 -13.5 -28.9 -26.1 -44.8 -31.1 Current Account Balance (% of GDP) -1.8 -1.3 -0.8 -1.8 -1.5 -2.7 -2.0 Foreign Direct Investment 45.1 30.0 25.0 35.0 30.0 40.0 40.0 International Reserves (US$ bi) 207 219 220 223 227 234 232 Debt Service to Exports (%) 19.0 18.1 18.0 11.8 12.0 12.9 13.5 Interest Payments to Exports (%) 7.1 4.3 4.3 4.3 4.4 4.1 4.3 Nominal Exchange Rate (eop) 2.3 1.9 1.8 2.09 2.05 2.2 2.2
Public Sector PS. Primary Balance (% of GDP) 4.1 2.0 1.5 3.5 3.2 3.5 3.5 PS. Overall Balance (% of GDP) -1.5 -3.0 -3.4 -1.8 -2.5 -1.5 -1.8 Net Public Sector Debt (% of GDP) 36.0 42.5 44.0 41.0 42.5 39.5 41.0 Gross Gen. Gov. Debt (% of GDP) 58.6 64.0 65.5 62.2 63.6 61.2 62.5
Prices and Economic Activity Consumer Inflation (%) 5.9 4.4 4.0 4.5 4.5 4.5 4.5 Wholesale Inflation (%) 9.1 3.0 2.5 4.5 4.5 4.5 4.5 Headline Interest Rate (% eop) 13.8 8.8 8.8 8.5 8.5 9.0 9.0 Unemployment (%) 7.9 8.5 9.0 8.2 8.7 8.0 8.5 Industrial Cap. Utilization (%) 82.6 78.5 76.6 79.5 79.0 81.5 80.5
Source: IMF, BCB, IBGE, Bank Staff Calculation

85
AN
NE
X 2
: O
PE
RA
TIO
N P
OL
ICY
MA
TR
IX:
Ala
goas
- F
isca
l an
d P
ub
lic
Sec
tor
Ref
orm
s D
PL
48
Ob
ject
ives
K
ey o
bst
acle
s to
ach
ievi
ng
thos
e ob
ject
ives
A
ctio
ns
Com
ple
ted
(F
irst
Tra
nch
e)
Act
ion
s T
o B
e C
omp
lete
d (S
econ
d t
ran
che)
1. C
onso
lid
atin
g th
e F
isca
l Ad
just
men
t
1.1
Fis
cal B
alan
ces
Ach
ieve
long
run
fis
cal s
usta
inab
ility
.
Cre
ate
fisc
al s
pace
for
pub
lic
inve
stm
ents
to
assu
re f
inan
cing
for
pub
lic s
ervi
ces
deliv
ery.
Pri
mar
y ba
lanc
es lo
wer
than
req
uire
d to
gu
aran
tee
a de
clin
ing
path
of
stat
e de
bt.
Low
gro
ss o
pera
ting
bala
nces
res
ults
on
redu
ced
fisc
al s
pace
for
sta
te in
vest
men
ts.
a. A
chie
vem
ent o
f the
targ
ets
for
prim
ary
surp
lus,
fina
ncia
l deb
t to
net r
eal r
even
ue
ratio
, ow
n re
venu
e co
llect
ion
and
pers
onne
l ex
pend
iture
s to
net
cur
rent
rev
enue
rat
io in
20
07 a
nd 2
008
defin
ed in
the
Pro
gram
of
Fis
cal A
djus
tmen
t (P
AF
) ag
reed
wit
h th
e N
atio
nal T
reas
ury
Secr
etar
iat (
STN
) fo
r th
e pe
riod
200
7-09
.
b. I
ncre
ased
gro
ss o
pera
ting
bala
nces
from
R
$467
mill
ion
in 2
006
to R
$670
mill
ion
in
2007
and
R$7
36 m
illio
n in
200
8.
a. A
chie
vem
ent o
f the
targ
ets
for
prim
ary
surp
lus,
fina
ncia
l deb
t to
net r
eal r
even
ue
ratio
, ow
n re
venu
e co
llect
ion
and
pers
onne
l ex
pend
iture
s to
net
cur
rent
rev
enue
rat
io in
20
09 d
efin
ed in
the
Pro
gram
of F
isca
l A
djus
tmen
t (P
AF
) ag
reed
with
the
Nat
iona
l T
reas
ury
Secr
etar
iat (
STN
) fo
r th
e pe
riod
20
08-1
0.
1. M
ain
tain
goo
d f
isca
l sta
tus
un
der
th
e B
razi
l’s
Fis
cal R
esp
onsi
bil
ity
Law
.
b. G
ross
ope
ratin
g ba
lanc
e of
at l
east
R$6
00
mill
ion
in 2
009.
1.2
Rev
enu
e
Impr
ove
tax
reve
nue
perf
orm
ance
to
supp
ort f
isca
l adj
ustm
ent e
ffor
t in
a co
ntex
t of
str
ong
expe
nditu
re r
igid
ity.
Incr
ease
the
fisc
al s
pace
for
inve
stm
ent.
Thr
ough
the
incr
ease
in o
wn
reso
urce
s.
Wea
k pe
rfor
man
ce o
f st
ate
own
reve
nues
.
Wea
k m
anag
emen
t and
out
date
d m
etho
ds o
f ta
x ad
min
istr
atio
n.
Ach
ieve
men
t of
PAF
targ
et f
or o
wn
reve
nue
coll
ecti
on (
see
Fis
cal A
djus
tmen
t, lin
e 1.
1 ab
ove)
.
1. A
dopt
ion
of a
sys
tem
aim
ed a
t ac
hie
ving
G
oA’s
rev
enu
e co
llec
tion
tar
gets
th
rou
gh
the
esta
bli
shm
ent
of a
n in
tegr
ated
dat
a b
ase
(Ges
tão
Mat
rici
al d
a R
ecei
ta -
GM
R)
to
faci
litat
e th
e id
enti
fica
tion
of
tax
evas
ion
an
d t
he
esta
blis
hm
ent
of a
rem
un
erat
ion
sc
hed
ule
for
th
e st
aff
of t
he
Sec
reta
riat
of
Fin
ance
(S
EF
AZ
) li
nk
ed t
o sp
ecif
ic t
ax
coll
ecti
on t
arge
ts.
Ach
ieve
men
t of
PAF
targ
et f
or o
wn
reve
nue
coll
ecti
on (
see
Fis
cal A
djus
tmen
t, li
ne 1
.1
abov
e).
c. M
aint
ain
syst
em o
f dat
a ba
se in
tegr
atio
n fo
r th
e co
llect
ion
of I
CM
S an
d re
new
the
resu
lt b
ased
con
trac
t wit
h SE
FA
Z.
48
. P
rior
act
ions
and
sec
ond
tran
che
cond
ition
s (l
egal
con
ditio
ns f
or d
isbu
rsem
ent)
are
ord
ered
by
num
bers
and
are
in
bol
d. B
ench
mar
ks (
prog
ress
mar
kers
of
impl
emen
tati
on)
are
orde
red
by le
tter
s an
d ar
e in
ital
ic.

86
Ob
ject
ives
K
ey o
bst
acle
s to
ach
ievi
ng
thos
e ob
ject
ives
A
ctio
ns
Com
ple
ted
(F
irst
Tra
nch
e)
Act
ion
s T
o B
e C
omp
lete
d (S
econ
d t
ran
che)
1.3
Exp
end
itur
es
Red
uce
the
pres
sure
of
pers
onne
l and
oth
er
recu
rren
t exp
endi
ture
s on
sta
te f
inan
ces.
Impr
ove
stat
e ex
pend
iture
com
posi
tion
in
favo
r of
inve
stm
ent.
Wag
e bi
ll in
flat
ed b
y in
accu
rate
rec
ords
on
staf
fing
, ina
ccur
ate
wag
e ca
lcul
atio
ns;
poss
ible
ove
rsta
ffin
g an
d ex
cess
ive
sala
ries
(i
n so
me
sect
ors
and
grad
es).
Fed
eral
legi
slat
ion
impe
des
staf
f re
duct
ions
, fo
rbid
s re
duct
ions
in n
omin
al s
alar
ies.
Inef
fici
ent p
rocu
rem
ent s
yste
m c
hara
cter
ized
by
slo
wne
ss o
f pr
ocur
emen
t pro
cess
es a
nd
lim
ited
use
of
elec
tron
ic a
ucti
on a
nd
elec
tron
ic p
rice
reg
istr
atio
n.
Ach
ieve
men
t of
PAF
targ
et f
or p
erso
nnel
ex
pend
iture
s to
net
cur
rent
rev
enue
(se
e F
isca
l A
djus
tmen
t, li
ne 1
.1 a
bove
).
Com
plet
ion
of c
ensu
s an
d au
dit o
f pe
rson
nel
reco
rds
(see
Hum
an R
esou
rce
Man
agem
ent,
line
2.1,
bel
ow).
2. I
ntr
odu
ctio
n o
f a
seri
es o
f re
form
s ai
med
at
mod
ern
izin
g th
e B
orro
wer
’s p
ub
lic
pro
cure
men
t sy
stem
, in
clu
din
g th
e im
ple
men
tati
on o
f an
ele
ctro
nic
pri
ce
regi
stra
tion
sys
tem
for
th
e p
urc
has
ing
of
635
item
s d
uri
ng
2008
and
th
e es
tab
lish
men
t of
tim
e li
mit
s to
com
ple
te
each
pro
ced
ure
un
der
sai
d s
yste
m
Ach
ieve
men
t of
PAF
targ
et f
or p
erso
nnel
ex
pend
iture
s to
net
cur
rent
rev
enue
(se
e F
isca
l Adj
ustm
ent,
line
1.1
abo
ve).
Com
plet
ion
and
impl
emen
tati
on o
f au
dit o
f pe
rson
nel r
ecor
ds (
See
Hum
an R
esou
rce
Man
agem
ent,
line
2., b
elow
).
d. I
ncre
ase
to 1
,000
the
item
s to
be
purc
hase
d th
roug
h el
ectr
onic
pri
ce
regi
stra
tion
.
e. R
educ
e to
60
days
the
proc
essi
ng ti
me
for
the
elec
tron
ic r
ever
se a
ucti
on a
nd p
rice
re
gist
ratio
n pr
oced
ures
.
2. I
mp
rovi
ng
Hu
man
Res
ourc
es M
anag
emen
t
2.1
Info
rmat
ion
Sys
tem
an
d
Man
agem
ent
of t
he
Pay
roll
Gen
erat
e an
d m
aint
ain
relia
ble
info
rmat
ion
on p
ublic
per
sonn
el –
incl
udin
g sa
lari
es a
nd
bene
fits
– in
ord
er to
impo
se e
ffec
tive
cont
rol o
ver
the
payr
oll.
Ass
ure
relia
bilit
y of
info
rmat
ion
and
its
proc
essi
ng.
Cor
rect
fra
uds
and
mis
take
s on
the
stat
e pa
yrol
l.
Lac
k of
rel
iabl
e in
form
atio
n on
num
ber
of
publ
ic s
erva
nts,
pen
sion
ers
and
surv
ivor
s.
Wea
k in
form
atio
n te
chno
logi
cal s
yste
ms
for
payr
oll.
3. T
he
com
ple
tion
of
the
Cen
sus
of t
he
civi
l se
rvic
e st
aff
and
th
e ca
rryi
ng
out
of
rem
edia
l mea
sure
s, in
clu
din
g th
e el
imin
atio
n of
abo
ut 4
50 s
taff
fro
m t
he
regi
stry
of
acti
ve p
ublic
ser
van
ts.
4. L
aunc
hin
g th
e au
dit
of
the
stat
e pa
yrol
l in
clu
din
g co
mp
ensa
tion
for
act
ive
emp
loye
es a
nd p
ensi
oner
s an
d s
urv
ivor
s b
enef
its
wh
ich
incl
ud
es t
he
con
trac
t w
ith
the
aud
itin
g fi
rm, t
he
app
rova
l of
its
wor
kin
g p
lan
an
d f
irst
pro
gres
s re
por
t co
nfi
rmin
g th
e co
ncl
usi
on o
f th
e A
ud
it f
irst
p
has
e.
c. P
urch
ase
of a
new
Hum
an R
esou
rce
Syst
em
that
sho
uld
man
age
the
payr
oll o
f act
ives
em
ploy
ees,
pen
sion
ers
and
surv
ivor
s.
2. C
omp
leti
on o
f th
e pa
yrol
l aud
it a
nd
imp
lem
enta
tion
of
rem
edia
l leg
al,
adm
inis
trat
ive
and
acc
ount
ing
mea
sure
s.
f. N
ew H
uman
Res
ourc
e Sy
stem
fully
op
erat
iona
l and
cov
erin
g th
e pa
yrol
l of
activ
e em
ploy
ees,
pen
sion
ers
and
surv
ivor
s.
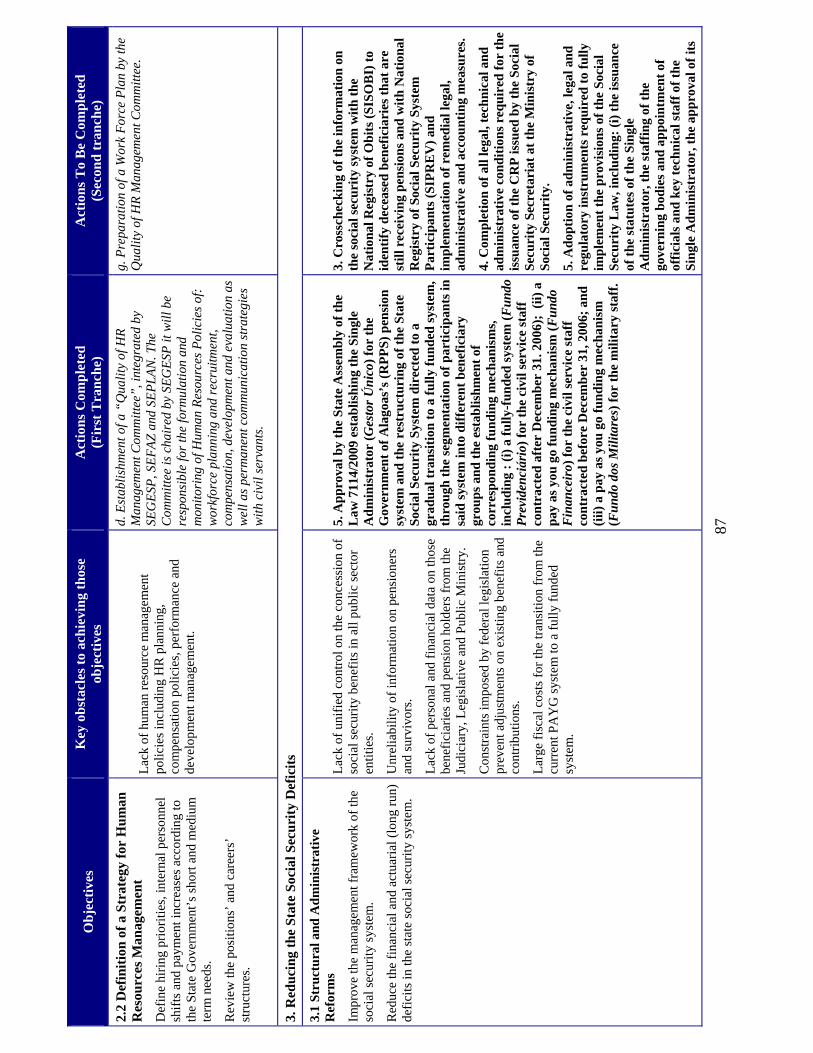
87
Ob
ject
ives
K
ey o
bst
acle
s to
ach
ievi
ng
thos
e ob
ject
ives
A
ctio
ns
Com
ple
ted
(F
irst
Tra
nch
e)
Act
ion
s T
o B
e C
omp
lete
d (S
econ
d t
ran
che)
2.2
Def
init
ion
of a
Str
ateg
y fo
r H
um
an
Res
ourc
es M
anag
emen
t
Def
ine
hiri
ng p
rior
itie
s, in
tern
al p
erso
nnel
sh
ifts
and
pay
men
t inc
reas
es a
ccor
ding
to
the
Sta
te G
over
nmen
t’s
shor
t and
med
ium
te
rm n
eeds
.
Rev
iew
the
posi
tion
s’ a
nd c
aree
rs’
stru
ctur
es.
Lac
k of
hum
an r
esou
rce
man
agem
ent
polic
ies
incl
udin
g H
R p
lann
ing,
co
mpe
nsat
ion
polic
ies,
per
form
ance
and
de
velo
pmen
t man
agem
ent.
d. E
stab
lishm
ent o
f a “
Qua
lity
of H
R
Man
agem
ent C
omm
ittee
”, i
nteg
rate
d by
SE
GE
SP, S
EF
AZ
and
SE
PL
AN
. The
C
omm
ittee
is c
hair
ed b
y SE
GE
SP it
will
be
resp
onsi
ble
for
the
form
ulat
ion
and
mon
itori
ng o
f Hum
an R
esou
rces
Pol
icie
s of
: w
orkf
orce
pla
nnin
g an
d re
crui
tmen
t, co
mpe
nsat
ion,
dev
elop
men
t and
eva
luat
ion
as
wel
l as
perm
anen
t com
mun
icat
ion
stra
tegi
es
with
civ
il se
rvan
ts.
g. P
repa
ratio
n of
a W
ork
For
ce P
lan
by th
e Q
uali
ty o
f HR
Man
agem
ent C
omm
itte
e.
3. R
edu
cin
g th
e S
tate
Soc
ial S
ecu
rity
Def
icit
s
3.1
Stru
ctu
ral a
nd A
dm
inis
trat
ive
Ref
orm
s
Impr
ove
the
man
agem
ent f
ram
ewor
k of
the
soci
al s
ecur
ity
syst
em.
Red
uce
the
fina
ncia
l and
act
uari
al (
long
run
) de
fici
ts in
the
stat
e so
cial
sec
urit
y sy
stem
.
Lac
k of
uni
fied
con
trol
on
the
conc
essi
on o
f so
cial
sec
urit
y be
nefi
ts in
all
pub
lic
sect
or
enti
ties
.
Unr
elia
bilit
y of
info
rmat
ion
on p
ensi
oner
s an
d su
rviv
ors.
Lac
k of
per
sona
l and
fin
anci
al d
ata
on th
ose
bene
fici
arie
s an
d pe
nsio
n ho
lder
s fr
om th
e Ju
dici
ary,
Leg
isla
tive
and
Pub
lic M
inis
try.
Con
stra
ints
impo
sed
by f
eder
al le
gisl
atio
n pr
even
t adj
ustm
ents
on
exis
ting
bene
fits
and
co
ntri
butio
ns.
Lar
ge f
isca
l cos
ts f
or th
e tr
ansi
tion
fro
m th
e cu
rren
t PA
YG
sys
tem
to a
ful
ly f
unde
d sy
stem
.
5. A
ppro
val b
y th
e St
ate
Ass
emb
ly o
f th
e L
aw 7
114/
2009
est
ablis
hin
g th
e S
ingl
e A
dm
inis
trat
or (
Ges
tor
Ún
ico)
for
th
e G
over
nm
ent
of A
lago
as’s
(R
PP
S)
pen
sion
sy
stem
an
d t
he
rest
ruct
uri
ng
of t
he
Sta
te
Soc
ial S
ecu
rity
Sys
tem
dir
ecte
d t
o a
grad
ual t
ran
siti
on t
o a
full
y fu
nd
ed s
yste
m,
thro
ugh
th
e se
gmen
tati
on o
f p
arti
cip
ants
in
said
sys
tem
into
dif
fere
nt
ben
efic
iary
gr
oup
s an
d t
he e
stab
lish
men
t of
co
rres
pond
ing
fun
din
g m
ech
anis
ms,
in
clu
din
g :
(i)
a fu
lly-
fun
ded
sys
tem
(F
un
do
Pre
vide
nci
ário
) fo
r th
e ci
vil s
ervi
ce s
taff
co
ntr
acte
d a
fter
Dec
emb
er 3
1. 2
006)
; (
ii)
a p
ay a
s yo
u g
o fu
nd
ing
mec
han
ism
(F
undo
F
inan
ceir
o) f
or t
he
civi
l ser
vice
sta
ff
con
trac
ted
bef
ore
Dec
emb
er 3
1, 2
006;
an
d
(iii
) a
pay
as
you
go
fun
din
g m
ech
anis
m
(Fu
ndo
dos
Mili
tare
s) f
or t
he
mili
tary
sta
ff.
3. C
ross
chec
kin
g of
th
e in
form
atio
n o
n th
e so
cial
sec
uri
ty s
yste
m w
ith
th
e N
atio
nal R
egis
try
of O
bit
s (S
ISO
BI)
to
iden
tify
dec
ease
d b
enef
icia
ries
th
at a
re
stil
l rec
eivi
ng
pen
sion
s an
d w
ith
Nat
ion
al
Reg
istr
y of
Soc
ial S
ecu
rity
Sys
tem
P
arti
cip
ants
(S
IPR
EV
) an
d
imp
lem
enta
tion
of
rem
edia
l leg
al,
adm
inis
trat
ive
and
acc
ount
ing
mea
sure
s.
4. C
omp
leti
on o
f al
l leg
al, t
ech
nic
al a
nd
adm
inis
trat
ive
con
dit
ion
s re
qu
ired
for
th
e is
suan
ce o
f th
e C
RP
issu
ed b
y th
e S
ocia
l S
ecu
rity
Sec
reta
riat
at
the
Min
istr
y of
S
ocia
l Sec
uri
ty.
5. A
dopt
ion
of a
dm
inis
trat
ive,
lega
l an
d
regu
lato
ry in
stru
men
ts r
equ
ired
to
full
y im
ple
men
t th
e p
rovi
sion
s of
th
e S
ocia
l S
ecu
rity
Law
, in
clu
din
g: (
i) t
he
issu
ance
of
th
e st
atu
tes
of t
he
Sin
gle
Ad
min
istr
ator
, th
e st
affi
ng
of t
he
gove
rnin
g b
odie
s an
d ap
poin
tmen
t of
of
fici
als
and
key
tech
nic
al s
taff
of
the
Sin
gle
Ad
min
istr
ator
, th
e ap
pro
val o
f it
s

88
Ob
ject
ives
K
ey o
bst
acle
s to
ach
ievi
ng
thos
e ob
ject
ives
A
ctio
ns
Com
ple
ted
(F
irst
Tra
nch
e)
Act
ion
s T
o B
e C
omp
lete
d (S
econ
d t
ran
che)
fin
anci
ng
pla
n; (
ii)
the
segr
egat
ion
of
the
thre
e fu
nd
ing
and
th
e (i
ii)
the
cap
ital
izat
ion
of
the
fun
din
g of
an
am
ount
of
at
leas
t R
$122
.5 m
illio
n in
201
0.
h. U
phol
ding
of
the
Cer
tific
ate
of S
ocia
l Se
curi
ty R
egul
arity
(C
ertif
icad
o de
R
egul
arid
ade
Pre
vide
nciá
ria
– C
RP
).
3.2
Par
amet
ric
Ref
orm
s
App
ly e
xist
ing
fede
ral r
ules
for
the
calc
ulat
ion
of b
enef
its a
nd c
ontr
ibut
ions
.
Lac
k of
str
ong
link
betw
een
lifet
ime
cont
ribu
tions
and
pen
sion
ben
efits
.
Cor
pora
tive
inte
rest
s av
oid
the
com
plia
nce
with
the
rule
s es
tabl
ishe
d in
the
fede
ral
legi
slat
ion.
e. G
over
nmen
t has
iden
tifie
d la
ck o
f co
mpl
ianc
e of
fede
ral s
ocia
l sec
urit
y le
gisl
atio
n as
per
pre
lim
inar
y re
sult
s of
the
payr
oll a
udit
for
pens
ione
rs a
nd s
urvi
vors
an
d is
taki
ng fi
st s
teps
to r
evis
e be
nefit
s gr
ante
d in
the
last
yea
r.
6. A
pp
lica
tion
of
fed
eral
soc
ial s
ecu
rity
le
gisl
atio
n in
clu
din
g: (
a) p
ubli
c se
ctor
en
titi
es s
hou
ld p
ay 1
00 p
erce
nt
of
surv
ivor
s b
enef
its
up
to
the
RG
PS
cei
lin
g p
lus
70 p
erce
nt
of t
he
valu
e th
at e
xcee
d
this
cei
ling
(Art
. 40.
7.1
of t
he
Con
stit
uti
onal
Am
end
men
t 41
); (
b) p
ub
lic
enti
ties
sh
ould
cal
cula
te p
ensi
ons
usi
ng
the
aver
age
of t
he
180
pre
viou
s sa
lari
es
bef
ore
reti
rem
ent
and
not
an
ymor
e th
e ex
it s
alar
y (A
rt. 4
0.3
of t
he
Con
stit
uti
onal
A
men
dm
ent
41);
(c)
pu
bli
c en
titi
es n
eed
to
use
sp
ecif
ic s
ocia
l sec
uri
ty e
xem
pti
ons
legi
slat
ion
s to
be
app
lied
to
pen
sion
ers
and
su
rviv
ors
con
trib
uti
ons
in e
xces
s to
th
e R
GP
S c
eili
ng
and
not
th
e le
gisl
atio
n
use
d b
y th
e in
com
e ta
x le
gisl
atio
n (
Art
. 40
.21
of t
he
Con
stit
utio
nal A
men
dmen
t 41
).
4. S
tren
gth
enin
g P
ub
lic
Sec
tor
Man
agem
ent
4.1
Str
engt
hen
ing
the
Pro
cess
of
Bu
dge
t E
lab
orat
ion
an
d E
xecu
tion
Pro
vide
tool
s an
d m
etho
ds f
or b
ette
r de
sign
an
d im
plem
enta
tion
of s
tate
pub
lic p
olic
ies.
Wea
k in
stitu
tiona
l fra
mew
ork
defi
ning
the
allo
catio
n of
res
pons
ibili
ties
for
the
cent
ral
and
sect
oral
sec
reta
ries
for
pla
nnin
g an
d
6. A
pp
rova
l of
an a
ctio
n p
lan
det
ailin
g th
e m
easu
res
req
uir
ed f
or t
he
imp
rove
men
t of
th
e B
orro
wer
’s c
apab
iliti
es f
or b
ud
get
7. S
atis
fact
ory
imp
lem
enta
tion
of
the
Act
ion
Pla
n t
o im
pro
ve p
lann
ing,
b
udg
etar
y, f
inan
cial
man
agem
ent
and

89
Ob
ject
ives
K
ey o
bst
acle
s to
ach
ievi
ng
thos
e ob
ject
ives
A
ctio
ns
Com
ple
ted
(F
irst
Tra
nch
e)
Act
ion
s T
o B
e C
omp
lete
d (S
econ
d t
ran
che)
budg
etin
g.
Poo
r pl
anni
ng a
nd b
udge
ting
coor
dina
tion;
Lac
k of
man
ual o
f in
stru
ctio
ns a
nd
chro
nogr
am o
f ac
tivi
ties
for
the
prep
arat
ion
of m
ulti
-ann
ual p
lan
(PP
A)
and
annu
al
budg
et la
ws
(LO
As)
.
Lac
k of
cre
dibi
lity
of b
udge
t du
e to
the
abse
nce
of m
acro
-fis
cal p
rogr
amm
ing
and
budg
et c
eilin
gs a
nd lo
w p
redi
ctab
ility
on
reso
urce
ava
ilabi
lity.
form
ula
tion
an
d f
inan
cial
exe
cuti
on,
incl
ud
ing
the
esta
bli
shm
ent
of a
tas
k f
orce
(G
rupo
Ges
tor)
res
pon
sib
le f
or t
he
imp
lem
enta
tion
of
the
acti
on p
lan
.
g. I
nclu
sion
of a
rtic
les
in th
e B
udge
tary
G
uide
lines
Law
(L
DO
) fo
r 20
09-1
1 to
si
mpl
ify b
udge
t cla
ssifi
catio
n al
low
mor
e fle
xibi
lity
on b
udge
t rea
lloca
tion
and
set
budg
et c
eili
ngs
by s
ecre
tari
ats
in L
OA
201
0.
inte
rnal
con
trol
sys
tem
s. T
he
crit
eria
for
sa
tisf
acto
ry im
ple
men
tati
on w
ould
be
the
imp
lem
enta
tion
of
at le
ast
5 ou
t of
th
e 9
acti
ons
incl
uded
in t
he
Act
ion
Pla
n.
4.2
Intr
odu
ce R
esu
lts
Bas
ed
Man
agem
ent
and
Str
engt
hen
Str
ateg
ic
Inve
stm
ents
Pro
vide
tool
s to
ens
ure
that
the
stat
e de
live
rs
resu
lts
in a
n ef
fici
ent a
nd e
ffec
tive
way
.
Ens
ure
that
pub
lic in
vest
men
ts a
re d
eliv
ered
by
eff
icie
nt a
lloc
atio
n an
d m
aint
enan
ce o
f fi
scal
equ
ilib
rium
.
Lac
k of
foc
us in
gov
ernm
enta
l pro
gram
s an
d pr
ojec
ts.
Wea
k m
anag
emen
t of
gove
rnm
ent
inve
stm
ent p
rogr
ams.
Lac
k of
tool
s to
res
ults
bas
ed m
anag
emen
t.
7. E
stab
lish
men
t an
d st
affi
ng
of t
he
Pro
ject
M
anag
emen
t O
ffic
e at
th
e S
ecre
tary
of
Pla
nn
ing
(SE
PL
AN
) re
spon
sib
le f
or t
he
def
init
ion
of
rule
s go
vern
ing
the
exec
uti
on
of t
he
port
folio
of
pri
orit
y pr
ojec
ts a
nd f
or
thei
r an
d t
hei
r m
onit
orin
g.
h. S
elec
tion
of a
Por
tfolio
of P
rior
ity
Pro
gram
s, is
suan
ce o
f an
oper
atio
nal m
anua
l fo
r th
eir
man
agem
ent a
nd a
ppoi
ntm
ent o
f th
eir
man
ager
s.
8. A
ppro
val b
y th
e St
ate
Ass
emb
ly o
f an
am
end
men
t to
th
e M
ult
i-Y
ear
Pla
n 2
008-
11,
incl
ud
ing
the
Sta
te p
rior
ity
pro
gram
s “S
tren
gth
enin
g of
Pu
blic
Man
agem
ent”
an
d “
Str
engt
hen
ing
of P
lan
nin
g” w
ith
a
bu
dge
t al
loca
tion
of
R$7
.8 m
illio
n a
nd
R$7
.2 m
illi
on, r
esp
ecti
vely
.
8. S
atis
fact
ory
imp
lem
enta
tion
of
the
Sta
te p
rior
ity
pro
gram
s “S
tren
gth
enin
g of
P
ub
lic
Man
agem
ent”
an
d “
Str
engt
hen
ing
Pla
nn
ing”
. Th
e cr
iter
ia f
or s
atis
fact
ory
imp
lem
enta
tion
wou
ld b
e th
e go
vern
men
t ex
pen
dit
ure
of
at le
ast
R$5
mill
ion
of
com
mit
ted
exp
end
itu
res
(or
30 p
erce
nt
of
bu
dge
t al
loca
tion
s) in
th
ese
pro
gram
s.
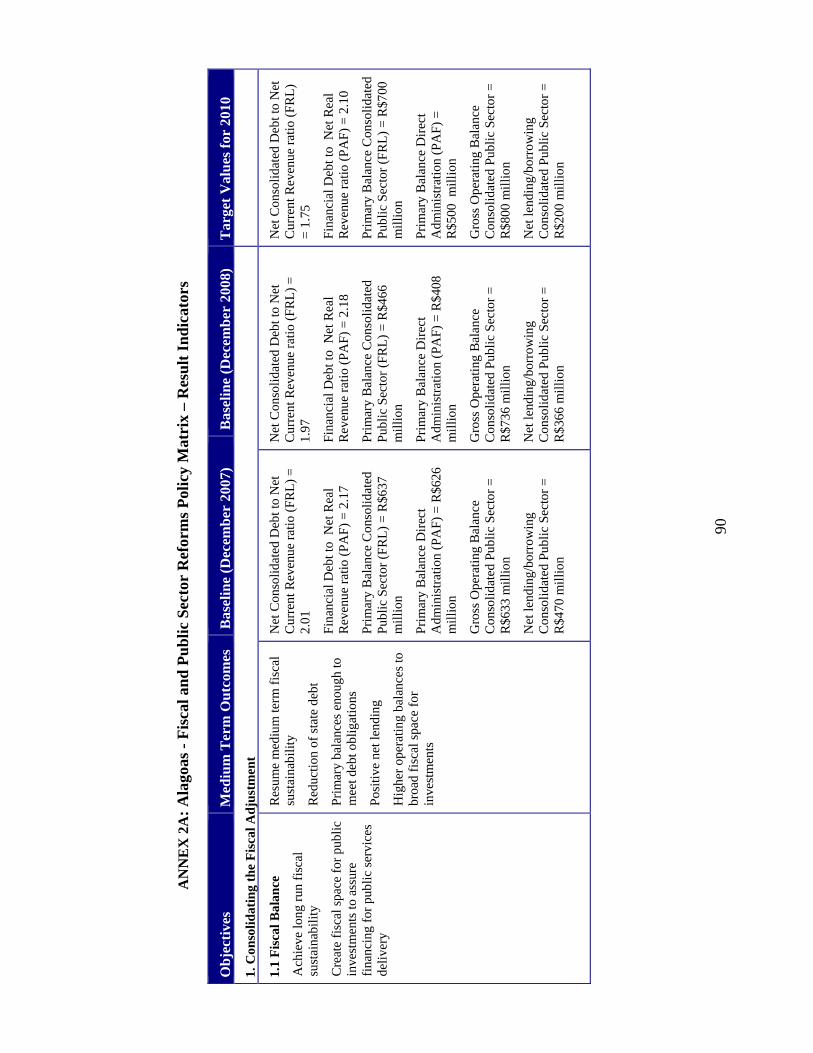
90
A
NN
EX
2A
: A
lago
as -
Fis
cal a
nd
Pu
bli
c S
ecto
r R
efor
ms
Pol
icy
Mat
rix
– R
esu
lt I
nd
icat
ors
Pol
icy
Mat
rix
- R
e
Ob
ject
ives
M
ediu
m T
erm
Ou
tcom
es
Bas
elin
e (D
ecem
ber
200
7)
Bas
elin
e (D
ecem
ber
200
8)
Tar
get
Val
ues
for
201
0
1. C
onso
lidat
ing
the
Fis
cal A
dju
stm
ent
1.1
Fis
cal B
alan
ce
Ach
ieve
long
run
fis
cal
sust
aina
bilit
y
Cre
ate
fisc
al s
pace
for
pub
lic
inve
stm
ents
to a
ssur
e fi
nanc
ing
for
publ
ic s
ervi
ces
deli
very
Res
ume
med
ium
term
fis
cal
sust
aina
bilit
y
Red
uctio
n of
sta
te d
ebt
Pri
mar
y ba
lanc
es e
noug
h to
m
eet d
ebt o
blig
atio
ns
Pos
itive
net
lend
ing
Hig
her
oper
atin
g ba
lanc
es to
br
oad
fisc
al s
pace
for
in
vest
men
ts
Net
Con
solid
ated
Deb
t to
Net
C
urre
nt R
even
ue r
atio
(F
RL
) =
2.
01
Fin
anci
al D
ebt t
o N
et R
eal
Rev
enue
rat
io (
PA
F)
= 2
.17
Pri
mar
y B
alan
ce C
onso
lidat
ed
Pub
lic S
ecto
r (F
RL
) =
R$6
37
mil
lion
Pri
mar
y B
alan
ce D
irec
t A
dmin
istr
atio
n (P
AF)
= R
$626
m
illio
n
Gro
ss O
pera
ting
Bal
ance
C
onso
lidat
ed P
ublic
Sec
tor
=
R$6
33 m
illio
n
Net
lend
ing/
borr
owin
g C
onso
lidat
ed P
ublic
Sec
tor
=
R$4
70 m
illio
n
Net
Con
solid
ated
Deb
t to
Net
C
urre
nt R
even
ue r
atio
(F
RL
) =
1.
97
Fin
anci
al D
ebt t
o N
et R
eal
Rev
enue
rat
io (
PA
F)
= 2
.18
Pri
mar
y B
alan
ce C
onso
lidat
ed
Pub
lic S
ecto
r (F
RL
) =
R$4
66
mil
lion
Pri
mar
y B
alan
ce D
irec
t A
dmin
istr
atio
n (P
AF)
= R
$408
m
illio
n
Gro
ss O
pera
ting
Bal
ance
C
onso
lidat
ed P
ublic
Sec
tor
=
R$7
36 m
illio
n
Net
lend
ing/
borr
owin
g C
onso
lidat
ed P
ublic
Sec
tor
=
R$3
66 m
illio
n
Net
Con
solid
ated
Deb
t to
Net
C
urre
nt R
even
ue r
atio
(F
RL
) =
1.7
5
Fin
anci
al D
ebt t
o N
et R
eal
Rev
enue
rat
io (
PA
F)
= 2
.10
Pri
mar
y B
alan
ce C
onso
lidat
ed
Pub
lic S
ecto
r (F
RL
) =
R$7
00
mil
lion
Pri
mar
y B
alan
ce D
irec
t A
dmin
istr
atio
n (P
AF)
=
R$5
00 m
illio
n
Gro
ss O
pera
ting
Bal
ance
C
onso
lidat
ed P
ublic
Sec
tor
=
R$8
00 m
illio
n
Net
lend
ing/
borr
owin
g C
onso
lidat
ed P
ublic
Sec
tor
=
R$2
00 m
illio
n
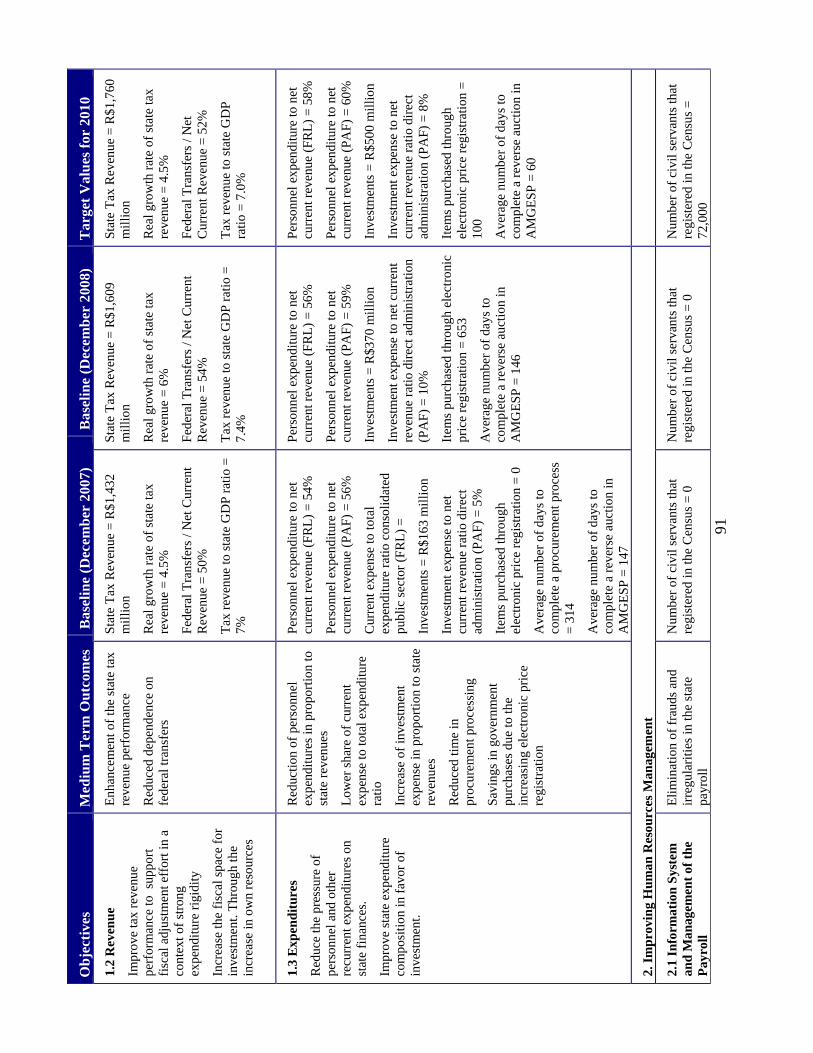
91
Ob
ject
ives
M
ediu
m T
erm
Ou
tcom
es
Bas
elin
e (D
ecem
ber
200
7)
Bas
elin
e (D
ecem
ber
200
8)
Tar
get
Val
ues
for
201
0
1.2
Rev
enu
e
Impr
ove
tax
reve
nue
perf
orm
ance
to s
uppo
rt
fisc
al a
djus
tmen
t eff
ort i
n a
cont
ext o
f st
rong
ex
pend
iture
rig
idity
Incr
ease
the
fisc
al s
pace
for
in
vest
men
t. T
hrou
gh th
e in
crea
se in
ow
n re
sour
ces
Enh
ance
men
t of
the
stat
e ta
x re
venu
e pe
rfor
man
ce
Red
uced
dep
ende
nce
on
fede
ral t
rans
fers
Sta
te T
ax R
even
ue =
R$1
,432
m
illio
n
Rea
l gro
wth
rat
e of
sta
te ta
x re
venu
e =
4.5
%
Fed
eral
Tra
nsfe
rs /
Net
Cur
rent
R
even
ue =
50%
Tax
rev
enue
to s
tate
GD
P r
atio
=
7%
Sta
te T
ax R
even
ue =
R$1
,609
m
illio
n
Rea
l gro
wth
rat
e of
sta
te ta
x re
venu
e =
6%
Fed
eral
Tra
nsfe
rs /
Net
Cur
rent
R
even
ue =
54%
Tax
rev
enue
to s
tate
GD
P r
atio
=
7.4%
Sta
te T
ax R
even
ue =
R$1
,760
m
illio
n
Rea
l gro
wth
rat
e of
sta
te ta
x re
venu
e =
4.5
%
Fed
eral
Tra
nsfe
rs /
Net
C
urre
nt R
even
ue =
52%
Tax
rev
enue
to s
tate
GD
P
ratio
= 7
.0%
1.3
Exp
end
itur
es
Red
uce
the
pres
sure
of
pers
onne
l and
oth
er
recu
rren
t exp
endi
ture
s on
st
ate
fina
nces
.
Impr
ove
stat
e ex
pend
iture
co
mpo
sitio
n in
fav
or o
f in
vest
men
t.
Red
uctio
n of
per
sonn
el
expe
nditu
res
in p
ropo
rtio
n to
st
ate
reve
nues
Low
er s
hare
of
curr
ent
expe
nse
to to
tal e
xpen
ditu
re
rati
o
Incr
ease
of
inve
stm
ent
expe
nse
in p
ropo
rtio
n to
sta
te
reve
nues
Red
uced
tim
e in
pr
ocur
emen
t pro
cess
ing
Savi
ngs
in g
over
nmen
t pu
rcha
ses
due
to th
e in
crea
sing
ele
ctro
nic
pric
e re
gist
rati
on
Per
sonn
el e
xpen
ditu
re to
net
cu
rren
t rev
enue
(F
RL
) =
54%
Per
sonn
el e
xpen
ditu
re to
net
cu
rren
t rev
enue
(PA
F) =
56%
Cur
rent
exp
ense
to to
tal
expe
nditu
re r
atio
con
solid
ated
pu
blic
sec
tor
(FR
L)
=
Inve
stm
ents
= R
$163
mil
lion
Inve
stm
ent e
xpen
se to
net
cu
rren
t rev
enue
rat
io d
irec
t ad
min
istr
atio
n (P
AF
) =
5%
Item
s pu
rcha
sed
thro
ugh
elec
tron
ic p
rice
reg
istr
atio
n =
0
Ave
rage
num
ber
of d
ays
to
com
plet
e a
proc
urem
ent p
roce
ss
= 3
14
Ave
rage
num
ber
of d
ays
to
com
plet
e a
reve
rse
auct
ion
in
AM
GE
SP =
147
Per
sonn
el e
xpen
ditu
re to
net
cu
rren
t rev
enue
(F
RL
) =
56%
Per
sonn
el e
xpen
ditu
re to
net
cu
rren
t rev
enue
(PA
F) =
59%
Inve
stm
ents
= R
$370
mil
lion
Inve
stm
ent e
xpen
se to
net
cur
rent
re
venu
e ra
tio d
irec
t adm
inis
trat
ion
(PA
F)
= 1
0%
Item
s pu
rcha
sed
thro
ugh
elec
tron
ic
pric
e re
gist
ratio
n =
653
Ave
rage
num
ber
of d
ays
to
com
plet
e a
reve
rse
auct
ion
in
AM
GE
SP =
146
Per
sonn
el e
xpen
ditu
re to
net
cu
rren
t rev
enue
(F
RL
) =
58%
Per
sonn
el e
xpen
ditu
re to
net
cu
rren
t rev
enue
(PA
F) =
60%
Inve
stm
ents
= R
$500
mil
lion
Inve
stm
ent e
xpen
se to
net
cu
rren
t rev
enue
rat
io d
irec
t ad
min
istr
atio
n (P
AF
) =
8%
Item
s pu
rcha
sed
thro
ugh
elec
tron
ic p
rice
reg
istr
atio
n =
10
0
Ave
rage
num
ber
of d
ays
to
com
plet
e a
reve
rse
auct
ion
in
AM
GE
SP
= 6
0
2. I
mp
rovi
ng
Hu
man
Res
ourc
es M
anag
emen
t
2.1
Info
rmat
ion
Sys
tem
an
d M
anag
emen
t of
the
P
ayro
ll
Eli
min
atio
n of
fra
uds
and
irre
gula
riti
es in
the
stat
e pa
yrol
l
Num
ber
of c
ivil
serv
ants
that
re
gist
ered
in th
e C
ensu
s =
0
Num
ber
of c
ivil
serv
ants
that
re
gist
ered
in th
e C
ensu
s =
0
Num
ber
of c
ivil
serv
ants
that
re
gist
ered
in th
e C
ensu
s =
72
,000

92
Ob
ject
ives
M
ediu
m T
erm
Ou
tcom
es
Bas
elin
e (D
ecem
ber
200
7)
Bas
elin
e (D
ecem
ber
200
8)
Tar
get
Val
ues
for
201
0
Gen
erat
e an
d m
aint
ain
relia
ble
info
rmat
ion
on
publ
ic p
erso
nnel
–in
clud
ing
sala
ries
and
ben
efits
– in
or
der
to im
pose
eff
ectiv
e co
ntro
l ove
r th
e pa
yrol
l.
Ass
ure
relia
bilit
y of
in
form
atio
n an
d its
pr
oces
sing
Cor
rect
fra
uds
and
mis
take
s on
the
stat
e pa
yrol
l.
Rel
iabl
e in
form
atio
n sy
stem
s on
hum
an r
esou
rce
and
payr
oll
Num
ber
of r
egis
ters
aud
ited
= 0
Num
ber
of a
ctiv
e, p
ensi
oner
s
and
surv
ivor
s in
the
payr
oll t
hat
are
rece
ivin
g sa
lari
es a
nd
bene
fits
irre
gula
rly
= n
.a
Sav
ings
on
payr
oll d
ue to
el
imin
atio
n of
irre
gula
ritie
s =
n.a
Num
ber
of r
egis
ters
aud
ited
= 0
Sav
ings
on
payr
oll d
ue to
el
imin
atio
n of
irre
gula
ritie
s =
n.a
Num
ber
of r
egis
ters
aud
ited
=
57,0
00
Sav
ings
on
payr
oll d
ue to
el
imin
atio
n of
irre
gula
ritie
s =
5%
2.2
Def
init
ion
of
a S
trat
egy
for
Hu
man
Res
ourc
es
Man
agem
ent
Def
ine
hiri
ng p
rior
itie
s,
inte
rnal
per
sonn
el s
hift
s an
d pa
ymen
t inc
reas
es a
ccor
ding
to
the
Sta
te G
over
nmen
t’s
shor
t and
med
ium
term
ne
eds.
Rev
iew
the
posi
tions
’ an
d ca
reer
s’ s
truc
ture
s
Sou
nd H
uman
Res
ourc
es
Pol
icie
s
Str
eam
line
d w
ork
forc
e
Enh
ance
d w
ork
forc
e pl
anni
ng c
apac
ity
Red
uced
abs
ente
eism
Impr
oved
org
aniz
atio
nal
clim
ate
Wor
k Pl
an F
orce
= N
o
Num
ber
of s
taff
trai
ned
= 1
,600
Rat
e of
abs
ente
eism
= n
.a
Com
pens
atio
n po
licy
in p
lace
al
igne
d w
ith s
alar
ies
paid
in
othe
r st
ate
gove
rnm
ents
= N
O
Num
ber
of s
trik
e da
ys o
f pu
blic
se
rvan
ts =
300
Wor
k Pl
an F
orce
= N
O
Num
ber
of s
taff
trai
ned
= 1
,600
Rat
e of
abs
ente
eism
=
Com
pens
atio
n po
licy
in p
lace
al
igne
d w
ith s
alar
ies
paid
in o
ther
st
ate
gove
rnm
ents
= N
O
Num
ber
of s
trik
e da
ys o
f pu
blic
se
rvan
ts =
250
Wor
k P
lan
Forc
e =
YE
S
Num
ber
of s
taff
trai
ned
=
24,0
00
Rat
e of
abs
ente
eism
= 2
0%
Com
pens
atio
n po
licy
in p
lace
al
igne
d w
ith s
alar
ies
paid
in
othe
r st
ate
gove
rnm
ents
=
YE
S
Num
ber
of s
trik
e da
ys o
f pu
blic
ser
vant
s <
100
3. R
edu
cin
g th
e S
tate
Soc
ial S
ecu
rity
Def
icit
s
3.1
Ad
min
istr
ativ
e R
efor
ms
Impr
ove
the
man
agem
ent
fram
ewor
k of
the
soci
al
secu
rity
sys
tem
Ens
ure
equi
tabl
e tr
eatm
ent
of a
ll c
lass
es o
f ci
vil
serv
ants
in a
ll go
vern
men
t br
anch
es
Eff
ectiv
e m
anag
emen
t of
the
stat
e so
cial
sec
urit
y sy
stem
S
ingl
e A
dmin
istr
ator
= N
o
Cro
ssch
eck
Info
rmat
ion
with
F
eder
al G
over
nmen
t Sys
tem
s =
N
o
CR
P =
No
Sin
gle
Adm
inis
trat
or =
No
Cro
ssch
eck
Info
rmat
ion
with
F
eder
al G
over
nmen
t Sys
tem
s =
N
o
CR
P =
No
Sin
gle
Adm
inis
trat
or =
YE
S
Cro
ssch
eck
Info
rmat
ion
with
F
eder
al G
over
nmen
t Sys
tem
s =
2 C
ross
chec
ks
CR
P =
YE
S
3.2
Par
amet
ric
Ref
orm
s R
educ
tion
in p
ensi
on
expe
nditu
res
and
cash
pen
sion
C
ash
Def
icit
of th
e R
PP
S =
R
$397
mil
lion
Cas
h D
efic
it of
the
RP
PS
=
R$4
51 m
illio
n C
ash
Def
icit
of th
e R
PP
S =
R
$600
mil
lion
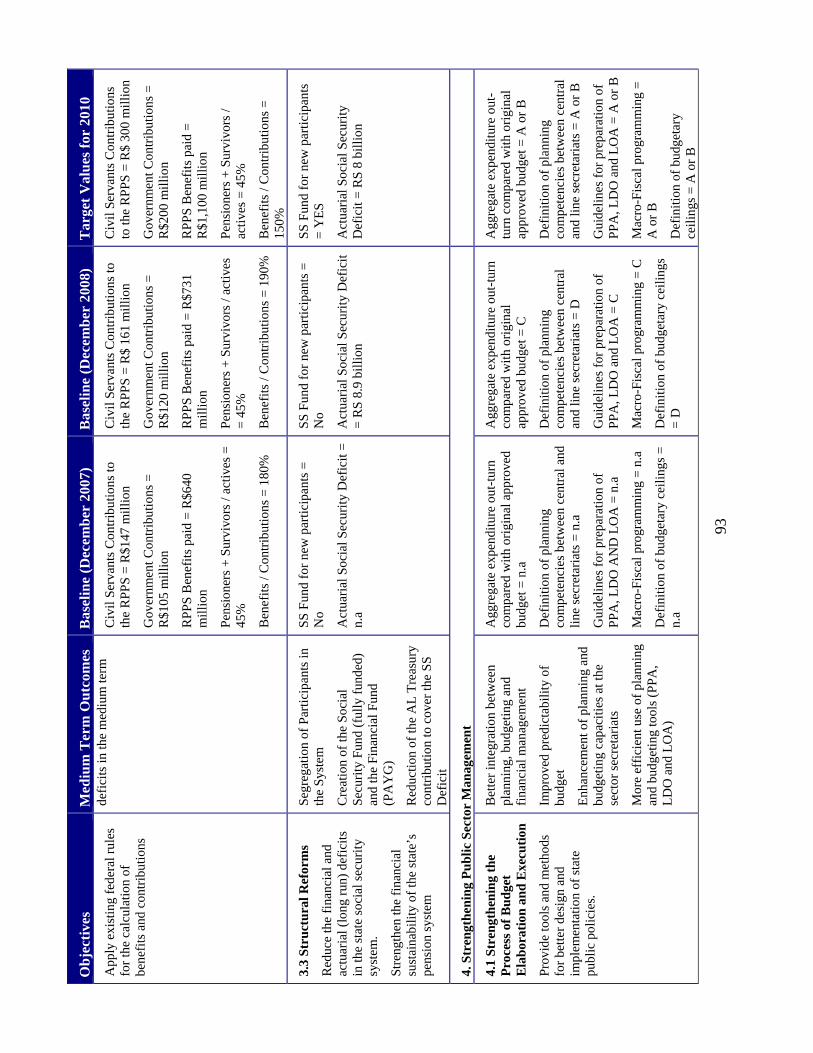
93
Ob
ject
ives
M
ediu
m T
erm
Ou
tcom
es
Bas
elin
e (D
ecem
ber
200
7)
Bas
elin
e (D
ecem
ber
200
8)
Tar
get
Val
ues
for
201
0
App
ly e
xist
ing
fede
ral r
ules
fo
r th
e ca
lcul
atio
n of
be
nefi
ts a
nd c
ontr
ibut
ions
defi
cits
in th
e m
ediu
m te
rm
C
ivil
Ser
vant
s C
ontr
ibut
ions
to
the
RP
PS
= R
$147
mill
ion
Gov
ernm
ent C
ontr
ibut
ions
=
R$1
05 m
illio
n
RP
PS
Ben
efit
s pa
id =
R$6
40
mil
lion
Pen
sion
ers
+ S
urvi
vors
/ ac
tives
=
45%
Ben
efits
/ C
ontr
ibut
ions
= 1
80%
Civ
il S
erva
nts
Con
trib
utio
ns to
th
e R
PP
S =
R$
161
mil
lion
Gov
ernm
ent C
ontr
ibut
ions
=
R$1
20 m
illio
n
RP
PS
Ben
efit
s pa
id =
R$7
31
mil
lion
Pen
sion
ers
+ S
urvi
vors
/ ac
tives
=
45%
Ben
efits
/ C
ontr
ibut
ions
= 1
90%
Civ
il S
erva
nts
Con
trib
utio
ns
to th
e R
PP
S =
R$
300
mill
ion
Gov
ernm
ent C
ontr
ibut
ions
=
R$2
00 m
illio
n
RP
PS
Ben
efit
s pa
id =
R
$1,1
00 m
illio
n
Pen
sion
ers
+ S
urvi
vors
/ ac
tive
s =
45%
Ben
efits
/ C
ontr
ibut
ions
=
150%
3.3
Stru
ctu
ral R
efor
ms
Red
uce
the
fina
ncia
l and
ac
tuar
ial (
long
run
) de
fici
ts
in th
e st
ate
soci
al s
ecur
ity
syst
em.
Str
engt
hen
the
fina
ncia
l su
stai
nabi
lity
of th
e st
ate’
s pe
nsio
n sy
stem
Seg
rega
tion
of P
artic
ipan
ts in
th
e S
yste
m
Cre
atio
n of
the
Soc
ial
Sec
urit
y F
und
(ful
ly f
unde
d)
and
the
Fin
anci
al F
und
(PA
YG
)
Red
uctio
n of
the
AL
Tre
asur
y co
ntri
butio
n to
cov
er th
e S
S
Def
icit
SS
Fun
d fo
r ne
w p
artic
ipan
ts =
N
o
Act
uari
al S
ocia
l Sec
urit
y D
efic
it =
n.
a
SS
Fun
d fo
r ne
w p
artic
ipan
ts =
N
o
Act
uari
al S
ocia
l Sec
urit
y D
efic
it
= R
S 8
.9 b
illio
n
SS
Fun
d fo
r ne
w p
artic
ipan
ts
= Y
ES
Act
uari
al S
ocia
l Sec
urit
y D
efic
it =
RS
8 b
illio
n
4. S
tren
gth
enin
g P
ub
lic
Sec
tor
Man
agem
ent
4.1
Stre
ngth
enin
g th
e P
roce
ss o
f B
ud
get
Ela
bor
atio
n a
nd
Exe
cuti
on
Pro
vide
tool
s an
d m
etho
ds
for
bett
er d
esig
n an
d im
plem
enta
tion
of s
tate
pu
blic
pol
icie
s.
Bet
ter
inte
grat
ion
betw
een
plan
ning
, bud
getin
g an
d fi
nanc
ial m
anag
emen
t
Impr
oved
pre
dict
abil
ity
of
budg
et
Enh
ance
men
t of
plan
ning
and
bu
dget
ing
capa
citie
s at
the
sect
or s
ecre
tari
ats
Mor
e ef
fici
ent u
se o
f pl
anni
ng
and
budg
etin
g to
ols
(PPA
, L
DO
and
LO
A)
Agg
rega
te e
xpen
ditu
re o
ut-t
urn
com
pare
d w
ith
orig
inal
app
rove
d bu
dget
= n
.a
Def
initi
on o
f pl
anni
ng
com
pete
ncie
s be
twee
n ce
ntra
l and
li
ne s
ecre
tari
ats
= n
.a
Gui
deli
nes
for
prep
arat
ion
of
PPA
, LD
O A
ND
LO
A =
n.a
Mac
ro-F
isca
l pro
gram
min
g =
n.a
Def
init
ion
of b
udge
tary
cei
ling
s =
n.
a
Agg
rega
te e
xpen
ditu
re o
ut-t
urn
com
pare
d w
ith
orig
inal
ap
prov
ed b
udge
t = C
Def
initi
on o
f pl
anni
ng
com
pete
ncie
s be
twee
n ce
ntra
l an
d li
ne s
ecre
tari
ats
= D
Gui
deli
nes
for
prep
arat
ion
of
PP
A, L
DO
and
LO
A =
C
Mac
ro-F
isca
l pro
gram
min
g =
C
Def
initi
on o
f bu
dget
ary
ceili
ngs
= D
Agg
rega
te e
xpen
ditu
re o
ut-
turn
com
pare
d w
ith o
rigi
nal
appr
oved
bud
get =
A o
r B
Def
initi
on o
f pl
anni
ng
com
pete
ncie
s be
twee
n ce
ntra
l an
d li
ne s
ecre
tari
ats
= A
or
B
Gui
deli
nes
for
prep
arat
ion
of
PP
A, L
DO
and
LO
A =
A o
r B
Mac
ro-F
isca
l pro
gram
min
g =
A
or
B
Def
initi
on o
f bu
dget
ary
ceili
ngs
= A
or
B

94
Ob
ject
ives
M
ediu
m T
erm
Ou
tcom
es
Bas
elin
e (D
ecem
ber
200
7)
Bas
elin
e (D
ecem
ber
200
8)
Tar
get
Val
ues
for
201
0
4.2
Intr
odu
ce R
esu
lts
Bas
ed M
anag
emen
t an
d
Str
engt
hen
Str
ateg
ic
Inve
stm
ents
Pro
vide
tool
s to
ens
ure
that
th
e st
ate
deliv
ers
resu
lts in
an
eff
icie
nt a
nd e
ffec
tive
w
ay.
Ens
ure
that
pub
lic
inve
stm
ents
are
del
iver
ed b
y ef
fici
ent a
lloc
atio
n an
d m
aint
enan
ce o
f fi
scal
eq
uilib
rium
Impr
oved
impl
emen
tatio
n pe
rfor
man
ce o
f pr
iori
ty
prog
ram
s
Incr
ease
inve
stm
ent
expe
nditu
res
in p
rior
ity
prog
ram
s
Red
uce
disp
ersi
on o
f st
ate
gove
rnm
ent i
nves
tmen
t ex
pend
iture
s
Inve
stm
ent i
n pr
iori
ty p
rogr
ams
=
n.a
Num
ber
of p
rior
ity p
rogr
ams
= n
.a
Num
ber
of p
rogr
ams
with
in
tens
ive
mon
itori
ng =
n.a
Bud
get e
xecu
tion
of p
rior
ity
prog
ram
s =
n.a
Inve
stm
ent i
n pr
iori
ty p
rogr
ams
Num
ber
of p
rior
ity p
rogr
ams
Num
ber
of p
rogr
ams
with
in
tens
ive
mon
itori
ng
Bud
get e
xecu
tion
of p
rior
ity
prog
ram
s
Inve
stm
ent i
n pr
iori
ty =
300
pr
ogra
ms
Num
ber
of p
rior
ity p
rogr
ams
= 1
8
Num
ber
of p
rogr
ams
with
in
tens
ive
mon
itori
ng =
18
Bud
get e
xecu
tion
of p
rior
ity
prog
ram
s =
60%
95
ANNEX 3: FISCAL SUSTAINABILITY ANALYSIS AND DPL PROGRAM IMPACTS 1. INTRODUCTION
A3.1 The fiscal situation of Alagoas is widely recognized as among one of the most difficult in Brazil. Up to December 2008, Alagoas was one of the two outliers whose debt indicators fail to meet the conditions set forth in the Fiscal Responsibility Law (Lei de Responsabilidad Fiscal, LRF) (Rio Grande do Sul has been the other). Alagoas had difficulty meeting its fixed spending obligations, such as personnel expenditures, civil service social security benefits and debt servicing. As in other states, high indebtedness led Alagoas to require three debt refinancing operations from the federal government between 1989 and 1997.
A3.2 The 1997 debt refinancing operation has been accompanied by a three year rolling fiscal adjustment program (PAF) with specific actions and targets focused on all major parameters of fiscal performance. The State of Alagoas signed its initial restructuring agreement in 1998. After the debt renegotiation contracts were signed with the National Treasury Secretariat in 1997 and especially following the enactment of the Fiscal Responsibility Law in 2000, which created the conditions for the presence of hard budget constraints, Alagoas was obligated to adopt a severe fiscal adjustment.
A3.3 The adjustment has been due largely to the fact that GOA’ access to borrowing sources had by then been practically eliminated. Without any access to credit since 2000, GoA has confronted a permanent impending fiscal crisis characterized by extreme difficulties to accomplish the targets of the Fiscal Adjustment programs agreed with the National Treasury Secretariat, very low investment spending, and increasing dependence on federal capital transfers to finance some investments.
A3.4 High personnel expenditures, social security deficits and burdensome debt payments have crippled the state’s ability to invest in and support the growth of its economy, which in turn led to lower revenues and a more adverse debt dynamics that jeopardized the fiscal adjustment efforts. The hard fiscal constraints faced by GoA have choked off initiatives to promote economic development and poverty reduction, leading to a downward spiral of weaker public services and missed growth opportunities.
A3.5 The challenge to turn this situation around is at the core of the new government’s program for fiscal adjustment and reform. Indeed, during the first two years of the current administration, the difficult fiscal situation was partially alleviated by the good revenue performance, reduction of operating costs and further investment expense cuts. Nonetheless, strong expenditure rigidities, have limited the scope of a more decisive fiscal adjustment.
A3.6 The program supported by the proposed DPL aims at weathering the structural forces behind the chronic fiscal disequilibria. Along these lines, measures directed to increase the efficiency of tax collection, to control personnel expenditures and to reduce social security deficit would both guarantee the sustainability of the current fiscal adjustment effort and open fiscal space for government investments.
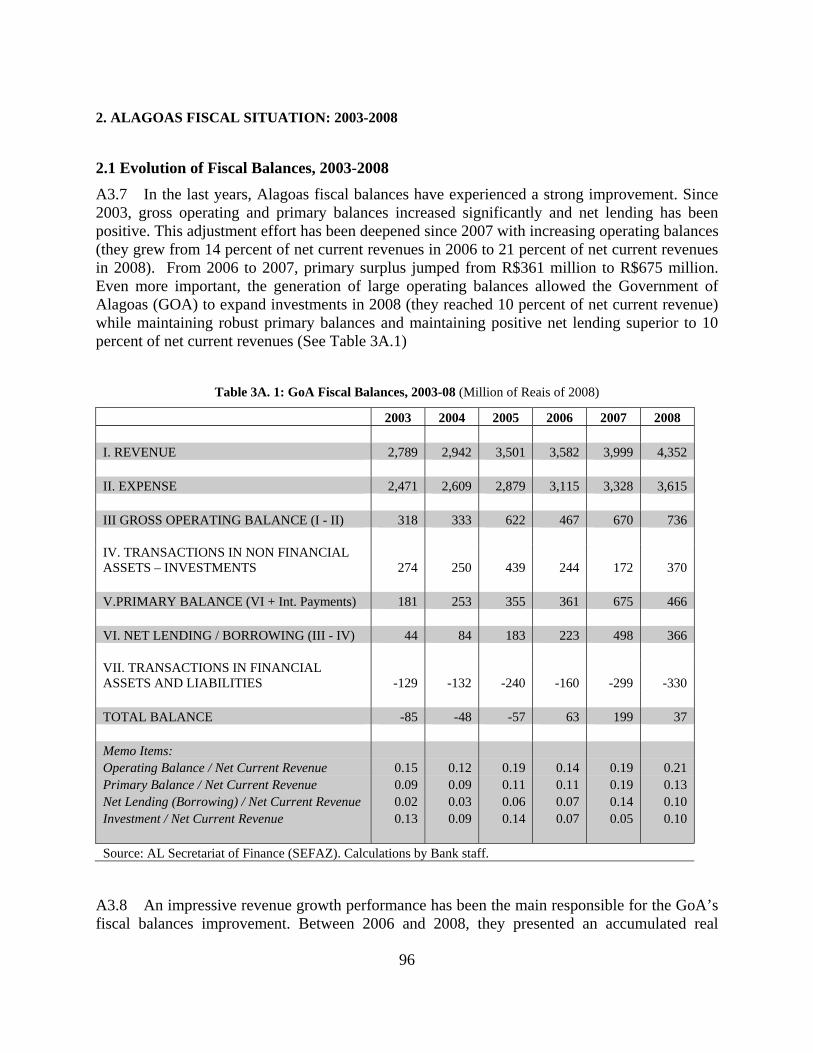
96
2. ALAGOAS FISCAL SITUATION: 2003-2008
2.1 Evolution of Fiscal Balances, 2003-2008
A3.7 In the last years, Alagoas fiscal balances have experienced a strong improvement. Since 2003, gross operating and primary balances increased significantly and net lending has been positive. This adjustment effort has been deepened since 2007 with increasing operating balances (they grew from 14 percent of net current revenues in 2006 to 21 percent of net current revenues in 2008). From 2006 to 2007, primary surplus jumped from R$361 million to R$675 million. Even more important, the generation of large operating balances allowed the Government of Alagoas (GOA) to expand investments in 2008 (they reached 10 percent of net current revenue) while maintaining robust primary balances and maintaining positive net lending superior to 10 percent of net current revenues (See Table 3A.1)
Table 3A. 1: GoA Fiscal Balances, 2003-08 (Million of Reais of 2008)
2003 2004 2005 2006 2007 2008 I. REVENUE 2,789 2,942 3,501 3,582 3,999 4,352 II. EXPENSE 2,471 2,609 2,879 3,115 3,328 3,615 III GROSS OPERATING BALANCE (I - II) 318 333 622 467 670 736 IV. TRANSACTIONS IN NON FINANCIAL ASSETS – INVESTMENTS 274 250 439 244 172 370 V.PRIMARY BALANCE (VI + Int. Payments) 181 253 355 361 675 466 VI. NET LENDING / BORROWING (III - IV) 44 84 183 223 498 366 VII. TRANSACTIONS IN FINANCIAL ASSETS AND LIABILITIES -129 -132 -240 -160 -299 -330 TOTAL BALANCE -85 -48 -57 63 199 37 Memo Items: Operating Balance / Net Current Revenue 0.15 0.12 0.19 0.14 0.19 0.21 Primary Balance / Net Current Revenue 0.09 0.09 0.11 0.11 0.19 0.13 Net Lending (Borrowing) / Net Current Revenue 0.02 0.03 0.06 0.07 0.14 0.10 Investment / Net Current Revenue 0.13 0.09 0.14 0.07 0.05 0.10 Source: AL Secretariat of Finance (SEFAZ). Calculations by Bank staff.
A3.8 An impressive revenue growth performance has been the main responsible for the GoA’s fiscal balances improvement. Between 2006 and 2008, they presented an accumulated real

97
growth of 21 percent while expenditures grew by 16 percent during the same period. As a result, GoA’s gross operating balance which corresponds to the current account saving including the capital revenue transfers, recorded an increase of 58 percent during 2006-08.
Figure 3A. 1: GoA Fiscal Balances, 2003-2008 (Millions of 2008 Reais)
A3.9 The increase in operating balance broadened the space for investments. After the strong cut in 2007, GoA’s investments more than doubled between 2007 and 2008, while primary surplus has been maintained above 10 percent of net current revenues. As a result, primary surplus and net lending declined slightly when compared with their 2007 levels but still significantly higher than the levels observed in previous years.
Figure 3A. 2: GoA Gross Operating Balance and Investment, 2003-2008 (Millions of 2008 Reais)

98
2.2 Evolution of Fiscal Revenues, 2003-2008
A3.10 From 2003 to 2008, state revenues grew by 56 percent in real terms. In this period, GoA’s fiscal revenues trajectory can be divided into two periods. The first period would be from 2003 to 2006 and the other would be 2007 to 2008 when GoA’s revenue growth accelerated. From 2003 to 2006 GoA’s revenues annual growth was 6 percent while in the last two years the growth rate increased to 10 percent.
A3.11 Transfers from federal government have been the most important driver of this growth. Fostered by the national economic activity acceleration in 2006-2008 the federal tax revenue sharing transfers to the state increased by 11 percent per year. Better regional growth performance as well as the stringent measures taken to improve taxpayers’ compliance resulted in state tax collection annual growth of 5.5 percent in the same period (See 34A.2).
Table 3A. 2: GoA Revenues, 2003-08 (Million of Reais of 2008)
2003 2004 2005 2006 2007 2008 Revenue 2,789 2,943 3,501 3,582 3,999 4,352 I. Tax Revenue 1,037 1,179 1,297 1,448 1,518 1,609 State VAT (ICMS) 909 1,020 1,125 1,249 1,300 1,370 Vehicle Property Tax 49 52 61 69 77 81 Other 79 107 111 130 140 158 II. Social Security Contributions 88 110 115 126 156 162 III. Other Current Revenues 167 102 205 92 250 256 Non Financial Asset Revenues 6 5 5 3 4 3 Interest 35 13 15 21 30 64 Miscellaneous Revenues 126 83 185 68 217 189 IV. Transfers 1,497 1,552 1,885 1,916 2,075 2,325 Current Transfers 1,296 1,456 1,724 1,803 1,981 2,187 - FPE 996 1,021 1,207 1,297 1,410 1,595 - IPI Exports 5 5 6 9 9 0 - Kandir Law 22 22 22 12 11 10 - Other Federal Transfers 163 279 352 348 328 300 - FUNDEF 110 129 137 137 223 282 - Private Transfers 0 0 0 0 0 0 Capital Transfers 201 96 161 113 93 137 Memo Items: Deductions 688 629 714 623 710 823 Net Current Revenue 2,101 2,313 2,787 2,959 3,289 3,528 Source: AL Secretariat of Finance (SEFAZ). Calculations by Bank staff.
A3.12 The better performance of federal transfers compared to the one observed for tax revenues, accentuated the dependence of GoA’s public finance on transfers. In average tax revenue transfers represented about 50% of state revenues while GoA’s own tax collection accounted for 40%. In the last year the share of transfers increased to 54 percent while own tax revenue represented 38 percent of total revenues. (See Figure 3A.3).

99
A3.13 In addition, in recent years, the dependence on federal transfers has been deepened as capital transfers from the Federal Government became the most important financing source of GoA investment programs in a context of reduced access to credit and low capacity to generate current savings.
Figure 3A. 3: GoA Revenues, 2003-2008 ( Millions of 2008 Reais)
2.3 Evolution of Fiscal Expenditures, 2003-2008
A3.14 During the period 2003-2008, total expenses increased by 45% driven by the personnel expenditures which grew by 53% while social security benefits grew by 60% in overall. Expenses followed a similar pattern than the observed at the revenue side. From 2003 to 2006, expenses grew at 6 percent per year, while between 2006 and 2008, expenditure growth accelerated to 7.6 percent.
A3.15 This pattern was defined by the evolution of personnel expenses and social security benefits, the most important expenditure categories. From 2003 to 2006, both categories annually grew by about 6 percent while their annual growth increased to 11 percent in the last two years. The reason for the personnel expenditures growth acceleration was the concession of large salary increases by the previous administration that began to be applied in the term of the new administration. Despite the government’s resistance to validate the salary adjustments granted by the previous administration, the negotiated chronogram of salary adjustments over 2007 and 2008 resulted in the acceleration of personnel expenses growth. As social security benefits are indexed to salary adjustment for the active civil service, a similar increase has been observed for pensions expenses (See Table 3A.3).
A3.16 In terms of their composition, GoA current expenditures represent in average 91% of total expenses. Among the current expenses, the compensation of employees is the bigger

100
component accounting in average for 42 percent followed by both pensions and the use of goods and services at 19 percent. (See Figure 3A.4).
Table 3A. 3: GoA Expenditures, 2003-08 (Million of Reais of 2008)
2003 2004 2005 2006 2007 2008 Total Expenses 2,746 2,859 3,318 3,359 3,501 3,985 Current Expenses 2,471 2,609 2,879 3,115 3,328 3,615 Compensation of employees 1,038 1,070 1,169 1,291 1,447 1,587 Goods and Services 485 518 620 627 516 604 Interest Payments 172 183 187 159 207 164 Transfers 318 338 366 450 480 528 Pensions 458 501 537 588 678 731 Non Financial Assets 274 250 439 244 173 370 Net Acquisition of Non-Financial Assets 272 247 438 243 172 369 Other Investment in Assets 2 3 1 1 0 1 Source: AL Secretariat of Finance (SEFAZ). Calculations by Bank staff.
A3.17 Other expenses that are not controlled by the state government such as revenue sharing transfers to municipalities grew by 66% from 2003 to 2008. Interest payments and debt amortization (transactions in financial assets in table 13) are also other obligations not controlled by GoA and they represent about 14 percent of government expenses. Summing up personnel expenses, pensions, transfers to municipalities and debt service, obligatory spending represents in average more than 80 percent of total expenditures and about 75 percent of GoA’s revenue.
A3.18 Where the GoA could assert control it obtained good results. For instance in 2006-2008, the strict control of operating expenses resulted in a reduction of 5 percent. On the negative side, GoA recent fiscal adjustment resulted in an unavoidable sharp reduction in 2007 investment expenditures followed by a strong recovery as fiscal conditions improved in 2008. In fact, investment expenses seem to be the adjustment variable at the expenditure side.
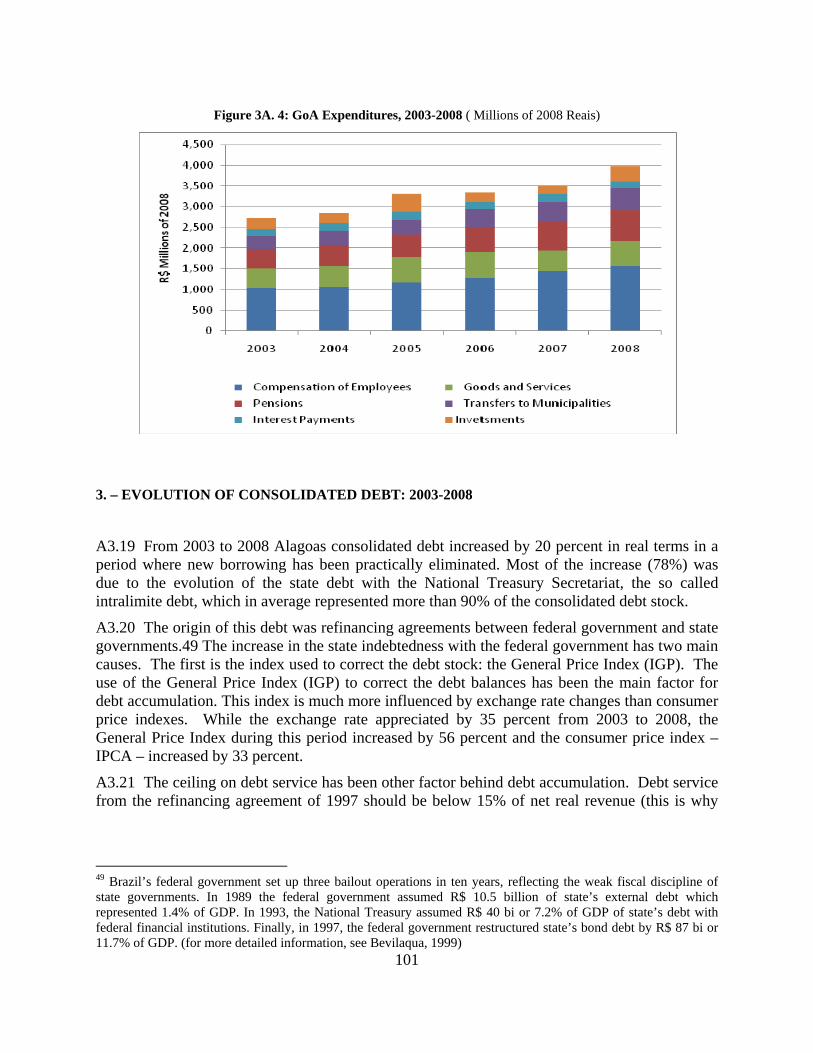
101
Figure 3A. 4: GoA Expenditures, 2003-2008 ( Millions of 2008 Reais)
3. – EVOLUTION OF CONSOLIDATED DEBT: 2003-2008
A3.19 From 2003 to 2008 Alagoas consolidated debt increased by 20 percent in real terms in a period where new borrowing has been practically eliminated. Most of the increase (78%) was due to the evolution of the state debt with the National Treasury Secretariat, the so called intralimite debt, which in average represented more than 90% of the consolidated debt stock.
A3.20 The origin of this debt was refinancing agreements between federal government and state governments.49 The increase in the state indebtedness with the federal government has two main causes. The first is the index used to correct the debt stock: the General Price Index (IGP). The use of the General Price Index (IGP) to correct the debt balances has been the main factor for debt accumulation. This index is much more influenced by exchange rate changes than consumer price indexes. While the exchange rate appreciated by 35 percent from 2003 to 2008, the General Price Index during this period increased by 56 percent and the consumer price index – IPCA – increased by 33 percent.
A3.21 The ceiling on debt service has been other factor behind debt accumulation. Debt service from the refinancing agreement of 1997 should be below 15% of net real revenue (this is why
49 Brazil’s federal government set up three bailout operations in ten years, reflecting the weak fiscal discipline of state governments. In 1989 the federal government assumed R$ 10.5 billion of state’s external debt which represented 1.4% of GDP. In 1993, the National Treasury assumed R$ 40 bi or 7.2% of GDP of state’s debt with federal financial institutions. Finally, in 1997, the federal government restructured state’s bond debt by R$ 87 bi or 11.7% of GDP. (for more detailed information, see Bevilaqua, 1999)

102
this debt is called intralimite debt).50 Any intralimite debt service above this limit is automatically incorporated into the debt stock. It is worth to mention that Alagoas pays an interest rate of 7.5 percent (plus the IGP debt stock correction) while other states pay 6 percent (plus the IGP debt stock correction), therefore, debt dynamics is more adverse for Alagoas. In fact, given the high debt, high interest rates and debt correction above inflation, Alagoas has been capitalizing interest payments as they were always superior to 15 percent of GoA net real revenues. This explains why, even in the absence of large new credit operations, the debt stock has grown.
A3.22 The other part of the GoA debt is the extralimite debt that encompasses small debts including the external one. In the last years, the extralimite debt increased basically because the debt with the federal social security system has strongly increased. This debt is being generated by indirect administration entities that did not contribute to the general social security system and that needed to be recognized by the state government. Debt with federal banks (BNDES and Caixa Economica Federal) has been constant. External debt was eliminated as the state did not have access to new borrowing operations.
Table 3A. 4: Government of Alagoas – Consolidated Debt Millions of Reais of 2008
2003 2004 2005 2006 2007 2008 Consolidated Debt 5,836 6,137 6,436 6,688 6,585 6,955 Domestic Debt 5,804 6,116 6,425 6,681 6,571 6,955 National Treasury 5,635 5,811 5,745 6,034 6,100 6,326 Federal Banks 136 148 144 156 150 144 Other debts 32 157 387 360 333 485 External Debt 32 20 11 7 2 0 Assets (1) 18 168 175 132 0 0 Net Consolidated Debt 5,818 5,969 6,262 6,556 6,585 6,955 Memo Items: Net Current Revenue 2,101 2,313 2,787 2,959 3,288 3,528 Net Consolidated Debt / NCR 277 264 225 222 202 197 Intralimite Debt 5,635 5,811 5,745 6,034 6,100 6,326 Extralimite Debt 201 326 542 522 485 629
50 Net real revenue is sum of current and capital revenues excluded: FUNDEF transfers, credit operation revenues, asset sales revenues, capital transfers, constitutional transfers to municipalities and the SUS revenues. The concept is different than the net current revenue that it is used by the Fiscal responsibility law. The difference is the coverage. Net real revenue refers to the revenues collected by state treasury account (direct administration), while the net current revenue refers to the consolidated public sector.

103
Source: AL. Secretary of Finance SEFAZ (1) According to the Fiscal Responsibility Law, deductions are equal to zero if the sum of assets and short term obligations is negative
A3.23 At present, net consolidated debt amounts R$7 billion representing 1.97 times the state net current revenue. Actually, Alagoas net consolidated debt to net current revenue fell from 277 percent in 2003 to 197 percent of net current revenues in 2008 and to 1.85 in August 2009. As a consequence--and for the first time since the enactment of the Fiscal Responsibility Law in 2000, Alagoas is in compliance with the declining path of indebtedness requirement. Furthermore, it has already reached the level of 2.0, seven years earlier than the cut-off date of 2015 established by the FRL. Up to 2008, Alagoas had been one the two outliers whose debt indicators fail to meet the Fiscal Responsibility Law (FRL) requirements since its enactment in 2000 (Rio Grande do Sul is the other). The reduction in its indebtedness and its compliance with the FRL debt limit have led the National Treasury Secretariat to authorize Alagoas to contract the World Bank operation --its first credit operation in the current decade.51
Figure 3A. 5: GoA Net Consolidated Debt to Net Current Revenue, 2003-2009
2003 2004 2005 2006 2007 20082009 Aug
Observed 2.77 2.64 2.25 2.22 2 1.97 1.85
FRL Declining Path 2.32 2.29 2.27 2.25 2.22 2.20 2.18
1.8
2
2.2
2.4
2.6
2.8
3
NCD / NCR
4. COMPLIANCE WITH THE FISCAL RESPONSIBILITY LAW
A3.24 GOA has met only partially with the Fiscal Responsibility Law key indicator requirements since its enactment in 2000, mainly because of its high level of debt, debt service payments and personnel expenses. The reduction of net consolidated debt to net current revenue from 277 percent in 2003 to 197 percent in 2008, has allowed Alagoas to comply with the fiscal
51 The Federal Senate Resolution 40/2001, complying with the Fiscal Responsibility Law, established a ceiling for net consolidated debt to net current revenues of 2.0 for state governments. For states that were above this ceiling in 2000, the Resolution mandated an adjustment to the ceiling in fifteen years. In 2015 all states should have a net consolidated debt to net current revenue ratio inferior to 2.0.

104
responsibility law. Nonetheless, the state is far from reaching the FRL target on debt service in relation to net current revenues. Debt service payments to NCR has been varying between 13 and 14 percent between 2003 and 2008, above the target of 11.5 percent of NCR reflecting that high indebtedness obligations continues to restrict new borrowing operations.
A3.25 According to its own estimates, the state has been mostly in compliance with the other indicators of the FRL. The personnel expenditures to net current revenue ratio, which under the Fiscal Responsibility Law should be inferior to 60 percent, declined from 66 percent in 2003 to 56 percent in 2008. It is important to note here that the figures compiled by the State may be underestimated as personnel expenditures do not include, severance payments, payments derived from judicial decisions, payments derived from past fiscal years, certain fringe benefits, among others. Inaccuracy is also likely in the personnel expenses reported by the different branches. In any case, the figures presented in the Table below show that Alagoas has serious difficulties in maintain personnel expenses below the FRL ceilings.
A3.26 Given the lack of access to credit operations, new borrowing as a proportion of the net current revenue has been almost 0, therefore, the FRL constraint in credit operations has not been binding for Alagoas.

Tab
le 3
A. 5
: F
isca
l Res
pon
sib
ilit
y L
aw L
imit
s an
d R
esu
lts
for
Ala
goas
200
3-20
08
CA
TE
GO
RIE
S
Leg
al
Cei
ling
2003
20
04
2005
20
06
2007
20
08
% N
CR
T
otal
%
NC
RT
otal
%
NC
RT
otal
%
NC
R
Tot
al
% N
CR
Tot
al
% N
CR
T
otal
%
NC
R
Per
sonn
el E
xpen
ditu
res
≤ 60
%
1,08
3 66
.8%
1,
144
59.6
%
1,22
8 50
.2%
1,
343
50.2
%
1,79
1 57
.7
1,96
9 55
.8
Exe
cutiv
e ≤
49%
79
3 49
.0%
92
6 48
.3%
1,
069
43.8
%
1,22
9 45
.9%
1,
455
46.9
%
1,61
7 45
.9%
Leg
isla
tive
≤ 3%
n.
a n.
a
n.a
n.
a
n.a
n.
a
n.a
n.
a 13
5 4.
3%
128
3.6%
Judi
ciar
y ≤
6%
n.
a
n.a
n.
a
n.a
n.
a
n.a
n.
a
n.a
138
4.4%
15
2 4.
3%
Pub
lic
Att
orne
y ≤
2%
n.
a
n.a
n.
a
n.a
n.
a
n.a
n.
a
n.a
63
2.0%
71
2.
0%
Net
Con
solid
ated
Deb
t ≤
200%
4,
484
277%
4,
950
264%
5,
448
225%
5,
927
222%
6,21
8 20
2%
6,
995
19
7%
Cre
dit O
pera
tion
≤ 16
%
12
0.7%
10
0.
5%
1 0.
0 0
0.0
0 0.
0 4
0.0
Deb
t Ser
vice
≤
11.5
%
245
15.2
%
272
11.7
%
376
13.4
%
350
11.8
%
479
14.5
%
49
8
14.1
%
Net
Cu
rren
t R
even
ue (
NC
R)
1,61
91,
918
2,44
3
2,67
53,
105
3,52
8

106
5. THE IMPACT OF THE FINANCIAL CRISIS ON GoA’s FISCAL SITUATION
A3.27 The financial crisis has been strongly impacted GoA’s finances. While regional economic activity has not been too affected by the worldwide economic slowdown, the transmission mechanism of the crisis to Alagoas is through the decline of Federal Government transfers to the State. Federal revenues suffered a strong fall that has been accentuated by its countercyclical policy of tax breaks. This has affected sub-national governments that receive federal revenue-sharing transfers. Given the high dependence of GoA on federal transfers (about 60 percent of State revenues comes from federal transfers), the fall in Federal Government tax revenue collection has been imposing expressive falls in GoA revenues. In fact, Figure below shows the strong correlation between federal and national industrial activity and between Federal Government and GoA revenues.
A3.28 In the first semester of 2009, as a result of national economic slowdown and the countercyclical measures (tax breaks) adopted by the Federal Government, federal revenue sharing transfers fell by 10 percent in real terms. The State VAT, the ICMS maintained a positive growth rate of 5 percent.
A3.29 State administration is taking additional adjustment measures and accelerating the rhythm of the reforms directed to reduce the pressure of personnel expenditures on State finances52. First, GoA established an additional cut of 15 percent on the operating budget of State secretariats. Second is postponing planned investments in the state that will be resumed as fiscal conditions allow. Third, is initiating the audit of the State payroll that would bring significant savings, initiating the revision of pensioners and survivors benefits and accelerating social security reform. In addition, government and Bank teams prepared a set of short run options to reduce personnel expenditures that would be used in case of revenue fall persistence. Finally, the Federal Government is implementing a compensation support program to sub-national governments that experienced intergovernmental transfers fall. Of course, Alagoas has been included in this compensation package as its fiscal situation deteriorated substantially in the previous months.
A3.30 This deterioration trend has been reflected in the assumptions for the projection exercises performed by the Bank Team. As it is described in section VI, projections on transfers and own revenue collection incorporate the recent fall as well as, personnel expenditures were projected using available information on the salary adjustment already conceded and other automatic adjustments that should be granted in 2009 and 2010.
52 For more detailed on suggested measures to reduce personnel expenses in the short run see Adjustment of Personnel Expenditures in Alagoas: Options in the Short Run by Raul Velloso (WB consultant).

107
Figure 3A. 6: Industrial Activity, Federal and Alagoas Net Current Revenues (Accum. 12-month growth rate)
-15.0
-10.0
-5.0
0.0
5.0
10.0
15.0
20.0
25.0
30.0
35.0
Dez
/03
Abr/
04
Ago/
04
Dez
/04
Abr/
05
Ago/
05
Dez
/05
Abr/
06
Ago/
06
Dez
/06
Abr/
07
Ago/
07
Dez
/07
Abr/
08
Ago/
08
Dec
-08
Apr
-09
Federal Industrial Activity Alagoas
6. PROJECTED FISCAL SITUATION: 2009-2020
A3.31 In this section, the fiscal situation of GoA will be projected in order to asses fiscal sustainability of the state, the state’s capacity to repay the Bank’s loan, with and the fiscal impact of the new policies. In addition, compliance with key indicators of the LRF will be evaluated through time. For this, two scenarios will be depicted: first without the lending operation and second with the World Bank lending operation.
A3.32 The first scenario was based upon the revenue and expenditure trends observed prior to the measures taken by the government in 2007 and 2008 that are contemplated as prior actions in the proposed lending operation. The second scenario took into account the measures adopted in 2008-09 and the actions proposed in the operation. The study projects the evolution of the government balances, the civil service pension deficit, and the key Fiscal Responsibility Law indicators of total debt, debt service, and personnel expenditures.
A3.33 The assumptions under the two scenarios are as follows.

108
Table 3A. 7: Assumptions for Fiscal Projections (Base Year Figures - 2008)
Variables Assumptions
Baseline: with the World Bank lending operation and reforms
Alternative: with the World Bank lending operation and reforms
Macroeconomic/demographic
Population growth 1.04 percent in 2008 and decreasing to 0.86 percent in 2015 and 0.76 percent in 2020 (projection by IBGE).
Same as baseline scenario
National GDP growth 0 percent in 2008, -0.5 percent in 2009, 3 % in 2010, 3.5% in 2011, 4% in 2012 and 4.5 percent thereafter.
Growth of 10 percent higher than the projected baseline scenario consecutive to improvements in public sector management and productive investments.
State GDP growth -4.75 percent of national GDP growth in 2008, +5 percent of national GDP growth afterwards.
Growth of 10 percent higher than the projected baseline scenario consecutive to improvements in public sector management and productive investments.
GPI Inflation rate 9 percent in 2008, 3 percent in 2009 and 4.5 percent afterwards.
Same as baseline scenario
IPCA Inflation rate 6 percent in 2008, 3.5 percent in 2009 and 4.5 percent afterwards.
Same as baseline scenario
Exchange rate (R$/US$) 1.9 in 2008, 2.2 in 2009, 2.3 in 2010 and a depreciation rate of 4.5 percent thereafter.
Same as baseline scenario
Revenue
TAX REVENUES
ICMS Increase with State GDP growth and inflation.
Tax collection efficiency gain of 0.5 percent for 2008-2011 and 0.25 percent afterwards
Motor Vehicle Tax Increase with State GDP growth and inflation.
Same as baseline scenario
Others Increase with population growth and inflation
Same as baseline scenario
SOCIAL CONTRIBUTIONS Increase with population growth, Lower growth rate increasing with

109
national GDP growth rate and inflation
population growth, inflation and only 65 percent of the national GDP growth rate.
TRANSFERS
State Participation Fund- FPE, IPI Exports, Kandir Law and others
Increase with national GDP growth and inflation
Same as baseline scenario
FUNDEB and other Capital Grants
Increase with population growth and inflation
Same as baseline scenario
OTHER CURRENT REVENUES
Non financial assets and Admin. Fees
Increase with inflation Same as baseline scenario
Interest, sales and miscellaneous
Increase with inflation Same as baseline scenario
Other revenues Increase with national GDP growth and inflation
Same as baseline scenario
Net Real Revenues53
Increase with national GDP growth and inflation
Same as baseline scenario
Expenditures
Wages Increase with population growth, national GDP growth rate and inflation
Lower growth rate increasing with population growth, inflation and only 85 percent of the national GDP growth rate. One time decrease of 3 percent consecutive to audit of pensioners.
Goods and Services Increase with inflation and national GDP growth
One time decrease by 10 percent in 2010 and grow with inflation and national GDP growth afterwards
Transfers to municipalities Increase with State GDP growth and inflation.
Interest payments Obtained from Debt Department of SEFAZ GoA and WB Staff estimates
53 Net Real Revenues cover only the Central Government revenue. The value for 2008 has been provided by the Secretary of Finance in Alagoas and is used to calculate the debt service ceiling set at 15 percent of the net real revenue.
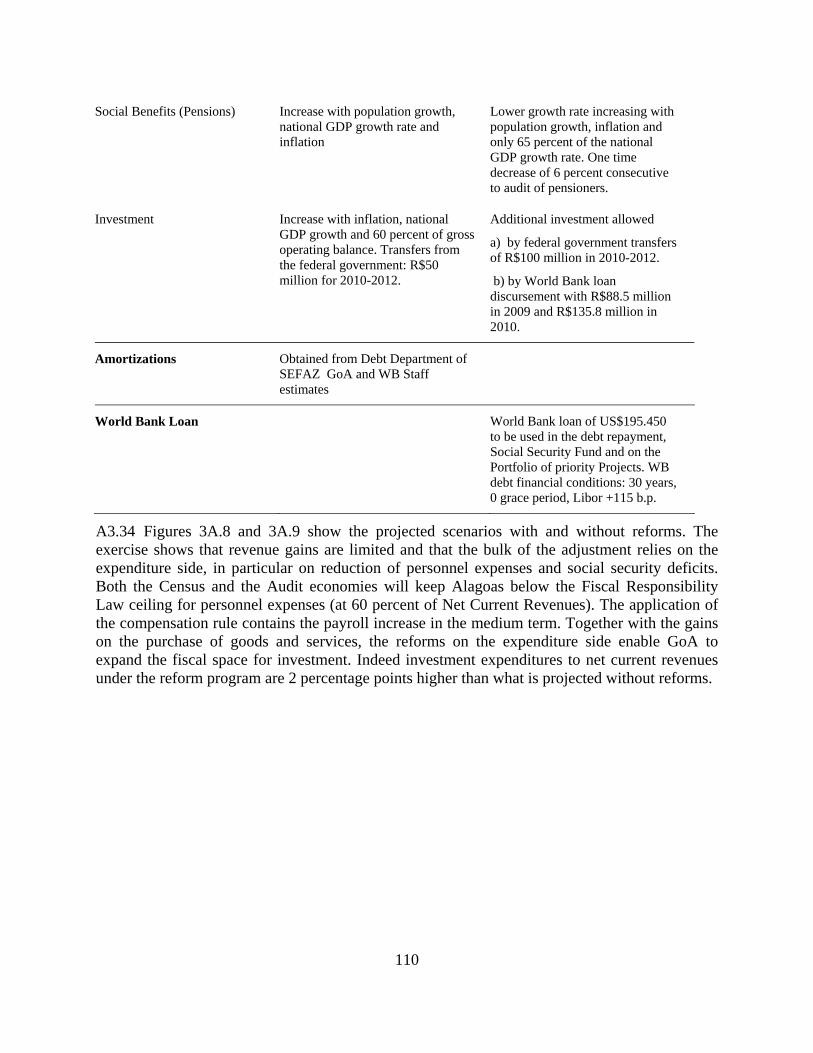
110
Social Benefits (Pensions) Increase with population growth, national GDP growth rate and inflation
Lower growth rate increasing with population growth, inflation and only 65 percent of the national GDP growth rate. One time decrease of 6 percent consecutive to audit of pensioners.
Investment Increase with inflation, national GDP growth and 60 percent of gross operating balance. Transfers from the federal government: R$50 million for 2010-2012.
Additional investment allowed
a) by federal government transfers of R$100 million in 2010-2012.
b) by World Bank loan discursement with R$88.5 million in 2009 and R$135.8 million in 2010.
Amortizations Obtained from Debt Department of SEFAZ GoA and WB Staff estimates
World Bank Loan World Bank loan of US$195.450 to be used in the debt repayment, Social Security Fund and on the Portfolio of priority Projects. WB debt financial conditions: 30 years, 0 grace period, Libor +115 b.p.
A3.34 Figures 3A.8 and 3A.9 show the projected scenarios with and without reforms. The exercise shows that revenue gains are limited and that the bulk of the adjustment relies on the expenditure side, in particular on reduction of personnel expenses and social security deficits. Both the Census and the Audit economies will keep Alagoas below the Fiscal Responsibility Law ceiling for personnel expenses (at 60 percent of Net Current Revenues). The application of the compensation rule contains the payroll increase in the medium term. Together with the gains on the purchase of goods and services, the reforms on the expenditure side enable GoA to expand the fiscal space for investment. Indeed investment expenditures to net current revenues under the reform program are 2 percentage points higher than what is projected without reforms.

111
Figure 3A. 8: Net Current Revenues, Personnel Expenditures, Gross Operating and Investment, 2008-20
A3.35 Higher investment expenditures do not reduce primary and overall balances. Only in the first year are the projected primary and overall balances lower under the reform scenario because the Bank loan is allocated to investments. From 2010 onwards, projected fiscal balances are higher and thus the debt reduction path is accelerated. It is worth noting that the projection for debt services (amortization plus interest payments) reflects the prepayment of a high cost debt. Part of the DPL proceeds will be allocated to pay this debt that amounts R$106 million and must be paid in 2012.

112
Figure 3A. 9: Primary and Overall Balances, Net Consolidated Debt to Net Current Revenue and Debt Service to net Current Revenues, 2008-20
A3.36 In summary, the reforms supported in this proposed DPL and agreed by the GoA will have important impacts on guaranteeing a decreasing path for indebtedness and expanding fiscal space for the increase of investment expenditures.

113
7. RISK ANALYSIS
A3.37 To take into account the uncertainty surrounding the projection of fundamental bmacroeconomic variables such as the exchange rate, the GDP growth rate, the real interest rate and the inflation rate a risk analysis was conducted. By doing a number of Monte-Carlo simulations drawing shocks from specific probability distributions it was possible to simulate simultaneous random shocks in a set of variables and their impacts on the state’s financial situation.
A3.38 The Normal distribution has been applied for simplicity, but one can easily change the distribution choosing from a wide family of densities e.g. , Exponential, Gamma, Log-Normal, etc--- or even boostrap the shocks from, e.g., WEO historical values. Thus, stochastic variables are specified using the formulation: )(0,~,= 2σεε Nxx ttt +
A3.39 with x being the mean of the variable of interest--- e.g. , the inflation rate, the growth
rate, the real interest rate and the exchange rate. Note that ondepreciati
tlation
t εε 5.0inf = .
A3.40 Since these are expressed as percentages, attention must be paid to use appropriate units in the shock specification--- e.g. , a normally-distributed shock with a standard deviation of one percentage point will be specified as:
0.0001)=0.01=(0, 22σε Nt ~
A3.41 Figure 3A.10 below illustrates a risk analysis for the consolidated debt-to-net current revenue ratio indicator.
Figure 3A. 10: Risk Analysis for Consolidated debt (% of NCR) , 2008-2020, Scenario without IBRD loan
neither policy reforms
Source: World Bank calculation

114
A3.42 On a technical consideration, the probability bands display the 10, 25, 50, 75 and 90 percentiles computed from the N Monte-Carlo simulations. The interpretation of the probability bands is as follows: in 75% of the cases, the projected value of the debt-to-NCR ratio lies below the limit indicated by the 75% band on the vertical axes. Hence the area lying between two bands, say the 25% and 75% probability bands, gives a range of values that can be taken by the debt-to-NCR ratio for each year, with a given probability—in this case, with a probability of 50%, as 75% - 25% = 50%.
A3.43 Hence in our case, in 90% of the cases, the debt-to-NCR ratio projected for 2012 takes on values lying between 165% and 185%.
8. GLOBAL CRISIS EFFECTS ON GoA FINANCES Sensitivity Analysis (Baseline GDP growth Rate).
A3.44 The strong effects of the global crisis on GoA fiscal situation as described in section V led to perform a sensitivity analysis to assess the effects of different growth assumptions on GoA fiscal sustainability. Table 3A.6 depictsdifferent growth rates that were used to simulate the impacts o Alagoas’s fiscal trends under the no-reform and reform scenario.
Table 3A. 6: Growth Scenarios
2008 2009 2010 2011 2012 2013-2020
Baseline 0% -0.50% 3% 3.50% 4% 4.50%Lower GDP Growth rate 0% -1.50% 3% 3.50% 4% 4.50%
A3.45 Results are presented in Figures A3.11 to A3.13 below. Given the temporary nature of the GDP growth rate shock, the trends for the main fiscal variables did not exibit significant shifts. Of course, results show the deterioration of the scenarios withou and without reforms. The analysis shows that from 2009 and 2011 Alagoas would return to the non-compliance of the FRL indebtedness indicator. More important, results show that the adoption of the reforms would guarantee a faster return to fiscal sustainability and to the compliance of the Fiscal Responsbility Law.
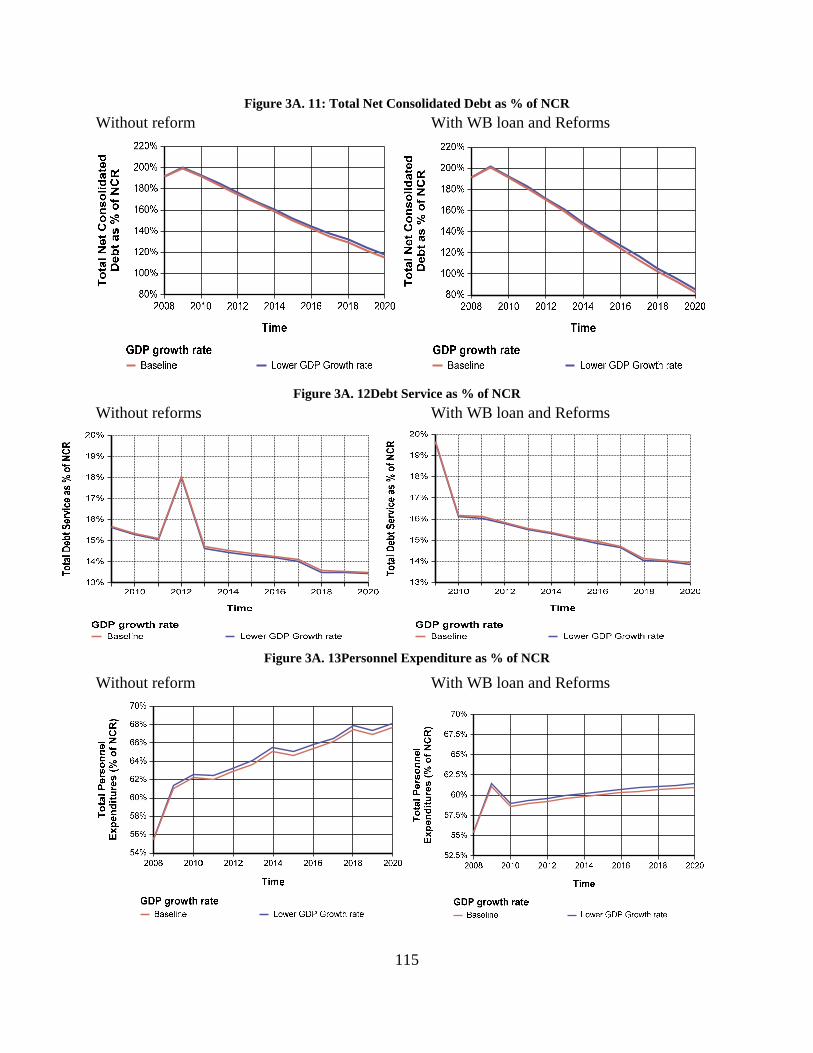
115
Figure 3A. 11: Total Net Consolidated Debt as % of NCR
Without reform With WB loan and Reforms
Figure 3A. 12Debt Service as % of NCR
Without reforms With WB loan and Reforms
Figure 3A. 13Personnel Expenditure as % of NCR
Without reform With WB loan and Reforms

116
Risk Analysis (Baseline GDP growth rate)
A3.46 Besides the sensitivity analysis for each variable, risk analyses were conducted to observe simultaneous random shocks in a set of variables and their impacts on the state’s financial situation.
A3.47 A random error was added to each of the following variables: tax revenues, federal government transfers, state government transfers, personnel expenditures and pension fund contributions, other current expenditures (including goods and services), and the exchange rate. For each variable, the random affects the simulations as depicted in Figures A3.14 to A3.1654.
Figure 3A. 14: Total Net Consolidated Debt as % of NCR
Figure 3A. 15: Debt Service as % of NCR
54. For a more detailed description of the stochastic model, see the methodological note below.
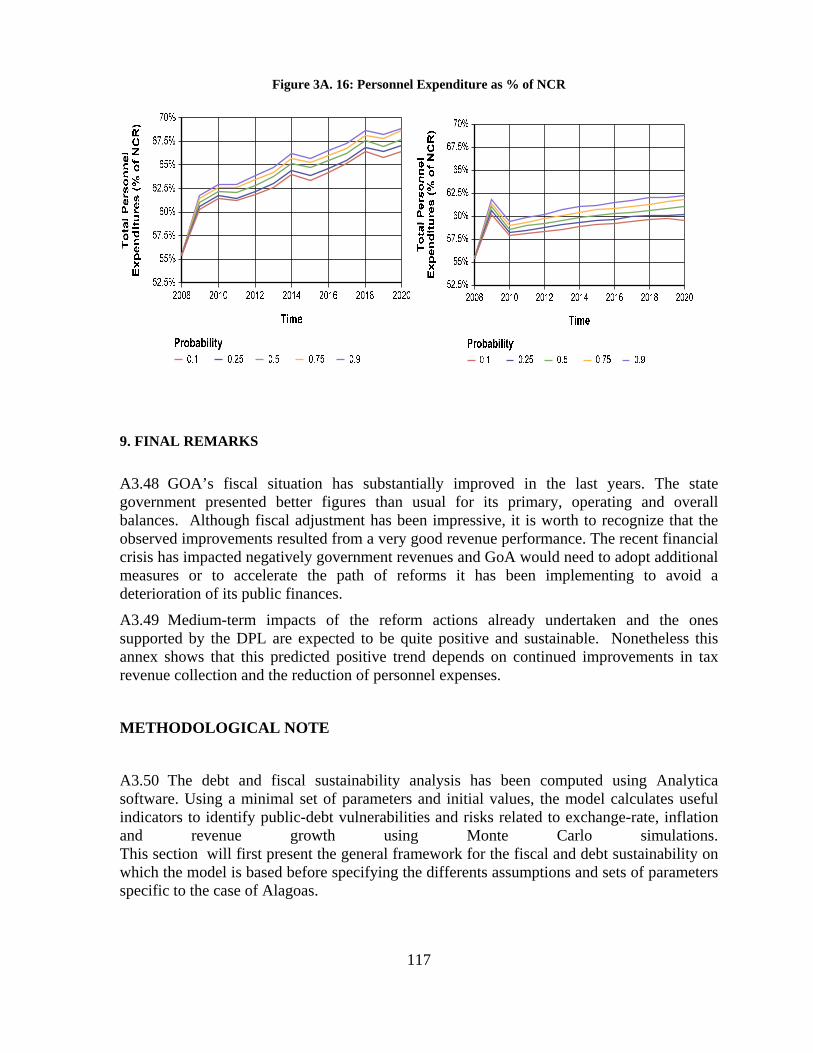
117
Figure 3A. 16: Personnel Expenditure as % of NCR
9. FINAL REMARKS
A3.48 GOA’s fiscal situation has substantially improved in the last years. The state government presented better figures than usual for its primary, operating and overall balances. Although fiscal adjustment has been impressive, it is worth to recognize that the observed improvements resulted from a very good revenue performance. The recent financial crisis has impacted negatively government revenues and GoA would need to adopt additional measures or to accelerate the path of reforms it has been implementing to avoid a deterioration of its public finances.
A3.49 Medium-term impacts of the reform actions already undertaken and the ones supported by the DPL are expected to be quite positive and sustainable. Nonetheless this annex shows that this predicted positive trend depends on continued improvements in tax revenue collection and the reduction of personnel expenses.
METHODOLOGICAL NOTE
A3.50 The debt and fiscal sustainability analysis has been computed using Analytica software. Using a minimal set of parameters and initial values, the model calculates useful indicators to identify public-debt vulnerabilities and risks related to exchange-rate, inflation and revenue growth using Monte Carlo simulations. This section will first present the general framework for the fiscal and debt sustainability on which the model is based before specifying the differents assumptions and sets of parameters specific to the case of Alagoas.
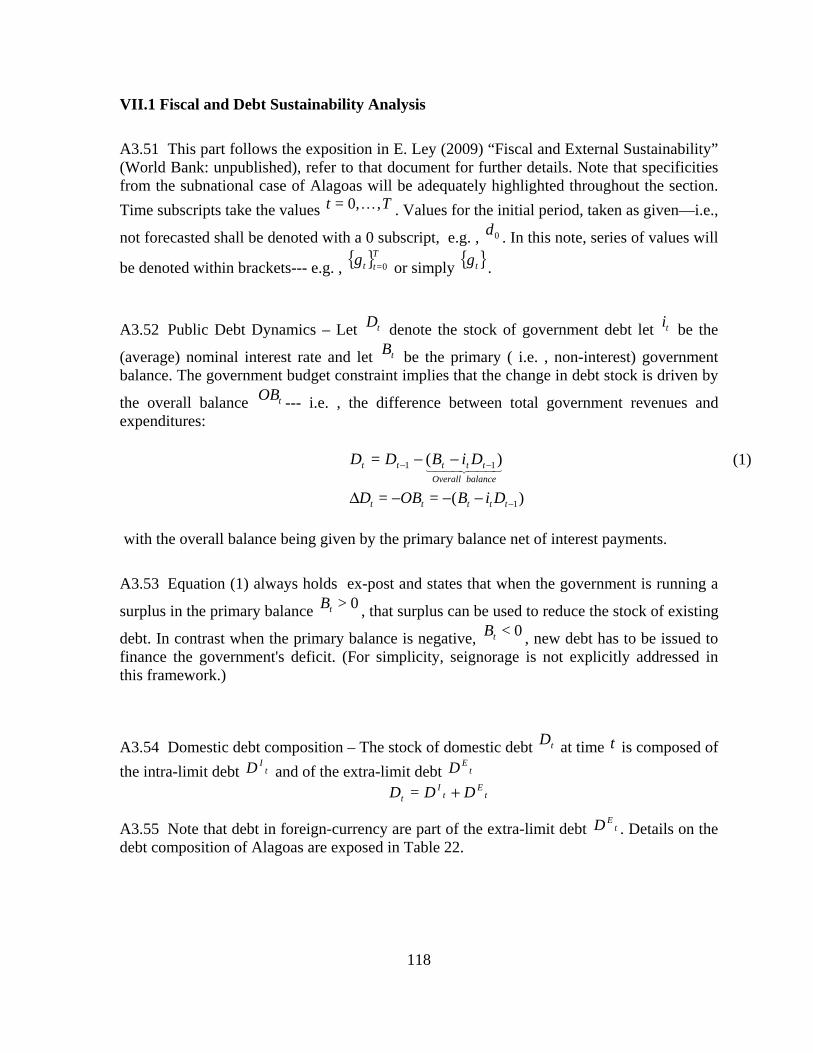
118
VII.1 Fiscal and Debt Sustainability Analysis
A3.51 This part follows the exposition in E. Ley (2009) “Fiscal and External Sustainability” (World Bank: unpublished), refer to that document for further details. Note that specificities from the subnational case of Alagoas will be adequately highlighted throughout the section.
Time subscripts take the values Tt ,0,= . Values for the initial period, taken as given—i.e.,
not forecasted shall be denoted with a 0 subscript, e.g. , 0d . In this note, series of values will
be denoted within brackets--- e.g. , { }T
ttg 0= or simply { }tg .
A3.52 Public Debt Dynamics – Let tD denote the stock of government debt let ti be the
(average) nominal interest rate and let tB be the primary ( i.e. , non-interest) government balance. The government budget constraint implies that the change in debt stock is driven by
the overall balance tOB --- i.e. , the difference between total government revenues and expenditures:
balanceOverall
ttttt DiBDD )(= 11 −− −− (1)
)(== 1−−−−Δ ttttt DiBOBD
with the overall balance being given by the primary balance net of interest payments.
A3.53 Equation (1) always holds ex-post and states that when the government is running a
surplus in the primary balance 0>tB , that surplus can be used to reduce the stock of existing
debt. In contrast when the primary balance is negative, 0<tB , new debt has to be issued to finance the government's deficit. (For simplicity, seignorage is not explicitly addressed in this framework.)
A3.54 Domestic debt composition – The stock of domestic debt tD at time t is composed of
the intra-limit debt tID and of the extra-limit debt t
ED t
Et
It DDD +=
A3.55 Note that debt in foreign-currency are part of the extra-limit debt tED . Details on the
debt composition of Alagoas are exposed in Table 22.

119
Table 3A. 17: Debt composition
Intra-limit Debt
Lei 9496/97 - ROLAGEMLei 9496/97 - PRODUBANDÍVIDA MOBILIÁRIALEI 8727/93LEI 7976/89 - VOTO 340 - GOVERNOLEI 7976/89 - AVISO 030 - GOVERNODMLP - GOVERNO
Extra-limit Debt
Domestically denominatedPARANÁFGTSINSSReceita FederalForeign-currency denominatedPRODETURPNAFEBIRD
Source: Secretary of Fazenda
A3.56 Cashflow Analysis – The size of gross debt issuance (or withdrawals) is determined by the primary balance and the debt service. Debt service is defined as the sum of principal
repayments (amortization), tA , and interest payments, 1−tt Di . Equivalently, gross debt issuance is determined by the overall balance and amortizations. However, as equation (2) shows, net change in debt, DΔ , is determined solely by the overall balance.
A3.57 Rewriting equation (2), we obtain the debt-dynamics equation: ttt OBDD −−1=
debtNew
tttt
debtExisting
tt BDiAAD )()(= 11 −++− −− (2)
A3.58 The size of the gross debt issuance is important for assessing rollover risk---an appropriate cashflow analysis can flag important vulnerabilities.
A3.59 Debt service ceiling – The PAF (Program of Fiscal Adjustment) sets a cap to the intra-limit debt service of 15 percent of the State’s net real revenues (NRR) debt service with the exceeding interest being automatically capitalized and incoporated into the so-called intra-limit residual.
A3.60 The amortization tA is then defined as a residual variable such as
Ittt iDNRRA 1*15.0 −−= (3)

120
A3.61 Indexation of the debt – In the case of Brazil, subantional intra-limit debts are indexed by inflation. By taking into account the amortization and the indexation of the debt we have from Equation (3):
)()(]1[= 1 ttttt OBAADD −+−+ −π (4)
ttttt OBADD −−+ −− )(= 11 π
A3.62 Where )( 1 ttt AD −−π is the automatic indexation of the principal. Note that the
indexation has no effect on the gross debt issuance, but do affect the evolution in nominal terms of the stock of debt.
A3.63 Ratios to Net Current Revenue (NCR) — Normalizing equation (1) by NCR provides the most important FRL indicator and by the same token gives a sense of the government's ability to service its debt obligations. The law of motion of the government's debt-to-NCR ratio is thus given by:
ttttttt NCRTBNCRDiNCRD //)(1=/ 1 −+ −
t
t
t
t
tt
t
NCR
B
NCR
D
g
i−
++
+
−
−
1
1
))(1(1
)(1=
π
where tg is the growth rate of real GDP and tπ is the inflation rate.
A3.64 Using lowercase symbols to denote ratios to NCR, the dynamics of the debt-to-NCR ratio is:
tttt
tt bd
g
id −
+++
−1))(1(1
)(1=
π
ttt
t bdg
r−
++
−11
1= (5)
where the real interest rate is given by )(1)(= ππ +÷−ir .
A3.65 The change in the debt-to-NCR ratio is therefore given by
ttt
ttt bd
g
grd −
+−
Δ −11= (6)
A3.66 From (5) it is apparent that to stabilize the debt-to-NCR ratio td ( 0=tdΔ ), the real
interest-growth differential )( tt gr − must be balanced by the primary surplus/deficit. Thus,

121
when tt gr > , a primary surplus is required to achieve a non-explosive path for the debt-to-NCR ratio.
A3.67 Debt in Foreign Currency— When governments can borrow in foreign currency, then
government debt D has a domestic-denominated component hD (home), and a foreign-
denominated component fD :
f
tthtt DeDD += (7)
A3.68 with e being the exchange rate (price of one unit of foreign currency in terms of domestic currency). Let us define the fraction of foreign-denominated debt as
111 /= −−− tf
ttf DDeα , and, reciprocally, the fraction of domestic-denominated debt as
fh αα −1= . The dynamics of the debt-to-GDP ratio in an open economy is given by:
tttt
ft
ftt
t bdg
iid −
+++++
−1)1()(1
)(1ˆ1=
παε
(8)
A3.69 with 1/= −Δ ttt eeε being the rate of depreciation of the local currency -- i.e. , 0>tε
means depreciation, ft
fht
ht iii αα +=ˆ being a weighted average of the domestic interest rate
hti and the foreign interest rate f
ti . Particular attention must now be paid to exchange rate
movements since they may affect the debt burden, especially during sharp exchange-rate adjustments.
VII.2 Model setting for the specific case of Alagoas
A3.70 In this section we will first expose the different policy reforms considered in our scenarios, then we will specify the equations defining the debt sustainability analysis.
A3.71 Policy reforms – The policy reforms are those described in Section V and summarized in Table 22.
A3.72 Debt dynamics – As mentioned above the stock of domestic debt tD is composed of
the intra-limit debt tID and of the extra-limit debt t
ED t
Et
It DDD +=
A3.73 Note that the extra-limit debt is composed in turn by a foreign-denominated EtfD , part
and a domestic-denominated component EthD , :
Etf
Eth
Et DDD ,, +=
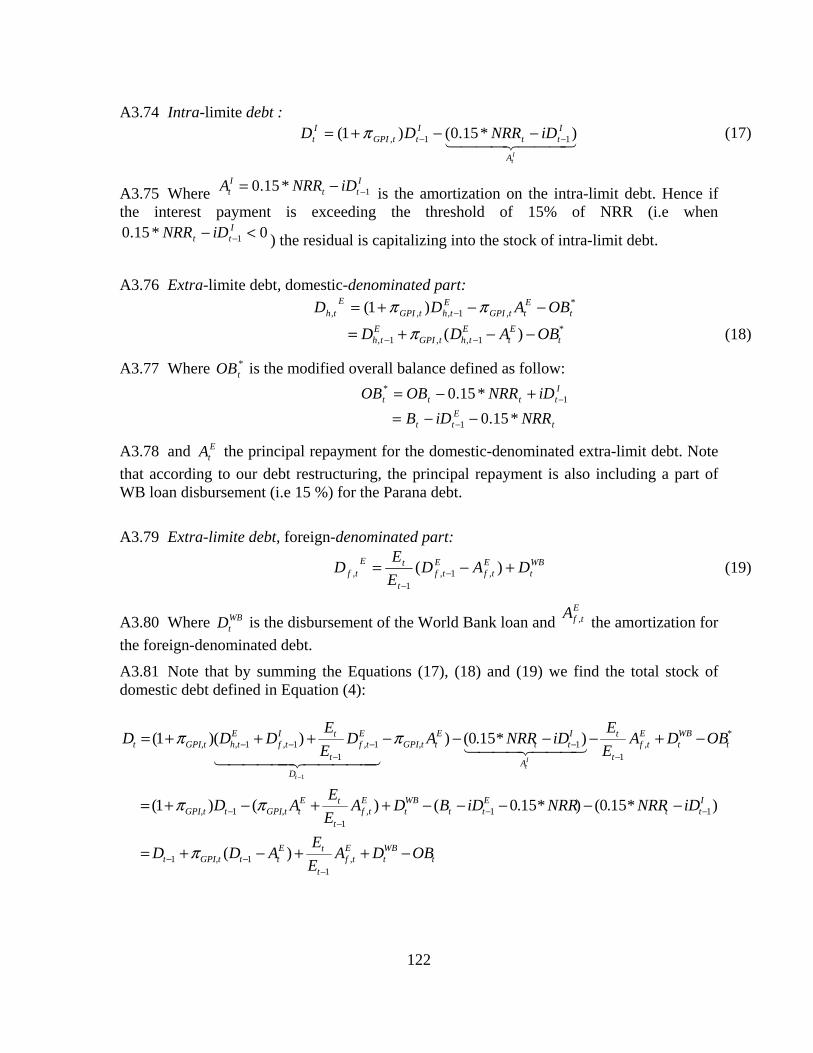
122
A3.74 Intra-limite debt :
ItA
Itt
IttGPI
It iDNRRDD )*15.0()1( 11, −− −−+= π (17)
A3.75 Where Itt
It iDNRRA 1*15.0 −−= is the amortization on the intra-limit debt. Hence if
the interest payment is exceeding the threshold of 15% of NRR (i.e when 0*15.0 1 <− −
Itt iDNRR ) the residual is capitalizing into the stock of intra-limit debt.
A3.76 Extra-limite debt, domestic-denominated part: *
,1,,, )1( tEttGPI
EthtGPI
Eth OBADD −−+= − ππ
*1,,1, )( t
Et
EthtGPI
Eth OBADD −−+= −− π (18)
A3.77 Where *tOB is the modified overall balance defined as follow:
Itttt iDNRROBOB 1
* *15.0 −+−=
tEtt NRRiDB *15.01 −−= −
A3.78 and EtA the principal repayment for the domestic-denominated extra-limit debt. Note
that according to our debt restructuring, the principal repayment is also including a part of WB loan disbursement (i.e 15 %) for the Parana debt.
A3.79 Extra-limite debt, foreign-denominated part:
WBt
Etf
Etf
t
tEtf DAD
E
ED +−= −
−
)( ,1,1
, (19)
A3.80 Where WBtD is the disbursement of the World Bank loan and
EtfA , the amortization for
the foreign-denominated debt.
A3.81 Note that by summing the Equations (17), (18) and (19) we find the total stock of domestic debt defined in Equation (4):
tWBt
Etf
t
tEtttGPIt
Itt
Ett
WBt
Etf
t
tEttGPIttGPI
tWBt
Etf
t
t
A
Itt
EttGPI
D
Etf
t
tItf
EthtGPIt
OBDAE
EADD
iDNRRNRRiDBDAE
EAD
OBDAE
EiDNRRAD
E
EDDD
It
t
−++−+=
−−−−−++−+=
−+−−−−+++=
−−−
−−−
−
−−−
−−−
−
,1
1,1
11,1
,1,
*,
11,1,
11,1,,
)(
)*15.0()*15.0()()1(
)*15.0())()1(
1
π
ππ
ππ

123
ANNEX 4: FUND RELATIONS NOTE
Public Information Notices (PINs) form part of the IMF's efforts to promote transparency of the IMF's views and analysis of economic developments and policies. With the consent of the country (or countries) concerned, PINs are issued after Executive Board discussions of Article IV consultations with member countries, of its surveillance of developments at the regional level, of post-program monitoring, and of ex post assessments of member countries with longer-term program engagements. PINs are also issued after Executive Board discussions of general policy matters, unless otherwise decided by the Executive Board in a particular case.
A4.1 On July 16, 2009, the Executive Board of the International Monetary Fund (IMF) concluded the Article IV consultation with Brazil.1
Background
A4.2 Brazil has built a strong macroeconomic framework over the past decade, which has served to increase its resilience to the global economic crisis. Sustained fiscal discipline and implementation of the inflation targeting regime have reduced fiscal and external vulnerabilities, and the flexible exchange rate regime has played a key role, allowing the economy to adjust quickly to external shocks. Public debt has been lowered in relation to GDP, and substantial international reserves have been accumulated. While the economy has been sharply affected by the global crisis—GDP shrank by 4½ percent in the two quarters to March 2009—the high credibility of the policy framework has allowed the authorities to adopt countercyclical measures. There are signs that the economy began to improve in the second quarter of this year, supported by private consumption and a healthy financial system.
A4.3 The global downturn affected Brazil through a sudden curtailment in external credit, as well as a decline in commodity prices and export demand. The disruption in global financial markets also led to a liquidity squeeze for Brazilian corporates and financial firms. Access to credit became limited, especially for small- and medium-sized firms. The weakening of external conditions also led to pressures on the currency, which depreciated by about 23 percent against the U.S. dollar between mid-September and end-December 2008.
A4.4 The creation of lending facilities in foreign currencies and intervention in the foreign exchange market through futures helped stabilize domestic financial conditions relatively rapidly, while making parsimonious use of cash reserves. Exchange rate depreciation and equity market price declines reduced the stock of nonresidents’ claims on the economy, without generating a large outflow of reserves. Since the beginning of this year, the real has appreciated by 17 percent against the U.S. dollar, and the stock market has been among the best performers globally.
A4.5 Brazilian financial institutions, which were not exposed to impaired assets abroad, have built strong capital buffers in recent years, albeit at levels varying across institutions. Bank liquidity ratios have recovered after some dipping in the fourth quarter of

124
2008. Nonperforming loan ratios (NPLs) have risen with the weakening in economic activity. In recent months, the extension of credit by private banks has slowed, reflecting greater caution as economic activity weakens and NPLs rise, while the share of public banks in total credit has risen. The external financing needs of the corporate sector appear manageable.
A4.6 Monetary policy has been eased substantially. With inflation trending downward since July 2008, the policy rate has been cut by 450 basis points since January 2009, and the equivalent of 3½ percent of GDP in liquidity has been released through reductions in reserve requirements. Inflationary expectations have remained well anchored, despite the significant depreciation of the currency and the fact that inflation was still close to the top of the target range in late 2008.
A4.7 Federal Government revenues declined by close to 7 percent in real terms during January−May 2009 compared with the same period in 2008. The government has announced some stimulative tax and spending initiatives. It is also providing additional resources to the development bank BNDES (equivalent to 3½ percent of GDP over two years). The primary surplus is targeted to decline by 1½ percent of GDP in 2009. The adjustor for public investment, and resources from the sovereign wealth fund, provide additional flexibility to maintain spending should staff’s less optimistic revenue projections materialize. While the net debt ratio is expected to increase this year and public financing needs remain large, at approximately 19½ percent of GDP, long-term interest rates have remained below the levels prevailing a year ago.
Executive Board Assessment
A4.8 After suffering a sharp contraction in the last quarter of 2008 and first quarter of 2009, Directors welcomed signs that the Brazilian economy has began to improve and considered Brazil to be in a favorable position to weather well the global crisis. They praised the Brazilian authorities’ robust policy framework and sound prudential supervision, which has allowed an appropriate and timely countercyclical policy response. If the growth outlook were to deteriorate significantly from the authorities’ current projections, Directors saw room for additional fiscal and monetary easing, subject to careful monitoring of market reaction.
A4.9 Directors considered that the flexible exchange rate regime has served Brazil well. They generally commended the authorities for accumulating a comfortable foreign reserves cushion, which has helped limit the adverse effects of the global financial turmoil. Directors agreed that intervention to address disorderly market conditions remains appropriate. They noted that under the most recent and globally-consistent application of the Consultative Group on Exchange Rate Issues (CGER) methodology, based on exchange rates prevailing during the reference period February 25–March 25, Brazil’s real exchange rate was assessed to be broadly in equilibrium, but had appreciated slightly since the reference period.
A4.10 Directors endorsed the authorities’ planned fiscal stimulus and reduction in the primary fiscal surplus target in 2009. If revenues are less buoyant than projected. Directors saw scope for further flexibility in the fiscal target through the use of the adjustor for public investment and resources from the sovereign wealth fund. They encouraged the authorities to contain other current expenditure, including wages, which will be difficult to reverse as the economy recovers.
125
A4.11 Directors stressed the importance of keeping public debt on a declining path over the medium term, and welcomed the authorities’ plans to return to a higher primary surplus in 2010 as the economy recovers. Directors underscored the importance of instituting a sound medium-term fiscal framework and encouraged efforts to reinvigorate the reform process, including with respect to tax and pension reform. A gradual reduction of revenue earmarking and expenditure rigidities would also be desirable.
A4.12 Directors praised the authorities’ adroit management of liquidity in domestic and foreign exchange markets. Intervention in the foreign exchange market has allowed participants to hedge exposures rapidly. Significant cuts in reserve requirements, expansion in the range of collateral accepted in discount operations, liquidity provision to smaller banks by the Deposit Insurance Fund, and the temporary extension of deposit guarantees have also eased tensions in domestic money markets and helped redistribute liquidity to smaller banks. Directors welcomed recent proposals to change the taxation of savings accounts, noting that further changes may be needed to facilitate monetary easing. They also encouraged efforts to lower the high interest rate spreads.
A4.13 Directors considered that the financial system has proven resilient during the global crisis but that some risks may persist at the individual bank level. Therefore, they encouraged the authorities to further strengthen the financial safety net and the assessment of contagion risks across financial intermediaries. Directors emphasized the importance of ensuring that banks, including public banks, do not take on excessive risk. They encouraged reviewing the limits on financial funds’ exposures to single counterparties and the regulations on asset sales between banks and affiliated funds. Directors suggested clarifying the role of the central bank and other institutions to ensure that adequate resources would be available in the event of systemic crisis scenarios. Directors supported the authorities’ efforts to ensure greater availability of information on nonfinancial firms’ foreign exchange exposures. Some Directors encouraged the authorities to undertake a Financial Sector Assessment Program (FSAP) update in the near future.

126
Table 4A. 1: Brazil: Selected Economic Indicators
2004 2005 2006 2007 2008 Proj.2009
Proj.2010
(Annual percentage changes, unless otherwise indicated)
Real GDP 5.7 3.2 4.0 5.7 5.1 -1.3 2.5
Domestic demand (contribution to growth) 5.1 2.8 4.8 6.7 6.9 -2.0 2.5
Private consumption 3.8 4.5 5.2 6.3 5.4 0.0 4.5
Public consumption 4.1 2.3 2.6 4.7 5.6 2.3 -3.8
Gross investment 9.4 -0.3 6.1 9.6 11.8 -8.8 2.3
Gross fixed capital formation 9.1 3.6 9.8 13.5 13.8 -12.8 3.5
Foreign balance (contribution to growth) 0.6 0.4 -0.8 -1.0 -1.9 0.7 0.0
Exports of GNFS (contribution to growth) 1.5 1.0 0.6 0.8 -0.1 -0.4 0.4
Imports of GNFS (contribution to growth) 0.9 0.6 1.4 1.8 1.8 -1.1 0.4
Prices
Consumer price index (IPCA, period average)
6.6 6.9 4.2 3.6 5.7 4.8 4.0
Consumer price index (IPCA, end of period)
7.6 5.7 3.1 4.5 5.9 4.2 4.0
GDP deflator 8.0 7.2 6.2 3.7 5.9 2.2 4.5
Terms of trade 0.5 0.9 5.1 3.5 3.5 -8.1 -1.7
(In percent of GDP)
Public finances
Federal government 1/ 2/
Total revenues 21.8 22.8 23.0 23.9 24.8 23.8 24.2
Total expenditures 23.2 26.2 26.1 26.1 25.7 26.3 24.9
Of which: interest 4.1 6.0 5.3 4.6 3.8 3.0 2.8
Primary balance 2.7 2.6 2.2 2.3 3.0 0.6 2.2
Consolidated public sector 2/
Primary balance 4.2 3.9 3.3 3.6 4.1 1.5 3.3
Overall balance -2.4 -3.4 -3.5 -2.5 -2.0 -3.2 -1.3
Public sector net debt 3/ 49.3 46.7 45.0 44.3 36.5 41.6 40.3
(12-month percentage changes, unless otherwise indicated)

127
Money and credit
Base money 4/ 4.7 7.7 12.6 21.8 -17.6 20.6 5.8
Broad money (M2) 5/ 16.6 19.2 18.6 18.4 18.0 11.5 11.9
Credit to the public sector (net) 10.1 9.5 13.9 6.1 11.3 3.1 7.1
Credit to the private sector 17.2 22.5 21.8 28.9 28.3 14.3 21.2
(In billions of U.S. dollars, unless otherwise indicated)
Balance of payments
Current account 11.7 14.0 13.6 1.6 -28.5 -18.0 -21.8
Merchandise trade balance 33.6 44.7 46.5 40.0 24.7 17.8 15.4
Exports 96.5 118.3 137.8 160.6 197.9 158.0 166.8
Imports -62.8 -73.6 -91.4 -120.6 -173.2 -140.3 -151.4
Services, income, and transfers (net) -22.0 -30.7 -32.8 -38.5 -53.2 -35.8 -37.3
Capital and financial account -7.5 -9.5 16.3 89.1 29.2 28.2 30.3
Foreign direct investment (gross) 18.1 15.1 18.8 34.6 45.1 25.0 27.6
Portfolio investment -5.2 4.6 4.3 37.9 3.5 -4.1 0.4
Other capital (net) -20.5 -29.1 -6.8 16.6 -19.4 7.3 2.4
Errors and omissions -1.9 -0.2 0.6 -3.2 2.3 -0.1 0.0
Change in net international reserves 8.0 28.5 32.0 94.5 13.4 7.8 8.5
Current account (in percent of GDP) 1.8 1.6 1.3 0.1 -1.8 -1.4 -1.6
Outstanding external debt (in percent of GDP)
30.3 19.1 15.8 14.4 12.4 14.7 14.2
Debt service ratio (in percent of exports of goods and services)
66.6 68.9 58.2 65.9 40.7 48.3 47.5
Gross reserves/short-term external debt (residual maturity, in percent)
68.9 73.0 100.0 231.3 259.2 284.4 272.4
Sources: Central Bank of Brazil; Ministry of Finance; and Fund staff estimates. 1/ Includes the central government, central bank, and social security system. 2/ Transfers to the sovereign wealth fund are excluded from expenditure in 2008 (0.5 percent of GDP). The 2009 projection assumes use of resources from the sovereign wealth fund (0.5 percent of GDP) and use of the Public Investment Pilot Program adjustor (0.5 percent of GDP). Prior to 2005, primary and overall balance data include Petrobras. 3/ Includes Petrobras. 4/ End of period. Currency issued plus required and free reserves on demand deposits held at the central bank. 5/ End of period. Currency in circulation plus demand, time and savings deposits.
1 Under Article IV of the IMF's Articles of Agreement, the IMF holds bilateral discussions with members, usually every year. A staff team visits the country, collects economic and financial information, and discusses with officials the country's economic developments and policies. On return to headquarters, the

128
staff prepares a report, which forms the basis for discussion by the Executive Board. At the conclusion of the discussion, the Managing Director, as Chairman of the Board, summarizes the views of Executive Directors, and this summary is transmitted to the country's authorities.
IMF EXTERNAL RELATIONS DEPARTMENT
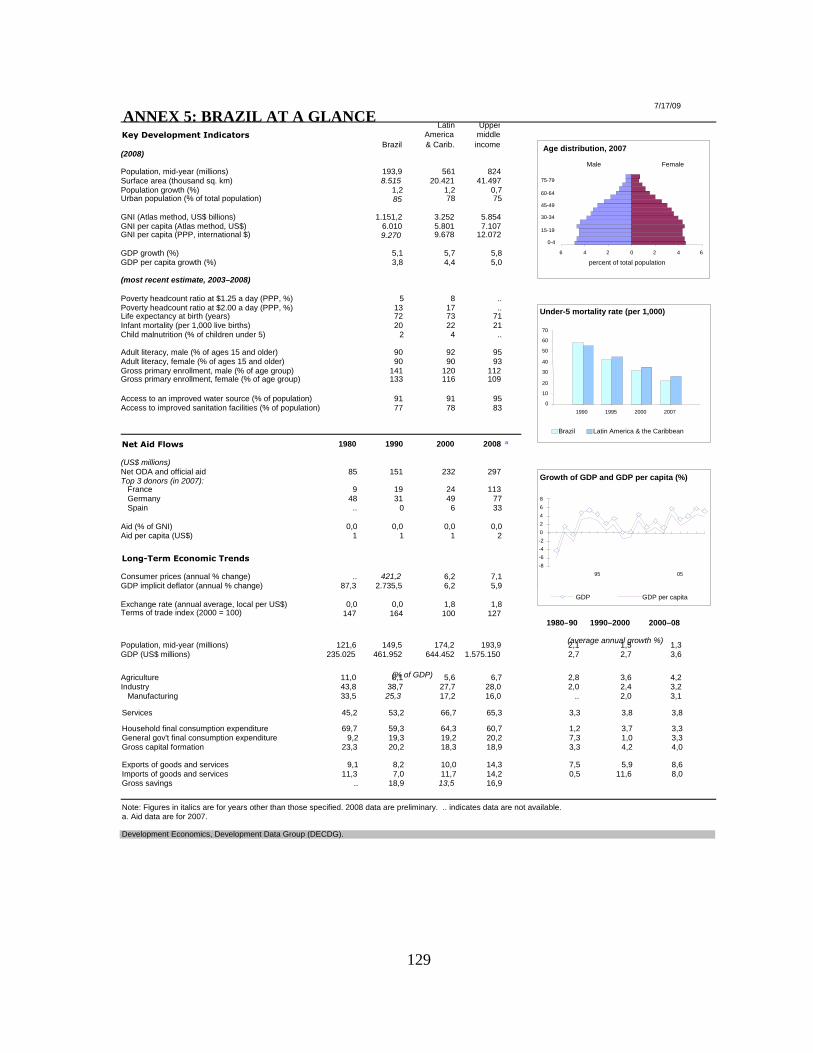
129
ANNEX 5: BRAZIL AT A GLANCE7/17/09
Latin Upper
Key Development Indicators
America middleBrazil & Carib. income
(2008)
Population, mid-year (millions) 193,9 561 824Surface area (thousand sq. km) 8.515 20.421 41.497Population growth (%) 1,2 1,2 0,7Urban population (% of total population) 85 78 75
GNI (Atlas method, US$ billions) 1.151,2 3.252 5.854GNI per capita (Atlas method, US$) 6.010 5.801 7.107GNI per capita (PPP, international $) 9.270 9.678 12.072
GDP growth (%) 5,1 5,7 5,8GDP per capita growth (%) 3,8 4,4 5,0
(most recent estimate, 2003–2008) Poverty headcount ratio at $1.25 a day (PPP, %) 5 8 ..Poverty headcount ratio at $2.00 a day (PPP, %) 13 17 ..Life expectancy at birth (years) 72 73 71Infant mortality (per 1,000 live births) 20 22 21Child malnutrition (% of children under 5) 2 4 ..
Adult literacy, male (% of ages 15 and older) 90 92 95Adult literacy, female (% of ages 15 and older) 90 90 93Gross primary enrollment, male (% of age group) 141 120 112Gross primary enrollment, female (% of age group) 133 116 109
Access to an improved water source (% of population) 91 91 95Access to improved sanitation facilities (% of population) 77 78 83
Net Aid Flows 1980 1990 2000 2008 a
(US$ millions) Net ODA and official aid 85 151 232 297Top 3 donors (in 2007): France 9 19 24 113 Germany 48 31 49 77 Spain .. 0 6 33
Aid (% of GNI) 0,0 0,0 0,0 0,0Aid per capita (US$) 1 1 1 2
Long-Term Economic Trends Consumer prices (annual % change) .. 421,2 6,2 7,1GDP implicit deflator (annual % change) 87,3 2.735,5 6,2 5,9
Exchange rate (annual average, local per US$) 0,0 0,0 1,8 1,8Terms of trade index (2000 = 100) 147 164 100 127
1980–90 1990–2000 2000–08
Population, mid-year (millions) 121,6 149,5 174,2 193,9 2,1 1,5 1,3GDP (US$ millions) 235.025 461.952 644.452 1.575.150 2,7 2,7 3,6
Agriculture 11,0 8,1 5,6 6,7 2,8 3,6 4,2Industry 43,8 38,7 27,7 28,0 2,0 2,4 3,2 Manufacturing 33,5 25,3 17,2 16,0 .. 2,0 3,1
Services 45,2 53,2 66,7 65,3 3,3 3,8 3,8
Household final consumption expenditure 69,7 59,3 64,3 60,7 1,2 3,7 3,3General gov't final consumption expenditure 9,2 19,3 19,2 20,2 7,3 1,0 3,3Gross capital formation 23,3 20,2 18,3 18,9 3,3 4,2 4,0
Exports of goods and services 9,1 8,2 10,0 14,3 7,5 5,9 8,6Imports of goods and services 11,3 7,0 11,7 14,2 0,5 11,6 8,0Gross savings .. 18,9 13,5 16,9
Note: Figures in italics are for years other than those specified. 2008 data are preliminary. .. indicates data are not available.a. Aid data are for 2007. Development Economics, Development Data Group (DECDG).
(average annual growth %)
(% of GDP)
6 4 2 0 2 4 6
0-4
15-19
30-34
45-49
60-64
75-79
percent of total population
Age distribution, 2007
Male Female
0
10
20
30
40
50
60
70
1990 1995 2000 2007
Brazil Latin America & the Caribbean
Under-5 mortality rate (per 1,000)
-8
-6
-4
-2
0
2
4
6
8
95 05
GDP GDP per capita
Growth of GDP and GDP per capita (%)

130
Braz
Balance of Payments and Trade 2000 2008
(US$ millions)Total merchandise exports (fob) 54.187 184.216Total merchandise imports (cif) 55.783 155.475Net trade in goods and services -7.860 8.146
Current account balance -24.225 -28.192 as a % of GDP -3,8 -1,8
Workers' remittances and compensation of employees (receipts) 1.649 4.382
Reserves, including gold 33.011 206.806
Central Government Finance
(% of GDP)Current revenue (including grants) 0,0 32,6 Tax revenue 0,0 24,1Current expenditure 0,0 30,2
Technology and Infrastructure 2000 2007Overall surplus/deficit -0,2 0,1
Paved roads (% of total) 5,5 ..Highest marginal tax rate (%) Fixed line and mobile phone Individual 28 28 subscribers (per 100 people) 31 84 Corporate 15 15 High technology exports
(% of manufactured exports) 18,7 12,4
External Debt and Resource FlowsEnvironment
(US$ millions)Total debt outstanding and disbursed 241.552 237.472 Agricultural land (% of land area) 31 31Total debt service 64.843 55.319 Forest area (% of land area) 58,3 56,5Debt relief (HIPC, MDRI) – – Nationally protected areas (% of land area) .. 17,9
Total debt (% of GDP) 37,5 17,8 Freshwater resources per capita (cu. meters) 30.227 28.277Total debt service (% of exports) 90,9 22,8 Freshwater withdrawal (billion cubic meters) 59,3 ..
Foreign direct investment (net inflows) 32.779 34.585 CO2 emissions per capita (mt) 1,8 1,7Portfolio equity (net inf lows) 3.076 26.217
GDP per unit of energy use (2005 PPP $ per kg of oil equivalent) 7,3 7,3
Energy use per capita (kg of oil equivalent) 1.090 1.184
World Bank Group portfolio 2000 2007
(US$ millions)
IBRD Total debt outstanding and disbursed 7.377 9.676 Disbursements 1.692 606 Principal repayments 887 805 Interest payments 464 548
IDA Total debt outstanding and disbursed 0 0 Disbursements 0 0
Private Sector Development 2000 2008 Total debt service 0 0
Time required to start a business (days) – 152 IFC (fiscal year)Cost to start a business (% of GNI per capita) – 8,2 Total disbursed and outstanding portfolio 2.146 1.706Time required to register property (days) – 42 of which IFC own account 1.157 1.284
Disbursements for IFC own account 160 397Ranked as a major constraint to business 2000 2007 Portfolio sales, prepayments and (% of managers surveyed who agreed) repayments for IFC own account 111 175 Tax rates .. 84,5 Access to/cost of f inancing .. 84,3 MIGA
Gross exposure 706 288Stock market capitalization (% of GDP) 35,1 102,8 New guarantees 315 5Bank capital to asset rat io (%) 12,1 9,9
Note: Figures in italics are for years other than those specif ied. 2008 data are preliminary. 6/4/09.. indicates data are not available. – indicates observation is not applicable.
Development Economics, Development Data Group (DECDG).
0 25 50 75 100
Control of corruption
Rule of law
Regulatory quality
Political stability
Voice and accountability
Country's percentile rank (0-100)higher va lues imply better ratings
2007
2000
Governance indicators, 2000 and 2007
Sourc e: Kaufmann-Kraay-Mas truzzi, World B ank
Short-term; 39.248
IBRD; 9.676Other multi- lateral; 13.360
IMF; 0IDA; 0
Private; 171.712
Bilateral ; 3.476
Composition of total external debt, 2007
US$ millions

131
Millennium Development Goals Brazil
With selected targets to achieve between 1990 and 2015(estimate closest to date shown, +/- 2 years)
Goal 1: halve the rates for extreme poverty and malnutrition 1990 1995 2000 2007 Poverty headcount rat io at $1.25 a day (PPP, % of population) 15,5 12,0 11,0 5,2 Poverty headcount rat io at national poverty line (% of population) .. .. 22,0 21,5 Share of income or consumption to the poorest qunitile (%) 2,4 2,6 2,7 3,0 Prevalence of malnutrit ion (% of children under 5) .. 4,5 .. 2,2
Goal 2: ensure that children are able to complete primary schooling Primary school enrollment (net, %) 84 .. 92 94 Primary completion rate (% of relevant age group) .. 90 108 106 Secondary school enrollment (gross, %) 54 64 104 105 Youth literacy rate (% of people ages 15-24) 90 91 93 ..
Goal 3: eliminate gender disparity in education and empower women Ratio of girls to boys in primary and secondary education (%) .. .. 103 103 Women employed in the nonagricultural sector (% of nonagricultural employment) 35 39 40 .. Proportion of seats held by women in national parliament (%) 5 7 6 9
Goal 4: reduce under-5 mortality by two-thirds Under-5 mortality rate (per 1,000) 58 42 32 22 Infant mortality rate (per 1,000 live births) 49 37 28 20 Measles immunization (proportion of one-year olds immunized, %) 78 87 99 99
Goal 5: reduce maternal mortality by three-fourths Maternal mortality rat io (modeled estimate, per 100,000 live births) .. .. .. 110 Births attended by skilled health staff (% of total) 72 88 96 97 Contraceptive prevalence (% of women ages 15-49) 59 77 .. ..
Goal 6: halt and begin to reverse the spread of HIV/AIDS and other major diseases Prevalence of HIV (% of population ages 15-49) 0,4 0,6 0,6 0,6 Incidence of tuberculosis (per 100,000 people) 84 71 60 48 Tuberculosis cases detected under DOTS (%) .. .. 7 69
Goal 7: halve the proportion of people without sustainable access to basic needs Access to an improved water source (% of populat ion) 83 86 89 91 Access to improved sanitation facilit ies (% of populat ion) 71 73 74 77 Forest area (% of total land area) 61,5 59,9 58,3 56,5 Nationally protected areas (% of total land area) .. .. .. 17,9 CO2 emissions (metric tons per capita) 1,4 1,5 1,8 1,7 GDP per unit of energy use (constant 2005 PPP $ per kg of oil equivalent) 7,7 7,8 7,3 7,3
Goal 8: develop a global partnership for development Telephone mainlines (per 100 people) 6,3 8,2 17,8 20,6 Mobile phone subscribers (per 100 people) 0,0 0,8 13,3 63,1 Internet users (per 100 people) 0,0 0,1 2,9 35,2 Personal computers (per 100 people) 0,3 1,7 4,9 16,1
Note: Figures in italics are for years other than those specif ied. . . indicates data are not available. 6/4/09
Development Economics, Development Data Group (DECDG).
Brazil
0
25
50
75
100
125
2000 2002 2004 2006 2007
Primary net enrollment ratio
Ratio of gir ls to boys in primary &secondary education
Education indicators (%)
010
203040
50607080
90
2000 2002 2004 2006 2007
Fixed + mobile subscr ibers
Internet users
ICT indicators (per 100 people)
0
25
50
75
100
1990 1995 2000 2007
Brazil Latin America & the Caribbean
Measles immunization (% of 1-year olds)


M A T OG R O S S O
TOCANTINSB A H I A
MINAS GERA I S
F.D.
GOIASMATO GROSSO
DO SUL
SÃO PAULO
ESPÍRITOSANTO
RIO DEJANEIRO
PARANÁ
STA CATARINA
RIO GRANDEDO SUL
A M A Z O N A S
RONDÔNIA
P A R Á
RORAIMA AMAPÁ
MARANHÃO CEARÁ
P I A U I
RIO GRANDEDO NORTE
PARAÍBA
ALAGOAS
SERGIPE
PERNAMBUCOACRE
Porto Alegre
Rio deJaneiro
São Paulo
Vitória
Salvador
Maceió
Recife
João Pessoa
Fortaleza
São Luís
Belém
Porto Velho
Cuiabá
Belo Horizonte
Goiânia
Teresina
Palma
Florianópolis
Curitaba
Aracaju
Natal
Macapá
Boa Vista
Manaus
Rio Branco
CampoGrande
BRASÍLIA
Porto Alegre
Rio deJaneiro
São Paulo
Vitória
Salvador
Maceió
Recife
João Pessoa
Fortaleza
São Luís
Belém
Porto Velho
Cuiabá
Belo Horizonte
Goiânia
Teresina
Palma
Florianópolis
Curitaba
Aracaju
Natal
Macapá
Boa Vista
Manaus
Rio Branco
CampoGrande
BRASÍLIA
M A T OG R O S S O
TOCANTINSB A H I A
MINAS GERA I S
F.D.
GOIASMATO GROSSO
DO SUL
SÃO PAULO
ESPÍRITOSANTO
RIO DEJANEIRO
PARANÁ
STA CATARINA
RIO GRANDEDO SUL
A M A Z O N A S
RONDÔNIA
P A R Á
RORAIMA AMAPÁ
MARANHÃO CEARÁ
P I A U I
RIO GRANDEDO NORTE
PARAÍBA
ALAGOAS
SERGIPE
PERNAMBUCOACRE
COLOMBIA
PERU
BOL IV IA
PARAGUAY
URUGUAY
ARGENT INA
CHILE
GUYANA
SURINAME
FrenchGuiana
(Fr.)
R.B. DEVENEZUELA
ATLANTIC
OCEAN
ATLANTIC
OCEAN
PACIFIC
OCEAN
BRAZIL
Th is map was produced by the Map Des ign Uni t o f The Wor ld Bank. The boundar ies , co lo rs , denominat ions and any other in format ionshown on th is map do not imply, on the par t o f The Wor ld BankGroup, any judgment on the lega l s tatus of any te r r i to ry , o r anyendorsement or acceptance of such boundar ies .
IBRD 37156
SEPTEMBER 2009
BRAZILALAGOAS STATE
STATE CAPITALS
NATIONAL CAPITAL
STATE BOUNDARIES
INTERNATIONAL BOUNDARIES
Top Related