


Languages
Pages
Legal

Do Board Contacts Matter? An analysis of the relationship between boards of directors’ ties and the performance of Australia’s largest companies.
Thesis submitted in partial fulfilment of the degree of Master of Business (Research)
Kevin J. Smith School of Accountancy
Faculty of Business Queensland University of Technology
2009


i
Keywords
corporate governance, boards of directors, directors, networks, social capital,
interlocks, resource dependence
ii
Abstract
Boards of directors are thought to provide access to a wealth of knowledge and
resources for the companies they serve, and are considered important to corporate
governance. Under the Resource Based View (RBV) of the firm (Wernerfelt, 1984)
boards are viewed as a strategic resource available to firms. As a consequence there has
been a significant research effort aimed at establishing a link between board attributes
and company performance. In this thesis I explore and extend the study of interlocking
directorships (Mizruchi, 1996; Scott 1991a) by examining the links between directors’
opportunity networks and firm performance. Specifically, I use resource dependence
theory (Pfeffer & Salancik, 1978) and social capital theory (Burt, 1980b; Coleman,
1988) as the basis for a new measure of a board’s opportunity network. I contend that
both directors’ formal company ties and their social ties determine a director’s
opportunity network through which they are able to access and mobilise resources for
their firms. This approach is based on recent studies that suggest the measurement of
interlocks at the director level, rather than at the firm level, may be a more reliable
indicator of this phenomenon.
This research uses publicly available data drawn from Australia’s top-105 listed
companies and their directors in 1999. I employ Social Network Analysis (SNA) (Scott,
1991b) using the UCINET software to analyse the individual director’s formal and
social networks. SNA is used to measure a the number of ties a director has to other
directors in the top-105 company director network at both one and two degrees of
separation, that is, direct ties and indirect (or ‘friend of a friend’) ties. These individual
measures of director connectedness are aggregated to produce a board-level network
metric for comparison with measures of a firm’s performance using multiple regression
analysis. Performance is measured with accounting-based and market-based measures.
Findings indicate that better-connected boards are associated with higher market-based
company performance (measured by Tobin’s q). However, weaker and mostly
unreliable associations were found for accounting-based performance measure ROA.
Furthermore, formal (or corporate) network ties are a stronger predictor of market
performance than total network ties (comprising social and corporate ties). Similarly,
iii
strong ties (connectedness at degree-1) are better predictors of performance than weak
ties (connectedness at degree-2).
My research makes four contributions to the literature on director interlocks. First, it
extends a new way of measuring a board’s opportunity network based on the director
rather than the company as the unit of interlock. Second, it establishes evidence of a
relationship between market-based measures of firm performance and the connectedness
of that firm’s board. Third, it establishes that director’s formal corporate ties matter
more to market-based firm performance than their social ties. Fourth, it establishes that
director’s strong direct ties are more important to market-based performance than weak
ties.
The thesis concludes with implications for research and practice, including a more
speculative interpretation of these results. In particular, I raise the possibility of reverse
causality – that is networked directors seek to join high-performing companies. Thus,
the relationship may be a result of symbolic action by companies seeking to increase the
legitimacy of their firms rather than a reflection of the social capital available to the
companies. This is an important consideration worthy of future investigation.

iv
Table of Contents KEYWORDS ......................................................................................................................................... I
ABSTRACT .......................................................................................................................................... II
LIST OF FIGURES ............................................................................................................................... VI
LIST OF TABLES ................................................................................................................................ VII
LIST OF APPENDICES ....................................................................................................................... VIII
STATEMENT OF ORIGINALITY............................................................................................................ IX
ACKNOWLEDGEMENTS ...................................................................................................................... X
CHAPTER 1 INTRODUCTION........................................................................................................... 1
1.1 BACKGROUND TO THE RESEARCH ..................................................................................................... 1 1.2 RESEARCH PROBLEM ..................................................................................................................... 2 1.3 JUSTIFICATION FOR THE RESEARCH ................................................................................................... 5 1.4 METHODOLOGY ........................................................................................................................... 6 1.5 OUTLINE OF THESIS ....................................................................................................................... 6 1.6 DEFINITIONS ................................................................................................................................ 7 1.7 DELIMITATIONS OF SCOPE AND KEY ASSUMPTIONS............................................................................... 9 1.8 CONCLUSION ............................................................................................................................. 10
CHAPTER 2 COMPANIES, BOARDS AND GOVERNANCE ................................................................ 12
2.1 INTRODUCTION .......................................................................................................................... 12 2.2 COMPANIES AND DIRECTORS’ LEGAL OBLIGATIONS ............................................................................ 12 2.3 CORPORATE GOVERNANCE AND THEORIES ....................................................................................... 15
2.3.1 Governance overview ................................................................................................... 15 2.3.2 Agency theory .............................................................................................................. 17 2.3.3 Stewardship theory ...................................................................................................... 20 2.3.4 Resource dependence theory ....................................................................................... 21 2.3.5 Resource based view of the firm .................................................................................. 22 2.3.6 Summary of key governance theories and their importance to this thesis .................. 23
2.4 BOARDS OF DIRECTORS - ROLES AND THEORIES ................................................................................. 24 2.4.1 Overview of board roles ............................................................................................... 24 2.4.2 Resource dependence role ........................................................................................... 26 2.4.3 Monitoring and control role ......................................................................................... 27 2.4.4 Service role ................................................................................................................... 28
2.5 THE STUDY OF BOARD STRUCTURE .................................................................................................. 28 2.5.1 Board size ..................................................................................................................... 29 2.5.2 Board independence .................................................................................................... 30 2.5.3 CEO duality ................................................................................................................... 32
2.6 CONCLUSION ............................................................................................................................. 33
CHAPTER 3 LITERATURE REVIEW & THEORETICAL DEVELOPMENT .............................................. 34
3.1 INTRODUCTION .......................................................................................................................... 34 3.2 DIRECTOR INTERLOCKS ................................................................................................................. 35
3.2.1 Definitions and overview .............................................................................................. 35 3.2.2 Classification of interlocks ............................................................................................ 37 3.2.3 Measurement of interlocks .......................................................................................... 38 3.2.4 Effects and consequences of interlocks ........................................................................ 39 3.2.5 Relationships of interlocks to firm performance .......................................................... 40
3.3 SOCIAL CAPITAL AND OPPORTUNITY NETWORKS ................................................................................ 45 3.3.1 Introduction to social capital ....................................................................................... 45 3.3.2 Defining social capital .................................................................................................. 45 3.3.3 Dimensions and measurement of social capital........................................................... 47 3.3.4 Application of social capital theory to boards.............................................................. 51
v
3.4 DEVELOPMENT OF RESEARCH QUESTIONS ........................................................................................ 55 3.5 HYPOTHESES DEVELOPMENT ......................................................................................................... 57 3.6 CONCEPTUAL MODEL .................................................................................................................. 60 3.7 CONCLUSION ............................................................................................................................. 61
CHAPTER 4 PHILOSOPHY, DESIGN AND METHOD ........................................................................ 62
4.1 INTRODUCTION .......................................................................................................................... 62 4.2 JUSTIFICATION FOR THE PARADIGM AND METHODOLOGY .................................................................... 62
4.2.1 Research philosophy .................................................................................................... 62 4.2.2 Approach to this research. ........................................................................................... 65
4.3 RESEARCH DESIGN AND METHOD ................................................................................................... 66 4.3.1 Overview ...................................................................................................................... 66 4.3.2 Hypothesis testing methods and justification .............................................................. 67 4.3.3 Study period and sample selection .............................................................................. 69 4.3.4 Constructs and measures ............................................................................................. 70 4.3.5 Data sources and data collection ................................................................................. 81 4.3.6 Data matrix preparation and upload ........................................................................... 99
4.4 CONCLUSION ............................................................................................................................. 99
CHAPTER 5 ANALYSIS AND FINDINGS ........................................................................................ 101
5.1 INTRODUCTION ........................................................................................................................ 101 5.2 DATA SCREENING AND DESCRIPTIVE STATISTICS ............................................................................... 101
5.2.1 Pre-analysis screening ................................................................................................ 102 5.2.2 Screening board network (IV) data ............................................................................ 104 5.2.3 Screening performance and control data .................................................................. 106
5.3 CORRELATIONS ........................................................................................................................ 111 5.3.1 Correlation matrix ...................................................................................................... 111
5.4 REGRESSION ANALYSIS ............................................................................................................... 115 5.5 FINDINGS ................................................................................................................................ 117
5.5.1 Results of regression tests .......................................................................................... 117 5.5.2 Results of hypotheses tests ........................................................................................ 123 5.5.3 Summary of results .................................................................................................... 130
5.6 CONCLUSION ........................................................................................................................... 131
CHAPTER 6 DISCUSSION AND CONCLUSION .............................................................................. 133
6.1 INTRODUCTION ........................................................................................................................ 133 6.2 CONCLUSION ON RESEARCH QUESTIONS ........................................................................................ 135
6.2.1 Formal board ties and company performance ........................................................... 135 6.2.2 Inclusion of directors’ social ties in the analysis ......................................................... 139 6.2.3 Using the boards’ opportunity network in the analysis ............................................. 141
6.3 IMPLICATIONS OF THE THESIS ...................................................................................................... 142 6.3.1 Implications for theory ............................................................................................... 142 6.3.2 Implications for practice ............................................................................................ 143 6.3.3 Implications for methodology .................................................................................... 144
6.4 LIMITATIONS ........................................................................................................................... 146 6.4.1 Measurement error in formal networks at two degrees of separation. .................... 146 6.4.2 Limitations in the social connections data. ................................................................ 146 6.4.3 Datedness of the study period. .................................................................................. 147 6.4.4 Single year data and cross-sectional design. ............................................................. 148 6.4.5 Lagged accounting-based measures .......................................................................... 148
6.5 FURTHER RESEARCH .................................................................................................................. 148 6.6 CONCLUSION ........................................................................................................................... 150
APPENDICES .................................................................................................................................. 153

vi
List of Figures Figure 2-1 Board attributes, roles and performance ........................................................................... 25Figure 3-1 Interlocks measured as connections between companies ................................................. 36Figure 3-2 Classification of director interlocks .................................................................................... 38Figure 3-3 Dimensions of social capital ............................................................................................... 48Figure 3-4 Opportunity networks and structural social capital ........................................................... 51Figure 3-5 Theory classification overview ............................................................................................ 54Figure 3-6 Conceptual model – opportunity networks and company performance ........................... 61Figure 4-1 Research method - key steps .............................................................................................. 67Figure 4-2 Independent variable measures used ................................................................................ 79Figure 4-3 Process to generate board opportunity network metrics .................................................. 91Figure 6-1 The dyad – a simple undirected network ......................................................................... 163

vii
List of Tables Table 3-1 Key literature on the effects of interlocks ........................................................................... 41Table 3-2 Research into the relationship between interlocks and firm performance ......................... 44Table 4-1 Overview of data types, years, sources and processing requirements ............................... 84Table 4-2 Treasury bond rates 1998 to 2003 ....................................................................................... 87Table 4-3 Regression tests to be performed ....................................................................................... 88Table 4-4 Directors network relationship data - descriptive analysis .................................................. 93Table 4-5 Director memberships of professional organisations .......................................................... 95Table 5-1 Companies with unusual network data ............................................................................. 105Table 5-2 Descriptive statistics for all study variables. ...................................................................... 107Table 5-3 Missing data summary – company financial performance variables ................................. 108Table 5-4 Company performance data - outliers .............................................................................. 109Table 5-5 Correlations matrix – Pearson two-tailed (dependent variables 1999) ............................. 113Table 5-6 Multiple regression analysis of the association of board opportunity network and ROA . 119Table 5-7 Multiple regression analysis of the association of board opportunity network and Tobin’s q
(ln) ............................................................................................................................................ 121Table 5-8 Multiple regression analysis of the association of board opportunity network and RATSR
.................................................................................................................................................. 122Table 5-9 Summary of hypotheses tests Board Opportunity Network to firm performance ............ 130Table 6-1 Summary of Contributions ................................................................................................. 134Table 6-2 Implications of thesis conclusions for theory, practice and methodology ........................ 145

viii
List of Appendices APPENDIX 1 Director associations database tables ............................................................................................ 154
APPENDIX 2 Top-105 companies ....................................................................................................................... 157
APPENDIX 3 Board opportunity network metrics by company .......................................................................... 160
APPENDIX 4 Social network analysis (SNA) ........................................................................................................ 163
APPENDIX 5 SNA network measures ................................................................................................................. 166
APPENDIX 6 Correlation matrices 2000-2002 ..................................................................................................... 168
APPENDIX 7 Statistical procedures employed .................................................................................................... 171

ix
Statement of Originality
The work presented in this thesis, is to the best of my knowledge and belief, original
and my own work, except as acknowledged in the text. It has not been submitted in
whole or in part, for a degree at this or any other university.
________________________________
Kevin J. Smith
Date_____________________________

x
Acknowledgements Firstly, I would like to express my thanks to Dr. Gavin Nicholson my principal supervisor, for the many hours I know he contributed to making this thesis happen for me. His thoughts and challenging ideas have added a new dimension to my learning. I would also like to thank other staff and colleagues at QUT for their help and support over the duration of this research; in particular Professor Natalie Gallery (my associate supervisor), Professor Gerry Gallery, Dr. Stephen Cox, Dr. Cameron Newton and Kerry Kruger. To Associate Professor, Malcolm Alexander at Griffith University your assistance with social network analysis is appreciated. Finally to my friends and family, thank-you for your support and encouragement over the period of this study, particularly those who assisted in reading the document.
1
Chapter 1 Introduction
1.1 Background to the research Do board contacts matter? In this thesis I seek to develop an understanding of this
question by investigating boards of directors’ formal inter-corporate connections as
well as their social connections, and any relationship between these connections and
the performance of the companies they govern.
Over the past decade corporate governance has received regular coverage in the
financial press, and various articles have targeted boards of directors’ and the roles
they play in governing companies. There have been calls for boards to be more
effective and add value to the corporations they oversight. This has generated
discussion and research into the roles boards play (Johnson, Daily, & Ellstrand,
1996; Zahra & Pearce, 1989). Although there is no universal board role set (Daily,
Dalton & Cannella, 2003), boards clearly play multiple roles in the corporations they
govern (Hillman & Dalziel, 2003). This research focuses on the strategic role of the
board of directors, and a board’s capability to assist their company in acquiring the
resources it needs for its survival. Under the Resource Based View (RBV) of the
firm (Barney, 1991; Wernerfelt, 1984) boards are seen as a strategic resource that
can add value to their firms and the Australian economy. For example, the quoted
market capitalisation of the ASX in 2008 was estimated to be $1.29 trillion.1
Specifically my research is concerned with better understanding how a firm’s access
to resources may vary with the social capital of the board of directors. Often
referred to as their resource dependence role (Pfeffer & Salancik, 1978), it is a
strategic role whereby board members provide their firms with access to critical
resources (Pfeffer, 1972) and a consequent advantage over competitors. I adopt
, if
boards could add an additional 1% greater value to companies they govern, the
impact on the value of the ASX market capitalisation alone would be $12.9 billion.
Therefore the impact of boards and their potential to add value to the corporations
they govern is significant.
1 Based on the ASX domestic market capitalisation as at 30 June 2008, from ASX website http://www.asx.com.au/about/asx/index.htm as at 2 August 2009.
2
social capital theory (Burt, 1980b; Nahapiet & Ghoshal, 1998) to understand how
resources are accessed through the network of directors’ personal connections. I do
this by examining how a firm’s financial performance varies with different measures
of a board’s opportunity network, or the potential social capital available to it
(Nicholson, Alexander, & Kiel, 2004).
The remainder of Chapter 1 provides an overview of this thesis. In section 1.2, I
identify the research problem and the specific hypotheses that are tested in this
research. The justification for the research is contained in section 1.3 and an
overview of the research methodology is discussed in section 1.4. The thesis
structure is discussed in section 1.5, and the definition of key terms used throughout
the thesis is contained in section 1.6. In the final section 1.7, I discuss the
delimitations or boundaries to this research program.
1.2 Research problem This research investigates the relationship between board of director opportunity
networks and company performance. Specifically, the central theme of this research
is the question:
Is there a relationship between the size of a corporate board’s opportunity
network and the performance of the company it governs?
This research is based on the Resource Based View (RBV) of the firm (Wernerfelt,
1984) where boards are viewed as a strategic resource available to firms, through
which firms can access scarce resources critical to their survival. This view of the
board is based on social capital theory (Burt, 1980b; Coleman, 1988) and resource
dependence theory (Pfeffer & Salancik, 1978). Social capital theory investigates
relationships between people, their interpersonal ties and the advantage that
interpersonal ties can generate. In Australia’s largest companies this social capital
(i.e. the ties between the individual directors of company boards) forms the basis for
possible competitive advantage. Since resource dependence theory links a firm’s
survival to its ability to acquire and control external resources, firms may engage
directors to improve their access to external resources (Pfeffer & Salancik, 1978). In
short, they can use interlocking directorships (Mizruchi, 1996) or interlocks (when a
3
director of one company also serves on the boards of one or more other companies
(Scott, 1991a) to control the flow of resources. As discussed in section 3.2,
interlocks are considered to be inter-corporate connections.
As interlocks are thought to be associated with a firm’s ability to access resources, it
can be reasonably expected that they will be associated with corporate performance.
However a considerable amount of research, including recent Australian research
into interlocks and firm performance, has failed to produce robust results in support
of this phenomenon (see section 3.2.5).
In this study I question the conceptual validity of measuring inter-corporate
connections at the firm level. Social capital theory argues that it is through
individual relationships and ties between people (in this case directors), and not firm
ties, that resources and advantage can be acquired. Every person has a unique social
capital footprint which comprises their network of connections (Nahapiet &
Ghoshal, 1998). Therefore I measure inter-corporate connections through directors
structural social capital which is a key component of, and used as a proxy for, their
individual social capital. I define the network of contacts available to directors
through their connections as their ‘opportunity network’, and propose that it is
through their opportunity network that directors access resources. The opportunity
network available through their formal inter-corporate ties is referred to as their
formal opportunity network. I extend the measure of the director’s opportunity
network in two directions, firstly to include directors’ social connections and
secondly to include their indirect as well as their direct ties (see section 3.3.4 for
more detail). Social ties are all other personal ties a director may have excluding
their formal inter-corporate ties. I refer to the combined opportunity network
comprising their formal ties and their social ties as their ‘total opportunity network’.
As social capital is regarded as cumulative and transferable across different types of
relations including business and social relations (Coleman, 1988; Nahapiet &
Ghoshal, 1998), the total opportunity network is, at least theoretically, a more
complete picture of potential resources that a director can access. As well as
examining the impact of social ties, this research extends the study of opportunity
networks to indirect ties. Indirect ties occur through a third person, for example a
‘friend of a friend’ and are considered weaker ties (Granovetter, 1973). Intuitively,
4
social capital is expected to pass to the second level of contact (Nicholson et al.,
2004) which I refer to throughout this thesis as two degrees of separation or degree-2
(see section 3.3). Therefore by measuring directors’ ties at two degrees of
separation, I propose that a more complete measure of directors’ social capital
(through which they can access resources for their companies) is obtained.
As a result of this investigation I test the following six hypotheses:
Hypothesis 1: The size of an Australian company board’s formal structural social
capital is positively correlated with firm performance.
Hypothesis 2: The size of an Australian company board’s formal opportunity
network at degree-2 is positively correlated with firm performance.
Hypothesis 3: The size of an Australian company board’s total structural social
capital (i.e. formal and social) is positively correlated with firm performance.
Hypothesis 4: The size of an Australian company board’s total opportunity
network (i.e. formal and social) at degree-2 is positively correlated with firm
performance.
Hypothesis 5: There is a stronger association and effect of a boards’ opportunity
network measured at degree-2 on firm performance than of a boards’ structural
social capital on firm performance.
Hypothesis 6: There is a stronger association and effect of a boards’ total (formal
and social) opportunity network on firm performance than of a boards’ formal
opportunity network on firm performance.
My results indicate that better connected boards are associated with higher market-
based measures of company performance (measured by Tobin’s q). However there
does not appear to be any consistent association between the size of board
opportunity networks and the accounting-based performance measure (ROA) or the
hybrid market-accounting measure (Risk Adjusted Total Shareholder Return). Also
there does not appear to be any support for extending the board opportunity network
measures beyond direct ties and including social connections in the analysis. More

5
significant results are found when the opportunity network is measured using the
boards’ formal structural social capital.
This thesis makes four contributions to the corporate governance literature (see
chapter 6, particularly section 6.1). These contributions (briefly) are (1) a new and
arguably better method than firm-focused interlocks for measuring inter-corporate
ties, (2) evidence of a positive association between board connections and market-
based measures of firm performance, (3) evidence that formal inter-corporate board
ties matter to financial markets more than social ties, and finally (4) evidence that
directors direct ties are more strongly associated with company performance than
indirect ties.
1.3 Justification for the research This research focuses on the boards of directors’ of Australia’s largest companies
and their performance. Companies make up a major contribution to Australia’s
economy, and boards of directors’ are the ultimate decision making body of listed
companies (see section 2.2). Ultimately this research may provide practical
direction to boards to enhance the performance of the companies they govern.
Director interlocks are regarded as a important mechanism by which boards can
access resources through their inter-corporate connections. However in spite of
strong theoretical support for the benefits of interlocks (see section 3.2.4), research
into links between interlocks and firm value (or performance) have produced mixed
results (Carrington, 1981; Fligstein & Brantley, 1992; Mizruchi & Stearns, 1988).
Some researchers have suggested that reverse causality may be a more probable
outcome, that is higher performing companies may lead to more interlocks. This
suggests that directors seek to join the boards of well performing companies to
advance their careers or reputation (Zajac, 1988). Regardless of the association, a
better understanding of interlocks and inter-corporate connections and how they
relate to corporate performance is required. This is expected to be of interest not
only to researchers, but to practitioners and regulators as well.
6
1.4 Methodology In this section I provide an introduction and overview of my approach to this
research. A detailed account is contained in Chapter 4, including my research
philosophy (section 4.2.1), the research approach (section 4.2.2), and research
method (section 4.3).
I adopt a positivist approach to this study (see section 4.2.2), as essentially I believe
there is an observable and measurable social reality waiting to be discovered
(Saunders, Lewis, & Thornhill, 2003). I employ regression analysis to test the
relationships between board connections (which represent the opportunity network
of connections available to the board) and company performance. Data are drawn
from publicly available archival sources. Full details of the sampling and data
collection methods are discussed in sections 4.3.3 and 4.3.5 respectively.
To operationalise board connectivity measures (i.e. the independent variable used in
the analysis) I have used Social Network Analysis (SNA). SNA is a technique
developed within the social sciences (see section 4.3.5.3) to analyse social relations
and inter-personal ties. In this study, I measure ties at the individual director level
and develop a board-level measure to determine the impact on corporate
performance. Since I have measured both direct and indirect ties as well as the
formal inter-corporate network and the combined formal and social network, I use
four different board connectivity measures to represent alternative measures of the
board opportunity networks. Details of other measures and variables used in the
analysis are discussed in section 4.3.4.
1.5 Outline of thesis The remainder of the thesis comprises six chapters. Chapter 2 discusses the
institutional and legal background in which listed companies operate in Australia. It
outlines the major theories of corporate governance and discusses boards of directors
and the important roles they play in governing companies. Chapter 3 details the
research framework for my study based on my review of key literatures in this area
and culminates in development of the research question and hypotheses. In Chapter
4, I discuss my research approach and the research design. I present the methods
7
used to answer the research questions and test the hypotheses. I then proceed to
collecting the data required to undertake the analysis. Chapter 5 presents the
analysis of data. In Chapter 6, I interpret and discuss the results and findings and
consider major conclusions that can be drawn from this research program in its
entirety. I further discuss the implications which can be drawn from these
conclusions and consider further research agendas which may be developed from,
and extend, the knowledge gained in this study.
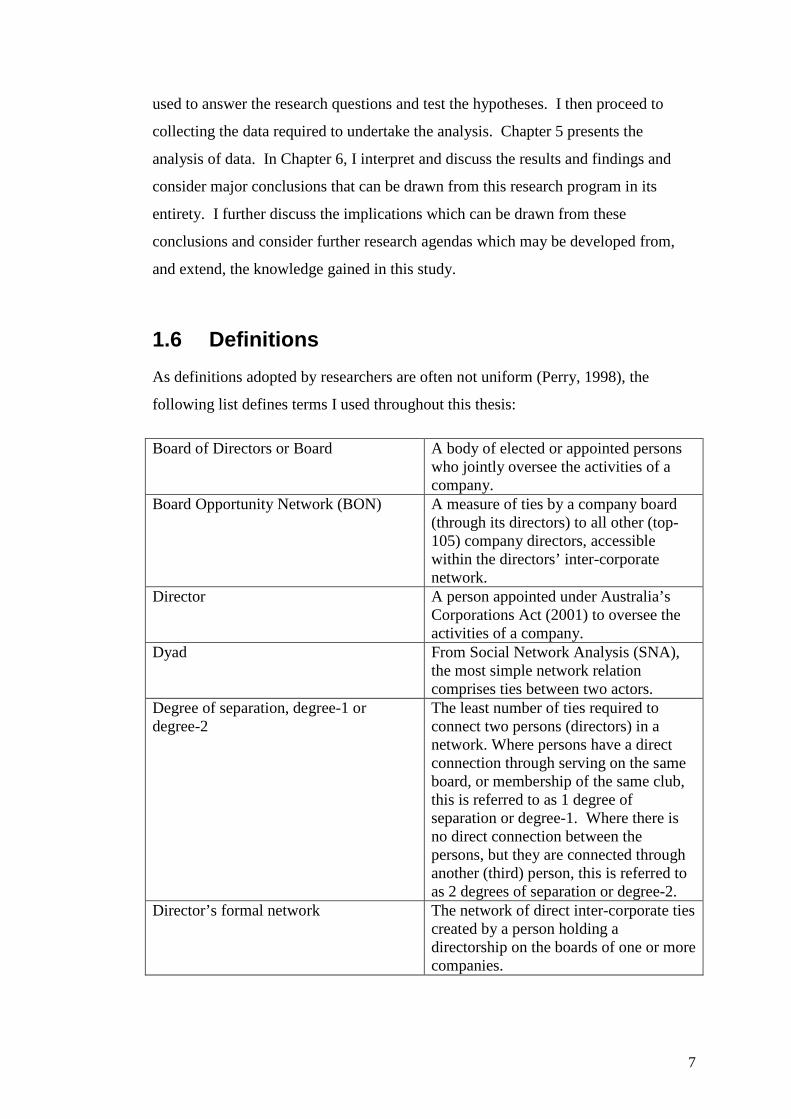
1.6 Definitions As definitions adopted by researchers are often not uniform (Perry, 1998), the
following list defines terms I used throughout this thesis:
Board of Directors or Board A body of elected or appointed persons who jointly oversee the activities of a company.
Board Opportunity Network (BON) A measure of ties by a company board (through its directors) to all other (top-105) company directors, accessible within the directors’ inter-corporate network.
Director A person appointed under Australia’s Corporations Act (2001) to oversee the activities of a company.
Dyad From Social Network Analysis (SNA), the most simple network relation comprises ties between two actors.
Degree of separation, degree-1 or degree-2
The least number of ties required to connect two persons (directors) in a network. Where persons have a direct connection through serving on the same board, or membership of the same club, this is referred to as 1 degree of separation or degree-1. Where there is no direct connection between the persons, but they are connected through another (third) person, this is referred to as 2 degrees of separation or degree-2.
Director’s formal network
The network of direct inter-corporate ties created by a person holding a directorship on the boards of one or more companies.

8
Director social network
The network of direct inter-personal social ties that exist between directors (excluding their formal network ties) and include social, professional, government, community and other business ties.
External Director, Outside Director or non-executive director
A person who serves on the board of a company but who is not an employee of the company, referred to throughout this study as a non-executive director.
Formal opportunity network A measure of potential ties within the directors’ formal network through which social capital is accessible. This includes ties at degree-1 and degree-2. Note: ties at degree-1 only represent formal structural social capital (see below).
Formal structural social capital A measure of potential ties within the directors’ formal network through which social capital is accessible at degree-1.
Internal Director, Inside Director or Executive director
A person appointed to the company board and who is also an employee of the company, referred to throughout this study as an executive director.
Independent Director A director who is independent of the management of the company and free of any business or other relationship that could materially interfere (or be seen to interfere) with the exercise of their unfettered and independent judgment2.
Indirect tie A tie between two actors which occurs through other actors (third persons) and not directly.
Listed Public Company A company registered in Australia under Australia’s Corporations Act (2001).
Opportunity network Potential ties within a network through which social capital is accessible (can be either through a formal network or a total (formal and social) network).
Total opportunity network Refers to social capital which is accessible through the total (formal and social) network by both direct and indirect ties. This includes ties at degree-1 (structural social capital) and degree-2.
Total structural social capital Refers to social capital which is accessible through the total (formal and social) network by direct ties only.
2 Definition adopted from the ASX Corporate Governance Council (2003)
9
1.7 Delimitations of scope and key assumptions Delimitations define explicit boundaries around the research program and key
assumptions made which together may limit the application of this research and need
to be clearly expressed (Perry, 1998, p. 19).
First, this research is limited to corporate governance and is applicable to corporate
entities only. Other business structures (including partnerships, unincorporated
associations, not for profit associations, government authorities), although they may
play an important role in the modern business environment were not included in the
population of interest.
Second, the study relates to a specific population, which are the largest Australian
listed companies in 1999 (measured by their market capitalisation). I cover
companies in all industries, but have excluded companies that operate in Australia
but are not registered in Australia. The top-105 largest companies in Australia are
selected as an important network to study, due to their economic significance in
Australia and the apparent importance and regular reference to this particular group.
The ASX 100 companies represent Australia’s premier large capitalisation
companies3
Third, this study focuses on company boards made up of serving directors in 1999. I
do not consider past directors who are no longer serving on the board or other
company officers who are not serving in a director’s capacity. For example
company secretaries have been excluded.
.
Fourth, the inter-corporate director network comprises all directors serving on the
boards of the top-105 companies. While I have been able to accurately determine
who knows who through an analysis of the top-105 directors, I cannot be assured
that all other direct and indirect (‘friend of a friend’) connections will be collected.
This is because there may be many other organisations both corporate and social that
are not included in my analysis. For example, directors may know each other
through other formal business connections including companies other than those in
the top-105 listed. To capture all business and corporate memberships would be a
3 InvestSmart website http://www.investsmart.com.au/shares/indices_details.asp accessed 2 August 2009

10
considerable task and beyond the scope and resources (primarily time and
computing power) available for a master’s thesis. For instance in June 2008 there
were 2226 listed companies in Australia alone.
Fifth, I have captured directors’ social memberships data from public sources to
which they have declared their social memberships. I have assumed that directors
will declare social connections they consider important them, and this will be a good
proxy for their social opportunity network. However, I do not expect to have
collected all significant social connections through which the directors are able to
access social capital. For instance family ties, religious ties and school ties are
considered important social ties (Nahapiet & Ghoshal, 1998) but have not been
specifically addressed.
Finally, and perhaps the most significant limitation in this thesis lies in my measure
of directors’ social capital. I measure the size of directors’ opportunity networks for
my independent variable. Opportunity networks are used as a proxy for directors’
social capital. Opportunity networks are ties (either direct or indirect) between
directors and represent a network through which social capital is accessible.
Therefore, opportunity networks represent potential social capital and assume that
all the bonds between directors are positive and capable of generating social capital.
However, this may not always be the case. As discussed in section 3.3.3 opportunity
networks are derived from structural social capital (ties) which represent one of the
three dimensions to social capital (Nahapiet & Ghoshal, 1998). Measurement of the
nature and strength of the bonds between directors in the network is specifically
excluded from the scope of this thesis.
1.8 Conclusion In this Chapter, I laid down the foundations for this research. I provide a
background to the study in section 1.1 and introduce the research problem and
research issues (section 1.2). Section 1.3 explains the importance of the research
within the corporate governance context. A brief introduction to the methodology
used is discussed in section 1.4. Finally this chapter concludes with a road map for
the thesis, definitions, and discusses any key delimitations.

11
In Chapter 2, I provide an overview of companies, boards and governance within
which this thesis is centred.

12
Chapter 2 Companies, boards and governance
2.1 Introduction Any relationship between the opportunity networks of company boards and
performance needs to be understood in the context of the institutional environment
in which they operate. This chapter briefly describes the corporate legal and
institutional environment in Australia in four parts. First, I describe the legal
framework for companies, boards and directors in Australia and then discuss the
importance of corporate governance in general. Second, I introduce four main
governance theories and their application to both boards and companies. These
theories are important to this thesis and I draw on them during the study. This
Chapter does not provide an exhaustive treatment of these issues. Rather it provides
important context by describing the complex environment relevant to this study.
Thirdly, I discuss the importance of boards and the various roles that they play in
controlling and governing corporations. Finally, I discuss board structure and
demographics and their significance of to this research agenda. Board structure and
demographics is related to how boards perform in the roles they play and I draw on
this when selecting control variables for this study.
2.2 Companies and directors’ legal obligations Companies are important to the Australian economy and society in general, at June
2008 the market capitalisation of companies listed on the ASX is estimated at $1.29
trillion. One of the key reasons which have led to the success of the company
organisational form is that they can be registered with limited legal liability. That is,
the financial liability of the members (shareholders) can be capped. Legal liability
reduces the down-side risk of ownership in companies to the members. If the
company fails the members may only be liable up to the nominal value of their
shares.
Companies in Australia, like most nations, have a separate legal status and are
survivable independently of their owners. In Australia most companies are now

13
established under the provisions of the federal Corporations Act (2001). This
research is particularly concerned with company boards of directors. A company
director is broadly defined in s 9 of the Corporations Act 2001 as:
(a) A person who: (i) Is appointed to the position of director or (ii) Is appointed to the position of an alternate director and is acting in
that capacity; regardless of the name that is given to their position.
Under previous laws (i.e. state laws and UK colonial law) directors were charged
with a small number of legal obligations and their roles were viewed from a
legalistic perspective. However today, under the Corporations Act 2001, boards’
and directors’ powers are derived from the company’s constitution (which all
companies are required to have). The company constitution is an important
mechanism by which members can to safeguard their interests and exercise some
control over their investments. Companies can either write (and adopt) their own
constitution, or they can adopt the default constitution (referred to as the replaceable
rules (s.135)) within the Corporations Act 2001. Where the default constitution is
adopted, the board’s power is derived from a replaceable rule under s198A of
Corporations Act 2001 (Power of directors) which states:
(1) The business of a company is to be managed by or under the direction of the directors.
(2) The directors may exercise all the powers of the company except any powers that this Act or the company’s constitution (if any) requires the company to exercise in general meeting.
In addition to their obligations under the company’s constitution, directors’
obligations have continued to increase due to a range of specific legislation (taxation
laws, occupational health and safety laws, environmental laws, securities laws and
insolvency laws). The legal obligations of directors and officers are contained in
both case law (general law) and under statutory (state and federal) laws. These
obligations can be broadly categorized as four types of duties (1) Fiduciary duties,
(2) Due care and diligence (3) Contractual obligations and (4) other legal
obligations (Psaros, 2009). These duties are briefly discussed below:
14
Fiduciary duties:
1. a duty to act in good faith (s.181 Corporation Act 2001)
Directors have an obligation to act to the best of their ability in
serving the interests of the company. Fiduciary duties bring in four main themes,
which have been codified in legislation. These are:
2. a duty to use their powers for proper purpose (s.182 Corporation Act 2001)
3. a duty to avoid conflicts of interest, this might occur where a director
transacts with the company (ss. 180, 181 and 182 Corporation Act 2001)
4. a duty not to misuse information (ss182 and 183 Corporation Act 2001)
In addition to fiduciary duties to shareholders, directors also have an obligation not
to permit the company to trade when they believe the company is insolvent (or likely
to become insolvent), s.588G Corporation Act 2001.
Due care and diligence: Directors have a duty to act with care and diligence in the
performance of their duties, s.180 Corporation Act 2001. If they are proven to be
negligent in performing their duties they may be liable to the company for loss
suffered.
Contractual obligations. Directors have contractual obligations with the companies
under the company’s constitution. They must perform their duties in accordance
with obligations.
Other legal obligations.
While most companies adopt the replaceable rules contained in s.198 A to C of the
Corporations Act (i.e. that the business is under the direction of directors), the board
cannot make every decision necessary to run the company. Thus, s198D of the
Corporations Act empowers directors to delegate authority and powers to
committees, individual directors, employees and other individuals. Nevertheless, the
boards of directors are held ultimately responsible for the exercise of these powers
Specific legislated obligations, with some involving
criminal penalties, are contained on other state and federal legislative provisions,
e.g. occupational health and safety laws and environmental laws.

15
(subject to the constitution), and are therefore responsible to ensure any delegations
are appropriate and regularly monitored (s190 (1)).
Today, board roles are now seen from a wider corporate governance perspective
than simply their legal obligations, this is discussed in the following sections.
2.3 Corporate governance and theories
2.3.1 Governance overview
Definitions of corporate governance vary with the perspectives of the authors
(Gillan, 2006). Many follow Shleifer and Vishny (1997) who define corporate
governance from a financial perspective as the ways in which suppliers of finance to
corporations assure themselves of getting a return on their investment. In contrast,
Gillan and Starks (1998) take a legal perspective and define corporate governance as
the system of laws, rules and factors that control operations at a company. Daily,
Dalton and Cannella (2003, p. 371) adopt a broad perspective and define governance
as “the determination of the broad uses to which organizational resources will be
deployed and the resolution of conflicts among the myriad of participants in
organizations”. An authoritative definition, which I adopt in this study, is provided
by the ASX Corporate Governance Council (2007, p. 3) as:
The framework of rules, relationships, systems and processes within and by which authority is exercised and controlled in corporations. It encompasses the mechanisms by which companies , and those in control, are held to account. Corporate governance influences how the objectives of the company are set and achieved, how risk is monitored and assessed and how performance is optimised. Good corporate governance structures encourage companies to create value (through entrepreneurialism, innovation, development and exploration) and provide accountability and control systems commensurate with the risks involved.
Irrespective of the definition of corporate governance, researchers have generally
adopted either an internal or external perspective when studying corporate
governance mechanisms. Internal governance mechanisms concentrate on
management (who decide the assets in which the firm will invest and how they will
be financed) and the board of directors who are charged with overseeing and
advising management. External governance mechanisms introduce elements which
arise from a firm’s need to raise capital and highlights a separation between capital

16
providers and those who manage the firm. Gillan (2006) proposes an integrated
governance framework that synthesises these mechanisms. This framework sets out
five categories of internal governance: boards of directors, managerial incentives,
capital structure, by-laws and charter provisions, and internal control systems.
Similarly, Gillan (2006) provides five categories of external governance: law and
regulation, markets (capital/ corporate control/ labour/ product), capital information
markets, market for professional services, and other private sources of external
oversight.
Strong governance mechanisms are thought to ensure that corporate activity is
effectively scrutinized, and that companies behave as good public citizens (Huse,
2007). Corporate governance mechanisms therefore can have a significant impact
on the economic performance of countries. Where governance mechanisms are
weak this can lead to substantial economic problems. It is in the public interest to
ensure that effective corporate governance mechanisms exist as this will enable
firms to raise external capital at the lowest cost. For example, in Italy where
corporate governance is weak, flows of external capital to firms are retarded and
similarly in Russia (where weakness of corporate governance has lead to a
substantial diversion of assets by managers of many privatized firms) external
capital supply to firms is virtually non-existent (Huse, 2007).
Public pressure on governments by their constituents can force changes to be made
to the Corporations Law, and other specific corporate related legislation in such
areas as environment and health and safety. External governance mechanisms
comprising economic and legal institutions are altered through the political process,
particularly when there is sufficient public outcry. The recent global financial crisis
of 2007 has already lead to number of corporate causalities (or near causalities) in
Australia including ABC Learning Centres, Rams Home Loans and Centro
Properties which the Australian regulators will monitor. Similarly, after major
corporate collapses in the early 2000’s including HIH, One-Tel, Harris-Scarfe and
Ansett, the Clerp 9 changes were introduced to the Corporations Act 2001.
Boards of directors are regarded by many as the lynchpin of internal corporate
governance (Gillan, 2006). This is understandable given that directors have the
17
ultimate corporate decision making power, the responsibility to oversight corporate
operations, and the fiduciary duty to act in the best interests of the corporation.
Several governance theories have developed to provide a theoretical perspective for
application in governance studies of corporate organisations. Many modern
corporations, particularly companies listed on the stock exchange are characterised
by factors like: their large size and complexity, significant assets or access to assets
and wealth, separation of ownership and management, a large number (6 and more)
of directors on their boards, independent directors on their boards, significant
economic power and many thousands on small shareholders. I concentrate on four
of the predominant governance theories most relevant to large (listed) corporations
and to this research of the top-105 listed companies in Australia, these are discussed
in the following sections together with their relevance to this research. These
theories are agency and contracting theory, stewardship theory, resource dependence
theory and the resource based view of the firm.
2.3.2 Agency theory The agency problem occurred following a separation of ownership and control in
companies (Berle & Means, 1932), and is arguably the most dominant governance
theory having its roots back to the ‘Wealth of Nations’ (Smith, 1776). In simple
terms, Agency theory involves one person (i.e. the principal) delegating work and
authority to another person (i.e. the agent) so that the principal is reliant on the agent
for their future well being (Eisenhardt, 1989). Agency costs arise from this
relationship and represent the costs that occur when the interests of the principal and
the agent are misaligned and the bonding costs for establishing relationship
(discussed below). For example, the agent may not perform in a way that the
principal had intended. Agency theory has been applied to corporate governance to
help understand the relationships between managers of the firm and the shareholders
whose interests are arguably represented by the board of directors.4
4 Under the theory of the firm (Coase, 1937) the firm is viewed as a set of contracts with agents to secure its factors of production. In large corporations where responsibility for managing the companies is delegated by the board to the professional managers, contracts are established for management labour.
With respect to
corporate governance, the challenge for agency theorists is to reduce agency costs by
aligning the interests of managers with those of the owners (Fama, 1980; Fama &
18
Jensen, 1983; Jensen & Meckling, 1976). Ideally, this will encourage managers to
produce the best returns for themselves and shareholders.
Agency costs (in the typical corporate form) are thought to be created in three main
ways, these are through (1) moral hazard, (2) risk taking preferences and (3)
principal centred problems. Firstly, moral hazard is considered the most common
conceptualisation of the agency problem (Hendry, 2002) that argues that managers
can be self interested entrepreneurs and opportunists who may make decisions that
benefit themselves rather than in the interests of shareholders (Fama & Jensen,
1983). This behaviour may manifest itself in several ways including using the
owner’s funds to acquire perquisites, paying excessive remuneration or otherwise
make operating decisions which may not be in the best interests of shareholders
(Jensen & Meckling, 1976). Agency theory also recognises that managers will
generally possess greater knowledge and expertise of the firm, and are thus in an
advantaged position to the owners. This is referred to as information asymmetry,
and may enable managers to pursue self interested action at the expense of
shareholders (Healy. & Palepu, 2001). Second, risk taking preferences centre on the
different risk profiles of the principal and agent (Jensen & Meckling, 1976). This
depends on the general risk sharing approach between principals and managers, that
is the sharing of residual claims and how this effects risk bearing by residual
claimants (Fama & Jensen, 1983). Shareholders generally want to encourage and
motivate managers to take risk and produce higher returns for their investments
rather than produce normal returns. This includes the take on of high risk capital
projects that have the potential to yield super-normal returns, but are also associated
with higher risk and the potential for disaster. Residual claims (including super-
normal profits or losses) would flow to the shareholders. Modern capital markets
allow shareholders to spread (minimize) their risk to acceptable levels through
diversified share portfolios (Fama, 1980; Jensen & Meckling, 1976). However,
managers may have little to gain from undertaking high risk projects, as these
projects can involve significant career risks and potential reputation loss.
Consequently managers are considered to be more risk averse in their decision
making than diversified shareholders (Fama, 1980). Finally, principal centred
problems arise where the agent, selected by the principal, cannot perform the role
required of them (Eisenhardt, 1989). This can arise from adverse selection by the
19
principal (Eisenhardt, 1989) and honest incompetence of the agent (Hendry, 2002)
and are errors made by the principal in agent selection.
Economic inefficiencies in the principal and agent relationship are referred to as
agency costs. Three of the predominant methods used to reduce or control agency
costs in the manager and owner (shareholder) relationship are: (1) contracts, (2)
disclosure, (3) monitoring of management. These are briefly discussed below.
Contracts, which are compensation agreements between management and the
shareholders, are used to motivate the agent by focussing on desired behaviours and
outcomes (Jensen & Meckling, 1976). In essence, financial incentives are offered to
the agent to encourage them to meet the shareholders’ goals. However, contracts
themselves can give rise to other type of agency costs, because these contracts are
not costlessly written and enforced (Fama & Jensen, 1983). These agency costs
include the costs of structuring, monitoring and bonding a set of contracts among
agents with conflicting interests and also include the value of output lost where the
costs of full enforcement of contracts exceed the benefits (Jensen & Meckling,
1976).
Disclosure requires management to provide relevant information to shareholders
through either voluntary or through mandatory requirements. This mechanism is
designed to reduce information asymmetry. Since managers have access to more
information than the shareholders they have a clear power advantage over
shareholders (Healy. & Palepu, 2001). Disclosing relevant information is thought to
facilitate shareholder monitoring of firm performance.
Monitoring of management by the board of directors (on behalf of the shareholders)
is regarded as a key mechanism to reduce agency costs (Fama, 1980). However,
legally shareholders do not have any direct influence over the managers and they do
not have a claim to the position of principal under an agency relationship (Aglietta,
2008). Shareholders effectively have no legal rights to exercise control over the
corporation (Bainbridge, 2003) as that is the directors’ legal duty (see section 2.2).
Management are hired by the board and answerable to the board for their
performance, and the board has a fiduciary duty to the company to monitor their
performance.
20
In summary, Agency theory (a subset of contracting theory) has been applied to
understand and predict management motivations (following the separation of the
ownership and management in many large companies). Various mechanisms have
been developed to control and mitigate agency problems. Some researchers consider
that agency problems are primarily based on the assumption of management
exploiting their advantaged position, however this is not generally accepted.
Stewardship theory, which I discuss in the next section, is based on different
assumptions which some researchers claim is almost diametrically opposed to
Agency theory.
2.3.3 Stewardship theory
Stewardship theory is regarded as an alternative to agency theory that developed in
the 1990’s as a response to the dominance of agency theory’s influence on corporate
governance research (Donaldson, 1990; Huse, 2007). Whereas agency theory has
primarily developed on the assumption of managerial opportunism, the core concept
in stewardship theory is that managers are trustworthy stewards, whom boards
should support and mentor. Stewardship theory assumes that managers are
collectivistic and motivated by intrinsic rewards such as achievement and
satisfaction in their work rather than extrinsic rewards such as financial incentives.
Donaldson (1990, p. 377) stated that ‘there is no conflict of interest between
managers and owners and the desideratum of governance structure is to find an
organisational structure that allows coordination to be achieved more effectively’.
The challenge for stewardship theorists is to develop organisational structures that
facilitate and empower managers. Stewardship theory is consistent with the classic
motivational theory, Theory ‘Y’, developed by McGregor (1960) whereby managers
are characterised as hard working, selfless and honest. In contrast McGregor’s
theory ‘X’ views workers as lazy, disloyal and opportunistic and self interested, a
situation analogous to the assumptions underlying agency theory. In contrast with
proponents of agency theory, stewardship theorists argue that agency costs would be
minimized as a matter of course, as senior managers keen to protect their reputations
would not jeopardize them by abusing their power to the detriment of shareholders
(Donaldson & Davis, 1994).

21
2.3.4 Resource dependence theory In contrast to both stewardship and agency theories and their management
motivation focus, resource dependence theory attempts to explain how firms acquire
and manage their dependence on resources available through the external
environment (Hillman & Dalziel, 2003; Pfeffer & Salancik, 1978). A firm’s
survival is regarded as contingent on how effectively the firm performs in its ability
to acquire and control external resources (Aldrich, 1979; Aldrich & Pfeffer, 1976).
Resource dependence theory is premised on three key assumptions or concepts
(Pfeffer & Salancik, 2003) these are (1) resource interdependence, (2) external social
constraint, and (3) organisational adaptation. Resource dependence theory is based
on the idea that in social systems and social interactions, interdependence exists
whenever an actor does not entirely control all of the conditions necessary for
achieving an action, or for obtaining the desired outcome desired from the action
(Pfeffer & Salancik, 1978). Thus, a firm is linked to its external environment
whereby organizations are embedded in a network of interdependences and social
relationships (Granovetter, 1985). These interdependencies with other organizations
and the environment are affected by social power (Blau, 1964) and with economic
efficiency and rationality (Williamson, 1995). Organisations are constrained by
their situations and affected by their environments. Thus, firm performance (or
effectiveness) can be viewed as a derivative of how well a firm manages the
demands placed upon it. In particular, effectiveness depends on a firm’s ability to
manage the interest groups on whom it depends for its resources and support
(Pfeffer, 1972). The key to organisational survival is acquiring and maintaining
adequate resources, include financial, physical, and information resources (Pfeffer &
Salancik, 2003).
Consequently, organisations develop and use various strategies to cope with external
constraints (i.e. to avoid, reduce or manage resource dependence or interdependence
(Pfeffer & Salancik, 1978)). These strategies are thought to provide at least
temporary autonomy. Pfeffer and Salancik (2003) categorise these strategies into
four main groups, namely:

22
1. Adapting to or avoiding external demands such as implementing new electronic
commerce business systems. This strategy exclusively concentrates on
improving the efficiency of the internal transformation processes (Pfeffer,
1972).
2. Altering the patterns of interdependence through growth, merger or acquisition.
Business mergers and takeovers are common practice among Australia’s listed
public companies.
3. Establishing alliances and collective structures such as interlocking directorships
(Mizruchi, 1996), co-option (Selznick, 1949; Zald, 1967), joint ventures, trade
associations or similar means of association and influence (Guetzkow, 1966).
For instance Selznick found that co-option onto the governing board was used
successfully by the Tennessee Valley Authority to partially neutralize strong
opposition from hostile groups. In this way, the board can be viewed as an
administrative body linking the firm with its environment. As a ‘boundary
spanner’, the board can assist the firm to acquire important resources from its
environment and thereby enable the firm to either reduce its dependence on
external stakeholders or protect it from external threats.
4. Intervention in public policy and political process. This strategy can result in
altering the definitions of legitimacy and public opinion. For instance, Schuler
et. al. (2002) found that companies which were heavily reliant on government
contracts lobbied and contributed to campaigns which maintained close ties to
the policymakers responsible for their livelihoods. A notable example of
political lobbying in Australia over the past 10 years has been by Telstra in an
attempt to retain its monopoly position in key areas of the Australian telephony
and communications infrastructure.
2.3.5 Resource based view of the firm
Closely allied to resource dependence theory is the resource based view (RBV) of
the firm. Whereas resource dependence concentrates on how firms rely on the
external environment, the RBV posits that the firm is a bundle of resources,
knowledge, competencies and capabilities which can be used to create value
(Barney, 1991). By developing these unique and inimitable resources a firm can
develop and sustain a competitive advantage (Wernerfelt, 1984). The basic
23
assumptions made in resource based theory are that resources are distributed
heterogeneously across firms and that resources which are productive cannot be
transferred across firms without cost.
In order to produce a sustainable competitive advantage a firm should seek ownership of
firm-specific resources that are valuable, rare, inimitable and non-substitutable (Barney,
1991). Resources with these properties are valuable and can be used to exploit
opportunities and/or neutralize threats in a firm’s environment.
From the resource based perspective, the board of directors is a potentially valuable
resource for the firm and its management. A board of directors could meet these
required attributes and so be considered a strategic resource when governance choices
affect the creation of economic rents. In particular, where boards can provide a firm
access to scarce, valuable and non-replicable resources, it can become a valuable
resource, particularly when compared to a board that focuses mainly on monitoring and
minimizing agency costs (Huse, 2007). Thus, a board’s capabilities may be a valuable
resource that cannot be easily duplicated or substituted and so may provide the firm with
a distinct competitive advantage.
2.3.6 Summary of key governance theories and their importance to this thesis
In this section, I outlined four key theories of relevance to this study. First, I outlined
agency theory, then stewardship theory and resource dependence theory and then finally
the resource based view of the firm. These theories can be used to justify the perceived
roles of the directors and the board. For instance agency theorists who emphasise the
importance of the board’s role in monitoring and oversighting management would argue
for greater board independence, as this will strengthen this role. In contrast, stewardship
theorists would focus on structures that facilitate and empower would perceive the
board’s role as one of providing service and guidance to management. Consequently
stewardship theorists would take the view that a majority of executive directors will
yield superior firm performance, as executive directors will understand the business
better than outside directors and can offer more informed counsel (Donaldson, 1990;
Donaldson & Davis, 1994), collaborative strategy formulation and mentorship.
Resource dependence theorists view the role of boards as one of providing access to
24
resources, and would to support greater board connections. These roles are further
discussed in section 2.4.
2.4 Boards of directors - roles and theories
2.4.1 Overview of board roles Boards of directors, as the ultimate corporate decision makers in the firm, have been
the subject of a significant research effort the past two decades (Nicholson & Kiel,
2007; Pettigrew, 1992; Zahra & Pearce, 1989). However attempts to link boards to
the performance of the companies they govern have met with mixed results
(Hillman & Dalziel, 2003; Johnson et al., 1996).
Much of the corporate governance research agenda has focused on defining and
reviewing how board attributes are related to company effectiveness. Reviews of the
literature are near unanimous that there is no uniform relationship between boards
and firm performance (Daily et al., 2003; Johnson et al., 1996). Instead, individual
projects have tended to focus on single mechanisms by which a board can affect firm
performance (i.e. they concentrate on a single board role). As a result, there is no
clearly agreed role set that a board follows (e.g. see Nicholson and Kiel, 2007 for a
summary and exception to single theory focus).
Most studies assume a board role (i.e. they do not directly measure the mechanism
by which boards are thought to affect corporate performance (Daily et al, 2003).
Rather, they use an input-output approach (Pfeffer, 1972) that seeks to link board
attributes (e.g. board composition, director characteristics, and governance process)
with firm performance. They assume that these will affect how well the board
functions in performing its three key roles of service, strategy (which includes
resource dependence) and control (Zahra & Pearce, 1989). Earlier research by Zahra
& Pearce (1989) has led to a framework which has generally been used by
researchers in their studies of boards and company performance. Zahra & Pearce
(1989) in their summary paper presented an integrated model of the links between
boards and company performance, including board attributes and roles. Their
integrated model combined four separate models based on different perceived
perspectives of the board, viz. legalistic, resource dependence, class hegemony and

25
agency theory. This model indicates that a relationship exists between board
attributes, board roles and company performance. Specifically it highlights that
board attributes (that is composition, characteristics, structure, and process) can
affect company performance directly and also indirectly through their influence on
board roles and the strategic outcomes they achieve. Contingencies represent
internal and external factors, such as the legal environment, industry constraints,
company size, CEO style, which are resource constraints within which the company
operates. Figure 2-1 represents a simplification of their model.
Building on Zahra & Pearce’s (1989) work on boards of directors, Johnson et al.
(1996) recategorised directors’ roles into Control, Service, and Resource
Dependence. They incorporated the strategic role of the board within the service
role, the control role and the new category of resource dependence. Strategy which
is concerned with creating advantage for the firm over its competitors can occur
through improved monitoring and control, assisting the management team and
through providing access to resources. For example, improved audit committee
processes and introduction of better management contracts and incentive schemes,
which are generally regarded as control mechanisms can also yield a competitive
advantage. Similarly, the service role can involve the directors in actively
formulating and implementing strategy (Johnson et al., 1996).
Figure 2-1 Board attributes, roles and performance
Strategic Outcomes and effect
Roles • Service • Strategy
(resource dep.) • Control
Attributes • Composition • Characteristics • Structure • Process
Contingencies • Legal • Industry • Co. Size
Company Performance
26
Source: Adapted from (Zahra & Pearce, 1989)
Directors’ role sets have continued to evolve in response to economic factors
including recent corporate collapses, and board performance has not been without
criticism (Anderson, Melanson, & Maly, 2007; Coulton & Taylor, 2004). In more
recent research into board roles, boards seem to be taking a more collaborative
approach with management in undertaking their roles. This is more aligned with
stewardship theory, and indicates a possible blurring of role domains. For example
Hillman and Dalziel (2003) consider the resource dependence role and the service
role to be part of the same general provision of resources function, Coulton & Taylor
(2004) claim that previous roles of directors are overly simplistic and will vary
based on economic activity and circumstances, and Anderson et al.(2007) in a
qualitative study (using director surveys undertaken in Australia, Canada, the U.S.
and New-Zealand) identified a significant shift in board roles towards strategic
partnering with management.
In spite of these more recent developments, the literature has not strayed from that of
board roles proposed by Johnson et al.(1996). These roles of monitoring and control,
service and resource dependence also represent directors’ responsibilities and are
consistent with those proposed by (Pfeffer & Salancik, 1978) and (Daily & Dalton,
1993) and I have adopted these roles for this study5
2.4.2 Resource dependence role
. These roles focus specifically
on inter-relationships between the board, management and stockholders of
contemporary publicly listed companies (Johnson et al., 1996) and are briefly
discussed below.
As set out in section 2.3.4, resource dependence theory posits that the board is a
means to facilitate the access to resources which are critical to the firm’s success
(Pfeffer, 1972). Pfeffer and Salancik (1978) identified four strategic advantages
which can be provided by boards to assist the firm in reducing its uncertainty to
external contingencies. These are:
5 Additional roles considered in the service to other constituencies including; other corporate stakeholders (Freeman & Evan, 1990), corporate and financial sectors (Mintz & Schwartz, 1985) and local and national elites (Useem, 1984) are not considered relevant to this study.

27
1. Linking the firm to important stakeholders (Burt, 1980b). Linkages provide
important communications channels between the firm and its external
environment. Through these ties a company may be able to obtain strategic
advantage that may not be available to its rival organisations.
2. Obtaining preferential access to commitments or support. This is an
extension of point 1, and focuses on specific benefits which may accrue
through these important linkages. Access to capital is seen as a major
benefit. A firm’s ability to access capital has been shown, through a long
stream of research, to be associated with board membership (Johnson et al.,
1996; Mizruchi & Stearns, 1994).
3. Legitimacy. The association of reputable directors with the company is
expected to enhance standing and image to the public at large. This is
particularly so for smaller firms which have not developed “a sense of
historical legitimacy” (Selznick, 1949, p. 259).
4. Providing Expertise, Advice and Counsel. Based on my categorisation of
board roles adopted, this is now discussed under the separate Service Role
below.
2.4.3 Monitoring and control role
The monitoring function of boards, often described as their control role (Johnson et
al., 1996), refers to directors being responsible for oversight of the company. This is
thought to include monitoring and evaluating managers on behalf of shareholders.
Under this role, the board is seen to promote alignment between the interests of
shareholders and company management (Jensen & Meckling, 1976, p. 377) .
Monitoring is thought to ensure the owners interests are adequately protected
(Eisenhart, 1989; (Jensen & Meckling, 1976); (Fama & Jensen, 1983)). Based on
both agency theory and legal authority, the board’s primary purpose is that of a
fiduciary charged with monitoring management for the benefit of the corporation
(Johnson et al., 1996). Monitoring and controlling activities can typically include;
monitoring the CEO, monitoring strategy implementation, planning CEO
succession, evaluating performance and rewarding the CEO and top management

28
(Hillman & Dalziel, 2003). To facilitate monitoring, the board may establish
formal delegations of authority, corporate management related policies and make
decisions on major company issues. Some key issues include the hiring/firing of the
CEO and other executives, dividend policies, options policies and executive
compensation.
2.4.4 Service role
The service role refers to the directors providing expertise, advice and counsel to the
CEO and other top management (Lorsch & MacIver, 1989; Mintzberg, 1983).
Lorcsch and MacIver (1989) noted that a considerable amount of directors’ time is
spent advising the CEO (which may be one reason that many active and retired
CEO’s are appointed to company boards). In providing advice and counsel,
directors are becoming increasingly involved in the firm’s decision management and
the strategic planning process (Hermalin & Weisbach, 1988) and that the success of
this role has been positively related to firm performance (Judge & Zeithaml, 1992).
Although the service role appears to be positively aligned with stewardship theory, it
also receives some interesting support from agency theory. Expert directors may
provide effective advice to management when reviewing and evaluating
management proposals, thereby providing assistance during strategy formulation
(Fama & Jensen, 1983). Consequently there can be some overlap between advice
and control.
2.5 The study of board structure As outlined in section 2.4, research into board roles has traditionally focused on
links between board composition and firm performance (Gillan, 2006). For instance,
board size and independence of the board from management have been central
themes in governance research (Yermack, 1996). Similarly, many research efforts
have examined duality of the CEO/board chair roles (i.e. where the CEO also acts in
the capacity of Chairman of the Board) (Brickley, Coles, & Jarrell, 1997; Goyal &
Park, 2002). Board demographics (sometimes referred to as structural aspects of
boards) are thought to affect how well boards are able to perform their roles.
Although several structural elements are often used in board research (including

29
board diversity, board age, gender, race and ethnicity), I have limited this research
to consider the three major elements of board structure, board size, board
independence and CEO duality, as this research implicitly assumes that all directors
are equal and homogeneous barring their connections. These three elements of
structure are discussed below.
2.5.1 Board size
Board size (i.e. the number of directors appointed to serve on a company’s board) is
regarded as an important factor in effective corporate governance (Dalton, Daily,
Johnson & Ellstrand, 1999; Pearce & Zahra, 1992). Evidence suggests that board
size is related to the size and complexity of the companies on which they serve.
Larger companies generally have larger boards (Kiel & Nicholson, 2003), therefore
the average board size reported in studies can vary with the population being
studied. For instance, Bosch (1995) highlighted that Australian major listed
companies averaged around ten board members, whereas substantial private
companies averaged around six members (Bosch, 1995). Similarly, Lawrence &
Stapledon (1999b) found that in the top 100 publicly listed companies in 1996 there
was an mean board size of 8.9 directors, whereas Kiel & Nicholson (2003) found an
mean board size of 6.6 directors in their study of the same year of the top 500
companies.
Similarly, there are differences between average board sizes across countries (which
may well relate to the difference in company sizes. Average Australian board size
appears to be lower than in the United States where firms average ten to twelve
board members (Huse, 2007).
Theoretically, there are reasons to suspect there are positive and negative effects of
both large and small boards. While there is a clear preference for an ideal number
chosen to ensure greatest board effectiveness at the lowest cost, there is no
consensus of what is ideal (Johnson et al., 1996). If a board is excessively large it
can become unwieldy and suffer from poor communication and decision making
processes. In contrast, boards with a smaller number of directors are more likely to
reach agreement quicker (Lange et. al., 2000) and engage in genuine interaction and
30
debate (Forbes & Milliken, 1999). However, a board that is too small may lack the
spread of skills required to effectively discharge its duties (Huse, 2007).
From the perspectives of the control and monitoring and the resource dependence
role, larger boards are supported, but for different reasons. Resource dependence
theory posits that a larger board will provide access to a greater pool of resources,
opportunities and expertise which it brings to the firm to assist it in achieving its
objectives. This would suggest a positive relationship between board size and firm
performance. From the control and monitoring perspective, (Zahra & Pearce,
1989, p. 309) state:
Larger boards are not as susceptible to managerial domination as their smaller counterpart. They are more likely to be heterogeneous in member background, values, and skills. Thus, they are likely to resist managerial domination and present shareholders interest. Therefore, these boards will be more actively involved in monitoring and evaluating CEO and company performance…
Empirical research which has tested the relationship between board size and
company performance has shown mixed results. In a sample of 452 large U.S.
public companies observed over the period 1984 to 1991, Yermack (1996) found an
inverse relation between firm market value (represented by Tobin’s Q) and the size
of the board of directors. In recent Australian research, Kiel & Nicholson (2003)
found a significant positive relationship between board size and the market-based
performance measured by Tobin’s Q, but no support for an accounting-based
performance measure. In contrast, Bonn (2004) found no support for the hypothesis
that board size is related to performance.
In spite of the mixed empirical results, board size is seen as a key variable with the
corporate governance literature. It is also used in the development of other
governance constructs, for example, it can be used as the denominator to calculate
the proportion of non-executive directors construct. As such, Johnson et al. (1996)
suggest that it is an important control in multivariate models.
2.5.2 Board independence Board independence is thought to indicate the degree to which management are able
to influence the board. It is often operationalised as a ratio between executive
directors and non-executive directors on the board (Zahra & Pearce, 1989), but may

31
be measured in different ways. Perhaps the most common measure for board
independence in governance research is the proportion of the number of non-
executive directors (to all directors or executive directors). A key problem is that
outside directors and independent directors are not necessarily the same (Nicholson
& Kiel, 2007) and so this measure is increasingly being questioned (Johnson et al.,
1996). Some researchers have supported the proposition that a reverse causal
relationship may exist between firm performance and the proportion of outside
directors on their boards. For a review of the problems in measuring board
independence (Daily et al., 2003).
A preference for outsider-dominated boards is largely grounded in agency theory
(Eisenhardt, 1989; Jensen & Meckling, 1976). Agency theorists argue that from a
control and monitoring role, independent boards are required to effectively oversee
and monitor management (Jensen & Meckling, 1976;(Mace, 1971). An independent
board (i.e. one comprised of non-executive directors independent of management
influence) would not be subject to the same potential conflicts of interests as
executive or grey directors (Bonn, 2004). This structure would overcome the
conflicts of interests involved when directors who are (or appear) beholden to
management evaluating that same management, especially where management
performance is poor (Johnson et al., 1996). At an extreme, executive directors (i.e.
directors who also work full time for the firm) may feel a debt of loyalty to or fear
reprisals from the CEO. In these cases, a director may not challenge management
where they should (Bosch, 1995, p. 309) and in cases of strong managerial
influence, the board may merely serve as a managerial puppet.
A review of the current literature shows strong debate for and against board
independence. Although the monitoring role of the board is widely accepted by the
business community and the regulators, recent research does not consistently support
any relationship between outside director ratios and firm performance. For instance,
MacAvoy & Millstein (1999) found a positive relationship between board
independence and financial value where Bhagat & Black (1999) and Yermack
(1996) report a negative correlation between Tobin’s Q and the proportion of
independent directors. Australian studies have also shown mixed results; (Lawrence
& Stapledon, 1999b) found that the proportion of independent directors positively

32
related to assets, net profit and EBIT, and Muth & Donaldson (1998) found board
independence to be negatively related to shareholder wealth and sales growth but not
profit performance. Irrespective of the performance measure adopted, there appears
to be a growing diversity of results on board independence, its affect on board roles,
and the value it contributes to the firm (Nicholson & Kiel, 2007). Daily and others
(2003, p. 375) suggest that:
Researchers and practitioners must reconsider the relative weight placed on the directors’ oversight function. In addition to the monitoring role, directors fulfil resource, service and strategy roles. Rather than focussing predominantly on directors willingness or ability to control executives, in future research scholars may yield more productive results by focussing on the assistance directors provide in bringing valued resources to the firm and in servicing as a source of advice or counsel for CEO’s.
This call has also been supported by Berhaut (2004, p.3) who stated that “Finding
people with the right knowledge and expertise to serve on the board of directors may
need to be at the expense of their independence and possible conflicts of interest”.
In summary, theoretical support for board independence, and its acceptance in the
community, depends on the perceived importance of the various board roles. Whilst
the monitoring role appears to have established dominance in the business
community, this is increasingly being challenged by the service role. Measures of
board independence are considered important research variables and have been
adopted in recent Australian governance research such as Bonn (2004), Kiel and
Nicholson (2003), Lawrence and Stapledon (1999b).
2.5.3 CEO duality Duality of the CEO and board chair is an important measure of board leadership
structure and has been one of the most used variables in research of boards and
governance (Huse, 2007). The chairman is considered to perform a pivotal role in
creating the conditions (which include attitudes, experience and conduct) for non-
executive directors to be effective (Roberts & McNulty, 2005), and therefore
directly effects board dynamics and overall board performance. An effective
Chairman is thought to create a culture of trust (Roberts & McNulty, 2005),

33
engagement (Huse, 2007), set the tone for the board, and orchestrate board self
development and evaluations.
Where the board is chaired by the CEO then managerial control is likely to be
dominant, and boards can represent little more than rubber stamps required to
provide legal compliance. Under this scenario boards can become ineffective and
may simply followed the recommendations of senior management, as was
apparently the case with corporate collapses such as HIH (Lipton, 2003).
Agency theorists advocate a clear separation of executive powers from board powers
and would argue that, where these waters are muddied, the board’s monitoring role
is diminished. In those jurisdictions which do not allow duality of the CEO and
board chair, a separation of executive powers and board tasks is enforced.
However, those researchers who promote Stewardship theory would argue that
duality of the CEO and board chair leads to a unity in command and improved
performance will flow from this.
Although a large number of studies have focused on the concept of duality of the
CEO and board chair, correlations with a firm’s financial performance have not been
conclusive (Dalton, Daily, Ellstrand, & Johnson, 1999).
2.6 Conclusion In this chapter I sought to establish the context of my study and set the scene by
discussing the major themes of research into corporate governance. First, I
discussed the importance of boards to both companies and the legal duties owed by
directors. I then introduced three key theories of corporate governance before
highlighting how these theories link to the roles played by boards of directors.
Finally, I introduced the major themes of research into the board-performance
relationship. In chapter three I refine and concentrate on a detailed literature review
of resource dependence theory and its application to Australian boards of directors.
34
Chapter 3 Literature review & theoretical development
3.1 Introduction As discussed in Chapter 2, boards of directors are important to the governance of
companies in Australia and several key theories have been developed to help explain
the roles they play. This research focuses on how directors’ contacts may (or may
not) be associated with the performance of the companies they govern.
The premise of the Resource Based View (RBV) of the firm (Wernerfelt, 1984) is
that firms may gain a strategic advantage over their competitors through their access
to resources. In terms of corporate governance research, resource dependence
theory aligns with the RBV as boards are able to provide the firm with access to
external resources, such as knowledge, information, finance, and capital, which may
otherwise constrain the operations of the firm (Brass, Galaskiewicz, Greve, & Tsai,
2004). In this way, the board provides the access to resources (resource
dependence) role discussed in section 1.4.1.2 and so may unlock potential resources
that would not otherwise be available to the firm.
The predominant way that boards are thought to co-opt the external environment and
provide resources is through interlocking directorships (Mizruchi & Stearns, 1994;
Pfeffer & Salancik, 1978). In this chapter, I introduce and discuss interlocking
directorships and social capital theory to propose an alternative measure to firm
interlocks. Interlocks and social capital are two different but parallel literatures that
have been used to help understand how board connections may provide resources to
a firm. Interlocks are formal connections between companies which occur when
firm’s share common directorships (Scott, 1991a). Social capital theory, which has
its roots in sociology, is much broader and is concerned with relationships between
people (Burt, 1980b; Coleman, 1988). After introducing these literatures, I discuss
and contrast how different network measures for interlocks are able to measure
social capital. Most research into board interlocks has attempted to associate
interlocks measured at the firm level to firm performance. However despite a sound
theoretical basis for expecting a relationship between board connections and firm
35
performance, results have been variable and inconclusive. In this study, I break
from tradition and measure the network of directors’ personal ties at the individual
level. Individual directors’ ties are then grouped at the board-level to provide a
measure of a board’s social capital.
Finally, I develop my guiding research question by synthesizing the governance and
sociological literatures to explore the relationship between the social capital of
boards of directors and company performance. As a result, I focus the research on
directors’ opportunity networks that arise through the network of directors’ social
connections.
3.2 Director interlocks
3.2.1 Definitions and overview A director interlock exists when an actor (director) simultaneously sits on the board
of two or more different organisations (Mizruchi, 1996). Thus, the study of director
interlocks is also referred to as multiple directorships (Scott, 1991a).
If a director of one company is also a director of one or more other companies, then
those companies are said to be interlocked by virtue of this director’s connection,
even though there may be no formal (or even actual) relationship between them.
This means new interlocks are automatically created whenever an existing director
joins the board of another firm, hence their creation may be either inadvertent or
intended.
Scott (1991b) refers to an inadvertent interlock as an induced interlock to highlight
that these links are (at least potentially) qualitatively different from a planned
interlock. In either case, interlocks are broken when a director holding more than
one director position leaves the board of one or more companies.
Following this definition, most director interlock research uses the company as the
unit of analysis, and measures the number of interlocks per company e.g. (Alexander
and Murray, 1992). The interlocks created by the ties between these companies can
then be mapped into a complex network of inter-organisational ties (Mintz &
Schwartz, 1985). The literature also highlights that interlocks can create indirect
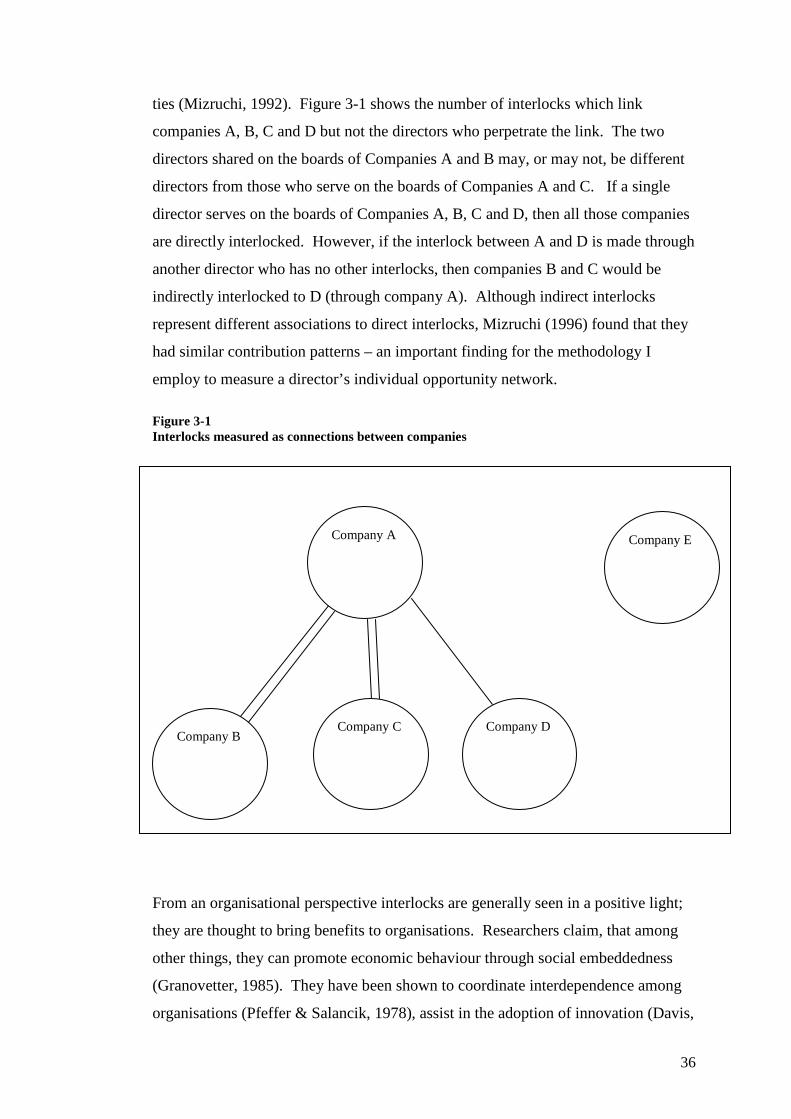
36
ties (Mizruchi, 1992). Figure 3-1 shows the number of interlocks which link
companies A, B, C and D but not the directors who perpetrate the link. The two
directors shared on the boards of Companies A and B may, or may not, be different
directors from those who serve on the boards of Companies A and C. If a single
director serves on the boards of Companies A, B, C and D, then all those companies
are directly interlocked. However, if the interlock between A and D is made through
another director who has no other interlocks, then companies B and C would be
indirectly interlocked to D (through company A). Although indirect interlocks
represent different associations to direct interlocks, Mizruchi (1996) found that they
had similar contribution patterns – an important finding for the methodology I
employ to measure a director’s individual opportunity network.
Figure 3-1 Interlocks measured as connections between companies
From an organisational perspective interlocks are generally seen in a positive light;
they are thought to bring benefits to organisations. Researchers claim, that among
other things, they can promote economic behaviour through social embeddedness
(Granovetter, 1985). They have been shown to coordinate interdependence among
organisations (Pfeffer & Salancik, 1978), assist in the adoption of innovation (Davis,
Company D
Company A
Company C
Company E
Company B
37
1991), and provide legitimacy to firms (Selznick, 1949) (see Table 3-1 for an
extensive review of the potential benefits of interlocks). However, interlocks have
also been regarded as indicators of ‘potential’ power relationships between
companies at the highest level which can be exploited (Roy, Fox, & Hamilton,
1994). Thus, interlocks have been considered as instruments of cohesion within the
capitalist class and so help to unify business into a strong and effective political
body (Mizruchi, 1996). In a study of interlocked directors in the United States and
Great Britain carried out by Useem (1984) a high level of political consciousness
was found among directors in both countries suggesting that they formed an “inner
circle” or a leading edge of the capitalistic class. However research attempts to
associate interlocks with the political behaviour of firms (and political action
committees) have been inconclusive (Mizruchi, 1992).
Interlocks have also been seen to have undesirable implications. They have been
referred to as sinister due to their association with anti-competitive and illegal
behaviour (Carroll, Stening, & Stening, 1990). The U.S. Congress considered that
interlocks could be used as mechanisms by unethical business to facilitate collusion
and restrict competition in markets and in 1914 passed the (U.S.) Clayton Anti-trust
Act. to prohibit interlocks between firms deemed to be operating in the same
markets (Mizruchi, 1996).
3.2.2 Classification of interlocks
While the definition of an interlock is uniform, researchers often classify interlocks
differently. Scott (1991b) classified interlocks into primary and secondary
interlocks based upon their assumed strength which in turn depends on the director’s
role in the organisation forming the interlock. Primary interlocks are defined as
those where an executive director (including the managing director) in one company
also serves as a director (either executive or nonexecutive) in another company.
Secondary interlocks are created solely by non-executive directors.6
Figure 3-2
These
classifications are illustrated in .
6In some European countries there is a third category of director referred to as an ‘intermediate director’. This class of director exists where companies have multiple or hierarchical board structures and the director is involved in major firm decisions on a regular basis. This is not applicable to Australia.
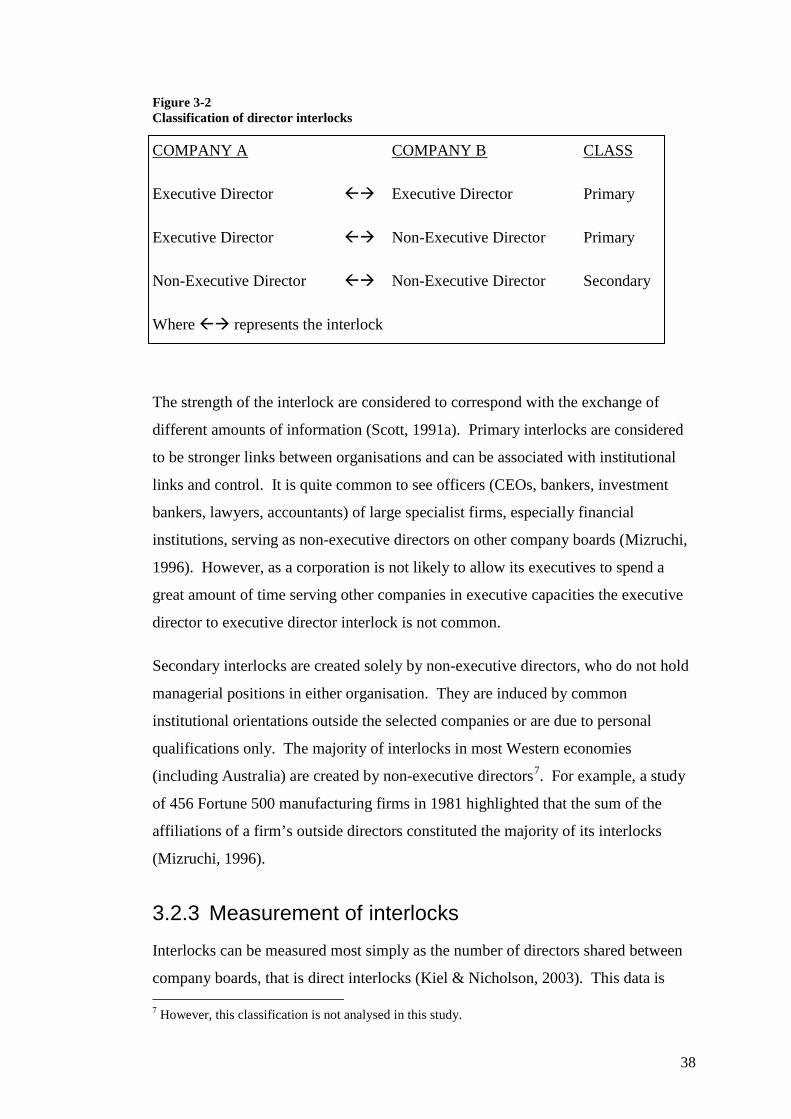
38
Figure 3-2 Classification of director interlocks
COMPANY A COMPANY B
Executive Director Executive Director Primary
CLASS
Executive Director Non-Executive Director Primary
Non-Executive Director Non-Executive Director Secondary
Where represents the interlock
The strength of the interlock are considered to correspond with the exchange of
different amounts of information (Scott, 1991a). Primary interlocks are considered
to be stronger links between organisations and can be associated with institutional
links and control. It is quite common to see officers (CEOs, bankers, investment
bankers, lawyers, accountants) of large specialist firms, especially financial
institutions, serving as non-executive directors on other company boards (Mizruchi,
1996). However, as a corporation is not likely to allow its executives to spend a
great amount of time serving other companies in executive capacities the executive
director to executive director interlock is not common.
Secondary interlocks are created solely by non-executive directors, who do not hold
managerial positions in either organisation. They are induced by common
institutional orientations outside the selected companies or are due to personal
qualifications only. The majority of interlocks in most Western economies
(including Australia) are created by non-executive directors7
3.2.3 Measurement of interlocks
. For example, a study
of 456 Fortune 500 manufacturing firms in 1981 highlighted that the sum of the
affiliations of a firm’s outside directors constituted the majority of its interlocks
(Mizruchi, 1996).
Interlocks can be measured most simply as the number of directors shared between
company boards, that is direct interlocks (Kiel & Nicholson, 2003). This data is 7 However, this classification is not analysed in this study.

39
then often represented graphically by the number of lines connecting the companies.
Figure 3-1provides an example of this approach. Of the five companies shown,
Company A has a total of 5 interlocks, Companies B and C have 3 interlocks each,
Company D one interlock and Company E has no interlocks. Company E is said to
be isolated from the other companies8
3.2.4 Effects and consequences of interlocks
.
Interlocks form a complex web of relationships between firms and so are potentially
powerful indicators of inter-organisational relations. Whether interlocks are
purposefully initiated by directors or by firms, or created quite unintentionally, the
consequences can be the same. Rather than speculate on apparent reasons that
organisations may seek to form interlocks, I focus on some of the main effects that
interlocks can have on organisations. As Mizruchi (1996, p. 280) highlights “the
causes of interlocks pale in comparison to the consequences or ‘so what’ question”.
Several reasons (and theories) have been proposed on the main effects of interlocks
at the organisational level and at the individual (director) level. From an
organisational perspective, interlocks are generally seen to open inter-corporate
communication channels (Brass et al., 2004; Galaskiewicz, 1985) from which a
variety of benefits or advantages can flow to the organisation and to individual
directors. Organisational benefits are primarily access to various types of
information (Davis, 1991; Mizruchi, 1996) needed by the firm (such as market-
based information, technical information, technology, new practices and innovation
(Davis, 1991)) and access to physical resources such as money and assets (Pfeffer &
Salancik, 1978). The significance of having prominent directors on a corporate
board can also serve to promote legitimacy for the firm (Mizruchi, 1996; Selznick,
1949). From the individual director’s perspective, the prestige afforded through
these appointments can affect their social standing among their peers and in the
8 Given that interlocks can be created innocuously, and without any intent by the companies
involved, this has lead some researchers to define interlocks more tightly in an attempt to focus more
on deliberate choice. For example, Cook (2003) defined interlocks as situations where companies
shared two or more directors on their boards.
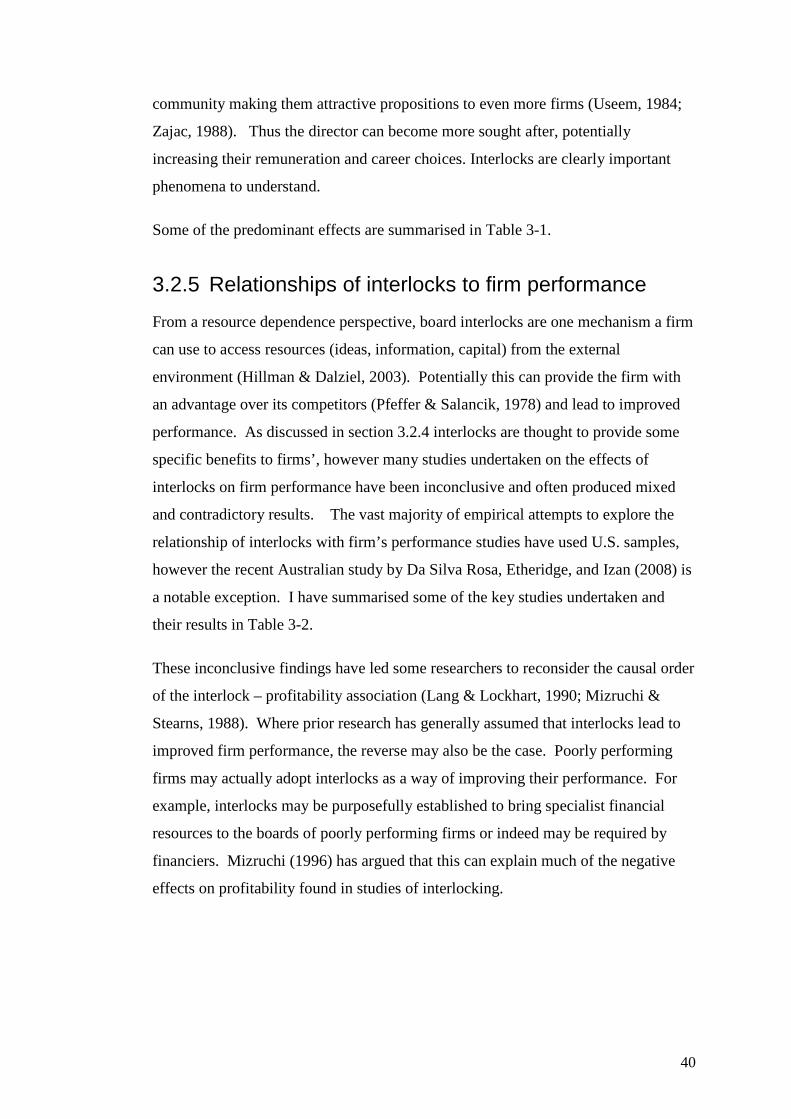
40
community making them attractive propositions to even more firms (Useem, 1984;
Zajac, 1988). Thus the director can become more sought after, potentially
increasing their remuneration and career choices. Interlocks are clearly important
phenomena to understand.
Some of the predominant effects are summarised in Table 3-1.
3.2.5 Relationships of interlocks to firm performance
From a resource dependence perspective, board interlocks are one mechanism a firm
can use to access resources (ideas, information, capital) from the external
environment (Hillman & Dalziel, 2003). Potentially this can provide the firm with
an advantage over its competitors (Pfeffer & Salancik, 1978) and lead to improved
performance. As discussed in section 3.2.4 interlocks are thought to provide some
specific benefits to firms’, however many studies undertaken on the effects of
interlocks on firm performance have been inconclusive and often produced mixed
and contradictory results. The vast majority of empirical attempts to explore the
relationship of interlocks with firm’s performance studies have used U.S. samples,
however the recent Australian study by Da Silva Rosa, Etheridge, and Izan (2008) is
a notable exception. I have summarised some of the key studies undertaken and
their results in Table 3-2.
These inconclusive findings have led some researchers to reconsider the causal order
of the interlock – profitability association (Lang & Lockhart, 1990; Mizruchi &
Stearns, 1988). Where prior research has generally assumed that interlocks lead to
improved firm performance, the reverse may also be the case. Poorly performing
firms may actually adopt interlocks as a way of improving their performance. For
example, interlocks may be purposefully established to bring specialist financial
resources to the boards of poorly performing firms or indeed may be required by
financiers. Mizruchi (1996) has argued that this can explain much of the negative
effects on profitability found in studies of interlocking.
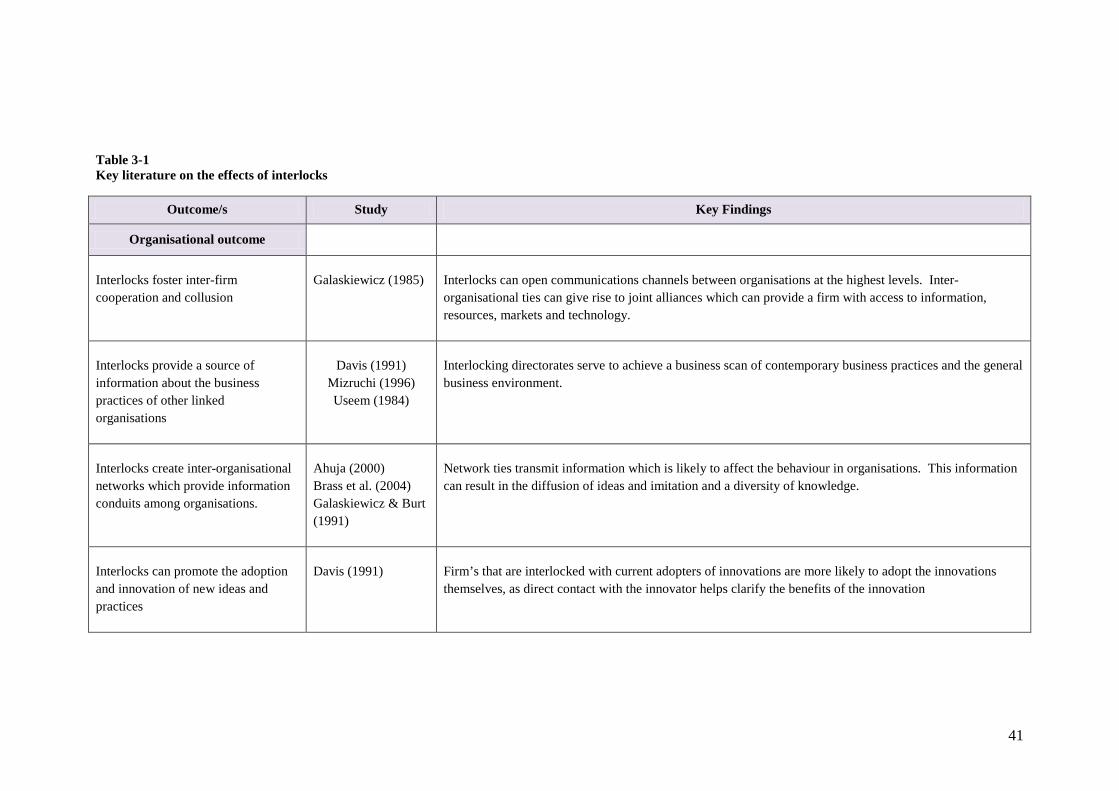
41
Table 3-1 Key literature on the effects of interlocks
Outcome/s Study Key Findings
Organisational outcome
Interlocks foster inter-firm cooperation and collusion
Galaskiewicz (1985) Interlocks can open communications channels between organisations at the highest levels. Inter-organisational ties can give rise to joint alliances which can provide a firm with access to information, resources, markets and technology.
Interlocks provide a source of information about the business practices of other linked organisations
Davis (1991) Mizruchi (1996) Useem (1984)
Interlocking directorates serve to achieve a business scan of contemporary business practices and the general business environment.
Interlocks create inter-organisational networks which provide information conduits among organisations.
Ahuja (2000) Brass et al. (2004) Galaskiewicz & Burt (1991)
Network ties transmit information which is likely to affect the behaviour in organisations. This information can result in the diffusion of ideas and imitation and a diversity of knowledge.
Interlocks can promote the adoption and innovation of new ideas and practices
Davis (1991) Firm’s that are interlocked with current adopters of innovations are more likely to adopt the innovations themselves, as direct contact with the innovator helps clarify the benefits of the innovation

42
Interlocks may promote economic behaviour through social cohesion and network embeddedness.
Granovetter (1985) A firm’s economic behaviour (which affects the firms’ strategies, structure, and performance) is socially embedded and can be affected by its relationship to other firms. Social embeddedness implies that actions undertaken in one firm may spread to other firm’s with which they are tied.
Interlocks can provide structural support for the ruling elite.
Huse (2007) Based on class hegemony theory, interlocks can be used as instruments of intra-class integration.
Interlocks coordinate interdependence among organisations.
Pfeffer & Salancik (1978)
Based on resource dependence theory, inter-organisational ties created by interlocks can assist the organisation to open pathways or linkages to other organisations. This can help to stabilise the organisation’s exchanges with its environment and reduce uncertainty.
Interlocks can result in co-option and control over firms.
Mizruchi (1992) Mizruchi & Stearns (1988) Pfeffer & Salancik (1978)
Interlocks enable firms, especially banks and financiers, to co-opt, control and monitor other firms.
Interlocks may provide a signal of legitimacy and confidence in the firm.
Mizruchi (1996) Selznick, 1949
Firms are considered legitimate by virtue of their linkages to other successful or prominent organisations. Boards want members who are renowned for being good citizens, who are both conscientious and non-controversial. Those most likely to have sufficient reputation are more likely to be known in a group of business owners and leaders, and friends or acquaintances of the CEO. By appointing high profile and successful directors to its board, the firm is signalling to investors and the community that it is a legitimate organisation and worthy of support
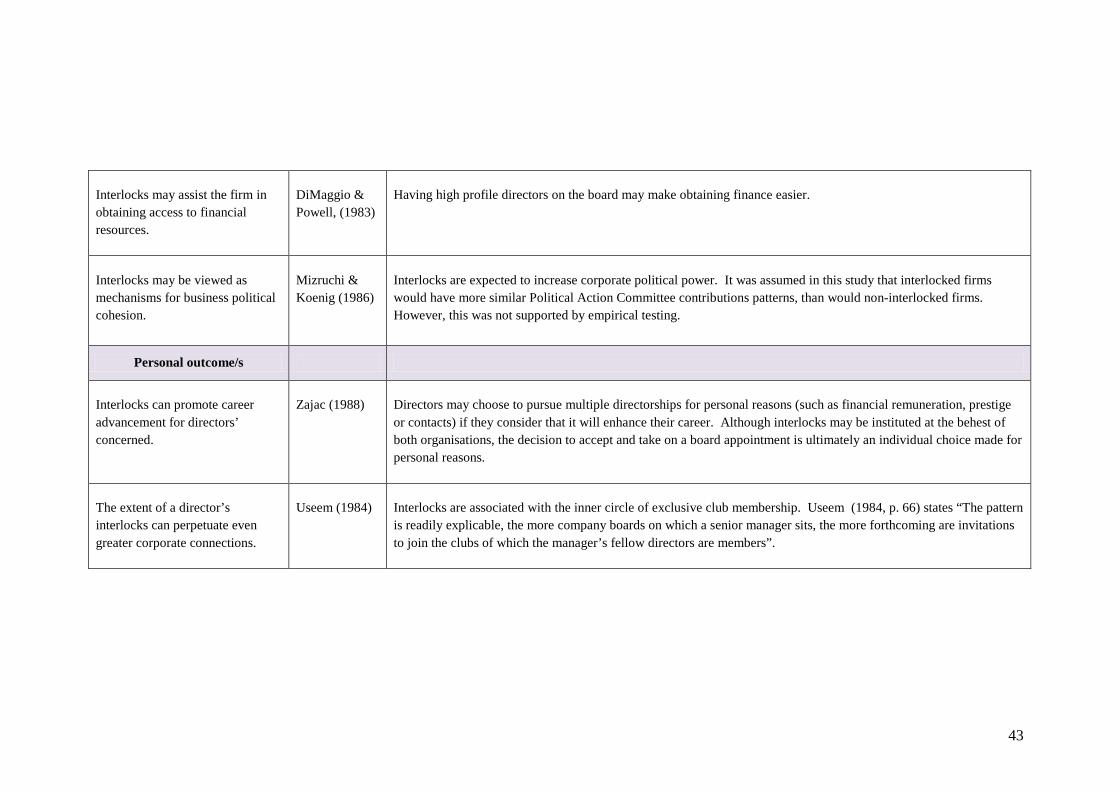
43
Interlocks may assist the firm in obtaining access to financial resources.
DiMaggio & Powell, (1983)
Having high profile directors on the board may make obtaining finance easier.
Interlocks may be viewed as mechanisms for business political cohesion.
Mizruchi & Koenig (1986)
Interlocks are expected to increase corporate political power. It was assumed in this study that interlocked firms would have more similar Political Action Committee contributions patterns, than would non-interlocked firms. However, this was not supported by empirical testing.
Personal outcome/s
Interlocks can promote career advancement for directors’ concerned.
Zajac (1988) Directors may choose to pursue multiple directorships for personal reasons (such as financial remuneration, prestige or contacts) if they consider that it will enhance their career. Although interlocks may be instituted at the behest of both organisations, the decision to accept and take on a board appointment is ultimately an individual choice made for personal reasons.
The extent of a director’s interlocks can perpetuate even greater corporate connections.
Useem (1984) Interlocks are associated with the inner circle of exclusive club membership. Useem (1984, p. 66) states “The pattern is readily explicable, the more company boards on which a senior manager sits, the more forthcoming are invitations to join the clubs of which the manager’s fellow directors are members”.
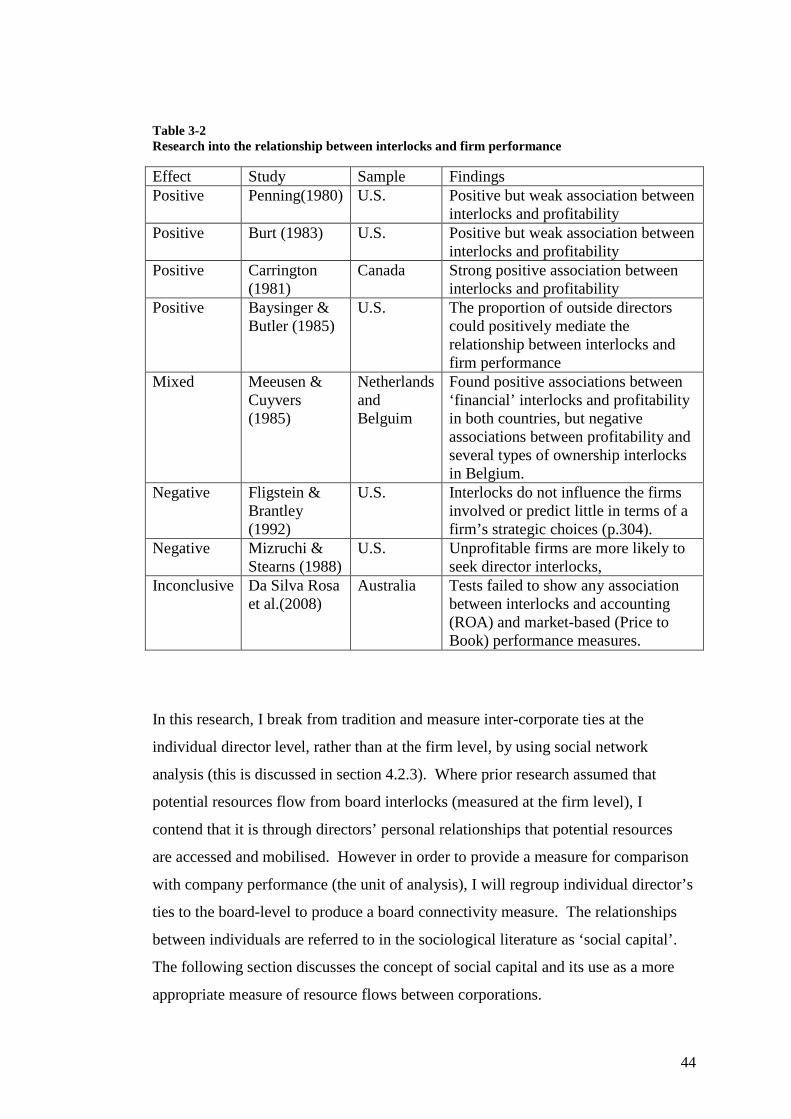
44
Table 3-2 Research into the relationship between interlocks and firm performance
Effect Study Sample Findings Positive Penning(1980) U.S. Positive but weak association between
interlocks and profitability Positive Burt (1983) U.S. Positive but weak association between
interlocks and profitability Positive Carrington
(1981) Canada Strong positive association between
interlocks and profitability Positive Baysinger &
Butler (1985) U.S. The proportion of outside directors
could positively mediate the relationship between interlocks and firm performance
Mixed Meeusen & Cuyvers (1985)
Netherlands and Belguim
Found positive associations between ‘financial’ interlocks and profitability in both countries, but negative associations between profitability and several types of ownership interlocks in Belgium.
Negative Fligstein & Brantley (1992)
U.S. Interlocks do not influence the firms involved or predict little in terms of a firm’s strategic choices (p.304).
Negative Mizruchi & Stearns (1988)
U.S. Unprofitable firms are more likely to seek director interlocks,
Inconclusive Da Silva Rosa et al.(2008)
Australia Tests failed to show any association between interlocks and accounting (ROA) and market-based (Price to Book) performance measures.
In this research, I break from tradition and measure inter-corporate ties at the
individual director level, rather than at the firm level, by using social network
analysis (this is discussed in section 4.2.3). Where prior research assumed that
potential resources flow from board interlocks (measured at the firm level), I
contend that it is through directors’ personal relationships that potential resources
are accessed and mobilised. However in order to provide a measure for comparison
with company performance (the unit of analysis), I will regroup individual director’s
ties to the board-level to produce a board connectivity measure. The relationships
between individuals are referred to in the sociological literature as ‘social capital’.
The following section discusses the concept of social capital and its use as a more
appropriate measure of resource flows between corporations.
45
3.3 Social capital and opportunity networks
3.3.1 Introduction to social capital
Social capital is concerned with the network of social relationships among people
and the benefit or advantage that these links or ties can provide to people (Burt,
1992, 2005). It focuses on links and relationships among people (social) and how the
structure of those relationships can provide a more valuable advantage (capital) to
some people in comparison to others. The term “Social Capital” has its roots in
sociology and originated from Jacobs (1965) work ‘The Death and Life of Great
American cities’. Jacobs (1965) highlighted the significance of networks of strong
personal relationships that had developed over time and the importance of these to
the functioning and survival of city neighbourhoods.
Social capital as a theory has been applied to understanding a wide range of social
phenomena (Nahapiet & Ghoshal, 1998). Some of the early applications of social
capital concepts related to family relations and the study of community organisations
(Loury, 1977; Nahapiet & Ghoshal, 1998) where it was considered essential in the
creation of trust, cooperation and collective action in these communities. It has also
been applied to other studies including; the development of human capital (Coleman,
1988), firm performance at the microeconomic level (Baker, 1990), geographic
regions at a macroeconomic level (Putman, 1993) and to nations (Fukuyama, 1995).
3.3.2 Defining social capital Researchers from different disciplines have proposed varying definitions for social
capital since its inception (e.g. Loury (1977), Bourdieu (1986), Baker (1990),
Coleman (1988), Burt(1992)).Whilst they generally agree on the concept (the
significance of relationships is a valuable resource in social action) different fields
and disciplines, including sociology, political science and economics, have
emphasised different aspects of social capital (Adler & Kwon, 2002). Definitional
differences relate primarily to the importance attached to the components of social
capital, and those components have been viewed in various ways. Most social
capital researchers acknowledge that there are at least two core components to social
capital. These are the physical network structure (the linkages) and the nature of the
46
linkage (i.e. whether the relationship between people is positive, negative or
neutral); both are necessary for social capital to exist.
Authors who emphasise the network structure of social capital (Baker, 1990; Burt,
1992) have defined structure as the physical direct ties between the actors (Baker,
1990). Others such as Bourdieu (1986) and Putman (1995) have defined structure
more widely than just direct linkages, and include indirect ties. An indirect tie is a tie
between two actors that occurs only through other actors and not directly (i.e. a
‘friend of a friend’). This wider conceptualization of social capital structure views
social capital as an opportunity network of potential resources that can be accessed
through such networks.
Different views have also been taken by researchers who have focused on different
aspects of social capital relations (the characteristics and nature of the ties of social
capital). These researchers argue that the quality and strength of bonds is most
important in the creation of social capital. For example, Dore (1983) focused on
goodwill, Adler (2001) on trust, and Williamson (1985) on forgiveness. Other
authors have classified the relationship types into two (Blau, 1964) or three broad
groups, namely social relations, market relations or hierarchical relations (Adler &
Kwon, 2002). Social relations are informal and relate to favours and gifts. In
contrast market relations are more formal and relate to the trade in goods and
services, these are generally structured. Hierarchical relations generally relate to
employment type contracts which have defined orders and authorities. Different
aspects of relations (trust, goodwill, forgiveness) will apply more to some categories
of relations than others. For example, goodwill which is essential in market
relations may not be so critical in hierarchical relations. Social exchange relations
evolve in a slow process, starting with minor transactions in which little trust is
required because little risk is involved and in which both partners can prove their
trustworthiness. This enables them to expand their relation and engage in major
transactions. Thus, the process of social exchange leads to the degree of trust
required for it, in a self governing fashion (Blau, 1968, p. 454).
Other researchers have tended to classify social capital relations as internal, external
or a combination of both. For collectives or groups, internal ties focus on the
relationships between actors within the group. The internal view of social capital

47
focuses on the ‘bonding’ inside a collective (commune) , that is between the persons,
whether it be an organisation, community or a nation (Putman, 1993; Sandefur &
Laumann, 1998). External bonds, commonly referred to as bridging, focus on
social capital as a resource located through a person’s external linkages to other
persons in the network (Burt, 1992). External ties among actors provides actors with
opportunities to leverage their contacts and resources (Adler & Kwon, 2002). The
composite internal/ external view takes a neutral position and recognizes that the
behaviour of a collective is influenced by both its internal bonding and its external
linkages, and what is internal or external can be a matter of perspective depending
on the unit of analysis.
For the purposes of this research I have adopted Burt’s (1992) definition of social
capital. This is a bridging definition of social capital which takes account of the
external links of individual directors as a mechanism to access and mobilize
resources or advantage for their firms. Burt (1992, p. 9) defines social capital as:
“Friends, colleagues, and more general contacts through whom you receive
opportunities to use your financial and human capital”.
3.3.3 Dimensions and measurement of social capital As highlighted in section 3.3.2 social capital is considered a multi-dimensional
construct, but one that lacks agreed dimensions (Nahapiet & Ghoshal, 1998). In
their investigation of the role of social capital, Nahapiet & Ghoshal (1998) proposed
that social capital be considered in three main dimensions, these are structural,
relational and cognitive social capital and are illustrated in Figure 3.3. Social capital
represents the intersection of these three dimensions. For instance social capital
between actors will come to fruition only when the actors are connected (structure),
have a common frame of understanding or reference (cognitive) and have a positive
bond (relation). These dimensions are discussed below.

48
Figure 3-3 Dimensions of social capital
Structural social capital is concerned with the physical linkages or ties between the
persons or groups. Granovetter (1992) refers to this as structural embeddedness. If
one person knows another, for example through a tennis club or a company
boardroom, then they are structurally connected through this relationship.
Structural ties between people or groups can result in a complex network of linkages
being created. It is the overall pattern of ties between actors which shows you who
can be reached and how they can be reached (Burt, 1992). Where persons in the
network are not directly connected, and can only be reached through other persons,
this is referred to as an indirect tie or a ‘weak tie’ (Granovetter, 1973). These social
networks can be studied and measured, and implications for the presence or absence
of network ties can be considered (Scott, 1991). Social Network Analysis (SNA)
has developed as a method to facilitate the measurement and analyses of various
networks and has spawned the development of some major software tools. SNA is
outlined in more detail in section 4.3.4.2.
SOCIAL CAPITAL

49
Relational social capital refers to the nature of those ties or bonds between persons,
that is the kind of personal bonds that people have developed with each other
through a history of their interactions (Granovetter, 1992). These bonds may be
positive, neutral or negative. If the bond is a friendship or a respected business
acquaintance, this bond can be regarded as a positive relation. Trust is considered a
key factor in the strength of the bond between the parties (Fukuyama, 1995; Putman,
1993). Trust between two people is created by repeated interaction, from the past
and from the future. Where relationships are high in trust, people are more likely to
be involved in social exchange and cooperation (Fukuyama, 1995). In contrast,
where two actors have developed mistrust for each other through a history of
interaction, this will result in a negative relation manifested in antagonistic
behaviour rather than cooperation (Nahapiet & Ghoshal, 1998). Relationships can
also be influenced by behavioural norms, which represent a degree of consensus in
the social system (Coleman, 1990), by obligations and expectations (Bourdieu,
1977) and by the willingness to identify with a group (Lewicki & Bunker, 1996).
Cognitive social capital relates to the shared mental schema between the actors
which can manifest itself in shared representations, interpretations and meaning
within a group (Cicourel, 1973) . It is a sharing of context between the actors which
enhances their communication thereby improving the social exchange process
(Boisot, 1995). Nahapiet & Ghoshal (1998) suggest that this sharing can take place
in two main ways, through shared language and vocabulary or through the sharing of
collective narratives. Though understanding a common language people are able to
discuss, exchange information and ideas, and communicate more freely. It also
facilitates their ability to gain access to people and information (Nahapiet &
Ghoshal, 1998). Shared narratives include stories, myths and metaphors which are
generally characterised by a lack detail and support, but which can nevertheless
facilitate the exchanging of practice and tacit experience between operators. These
‘rules of thumb’ can lead to a development and discovery of improved practice (Orr,
1990). This is arguably the more intrinsic component of social capital and can be
difficult to measure.
The basis of my research is related to structural social capital and traditional board
interlock studies, but distinguishable in an important way. Structural social capital

50
(i.e. a director’s network ties) only measures the number of direct connections that a
director has. More formally, structural social capital refers to actual direct ties
between actors in a network (in SNA terms it is ties at one degree of separation, see
appendix 4). In contrast, an opportunity network refers to an actor’s network of
social ties which creates opportunities for social capital transactions (Adler & Kwon,
2002). The opportunity network comprises both direct links and indirect links
(through a third person) which can be used to access resources that are embedded in
social networks (Lin, 1999). Therefore, it should be considered as a measure of
potential resources that a director can access. The differences are illustrated in
Figure 3-4 below and highlight that the structural social capital for the target director
is four links, the opportunity network is more than double at nine links (four direct
links and five indirect links)
In this study I follow Burt (1992) who considers the potential benefits derived
through social capital as ‘opportunities’ which are made available through an
individual’s network of ties, irrespective of the type of relations. He does not
distinguish between the types of relations (market relations, social relations and
other contacts) as social capital is considered transferrable from one social setting to
another and therefore influences the patterns of social exchange (Nahapiet &
Ghoshal, 1998). Some examples of transferability are: the transfer of trust from
religious and family situations to business situations (Fukuyama, 1995), from
personal relationships into business exchanges (Coleman, 1988) and from
individuals into organisations (Burt, 1992).
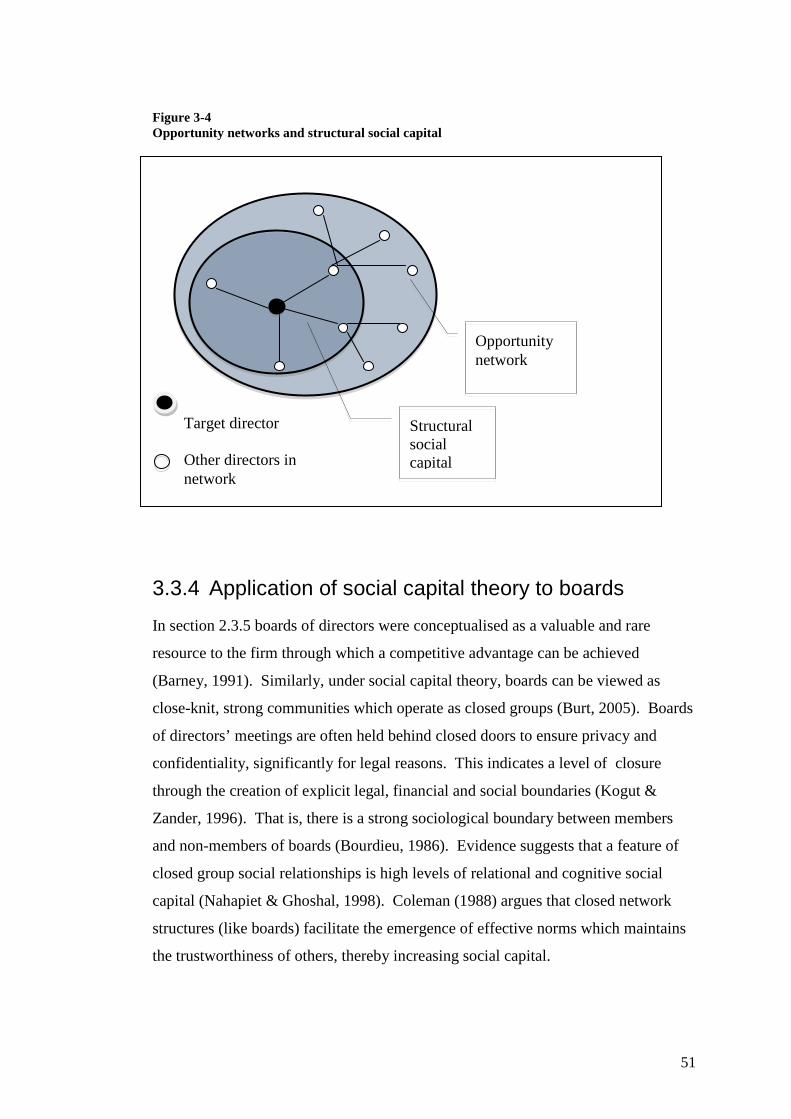
51
Figure 3-4 Opportunity networks and structural social capital
3.3.4 Application of social capital theory to boards
In section 2.3.5 boards of directors were conceptualised as a valuable and rare
resource to the firm through which a competitive advantage can be achieved
(Barney, 1991). Similarly, under social capital theory, boards can be viewed as
close-knit, strong communities which operate as closed groups (Burt, 2005). Boards
of directors’ meetings are often held behind closed doors to ensure privacy and
confidentiality, significantly for legal reasons. This indicates a level of closure
through the creation of explicit legal, financial and social boundaries (Kogut &
Zander, 1996). That is, there is a strong sociological boundary between members
and non-members of boards (Bourdieu, 1986). Evidence suggests that a feature of
closed group social relationships is high levels of relational and cognitive social
capital (Nahapiet & Ghoshal, 1998). Coleman (1988) argues that closed network
structures (like boards) facilitate the emergence of effective norms which maintains
the trustworthiness of others, thereby increasing social capital.
Opportunity network
Structural social capital
Target director Other directors in network

52
Directors who serve on the boards of multiple companies, that is directors who
create interlocks, possess a unique structural social capital network. Interlocks are
considered to create ties or bridges between directors in different companies through
which social capital can be created and transferred. Where there is only one link
(interlock) between two companies, that link is defined as a bridge which spans a
structural hole (Burt, 2005). Interlocking directors, therefore, act as boundary
spanners between two or more closed groups and serve as brokers in the social
network (Burt, 1992). Directors who span structural holes in the network can
possess a significant social capital advantage to themselves personally and to the
companies they serve through being able to broker the flow of information and
resources (Burt, 1992). Thus, social capital can be conceptualised as the advantage
that is created by a person’s location in a relationship structure or community.
Where all communication between the groups must pass through a particular actor,
they are in a privileged position. Those directors who span across organisations
have greater structural social capital (and potentially larger opportunity networks)
through which they can access resources.
While social capital benefits can accrue to individual directors, social capital theory
can also be applied to the board of directors as a team (Burt, 1992). The social
capital of individuals has been shown to aggregate to the teams on which they serve
(Rosenthal, 1996). Thus, the opportunity networks of individual directors should
accrue to boards who (through the access to resources role) can provide greater
access to resources for their firms (Nahapiet & Ghoshal, 1998)9
Directors’ formal ties, however, comprise only a subset of their total personal
network of ties. Every individual is socially embedded in a network of ties
(Granovetter, 1992) which comprise their business ties, family, friends, church
groups, social clubs and other social ties through which they belong and participate.
As social capital is transferrable from one social setting to another (Nahapiet &
Ghoshal, 1998), a person’s social capital network will include all these ties. For
.
9 Boards of directors who have greater diversity in their directors will potentially span more structural holes in the corporate network. Ancona and Caldwell’s (1992(a)) study of organisational teams found that teams composed of people from more diverse functions span more structural holes in the firm and had faster access to wider sources of information. Boards with larger opportunity networks will potentially mobilise greater resources for their firms.
53
example, the ties that a director may have through a professional association can
equally provide access to valuable resources (or advantage) similar to that which
they may access through their formal ties to another company board. Thus, another
important distinction for a focus on social capital is the scope of the network. Board
memberships and interlocks build formal ties between directors which comprise
their inter-corporate network. A director’s structural social capital, however,
represents both their formal company ties and other social ties. Furthermore, when
social ties are combined with indirect ties, a conceptually more complete picture of a
director’s potential social capital or opportunity network emerges.
An overview of the key theories synthesized in this research is shown in Figure 3-5 .
This figure depicts the intersection of board roles and social capital, particularly the
subset of structural social capital termed opportunity networks. It highlights that my
research focuses on measuring opportunity networks and how opportunity networks
relate to a board performing its resource dependence role.
A board of director’s opportunity network represents all potential resources a board
can access and mobilise for the company they serve through the ties of its directors.
I contend that this is a considerably more powerful measure than resources linked
only directly through interlocking boards (Nicholson et al., 2004). Whereas board
interlocks focus on direct links between companies, the opportunity network can
also extend to indirect ties. Nicholson et al. (2004) refer to indirect ties which pass
through a third person as ‘friend of a friend’ ties and argue that there is a transfer of
relational social capital (positive bond) to the second level of contact. This approach
is consistent with the strength of weak ties (Granovetter, 1973).
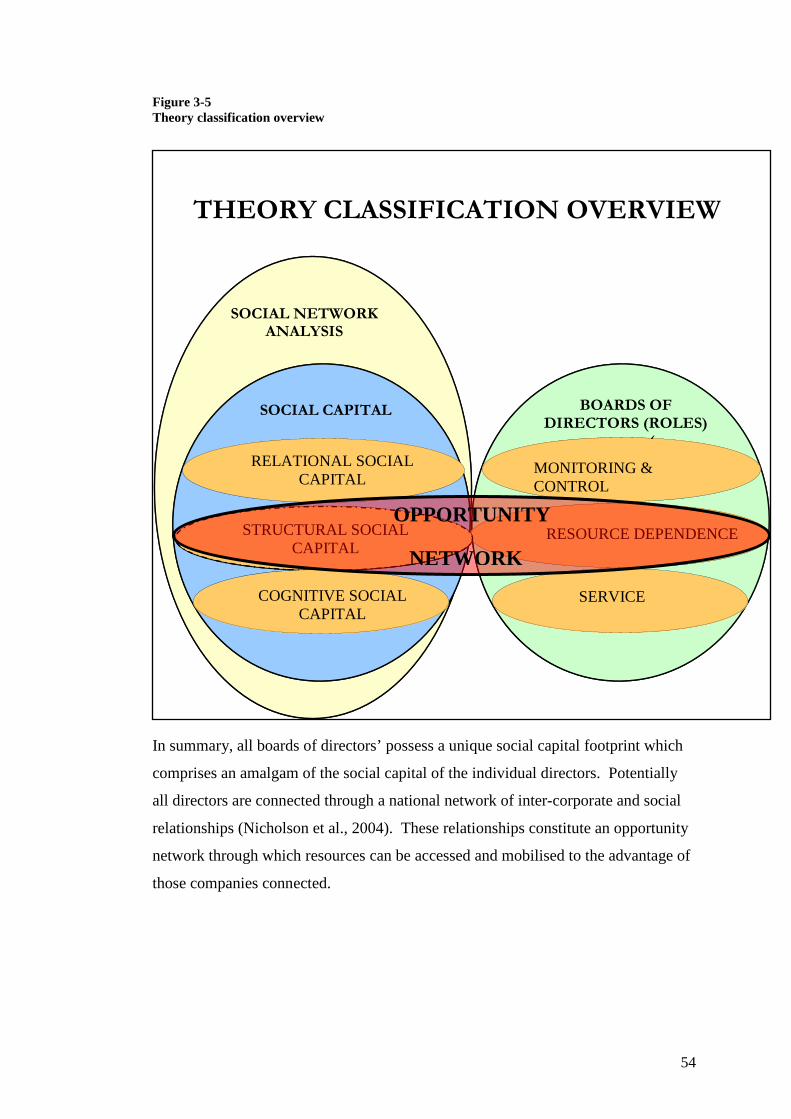
54
Figure 3-5 Theory classification overview
In summary, all boards of directors’ possess a unique social capital footprint which
comprises an amalgam of the social capital of the individual directors. Potentially
all directors are connected through a national network of inter-corporate and social
relationships (Nicholson et al., 2004). These relationships constitute an opportunity
network through which resources can be accessed and mobilised to the advantage of
those companies connected.
THEORY CLASSIFICATION OVERVIEW
SOCIAL NETWORK ANALYSIS
SOCIAL CAPITAL
RELATIONAL SOCIAL CAPITAL
STRUCTURAL SOCIAL CAPITAL
COGNITIVE SOCIAL CAPITAL
BOARDS OF DIRECTORS (ROLES)
(
MONITORING & CONTROL
RESOURCE DEPENDENCE
SERVICE
OPPORTUNITY
NETWORK
55
3.4 Development of research questions Resource dependence theory posits that a firm will develop strategies to enable it to
cope with external resource constraints (Pfeffer & Salancik, 1978) and various inter-
organisational vehicles have been used for this purpose (Selznick, 1949; Zald, 1967).
As discussed in section 3.2, interlocking directorships are considered as one of the
primary indicators of inter-corporate connectivity at the highest corporate levels.
These connections enable firms to acquire and mobilise resources to build a
sustainable competitive advantage (Mizruchi & Stearns, 1994).
This research is founded on two key differences with the extant literature. First,
while interlocks are an important mechanism for inter-corporate connectivity, there
are concerns about the conceptual validity of measuring interlocks directly and at the
firm level (e.g.(Nicholson et al., 2004)). This may be a reason that studies of the
relationship between firm performance and interlocks have provided inconclusive
research. In short, inter-corporate connections occur through people (directors) and
not through firms. It is a director’s ties that operationalise firm relations and so I
argue it is important to concentrate on the director as the level of analysis when
studying corporate networks. Second, directors’ ties occur through both their formal
(company) connections as well as their social networks. I use both these distinctions
from the standard approach to studies of directors’ networks to extend and test the
exploratory work undertaken by Nicholson et al.
Nicholson et al. (2004) undertook an exploratory study of board opportunity
networks (measured by board structural social capital) derived from the directors
interpersonal networks of the top 250 companies in Australia and the U.S.. While I
utilise their concept of an opportunity network, I extend their proposition that social
capital crystallises in inter-corporate relations to include personal or social
connections. Therefore, the research question this study seeks to answer is:
Is there a relationship between the size of a corporate board’s corporate and
social opportunity networks and the performance of the company they govern?
This research contributes to the Australian and international agenda on research into
corporate governance in two important ways. First, I focus on boards of directors
which many view as the lynchpin of corporate governance (Gillan, 2006). While I
56
ultimately need to determine a board’s opportunity network (since I am interested in
relationships to board performance), this approach better operationalises the access
to resources role of the board. Second, for the first time in the Australian literature, I
attempt to account for the impact of directors’ social networks. Though a better
understanding of directors’ roles and how they operate we may be able to identify
opportunities for advancement of knowledge and practices in this area. Ultimately,
this may lead to better governed and better performing companies.
The overall research question can be decomposed into research sub-questions that
address different board of directors opportunity networks. That is, the formal (inter-
corporate) network and the total network (comprising their formal and their social
network). I am interested in studying the relationship between firm performance
and the corporate network as previous studies of interlocks have provided
inconsistent results (see section 3.2.5). Table 3-2 summarises some of the mixed
results achieved by researchers in Australia and internationally in trying to relate
director interlocks with firm performance. By focusing on the individual director’s
network as a basis for measuring the corporate network, I expect to reconcile these
results. Thus I am interested in understanding:
RSQ1: Is there a relationship between the size of the formal opportunity
network of an Australian company board and the company’s performance?
Further, I am interested in extending research into directors’ networks by studying
the relationship between firm performance and the total director network (i.e. both
formal and social networks). For the purposes of this research, the social network is
defined as all relationships other than the formal inter-corporate (board)
relationships. The total network will be a larger, richer and more dense network,
with significantly more relationships between the directors and is expected to have
the strongest social capital effects (Burt, 1997). The total network takes account of
social capital being transferable across different relationship types (Nahapiet &
Ghoshal, 1998). A larger, denser network of directors’ ties will provide a greater
opportunity network through which greater access to resources is expected and so I
am interested in understanding:
57
SRQ2: Is there a relationship between the size of the total opportunity
network of an Australian company board and the company’s performance?
3.5 Hypotheses development The purpose of this section is to further develop the research questions into testable
hypotheses. One of the main challenges is to refine the meaning of opportunity
networks to enable them to be measured and tested. As discussed in section 3.3.3,
opportunity networks refer to the links between actors (directors) inside networks,
which can be used to access embedded resources (Lin, 1999). Those linkages
comprise both direct and indirect ties. In Figure 3-4, I differentiate between
structural social capital and opportunity networks, based on the nature of the ties
connecting the actors. Structural social capital is an opportunity network which is
comprised of direct ties only (no indirect ties), the inclusion of indirect ties (in
addition to the direct ties) results in a larger opportunity network. Therefore the
extent of an opportunity network will depend upon the number of indirect linkages
measured. In most human networks, it is probable that everyone is eventually
connected to everyone else where the chains are long.10
Social network analysis (SNA) measures degrees of separation between actors in a
network (see Appendix 4 for details). These are the number of linkages required to
connect any two actors. That is, if I know you, we have a direct tie. Direct ties
require one link and are referred to as one degree of separation. Where two actors
are not directly connected, that is do not know each other, but are connected through
another third person (or a common friend) they are connected through two linkages,
and this is referred to as two degrees of separation.
Nicholson, Alexander and Kiel (2004) contend that social capital is not expected to
transfer beyond three degrees of separation, that is a contact of my contact’s contact.
This is largely because there is no way of knowing who resides at the third degree of
separation. I know all the people with whom I am linked (one degree) and I can ask
these people to ask their contacts (second degree), but it is highly unlikely that my
contact’s contact will ask their contacts for any resources I may need.
10 Popular contention is six degrees of separation

58
In formulating hypotheses, I have taken a conservative approach to network reach
and test directors’ opportunity networks at both one degree (direct ties) and at two
degrees of separation. This represents direct ties as well as direct and indirect ties.
A director’s formal ties at one degree of separation are a function of the number of
boards on which they serve and the board size. Directors who serve on more than
one company board, that (i.e. interlocking directors) will generally have the largest
number of ties at degree-1 which they bring to their company boards. Board size, as
well as director interlocks, is also an important factor in determining a board’s
formal connections. For instance if I sit on 2 boards with 12 members, that
represents the same number of connections as sitting on 4 boards with 6 members.
The number of direct connections a board has, through its directors, represents a
board’s structural social capital and is a key component of a board’s social capital
(see section 3.3.3). The extent of a board’s formal connections is expected to
influence how well a board fulfils its resource dependence role (section 2.4.2),
particularly linking the company to its external environment (Pfeffer & Salancik,
1978) to provide access to resources and therefore to the company performance.
Therefore I would expect that :
Hypothesis 1: The size of an Australian company board’s formal structural
social capital is positively correlated with firm performance.
This logic is also directly applicable to a boards’ opportunity network, however I
now take account of weak ties (Granovetter, 1973), that is indirect ties at two
degrees of separation. Potential resources are also considered to be accessible by
directors through their formal inter-corporate network at two degrees of separation
(Nicholson et. al., 2004). As the board opportunity network is expected to provide a
more complete representation of resources embedded in social networks (Lin, 1999),
I would expect that:
Hypothesis 2: The size of an Australian company board’s formal opportunity
network at degree-2 is positively correlated with firm performance.
While the previous two hypotheses were concerned with the relationship between
inter-corporate ties and firm performance, I have also outlined the importance of
59
social ties. Social capital is expected to be cumulative and transferable across
networks (Nahapiet & Ghoshal, 1998) and so relevant to my research question.
Adler and Kwon (2002) classified social capital relations into three types; market,
hierarchical and social relations (see section 3.3.2.) and this classification can be
mapped and applied to directors’ relations. For example, market relations are formal
business relations and social relations relate to informal relations11
While H1 and H2 proposed relationships between firm performance and the formal
board network, the following two hypotheses propose a relationship with the total
network of director’s ties. The total network is expected to be more densely
connected providing more directors’ ties at one and two degrees of separation from
which greater social capital and opportunity can be accessed. Therefore, I would
expect that:
. These different
relations give rise to different exchange transactions (Blau, 1964), however under
conditions of repeated interaction all will contribute to the formation of social capital
(Adler & Kwon, 2002). The combination of formal ties and social ties together have
been shown to produce the strongest social capital (Burt, 1997). Therefore by
extending the formal network to include directors’ social networks, I would expect
to capture a greater board social capital network which can be mobilised to access a
heightened level of resources for their firms. The same logic as used in
formulating the preceding hypotheses (relating a board’s formal network to firm
performance) also applies to the relationship between a boards total (formal and
social networks) opportunity network and firm performance.
Hypothesis 3: The size of an Australian company board’s total structural
social capital (i.e. formal and social) is positively correlated with firm
performance.
Hypothesis 4: The size of an Australian company board’s total opportunity
network (i.e. formal and social) at degree-2 is positively correlated with firm
performance.
11 Although hierarchical relations, which are obedience based relations, and not expected to apply to this study they can give rise to social relations (Adler & Kwon, 2002).
60
A major contribution of this research is the use of different measures of board social
capital (through different measures of board opportunity networks). I measure this
social capital as both pure structural capital (i.e. ties directly associated with a
director) and as an opportunity network (i.e. ties associated at degrees one and two
with a director). Although I expect positive associations between both measures of
social capital and firm performance, the magnitude and impact of that effect may be
different. In fact, since the opportunity network represents a theoretically more
complete picture of the social capital available to a board, I would expect that:
Hypothesis 5: There is a stronger association and effect of a board’s
opportunity network measured at degree-2 on firm performance than of a
board’s structural social capital on firm performance.
Similarly, I expect differences in size and effect of the relationship between formal
measures of social capital and firm performance and the total measures of social
capital and firm performance. More particularly, since resources available to a
director in a social network are expected to cross over into business settings
(Nahapiet & Ghoshal, 1998) and the social capital available through the corporate
network is a subset of the full social network, I expect that:
Hypothesis 6: There is a stronger association and effect of a board’s total
(formal and social) opportunity network on firm performance than of a board’s
formal opportunity network on firm performance.
3.6 Conceptual model These hypotheses can be represented as a basic conceptual model (Ticehurst & Veal,
1999) which illustrates the building blocks of my research. I propose that there is an
association between board opportunity networks (structural social capital) and
company performance, as well as between other (control) variables and company
performance.
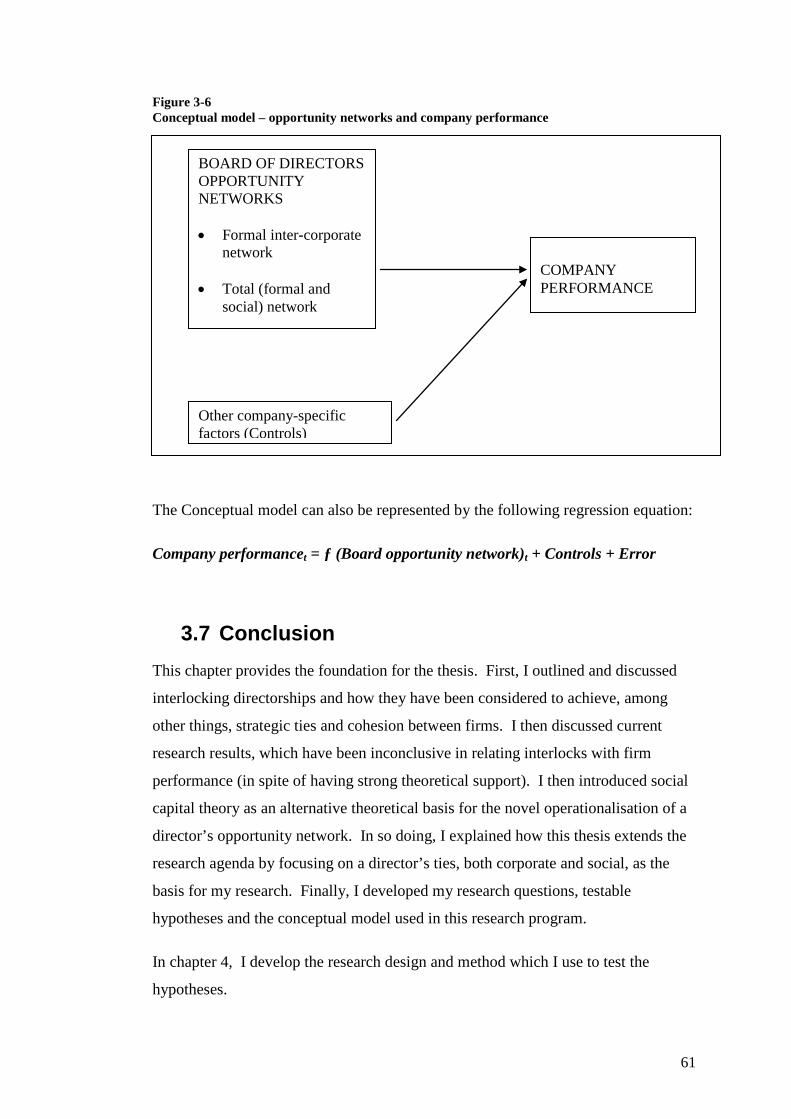
61
Figure 3-6 Conceptual model – opportunity networks and company performance
The Conceptual model can also be represented by the following regression equation:
Company performancet = ƒ (Board opportunity network)t + Controls + Error
3.7 Conclusion This chapter provides the foundation for the thesis. First, I outlined and discussed
interlocking directorships and how they have been considered to achieve, among
other things, strategic ties and cohesion between firms. I then discussed current
research results, which have been inconclusive in relating interlocks with firm
performance (in spite of having strong theoretical support). I then introduced social
capital theory as an alternative theoretical basis for the novel operationalisation of a
director’s opportunity network. In so doing, I explained how this thesis extends the
research agenda by focusing on a director’s ties, both corporate and social, as the
basis for my research. Finally, I developed my research questions, testable
hypotheses and the conceptual model used in this research program.
In chapter 4, I develop the research design and method which I use to test the
hypotheses.
BOARD OF DIRECTORS OPPORTUNITY NETWORKS • Formal inter-corporate
network • Total (formal and
social) network
Other company-specific factors (Controls)
COMPANY PERFORMANCE

62
Chapter 4 Philosophy, design and method
4.1 Introduction In Chapter 3, I developed the research questions and the six hypotheses central to
this study. In this Chapter, I describe the approach and steps taken to test the
hypotheses. First, I discuss and justify my research philosophy and approach
(section 4.2). I then outline the research design which includes how I test the
hypotheses (section 4.3.2), the study period, units of analysis and sampling
approach (section 4.3.3). In the research method I determine the constructs and
measures to be used in the analysis (section 4.3.4) and describe how required data is
sourced and collected (section 4.3.5).
Social Network Analysis (SNA) is a key technique of this research, that I have used
to operationalise the opportunity network constructs for my independent variable.
As a more in-depth knowledge of SNA may be required to help understand this
research, I provide a background to SNA, its development and network measures in
appendices 4 and 5, if required.
Finally in this chapter I discuss loading the data matrix in section 4.3.6 (for analysis
in Chapter 5).
4.2 Justification for the paradigm and methodology
4.2.1 Research philosophy In their quest to build knowledge researchers adopt a research philosophy (or
approach) to the building of knowledge (epistemology) which relates to their view of
reality (Trochim, 2000). Epistemology poses questions such as, how do we come to
know that reality? How do we know what we know? What counts as knowledge?
These research approaches can be broadly divided into three main views of reality or
paradigms12
12 Now commonly referred to as paradigms following the work of Thomas Kuhn (1962)
, these are positivism, interpretivism and realism. The methods and

63
techniques chosen in research should be in sympathy with the researcher’s
philosophical beliefs (Ticehurst & Veal, 1999). Selection of the chosen approach
will depend primarily on how the researcher views the world and what they intend to
accomplish by the research (Cavana, Delahaye, & Sekaran, 2001; Saunders et al.,
2003).
Positivist research is based on the assumption that there is one reality and a set of
universal laws exist which are waiting to be discovered. Positivist researchers prefer
to work with an observable social reality and the end product of positivist research
can be law-like generalizations similar to those produced from the physical and
natural scientists (Saunders et al., 2003). The researcher is detached from the data
being collected and “focuses on description, explanation and uncovering facts”
(Ticehurst & Veal, 1999, p. 20). Conclusions and test results are be based on
empirical evidence which is capable of replication (Cavana et al., 2001). Rigorous
processes and steps are involved in gathering and analysing data to ensure reliability
and replicability of the results. Replicability is considered the hallmark of good
positivist research. “Another researcher should be able to conduct the research in the
same way and come up with comparable results” (Cavana et al., 2001, p. 8).
Financial data is often analysed by positivist researchers using quantitative methods
to determine corporate financial performance in empirical studies. These
performance measures include ratios such as return on investment, return on assets
and profit margins. In corporate governance research various quantitative measures
(ratios) have been used to interpret board composition measures such as the
percentage of non-executive directors to board size.
Interpretivism (also referred to as constructivism) is an alternative view to
positivism in which knowledge is established through meanings attached to the
phenomena studied. A constructivist approach posits that there is no objective reality
and that there can be multiple versions of reality constructed by human beings who
experience a phenomenon of interest. People impose order on the world perceived in an
effort to construct meaning. Meaning lies in cognition not in elements external to us and
information impinging on our cognitive systems is screened, translated, altered, perhaps
rejected by the knowledge that already exists in that system. The resulting knowledge is
idiosyncratic and is purposefully constructed (Lythcott & Duschl, 1990). Interpretivist

64
researchers interact with the subjects of study to understand meaningful social action
and not just the external or observable behaviour of people (Neuman, 1997). The
researcher aims to capture the rich complexity of social situations (Saunders et al.,
2003) and attempts to understand the viewpoint from the subjects perspective. The
researcher “interprets” the information based on understanding the situation and is
immersed in the research process (Ticehurst & Veal, 1999, p. 20). Proponents of
interpretivism argue that the positivist approach may not explain the uniqueness of
particular situations and that a focus on abstract laws, formulas and numbers are not
relevant to the actual lives of people (Neuman, 1997).
Although the majority of research into boards has been positivist in nature, some of
the more recent board research has been interpretivist and has focused on the human
dynamics of boards as social systems, where factors such as where leadership
character, individual values, and decision making processes are seen as important
(Sonnenfeld, 2004). Much of the data for these interpretivist studies of boards are
gathered through personal interviews with directors , for an example see Pye
(2002).
Realism lies somewhere on the continuum between positivism and interpretivism
having elements of both (Healy & Perry, 2000). Among other names, realism is also
commonly referred to as critical realism (Hunt, 1991). While positivism is
concerned with a single, concrete reality and interpretivism multiple realities,
realism is concerned with multiple perceptions about a single, mind-independent
reality (Healy & Perry, 2000). Rather than being supposedly value-free, as in
positive research, or value-laden as in interpretive research (Lincoln & Guba, 1985),
realism is instead value cognizant and conscious of the values of human systems and
of researchers. Realism recognizes that perceptions have a certain plasticity
(Churchland, 1979) and that there are differences between reality and people’s
perceptions of reality. A realist researcher accepts that our knowledge of reality is a
result of social conditioning and cannot be understood independently of the social
actors involved in the knowledge derivation process (Dobson, 2002). However
realism also takes issue with the belief that the reality itself is a product of this
knowledge derivation process and asserts that "real objects are subject to value laden
observation" (Neuman, 1997, p. 74). For instance realism criticises positivism for
65
failing to deal with the meanings of real people and their capacity to feel and think,
but it also criticises the interpretivist approach for being too subjective and relativist.
Neuman (1997) contends that a realism researcher needs to understand history, adopt
a set of values, and know where to look for underlying structure to interpret the
facts.
Practically it has been difficult for researchers to adopt a realism approach for board
of director studies due to the confidential nature of board meetings, and outsiders are
rarely invited to observe how a board operates.
4.2.2 Approach to this research. In this research, I employ a positivist approach. Fundamentally, I believe there is an
underlying and measurable reality that governs business behaviour. Since this
research is concerned with boards of directors’ opportunity networks and the
relationship between these ‘board contacts’ and company performance, I focus on
objectively measuring relationships that I believe exist. Thus, I focus on measuring
the number of contacts in the opportunity network rather than the quality, nature or
depth of the relationships between the directors. In this way, the number of contacts
represents the potential resources or advantage that can be accessed and mobilised
for the benefit of the company. The size of a board opportunity network then
represents a proxy for a board’s real opportunity network.
Further, board memberships are publicly available information and can be obtained
from published annual reports; they thus represent objective and replicable data
sources. Ties through these memberships can be precisely mapped into a network
that can then be objectively and reliably measured using techniques found within
Social Network Analysis. Likewise the firm performance measures used in this
analysis, accounting-based and market-based measures, are objective measures that
are all available from public sources (published company information and market-
based information). As boards of directors’ network measures and company
performance data are precise quantitative data (Cavana et al., 2001), this research
lends itself to a positivist paradigm. I will empirically test the relationship between
the size of the opportunity network of a company’s board of directors and company

66
performance using statistical regression analysis. I also control for other factors
considered to affect this relationship in the regression.
In conclusion, I have adopted a positivist paradigm as it is best suited to what I am
trying to study (Cavana et al., 2001). By focusing on the phenomenon under
examination, rather than the methodology, researchers can select appropriate
methodologies for their enquiries (Krauss, 2005). Access to reliable archival data
sources and the use a structured quantitative methodology ensures strong objectivity
and replicability in this study. I am able to remain detached and uninvolved in the
data collection and interpretation (Al Zeera, 2001).
4.3 Research design and method
4.3.1 Overview In this section of provide details of the research steps I undertake in order to test the
hypotheses. Specifically I outline how I will test the hypotheses, the unit of
analysis, and rationale for selection of the sample. I then proceed to define the
constructs I use to measure the variables of interest and the how I collect the data
required for the analysis. This chapter culminates in uploading of the data matrix
into the statistical package SPSS. Details of the analysis itself are provided in
Chapter 5.
Figure 4-1 (below) shows the key steps I have undertaken to prepare the data matrix.
These are further discussed in the sections 4.3.3 to 4.3.6.
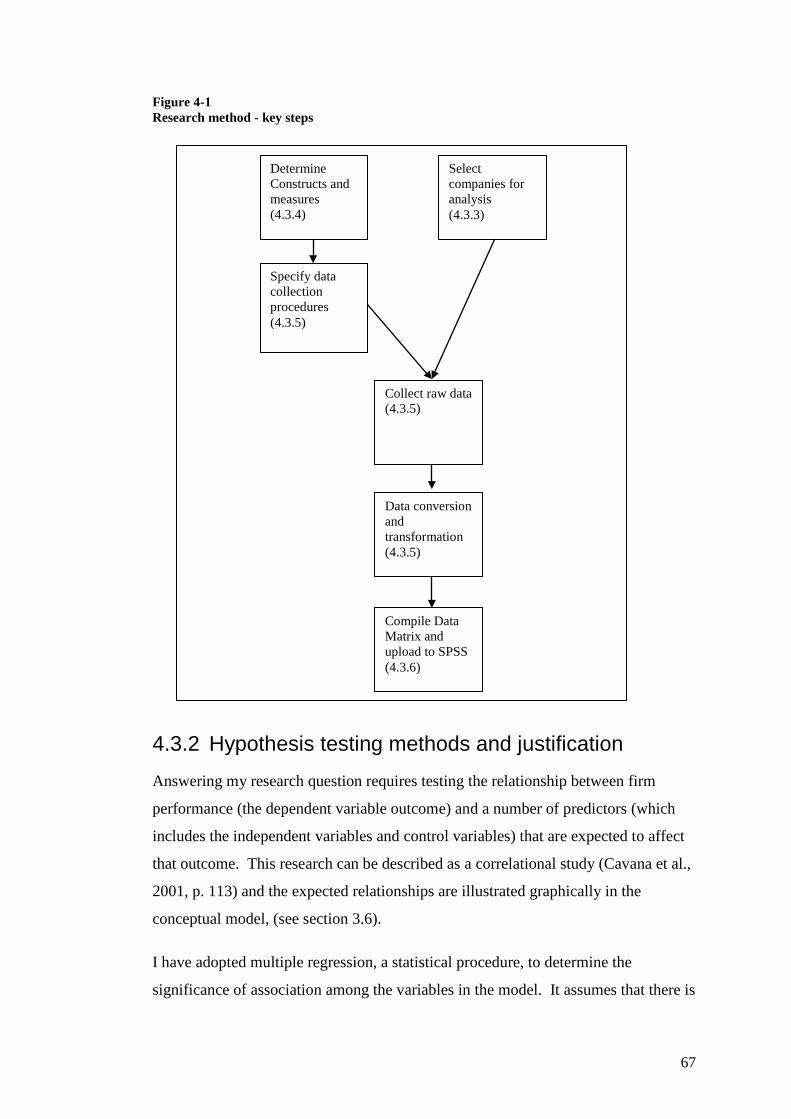
67
Figure 4-1 Research method - key steps
4.3.2 Hypothesis testing methods and justification Answering my research question requires testing the relationship between firm
performance (the dependent variable outcome) and a number of predictors (which
includes the independent variables and control variables) that are expected to affect
that outcome. This research can be described as a correlational study (Cavana et al.,
2001, p. 113) and the expected relationships are illustrated graphically in the
conceptual model, (see section 3.6).
I have adopted multiple regression, a statistical procedure, to determine the
significance of association among the variables in the model. It assumes that there is
Determine Constructs and measures (4.3.4)
Specify data collection procedures (4.3.5)
Select companies for analysis (4.3.3)
Data conversion and transformation (4.3.5)
Compile Data Matrix and upload to SPSS (4.3.6)
Collect raw data (4.3.5)

68
a linear relationship between the dependent variable and independent variables.
Multiple regression allows predictions to be made of the dependent variable
(company performance) based on several predictor variables (control and
independent variables) (Field, 2009, p. 198). With multiple regression it is possible
to determine the importance of each variable of interest, and within a group
comprising many variables of interest and their relationship with the dependent
variable (Hair, Anderson, Tatham, & Black, 1998).
All hypothesized relationships made in this research are directional, i.e. they
hypothesize a positive relationship between the size of the board opportunity
network and company performance. Consequently one-tail tests are adopted as each
comparison has one direction only. The hypothesis will be rejected where there is
no relationship between the network measure and performance or if there was a
negative relationship between the network measure and performance. The affect of
a one tail test is that the significance or potential error of the test is halved, thus
increasing significance over the two-tailed test.
I also adopt a ‘forced entry’ method of regression. With this method all predictors
are forced into the model simultaneously (Field, 2009). The forced method relies on
good reasons for choosing the predictors; in this study they are based on past
research. Unlike the other main regression methods (hierarchical or stepwise) no
decision is made as to the order or importance of predictor variables.
In summary, multiple regression is an objective method for assessing the degree and
character of the relationship between the dependent variable and the independent
variables in order to directly answer the research questions. It also aligns to my
positivist epistemological position (see section 4.2.2). However, its reliability is
premised on a number of assumptions about the data which must be met. The data
must satisfy normality, linearity and homoscedasticity tests (Tabachnick & Fidell,
2001, p. 56), which I discuss during the data analysis in Chapter 5.
In this study, the data analysis and multiple regression is performed using the
statistical package SPSS.
69
4.3.3 Study period and sample selection Since I am interested in the relationship between a board’s opportunity network and
company performance, the analysis must necessarily proceed at the company level.
Thus, the research focuses on developing a measure of the board’s opportunity
network (the independent variable) and analysing its association with company
performance. For each company selected, I collect and analyse directors’ network
data for both the formal (inter-corporate) network and the total (formal and social)
network) as well as performance and control data.
This study is restricted to large publicly listed companies registered and
headquartered in Australia for three important reasons. First, different countries
operate different corporate governance regimes, and since most companies operate
in a single country and are founded under local (national) laws, they are generally
not internationally comparable. Thus, selecting a single country as a focus was
necessary to control for differences in corporate governance systems. Second, social
capital resides in personal networks, and these networks are most often located in the
one geographical area (Nahapiet & Ghoshal, 1998). By restricting this study to
companies whose boards are domiciled in Australia, it is reasonable to assume the
majority of directors will be Australian residents and have their network of contacts
in Australia13
The analysis is undertaken using 1999 data. An extensive data set for this period
was made available to me, and this made the collection of several years of lagged
performance data possible (see section 4.3.4.1 below). Although the data could be
criticised as old, this does not bear directly on my research question and I expect
associations in the data to be generalisable across time.
. The third reason for my sample selection is that studying a full
network requires population data. Therefore, I have selected an entire population
comprising the Top-105 public listed Australian companies in 1999. This ensures
that the entire inter-corporate director network is captured for the analysis, and so
minimises any leakage of formal contacts outside the Top-105 network. This would
not be achievable under a sampling approach.
13 In fact there is a requirement that a minimum number of directors be ordinarily resident in Australia.

70
The top-105 listed companies were chosen by size, based on their 1999 market
capitalization14. These companies have a significant presence on the Australian
Stock Exchange (ASX) and to the Australian economy. The list of companies
selected for the study is provided in Appendix 2. The top-105 listed companies
account 73.8% of the market capitalisation of all Australian listed companies15
4.3.4 Constructs and measures
.
Further, as prominent Australian companies, the data was readily available from a
company search of public records. Selection of the population was initially made
using a search of the Aspect-Huntleys Fin-Analysis database of Top 200 companies
sorted by their 1999 market capitalization. Companies which were either not
Australian listed or headquartered in Australia were eliminated.
An important component of any study is operationalising the research question.
This involves two main challenges, namely specifying the model and
operationalising each construct within the study (Cavana et al., 2001). The first is a
potential problem of misspecification and the second involves measurement error or
construct validity. I now deal with each in turn.
When developing a model for testing research, the objective is to ensure that all
important variables are included and irrelevant variables have been omitted.
Redundant or irrelevant variables can mask the true effects of variables through
multicollinearity and over-fitting the model (Zikmund, 2003). The conceptual
model for this study was presented in section 3.6. The model comprises three
categories of variable, and an error factor. These are the dependent variable (i.e.
company performance), the independent variable (i.e. the measure of the board
opportunity network), and control variables. The error represents changes in the
dependent variable that cannot be explained by the independent variable and the
control variables. The variables are defined and discussed below.
14 Market capitalization is a market-based valuation measure for companies based on their share-prices. Based on the efficient market hypothesis (a market in which all share prices reflect fully all the available information, so that investors cannot make excessive returns by exploiting information (Drever, Stanton, & McGowan, 2007, p. 266)) share price can be assumed to be a measure of a firm’s true value (Drever et al., 2007, p. 266). 15 Based on the top-105 companies market cap. 1999 of 0.585$t. and all ASX Listed companies market cap. 1999 of 0.783$t. from Aspect-Huntleys Fin-Analysis data.

71
Company performance (Perf) is the dependent variable used in the model and
represents the primary variable of interest (Cavana et al., 2001). All other variables
in the model are hypothesised to effect company performance. Operationalisation
and justification of company performance measures is discussed in section 4.3.4.1.
Board opportunity network size (BON) is the independent variable of interest to
this research, which is expected to influence the dependant variable in either a
positive or negative way. This variable will be operationalised in several ways to
represent alternative network measures being tested. For operationalisation and
justification of board opportunity network size measures see section 4.3.4.2.
Control variables in the model represent other independent variables which, in
addition to the independent variable, are also expected to influence the dependent
variable. I have adopted five control variables commonly used in corporate
governance research which are considered to influence company performance in
addition to the size of the board opportunity network, these are:
Previous performance (Perft-1)
Company size (Coy-size)
Board size (Bdsize)
Board independence (Bdindep) and
CEO Duality (Chairindep)
These control variables are defined and discussed in section 4.3.4.3 together with
their operationalisation and justification.
Using the abbreviated variable names (shown in brackets above), the full regression
equation is:
Perf = ƒ (BON) + Perft-1 + Coysize + bdsize + bdindep + Chairindep + E
In addition to specifying the model, it is also important to measure variables as
accurately as possible. There are often many possible operationalisations for each
construct and it is therefore important to carefully consider each measure. In fact,
operationalising constructs remains a key problem in studies of boards (Daily,
Johnson, & Dalton, 1999). For example company performance can be measured in
72
different ways such as sales revenue, gross profit, and growth in equity, return on
shareholders’ funds or return on assets. In sections 4.3.4.1 to 4.3.4.3, I justify my
choice of variable and the operationalisation of each.
4.3.4.1 Dependant variable - company performance
While there is no consensus on what constitutes appropriate measures for financial
performance measurement (Johnson, 1996), performance measures usually fall into
two main groups; accounting-based and market-based performance measures
(Fosberg, 1989). Accounting-based measures are based on historical performance
(Fisher, 1988). They are measures of what has occurred in the past and are backward
looking and objective measures. The more popular or orthodox accounting-based
measures include some form of return on investment which compares profit
performance to the total asset base, the net asset base or the equity base. Other
accounting measures use valuation adjustments to asset values to update them to
current market or replacement cost. In contrast, market-based measures are
concerned with the overall value placed on the firm by the financial markets
(generally based on its future income or earnings expectations) and may not be
related to asset valuations, current operations or past profitability (Kiel & Nicholson,
2003). Market-based values are founded on economic valuations derived from the
capital asset pricing models. Capital asset pricing models use discounted future
earnings cash flows to derive a firm’s current valuation.
In comparison with market-based measures, accounting performance measures may
not be responsive in showing a performance effect. For instance an initiative may
take several years to eventually flow through to a reported accounting profit (or
loss). To address this concern with accounting measures, some corporate
governance researchers decide to lag or average accounting performance over time
(e.g. see Kiel and Nicholson (2003)). In contrast with accounting performance
measures, market-based measures are considered to be responsive in their reactions.
In an efficient market in which all share prices reflect fully all the available
information, it is assumed that investors cannot make excessive returns by exploiting
information (Drever et al., 2007, p. 266). Financial markets in Australia are regarded
as efficient (Ball, Brown, Finn, & Officer, 1989; Kasa, 1992) and it is therefore
assumed that board demographics will be known to market participants and reflected
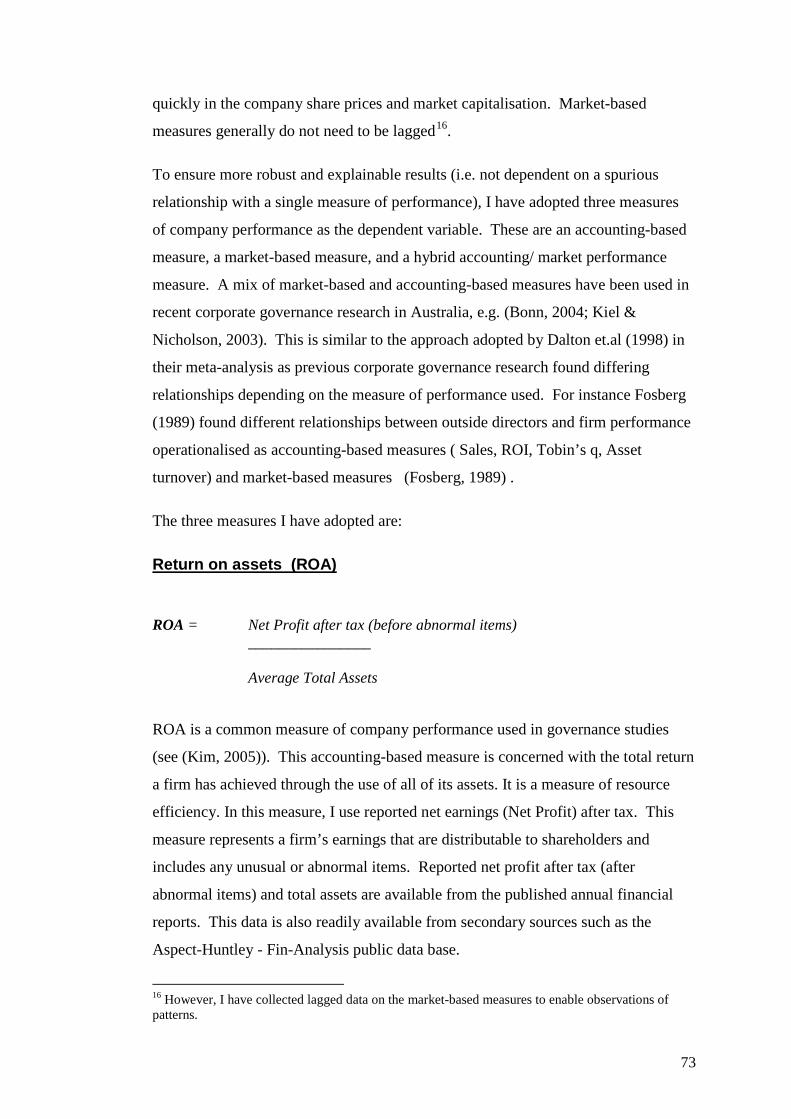
73
quickly in the company share prices and market capitalisation. Market-based
measures generally do not need to be lagged16
To ensure more robust and explainable results (i.e. not dependent on a spurious
relationship with a single measure of performance), I have adopted three measures
of company performance as the dependent variable. These are an accounting-based
measure, a market-based measure, and a hybrid accounting/ market performance
measure. A mix of market-based and accounting-based measures have been used in
recent corporate governance research in Australia, e.g. (Bonn, 2004; Kiel &
Nicholson, 2003). This is similar to the approach adopted by Dalton et.al (1998) in
their meta-analysis as previous corporate governance research found differing
relationships depending on the measure of performance used. For instance Fosberg
(1989) found different relationships between outside directors and firm performance
operationalised as accounting-based measures ( Sales, ROI, Tobin’s q, Asset
turnover) and market-based measures (Fosberg, 1989) .
.
The three measures I have adopted are:
Return on assets (ROA)
ROA = Net Profit after tax (before abnormal items) ________________ Average Total Assets
ROA is a common measure of company performance used in governance studies
(see (Kim, 2005)). This accounting-based measure is concerned with the total return
a firm has achieved through the use of all of its assets. It is a measure of resource
efficiency. In this measure, I use reported net earnings (Net Profit) after tax. This
measure represents a firm’s earnings that are distributable to shareholders and
includes any unusual or abnormal items. Reported net profit after tax (after
abnormal items) and total assets are available from the published annual financial
reports. This data is also readily available from secondary sources such as the
Aspect-Huntley - Fin-Analysis public data base.
16 However, I have collected lagged data on the market-based measures to enable observations of patterns.
74
Consistent with a similar network-performance study (Kim, 2005) I have lagged
accounting performance by one, two and three years in an attempt to better align this
with expected board opportunity network effects.
Risk adjusted total shareholder return (RATSR) is a hybrid accounting-based and
market-based measure. It measures an investor’s abnormal return (from
expectation) for their investment in the company over a period. It takes into account
changes in share price and is regarded as a comprehensive and forward looking
measure. RATSR can be both positive and negative and represent the difference
between the Total Shareholder Return (TSR) and the Expected Return (risk
adjusted) for the company. Where a company performs outside of what is expected
of it by the market (taking into account its market risk) it will show a positive or a
negative abnormal return. Total shareholder return for the period comprises three
components: (1) the change in the company share-price over the period, (2) capital
adjustments during the period (for example share splits and reconstructions), and (3)
any company distributions (e.g. dividends) paid to shareholders during the period.
Risk adjusted total shareholder return (RATSR)
RATSR is a derived measure calculated by reducing the total shareholder return by
the return expected for the company (after taking account of the risk free interest
rate, the market premium expected for share market investments and specific
company risk (beta)) and deflating the residual by the expected return. The risk free
rate is the rate of interest an investor would earn without any investment risk, that is
their capital and interest earned is fully protected. The 10 year government bond
rate is generally used as a proxy for the risk free rate (Officer, 1989). The Market
Premium is the difference between the Share Market Return (averaged for the share
market as a whole) and the Risk Free earning rate. The share market return is
expected to be greater than the Risk Free rate to compensate for the extra risk from
investing in the market. The Company Beta is a measure of variability in a
company’s income stream relative to the share market as a whole (A.G.S.M. Centre
for Research in Finance, 2007). Formally, a beta is defined as the covariance of
individual returns with those of the market index, scaled by the variance of index
returns. It is used as a company risk factor for each company relative to the share
market as a whole.
75
RATSR is calculated as follows:
RATSR= total shareholder returni (TSR) – expected returni _________________________________________ expected returni
where:
Total Shareholder Return = dividendi + (share priceend period i – share pricestart period i ) * 100 ___________________________________________________ share price start period i
and expected returni = risk free ratei + (company Beta * market premiumi).
The expected return represents the rate of return which the shareholder can
reasonably expect to receive from their investment in the company after allowing for
share market risk and company risk.
This measure may show significant variability among companies, primarily through
the equation denominator, the expected return. The expected return for all
companies is positively related to the company beta (as the risk free rate, and the
market return are constants for all companies). Therefore when the beta value is
small the expected return (denominator) will also be small and generate a higher
RATSR (similarly, a high beta will result in a higher expected return and a lower
RATSR). Extreme high or low beta values can generate significant variation in the
RATSR measure. An advantage of the RATSR measure is that, unlike other
measures, it controls for industry and firm type variability in the performance
figures.
Developed by James Tobin (1969), this measure compares the market value of a
company (determined by the financial markets) to the replacement value of the
company’s assets. Market efficiency in Australia is considered strong (Ball et al.,
1989) and it can be assumed that any effects of board performance would be quickly
absorbed by market participants and be reflected in the market price of securities
Tobin’s q (TQ)
76
(Fama, 1998). This measure has been employed to explain various corporate
phenomena. It is calculated as follows:
Tobin’s q = total market value of firm/ total assets at replacement cost.
The Total Market value of a firm is the aggregate of all issued shares, securities and
other debt of the company. Each class of security is valued at its respective market
value, the total reflects a market-based firm valuation. A value of 1 would indicate
that a firm’s market value is reflected solely in the firm’s recorded assets. Where the
market values a firm at greater than the value of its assets, then its Tobin’s q will
exceed 1.
Tobin’s q has been criticised due to its complexity of data requirements (to
determine asset replacement values) and computational effort (Chung & Pruitt,
1994). Chung and Pruitt (1994) developed a proxy for Tobin’s q to simplify this
calculation and provide a reliable estimate of Tobin’s q. Chung’s correlation
coefficient for Approximate q, when compared over a 7 year period from 1978 to
1987 against the more complex calculation results performed by Lindenburg-Ross in
1981, showed a significant correlation of 0.94. Based upon these results, I have
used Chung’s Approximate q measure as a proxy for Tobin’s q in my study; their
approximate measure is calculated:
Approximate q = (MVE + PS + DEBT) / Total Assets
Where, MVE is the Market value of Equity (the firm’s ordinary share price
multiplied by the number of Ordinary shares issued), PS is the liquidating value of
the firms preference shares and other convertible securities, and DEBT is the value
of the firm’s long term debt.
4.3.4.2 Independent variable - board opportunity network (BON)
As previously discussed, I am interested in measures of a board’s opportunity
network based on individual directors’ opportunity network measures. Therefore, at
first instance, directors’ opportunity networks must be measured. To do this I use
Social Network Analysis (SNA) (see Appendix 4 for relevant background
information). SNA is a robust technique, used by sociologists and mathematicians,

77
to measure social networks. Some of the predominant measures are shown and
discussed in Appendix 5.
SNA provides two primary measures for studying actors within a network, namely
degree17
The formal and total directors’ inter-corporate networks are expected to have some
unique characteristics that can be measured using SNA tools. First, the network ties
will be undirected and reciprocal; if director A knows director B then director B will
also know director A. This research is concerned with the structure of the relations
(structural social capital), that is who knows who, and not the quality or attributes of
the relations. Secondly the networks will be composed of many sub-groups or
clusters that represent company boards and social organisations. Those directors
who belong to multiple clusters (through their board memberships and social club
memberships) will have higher point centrality or higher connectedness in the
network. With respect to the importance of cliques (clusters), Scott claimed that:
and centrality. I have adopted degree as network measure as it best
represents network size and connectivity. It is the number of ties emanating to and
from a director (node). It is more appropriate than centrality because centrality is a
measure of the closeness between every director and every other director in the
network. The degree of each director will, therefore, measure the number of ties
directors have in the network (an integer that represents the opportunity network of
that director). I also report the network density for each network, as this is a
measure of network cohesion and is relevant when comparing the formal and total
networks.
They were second in importance only to the family in placing people in society. People are integrated into communities through ‘informal’ and ‘personal’ relations of family and clique membership, not simply through the ‘formal’ relations of the economy and political system. Any person may be a member of several different cliques, and ‘such overlapping in clique membership spreads out into a network of interrelations which integrate almost the entire population of a community in a single vast system of clique relations’.(Scott, 1991a, p. 21)
17 Also referred to as point centrality

78
Thirdly, the network of directors’ relationships will be large, which I estimate to be
700 directors based on Lawrence and Stapledon’s (1999a) study, see section 2.518
Various alternative measures can be derived to measure board opportunity networks
(BON), choice of the most appropriate measure will depend upon the research focus.
I adopt board connections which can be defined as the degree scores of all directors
(ties) serving on the same company board, this can be shown mathematically as:
.
Board connections = Director ties (degree)
Where n = number of directors on the board
Board connections best represents a board’s total connectedness through which it
can obtain access to resources and advantage. This assumes that all directors ties are
homogeneous and of equal value. This method of aggregation is likely to result in
multiple ties from directors within a board to other directors in the top-105
(corporate) directors’ network. In these situations the measure captures multiple
channels through which resources can flow, which arguably gives rise to stronger or
more beneficial relations. This is one of the central questions driving my choice of
constructs and it better represents the individual level of analysis. Ties between
directors of the same board (intra-board ties) are also captured by this measure.
These ties are directly related to board size and will be controlled for in the
regression through the board size variable, refer 4.3.4.3.
Since my hypotheses (H1 to H4) rely on four different conceptualizations of how
resources may flow (i.e. formal structural links, total structural links, formal
opportunity network, and total opportunity network), I employ four different
independent variable measures. These measures are based on the combination of the
network type (formal network or the combined formal and social network) and the
degree of separation between the actors, as shown in Figure 4-2 below. These
measures are entered into the regression model for testing.
18 Lawrence and Stapledon (1999a) collected data for the top 100 listed Australian companies in 1995. This contained 890 board seats filled by 700 directors.
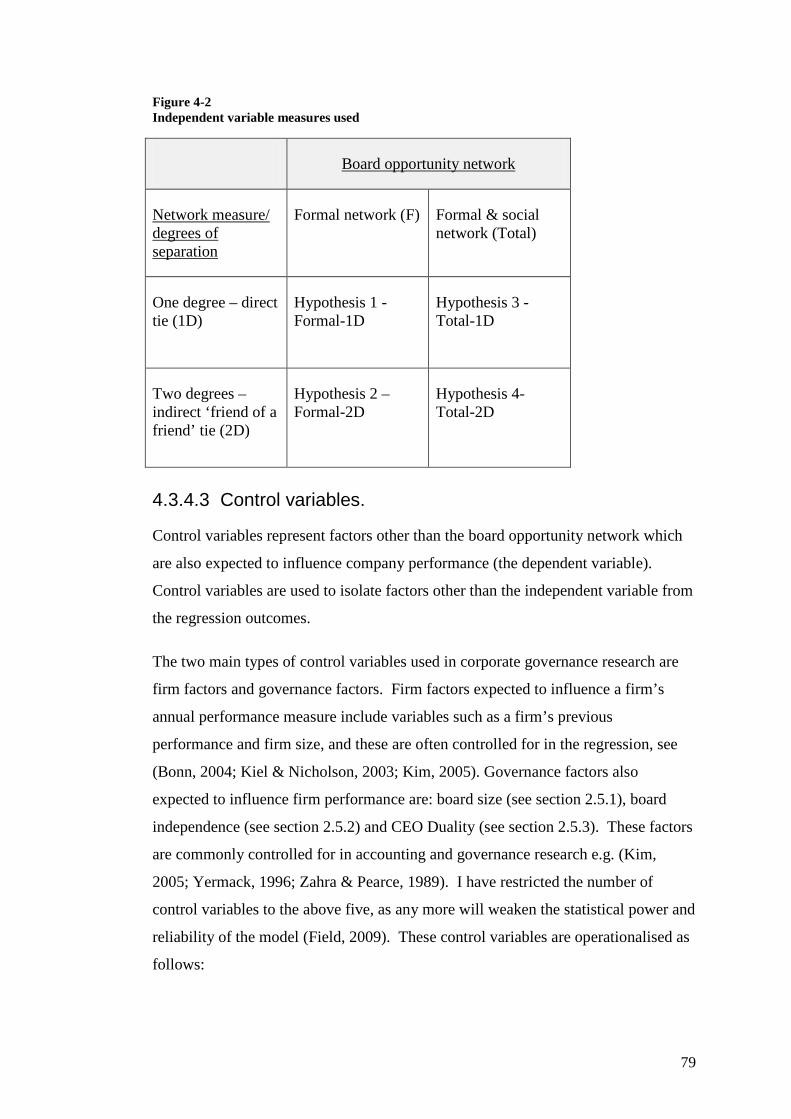
79
Figure 4-2 Independent variable measures used
Board opportunity network
Formal network (F) Network measure/ degrees of separation
Formal & social network (Total)
One degree – direct tie (1D)
Hypothesis 1 -Formal-1D
Hypothesis 3 - Total-1D
Two degrees – indirect ‘friend of a friend’ tie (2D)
Hypothesis 2 – Formal-2D Hypothesis 4-
Total-2D
4.3.4.3 Control variables.
Control variables represent factors other than the board opportunity network which
are also expected to influence company performance (the dependent variable).
Control variables are used to isolate factors other than the independent variable from
the regression outcomes.
The two main types of control variables used in corporate governance research are
firm factors and governance factors. Firm factors expected to influence a firm’s
annual performance measure include variables such as a firm’s previous
performance and firm size, and these are often controlled for in the regression, see
(Bonn, 2004; Kiel & Nicholson, 2003; Kim, 2005). Governance factors also
expected to influence firm performance are: board size (see section 2.5.1), board
independence (see section 2.5.2) and CEO Duality (see section 2.5.3). These factors
are commonly controlled for in accounting and governance research e.g. (Kim,
2005; Yermack, 1996; Zahra & Pearce, 1989). I have restricted the number of
control variables to the above five, as any more will weaken the statistical power and
reliability of the model (Field, 2009). These control variables are operationalised as
follows:
80
Previous performance. I have used the preceding year’s (1998) Return on Equity as
my measure of previous year’s company performance. This is consistent with
contemporary accounting and governance research undertaken in the U.S. and
Australia (Bonn, 2004; Pfeffer, 1972). I make no prediction as to the direction of
this relationship for the regressions, although would expect a high degree of
correlation between performance at t and t-1 in the absence of any unusual events.
Firm size. Research into boards commonly controls for firm size as it is found to be
significantly related to firm performance. Firm size measured by Total Assets
(transformed by its natural logarithm) was found to have a significant positive
association with ROA in Kim’s (2005) Korean study; however in Australia, Kiel
and Nicholson (2003) found that firm size measured by both assets and revenue
were inversely related to firm performance. I use Total Assets for 1999 which is a
common accounting measure for firm size; however make no prediction as to the
direction of the relationship.
Board size. Board size is commonly regarded as an important demographic
characteristic in governance research e.g. (Dalton et al., 1999; Zahra & Pearce,
1989). Evidence suggests that larger and more complex companies have larger
boards, but research has also produced mixed results when relating board size to
company performance (see section 2.5.1 for a summary of this research). My
measure for board size is simply operationalised as the number of members sitting
on the board. I make no predictions as to the direction of this relationship in the
regressions due to prior, contradictory research results. This variable is also critical
in the regression model as it is also used to control for the intra-board directors’ ties
which are included in the board opportunity network measure. Board size is
expected to be highly correlated with the size of the board opportunity network, as
more directors will generally result in more connections.
Board independence. Board independence is one of the most studied variables in
corporate governance research (Daily et al., 1999) and also attracts the attention of
corporate regulators and practitioners. Recommendation 2.1 of the ASX Corporate
Governance Council (2007) is that ‘a majority of the board should be independent
directors’. This is in spite of the mixed results that board independence has achieved
in recent research when related to corporate performance in both U.S and Australian
81
studies. For a summary of these results see section 2.5.2. My measure for board
independence is operationalised as the proportion of outside directors, by dividing
the number of outside directors by board size.19 Where the board is comprised
entirely of outside directors, then this ratio will be 1, which is 100%. Values are
continuous and will range from 0% (totally non-independent board) to 100% (fully
independent board). In view of the mixed results in relating board independence to
firm performance I will not be making predictions on the direction of this
relationship in the regressions.
CEO duality.
4.3.5 Data sources and data collection
This measure is concerned with the independence of board leadership
from management in the company. I have selected this as one of the control
variables as it has been one of the most used variables in research of boards and
governance as it is thought to be an indicator of management power (Huse, 2007)
(agency theorists would consider the board to be less effective monitors of
management where duality of the CEO and board chair exists and thus the boards
monitoring and control role is diminished). Empirically, its association with
performance has produced mixed results (Dalton et al., 1999), see section 2.5.3 for
further detail. I have operationalised this variable as follows. Where the
chairperson is independent from the management team (i.e. the chairperson is not
CEO) a value of “0” is assigned, otherwise where CEO duality exists the value = “1”
(as at 1999 balance date). In view of the mixed results obtained from empirical
testing relating CEO duality to firm performance, I make no prediction as to the
direction of this relationship.
4.3.5.1 Overview
In section 4.3.4 I defined the constructs that I use in this study, ensuring that they are
properly specified to measure the right concept to address the research question and
hypotheses. In this section, I collected the data in three separate phases to undertake
the analysis due. The data can be broadly classified into three types which I
collected (and processed) in three separate phases to populate the data matrix. The
19 However director independence is not always seen in such black and white terms. Outside directors may not always be independent, this can depend upon the circumstances (Collier, 2003).

82
three data types are: directors’ ties (degree) data, company financial data, and
governance data. Table 4-1 summarises the measures used, data types, the data
sources and manipulations required. Directors’ ties (degree) data were collected at
phase one, company and governance financial data at phase 2, and finally board
(governance) attribute data was collected in phase 3.
All data used in the study were collected, at first instance, from four separate
secondary (archival) sources. All data sources accessed are reliable secondary
sources which are used extensively in business and governance research. These are;
Company Published (audited) annual reports, Aspect-Huntleys (Morningstar) Fin-
Analysis data20, The Australian Graduate School of Management (AGSM) Centre
for Research in Finance (share price data), and Dunn & Bradstreet Business Who’s
Who in Australia (BWW)21
I undertook the collection of the data in three distinct phases. Collection and
processing of board opportunity network data was performed independently from the
collection of company financial data and company governance data. Board
opportunity network data was compiled from directors’ company and organisation
. I have relied in these data sources and have not
introduced further processes to ensure data reliability. The main advantage of
secondary data is that it has already been gathered and recorded by someone else,
and as such it is readily available and relatively inexpensive to obtain (Zikmund,
2003, p. 136). Zikmund (2003) identifies some common problems that can be
experienced with secondary data, such as (1) it can be outdated, (2) there may be
variation in the definition of terms, (3) different units of measurement, and (4) a lack
of information to verify the data’s accuracy. In some instances data may have to be
converted or transformed to make it useful for the analysis. For this study all data
were available for the periods tested, and standardised terms and measurements were
used to match the data definitions. As explained in section 4.3.5.2, complex data
conversions were required to generate the board opportunity network measures and
the RATSR measure (see section 4.3.5.2). Data is verifiable by comparison to
original sources, and therefore the tests are replicable.
20 Used by the Council of Australian University Librarians 21 Endorsed by the Australian Institute of Company Directors

83
memberships using data accessible through a private database22
22 Director affiliation data for 1999 was made available for this analysis by Nicholson and Alexander from previous research they had undertaken.
of directors’
associations. Whereas financial data was accessed on-line from the Aspect-Huntley
(Fin-Analysis) database, and share price information including company
distributions and beta risk coefficients were provided through the Centre for
Research in Finance, (AGSM), Share Price and Price Relatives database (SPPR).
Governance data was extracted from a private database of directors’ associations. In
the following subsections I discuss the steps and procedures undertaken to collect
the data in these three phases: company financial measures (section 4.3.5.2), board
opportunity network measures (section 4.3.5.3) and governance measures
(section4.3.5.4).
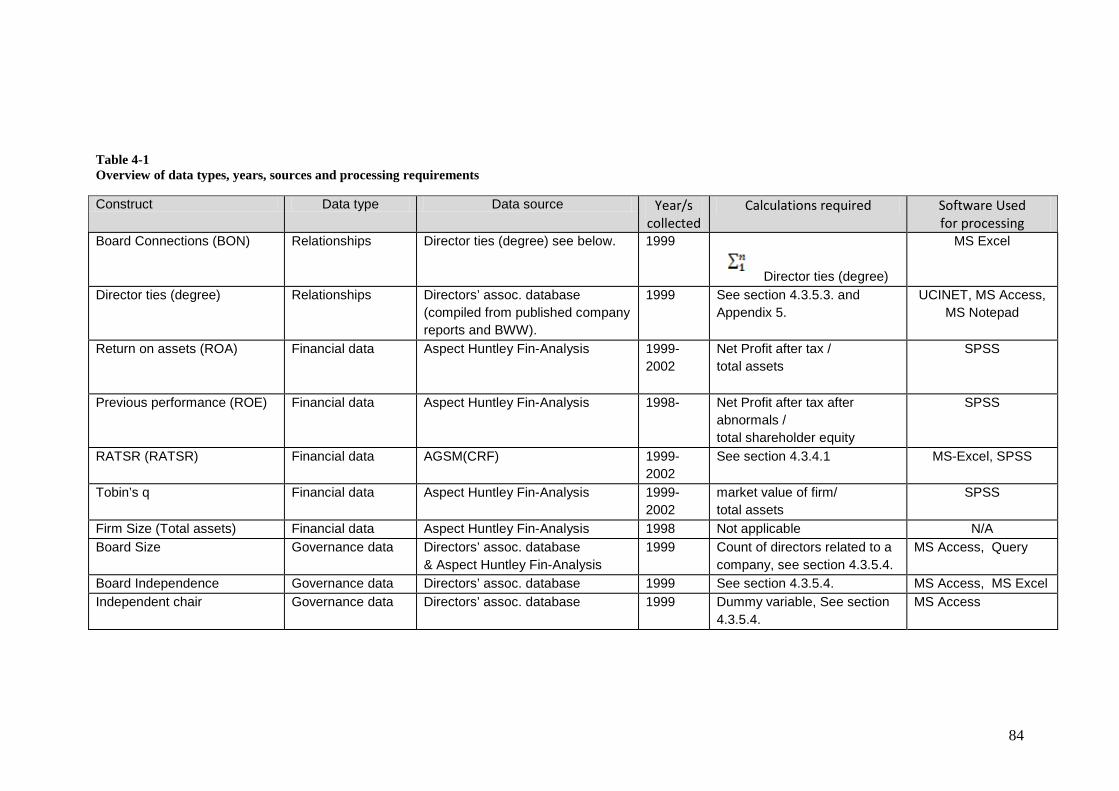
84
Table 4-1 Overview of data types, years, sources and processing requirements
Construct Data type Data source Year/s collected
Calculations required Software Used for processing
Board Connections (BON) Relationships Director ties (degree) see below. 1999
Director ties (degree)
MS Excel
Director ties (degree) Relationships Directors’ assoc. database (compiled from published company reports and BWW).
1999 See section 4.3.5.3. and Appendix 5.
UCINET, MS Access, MS Notepad
Return on assets (ROA) Financial data Aspect Huntley Fin-Analysis 1999-2002
Net Profit after tax / total assets
SPSS
Previous performance (ROE) Financial data Aspect Huntley Fin-Analysis 1998-
Net Profit after tax after abnormals / total shareholder equity
SPSS
RATSR (RATSR) Financial data AGSM(CRF) 1999-2002
See section 4.3.4.1 MS-Excel, SPSS
Tobin’s q Financial data Aspect Huntley Fin-Analysis 1999-2002
market value of firm/ total assets
SPSS
Firm Size (Total assets) Financial data Aspect Huntley Fin-Analysis 1998 Not applicable N/A Board Size Governance data Directors’ assoc. database
& Aspect Huntley Fin-Analysis 1999 Count of directors related to a
company, see section 4.3.5.4. MS Access, Query
Board Independence Governance data Directors’ assoc. database 1999 See section 4.3.5.4. MS Access, MS Excel Independent chair Governance data Directors’ assoc. database 1999 Dummy variable, See section
4.3.5.4. MS Access

85
4.3.5.2 Company financial measures
Financial data required to calculate the company performance variables and control
variables (previous performance and firm size) were collected directly from the
Aspect-Huntleys (Aspect Financial Pty. Ltd) Fin-Analysis database (see Table 4-1
for details). With the exception of the RATSR measure (see below), data elements
required to calculate these measures were initially loaded into MS-Excel and later
transferred to the data matrix. The company performance variables (see section
4.3.4.1 for the formulas for each performance measured used) and the financial (firm
factors) control variables (section 4.3.4.3) were computed within SPSS using the
data transformation function.
RATSR is a more complex measure to generate. This required collection of four
separate data elements (see section 4.3.4.1 for details) namely (1) Total Shareholder
return (2) Market Premium (3) Company Beta and (4) the Risk free rate. I discuss
their respective collection methods and transformations below:
1. Total shareholder return (TSR):
TSR data for each company has been sourced from the Prices table of the Share
Price and Price Relatives database (SPPR) (Australian Graduate School
Management Centre for Research in Finance, 2007) in a MS-Access database
format. TSR is calculated as follows:
TSRt,t1 =( (pricet1 / pricet ) * (repsharet1 / repsharet )) - 1
Where: price is the stock price taken at the start of period t and end of period t+1 and
repshare is an index value taken at the start and end of the period.
In order to calculate the TSR, both prices and RepShare values for the start and end
of the period are required to be present. Australian Graduate School Management
Centre for Research in Finance (2007, p. 21) describes ‘RepShare’ as an
abbreviation for Representative Shares Dividends and Capital Change, this
“provides the product of all Factor Divs and Cap Change values for this company up to the end of this month. It corresponds to the total number of representative shares an original share, at the start of the data set’s price series for this company,

86
would have become if all dividends and capitalization change benefits had been reinvested…”
2. Market premium
The Market Premium in Australia (and the U.S.) is approximately 6%, that is
investors expect an additional 6% return over the risk free rate for investing in the
stock market (Officer, 1989) . I applied a constant 6% market premium to calculate
the expected return.
3. Company beta:
I used historical Beta values obtained through the Centre of Research in Finance,
Australian Business School of the Australian Graduate Management School. These
are calculated quarterly (on a rolling basis) from ordinary least squares (OLS) at the
last trading day of each quarter March, June, September and December over the
previous 48 months (A.G.S.M. Centre for Research in Finance, 2007)23
4. Risk free rate:
. Beta values
generally start at zero, however it is possible to obtain negative beta values (when a
stock is truly counter-cyclical). A score of one means that the company carries the
same risk as the market, less than 1 is less risky than the market and over 1 is more
risky than the market. A negative beta score is rare (A.G.S.M. Centre for Research
in Finance, 2007), however it means that the company’s income stream runs
counter-cyclic to the market (where the market increases the company will decrease,
or vice versa). I have used the rolling beta values taken at 30 June each year in this
analysis as this represents the mid-point of each year and coincides with the majority
of the companies balance dates.
I used the 10 year government bond rate as a proxy for the risk free rate (Officer,
1989). The 10 Treasury rates are shown in Table 4-224
23 Where there are less than 20 months of data a default value of ‘1’ is assigned.
. These rates are measured
at June 30 in each year, which is the mid-point for the year and corresponds with the
majority of the top-105 companies balance dates.
24 If any Treasury bonds with a 10-year term are issued on 30 June, then the rate used is the annual yield on those bonds, otherwise if no Treasury bonds with a 10-year term are issued on 30 June, the rate is the annual yield published by the Reserve Bank of Australia for Treasury bonds with a 10-year term for 30 June.
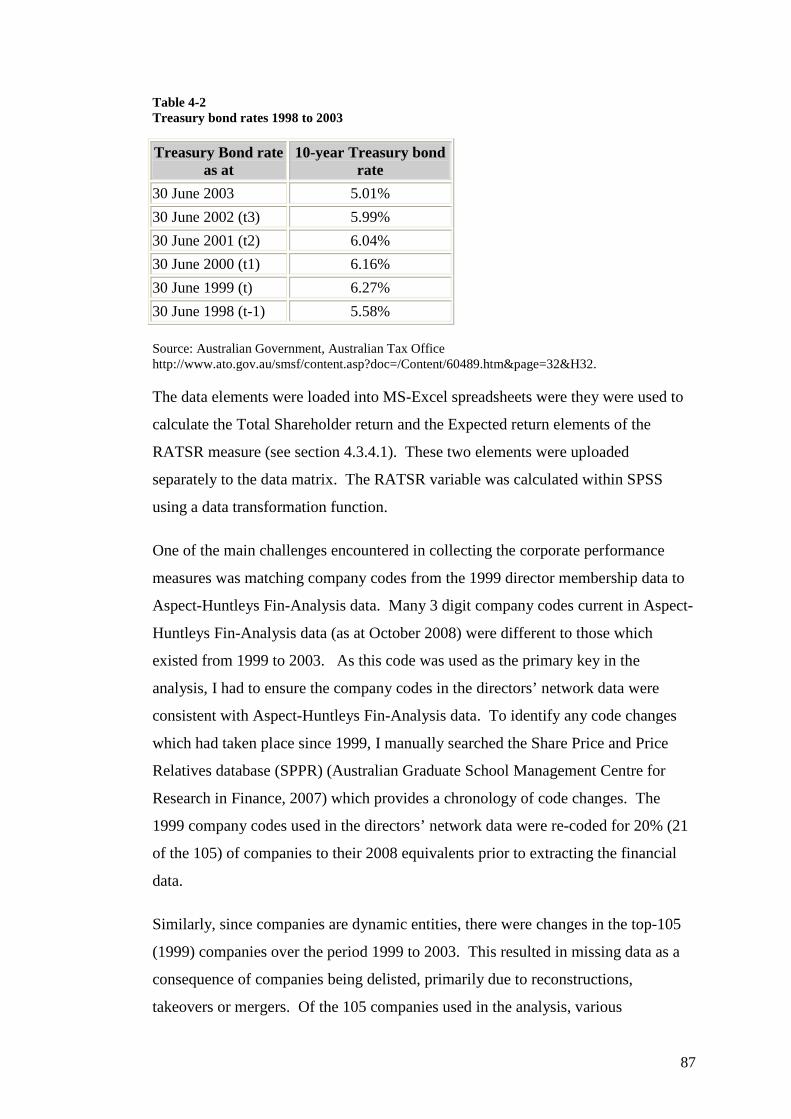
87
Table 4-2 Treasury bond rates 1998 to 2003
Treasury Bond rate as at
10-year Treasury bond rate
30 June 2003 5.01% 30 June 2002 (t3) 5.99% 30 June 2001 (t2) 6.04% 30 June 2000 (t1) 6.16% 30 June 1999 (t) 6.27% 30 June 1998 (t-1) 5.58%
Source: Australian Government, Australian Tax Office http://www.ato.gov.au/smsf/content.asp?doc=/Content/60489.htm&page=32&H32.
The data elements were loaded into MS-Excel spreadsheets were they were used to
calculate the Total Shareholder return and the Expected return elements of the
RATSR measure (see section 4.3.4.1). These two elements were uploaded
separately to the data matrix. The RATSR variable was calculated within SPSS
using a data transformation function.
One of the main challenges encountered in collecting the corporate performance
measures was matching company codes from the 1999 director membership data to
Aspect-Huntleys Fin-Analysis data. Many 3 digit company codes current in Aspect-
Huntleys Fin-Analysis data (as at October 2008) were different to those which
existed from 1999 to 2003. As this code was used as the primary key in the
analysis, I had to ensure the company codes in the directors’ network data were
consistent with Aspect-Huntleys Fin-Analysis data. To identify any code changes
which had taken place since 1999, I manually searched the Share Price and Price
Relatives database (SPPR) (Australian Graduate School Management Centre for
Research in Finance, 2007) which provides a chronology of code changes. The
1999 company codes used in the directors’ network data were re-coded for 20% (21
of the 105) of companies to their 2008 equivalents prior to extracting the financial
data.
Similarly, since companies are dynamic entities, there were changes in the top-105
(1999) companies over the period 1999 to 2003. This resulted in missing data as a
consequence of companies being delisted, primarily due to reconstructions,
takeovers or mergers. Of the 105 companies used in the analysis, various
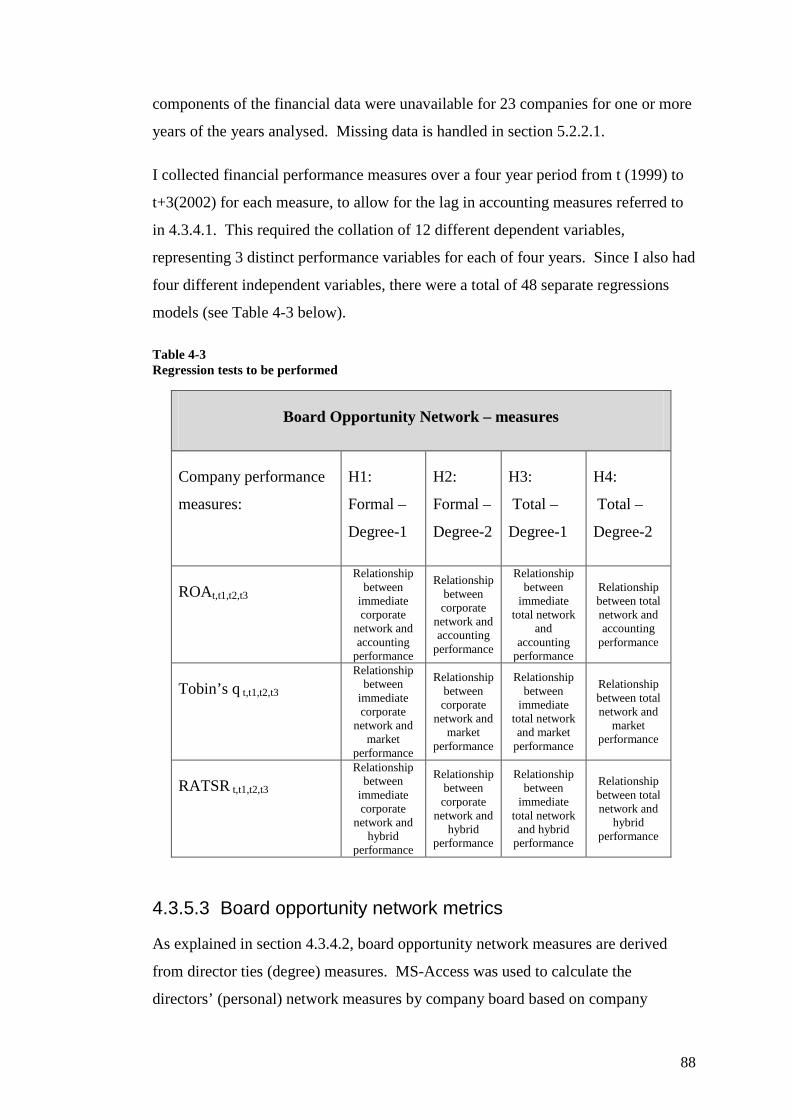
88
components of the financial data were unavailable for 23 companies for one or more
years of the years analysed. Missing data is handled in section 5.2.2.1.
I collected financial performance measures over a four year period from t (1999) to
t+3(2002) for each measure, to allow for the lag in accounting measures referred to
in 4.3.4.1. This required the collation of 12 different dependent variables,
representing 3 distinct performance variables for each of four years. Since I also had
four different independent variables, there were a total of 48 separate regressions
models (see Table 4-3 below).
Table 4-3 Regression tests to be performed
Board Opportunity Network – measures
Company performance
measures:
H1:
Formal –
Degree-1
H2:
Formal –
Degree-2
H3:
Total –
Degree-1
H4:
Total –
Degree-2
ROAt,t1,t2,t3 Relationship
between immediate corporate
network and accounting
performance
Relationship between corporate
network and accounting
performance
Relationship between
immediate total network
and accounting
performance
Relationship between total network and accounting
performance
Tobin’s q t,t1,t2,t3 Relationship
between immediate corporate
network and market
performance
Relationship between corporate
network and market
performance
Relationship between
immediate total network and market
performance
Relationship between total network and
market performance
RATSR t,t1,t2,t3 Relationship
between immediate corporate
network and hybrid
performance
Relationship between corporate
network and hybrid
performance
Relationship between
immediate total network and hybrid
performance
Relationship between total network and
hybrid performance
4.3.5.3 Board opportunity network metrics
As explained in section 4.3.4.2, board opportunity network measures are derived
from director ties (degree) measures. MS-Access was used to calculate the
directors’ (personal) network measures by company board based on company

89
relationships contained in the positions table, see Appendix 1. Grouping functions
enable data to be summarized at the board-level. Appendix 3 contains the board
connections data which is presented in descending order by size of the total network
at one degree of separation.
My research questions (outlined in section 3.4.2) requires data on two board
opportunity networks. This data is collected from two directors’ networks, the
formal inter-corporate network and the total (formal and social) network. The same
data collection methods are used for both networks and in both instances data is
collected at the individual director level.
The formal network represents the relationship between directors and the companies
(boards) on which they serve. I collected names and details of all directors in each
of the top-105 companies in 1999. As Table 4-4 indicates, there are 730 directors.
Formal network data is available through company annual reports which describe
individual director’s appointed to and serving on boards in each year, in this case
1999. In addition to the formal network relationships, the total director network
captures relations from various social memberships and other club affiliations.
These social relations have been sourced from “Who’s Who in Australia” based on
information voluntarily declared by the directors which they consider worthy of
mention in their personal profiles.
This analysis employs the director ties (degree) measure. In order to test my
hypotheses, separate network metrics were calculated both at one degree and at two
degrees of separation. Where multiple paths occur between any two directors, then
the shortest path (or geodesic distance) is chosen. It is expected that many directors
will know each other through multiple paths25
25 Arguably, the strength of the relationship will potentially be enhanced where multiple paths occur
but I do not attempt to measure path strength of relations.
. Each director’s global centrality
measure in each network was also calculated, although this was not required to
answer the research questions. Global centrality is defined and discussed in
Appendix 5.
90
The directors’ formal inter-corporate network and the directors’ total network are
based on the top-105 company connections (formal network) and the social ties of
the directors involved in the top-105 companies (total network). It is conceivable
that a director’s network will extend beyond these bounds. For example, it is
possible that two directors may be structurally connected (or indirectly connected)
through a company that is not in the top-105 listed companies or through a social
organisation which has not been declared. Potentially, this may result in some
relations not being captured in this analysis. However, the top-105 companies
represent a distinct type of company in Australia which contain the majority of
Australia’s listed capital and have significant economic power. Thus, the nature of
the top-105 inter-corporate network is arguably different to other networks. Also,
the social data is based on salient affiliations (memberships), which have been
reported by directors based on the importance they perceive in their declarations..
I performed six main steps to generate the board opportunity network data used in
this analysis, these steps are shown diagrammatically in Figure 4-3 and discussed in
detail below.
1.
Directors’ associations (for boards of the top-105 listed companies in 1999) were
compiled from publicly available external databases and company annual reports.
Databases accessed (and data retrieved) were: Connect4 (Boardroom and director
attributes), Aspect-Huntleys (Boardroom and director attributes data), and Dunn &
Bradstreet Business Who’s Who in Australia (social memberships and club
affiliations). This data was then coded and entered into three main data tables in a
Microsoft (MS) Access database. Details of the data stored in each table (attributes)
and a description of the data is shown in Appendix 1. A brief overview of these
tables is provided below.
Obtain directors’ associations data
Positions table: This table stores the primary membership data. Data records are
stored for each Director -Organisation association together with attributes to
describe the association. To facilitate the analysis; each director and each
organisation is assigned a unique numeric code for identification. Code assignment
is an important step used to reduce data processing errors.
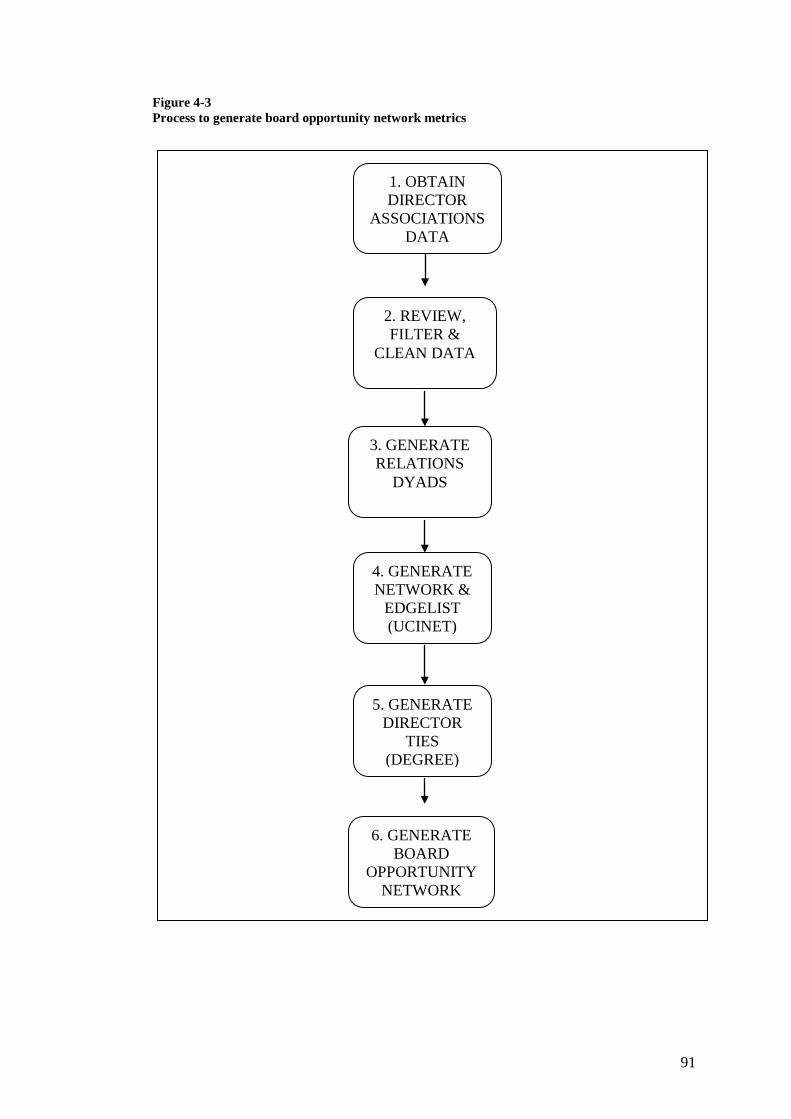
91
Figure 4-3 Process to generate board opportunity network metrics
1. OBTAIN DIRECTOR
ASSOCIATIONS DATA
2. REVIEW, FILTER &
CLEAN DATA
3. GENERATE RELATIONS
DYADS
4. GENERATE NETWORK &
EDGELIST (UCINET)
5. GENERATE DIRECTOR
TIES (DEGREE)
6. GENERATE BOARD
OPPORTUNITY NETWORK
92
Organisation / Company Master table: This table stores descriptive data for each
company or organisation associated with the directors including seven different
organisation types.
People table: This table stores directors’ personal attributes for all directors
referred to in the positions table.
2.
The ‘initial’ data investigation performed using MS Access Query language revealed
the following sizings and relationships in the data.
Review, filter and clean relationship data
There were a total of 3083 association records captured for 1999, comprising
812 company directors and company secretaries across 887 unique
organisations (for both listed companies and social organisations).
Of the 3083 associations, 1043 relate to the 105 Listed Public companies (the
formal network) and the remaining 2040 memberships account for the
declared social network. On average each director has approximately 3.8
(3083/ 812) associations, 1.3 (1043/ 812) formal inter-corporate associations
or interlocks; and 2.5 (2040/812) social memberships.
The total network is just less than twice the size (2040/ 1043) of the formal
network.
From the initial data, I removed associations that were not relevant to this study. Firstly,
83 company secretaries’ associations were eliminated as I was only interested in the
company decision makers and company secretaries are not company directors.
Secondly, 604 association memberships of ‘business serving non-profit institutions’ (i.e.
professional memberships) were eliminated from this analysis. While the rationale for
removing company secretaries is clear, the decision on professional memberships is
more complex. Professional memberships are often denoted through the use of post-
nominals or by the person indicating that are a “member, associate, or fellow”.
Professional memberships are often required as a qualification or sign of
competence for professionals seeking employment or registration26
26 For example, Australian Accounting bodies
.

93
Table 4-4 Directors network relationship data - descriptive analysis
TOTAL FORMAL
NETWORK NETWORK
Network processing counts:
Database association (position) records 2,396 960
No. Relationship dyads (including self loops) 1,552,952 9,482
No. Relationship dyads 776,109 4,376
Edgelist (all paths) - including reflexive (self loops) 538,756 532,900
Directors’ ties:
Ties at 1 degree of separation 18,112 8,346
Ties at 2 degrees of separation 151,984 35,996
Ties at 1 degree and two degrees 170,096 44,342
Total directors’ ties (all degrees) 269,011 266,085
Non-ties between directors 28,842 132,66027
Director/ Organisation relationships:
Number of directors (nodes) in network 734 730
Number Organisations in network 80428 105
Average Interlocks (associations per director) 3.3 1.3
Average Board size (No. Positions/ No. Organisations) 9.1
Network characteristics:
Average Network Geodesic distance (from UCINET) 2.793 3.765
Network cohesion (scale 0 low - 1 high) (from UCINET) 0.372 0.225
While membership of a social organisation highlights who a director knows, it is
arguable that professional associations do not actually enhance a director’s structural
social capital or opportunity network. Rather, memberships of this type of
organisation may enhance cognitive social capital by fostering a common language,
understanding, and improving communication of the members. These memberships
27 98 directors had no formal link outside of their board 28 512 director have only one association
94
can enhance the quality of relations between the directors (Nahapiet & Ghoshal,
1998), but, importantly for my study, not the opportunity networks.
Further, the inclusion of inappropriate ties not likely to affect the social capital
opportunity network can significantly change network characteristics (e.g. network
density) and markedly affect the analysis. A key concern with the professional
associations was the very high proportion of membership among the population of
730 (see Table 4-4) directors in the study. For example the four largest professional
memberships collectively had membership base of 243,000 members at June 200929
Table 4-5
(compared with 317 total directors’ associations, see ). Approximately one
in every six directors is associated with the Australian Institute of Company
Directors. If this membership were to be included in the directors’ social network it
will show a denser network and reduce the variability of network measure. The
average geodesic distance between all directors in the total network when
professional memberships are included is 2.436. This means that on average every
director can reach every other director at an average path-length of 2.436 ties, and
compares to 2.793 when these memberships are excluded (refer Table 4-4). Given
the ASCPA membership base of 122,000 members alone, there would appear little
validity in assuming a tie between directors in this type of organisation. Table 4-4
illustrates the membership levels of the professional associations on which data were
collected. For consistency, all professional membership affiliations were excluded
from the analysis.
29 Collected from their respective websites on 7 July 2009; AIDC 24,000 members, ICAA 62,000 members, ASCPA 122,000 members, AIM 35,000 members.
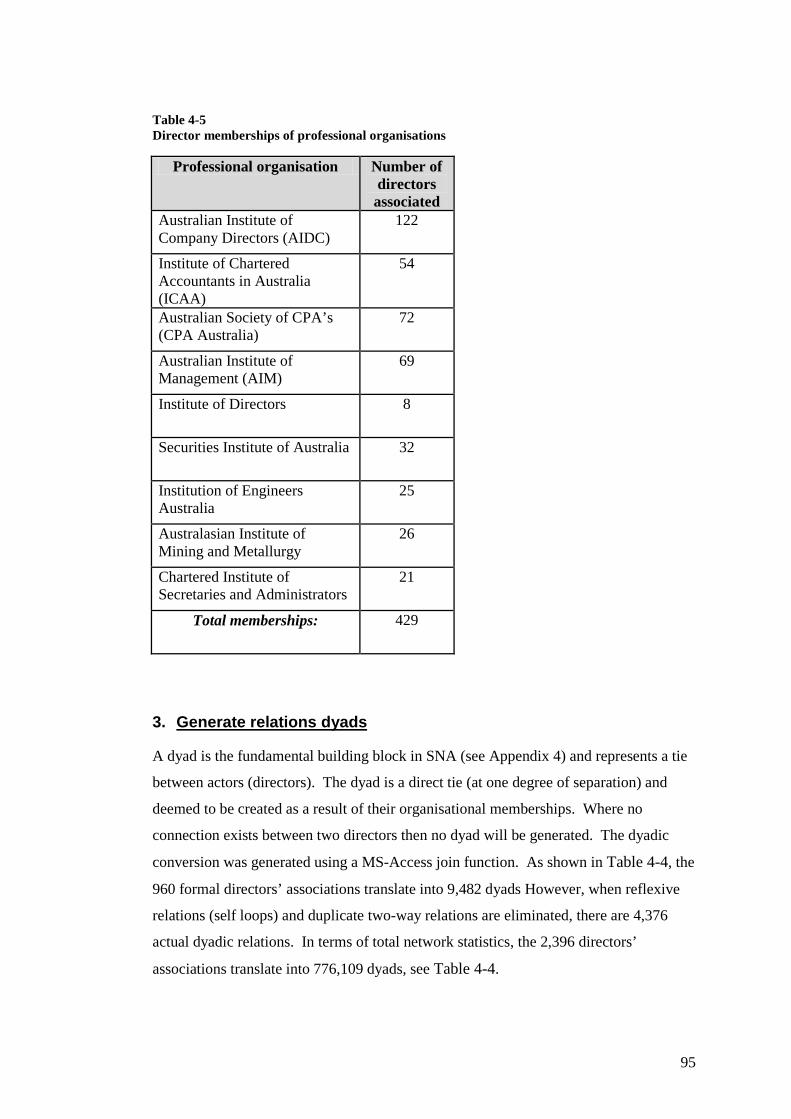
95
Table 4-5 Director memberships of professional organisations
Professional organisation Number of directors associated
Australian Institute of Company Directors (AIDC)
122
Institute of Chartered Accountants in Australia (ICAA)
54
Australian Society of CPA’s (CPA Australia)
72
Australian Institute of Management (AIM)
69
Institute of Directors 8
Securities Institute of Australia 32
Institution of Engineers Australia
25
Australasian Institute of Mining and Metallurgy
26
Chartered Institute of Secretaries and Administrators
21
Total memberships: 429
3.
A dyad is the fundamental building block in SNA (see Appendix 4) and represents a tie
between actors (directors). The dyad is a direct tie (at one degree of separation) and
deemed to be created as a result of their organisational memberships. Where no
connection exists between two directors then no dyad will be generated. The dyadic
conversion was generated using a MS-Access join function. As shown in Table 4-4, the
960 formal directors’ associations translate into 9,482 dyads However, when reflexive
relations (self loops) and duplicate two-way relations are eliminated, there are 4,376
actual dyadic relations. In terms of total network statistics, the 2,396 directors’
associations translate into 776,109 dyads, see Table 4-4.
Generate relations dyads
96
4.
The UCINET program was developed by the University of California to assist in
understanding and analysing networks and produce important network metrics.
UCINET reads in a file of dyadic relations, and analyses these to determine geodesic
distances between all actors. The geodesic distance represents the shortest path-
length between actors and is displayed as an Edgelist. Where there are multiple
paths between the actors, UCINET will select the shortest path (geodesic distance).
An edgelist can be visualized as a matrix of potential relations between actors, in
this case company directors. The network of top-105 companies boards in 1999
comprised of 730 individual directors who hold 960 board positions. If every
director was connected (either directly or indirectly) with every other director, the
total potential ties would be 266,085, this is calculated as follows:
Generate network and edge-list with UCINET.
(Number directors * Number directors -1 )/ 2 30
There are substantial differences between the total and formal networks. As shown
in Table 4-4 there are a significant number on directors who are not connected to the
network. Of the 266,085 potential ties available approximately 50% of directors
(132,660) were unconnected (at any degree) in the formal network. This means that
around half of all directors on a top-105 board only hold a position on a single
board. However, the number of directors not connected in the total network reduces
to approximately 11% (28,842/266085) of directors. The inclusion of social ties
makes a significant difference to the network. Further inspection of the UCINET
calculations highlighted that 98 directors from 14 company boards had no formal
ties outside of their own boards, that is 14 of 105 (13.3%) companies they had no
interlocks.
The edge-list was output as a data file31
30 The total number of director-director ties are halved to eliminate reciprocal ties
of undirected ties between the directors.
This file contained 266,085 records for both the formal and the total (i.e. formal and
social) networks. In those instances where there is no connection between two
directors, that is where no geodesic value exists, UCINET denotes this with a ‘?’.
31 The data file comprises three fields; the ‘from’ director, the ‘to’ director, and the geodesic.
97
The network summary metrics produced from UCINET are shown in Table 4-4. It
is interesting to note the network differences between the formal and the total
(formal and social) network. In the total network there were 170,096 ties at degrees
1 and 2, compared to 44,342 in the formal network, i.e. the total network is more
than 3.85 times more connected than the formal network. This connectivity means
that average geodesic distance is more than 25% shorter in the total network (2.793
in the total network compared to 3.765 in the formal network) and the total network
is substantially more cohesive (0.372 compared to 0.225). Overall the networks are
significantly different with respect to their closeness and cohesion as would be
expected given the significantly greater number of memberships in the total network.
Another notable characteristic of the social (non formal) network is that 73% of social
organisations have only one director-association declared. Of the 699 social
organisations (calculated as 804 total organisations minus the105 listed companies)
included in the analysis, 512 have only one director-association (membership) declared.
5.
Data files for each network (the formal network and the total network) comprising
directors’ connectivity geodesics were generated from UCINET and imported as
tables into MS Access for further transformation. These files show for each director
how many degrees of separation they are from every other director in the network.
As discussed in section 4.3.2, I was only interested in ties at Degree-1 and Degree-2
and any ties beyond Degree-2 were dropped from the analysis. I then ran two passes
(processing steps) on each file; the first pass totalled the number of director’s
connections (to other directors) at Degree-1 and Degree-2, whereas the second pass
totalled director’s connections at Degree-1 only. These counts then represent the
total number of ties that each director has at one degree and at one and two degrees
of separation to other directors in the network. The higher the connectivity score,
then the greater is the opportunity network measure for that director. The directors’
connectivity scores are then used to calculate the boards’ connectivity measures.
Generate directors’ degree metrics
6.
Director’s degree scores are summed for each director sitting on a company board to
produce the Board Opportunity Network measures (section
Generate board opportunity network metrics
4.3.4.2.) Using MS-

98
Access, I aggregated director’s degree scores to the board-level using a link to the
Director-associations data base (Positions table), see Appendix 1. Four separate
measures are calculated for each company board, these are the Formal Network at
Degree-1 and at Degree-2 and the Total Network at Degree-1 and at Degree-2.
These measures are loaded into the data matrix to be used in the regression analyses.
4.3.5.4 Governance measures
Data to derive the corporate governance variables for (1) board independence (2)
board size and (3) CEO duality were sourced and from the Director-associations
database (see Appendix 1). Data tables were interrogated using the MS Access
Structured Query Language (SQL), as follows:
Board size. The number of company to director-associations in the Positions table
were grouped by company (organisation type) and counted. This represents the total
number of directors on that company board in 1999. These counts were then
matched with the board size data extracted from Aspect Huntley’s Fin-Analysis
database search for that year. This matching or triangulation serves to enhance the
reliability of the data (Cavana et al., 2001). The board size measure was then
transferred to a MS Excel spreadsheet for upload to the data matrix.
Board independence. The Positions table stores the attributes; Title Description and
Classification. These were used to determine director’s independence, refer
Appendix 1. Outside directors were determined based on their classification; the
class groupings of non-executive director and chairman (non-executive) were
deemed to be outside directors. The number of outside directors is divided by the
board size (see above) to produce the board independence variable. This
computation was performed using MS Excel and the results uploaded to the data
matrix.
CEO duality. Using the Positions Table (see Appendix 1), I examined the Title
Description attribute of “Chairman” and the Classification codes of “Chairman
(executive)” or “Chairman (non-executive)”. A dummy variable was created due to
the presence of non-parametric data. Binary coding (Hair et al., 1998) was used due
for the requirement for only two categories. This variable was hand-coded given the
small amount of data (105 companies) involved, where the Chairperson was
99
independent of management (did not hold an executive position) the variable was
coded as ‘0’. Otherwise where duality of the CEO and board chair existed the
variable was coded ‘1’. The CEO duality measures were then transferred to a MS
Excel spreadsheet for upload to the data matrix.
This now completes the collection of all data required to undertake the analysis.
Transformation or computation of some variables was still required to be completed
in SPSS before data analysis can be commenced. And this is discussed in section
4.3.6.
4.3.6 Data matrix preparation and upload MS-Excel was used to compile the data matrix for uploading into SPSS. Simple
arithmetic data transformations are undertaken in SPSS, however for more complex
calculations I used MS-Excel as this has more powerful data manipulation functions.
The governance control variables and complex variables calculated using MS-Excel
are board size, board independence, Board Opportunity Network variables, and the
RATSR elements of Total Shareholder Return and Expected Return. During this
data transformation process I was careful to verify formulas and audited data
calculations and transformations.
The data matrix was uploaded into SPSS (version 16) for statistical analysis. SPSS
is a sophisticated piece of software used by social scientists and related professionals
(Coakes, Steed, & Price, 2008) . It is regarded by researchers as a single, highly
flexible program suitable for multiple regression (Tabachnick & Fidell, 2001). After
uploading the data matrix into SPSS, the variables ROA, RATSR, Tobin’s q, ROE-
1998, and Total Assets 1998 were computed using the data transformation function
in SPSS.
4.4 Conclusion I commenced this Chapter by outlining my positivist research philosophy and then
describing the approach and method I have taken to resolving the research question.
The predominant method used in this study is multiple regression. I then proceeded
to define the constructs required for the regression model and how I measure them.

100
Finally, I collected available data to satisfy these measures from a variety of sources
and uploaded this into a data matrix ready for analysis.
In Chapter 5, I undertake the analysis of the data. This is essentially a three part
process in which I (1) review the data and correct any errors discovered, (2)
understand and describe the data and (3) perform inferential statistics on the data.
Finally, in light of the results achieved, I make findings for or against the six
hypotheses which were developed in Chapter 3 (section 3.5).
101
Chapter 5 Analysis and findings
5.1 Introduction In Chapter 4, I developed my research design and method and collected the data
required to undertake the analysis. I also initially screened and generated the board
network data required for the analysis (see section 4.5.5.3).
In this chapter I present how the data were analysed to answer the research question.
I have adopted the quantitative data analysis approach recommended by Zikmund
(2003). This is a multi-part process consisting of three main steps (1) Reviewing the
data and correcting any errors in the data (2) Understanding and describing the data
and (3) Performing inferential statistics (correlations and regressions) on the data in
order to answer the research question.
The order in which these steps are undertaken is important in the analysis. As
described in section 4.3.2, I use multi-variate regression to analyse relationships
among the two or more variables in the data set (i.e. measures of the board
opportunity networks and firm performance). An understanding of the data,
particularly how it is distributed, is essential before multi-variate regression is
performed. This is because the reliability of multiple regression analysis is premised
on a number of assumptions which must be met to ensure its analytic validity.
5.2 Data screening and descriptive statistics Data screening or cleansing is recommended prior to undertaking the main analysis
to ensure the reliability of the results (Tabachnick & Fidell, 2001). Routine pre-
analysis screening procedures are used to assess normality, linearity and
homoscedasticity of the data. This can also be assessed through examination of
residuals produced from the regression programs (Tabachnick & Fidell, 2001). To
ensure assumptions of the analysis are met, residuals (differences between actual and
predicted DV scores) should have a straight line relationship with predicted DV
scores, be normally distributed around predicted DV scores, and the variance of the
residuals about predicted DV scores should be similar for all predicted scores.
102
These assumptions can be tested by reviewing residual scatterplots produced post
regression from the statistical program.
In my analysis I performed both pre-analysis screening procedures and post-
regression procedures where I was concerned that pre-analysis procedures identified
a potential lack of normality in the data distribution.
5.2.1 Pre-analysis screening
There are four main issues to consider in performing the pre-analysis screening: (1)
data accuracy, (2) missing data, (3) how the data is distributed, and (4) outliers in the
data.
First, data accuracy is concerned with ensuring the data on which the analysis is
based is accurate and reliable. As discussed in section 4.3.5.1 data has been
extracted from recognised and reliable public sources, and I considered that it was
reliable without the need to undertake further integrity or data auditing procedures.
Any potential data errors which could occur in data conversion (particularly using
MS-Excel) and may have escaped detection through auditing data calculations (see
section 4.3.6) would be identified as outliers (see below) and corrected.
Second, missing data occurs when some case (company) values have been omitted
from the data matrix. Potentially, missing data can bias the results of the analysis
depending upon how it is distributed. Random missing values are less serious than
non random patterns in the missing data as the latter are an indicator of potential bias
(Tabachnick & Fidell, 2001). For relatively small data sets (as in this study of 105
companies), missing data (and any significantly unusual values) can be identified by
proof reading the data in the data window of SPSS, an approach highly
recommended (Coakes et al., 2008). Missing data can also be identified from the
descriptive statistics and frequency distribution reports produced from SPSS. For
any variable, any instances where the ‘n statistic’ is less than the number of items in
the sample (or population) this represents missing data. Any missing data
identified, which cannot be collected for the analysis, should be coded (declared) as
such in SPSS to ensure these are flagged as missing cases and dropped from the
analysis. I coded any missing data as ‘99999’ in the SPSS statistical package. As

103
discussed in section 4.3.5.2 missing values in the company performance measures
are a concern which I address in section 5.2.3.1.
Third, how the data is distributed is important when regression analysis is used to
make statistical inferences from the data. An assumption of multivariate normality
is central to regression analysis (i.e. that the values for each variable are normally
distributed and any residuals in the analysis are randomly distributed). Data were
analysed using standard descriptive statistics and frequency distributions generated
as reports from SPSS. As discussed above where normality tests appeared to be
doubtful, I ran and analysed post-hoc regression scatterplots of residuals. I followed
the screening procedures recommended by Coakes et al.(2008, pp. 30-36).
Data normality was initially assessed by reviewing the following descriptive
statistics set out in table 5.2. I also generated histograms, normal probability plots
and detrended normal probability plots and reviewed them. These enable a pictorial
assessment of the data distribution and provide a good visual feel for the data.
Where the data distribution for any variable does not resemble a normal distribution,
transformation techniques may be applied to improve their normality (Tabachnick &
Fidell, 2001, p. 72) to better meet the assumptions of multiple regression.
Transformations also assist in modelling more complex linear relationships (e.g. log
relationships, etc). However, I transformed data only as a last resort where I was
satisfied the data did not meet the assumptions of regression analysis. Transformed
variables become indirect variables and are generally more difficult to interpret.
Consequently, prior to undertaking transformations I reviewed post-regression
residual scatter-plots to ensure the raw data was acceptable to use in the analysis.
Finally, outliers represent extreme values in the data and can distort the results of the
statistical analysis. Outliers may relate to either single variable (univariate outliers)
or to two or more variables (in the case) which give an unusual combination
(multivariate outliers). Outliers can be readily identified when reviewing the data
distribution (above), particularly through use of the graphical tools (i.e. histograms
and the normal probability plot). Outliers identified were investigated and either
corrected, adjusted or removed from the analysis. In this research I am reticent to
remove or adjust outliers, unless they are shown to distort the analysis. Outliers
104
represent more extreme values in the data which can be beneficial to the analysis32
In the next two sections (sections 5.2.2and 5.2.3) I discuss the results of data
screening of the board network data and of the company performance and control
data. I have reported the board network data (independent variables) separately
from the company performance and control data (dependent variables and control
variables) due to the different characteristics of these data types.
when explaining the phenomena under review, i.e. board opportunity networks and
company performance.
5.2.2 Screening board network (IV) data There were no missing board network data in the top-105 company cases. However,
proof reading of the four independent variables in the data matrix highlighted that 13
(of the 105) companies had no differences in the connectivity of their formal
networks at one degree or at two degrees of separation, see Table 5-1. This means
that these companies had no interlocks (their boards were not connected with any of
the other top-105 companies). Also, within this group of isolated company boards,
three companies showed no differences between their formal and social network
data. This means that no common social organisation memberships were declared
by these boards’ directors. Directors had either nothing to declare or chose not to
declare, or the data may have been incomplete. The companies concerned are:
• AMP Shopping Centre Trust
• Mobile Communications Holdings Limited
• Schroders Property Fund
The results of the descriptive analysis and normalised distributions are shown in
Table 5-2. Values are within expected bounds and consistent with the social
network analysis metrics generated through UCINET. There are 105 company
boards in the analysis that have between 4 and 17 directors with a mean of 9.1
directors on each board. The mean opportunity network score per director at 1
degree of separation is 13.7. This means that, on average, a director of a top-105
company has 13.7 formal direct contacts with other board members. The average 32 As company director networks are considered small world networks that have few big linkers.
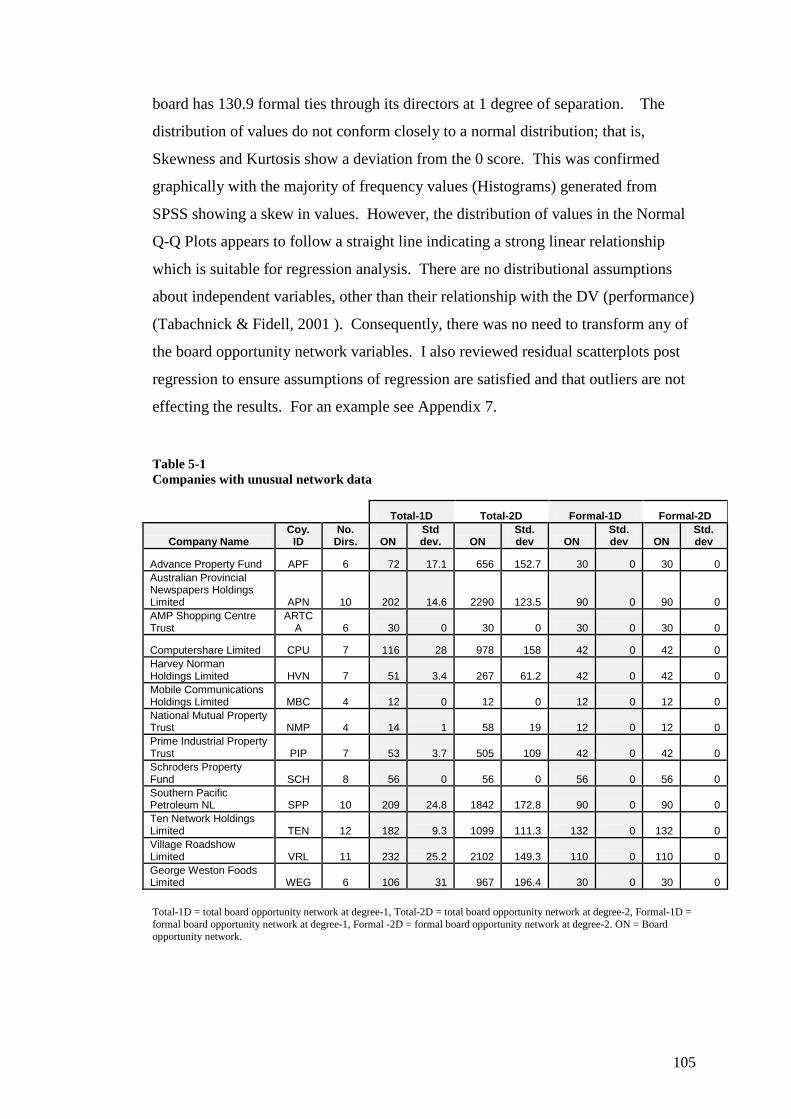
105
board has 130.9 formal ties through its directors at 1 degree of separation. The
distribution of values do not conform closely to a normal distribution; that is,
Skewness and Kurtosis show a deviation from the 0 score. This was confirmed
graphically with the majority of frequency values (Histograms) generated from
SPSS showing a skew in values. However, the distribution of values in the Normal
Q-Q Plots appears to follow a straight line indicating a strong linear relationship
which is suitable for regression analysis. There are no distributional assumptions
about independent variables, other than their relationship with the DV (performance)
(Tabachnick & Fidell, 2001 ). Consequently, there was no need to transform any of
the board opportunity network variables. I also reviewed residual scatterplots post
regression to ensure assumptions of regression are satisfied and that outliers are not
effecting the results. For an example see Appendix 7.
Table 5-1 Companies with unusual network data
Total-1D Total-2D Formal-1D Formal-2D
Company Name Coy.
ID No.
Dirs. ON Std dev. ON
Std. dev ON
Std. dev ON
Std. dev
Advance Property Fund APF 6 72 17.1 656 152.7 30 0 30 0 Australian Provincial Newspapers Holdings Limited APN 10 202 14.6 2290 123.5 90 0 90 0 AMP Shopping Centre Trust
ARTCA 6 30 0 30 0 30 0 30 0
Computershare Limited CPU 7 116 28 978 158 42 0 42 0 Harvey Norman Holdings Limited HVN 7 51 3.4 267 61.2 42 0 42 0 Mobile Communications Holdings Limited MBC 4 12 0 12 0 12 0 12 0 National Mutual Property Trust NMP 4 14 1 58 19 12 0 12 0 Prime Industrial Property Trust PIP 7 53 3.7 505 109 42 0 42 0 Schroders Property Fund SCH 8 56 0 56 0 56 0 56 0 Southern Pacific Petroleum NL SPP 10 209 24.8 1842 172.8 90 0 90 0 Ten Network Holdings Limited TEN 12 182 9.3 1099 111.3 132 0 132 0 Village Roadshow Limited VRL 11 232 25.2 2102 149.3 110 0 110 0 George Weston Foods Limited WEG 6 106 31 967 196.4 30 0 30 0
Total-1D = total board opportunity network at degree-1, Total-2D = total board opportunity network at degree-2, Formal-1D = formal board opportunity network at degree-1, Formal -2D = formal board opportunity network at degree-2. ON = Board opportunity network.
106
5.2.3 Screening performance and control data
5.2.3.1 Missing data Some of the companies selected at 1999 later went out of business, resulting in
missing performance data in subsequent years. Company financial performance data
for the top-105 listed companies was collected for the base year 1999 and the
following three years 2000 to 2002 to allow for tests on lagged performance. Over
this period (as anticipated) some companies had been taken-over, ceased to exist, or
undergone changes to their organisational and legal structures. Consequently some
of the data components required to calculate the dependent variables (ROA, Tobin’s
q, and RATSRs) did not exist, particularly in the later years. Missing data is one of
the most pervasive problems in data analysis and its seriousness depends on the
extent of data missing, whether there are any patterns to the missing data and why it
is missing (Tabachnick & Fidell, 2001). Missing data relates only to dependent
variables; the control variables and independent variables for board network data are
fully populated. However, specifically coding these as missing variables within
SPSS ensures that these cases are dropped from the analysis. Missing data cases by
dependent variable and year are summarised in Table 5-3 below.
With the exception of one case in 2002; ROA and Tobin’s q all had the same
company attrition rate over the period. However, the RATSR variable contained
more missing cases than the other dependent variable measures. This is primarily
because RATSR is comprised of more components33
33 The RATSR measure is calculated using relative price indices, share prices, and beta values (refer
4.3.4.1).
, and if any components were
missing the entire variable was compromised (and deemed missing). There appear to
be no patterns to the missing data, which cannot be explained by the normal cycle of
company acquisition and reorganization. Missing data for 1999 and 2000 is around
5% and should not have serious consequences in the analysis (Tabachnick & Fidell,
2001). The higher frequencies of missing data in 2001 and 2002 are expected to
slightly reduce the statistical power of the regressions in these years.
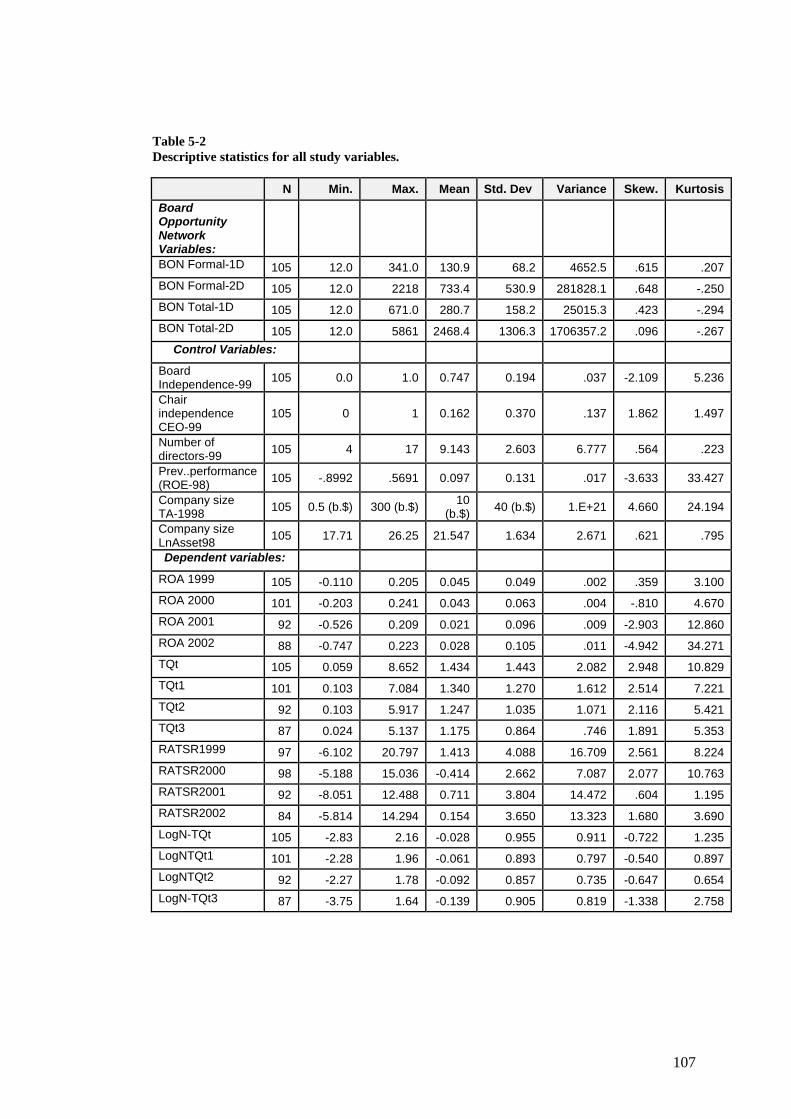
107
Table 5-2 Descriptive statistics for all study variables.
N Min. Max. Mean Std. Dev Variance Skew. Kurtosis Board Opportunity Network Variables:
BON Formal-1D 105 12.0 341.0 130.9 68.2 4652.5 .615 .207 BON Formal-2D 105 12.0 2218 733.4 530.9 281828.1 .648 -.250 BON Total-1D 105 12.0 671.0 280.7 158.2 25015.3 .423 -.294 BON Total-2D 105 12.0 5861 2468.4 1306.3 1706357.2 .096 -.267
Control Variables: Board Independence-99 105 0.0 1.0 0.747 0.194 .037 -2.109 5.236
Chair independence CEO-99
105 0 1 0.162 0.370 .137 1.862 1.497
Number of directors-99 105 4 17 9.143 2.603 6.777 .564 .223
Prev..performance (ROE-98) 105 -.8992 .5691 0.097 0.131 .017 -3.633 33.427
Company size TA-1998 105 0.5 (b.$) 300 (b.$) 10
(b.$) 40 (b.$) 1.E+21 4.660 24.194
Company size LnAsset98 105 17.71 26.25 21.547 1.634 2.671 .621 .795
Dependent variables: ROA 1999 105 -0.110 0.205 0.045 0.049 .002 .359 3.100 ROA 2000 101 -0.203 0.241 0.043 0.063 .004 -.810 4.670 ROA 2001 92 -0.526 0.209 0.021 0.096 .009 -2.903 12.860 ROA 2002 88 -0.747 0.223 0.028 0.105 .011 -4.942 34.271 TQt 105 0.059 8.652 1.434 1.443 2.082 2.948 10.829 TQt1 101 0.103 7.084 1.340 1.270 1.612 2.514 7.221 TQt2 92 0.103 5.917 1.247 1.035 1.071 2.116 5.421 TQt3 87 0.024 5.137 1.175 0.864 .746 1.891 5.353 RATSR1999 97 -6.102 20.797 1.413 4.088 16.709 2.561 8.224 RATSR2000 98 -5.188 15.036 -0.414 2.662 7.087 2.077 10.763 RATSR2001 92 -8.051 12.488 0.711 3.804 14.472 .604 1.195 RATSR2002 84 -5.814 14.294 0.154 3.650 13.323 1.680 3.690 LogN-TQt 105 -2.83 2.16 -0.028 0.955 0.911 -0.722 1.235 LogNTQt1 101 -2.28 1.96 -0.061 0.893 0.797 -0.540 0.897 LogNTQt2 92 -2.27 1.78 -0.092 0.857 0.735 -0.647 0.654 LogN-TQt3 87 -3.75 1.64 -0.139 0.905 0.819 -1.338 2.758

108
Table 5-3 Missing data summary – company financial performance variables
1999 2000 2001 2002
No.
cases %
found No.
cases %
found No.
cases %
found No.
cases %
found Return on Assets (ROA) 105 100 101 96 92 88 88 84 Tobin’s q (TobQ) 105 100 101 96 92 88 87 83 RATSR 97 92 98 93 92 88 84 80 Total cases 105 100
5.2.3.2 Descriptive analysis:
In this section I report on the descriptive analysis of the company performance and
control data (board opportunity network (IV) data were covered in section 5.2.2).
With the exception of Tobin’s q (which is expected to always produce a positive
ratio assuming that the market value of equity and asset replacement cost will be
positive values) the performance variables data contains an expected range of
positive and negative values. However, the distribution of values does not follow a
normal distribution and many variables show a high degree of skew and kurtosis.
These distributions can be partially attributed to the presence of outliers in the data
that cause the tail of the distribution to be stretched (skew) and also results in a
compression of the scale and therefore heightening the distribution peak (kurtosis).
ROA’s values for years 1999 to 2002 generally follow a normal probability plot with
values scattered evenly around the diagonal trend line, although some outliers have
skewed the results. RATSRs represent the difference between a company’s total
shareholder return and its expected (risk adjusted) return. These returns are
expected to be evenly distributed around 0 and this was generally the case (shown
graphically by the histograms) although a few higher value outliers caused a skew in
the distribution. RATSRs values follow the normal probability plot straight line and
therefore show a linear relationship. Tobin’s q showed a greater positive skew than
the other dependent variables and positive kurtosis. Normal probability graphs for
Tobin’s q values did not fit a strong linear relationship across all time periods 1999
to 2002 with all graphs showed a consistent non-linear pattern.
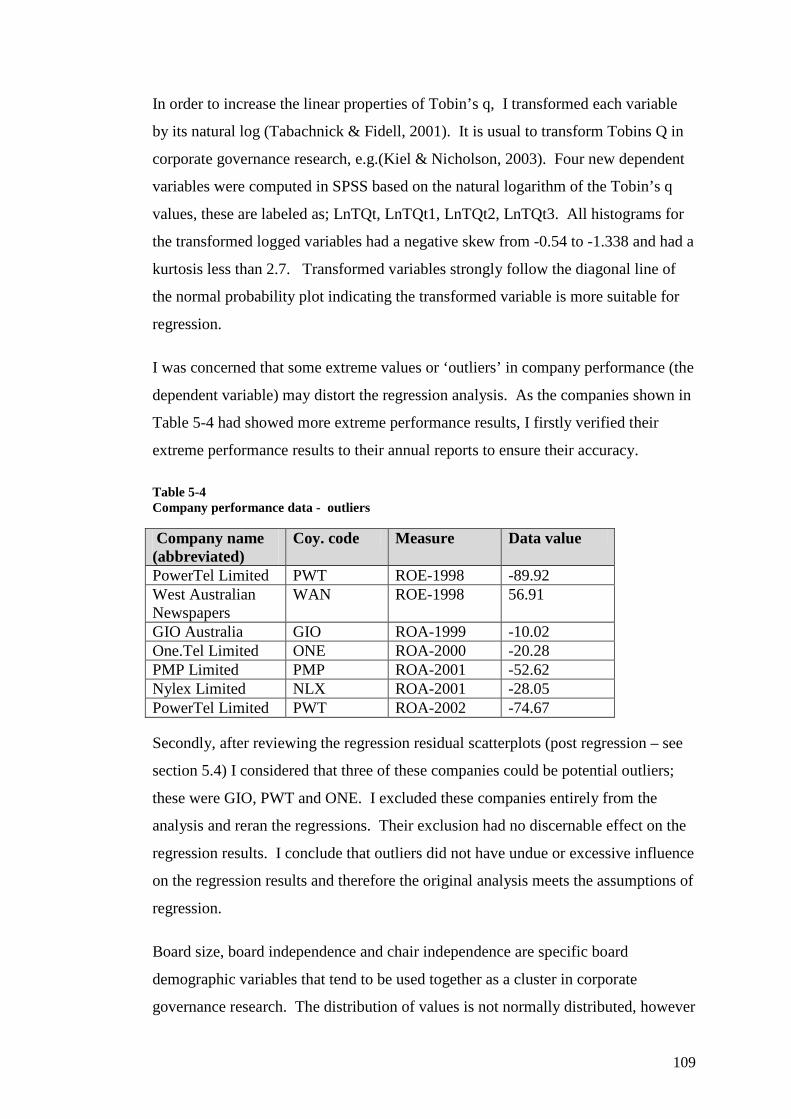
109
In order to increase the linear properties of Tobin’s q, I transformed each variable
by its natural log (Tabachnick & Fidell, 2001). It is usual to transform Tobins Q in
corporate governance research, e.g.(Kiel & Nicholson, 2003). Four new dependent
variables were computed in SPSS based on the natural logarithm of the Tobin’s q
values, these are labeled as; LnTQt, LnTQt1, LnTQt2, LnTQt3. All histograms for
the transformed logged variables had a negative skew from -0.54 to -1.338 and had a
kurtosis less than 2.7. Transformed variables strongly follow the diagonal line of
the normal probability plot indicating the transformed variable is more suitable for
regression.
I was concerned that some extreme values or ‘outliers’ in company performance (the
dependent variable) may distort the regression analysis. As the companies shown in
Table 5-4 had showed more extreme performance results, I firstly verified their
extreme performance results to their annual reports to ensure their accuracy.
Table 5-4 Company performance data - outliers
Company name (abbreviated)
Coy. code Measure Data value
PowerTel Limited PWT ROE-1998 -89.92 West Australian Newspapers
WAN ROE-1998 56.91
GIO Australia GIO ROA-1999 -10.02 One.Tel Limited ONE ROA-2000 -20.28 PMP Limited PMP ROA-2001 -52.62 Nylex Limited NLX ROA-2001 -28.05 PowerTel Limited PWT ROA-2002 -74.67
Secondly, after reviewing the regression residual scatterplots (post regression – see
section 5.4) I considered that three of these companies could be potential outliers;
these were GIO, PWT and ONE. I excluded these companies entirely from the
analysis and reran the regressions. Their exclusion had no discernable effect on the
regression results. I conclude that outliers did not have undue or excessive influence
on the regression results and therefore the original analysis meets the assumptions of
regression.
Board size, board independence and chair independence are specific board
demographic variables that tend to be used together as a cluster in corporate
governance research. The distribution of values is not normally distributed, however
110
outliers are not extreme. There are no distributional assumptions required for
independent variables, other than their relationship with the DV (performance)
(Tabachnick & Fidell, 2001), I have not transformed these variables as they
represent key governance attributes of the top-105 population and are desirable to
process in their raw forms. Board size (number of directors) is a discrete variable
which ranges from 4 to 17 across Australia’s top-105 companies. The distribution
histogram resembles a normal distribution shaped with a small positive skew and the
values in the normal probability plot are distributed around the diagonal line. Board
independence is operationalised as a continuous variable used to measure the
percentage of outside directors within the board. Values range from 0 to 1. As the
majority of top-105 company boards contain a majority of outside directors, the
distribution shows a significant negative skew in the values and a positive kurtosis,
as would be expected for major listed companies. The mean score is 0.747 and
values show some deviation from a normal linear plot. Chair independence is
operationalised as a dichotomous variable with values of only 0 and 1. Of the 105
values entered, 88 Chairs were not acting in the capacity of CEO (represented by the
value 0). Although values are not normally distributed they represent a valid
attribute of the population and the data has not been adjusted or transformed. To
alleviate any concerns with the distribution of the data for these variables, post-
regression residual scatter plots were run and reviewed to ensure that the regression
assumptions were satisfied.
There is a significant variation in the company size variable (Total Assets-98) values
across the 105 companies in the population measured by their market capitalizations.
The distribution of values shows a significant positive skew and kurtosis which
indicates the population is not normally distributed. The normal probability plot
highlighted that the distribution of values were non-linear. This variable was
transformed by the natural logarithm (Ln.) to yield a more normal distribution. It is
common practice in governance research to transform Total Assets by its natural
logarithm (Kiel & Nicholson, 2003; Kim, 2005). The transformed variable
Ln.Assets98 has a skewness and kurtosis of less than 0.8 and the values appear to
show a strong linear relationship evidenced from the normal plot of expected to
observed values.
111
Return on assets (98) is generally a symmetric distribution around the mean value of
0.097 (9.7%). A negative skew is caused by one company (SPSS case 77 -
PowerTel Limited which had a value of -89.92 (refer table 5-4), and as discussed
earlier in this section removal of this outlier had no excessive influence on the
regression results. All other values fall close to the linear normal plot and are
acceptable to undertake the regression analysis.
5.3 Correlations Correlations are statistical analyses performed of the relationships between two
variables in a linear fashion, also referred to as simple or univariate regressions.
They analyse the association between two variables, that is how these two variables
move together (Coakes et al., 2008). Normal practice is to correlate the variables
used in hypothesis testing (or other key variables) with each other. Where there is a
high correlation between the variables this can give rise to multicollinearity (which
is indicated by very large standard errors for the correlation coefficients). Stock &
Watson (2007) categorise multicollinearity into ‘perfect’ and ‘imperfect’
multicollinearity. Perfect multicollinearity arises where one of the regressors is a
perfect linear combination of the other regressors. Imperfect multicollinearity arises
where one of the regressors is very highly correlated, but not perfectly correlated,
with the other regressors. “Unlike perfect multicollinearity, imperfect
multicollinearity does not prevent estimation of the regression .....However., it does
mean that one or more of the regression coefficients could be estimated imprecisely”
(Stock & Watson, 2007, p. 206). Consequently, multicollinearity can threaten the
reliability of the multivariate regression analysis and for this reason needs to be
identified and treated prior to the regression. Tolerances as high as .5 or .6 can pose
difficulties in testing and interpreting regression coefficients (Tabachnick & Fidell,
2001, p. 118).
5.3.1 Correlation matrix
Pearson two tailed correlations were run for all variables in the regression model for
each year of the DV (company performance). Correlation results for the 1999
performance variables are shown in Table 5-5. Correlation matrices for the lagged
112
performance years are shown in Appendix 6. Correlates for all years are remarkably
similar, with the exception that significant negatives correlations (in the range -0.211
to -0.271) were found between the Board Opportunity Network variables and
RATSR for 1999 only; in later years there were no significant univariate results.
Therefore, I make the following observations based on the 1999 correlation results.
5.3.1.1 Independent variables
Board of directors’ opportunity network measures (the independent variable
measures) are all significantly positively correlated with each other. All correlates
exceeded 0.85, with a statistical significance of p < .01. There is a very high degree
of correlation (0.972) between the formal and social networks at both one degree and
two degrees of separation. Consequently, I would anticipate similar results in the
regressions between these independent variables. A high correlation was not
unexpected due to the composite nature of the measures used (i.e. the total network
is a larger network which encompasses the formal network, and also the network
measure for up to two degrees of separation also includes ties at one degree). These
high correlations have no affect on the reliability of results of the regression model
as they are all independent, and substituted into the model in isolation.
Another pattern to emerge in the correlation of the single board opportunity network
variables is that they are all significantly negatively correlated with the market-based
performance measures Tobin’s Q (Ln) and RATSR (hybrid). However, they are
significantly positively associated with firm size (LogN.total assets), board
independence and board size (number of directors), but significantly negatively
correlated with Chair independence. This suggests that larger companies are
associated with larger, better connected and more independent boards (with less
separate CEO-Chair positions) but also associated with lower market-based
performance. Conversely boards with CEO duality are less independent and have
fewer connections. These are some interesting findings which can be compared to
the results of the multivariate regression where the effect of all control variables
(modelled together), along with the board opportunity network measure, are
regressed against the dependent variable measures.
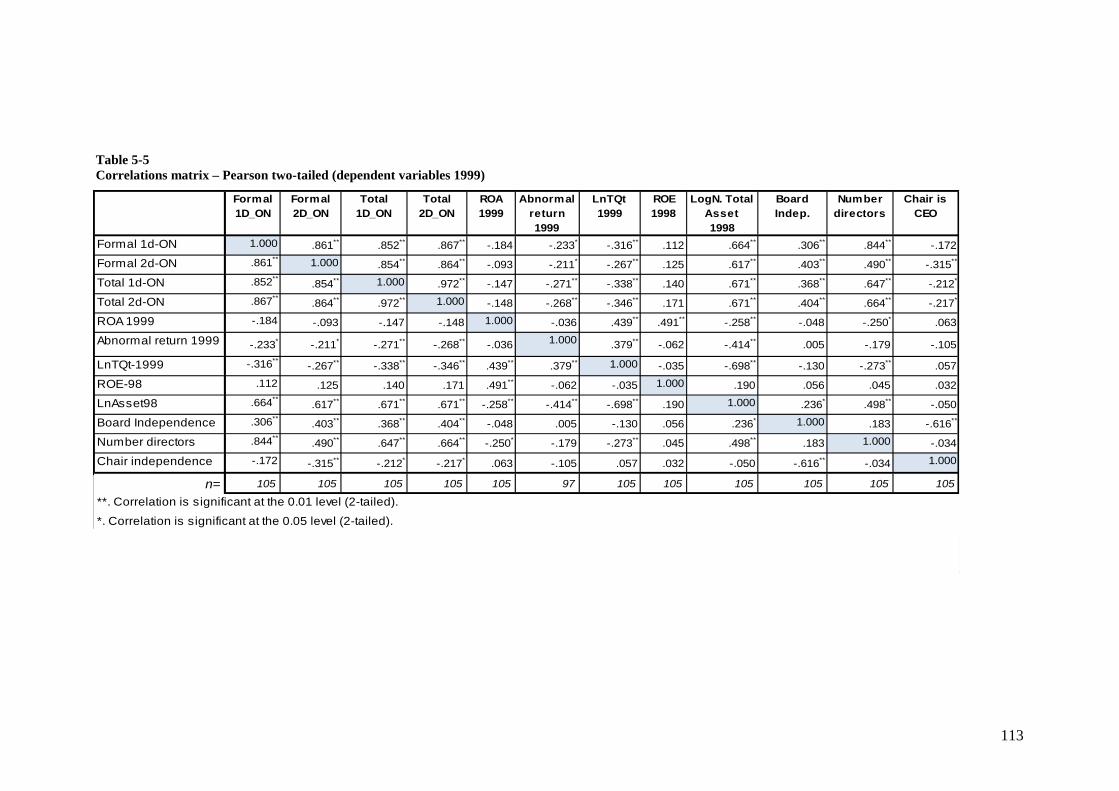
113
Table 5-5 Correlations matrix – Pearson two-tailed (dependent variables 1999)
Formal 1D_ON
Formal 2D_ON
Total 1D_ON
Total 2D_ON
ROA 1999
Abnormal return 1999
LnTQt 1999
ROE 1998
LogN. Total Asset 1998
Board Indep.
Number directors
Chair is CEO
Formal 1d-ON 1.000 .861** .852** .867** -.184 -.233* -.316** .112 .664** .306** .844** -.172
Formal 2d-ON .861** 1.000 .854** .864** -.093 -.211* -.267** .125 .617** .403** .490** -.315**
Total 1d-ON .852** .854** 1.000 .972** -.147 -.271** -.338** .140 .671** .368** .647** -.212*
Total 2d-ON .867** .864** .972** 1.000 -.148 -.268** -.346** .171 .671** .404** .664** -.217*
ROA 1999 -.184 -.093 -.147 -.148 1.000 -.036 .439** .491** -.258** -.048 -.250* .063
Abnormal return 1999 -.233* -.211* -.271** -.268** -.036 1.000 .379** -.062 -.414** .005 -.179 -.105
LnTQt-1999 -.316** -.267** -.338** -.346** .439** .379** 1.000 -.035 -.698** -.130 -.273** .057
ROE-98 .112 .125 .140 .171 .491** -.062 -.035 1.000 .190 .056 .045 .032
LnAsset98 .664** .617** .671** .671** -.258** -.414** -.698** .190 1.000 .236* .498** -.050
Board Independence .306** .403** .368** .404** -.048 .005 -.130 .056 .236* 1.000 .183 -.616**
Number directors .844** .490** .647** .664** -.250* -.179 -.273** .045 .498** .183 1.000 -.034
Chair independence -.172 -.315** -.212* -.217* .063 -.105 .057 .032 -.050 -.616** -.034 1.000
n= 105 105 105 105 105 97 105 105 105 105 105 105
**. Correlation is significant at the 0.01 level (2-tailed).
*. Correlation is significant at the 0.05 level (2-tailed).

114
5.3.1.2 Dependent variables
Tobin’s Q (Ln) is significantly positively correlated with ROA (0.439) and RATSRs
(0.379). However, there is no significant correlation between ROA and RATSR.
Similar to the independent variables, the dependent variables are regressed
separately in the models and will not influence each other. As they are not highly
correlated, the regression results with substituted dependent variables are expected
to produce quite different outcomes among the models.
All dependent variables show a significant (p<0.01) negative correlation to company
size measured by the natural log of total assets, ROA (-0.258), RATSR (-0.414) and
LnTQ (-0.698) which indicates that larger companies are associated with lower
performance.
5.3.1.3 Controls
As expected board size, operationalised as the number of directors, is significant
(p < 0.01) and highly positively correlated with the board opportunity network
measures. The highest correlation is with the formal network measure at degree-1
(correlation 0.844) as the intra-board opportunity network is less diluted with this
measure. Potentially, these correlated variables (i.e. board size and BON degree-1)
may not be sufficiently distinct as the correlation exceeds 0.75 (Cavana et al., 2001,
p. 328). However, as the number of director’s ties outside of the board increases,
that is through both the degree of separation and the infusion of social contact, the
correlates reduce to acceptable levels (from 0.49 to 0.664), but are still strongly
positive. Board size is also significant and positively correlated with the Natural
Log of Total Assets 1998 (firm size). This is expected and consistent with agency
theory and current Australian research, see Bonn (2004)34
Board Independence is strongly negatively correlated with Chair independence (p <
0.01) and correlate of -0.616. This is consistent with results of recent governance
research (Kiel & Nicholson, 2003) and indicates that as boards become more
and Kiel and Nicholson
(2003), because as companies get larger they tend to get larger boards.
34 Bonn found a significant (p<0.01) positive correlation 0.598 between firm size (measured by total sales) and board size.
115
independent of management (the proportion of outside directors on boards increases)
those boards will more likely have a non-management chair.
Previous performance (ROE 1998) shows a consistent significant positive
correlation with ROA in the current year 1999 and all three years of lagged
performance.
As discussed above, all correlates are within acceptable tolerances35
5.4 Regression analysis
to progress to
the inferential analysis undertaken in section 5.4.
As discussed in my research design (section 4.3.1) I use multiple regression to test
the hypotheses. Regression models are run to test the association between the DV
(dependent variable) and the predictors (independent variables). The power of the
model to explain the relationship is indicated by the Adjusted R2 value (Cavana et
al., 2001). Adjusted R2 values represent the extent to which the predictors
(independent variable and control variables) collectively account for changes in the
DV, that is, how much of the change in the DV can be accounted for with the model
(variables). Values range from 0 (no extent) to 1 (completely). Where the
explanatory power of the model is high, this indicates that the model has some
power in understanding the phenomenon.
The results reported separately for the IV and control variables tested in the model
are their p value (significance) and their coefficient (slope). Significance shows the
importance of the variable within the model. The standardised beta coefficient
indicates the direction of relationship. Beta coefficients range from -1 to +1, where -
1 is a strong negative relationship and +1 is a strong positive relationship and
coefficients near 0 are weak relationships. The coefficients are only reliable to the
extent of their significance (p value), that is, if the p value is insignificant then the
co-efficient is of low reliability.
35 With the reservation over the high correlation between board size and the formal BON measure at degree-1.

116
The significance of test results has been reported in three ways based on the p value
(Coolican, 1990); these are :
Significant: p< 0.10 reported as *
Very significant: 0.05 > p < 0.01 reported as **
Highly significant: p < 0.01 reported as ***
As described in section 4.3.4, tested models were variants of the form:
Perft = ƒ (BON)t + Perft-1 + Coysizet + bdsizet + bdindept + Chairindept + E
Where: Perf. is the dependent variable and represents the various performance
measures/ years tested
BON is the independent variable that represents various board connectivity
scores
Perft-1 is previous performance (ROE 1998)
Coysize is company size
Bdsize is board size
Bdindep is the board independence
Chairindep is chair independence and
E is the error rate in the model.
117
5.5 Findings
5.5.1 Results of regression tests
Regression results are reported in the following three tables for each performance
measure (and year) tested36
Table 5-6 shows the results of the four board opportunity network size models
(formal network at degree-1, formal network at degree-2, the total network at
degree-1 and the total network at degree-2) regressed against ROA for 1999 (t) and
the three later lagged years (t+1) through to (t+3). The power of the model (adjusted
R2) shows consistency, with minimal variation, across all BON models, this is
consistent with the high correlations found across the BON measures (see section
5.3.1.1). However there are noticeable differences across the four years tested. For
example the adjusted R2 for the formal opportunity network at degree-1 is strongest
at t+3 (.597) compared to 0.147 at t+2, 0.242 at t+1 and 0.366 at t. The most
consistent and significant variable in all models across all years is previous
. There are three performance measures; Table 5-6
shows Return on Assets, Table 5-7 shows the Natural Log Tobin’s q and Table 5-8
shows RATSR. Each table displays results for the four board opportunity network
size models (formal network at degree-1, formal network at degree-2, total network
at degree-1 and total network at degree-2) regressed against the performance
measure (dependent variable) for 1999 (t) and the three later lagged years (t+1)
through to (t+3). These models differ solely with respect to the measure of the
board opportunity network used in the regression. All other predictors used in the
models are the same. Each table reports the results of 16 different regressions, and
for each regression model I report the adjusted R2 for the model. The adjusted R2
indicates the power of the model to explain changes in the dependent variable. I
then report on the influence or importance of each variable (predictor) within each
model, that is its standardised beta coefficient (slope) and significance. I now
summarise the findings of each table.
36 Regressions were also run to test for possible associations between firm performance and diversity in a board’s opportunity network. I measured the variation (standard deviation) in director’s opportunity networks within company boards for the formal network at degree-2 and the total network at degree-2. Regressions were run for all performance measures but failed to produce any consistent or robust findings.
118
performance (ROE 1998). Previous performance is significant and positively
associated in all models for all years of the dependent variable. The strength of
association is similar in years t (0.542 to 0.545) and t+1 (0.544 to 0.55), lesser in t+2
(at 0.444 to 0.446), but very strong in t+3 at around 0.8. This relationship is not
unexpected, it is consistent with high correlations found between previous
performance (ROE 1998) and accounting-based performance measure ROA in 1999
(see section 5.3.1.2).
Company size was significant and negatively associated in all models for the current
year only. Similarly, board size was significant and negatively associated in all
models except the total network at degree-2; however results appear strongest for the
formal network at degree-1. Chair Independence showed an unexpected significant
negative association across all models for t3 (only), which I cannot explain and
consider to be an anomaly in the data. With respect to the board opportunity
network, the variable of interest to this research, significant positive associations
were found for the formal network only (at degree-1 and degree-2) for the current
year. No significant effects were found in later years.
Table 5-7 shows the results of the four board opportunity network size models
(formal network at degree-1, formal network at degree-2, total network at degree-1
and total network at degree-2) regressed against Tobin’s Q (Ln) at 1999 (t) and the
three later lagged years (t+1) to (t+3). The power of the model (adjusted R2) shows
consistency across all BON models, however the power of the formal models
(degree-1 and degree-2) is marginally greater (by 1 to 3 %) than total models
(degree-1 and degree-2) across all years. Also the power of the models are similar
across years of the DV; that is at t, t+1, and t+2 predictor variables accounted for
between 0.471 and 0.529 of the variation in performance. However the adjusted R2
is noticeably less for t+3, ranging from 0.343 in the total models to 0.359 on the
formal models.
Contrary to the other performance variables, where Tobin’s Q (Ln) is the
performance DV, the most significant and consistent predictor is company size
which showed strong consistent negative relationships across all BON models in all
years. Previous performance was also significant and positively associated with the
DV across all BON measures for all lagged years, but not the current year t0. Unlike
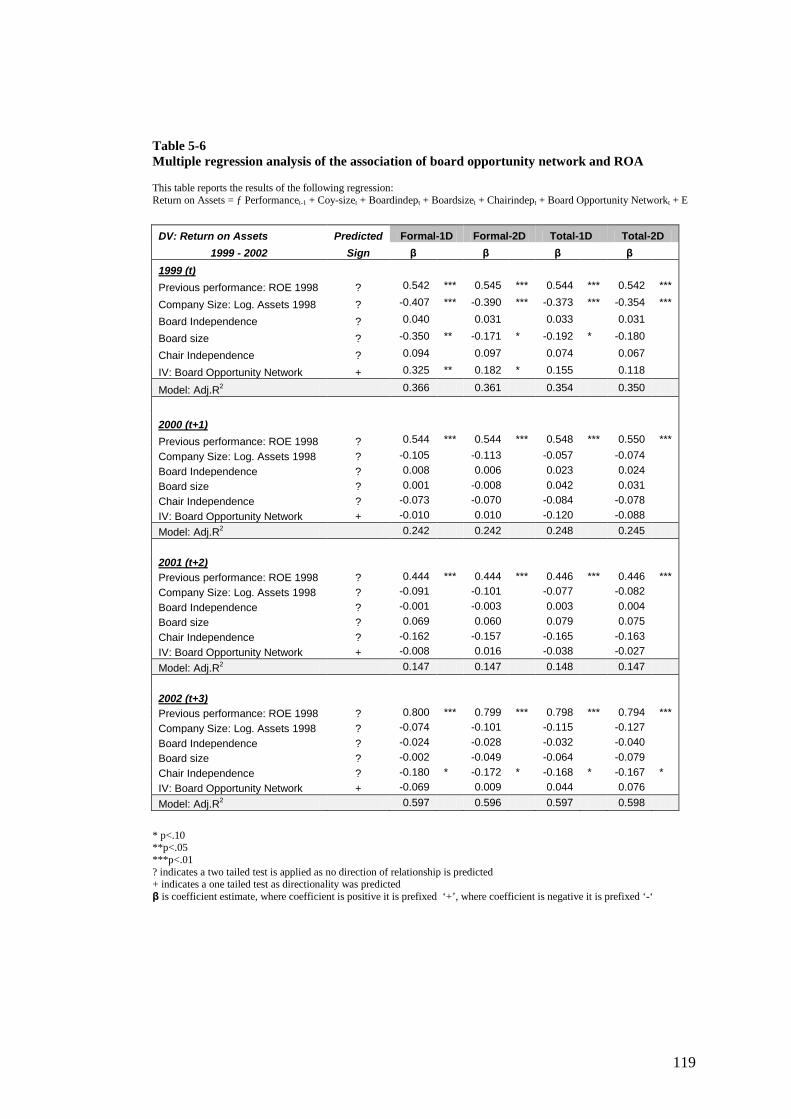
119
Table 5-6 Multiple regression analysis of the association of board opportunity network and ROA
This table reports the results of the following regression: Return on Assets = ƒ Performancet-1 + Coy-sizet + Boardindept + Boardsizet + Chairindept + Board Opportunity Networkt + E
DV: Return on Assets Predicted Formal-1D Formal-2D Total-1D Total-2D 1999 - 2002 Sign β β β β
1999 (t) Previous performance: ROE 1998 ? 0.542 *** 0.545 *** 0.544 *** 0.542 ***
Company Size: Log. Assets 1998 ? -0.407 *** -0.390 *** -0.373 *** -0.354 ***
Board Independence ? 0.040 0.031 0.033 0.031
Board size ? -0.350 ** -0.171 * -0.192 * -0.180
Chair Independence ? 0.094 0.097 0.074 0.067
IV: Board Opportunity Network + 0.325 ** 0.182 * 0.155 0.118
Model: Adj.R2 0.366 0.361 0.354 0.350
2000 (t+1)
Previous performance: ROE 1998 ? 0.544 *** 0.544 *** 0.548 *** 0.550 *** Company Size: Log. Assets 1998 ? -0.105 -0.113 -0.057 -0.074 Board Independence ? 0.008 0.006 0.023 0.024 Board size ? 0.001 -0.008 0.042 0.031 Chair Independence ? -0.073 -0.070 -0.084 -0.078 IV: Board Opportunity Network + -0.010 0.010 -0.120 -0.088 Model: Adj.R2 0.242 0.242 0.248 0.245
2001 (t+2) Previous performance: ROE 1998 ? 0.444 *** 0.444 *** 0.446 *** 0.446 *** Company Size: Log. Assets 1998 ? -0.091 -0.101 -0.077 -0.082 Board Independence ? -0.001 -0.003 0.003 0.004 Board size ? 0.069 0.060 0.079 0.075 Chair Independence ? -0.162 -0.157 -0.165 -0.163 IV: Board Opportunity Network + -0.008 0.016 -0.038 -0.027 Model: Adj.R2 0.147 0.147 0.148 0.147
2002 (t+3) Previous performance: ROE 1998 ? 0.800 *** 0.799 *** 0.798 *** 0.794 *** Company Size: Log. Assets 1998 ? -0.074 -0.101 -0.115 -0.127 Board Independence ? -0.024 -0.028 -0.032 -0.040 Board size ? -0.002 -0.049 -0.064 -0.079 Chair Independence ? -0.180 * -0.172 * -0.168 * -0.167 * IV: Board Opportunity Network + -0.069 0.009 0.044 0.076 Model: Adj.R2 0.597 0.596 0.597 0.598
* p<.10 **p<.05 ***p<.01 ? indicates a two tailed test is applied as no direction of relationship is predicted + indicates a one tailed test as directionality was predicted β is coefficient estimate, where coefficient is positive it is prefixed ‘+’, where coefficient is negative it is prefixed ‘-‘

120
regressions on the other performance measures Chair Independence did not show
any significance in any of the four models in t+3. Chair independence showed a
significant (p<0.10) positive association (0.17 and 0.174 respectively) at t+1 for the
formal BON models only (degree-1 and degree-2). The BON independent variable,
the focus of this research, was significant and positively associated with
performance in all models in the current year t, and with both the formal models in
years t+1 and t+2. A significant positive association was found at 2002 (t3) only in
the formal degree-1 model. This is consistent with the market effect being strongest
in the current year and washing out in subsequent years.
Table 5-8 shows results of the four board opportunity network size models (formal
network at degree-1, formal network at degree-2, total network at degree-1 and total
network at degree-2) regressed against the RATSR variable at 1999 (t) and the three
later lagged years (t+1) to (t+3). The results show inconsistent and mixed patterns
across the predictor variables and across years of the DV. Overall the power of the
model (adjusted R2) is less than for the other performance measures, highest values
(0.138 to 0.14) occur in the current year. Company size showed a significant
(p<.01) strong negative association (beta values from -0.434 to -0.475) for all
models in the current year, but there is no other significant results in later years t+1
through t+3. Previous performance is significant for all models only at t+2 where a
positive association was shown (beta coefficients ranging from 0.219 to 0.223).
Board independence is significant and showed a consistent positive association with
the DV for all models in t+2, but is not significant in any model in any other year
tested. Similar to ROA (Table 5 5) Chair independence showed a significant and
consistent negative association across all models at t+3, but in no other years. The
variable of interest, the board opportunity network, is significant (p<0.10) only at
t+3, showing a negative association with performance for models; formal degree-1 (-
0.387), total degree-1 (-0.263) and total degree-2 (-0.24). A negative association is
inconsistent with regressions results of the other performance measures.
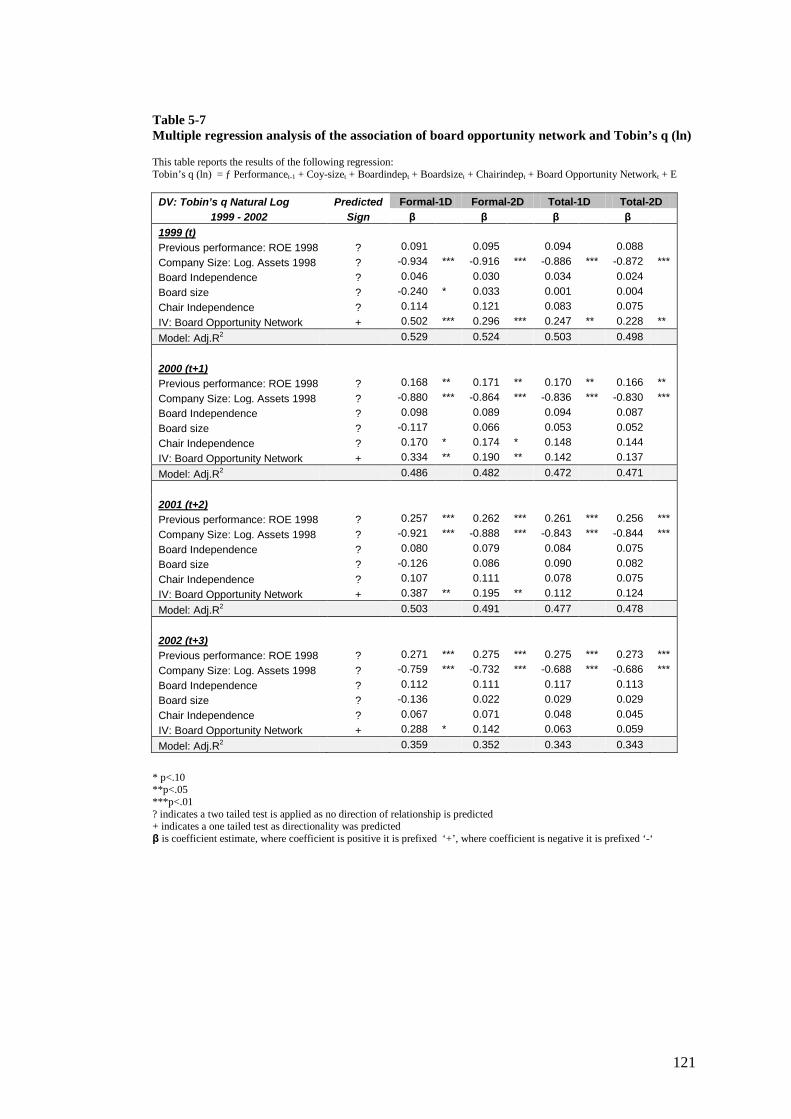
121
Table 5-7 Multiple regression analysis of the association of board opportunity network and Tobin’s q (ln)
This table reports the results of the following regression: Tobin’s q (ln) = ƒ Performancet-1 + Coy-sizet + Boardindept + Boardsizet + Chairindept + Board Opportunity Networkt + E
DV: Tobin’s q Natural Log Predicted Formal-1D Formal-2D Total-1D Total-2D 1999 - 2002 Sign β β β β
1999 (t) Previous performance: ROE 1998 ? 0.091 0.095 0.094 0.088 Company Size: Log. Assets 1998 ? -0.934 *** -0.916 *** -0.886 *** -0.872 *** Board Independence ? 0.046 0.030 0.034 0.024 Board size ? -0.240 * 0.033 0.001 0.004 Chair Independence ? 0.114 0.121 0.083 0.075 IV: Board Opportunity Network + 0.502 *** 0.296 *** 0.247 ** 0.228 ** Model: Adj.R2 0.529 0.524 0.503 0.498
2000 (t+1) Previous performance: ROE 1998 ? 0.168 ** 0.171 ** 0.170 ** 0.166 ** Company Size: Log. Assets 1998 ? -0.880 *** -0.864 *** -0.836 *** -0.830 *** Board Independence ? 0.098 0.089 0.094 0.087 Board size ? -0.117 0.066 0.053 0.052 Chair Independence ? 0.170 * 0.174 * 0.148 0.144 IV: Board Opportunity Network + 0.334 ** 0.190 ** 0.142 0.137 Model: Adj.R2 0.486 0.482 0.472 0.471
2001 (t+2) Previous performance: ROE 1998 ? 0.257 *** 0.262 *** 0.261 *** 0.256 *** Company Size: Log. Assets 1998 ? -0.921 *** -0.888 *** -0.843 *** -0.844 *** Board Independence ? 0.080 0.079 0.084 0.075 Board size ? -0.126 0.086 0.090 0.082 Chair Independence ? 0.107 0.111 0.078 0.075 IV: Board Opportunity Network + 0.387 ** 0.195 ** 0.112 0.124 Model: Adj.R2 0.503 0.491 0.477 0.478
2002 (t+3) Previous performance: ROE 1998 ? 0.271 *** 0.275 *** 0.275 *** 0.273 *** Company Size: Log. Assets 1998 ? -0.759 *** -0.732 *** -0.688 *** -0.686 *** Board Independence ? 0.112 0.111 0.117 0.113 Board size ? -0.136 0.022 0.029 0.029 Chair Independence ? 0.067 0.071 0.048 0.045 IV: Board Opportunity Network + 0.288 * 0.142 0.063 0.059 Model: Adj.R2 0.359 0.352 0.343 0.343
* p<.10 **p<.05 ***p<.01 ? indicates a two tailed test is applied as no direction of relationship is predicted + indicates a one tailed test as directionality was predicted β is coefficient estimate, where coefficient is positive it is prefixed ‘+’, where coefficient is negative it is prefixed ‘-‘

122
Table 5-8 Multiple regression analysis of the association of board opportunity network and RATSR
This table reports the results of the following regression: RATSR t = ƒ Performancet-1 + Coy-sizet + Boardindept + Boardsizet + Chairindept + Board Opportunity Networkt + E
DV: RATSR Predicted Formal-1D Formal-2D Total-1D Total-2D 1999 - 2002 Sign β β β β
1999 (t) Previous performance: ROE 1998 ? 0.027 0.028 0.029 0.032 Company Size: Log. Assets 1998 ? -0.475 *** -0.464 *** -0.434 *** -0.438 *** Board Independence ? 0.053 0.054 0.061 0.063 Board size ? 0.026 0.049 0.073 0.072 Chair Independence ? -0.098 -0.101 -0.108 -0.106 IV: Board Opportunity Network + 0.035 0.002 -0.064 -0.059 Model: Adj.R2 0.139 0.138 0.140 0.140
2000 (t+1) Previous performance: ROE 1998 ? 0.000 -0.001 0.000 0.008 Company Size: Log. Assets 1998 ? 0.094 0.099 0.063 0.081 Board Independence ? 0.096 0.107 0.099 0.111 Board size ? 0.250 0.124 0.127 0.151 Chair Independence ? 0.139 0.128 0.154 0.153 IV: Board Opportunity Network + -0.246 -0.176 -0.108 -0.159 Model: Adj.R2 -0.025 -0.021 -0.032 -0.027
2001 (t+2) Previous performance: ROE 1998 ? 0.219 ** 0.221 ** 0.222 ** 0.223 ** Company Size: Log. Assets 1998 ? 0.036 0.050 0.090 0.098 Board Independence ? 0.230 * 0.230 * 0.235 * 0.238 * Board size ? -0.260 -0.166 -0.147 -0.139 Chair Independence ? 0.067 0.069 0.048 0.046 IV: Board Opportunity Network + 0.172 0.087 0.006 -0.013 Model: Adj.R2 0.076 0.074 0.070 0.070
2002 (t+3) Previous performance: ROE 1998 ? 0.102 0.097 0.104 0.112 Company Size: Log. Assets 1998 ? 0.226 0.183 0.210 0.193 Board Independence ? -0.188 -0.193 -0.185 -0.171 Board size ? 0.041 -0.174 -0.115 -0.117 Chair Independence ? -0.369 ** -0.374 ** -0.375 ** -0.361 ** IV: Board Opportunity Network + -0.387 * -0.177 -0.263 * -0.240 * Model: Adj.R2 0.066 0.049 0.065 0.058
* p<.10 **p<.05 ***p<.01 ? indicates a two tailed test is applied as no direction of relationship is predicted + indicates a one tailed test as directionality was predicted β is coefficient estimate, where coefficient is positive it is prefixed ‘+’, where coefficient is negative it is prefixed ‘-‘
123
5.5.2 Results of hypotheses tests This section summarises the analysis and draws conclusions on each the six
hypotheses. For each hypothesis (one to four) I tested twelve different models; this
involves three different company performance measures employed across the four
years tested. Years tested are; the base year (yeart) 1999 and the following three
years t1, t2, and t3 (2000 to 2002). For ease of reference and association, I have also
summarised the results of all hypothesis testing in Table 5.9.
Hypothesis 1(A): The size of an Australian company board’s formal structural
social capital is positively correlated with firm performance (Return on Assets).
There is only partial support for formal structural social capital being positively
correlated with firm accounting performance (ROA). In terms of control variables,
both previous performance (positive association, p<.01) and company size (negative
association, p<.01) were significantly associated with ROA, a result that confirms
earlier studies of similar data sets (e.g. Kiel and Nicholson, 2003). Board size
showed inconsistent results across years and the four BON measures, showing
significant negative relationships with three models only in the current year, i.e.
formal degree-1 (p<.05) formal degree-2 (p<.10) and total degree-1 (p<.10). I was
anticipating a negative association between board size and ROA, as indicated in the
correlation matrix. Chair independence was significant at t+3 (negative association,
p<.01), however as no pattern is shown in the other years this appears to be an
artefact of the data rather than evidence of any consistent relationship. No other
control variables appeared to have a pattern of consistency.
In terms of the hypotheses and relationships between the opportunity networks and
performance (ROA), significant results were found in the current year only with the
formal network degree-1( p<.05) and the formal network at degree-2 (approaching
significance p<.10). There were no significant results in any of the following years
which is potentially problematic to interpretation as it is likely that accounting
performance would lag contemporaneous measures of opportunity network.
124
In conclusion, it appears there is partial support for hypothesis 1 such that there is a
positive relationship between the formal network at degree-1 and degree-2 for the
current year as measured by ROA.
Hypothesis 1(B): The size of an Australian company board’s formal structural
social capital is positively correlated with firm performance (Tobin’s Q (Ln).
There is strong support for formal structural social capital being positively correlated
with firm performance (Tobin’s Q (Ln)). In terms of the control variables, there was
a consistent and strong negative relationship (p<.01) between firm size and corporate
performance . Previous performance also shows a consistent and significant positive
association with performance in all lagged years, but not the current year. No other
control variables showed any pattern of consistency.
With regard to the hypotheses and the relationship between the opportunity network
and performance, there appears to be a positive, systematic relationship between a
board’s formal opportunity network measured at degree-1 and market-based
performance, measured by Tobin’s Q (Ln) in all years tested. Also this relationship
appears strongest in the current year, supported by the largest positive gradient
(standardised beta of .502) and the highest power of the model (adjusted R2 of .529).
That is, the model accounts for around 52.9% of the change in Tobin’s Q (Ln) in the
current year. This is consistent with market-based performance measures which are
expected to be responsive to market changes, see section 4.3.4.1. It is also
interesting that the strong relationship between the formal network at degree-1 and
performance in the contemporaneous year appears to have replaced previous
performance as a significant predictor variable.
In conclusion, it appears that there is strong support for hypothesis 1(B) in that there
is a positive relationship between the formal network at degree-1 and company
performance measured by Tobin’s Q (Ln).
Hypothesis 1(C): The size of an Australian company board’s formal structural
social capital is positively correlated with firm performance (RATSR).
There is little support for formal structural social capital being positively correlated
with firm accounting performance (RATSR). With respect to the control variables,

125
all showed mixed and inconsistent significance for this model and there were no
systematic pattern to emerge. Company size is shown to be significant (p<.01) and
negatively associated with performance only in the current year. Overall the
explanatory power of the model was weaker than with other performance measures
tested, with the adjusted R2 being greatest in the current year at 0.139.
In terms of the hypotheses and relationships between opportunity networks and firm
performance (measured by RATSR), a significant result (p<.10 and negative
association) was found only at third lagged year t+3. However the model at t+3 was
able to explain only 6.6% of the change in the RATSR. There are no significant
results found in the earlier years (current year and two lagged years).
In conclusion, there is little pattern in any of the results to support hypothesis 1(C).
Hypothesis 2(A): The size of an Australian company board’s formal
opportunity network at degree-2 is positively correlated with firm performance
(ROA).
As previously indicated, there is only moderate support for a relationship between
the formal opportunity network at two degrees and firm performance measured by
ROA. The pattern of results is similar to that of the formal structural social capital
model discussed in hypothesis 1(A). The significance of these results and the
gradients very closely resemble those of the formal structural model. Therefore the
logic, discussion and conclusions replicate the findings of hypothesis 1(A).
In conclusion, there is limited support for a relationship between the formal
opportunity network at degree-2 and ROA.
Hypothesis 2(B): The size of an Australian company board’s formal
opportunity network at degree-2 is positively correlated with firm performance
(Tobin’s Q (Ln)).
There is support for the formal opportunity network at two degrees being positively
correlated with firm performance Tobin’s Q (Ln). The pattern of results is similar
with that of the formal structural model for both the control variables and the IV and
therefore the logic, discussion and conclusions replicate the findings of hypothesis

126
1(B). The only notable differences in results (to the formal structural network) are
the gradient of the regression line (indicating the strength of association) is less
when the opportunity network is measured at degree-2 and that there is no longer a
significant association at t+3.
In conclusion, the hypothesis that there is a positive relationship between the formal
opportunity network measured at degree-2 and firm performance as measured by
Tobin’s Q (Ln) is supported.
Hypothesis 2(C): The size of an Australian company board’s formal
opportunity network degree-2 is positively correlated with firm performance
(RATSR).
There is no support for the formal opportunity network at degree-2 being positively
correlated with firm performance (RATSR). The patterns in the model and in the
control variables are the same as for the formal structural network and the same
discussions and conclusions can be drawn. In terms of the hypotheses and
relationships between the opportunity networks and firm performance (measured by
RATSR), there was no measure of the board opportunity network even approaching
significance in any of the four years.
In conclusion, the hypothesis that there is a positive relationship between the formal
opportunity network measured at degree-2 and firm performance as measured by
RATSR is not supported
Hypothesis 3(A): The size of an Australian company board’s total structural
social capital is positively correlated with firm performance (ROA).
There is no support for a board’s structural social capital being positively correlated
with firm accounting performance as measured by ROA. The pattern of results for
the model and control variables is very similar to that of the formal opportunity
network at degree-1 and degree-2 and therefore my discussion on the control
variables concludes the same as for hypotheses 1(A) and 2(A). However with regard
to the IV, no significant results were achieved in any of the four years tested.

127
In conclusion, the hypothesis that there is a positive relationship between a board’s
structural social capital and firm performance as measured by ROA is not supported.
Hypothesis 3(B): The size of an Australian company board’s total structural
social capital is positively correlated with firm performance (Tobin’s Q (Ln))
There is support for a board’s structural social capital being positively correlated
with firm performance (Tobin’s Q (Ln)). Again, the pattern of results for the control
variables is similar to those of the formal models and therefore my logic, discussion
and conclusions replicate the findings of hypothesis 1(B).
With regard to the hypotheses and the relationship between structural social capital
and performance, there is a positive relationship between a board’s structural social
capital and market-based performance measured by Tobin’s Q (Ln), in the current
year. Significant results were not found in subsequent years. This is expected for
market-based performance measures that react quickly to market changes, see
section 4.3.4.1.
In conclusion, it appears that there is support for hypothesis 3(B) in the current year.
Hypothesis 3(C): The size of an Australian company board’s total structural
social capital is positively correlated with firm performance (RATSR).
There is no support for a board’s structural social capital being positively correlated
with firm performance measured by RATSR. The patterns in the model, the control
variables and the IV are the same across all board opportunity network measures
where the DV is measured by company RATSR. Consequently I draw the same
conclusions from the data analysis. The explanatory power of the model was lower
than for other measures of the DV and a significant result (p<.10 and negative
association) was found only at third lagged year t+3. The model at t+3 was able to
explain only 6.5% of the change in the RATSR. No significant results were found in
the earlier years (current year and the two lagged years).
In conclusion the hypothesis that there is a positive relationship between the board’s
structural social capital and firm performance as measured by RATSR is not
supported.
128
Hypothesis 4(A): The size of an Australian company board’s total opportunity
network at degree-2 is positively correlated with firm performance (ROA).
There is no support for a board’s total opportunity network at degree-2 being
positively correlated with firm accounting performance as measured by ROA. The
pattern of results for the model, control variables and the IV are similar to that
shown for formal structural social capital, except that board size is now no longer
significant in any of the four years. With regard to the IV, the opportunity network
at degree-2 does not show a significant result in any of the four years tested.
In conclusion, the hypothesis that there is a positive relationship between a board’s
total opportunity network measured at two degrees of separation and firm
accounting performance as measured by ROA is not supported.
Hypothesis 4(B): The size of an Australian company board’s total opportunity
network at degree-2 is positively correlated with firm performance (Tobin’s Q
(Ln).
There is support for the board’s opportunity network being positively correlated with
firm performance measured by (Tobin’s Q (Ln)). The pattern of results shown for
the control variables is very similar to that of the other models when regressed
against Tobin’s Q (Ln). Therefore the discussion and conclusions replicate the
findings of hypothesis 1(B).
With regard to the hypotheses and the relationship between the board opportunity
network and performance, there appears to be a positive relationship between a
board’s opportunity network measured at degree-2 and market-based performance
measured by Tobin’s Q (Ln) in the current year. However no significant results
were achieved in later years.
In conclusion, it appears that there is support for hypothesis 4(B) in the current year.
Hypothesis 4(C): The size of an Australian company board’s opportunity
network at degree-2 is positively correlated with firm performance (RATSR).
There is no support for a board’s opportunity network measured at degree-2 being
positively correlated with firm performance measured by RATSR. The patterns in
129
the model, the control variables and the IV are the same across all board opportunity
network measures where the DV is measured by company RATSR. Consequently I
draw the same conclusions from the data analysis. The explanatory power of the
model was lower than for other measures of the DV and a significant result (p<.10
and negative association) was found only at third lagged year t+3. The model at t+3
was able to explain only 5.8% of the change in the RATSR. No significant results
found in the earlier years (current year and two lagged years).
In conclusion the hypothesis that there is a positive relationship between the a
board’s opportunity network and firm performance as measured by RATSR is not
supported.
Hypothesis 5: There is a stronger association and effect of the board
opportunity network on firm performance than of board structural social capital
on firm performance.
There is no support for a stronger association and effect of the board opportunity
network on firm performance compared with structural social capital on firm
performance. The variables (predictors) generally showed a consistent pattern of
results across all measures in the regressions. However, for those regressions where
the IV achieved consistent significance (i.e. Tobin’s Q (Ln) and ROA), all BON
measures at degree-1 showed stronger associations with performance than the
degree-2 measures (see Table 5-6 and Table 5-7). This evidence if anything
supports the opposite hypothesis. In conclusion, therefore hypothesis 5 is not
supported by the results.
Hypothesis 6: There is a stronger association and effect of the total (formal
and social) opportunity network on firm performance than of the formal
opportunity network on firm performance.
There is no support for the association of the total opportunity network on firm
performance having a greater effect than that of the formal opportunity network on
firm performance. In general the patterns of association for the control variables and
the independent variable were consistent by year for the formal network measures
and the total network measures. However, there were more cases where a significant
positive result was achieved for the IV when a formal measure was used rather than
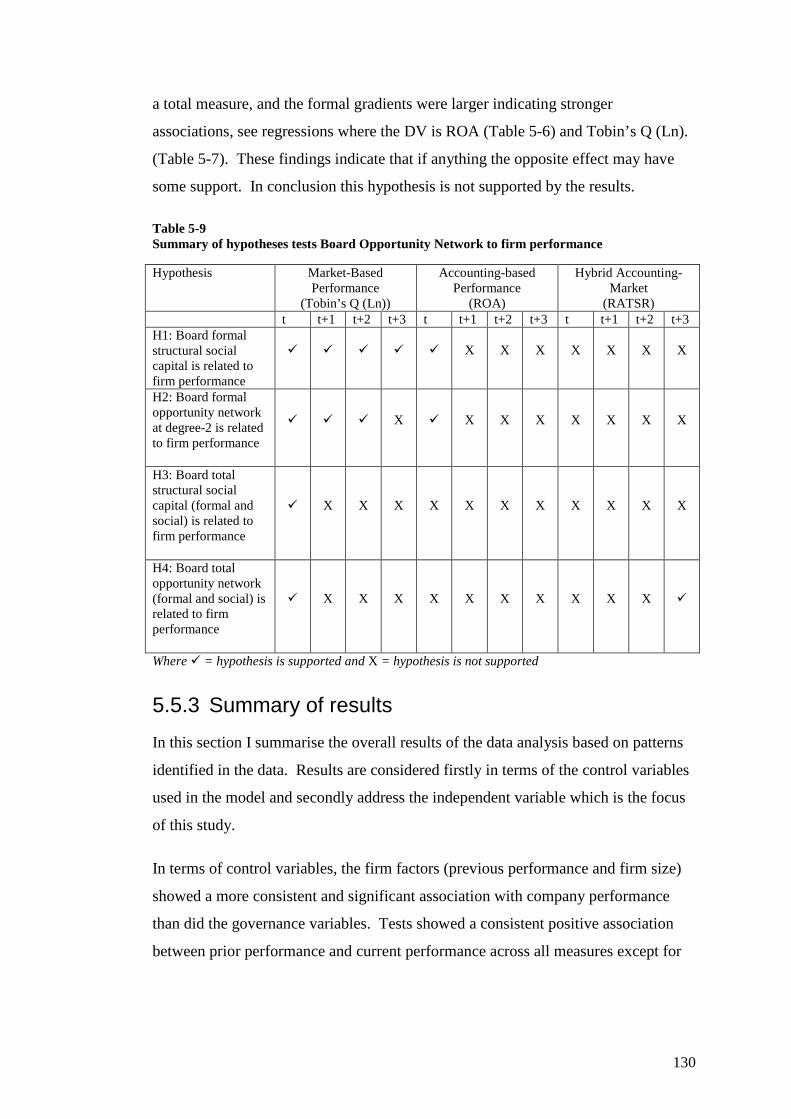
130
a total measure, and the formal gradients were larger indicating stronger
associations, see regressions where the DV is ROA (Table 5-6) and Tobin’s Q (Ln).
(Table 5-7). These findings indicate that if anything the opposite effect may have
some support. In conclusion this hypothesis is not supported by the results.
Table 5-9 Summary of hypotheses tests Board Opportunity Network to firm performance
Hypothesis Market-Based Performance
(Tobin’s Q (Ln))
Accounting-based Performance
(ROA)
Hybrid Accounting-Market
(RATSR) t t+1 t+2 t+3 t t+1 t+2 t+3 t t+1 t+2 t+3 H1: Board formal structural social capital is related to firm performance
X X X X X X X
H2: Board formal opportunity network at degree-2 is related to firm performance
X X X X X X X X
H3: Board total structural social capital (formal and social) is related to firm performance
X X X X X X X X X X X
H4: Board total opportunity network (formal and social) is related to firm performance
X X X X X X X X X X
Where = hypothesis is supported and X = hypothesis is not supported
5.5.3 Summary of results In this section I summarise the overall results of the data analysis based on patterns
identified in the data. Results are considered firstly in terms of the control variables
used in the model and secondly address the independent variable which is the focus
of this study.
In terms of control variables, the firm factors (previous performance and firm size)
showed a more consistent and significant association with company performance
than did the governance variables. Tests showed a consistent positive association
between prior performance and current performance across all measures except for
131
the current year of both market measures of performance and for RATSR37
In terms of the IV, the size of the board opportunity network appears to be
consistently associated with market-based measures of performance but not with the
accounting and hybrid based measures. The market-based measure produced robust
findings across all measures used, particularly at time t as would be expected under a
strong market hypothesis. The relationship between opportunity networks and
market performance appears to weaken over time, as would be expected under
strong market assumptions (see section 4.3.4.1). The association also appears to be
stronger for formal network measures than for the total network measures.
.
Company size showed a negative association with performance although this was
inconsistent across measures. However, a significant negative association was most
prevalent for those models where the IV was significant. Finally, there was no real
pattern in associations between governance variables and measures of performance.
In terms of accounting performance, there only appears to be a relationship between
the formal networks and ROA for the current year, all others are inconsistent.
5.6 Conclusion In this chapter I conducted an analysis of the data to test the hypotheses generated in
Chapter 4. This consisted initially of getting a feel for the data, i.e. identifying
missing data, reviewing the data distribution and the presence of potential outliers.
Where necessary, I performing transformations on the data to ensure it met the
assumptions of multiple regression. I then used inferential statistics to test for
associations in the data. Finally, I performed multiple regression tests on 48 models
in order to test the six hypotheses. I conclude the data analysis by reviewing and
summarising these results in order to identify patterns and consistencies in the
results.
In Chapter 6, I review and discuss these research findings and conclude on their
significance to this research program. I also consider the implications of these
findings and how they build upon extant literature of corporate governance and
37 Overall RATSR produced variable and inconsistent results throughout the analysis.

132
boards of directors in Australia. Finally I conclude this research by addressing the
research question this study seeks to answer.

133
Chapter 6 Discussion and conclusion
6.1 Introduction This research focuses on boards of directors’ opportunity networks and whether the
size of these networks are associated with the performance of the companies they
govern. To answer this question, I adopted four different measures for board
opportunity networks to test for differences between corporate versus social ties and
between strong ties and weak ties (Granovetter, 1973). The results indicate higher
market-based measures of company performance are associated with better
connected companies. There did not appear, however, to be any robust and
consistent association between opportunity network and accounting-based
performance measures and risk adjusted total shareholder return.
In this chapter, I consider and discuss the research findings and how they build upon
extant literature. I highlight how these findings contribute to the body of knowledge
and understanding of boards of directors and to corporate governance in Australia.
This research makes four contributions of varying importance to the governance
literature, a summary of which is provided in Table 6-1. First, I have demonstrated
the usefulness of a new way of measuring social capital at the board-level by
concentrating on how directors, rather than companies, connect to each other. These
ties arguably represent a more appropriate measure of the structural social capital
(Nicholson et al., 2004) because it is directors who access social capital flows not
firms (Nahapiet & Ghoshal, 1998). When aggregated at the board-level, these ties
represent the potential opportunity network available to the company through its
board of directors. Second, these results indicate that the size of a board’s
opportunity network is associated with market-based measures of company
performance. This is demonstrated in the formal inter-corporate network as well as
in the combined formal and social network. Third, and contrary to predictions,
results indicate a stronger association between the formal corporate network and
market-based measures of performance than between the total opportunity network
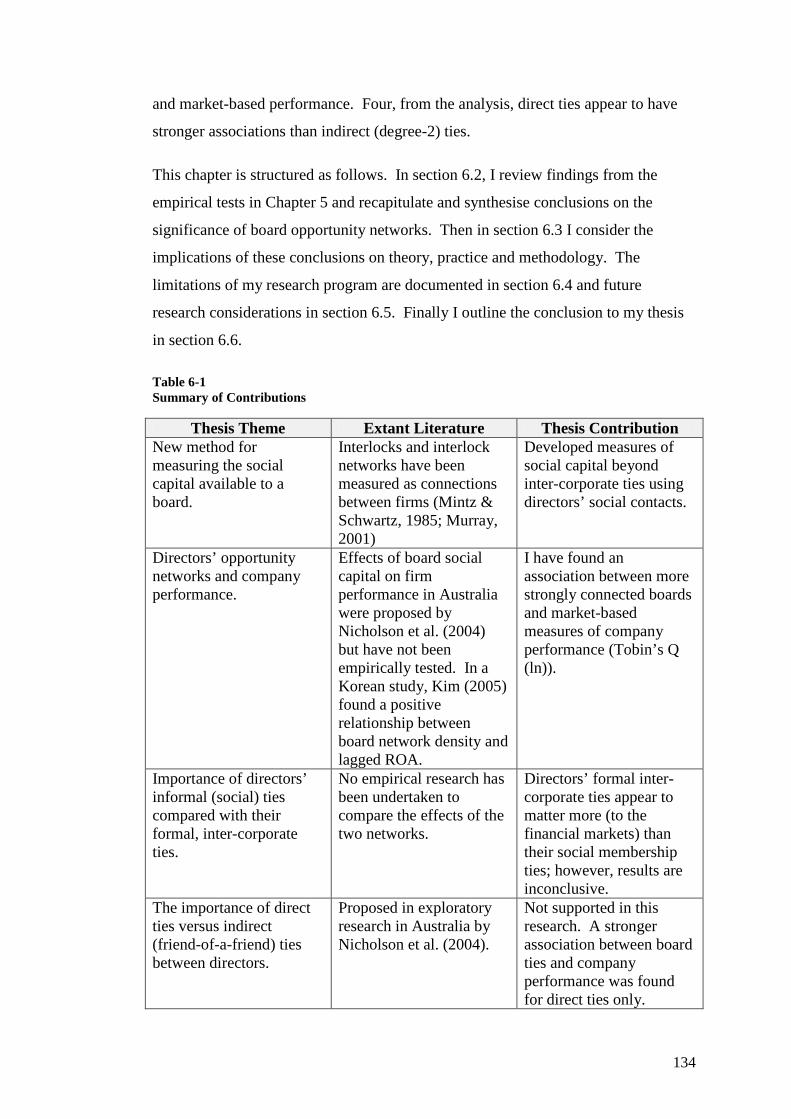
134
and market-based performance. Four, from the analysis, direct ties appear to have
stronger associations than indirect (degree-2) ties.
This chapter is structured as follows. In section 6.2, I review findings from the
empirical tests in Chapter 5 and recapitulate and synthesise conclusions on the
significance of board opportunity networks. Then in section 6.3 I consider the
implications of these conclusions on theory, practice and methodology. The
limitations of my research program are documented in section 6.4 and future
research considerations in section 6.5. Finally I outline the conclusion to my thesis
in section 6.6.
Table 6-1 Summary of Contributions
Thesis Theme Extant Literature Thesis Contribution New method for measuring the social capital available to a board.
Interlocks and interlock networks have been measured as connections between firms (Mintz & Schwartz, 1985; Murray, 2001)
Developed measures of social capital beyond inter-corporate ties using directors’ social contacts.
Directors’ opportunity networks and company performance.
Effects of board social capital on firm performance in Australia were proposed by Nicholson et al. (2004) but have not been empirically tested. In a Korean study, Kim (2005) found a positive relationship between board network density and lagged ROA.
I have found an association between more strongly connected boards and market-based measures of company performance (Tobin’s Q (ln)).
Importance of directors’ informal (social) ties compared with their formal, inter-corporate ties.
No empirical research has been undertaken to compare the effects of the two networks.
Directors’ formal inter-corporate ties appear to matter more (to the financial markets) than their social membership ties; however, results are inconclusive.
The importance of direct ties versus indirect (friend-of-a-friend) ties between directors.
Proposed in exploratory research in Australia by Nicholson et al. (2004).
Not supported in this research. A stronger association between board ties and company performance was found for direct ties only.

135
6.2 Conclusion on research questions The central theme underlying this research is that boards are an important strategic
resource available to firms due to their capacity to access and acquire scarce
resources (Pfeffer & Salancik, 1978), and that more strongly connected boards can
result in more valuable and higher performing companies (Hillman & Dalziel,
2003). The research questions were, therefore, centred on the resource dependence
role of the board (see section 2.4.1.2) under the premise that the extent to which
boards are effective in fulfilling this role impacts firm performance (Zahra & Pearce,
1989). More particularly, more strongly connected boards possess more social
capital (Nicholson et al., 2004) which leads to greater effectiveness of the board in
fulfilling its resource dependence role. These boards should then be able to provide
their companies with better access to scarce resources than their counterparts.
To operationalise the research questions, I measured ties between directors as a
proxy for the directors’ opportunity network. This is justified on the basis that this
opportunity network (i.e. the structural ties of directors) is a major component of
social capital (Nahapiet & Ghoshal, 1998). Using social network analysis, I was
able to extend the dimensions of the research question to consider broader network
issues, particularly the relative importance of the formal network versus the
combined formal and social network and also strong and weak ties (Granovetter,
1973). These dimensions to the research problem were included in my hypotheses
and tested through using different measures for the independent variable. The
remainder of this section is structured around three research dimensions or themes
that emerged: (1) the relationship between a board’s formal inter-corporate ties and
firm performance, (2) the same relationship where indirect ties are measured, and (3)
the implications of including the directors’ social connections in the network.
6.2.1 Formal board ties and company performance Formal board ties represent the ties of directors on a board to other directors in the
top-105 inter-company directors’ network. My results lend partial support to the
theories being tested (see section 3.4) as they identified a consistent positive
association between the number of board inter-corporate direct ties and the market-
based measure of corporate performance measured by Tobin’s Q (ln). However,
136
there was no consistent relationship with either the accounting-based measures of
performance or the RATSR measure (risk adjusted total shareholder return).
Results from the accounting-based measure (ROA) were weak and unreliable across
the four year period. A significant positive association result is only found
contemporaneously for ROA (i.e. in 1999). This is an unusual result, given it would
be normal to expect accounting measures to lag any board attributes. More
specifically, while the strong market hypothesis (Ball et al., 1989) suggests changes
in board composition would quickly result in a performance effect, changes in
accounting-based performance measures are only likely to take effect in the years
following the observation. This is because the effect of a board’s opportunity
network to acquire resources may take several years to come to fruition. .
RATSR, a hybrid accounting and market-based measure, also failed to show any
significance (other than a single result across all tests) in the regressions. My
measure for RATSR uses the total shareholder return (including share price
movements and company distributions) deflated by the expected risk adjusted return
for the company.
Tobin’s Q is a pure market-based measure which compares a company’s market
worth (based on the market value of its securities and debt) to the accounting book
value of its assets. Unlike accounting-based returns and RATSR, market values are
based on corporate expectations regarding income and growth. These expectations
will either be achieved by the company in due course or fail to be met. As discussed
in section 4.3.4.1, markets can react rapidly to changes in company expectations and
lagged responses are unusual. This expectation is borne out in the results, where the
most significant relationships were found contemporaneously (i.e. at time t). Lagged
market performance measures showed a lesser, although still significant relationship.
This indicates that there is an effect, but one that dissipates over time.
The robust pattern of association between Tobin’s Q (ln) and the size of the board
opportunity network suggests that the market is prepared to pay a premium for
better-connected boards. In a well informed and efficient market, as in Australia,
(Ball et al., 1989) the market has anticipated that higher company returns arise from
better connected boards. However, this was not reflected in the accounting-based

137
measures; there was no consistent support under any accounting-based measure
(with the exception of ROA at year t). This gives rise to three alternative
interpretations of the pattern of research results.
First, the results may be due to a limitation of the research design, in that three years
of lagged accounting performance may be insufficient to highlight the performance
effect of board connectivity. Given the potentially long lead time between a board
member providing information to management or harnessing their relationships,
benefits to the corporation may take longer than three years to flow through to
reported accounting returns. In fact, it is possible that the potential benefits (access
to capital, information, improved practices) brought by better connected boards may
take several years for the benefits to materialise. Large projects, for example, may
take many years to become fully commissioned and generate the income stream
reflecting superior company performance. Therefore, it is conceivable that the
opportunity network to accounting-based company performance differentials will
show up beyond three years. This is discussed further in section 6.4.
Alternatively, and contrary to market expectations, better connected boards may not
be associated with real higher accounting-based earnings. This interpretation would
require an assumption that the Australian stock market has a systemic inefficiency in
that it consistently and systematically expects better connected boards to have higher
performance, but this does not eventuate. However, rational financial markets can
react to perceptions, that is appearance rather than fact, particularly in respect to
company initiatives regarded as reducing uncertainty (Westphal & Zajac, (1998).
However, this assumption could be viewed as inconsistent with prior Australian
research. For instance, Ball et.al. (1989) conclude that the market effects could be
expected to lead the accounting results in an informed market.
The third interpretation of the results does not support the theoretical basis of this
thesis, but instead suggests reverse causality – that corporate performance leads to
the appointment of well-connected directors, rather than vice versa. Regression only
examines the general associations between connectedness and performance. To
claim that market conclusions lead to directors’ connections would require a
different method (e.g. an event based methodology) so that conclusions could be
drawn on the effect of announcements of the appointment of well-connected
138
directors. Instead, it is plausible that highly networked directors (arguably,
influential directors) seek appointment with high performing companies. The high
Tobin’s Q (ln) at time t indicates that these firms were well regarded to the market.
It is likely that these firms would be attractive to directors seeking to enhance their
reputations (Zajac, 1988) and would therefore consider or seek appointment to these
well-regarded companies. This interpretation is consistent with both the market-
based performance results and the accounting-based performance results. The
relationship between connectedness and accounting performance was only found
contemporaneously and may also indicate a reverse causality – companies that are
performing well can attract well-connected directors.
There is empirical support for this effect, both from the perspective of directors and
companies. In terms of directors, those directors seeking to advance their careers
will actively seek to join well performing, growing, and prestigious company boards.
This will result in a higher board connectivity score for those companies. This
motivation is consistent with the findings of Zajac (1988) and Useem (1984), both of
whom consider directors’ personal outcomes on the effects of interlocks (see table
3.1). From the company’s perspective, there is emerging empirical evidence that
companies and their boards engage in symbolic action (Westphal & Zajac, 1998;
Zajac & Westphal, 2004). For instance, Westphal and Zajac(1998) provide strong
evidence that markets react positively to the announcement of changes in executive
compensation plans that align with shareholder value, whether these changes are
implemented or not. They also document a relationship such that announcements of
changes in compensation plans are negatively associated with other measures
designed to reduce agency costs. They conclude that companies engage in the
symbolic management of stockholders. Similarly, Zajac & Westphal (2004)
examined market reactions to announcements of share repurchase plans (repurchase
plans are considered positively by the market as a means of preventing managers
from wasting free cash flow on empire building projects). They found a growing
positive market reaction to the announcement of share repurchase plans despite a
falling rate of implementation of plans previously adopted and concluded that the
plans became more strongly associated with the agency values they affirm. In
effect, repurchase plans built symbolic value through ‘reciprocal interpretations’.
139
Overall, this research has found a sociological perspective to stock market reactions
based on corporate policy adoptions.
The results I have presented are consistent with a symbolic management perspective.
However, a longitudinal (Zikmund, 2003) or event-based study (W. R. Scott, 2003)
would be required to provide more robust evidence of such phenomena, a point to
which I return in section 6.5.
Overall, I conclude that these findings do not support positive associations between
a board’s opportunity network and the firm’s accounting-based performance. They
do, however, provide support for a positive relationship between a board’s
opportunity network and market-based performance. There is also a pattern in the
data suggestive of reverse causality – that good boards attract well-connected
directors, not that well-connected directors enhance corporate performance. The
results provide partial support for the synthesis of social capital theory and resource
dependence theory; that better connected boards provide access to greater potential
resources and advantage for their companies in comparison with their less well-
connected peers.
6.2.2 Inclusion of directors’ social ties in the analysis A second contribution of my work is to extend the measure of network
connectedness from the network of directors’ formal inter-corporate ties to their
declared social ties. Social ties comprised memberships of clubs and other non-
profit bodies that directors had publicly declared to ‘Who’s Who in Australia’. As
shown in table 4-3, the combined network is considerably larger than the formal
network. Whereas the formal network contained 4,376 relationship dyads, the
combined network contained 776,109 relationship dyads. At two degrees of
separation the formal network contained 44,342 ties compared with 170,096 ties for
the combined network. Correlations of the two networks (see section 5.3.1.1)
showed a high correlation in board connectivity across the four network measures.
In general, the pattern of results indicates that the amalgam of the directors’ social
network with the inter-corporate formal network weakens the association with
company performance. More robust results were achieved with the formal inter-
140
corporate network than with the total network despite the very high correlation
between these variables (as discussed in section 5.3).
This finding appears to be inconsistent with the social capital literature. Social
capital leads to opportunities which are accessible through the network, irrespective
of type of social capital relations (Burt, 1992; Nahapiet & Ghoshal, 1998). Failure
to show an improved association in performance with the larger denser total network
may be due to three key causes.
First, a failure to demonstrate a link may be related to data collection; more
correctly, an inability to capture more significant social connections. Social data
was gathered from secondary archival sources initially collected through directors’
declarations/ interviews by Who’s Who in Australia. This data relates to club, non-
business and non-profit association memberships only. It does not extend to family
ties, religious ties and school ties which are considered significant in the social
capital literature (e.g. Nahapiet & Ghoshal, 1998). Directors may be reluctant to
divulge all their social affiliations as providing this information to public sources
may expose them to criticism or infringe their privacy.
A second, related cause may be the nature of the measure that I use. Opportunity
network represents the potential resources available to the board (Nicholson et. al,
2004) and not the actual social capital. Measuring social capital requires an
understanding of the strength of the tie and the resources available through that tie
(Burt, 2005; Granovetter, 1973; Nahapiet & Ghoshal, 1998). Since I was only
interested in the opportunity network, I would not capture those elements of the
mechanism thought to relate social capital to firm performance.
Finally, a third explanation is that there is no relationship between a director’s social
ties and firm performance. Rather, the pattern suggests that only formal corporate
ties matter and provide more explanatory power than a director’s full network.
Whilst there are strong theoretical reasons for including directors’ social ties in any
broad social capital analysis, my results do not provide any support for a
relationship. In fact, they suggest the opposite. Possible improvements in data
collection methods for social data are discussed in section 6.4 Limitations.
141
6.2.3 Using the boards’ opportunity network in the analysis
In this research, I measured ties between directors as direct ties38
The correlation analysis (see section 5.3) suggests degree-1 and degree-2 networks
in Australian corporate settings are quite similar, but not identical. The regression
analyses found minimal difference in the explanatory power of the model or in the
significance of the result when the degree-2 (i.e. ‘friend of a friend’) measure was
used. For instance, there was a reduction in the significance of the ROA model at t (
see table 5-5), and results found with Tobin’s Q (ln) (table 5-7) for the formal and
total networks (particularly at t, t+1, and t+2) had similar significance whether the
networks were measured at one or two degrees of separation. However, the beta
coefficients of the formal network were significantly less when measured at two
degrees (see section 5.5.2, hypothesis 5). The reduction in the beta coefficients for
Tobin’s Q (ln) and ROA indicates that the strength of the association between the
board network measure and company performance is greater where the measurement
is of direct rather than indirect ties.
and as indirect ties
at two degree of separation, also referred to as ‘friend-of-a-friend’ ties (Nicholson et
al., 2004). Indirect ties occur through a third person. Both direct ties and indirect
ties (at two degrees) can be used to access resources that are embedded in social
networks and represent an opportunity network. The opportunity networks
measured in this thesis are the structural network (comprised of direct ties) and the
opportunity network of direct and indirect ties (measured at degree-2), for both the
directors’ formal network and the combined formal and social network.
The pattern of findings in the results does not support measurement of the
opportunity network beyond one degree of separation. A stronger association of at
least equal significance is found when direct ties only are measured. This finding,
although not conclusive, supports the network structure of social capital defined as
physical direct ties (Baker, 1990). With respect to this research of company
directors and boards, it would appear that direct ties are more important than indirect
(weak) ties (Granovetter, 1973).
38 Direct ties are ties at one degree of separation
142
6.3 Implications of the thesis These conclusions lead to a number of implications for theory, practice and
methodology. These implications are discussed below and summarised in Table 6-2.
6.3.1 Implications for theory
I have been unable to provide robust empirical support for the theory underpinning
this thesis. The strong pattern of association between Tobin’s Q (ln) and the size of
the board opportunity network suggests that the market is prepared to pay a premium
for better-connected boards (on the basis that higher company returns can be
anticipated (Ball et al., 1989)). However, this was not reflected in the accounting-
based measures in the contemporaneous year or within three lagged years. There
was no consistent support under any accounting-based measure (with the exception
of ROA at year t) or the hybrid measure.
However, the pattern of results is more consistent with the perspective of symbolic
management (Westphal & Zajac, 1998; Zajac & Westphal, 2004). Investors
(shareholders) may be willing to pay a premium for companies they consider well
governed and having boards that are well-connected. Symbolic management does
not suggest that the markets are irrational, but rather bounded rational processors of
information that respond to legitimate perceived indications that agency problems
or, in this case, resource dependency problems, are being addressed. For instance,
well-connected boards may be considered to enhance organisational legitimacy
(Selznick, 1949) irrespective of whether they do, in fact, result in higher accounting
profits. Investors may perceive the enhanced legitimacy through well-connected
directors as lowering the uncertainly of investment risk in the company (Westphal &
Zajac, 1998).
In this research, a symbolic management perspective suggests a symbiotic
relationship between boards and directors. It is proposed that boards will seek out
well-connected directors to join them to strengthen their social legitimacy and that
directors strive to join well performing companies to enhance their reputations and
career prospects (Zajac, 1988). Further research to empirically test this proposition
is discussed in section 6.5.

143
Other significant theoretical implications of this thesis relate to a failure to find
support (1) for including directors’ social connections into their opportunity
networks (see section 6.2.2). and (2) for extending the social capital opportunity
network to two degrees of separation to include ‘friends of friends’ (see section
6.2.3). I am surprised that the inclusion of directors’ social connections in the
analysis did not yield stronger results, in view of the strong sociological
underpinning for this position (Burt, 1992; Nahapiet & Ghoshal, 1998). As
discussed in section 6.2.2, a more supportive result may have been achievable using
an expanded social data set. This is discussed in section 6.4 Limitations.
Alternatively, it is probable that, with respect to directors and boards, their formal
connections may be stronger and have more significance in the analysis.
Consequently this may require modification to the current theoretical position.
Similarly, stronger findings where direct ties (in comparison with second degree
ties) are used in the analysis run contrary to the proposition of Nicholson et. al
(2004) and support the social capital definition of direct ties of Baker (1990). It is
probable that for directors (and boards), which some consider to be an elite group
(Useem, 1984), that direct ties matter more than indirect ties.
6.3.2 Implications for practice
The results of this thesis show that the financial markets value well-connected
directors and well-connected boards. As discussed in section 6.2.1, companies may
use the services of well-connected directors as a vehicle to symbolically manage the
expectations of its shareholders and investors. Boards need to consider market
expectations when appointing new directors. The board as a collective should be
aiming to achieve optimal performance in undertaking the roles described in section
2.4 that is, resource dependence, monitoring and control, and service. With respect
to resource dependence, which is the focus of this thesis, boards will need to develop
and foster ties through their directors to maximise their links to the external
environment. These linkages facilitate access to resources and enable the company
to achieve competitive advantage over its competitors. Ideally, boards could map
their ties to companies and institutions they consider critical within the inter-
corporate network and the economy. Such mapping may ensure that they minimise
structural holes (Burt, 1992).
144
Directors who are aware of the importance companies attach to their network of
business connections, may strive to join well-connected boards. In doing so, they
may significantly enhance their perceived value to the companies they serve.
Directors may also seek to exploit their social connections outside of the inter-
corporate network. While my research is inconclusive on the effect of social ties,
this may possibly be a result of insufficient data. Directors who choose to disclose
the extent of their network of memberships and affiliations may be rewarded with
enhanced career prospects in future board openings and offerings. This could be an
interesting area for future research and is discussed in section 6.5.
Financial market investors and market regulators need to be wary that investors may
be encouraged to pay a premium for announcements which are intended to be
largely symbolic and which may not necessarily result in a change of company
earnings. These announcements have the capacity to create future expectations and
not necessarily future value. Such disclosures could potentially be abused by
unscrupulous boards keen to increase the share-price of their companies. It also
highlights a potential flaw in the market (at least in Australia) that regulators and
market participants may want to investigate.
6.3.3 Implications for methodology
The main methodological implications to be drawn from this research is that board
interlocks measured at the director level may provide more reliable analysis than
board-level measures in any future interlock research. The methodology adopted in
this research provides academics an alternative measure for inter-corporate ties for
use in their research programs. By grounding future interlock studies within social
capital theory and utilizing social network analysis to analyse the network of
connections between directors, a raft of alternative measures becomes available.
These include the measurement of indirect ties, or reach, within a network.
However, researchers will need to exercise caution with the selection of new
measures to ensure these are appropriate to their study. For example, when grouping
individual directors to the board-level, redundant links should be considered (these
arise where different directors on a board have connections with the same director in
the network). Properly considered, the application of sociology to interlock research
can provide more depth and robustness.

145
A summary of the main thesis implications is provided in Table 6-2.
Table 6-2 Implications of thesis conclusions for theory, practice and methodology
Thesis
Contribution
Implications for
Theory
Implications for
Practice
Implications for
Methodology
Inter-corporate ties are represented in director’s social capital measured through their formal and social ties.
• Strong theoretical underpinning in sociology.
• Directors may be more willing to divulge important social connections where they perceive this can benefit their careers.
• This methodology is under-pinned by current sociological theory. It is arguably an advance on traditional measures of firm interlocks.
Positive association found between better connected boards and market-based performance measured by the Tobin’s Q (ln). However, no consistent association was found with historic accounting-based measures, except for ROA which showed mixed results for the contemporaneous year only.
• Mixed results between market-based measures and accounting-based measures do not provide consistent and robust support for the theoretical position that better connected boards lead to better company performance. Rather, the pattern of results is more consistent with reverse causality, that well-connected directors (seek to) join better performing companies.
• Well-connected directors seek to serve on better performing companies to enhance their careers.
• Boards may actively seek to attract better connected directors, due to a positive market effect.
• Inter-corporate connections may be more reliably measured using ties at the individual director level, rather than through interlocks at firm level.
Directors’ formal inter-corporate ties appear to matter more (to financial markets) than their social membership ties.
• Results are inconclusive. Social capital types may not be of equal value or cumulative with respect to directors’ opportunity networks.
• The markets may not be fully informed or aware of directors’ important social connections
• Directors may seek to disclose to the markets social ties which they consider are important
• Alternative and more comprehensive measures of social capital are needed.
• More thorough collection methods are needed.
Direct ties show a stronger association with company performance than indirect ties (at Degree-2).
• Direct ties may be stronger ties and provide better access social capital than indirect ties. More research is needed.
• No direct implication
• No implications considered.
146
6.4 Limitations Five limitations to this thesis were identified during the study, namely: (1)
measurement error in directors’ networks at two degrees of separation, (2) a limited
data set of directors’ social connections (3) the datedness of the study period and
resultant missing data (4) the single year cross sectional approach and (5) a
potentially insufficient lag on accounting-based measures. The nature of these
limitations can potentially weaken the power of this analysis and inhibit or disguise
the findings. These limitations are discussed below and also addressed in the next
sections as future research opportunities.
6.4.1 Measurement error in formal networks at two degrees of separation.
Although BON measures indicate variability they generally showed a high
correlation. Results indicated that stronger associations of at least equal significance
were found when direct ties only are measured. The pattern of findings in the results
does not support measurement of the opportunity network beyond one degree of
separation.
Potentially, some formal degree-2 connections may not be captured in the analysis,
which could weaken the indirect ties association. This would occur where top-105
directors also serve on the boards of other (smaller) listed or unlisted companies not
in the top-105 listed companies. While I delimited the study to capture the entire
network for the top-105 companies, significant links may occur in the formal
network that is outside those companies. Extending the study to all listed entities
(and indeed all business entities) would overcome this challenge, but would involve
a significant investment of resources and time, beyond the scope of a traditional
Master’s Thesis.
6.4.2 Limitations in the social connections data. My research was unable to find any support for extending directors’ formal
connections to include their social connections in the analysis (see section 6.2.2). If
anything, enhancement of the formal network with social connections produced a
weaker result. As explained in section 6.2.2, failure to demonstrate a link may be
147
related to data collection: particularly an inability to capture more significant social
connections. Social data was gathered from secondary archival sources initially
collected through directors’ declarations (from interviews conducted by Who’s Who
in Australia). Publicly available social ties may not have been sufficiently
comprehensive or consistent to accurately map the network (and some social data
was found to be sparse or missing, see section 5.2.2). It is probable that directors
may have avoided declaring sensitive memberships for personal and/or political
reasons. The data-set comprised club, non-business and non-profit association
memberships only. It did not extend to family ties, religious ties and school ties,
which are considered significant in the social capital literature (e.g. Nahapiet &
Ghoshal, (1998)). While I was able to verify formal ties data by comparing director-
associations to the board counts, similar completeness checks were unable to be
undertaken on social ties due to their open ended nature. Potentially, missing social
ties can significantly reduce the generation of dyadic relations in the analysis, and so
under-represent the impact of social ties on firm performance.
Arguably, more supportive results may have been forthcoming if more
comprehensive and extended social data was acquired, perhaps through primary
research. This is further discussed as a future research focus, see section 6.5.
6.4.3 Datedness of the study period. This study was conducted using 1999 data made available to me from another
research program. Although components of the associations between board
opportunity networks and company performance, which I have analysed, could be
criticised as being dated, they are expected to be similar for other top-105 company
populations in later years. The age of the data does not bear directly on my research
question. However, it was not possible to collect company performance data for all
lagged years as some companies had ceased to exist after 1999. They had either
been taken over, collapsed or undergone significant organisational change. The
highest frequencies of missing data exceeding 5% occurred in 2001 (t+1) and 2002
(t+2); this reduced the statistical power of the analysis in these later years.
Potentially, it could have affected the significance of findings in the regression
analyses performed in these (lagged) years, particularly as these companies are
likely to be performing poorly.
148
6.4.4 Single year data and cross-sectional design. In this study, I have analysed a relationship between the size of a corporate board’s
opportunity network at 1999 and company performance at that time. The results of
this analysis can arguably be applied across other years for the same population of
interest. However, this cross-sectional design does not allow for changes over time
to be analysed. For instance, I am unable to determine whether changes in a board’s
opportunity network over time are associated with company performance changes
(or the effect of company performance changes on board opportunity networks).
There is also insufficient data to analyse possible effects associated with reverse
causality (section 6.2).
6.4.5 Lagged accounting-based measures As discussed in section 6.2.1, accounting-based performance measures, ROA and
ROE, failed to show any significant results beyond the contemporaneous year,
contrary to expectations. It is conceivable that any performance change may not
show up within the three year lagged performance period, as the resource effect
(through the BON) may take several years to flow through to the accounting
numbers. A longer performance lag time may have found different results.
Although discussion and acknowledgement of these limitations is important and may
temper the conclusions to be drawn from this research, they do not detract from the
overall significance of the findings or implications of this research program. This
research has demonstrated an alternative approach to measuring inter-corporate ties
and is designed to overcome some of the criticisms of “interlocks to firm
performance” studies. Through an understanding of social capital and the
application of social network analysis to exploring human relations, future
researchers may unearth further gaps in our knowledge.
6.5 Further research Opportunities for further research relate mainly to the limitations identified in
section 6.4. These limitations have restricted potential findings of this research
program and my ability to draw some conclusions. In particular, I have been unable
149
to unequivocally answer my guiding research question due to inconclusive and
inconsistent results found across market-based, accounting-based and hybrid
company performance measures and with some board opportunity network
measures. Further research opportunities may uncover and resolve some of the
outstanding issues raised and these are addressed in order of importance.
A longitudinal study could be undertaken to investigate the relationship between
boards of directors’ contacts and company performance over time. My study based
on cross sectional 1999 data, has shown partial support for this association, but the
cause and effect of this association remains unknown and subject to conflicting
interpretations (see section 6.2.1). Longitudinal data can be used to analyse changes
in boards of directors’ opportunity networks over time and the relationship with
changes in company performance over this same time frame. Ideally more recent
datasets should be used primarily to reduce the incidence of missing data. Care will
need to be taken to ensure company dropouts over the period of the study are
minimised, if a company selected at timet no longer exists at timet+1 then the
company would be excluded from the analysis. Longitudinal studies could, among
other things, help to strengthen claims to cause and effect relationships (Cavana et
al., 2001, p. 122).
Consideration could also be given to using an event-based study to examine possible
reverse causality of the association. As discussed in section 6.2.1, the results of this
study could be interpreted as indicative of boards appointing well-connected
directors to their ranks (for among other reasons) to symbolically manage investor
perceptions and directors seeking to join well-performing companies to enhance
their careers and reputation. An event-based study can be used to analyse changes
in a company performance (measured by market and accounting performance)
immediately following appointment of new directors to the board.
Further research could enhance the power of this study by including greater formal
and social associations (connections) data. More association data will ensure more
salient connections are captured in the analysis, that is for both direct ties and
indirect ties. Formal associations could, for example, be extended to include a larger
data set of listed (and possibly unlisted) companies. The purpose would be to ensure
all important formal direct and indirect ties which occur outside of the top-105 listed
150
companies are captured (for instance two top-105 company directors may be
connected through an unlisted company board). I am not suggesting that the top-105
population be widened (as this is a population of key economic interest), but that the
completeness of capturing vital ties is enhanced. However, a significant extension
of the data could prove problematic particularly with regard to processing capability.
For example, Table 4-3 shows that the number of relationship dyads increases
dramatically (from 9482 dyads in the formal top-105 network compared with
1,552,952 dyads in the total network) where other membership organisations are
included in the analysis. Potentially, current computer processing tools may limit
opportunities to extend the analysis, and will require further investigation.
Another area which could prove fruitful lies in expanding the social connections data
to ensure even stronger or more complete social data is captured. Directors’ social
capital can arise through, in addition to their club and business type memberships,
other important connections such family ties and church or religious groups
(Nahapiet & Ghoshal, 1998). These connections may prove difficult to capture,
particularly using public secondary data sources. Further opportunities to expand
this research exist using a qualitative research approach, for example using director
interviews. These can provide a richer data source and uncover ties which may be
more sensitive to disclose publicly, e.g. family, church and political associations
(Cavana et al., 2001, p. 12).
Finally, future studies may also take a different approach to measuring company
performance (the dependent variable). This could include developing consolidated
measures of accounting performance (e.g. see Boyd, 1990), extending the lag in
accounting measures beyond three years and or using moving averages to better
capture a lagged impact on firm performance.
6.6 Conclusion This thesis has investigated inter-corporate connections of boards of directors’, the
highest level of corporate power in Australia. The question which I sought to
answer was do boards’ of directors’ inter-corporate connections have any effect on
the performance of the companies they govern? My research has produced mixed

151
results. I found a strong association between measures of board connectivity and
market-based performance, which indicates that the market is prepared to pay a
premium for better connected boards. However, current and lagged accounting
measures of performance provided only weak support for this phenomenon. These
findings suggest that although having well connected directors on a board is
perceived positively by the financial markets, they are not associated with improved
corporate profitability (contrary to resource dependence theory). The pattern of
findings also indicate a possible reverse causality, that is well-connected directors
seek to join well-performing companies to enhance their career aspirations. Further
research will be required to investigate this proposition.
A major contribution of this study is that I have employed a new methodology for
measuring inter-corporate connections. Rather than using the traditional
methodology of firm interlocks to measure inter corporate connectivity, I adopted
social capital theory and produced four different measures of directors’ social capital
using social network analysis. Director’s social capital is aligned with the sociology
literature and is arguably a more reliable measure of a board’s capability to fulfill its
resource dependence role. Arguably it is through their personal networks, and not
through their firm connections, that directors access corporate resources. Finally, I
am hopeful that the academic community is able to utilise this development to
extend the knowledge of corporate governance and boards of directors.

152

153
Appendices
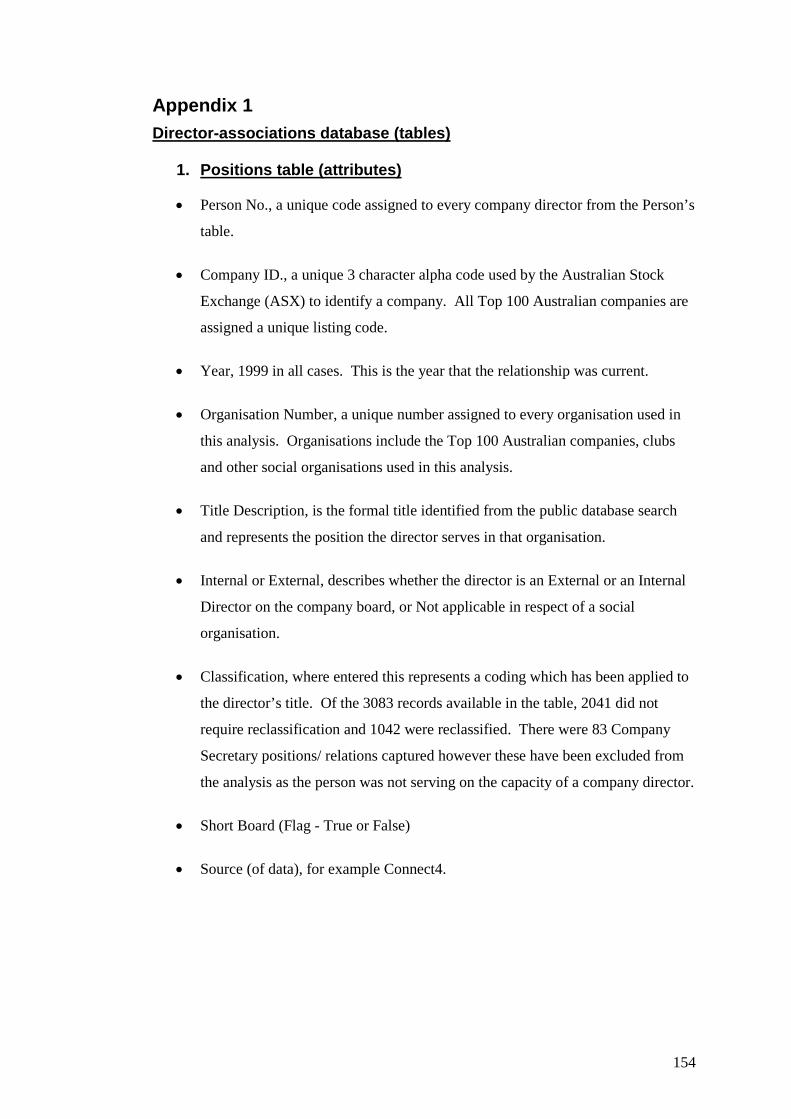
154
Appendix 1
Director-associations database (tables)
1.
• Person No., a unique code assigned to every company director from the Person’s
table.
Positions table (attributes)
• Company ID., a unique 3 character alpha code used by the Australian Stock
Exchange (ASX) to identify a company. All Top 100 Australian companies are
assigned a unique listing code.
• Year, 1999 in all cases. This is the year that the relationship was current.
• Organisation Number, a unique number assigned to every organisation used in
this analysis. Organisations include the Top 100 Australian companies, clubs
and other social organisations used in this analysis.
• Title Description, is the formal title identified from the public database search
and represents the position the director serves in that organisation.
• Internal or External, describes whether the director is an External or an Internal
Director on the company board, or Not applicable in respect of a social
organisation.
• Classification, where entered this represents a coding which has been applied to
the director’s title. Of the 3083 records available in the table, 2041 did not
require reclassification and 1042 were reclassified. There were 83 Company
Secretary positions/ relations captured however these have been excluded from
the analysis as the person was not serving on the capacity of a company director.
• Short Board (Flag - True or False)
• Source (of data), for example Connect4.

155
2.
• Company ID
Organisation table (attributes)
• Company Name; is the full name of the company or organisation.
• Organisation Number
• Organisation type (Listed company or other body). There are 7 Distinct organisation types captured, these are:
o Government board or mission. These are state or federal government bodies charged with a public purpose.
o Education/research institution
o Listed co. This identifies listed public companies. Whilst this table contains data on 1264 companies, only 105 listed public companies are associated with directors (persons) in the Positions table and relevant to this analysis. The Positions table contains 1043 memberships with 105 listed public companies.
o Non listed co. These are 19 organisations coded as Non Listed companies. These comprise 15 professional services firms, lawyers and accountants and 4 mis-codings (to be corrected).
o Not-for-profit institutions (NPI) serving business. These are professional membership organisations which the directors would be a member of in the capacity of; associate, member or fellow. (There are 691 separate organisation memberships stored in the Positions table).
o NPI Serving community.
o Other – this represents a range of social clubs; including golf clubs, ski clubs, business clubs, yachting clubs. (there are 705 separate club memberships stored in the Positions table).

156
3.
• Person_Id
People table (attributes)
• Person_Number; a unique integer assigned to every person/ company director.
• Surname; the director’s surname
• Firstname; the director’s first-name or initials
• Date of Birth; not populated.
• Gender; two values are populated, false and true. False translates to male and
true translates to female.
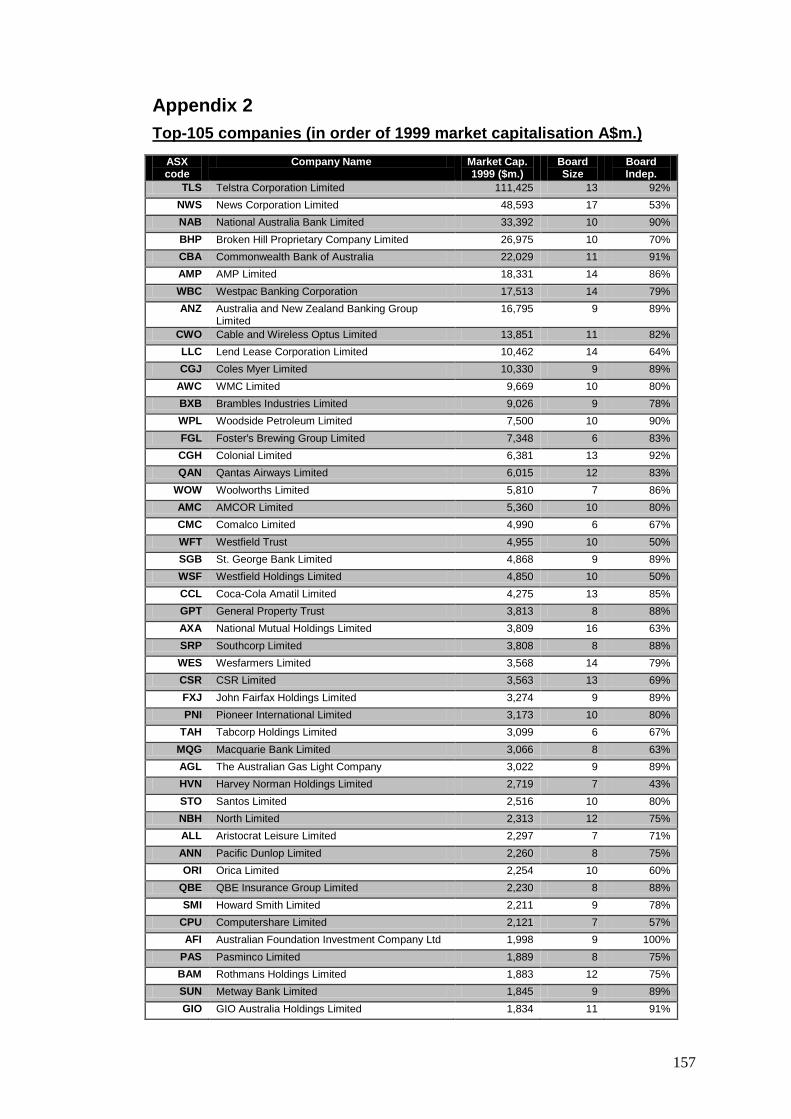
157
Appendix 2
Top-105 companies (in order of 1999 market capitalisation A$m.)
ASX code
Company Name Market Cap. 1999 ($m.)
Board Size
Board Indep.
TLS Telstra Corporation Limited 111,425 13 92% NWS News Corporation Limited 48,593 17 53% NAB National Australia Bank Limited 33,392 10 90% BHP Broken Hill Proprietary Company Limited 26,975 10 70% CBA Commonwealth Bank of Australia 22,029 11 91% AMP AMP Limited 18,331 14 86% WBC Westpac Banking Corporation 17,513 14 79% ANZ Australia and New Zealand Banking Group
Limited 16,795 9 89%
CWO Cable and Wireless Optus Limited 13,851 11 82% LLC Lend Lease Corporation Limited 10,462 14 64% CGJ Coles Myer Limited 10,330 9 89%
AWC WMC Limited 9,669 10 80% BXB Brambles Industries Limited 9,026 9 78% WPL Woodside Petroleum Limited 7,500 10 90% FGL Foster's Brewing Group Limited 7,348 6 83% CGH Colonial Limited 6,381 13 92% QAN Qantas Airways Limited 6,015 12 83%
WOW Woolworths Limited 5,810 7 86% AMC AMCOR Limited 5,360 10 80% CMC Comalco Limited 4,990 6 67% WFT Westfield Trust 4,955 10 50% SGB St. George Bank Limited 4,868 9 89% WSF Westfield Holdings Limited 4,850 10 50% CCL Coca-Cola Amatil Limited 4,275 13 85% GPT General Property Trust 3,813 8 88% AXA National Mutual Holdings Limited 3,809 16 63% SRP Southcorp Limited 3,808 8 88% WES Wesfarmers Limited 3,568 14 79% CSR CSR Limited 3,563 13 69% FXJ John Fairfax Holdings Limited 3,274 9 89% PNI Pioneer International Limited 3,173 10 80%
TAH Tabcorp Holdings Limited 3,099 6 67% MQG Macquarie Bank Limited 3,066 8 63% AGL The Australian Gas Light Company 3,022 9 89% HVN Harvey Norman Holdings Limited 2,719 7 43% STO Santos Limited 2,516 10 80% NBH North Limited 2,313 12 75% ALL Aristocrat Leisure Limited 2,297 7 71% ANN Pacific Dunlop Limited 2,260 8 75% ORI Orica Limited 2,254 10 60%
QBE QBE Insurance Group Limited 2,230 8 88% SMI Howard Smith Limited 2,211 9 78%
CPU Computershare Limited 2,121 7 57% AFI Australian Foundation Investment Company Ltd 1,998 9 100%
PAS Pasminco Limited 1,889 8 75% BAM Rothmans Holdings Limited 1,883 12 75% SUN Metway Bank Limited 1,845 9 89% GIO GIO Australia Holdings Limited 1,834 11 91%

158
ASX code
Company Name Market Cap. 1999 ($m.)
Board Size
Board Indep.
ONE One.Tel Limited 1,791 8 63% MIM M.I.M. Holdings Limited 1,776 9 78% SYB Mayne Nickless Limited 1,774 8 88% NDY Normandy Mining Limited 1,752 7 71% CSL CSL Limited 1,747 8 88% SSX Smorgon Steel Group Limited 1,729 8 75% GMF Goodman Fielder Limited 1,717 10 80%
LEI Leighton Holdings Limited 1,544 12 83% TCL Transurban Group 1,535 12 83% TAB TAB Limited 1,525 8 88%
BWA Bank of Western Australia Ltd 1,520 12 83% PWT PowerTel Limited 1,489 8 75% FHF F.H. Faulding & Co. Limited 1,465 6 83% SGP Stockland Trust Group 1,458 7 71% BLD Boral Limited 1,455 10 90% FIF The Franked Income Fund 1,419 6 50%
JHX James Hardie Industries Limited 1,412 7 86% AAP AAPT Limited 1,405 6 83% CNA Coal & Allied Industries Limited 1,342 10 90% CFX Gandel Retail Trust 1,328 7 71%
WAN West Australian Newspapers Holdings Limited 1,242 6 83% SEV Seven Network Limited 1,136 11 73% FCL Futuris Corporation Limited 1,131 9 89% BRL BRL Hardy Limited 1,057 9 67% ADP Schroders Property Fund 1,028 8 0% ASX Australian Stock Exchange Limited 1,020 11 91% ARG Argo Investments Limited 993 7 71% SOL Washington H. Soul Pattinson and Company
Limited 978 5 80%
DDF National Mutual Property Trust 942 4 25% FOA Foodland Associated Limited 937 7 86% ILU Iluka Resources Limited 913 8 88%
PPT Perpetual Trustees Australia Limited 872 9 89% HIH HIH Insurance Limited 864 15 67% UEL United Energy Limited 862 8 88% JUP Jupiters Limited 840 8 88% APN Australian Provincial Newspapers Holdings
Limited 824 10 80%
NCM Newcrest Mining Limited 821 8 88% TEN Ten Network Holdings Limited 817 12 83% MIG Macquarie Infrastructure Group 816 4 50% HLY Hills Motorway Group 814 6 100% EML Email Limited 805 11 91% PMP PMP Communications Limited 786 7 86% GWT GWA International Limited 762 8 88% WEG George Weston Foods Limited 759 6 50% PBB Pacific BBA Limited 737 8 75% NFD National Foods Limited 729 7 86% NUF Fernz Corporation Limited 711 9 78% SPP Southern Pacific Petroleum NL 702 10 20% NLX Austrim Limited 679 8 63% ICT Incitec Limited 676 8 88%
CTX Caltex Australia Limited 656 12 83%

159
ASX code
Company Name Market Cap. 1999 ($m.)
Board Size
Board Indep.
MBC Mobile Communications Holdings Limited 656 4 50% APF Advance Property Fund 646 6 0% VRL Village Roadshow Limited 623 11 55%
IIF Prime Industrial Property Trust 602 7 86% ART AMP Shopping Centre Trust 0 6 0% CMJ Publishing and Broadcasting Limited 652 13 62%

160
Appendix 3
Board opportunity network metrics by company (ranked by total connections at degree-1) Company Name Coy.
code Total 1D
Total 2D
Formal 1D
Formal 2D
National Mutual Holdings Limited AXA 671 5568 341 2218
Westpac Banking Corporation WBC 654 5861 267 1733
Telstra Corporation Limited TLS 637 5400 276 1989
Australian Foundation Investment Company Ltd
AFI 633 4008 146 1100
AMP Limited AMP 609 5205 310 1896
National Australia Bank Limited NAB 596 4508 202 1610
AMCOR Limited AMC 569 4201 220 1820
Broken Hill Proprietary Company Limited BHP 525 4139 218 1663
Colonial Limited CGH 515 4317 191 907
Orica Limited ORI 501 3812 169 1187
Mayne Nickless Limited SYB 496 3700 153 1269
CSR Limited CSR 491 4289 255 1645
Santos Limited STO 487 3938 219 1729
Australia and New Zealand Banking Group Limited
ANZ 473 3738 148 1057
Commonwealth Bank of Australia CBA 466 4127 224 1494
WMC Limited AWC 439 3655 188 1337
Boral Limited BLD 430 4034 187 1497
Southcorp Limited SRP 418 3415 192 1460
HIH Insurance Limited HIH 412 3851 235 745
Publishing and Broadcasting Limited CMJ 407 3722 163 277
Macquarie Bank Limited MQG 391 3352 122 821
The Australian Gas Light Company AGL 390 3572 201 1661
Email Limited EML 381 3282 173 1153
Pacific BBA Limited PBB 380 2688 86 412
Qantas Airways Limited QAN 379 4023 238 1694
QBE Insurance Group Limited QBE 374 3286 134 1048
Woodside Petroleum Limited WPL 371 3133 139 744
Transurban Group TCL 368 3015 185 904
Australian Stock Exchange Limited ASX 365 3593 153 816
News Corporation Limited NWS 362 2445 295 769
St. George Bank Limited SGB 362 3160 140 969
Lend Lease Corporation Limited LLC 361 3273 218 792
Pioneer International Limited PNI 360 3552 191 1336
North Limited NBH 359 2944 150 468
Perpetual Trustees Australia Limited PPT 356 3115 140 999
Brambles Industries Limited BXB 353 3173 150 1156
Newcrest Mining Limited NCM 353 2843 122 833
GIO Australia Holdings Limited GIO 347 3576 188 1050
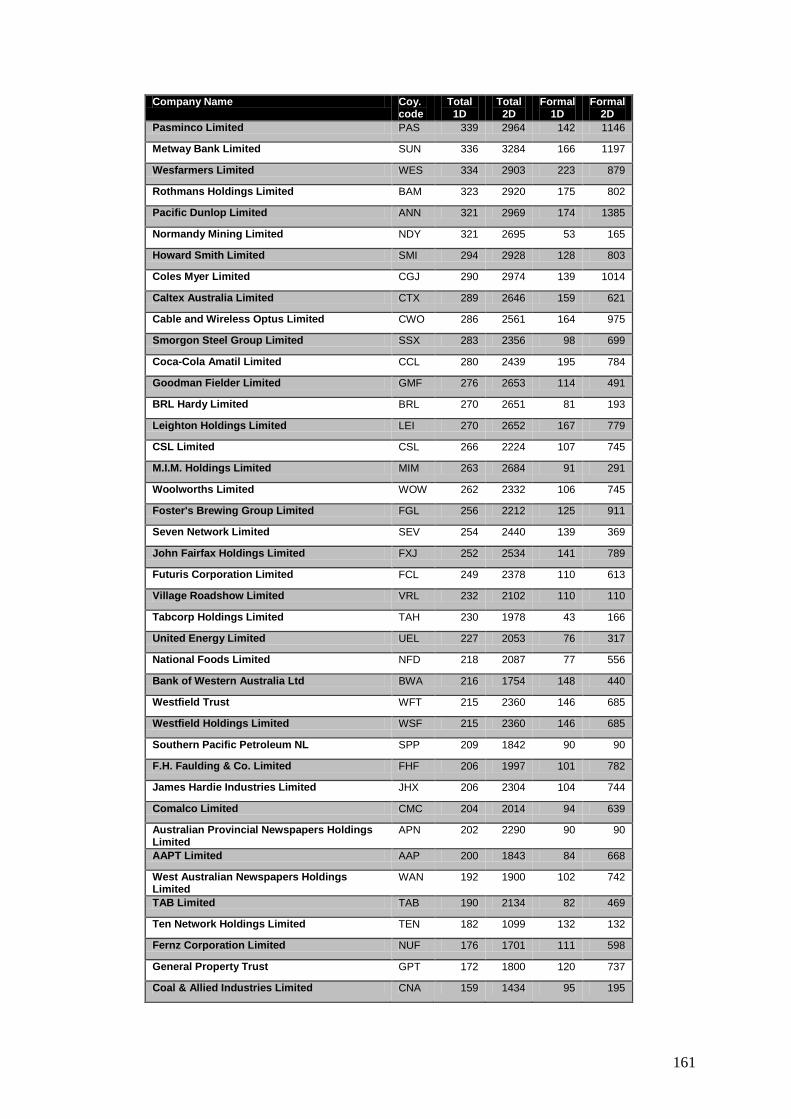
161
Company Name Coy. code
Total 1D
Total 2D
Formal 1D
Formal 2D
Pasminco Limited PAS 339 2964 142 1146
Metway Bank Limited SUN 336 3284 166 1197
Wesfarmers Limited WES 334 2903 223 879
Rothmans Holdings Limited BAM 323 2920 175 802
Pacific Dunlop Limited ANN 321 2969 174 1385
Normandy Mining Limited NDY 321 2695 53 165
Howard Smith Limited SMI 294 2928 128 803
Coles Myer Limited CGJ 290 2974 139 1014
Caltex Australia Limited CTX 289 2646 159 621
Cable and Wireless Optus Limited CWO 286 2561 164 975
Smorgon Steel Group Limited SSX 283 2356 98 699
Coca-Cola Amatil Limited CCL 280 2439 195 784
Goodman Fielder Limited GMF 276 2653 114 491
BRL Hardy Limited BRL 270 2651 81 193
Leighton Holdings Limited LEI 270 2652 167 779
CSL Limited CSL 266 2224 107 745
M.I.M. Holdings Limited MIM 263 2684 91 291
Woolworths Limited WOW 262 2332 106 745
Foster's Brewing Group Limited FGL 256 2212 125 911
Seven Network Limited SEV 254 2440 139 369
John Fairfax Holdings Limited FXJ 252 2534 141 789
Futuris Corporation Limited FCL 249 2378 110 613
Village Roadshow Limited VRL 232 2102 110 110
Tabcorp Holdings Limited TAH 230 1978 43 166
United Energy Limited UEL 227 2053 76 317
National Foods Limited NFD 218 2087 77 556
Bank of Western Australia Ltd BWA 216 1754 148 440
Westfield Trust WFT 215 2360 146 685
Westfield Holdings Limited WSF 215 2360 146 685
Southern Pacific Petroleum NL SPP 209 1842 90 90
F.H. Faulding & Co. Limited FHF 206 1997 101 782
James Hardie Industries Limited JHX 206 2304 104 744
Comalco Limited CMC 204 2014 94 639
Australian Provincial Newspapers Holdings Limited
APN 202 2290 90 90
AAPT Limited AAP 200 1843 84 668
West Australian Newspapers Holdings Limited
WAN 192 1900 102 742
TAB Limited TAB 190 2134 82 469
Ten Network Holdings Limited TEN 182 1099 132 132
Fernz Corporation Limited NUF 176 1701 111 598
General Property Trust GPT 172 1800 120 737
Coal & Allied Industries Limited CNA 159 1434 95 195
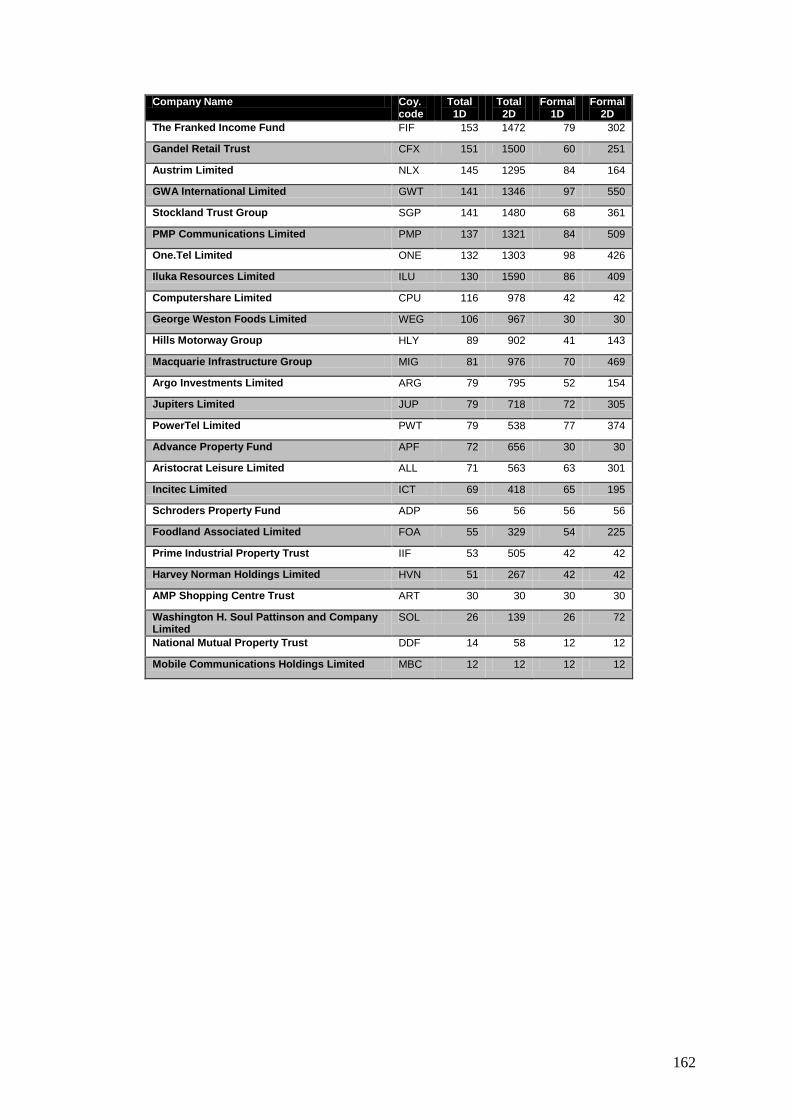
162
Company Name Coy. code
Total 1D
Total 2D
Formal 1D
Formal 2D
The Franked Income Fund FIF 153 1472 79 302
Gandel Retail Trust CFX 151 1500 60 251
Austrim Limited NLX 145 1295 84 164
GWA International Limited GWT 141 1346 97 550
Stockland Trust Group SGP 141 1480 68 361
PMP Communications Limited PMP 137 1321 84 509
One.Tel Limited ONE 132 1303 98 426
Iluka Resources Limited ILU 130 1590 86 409
Computershare Limited CPU 116 978 42 42
George Weston Foods Limited WEG 106 967 30 30
Hills Motorway Group HLY 89 902 41 143
Macquarie Infrastructure Group MIG 81 976 70 469
Argo Investments Limited ARG 79 795 52 154
Jupiters Limited JUP 79 718 72 305
PowerTel Limited PWT 79 538 77 374
Advance Property Fund APF 72 656 30 30
Aristocrat Leisure Limited ALL 71 563 63 301
Incitec Limited ICT 69 418 65 195
Schroders Property Fund ADP 56 56 56 56
Foodland Associated Limited FOA 55 329 54 225
Prime Industrial Property Trust IIF 53 505 42 42
Harvey Norman Holdings Limited HVN 51 267 42 42
AMP Shopping Centre Trust ART 30 30 30 30
Washington H. Soul Pattinson and Company Limited
SOL 26 139 26 72
National Mutual Property Trust DDF 14 58 12 12
Mobile Communications Holdings Limited MBC 12 12 12 12

163
Appendix 4
Social network analysis (SNA) – background and development
Definition
Social network analysis is a methodology to conceptualise and analyse social
relations (De Nooy, 2005). It focuses on relationships and structure between actors;
whether they are human groups, communities, organisations, markets, society, or the
whole world system. Social network analysts assume that interpersonal ties between
people matter, as do ties among organisations or countries, because they transmit
behaviour, attitudes, information, or resources.
Social relations, or ties between actors, can develop into complex networks of
relationships. The simplest network comprises ties between two actors, this is
referred to as a dyad, see Figure 6-1. A dyad is the foundation of SNA as all
networks can be decomposed into rows of dyads.
Figure 6-1 The dyad – a simple undirected network
SNA - history and development
SNA had its origins from three quite distinct sources; social psychology and group
dynamics (Kohler, 1925), studies of personal relationships and cliques (Mayo, 1933)
and in anthropological studies of tribal and village societies (Barnes, 1954).
However, it was not until the 1960’s when mathematical graph theory and other
mathematical models were applied to the concept that SNA became firmly
established as a method of structural analysis (Scott, 1991b). SNA has emerged as a
set of methods which can be used to analyse social structures and is specifically
geared to investigating the relational aspects of these structures (Scott, 1991b).
The dyad….a simple undirected network. Actor A Actor B
164
SNA was largely exploratory up to the mid 1990’s. However more recently, major
advances in computer based tools such as Netdraw, UCINET, and Pajek, have
enabled whole networks (as the unit of analysis) to be analysed due to enhanced
metrics for understanding network configurations.
Network analysis - SNA applications and measures
A network is a set of actors (vertices) that are connected by a set of lines or ties
between the actors. The ties may be directed or undirected39
• Network concepts and conventions have been defined through graph theory
(a branch of mathematics) and applied to social network analysis. Network
graphs may contain additional information relating to the actors (relevant to
the network being described) and this is generally recorded on the lines.
Also, where there is sociometric choice in the network (where choices may
not be reciprocated) this is normally represented by directed lines. For
example, if actor A chooses actor B this does not imply that B also chooses
actor A (De Nooy, 2005).
. Undirected ties imply
that the direction of the connection or flow between the actors is of no significance;
it is the existence of the tie that is important. If actor A knows (or is related to) actor
B, then actor B also knows actor A. When analysing just the network structure, the
strength or attributes of the relation are not considered, and therefore undirected ties
are appropriate. The simplest network is a relation between two actors, this is the
dyad.
SNA has become an invaluable tool with sociology in an attempt to better
understand and predict human behaviours (Scott, 1991b). Characteristics of the
network are important indicators of how relations among the actors function. There
are various network topologies including stars, circles, lines, cliques and bridges that
can describe the nature of communications within a network. SNA has developed a
range of measures that can be used to classify the nature of relationships between
people in a group, organisation or society.
39 Direction is usually indicated in a network graph by an arrowhead on the appropriate line, the direction of the arrowhead indicating the direction of the relation (Scott, 1991b).

165
A number of network measures have been developed in Social Network Analysis
(SNA) (Scott, 2000) to analyse, classify and describe network structure attributes
and their cohesion. These measures are of two main types; whole of network
measures and network attribute measures. Whole of network measures are useful
when comparing two networks and will highlight structural differences between the
networks, whereas attribute measures are relevant to describing the network under
review. SNA measures are summarised in Appendix 5.
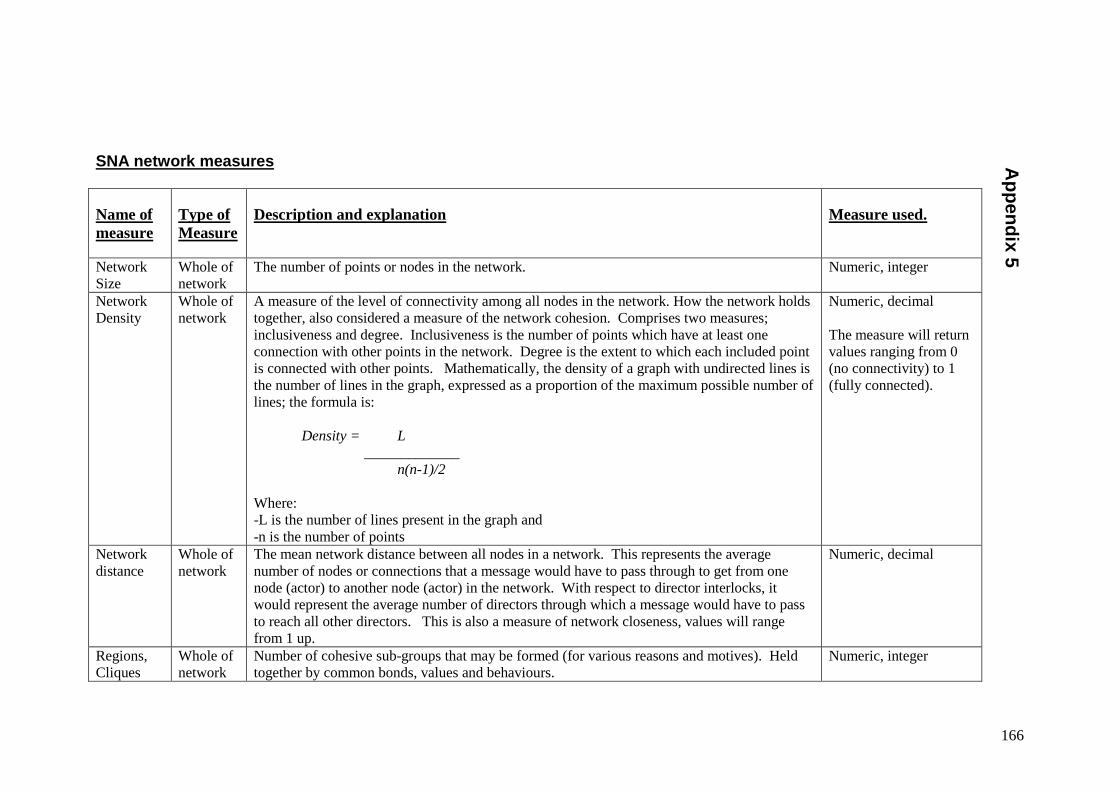
166
SNA network measures
Name of measure
Type of Measure
Description and explanation Measure used.
Network Size
Whole of network
The number of points or nodes in the network. Numeric, integer
Network Density
Whole of network
A measure of the level of connectivity among all nodes in the network. How the network holds together, also considered a measure of the network cohesion. Comprises two measures; inclusiveness and degree. Inclusiveness is the number of points which have at least one connection with other points in the network. Degree is the extent to which each included point is connected with other points. Mathematically, the density of a graph with undirected lines is the number of lines in the graph, expressed as a proportion of the maximum possible number of lines; the formula is: Density = L _____________ n(n-1)/2 Where: -L is the number of lines present in the graph and -n is the number of points
Numeric, decimal The measure will return values ranging from 0 (no connectivity) to 1 (fully connected).
Network distance
Whole of network
The mean network distance between all nodes in a network. This represents the average number of nodes or connections that a message would have to pass through to get from one node (actor) to another node (actor) in the network. With respect to director interlocks, it would represent the average number of directors through which a message would have to pass to reach all other directors. This is also a measure of network closeness, values will range from 1 up.
Numeric, decimal
Regions, Cliques
Whole of network
Number of cohesive sub-groups that may be formed (for various reasons and motives). Held together by common bonds, values and behaviours.
Numeric, integer
Appendix 5

167
Name of measure
Type of Measure
Description and explanation Measure used.
and Clusters (blocks) Degree/ Point centrality
Single network
The total number of lines that emanate to or from any node. That is the total number of ties between the node (actor) and all other nodes (actors) in the network. Degree is also referred to as ‘Point Centrality’ is a measure of the ‘local centrality’ of a point on the graph, it is a degree based measure calculated based on the number of points to which it adjacent or connected at distance 1 (ignoring any indirect ties). Point centrality is a measure of how well the point is connected within its local environment. A comparison of point centrality scores can be meaningfully made among the members of the same graph or between graphs which are of the same size (Scott, 1991)
Numeric, integer
Indegree (node)
Single network
The total number of other nodes in the network that have lines directed towards the node, where the ties between the nodes are directed.
Numeric, integer
Outdegree (node)
Single network
The total number of lines directed from the node to all other nodes in the network, where the ties between the nodes are directed.
Numeric, integer
Centrality/ Global centrality
Single network
Nodes in a network that have the shortest path-lengths (geodesics) to all other nodes in the network. It is concerned with path-lengths on a graph that connect any two or pair of points. (Freeman, 1979) refers to this as the ‘closeness’ of the points. A person located in the centre of a star (or a wheel) is assumed to be structurally more central than any other person the network. A point is globally central if it lies at the short distance from all other points. The reciprocal of this also holds that a point with the greatest sum distances is the most isolated or peripheral.
Numeric, integer Sum of all path-lengths (geodesic distances) from each node to all other nodes in the network. The node with the lowest sum distance is the most globally central point.
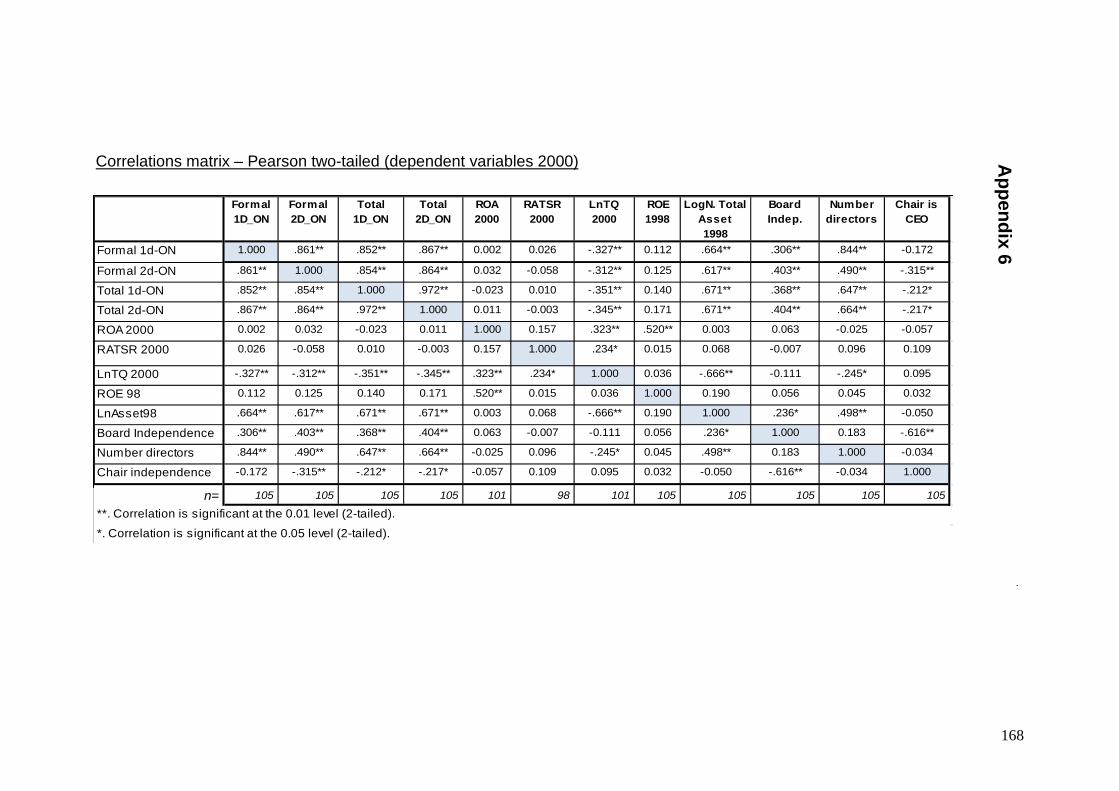
168
Formal 1D_ON
Formal 2D_ON
Total 1D_ON
Total 2D_ON
ROA 2000
RATSR 2000
LnTQ 2000
ROE 1998
LogN. Total Asset 1998
Board Indep.
Number directors
Chair is CEO
Formal 1d-ON 1.000 .861** .852** .867** 0.002 0.026 -.327** 0.112 .664** .306** .844** -0.172
Formal 2d-ON .861** 1.000 .854** .864** 0.032 -0.058 -.312** 0.125 .617** .403** .490** -.315**
Total 1d-ON .852** .854** 1.000 .972** -0.023 0.010 -.351** 0.140 .671** .368** .647** -.212*
Total 2d-ON .867** .864** .972** 1.000 0.011 -0.003 -.345** 0.171 .671** .404** .664** -.217*
ROA 2000 0.002 0.032 -0.023 0.011 1.000 0.157 .323** .520** 0.003 0.063 -0.025 -0.057
RATSR 2000 0.026 -0.058 0.010 -0.003 0.157 1.000 .234* 0.015 0.068 -0.007 0.096 0.109
LnTQ 2000 -.327** -.312** -.351** -.345** .323** .234* 1.000 0.036 -.666** -0.111 -.245* 0.095
ROE 98 0.112 0.125 0.140 0.171 .520** 0.015 0.036 1.000 0.190 0.056 0.045 0.032
LnAsset98 .664** .617** .671** .671** 0.003 0.068 -.666** 0.190 1.000 .236* .498** -0.050
Board Independence .306** .403** .368** .404** 0.063 -0.007 -0.111 0.056 .236* 1.000 0.183 -.616**
Number directors .844** .490** .647** .664** -0.025 0.096 -.245* 0.045 .498** 0.183 1.000 -0.034
Chair independence -0.172 -.315** -.212* -.217* -0.057 0.109 0.095 0.032 -0.050 -.616** -0.034 1.000
n= 105 105 105 105 101 98 101 105 105 105 105 105
**. Correlation is significant at the 0.01 level (2-tailed).
*. Correlation is significant at the 0.05 level (2-tailed).
Correlations matrix – Pearson two-tailed (dependent variables 2000) Appendix 6
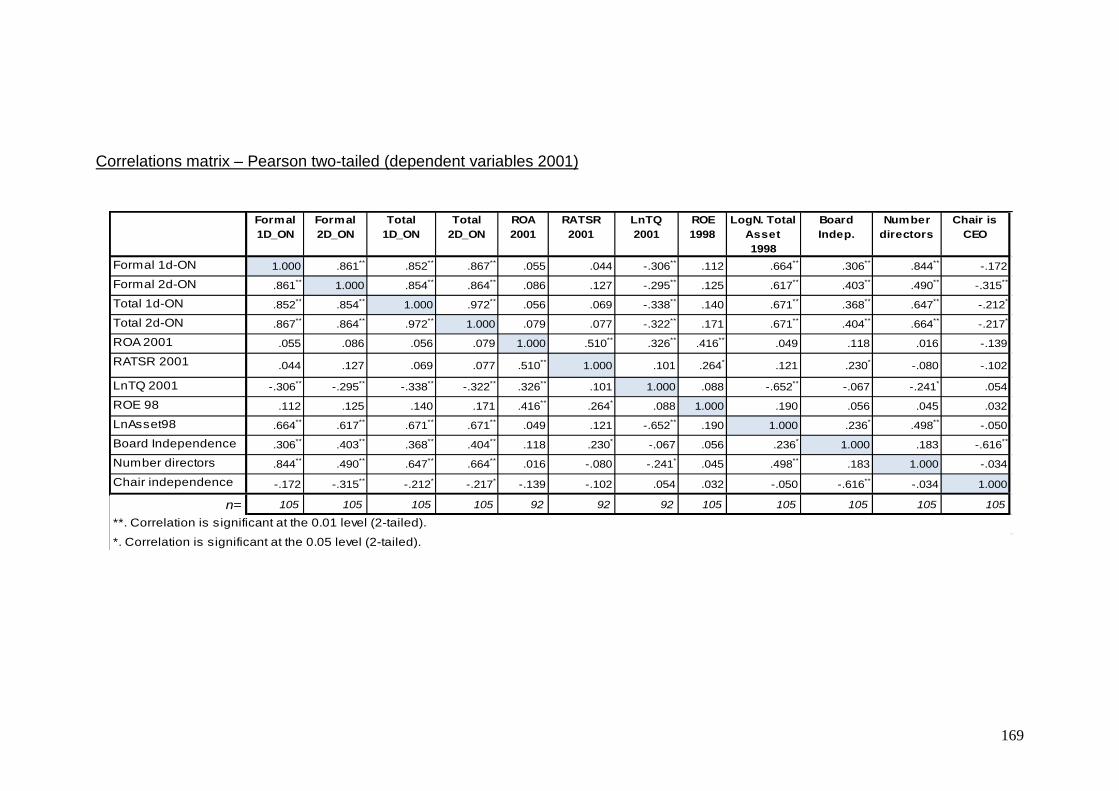
169
Formal 1D_ON
Formal 2D_ON
Total 1D_ON
Total 2D_ON
ROA 2001
RATSR 2001
LnTQ 2001
ROE 1998
LogN. Total Asset 1998
Board Indep.
Number directors
Chair is CEO
Formal 1d-ON 1.000 .861** .852** .867** .055 .044 -.306** .112 .664** .306** .844** -.172
Formal 2d-ON .861** 1.000 .854** .864** .086 .127 -.295** .125 .617** .403** .490** -.315**
Total 1d-ON .852** .854** 1.000 .972** .056 .069 -.338** .140 .671** .368** .647** -.212*
Total 2d-ON .867** .864** .972** 1.000 .079 .077 -.322** .171 .671** .404** .664** -.217*
ROA 2001 .055 .086 .056 .079 1.000 .510** .326** .416** .049 .118 .016 -.139
RATSR 2001 .044 .127 .069 .077 .510** 1.000 .101 .264* .121 .230* -.080 -.102
LnTQ 2001 -.306** -.295** -.338** -.322** .326** .101 1.000 .088 -.652** -.067 -.241* .054
ROE 98 .112 .125 .140 .171 .416** .264* .088 1.000 .190 .056 .045 .032
LnAsset98 .664** .617** .671** .671** .049 .121 -.652** .190 1.000 .236* .498** -.050
Board Independence .306** .403** .368** .404** .118 .230* -.067 .056 .236* 1.000 .183 -.616**
Number directors .844** .490** .647** .664** .016 -.080 -.241* .045 .498** .183 1.000 -.034
Chair independence -.172 -.315** -.212* -.217* -.139 -.102 .054 .032 -.050 -.616** -.034 1.000
n= 105 105 105 105 92 92 92 105 105 105 105 105
**. Correlation is significant at the 0.01 level (2-tailed).
*. Correlation is significant at the 0.05 level (2-tailed).
Correlations matrix – Pearson two-tailed (dependent variables 2001)
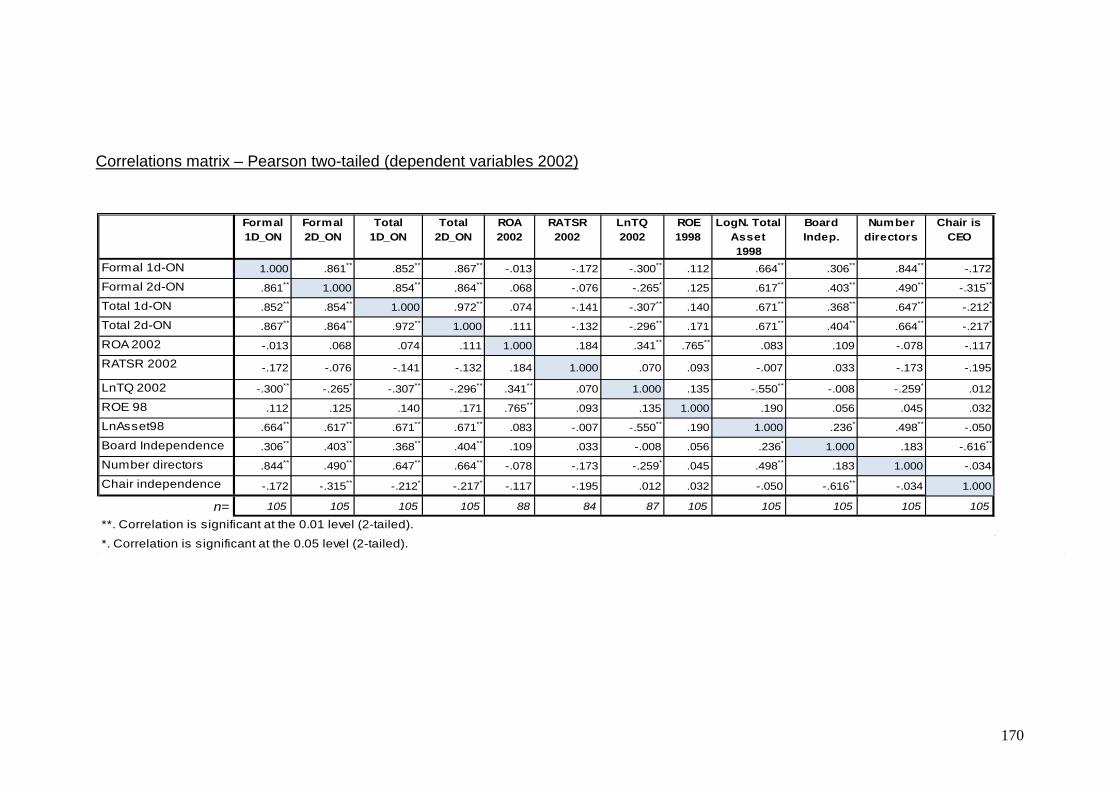
170
Formal 1D_ON
Formal 2D_ON
Total 1D_ON
Total 2D_ON
ROA 2002
RATSR 2002
LnTQ 2002
ROE 1998
LogN. Total Asset 1998
Board Indep.
Number directors
Chair is CEO
Formal 1d-ON 1.000 .861** .852** .867** -.013 -.172 -.300** .112 .664** .306** .844** -.172
Formal 2d-ON .861** 1.000 .854** .864** .068 -.076 -.265* .125 .617** .403** .490** -.315**
Total 1d-ON .852** .854** 1.000 .972** .074 -.141 -.307** .140 .671** .368** .647** -.212*
Total 2d-ON .867** .864** .972** 1.000 .111 -.132 -.296** .171 .671** .404** .664** -.217*
ROA 2002 -.013 .068 .074 .111 1.000 .184 .341** .765** .083 .109 -.078 -.117
RATSR 2002 -.172 -.076 -.141 -.132 .184 1.000 .070 .093 -.007 .033 -.173 -.195
LnTQ 2002 -.300** -.265* -.307** -.296** .341** .070 1.000 .135 -.550** -.008 -.259* .012
ROE 98 .112 .125 .140 .171 .765** .093 .135 1.000 .190 .056 .045 .032
LnAsset98 .664** .617** .671** .671** .083 -.007 -.550** .190 1.000 .236* .498** -.050
Board Independence .306** .403** .368** .404** .109 .033 -.008 .056 .236* 1.000 .183 -.616**
Number directors .844** .490** .647** .664** -.078 -.173 -.259* .045 .498** .183 1.000 -.034
Chair independence -.172 -.315** -.212* -.217* -.117 -.195 .012 .032 -.050 -.616** -.034 1.000
n= 105 105 105 105 88 84 87 105 105 105 105 105
**. Correlation is significant at the 0.01 level (2-tailed).
*. Correlation is significant at the 0.05 level (2-tailed).
Correlations matrix – Pearson two-tailed (dependent variables 2002)
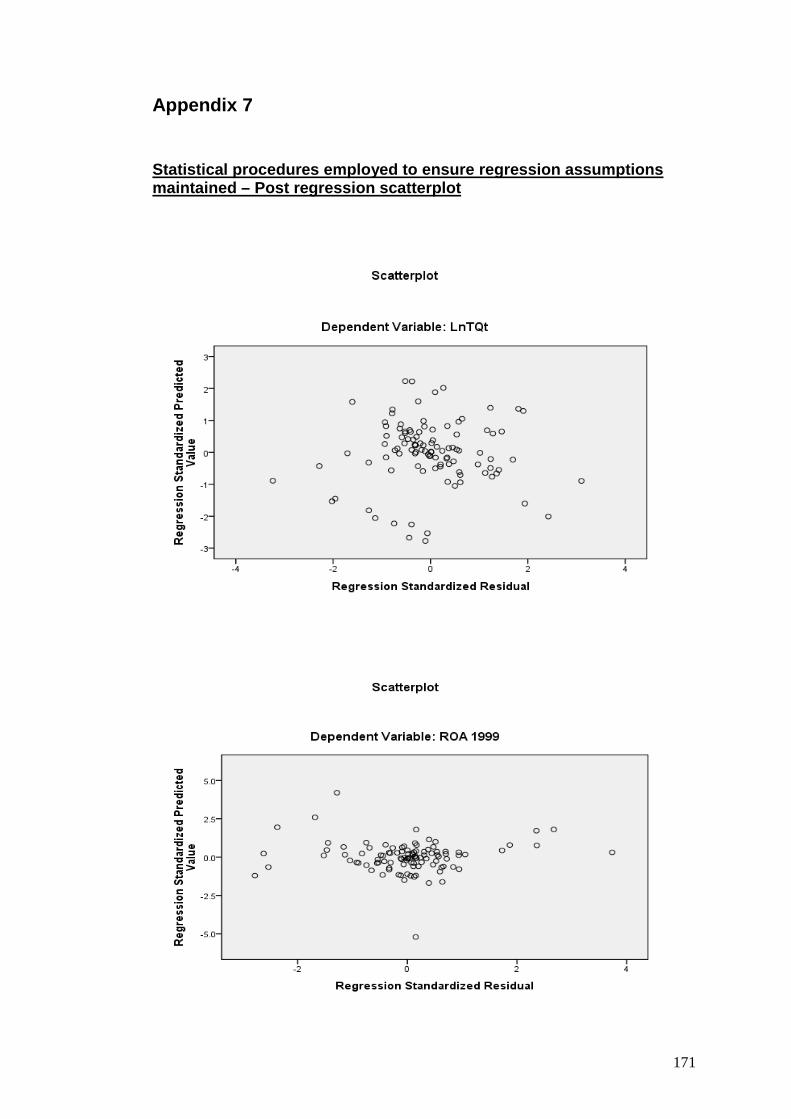
171
Appendix 7
Statistical procedures employed to ensure regression assumptions maintained – Post regression scatterplot
172
References Adler, P. S., & Kwon, S. W. (2002). Social capital: Prospects for a new concept.
Academy of Management Review, 27(1), 17-40.
Aglietta, M. (2008). Corporate Governance and the long run investor. International Review of Applied Economics, 22(4), 407-427.
Ahuja. (2000). The duality of collaboration: Inducements and opportunities in the formation of interfirm linkages. Strategic Management Journal, 21, 317-343.
Al Zeera, Z. (2001). Wholeness and holiness in education: An Islamic perspective. Herndon, VA: International Institute of Islamic Thought.
Aldrich, H. (1979). Organizations and environments Englewood Cliffs, NJ: Prentice Hall.
Aldrich, H., & Pfeffer, J. (1976). Environments of organizations. Annual Review of Sociology, 2, 79-105.
Ancona, D. G., & Caldwell, D. F. (1992(a)). Demography and design: predictors of new product team performance. Organisation Science, 3, 321-341.
Anderson, D. W., Melanson, S. J., & Maly, J. (2007). The Evolution of Corporate Governance: power distribution brings boards to life. Corporate Governance: An International Review, 15(5), 780-797.
ASX, C. G. C. (2007). Principles and Recommendations of Corporate Governance (2nd ed.). Sydney: ASX.
Bainbridge, S. M. (2003). Director Primacy: The means and Ends of Corporate Governance. Northwestern University Law review, 97(2), 547-606.
Baker, W. (1990). Market networks and corporate behaviour. American Journal of Sociology, 96, 589-625.
Ball, R., Brown, P., Finn, F. J., & Officer, R. R. (1989). Share markets and portfolio theory (2nd ed.). St. Lucia, Queensland: University of Queensland Press.
Barnes, J. (1954). Class and Committee in a Norwegian Islands Parish. Human Relations, 7.
Barney, J. (1991). Firm resources and sustained competitive advantage. Journal of Management, 17, 99-120.
Baysinger, B. D., & Butler, H. D. (1985). Corporate Governance and the board of directors: performance effects of changes in board composition. Journal of Law, Economics and Organisation, 1, 101 -124.
Berle, A., & Means, G. (1932). The Modern Corporation and Private Property. New York: MacMillan.

173
Bhagat, S., & Black, B. (1999). The uncertain relationship between board composition and firm value. Business Lawyer, 54, 921-963.
Blau, P. M. (1964). Exchange and power in social life. New York: Wiley.
Blau, P. M. (1968). Interaction: social exchange. New York: Free Press and MacMillan.
Boisot, M. (1995). Information space: A framework for learning in organisations, institutions and culture. London: Routledge.
Bonn, I. (2004). Board Structure and Firm Performance: Evidence from Australia. Journal of the Australian and New Zealand Academy of Management, 10(1), 14-24.
Bosch, H. (1995). The director at risk ; accountability in the boardroom. Melbourne: Pitman Publishing.
Bourdieu, P. (1977). Outline of a theory of practice. Cambridge, England: Cambridge Un iversity Press.
Bourdieu, P. (1986). The forms of capital In J. G. Richardson (Ed.), Handbook of theory and research for the sociology of education: (pp. 241-258). New York Greenwood.
Brass, D. J., Galaskiewicz, J., Greve, H. R., & Tsai, W. P. (2004). Taking stock of networks and organizations: A multilevel perspective. Academy of Management Journal, 47(6), 795-817.
Brickley, J. A., Coles, J. L., & Jarrell, J. (1997). Leadership structure: seperating the CEO and Chairman of the board. Journal of Corporate Finance, 3(3), 189-220.
Burt, R. S. (1980b). Coopitve corporate actor networks; A reconsideration of interlocking directorates involving Americam manufacturing. Administrative Science Quarterly, 25, 557-582.
Burt, R. S. (1983). Corporate Profits and Cooptation. New York: Academic.
Burt, R. S. (1992). Structural holes: The social structure of competition. Cambridge, M.A: Harvard University Press.
Burt, R. S. (1997). A note on social capital and network content. Social Networks, 19, 355-373.
Burt, R. S. (2005). Brokerage & Closure: An introduction to social capital. Melbourne: Oxford Press.
Carrington, P. (1981). Horizontal co-optation through corporate interlocks. University of Toronto, Toronto, Canada.
Carroll, R. (1990).

174
Carroll, R., Stening, B., & Stening, K. (1990). Interlocking directorships and the law in Australia. Company and Securities Law Journal, 8, 290-302.
Cavana, R. Y., Delahaye, B. A., & Sekaran, U. (2001). Applied Business Research: Qualitative and Quantitative Methods. Brisbane: John Wiley & Sons Australia, Ltd.
Centre for Research in Finance, A. G. S. M. (2007). Risk Measurement Service Introduction. In C. f. R. i. F. Australian Graduate School of management (Ed.). Canberra: AGSM.
Centre for Research in Finance, A. G. S. M. (2007). Share Price and Price Relatives Database (Notes). Sydney: Australian Graduate School of Management, UNSWo. Document Number)
Chung, K. H., & Pruitt, S. W. (1994). A simple approximation of Tobin's q. Financial Management, 23, 70-74.
Churchland, P. M. (1979). Scientific realism and the plasticity of mind. Cambridge: Cambridge University Press.
Cicourel, A. V. (1973). Cognitive sociology. Harmondsworth, England: Penguin Books.
Coakes, S. J., Steed, L., & Price, J. (2008). SPSS: Analysis without Anguish: version 15.0 for Windows Australia: Wiley.
Coleman, J. S. (1988). Social Capital in the creation of human capital. American Journal of Sociology, 94, 95-120.
Coleman, J. S. (1990). Foundations of social theory. Cambridge, MA: Belknap Press of harvard University Press.
Collier, B. (2003). Current Corporate Governance Issues An ASIC perspective. Paper presented at the N.T. Chapter of the Business & Professional Women's Association.
Cook, J. (2003). Corporate and Director Interlocks in The USA: 2003. The Corporate Library, September(2003 ).
Coolican, H. (1990). Research Methods and Statistics in Psychology. London: Hodder and Stoughton.
Coulton, J., & Taylor, S. (2004). Directors' duties and corporate governance: Have we gone to far? Australian Accounting Review, 14(1), 17-24.
Da Silva Rosa, R., Etheridge, D., & Izan, H. Y. (2008). Director Interlocking: What we know and what we are yet to learn. Paper presented at the AFAANZ 2008.
175
Daily, C. M., & Dalton, D. R. (1993). Board of directors leadership and structure: Control and performance implications. Entrepreneurship: Theory and Practice, 17, 65-81.
Daily, C. M., Dalton, D. R., & Cannella, A. A. J. (2003). Corporate Governance: Decades of Dialogue and Data. Academy of Management Review, 28(3), 371-382.
Daily, C. M., Johnson, J. L., & Dalton, D. R. (1999). On the measurements of board composition: Poor consistency and a serious mismatch of theory and operationalisation Decision Sciences, 30, 83-106.
Dalton, D. R., Daily, C. M., Ellstrand, A. E., & Johnson, J. L. (1998). Meta-analytic reviews of board composition, leadership structure, and financial performance. Strategic Management Journal, 19(3), 269-290.
Dalton, D. R., Daily, C. M., Ellstrand, A. E., & Johnson, J. L. (1999). Number of directors and financial performance: A meta-analysis. Academy of Management Journal, 42, 674-686.
Davis, G. F. (1991). Agents without Principles? The spread of the poison pill through the intercorporate network. Administrative Science Quarterly, 36, 583-613.
Dobson, P. J. (2002). Critical realism and information systems research: Why bother with philosophy? Information Research - An International Electronic Journal, 7(2).
Donaldson, L. (1990). The ethereal hand : organisation economics and management theory. The Academy of Management, 15(3), 369-381.
Donaldson, L., & Davis, J. H. (1994). Boards and Company Performance - Research Challenges the Conventional Wisdom. Corporate Governance: An International Review, 2, 151-160.
Drever, M., Stanton, P., & McGowan, S. (2007). Contemporary Issues in Accounting. Brisbane, Australia: John Wiley & Sons Australia Ltd.
Eisenhardt, K. M. (1989). Agency Theory: An Assessment and Review. Academy of Management Review, 14(1), 57-74.
Fama, E. F. (1980). Agency problems and the theory of the firm. Journal of Political Economy, 88, 288-307.
Fama, E. F. (1998). Market efficiency, long term returns, and behavioural finance. Journal of Financial Economics, 49, 283-306.
Fama, E. F., & Jensen, M. C. (1983). Separation of ownership and control. Journal of law and Economics, 26, 301-325.
Field, A. (2009). Discovering Statistics using SPSS. London: Sage.

176
Fisher, F. M. (1988). Accounting Data and the Economic Performance of Firms. Journal of Accounting and Public Policy, 7(1988), 253-260.
Fligstein, N., & Brantley, P. (1992). Bank control, owner control, or organisational dynamics: Who controls the large modern corporation? American Journal of Sociology, 98, 280-307.
Fosberg, R. (1989). Outside directors and managerial monitoring. Akron Business and Economic Review, 20(Summer), 24-32.
Fukuyama, F. (1995). Trust: Social virtues and the creation of prosperity. London: Hamish Hamilton.
Galaskiewicz, J. (1985). Interorganizational relations. Annual Review of Sociology, 11, 281-304.
Galaskiewicz, J., & Burt, R. (1991). Interorganizational contagion in corporate philanthropy. Administrative Science Quarterly, 36, 88-105.
Gillan, S. L. (2006). Recent Developments in Corporate Goverance: An Overview. Journal of Corporate Finance, 12, 381-402.
Gillan, S. L., & Starks, L. T. (1998). A survey of shareholder activism: motivation and empirical evidence. Contemporary Finance Digest, 2(3), 10-34.
Goyal, V. K., & Park, C. W. (2002). Board leadership structure and CEO turnover. Journal of Corporate Finance, 8, 49-66.
Granovetter, M. S. (1973). The strenght of weak ties. American Journal of Sociology, 78, 1360-1380.
Granovetter, M. S. (1985). Economic action and social structure: the problem of embeddedness. American Journal of Sociology, 91, 481-510.
Granovetter, M. S. (1992). Problems of explanation in economic sociology. In N. Nohria & R. Eccles (Eds.), Networks and organisations: Structure, form and action (pp. 25-56). Boston: Harvard Business School Press.
Hair, J. F., Jr., Anderson, R. E., Tatham, R. L., & Black, W. C. (1998). Multivariate data analysis (5th ed.). Upper Saddle River, NJ: Prentice-Hall International
Healy, M., & Perry, C. (2000). Comprehensive criteria to judge validity and reliability of qualitative research within the realism paradigm. Qualitative Market Research - An International Journal, 3(3), 118-126.
Healy., & Palepu. (2001). Information asymmetry, corporate disclosure, and the capital markets: A review of the empirical disclosure literature. Journal of Accounting & Economics, 31(2001), 405-440.
Hendry, J. (2002). The Principal's Other Problems: Honest Incompetence and the Specification of Objectives. Academy of Management Review, 27(1), 98-113.

177
Hermalin, B. E., & Weisbach, M. S. (1988). The determinants of board composition. RAND Journal of Economics, 19(589-606).
Hillman, A., & Dalziel, T. (2003). Boards of Directors and Firm Performance: Integrating Agency and Resource Dependence Perspectives, Acad. Mgmt. Rev. (Vol. 28, pp. 385).
Huse, M. (2007). Boards, Governance and Value Creation. Melbourne: Cambridge University Press.
Jacobs, J. (1965). The death and life of great American cities. London: Penguin Books.
Jensen, M. C., & Meckling, W. H. (1976). Theory of the firm: Managerial Behaviour, agency costs and ownership structure. Journal of Financial Economics, 3, 305-360.
Johnson, J. L., Daily, C., M., & Ellstrand, A. E. (1996). Boards of Directors: A Review and Research Agenda, J. MGMT (Vol. 22, pp. 411).
Judge, W. Q., & Zeithaml, C. P. (1992). Institutional and strategic choice perspectives on board involvement in the strategic decision process. Academy of Management Journal 35(766-794).
Kasa, K. (1992). Common Stochastic Trends in International Stock markets. Journal of Monetary Economics, 29, 95-125.
Kiel, G. C., & Nicholson, G. J. (2003). Board Composition and Corporate Performance: how the Australian experience informs contrasting theories of corporate governance. Blackwell Publishing Ltd., 11(3), 189-205.
Kim, Y. (2005). Board Network Characteristics and Firm Performance in Korea. Corporate Governance: An International Review, 13(6), 800-808.
Kogut, B., & Zander, U. (1996). What do firms do? Coordination, identity and learning. Organisational Science 7, 502-518.
Kohler, W. (1925). The Mentality of Apes. New York.
Krauss, S. E. (2005). Research Paradigms and Meaning Making: A Primer. The Qualitative Report 10(4), 758-770.
Lang, J. R., & Lockhart, D. E. (1990). Increased environmental uncertainty and changes in board linkage patterns. The Academy of Management Journal, 33, 106-128.
Lawrence, J., & Stapledon, G. (1999a). Do Independent Directors Add Value? ,
Lawrence, J., & Stapledon, G. (1999b). Do Independent Directors Add Value? Centre for Corporate Law and Securities Regulation, University of Melbourne.

178
Lewicki, R. J., & Bunker, B. B. (1996). Developing and maintaining trust in in work relationships. In R. M. Kramer & T. M. Tyler (Eds.), Trust in organisations: Frontiers of theory and research: (pp. 114-139). Thousand Oaks, CA: Sage.
Lin, N. (1999). Social Networks and Status Attainment. Annual Review of Sociology, 25, 467-487.
Lincoln, Y., & Guba, E. (1985). Naturalistic inquiry. Thousand Oaks, CA: Sage.
Lipton, P. (2003). The demise of HIH: corporate governance lessons. Keeping Good Companies(June), 273-277.
Loury, G. C. (1977). A dynamic theory of racial income differences. In P. A. Wallace & A. M. LaMonde (Eds.), Women , minorities and employment discrimination (pp. 153-186). MA: lexington Books.
Lythcott, J., & Duschl, R. (1990). Qualitative research: From methods to conclusions. Science Education, 74, 449-460.
MacAvoy, P. W., & Millstein, I. M. (1999). The active board of directors and its effect on the value of the large publicly traded corporation Journal of Applied Corporate Finance, 11, 8-20.
Mace, M. L. (1971). Directors: Myth and Reality. Boston: Harvard Business School.
Mayo, E. (1933). The Human Problems of an Industrial Civilization. Cambridge, MA: Macmillan.
Meeusen, W., & Cuyvers, L. (1985). The interaction between interlocking directorships and the economic behaviour of companies. In F. N. Stockman, R. Ziegler & J. Scott (Eds.), Networks of Corporate Power (pp. 45-72). Cambridge: Polity.
Mintz, B., & Schwartz, M. (1985). The Power Structure of American Business. Chicago: University of Chicago Press.
Mizruchi, M. S. (1992). The Structure of Corporate Political Action Cambridge: Harvard University Press.
Mizruchi, M. S. (1996). What Do Interlocks Do? An Analysis, Critique, and Assessment of Research on Interlocking Directorates, ANN. REV. SOC (Vol. 22, pp. 273).
Mizruchi, M. S., & Koenig, T. (1986). Economic sources of corporate political consensus: an examination of interindustry relations. American Sociology Review, 51, 482-491.
Mizruchi, M. S., & Stearns, L. B. (1988). A longitudinal study of the formation of interlocking directorates. Administrative Science Quarterly, 39, 118-140.
Mizruchi, M. S., & Stearns, L. B. (1994). A longitudinal study of borrowing by large American corporations Administrative Science Quarterly, 39, 118-140.
179
Murray, G. (2001). Interlocking Directorates: What do they tell us about Corporate Power in Australia? Journal of Australian Political Economy, 47(2001), 5-27.
Muth, M. M., & Donaldson, L. (1998). Stewardship Theory and Board Structure: A Contingency Approach. Corporate Governance: An International Review, 6(1), 5-28.
Nahapiet, J., & Ghoshal, S. (1998). Social capital, Intellectual capital, and the organisational advantage. The Academy of Management Review, 23(2), 242.
Neuman, W. L. (1997). Social Research Methods: Qualitative and Quantitative approaches Approaches (3rd. ed.). Boston: Allyn and Bacon.
Nicholson, G. J., Alexander, M., & Kiel, G. C. (2004). Defining the Social Capital of the Board of Directors: An Exploratory Study. Journal of Australian New Zealand Academy of Management, 10(1), 54-72.
Nicholson, G. J., & Kiel, G. C. (2007). Can Directors Impact Performance? A case-based test of three theories of corporate governance. 15(4).
Officer, R. R. (1989). Rates of Return to Shares, Bond Yields and Inflation Rates: A Historical Perspective. In R. Ball, P. Brown, F. J. Finn & R. R. Officer (Eds.), Share Markets and Portfolio Theory, 2nd edition. Brisbane: University of Queensland Press.
Orr, J. (1990). Sharing knowledge, celebrating identity: Community memory in a service culture. In D. Middleton & D. Edwards (Eds.), Collective remembering (pp. 169-189). London: Sage.
Penning, J. M. (1980). Interlocking directorates: Origins and consequences of connections among organizations' boards of directors.
Perry, C. (1998). A structured approach to presenting research thesis. Australian Marketing Journal 6(1), 63-86.
Pettigrew, A. M. (1992). On studying managerial elites. Strategic Management Journal, 13, 163-182.
Pfeffer, J. (1972). Size and composition of corporate boards of directors: The organization and its environment. Administrative Science Quarterly, 17, 218-228.
Pfeffer, J., & Salancik, G. R. (1978). The external control of organisations: A resource dependance perspective. New York: Harper & Row.
Pfeffer, J., & Salancik, G. R. (2003). The External Control of Organizations: A Resource Dependence Perspective. CA: Stanford University Press.
Psaros, J. (2009). Australian Corporate Governance: a review and analysis of key issues. New South Wales: Pearson.

180
Putman, R. D. (1993). The prosperouus community: Social capital and public life. American Prospect, 13, 35-42.
Putman, R. D. (1995). Bowling alone: America's declining social capital. Journal of democracy, 6, 65-78.
Pye, A. (2002). The changing power of 'explanations': Directors, academics and their sensemaking from 1989 to 2000. Journal of Management Studies, 39(7).
Roberts, J., & McNulty, T. (2005). Beyond agency conceptions of the work of the non-executive director: creating accountability in the boardroom. . British Journal of Management, 16(Special Edition), s5-s26.
Roy, M. R., Fox, M. A., & Hamilton, R. T. (1994). Board Size and Potential Corporate and Director Interlocks in Australasia 1984-1993. Australian Journal of Management, 19(2), 201-212.
Sandefur, R. L., & Laumann, E. O. (1998). A paradigm for social capital. Rationality and Society, 10, 481-501.
Saunders, M., Lewis, P., & Thornhill, A. (2003). Research methods for business students. Harlow, England: Prentice Hall.
Scott, J. (1991a). Networks of Corporate Power: A Comparative Assessment. Annual Review of Sociology, 17, 181-203.
Scott, J. (1991b). Social Network Analysis. London: Sage Publications
Scott, W. R. (2003). Financial Accounting Theory. Toronto, Canada: Pearson Education.
Selznick, P. (1949). TVA and the Grass Roots. New York: Harper & Row.
Shleifer, A., & Vishny, R. W. (1997). A Survey of Corporate Governance. The Journal of Finance, LII(2), 737-783.
Smith, A. (1776). An inquiry into the Nature and Causes of the Wealth of Nations. . London: George Routledge and Sons.
Sonnenfeld, J., A. . (2004). Good Governance and the Misleading Myths of Bad Metrics. The Academy of Management Executive, 18(1), 108.
Stock, J. H., & Watson, M. W. (2007). Introduction to Econometrics (2nd ed.). Boston: Pearson Education
Tabachnick, B. G., & Fidell, L. S. (2001). Using Multivariate Statistics (4th ed.). Boston: Allyn and Bacon.
Ticehurst, G. W., & Veal, A. J. (1999). Business Research Methods: A Managerial Approach: Addison Wesley Longman Australia Pty. Ltd.

181
Tobin, J. (1969). A general equilibrium approach to monetary theory. Journal of Money, Credit and Banking, 1, 15-29.
Useem, M. (1984). Inner Circle: Large corporations and the rise of business political activity in the U.S. and U.K. Oxford: Oxford University Press.
Wernerfelt, B. (1984). A resource-based view of the firm. Strategic Management Journal, 5(2), 171-180.
Westphal, J. D., & Zajac, E. J. (1998). The Symbolic Management of Stockholders: Corporate Governance Reforms and Shareholder Reactions. Administrative Science Quarterly, 43(1998), 127-153.
Yermack, D. (1996). Higher market valuation of companies with a small board of directors. Journal of Financial Economics, 40, 185-211.
Zahra, S. A., & Pearce, J. A., II. (1989). Boards Of Directors And Corporate Financial Performance: A. Journal of Management, 15(2), 291.
Zajac, E. J. (1988). Interlocking directorates as an interorganizational strategy: A test of critical assuptions. Academy of Management Journal, 31, 428-438.
Zajac, E. J., & Westphal, J. D. (2004). The Social Construction of Market Value: Institutionalization and Learning Perspectives on Stock Market Reactions. American Sociological Review, 69(3), 433-457.
Zald, M. (1967). Urban differentiation, characteristics of boards of directorsand organisational effectiveness. American Journal of Sociology, 73, 261-272.
Zikmund, W. G. (2003). Business Research Methods (7th. ed.). Australia: Thompson South Western.
Top Related