


Languages
Pages
Legal


Working Paper 2014-09
Distribution and types of multiple chronic conditions in Korea
Young-Ho Jung, Sukja Ko

Distribution and types of multiple chronic conditions in Korea
Young-Ho Jung, Research Fellow
ⓒ 2014Korea Institute for Health and Social Affairs
All rights reserved. No Part of this book may be reproduced in any form without permission in writing from the publisher
Korea Institute for Health and Social AffairsJinhungro 235, Eunpyeong-gu, Seoul 122-705, Koreahttp://www.kihasa.re.krISBN: 978-89-6827-141-0 93510

Contents
CHAPTER 1
Introduction ·····································································1
CHAPTER 2
Classification of chronic conditions and concept of
multiple chronic conditions ······································7
A. Classification of chronic conditions ·······································9
B. Concept of multiple chronic conditions ·····························12
CHAPTER 3
Distribution of comorbidity of major chronic
conditions and use of medical care ·····················13
A. Comorbidity of hypertension and heart disease ···············17
B. Comorbidity of diabetes and heart disease ························20
C. Distribution of hypertension and diabetes ·························22
CHAPTER 4
Types of multiple chronic conditions of
the elderly ·····································································27
A. Distribution of chronic conditions among the elderly 65
years of age or older ································································30
B. Types and distribution of multiple chronic conditions
among the elderly aged or older ············································39

C. Analysis of the risks of multiple chronic conditions for the
elderly ··························································································48
CHAPTER 5
Discussion and conclusion ·······································53
Reference ······································································59

Korea Institute for Health and Social Affairs
List of Tables
〈Table 1〉 Classification of chronic diseases ·············································10
〈Table 2〉 Risk factors in ischemic heart diseases, diabetes and
hypertension ··············································································15
〈Table 3〉 Comorbidity of heart disease and hypertension by age
(30 and above) ············································································19
〈Table 4〉 Odds ratio of comorbidity of ischemic heart disease and
hypertension ···················································································20
〈Table 5〉 Comorbidity of heart disease and diabetes by age (30 and
above) ·······························································································21
〈Table 6〉 Odds ratio of comorbidity of ischemic heart disease and
diabetes ····························································································22
〈Table 7〉 Comorbidity of hypertension and diabetes by age (30 and
above) ·······························································································24
〈Table 8〉 Odds ratio of comorbidity of hypertension and diabetes ···25
〈Table 9〉 Demographic features of patients 65 years of age or older ······31
〈Table 10〉 Average number of chronic diseases in different age groups ··33
〈Table 11〉 Distribution of prevalence of 46 chronic diseases among the
elderly 65 years of age or older ················································33
〈Table 12〉 Outpatient service usage for 46 chronic diseases among the
elderly aged 65 or older (2011) ·················································35
〈Table 13〉 Average annual outpatient medical expenses according to
the number of chronic diseases (65 and above) ···················37
〈Table 14〉 Average annual outpatient medical expenses for 46 chronic
diseases among the elderly aged 65 or older (2011) ··············37
〈Table 15〉 Combinations of multiple chronic conditions among
multimorbid patients (65 and above) ······································41

〈Table 16〉 Combinations of multiple chronic conditions among
multimorbid patients by gender (65 and above) ··················42
〈Table 17〉 Combinations of multiple chronic conditions among
multimorbid patients excluding low back pain (65 and
above) ······························································································44
〈Table 18〉 Combinations of multiple chronic conditions among
multimorbid patients excluding low back pain by gender
(65 and above) ···············································································45
〈Table 19〉 Combinations of multiple chronic conditions among
multimorbid patients excluding low back pain and
hypertension ··················································································46
〈Table 20〉 Combinations of multiple chronic conditions among
multimorbid patients excluding low back pain and
hypertension by gender ······························································47
〈Table 21〉 Odds ratio of multiple chronic conditions among the elderly
aged 65 or older ···········································································49
〈Table 22〉 Odds ratio of multiple chronic conditions among the elderly
aged 65 or older by gender ························································50
〈Table 23〉 Odds ratio of multiple chronic conditions among the elderly
aged 65 or older by age ······························································51

Korea Institute for Health and Social Affairs
List of Picture
〔Figure 1〕 Distinction between comorbidity and multimorbidity ·······12
〔Figure 2〕 Composition of analysis data ····················································17
〔Figure 3〕 Comorbidity of hypertension and heart disease
(n=89,595 patients of all ages) ·················································18
〔Figure 4〕 Ratio of hypertension patients among heart disease patients
in different age groups (30 and above) ··································19
〔Figure 5〕 Comorbidity of heart disease and diabetes
(n=41,040 patients of all ages) ·················································20
〔Figure 6〕 Ratio of diabetes patients among heart disease patients in
different age groups (30 and above) ·······································21
〔Figure 7〕 Comorbidity of heart disease and diabetes
(n=106,341 patients of all ages) ···············································23
〔Figure 8〕 Ratio of hypertension patients and diabetes patients in
different age groups ····································································24
〔Figure 9〕 Composition of analysis data ····················································30
〔Figure 10〕 Distribution of prevalence of chronic diseases in patients
65 years of age or older ····························································32
〔Figure 11〕 Average number of chronic conditions in multimorbidity
group and non-multimorbidity group ···································40


Chapter 1
Introduction


With the progress of population aging, development of medi-
cal technology, increase in life expectancy, changes in life hab-
its, etc., the prevalence of chronic conditions is rising and their
burden on individuals and society is growing rapidly(WHO,
2011)1). According to a report from OECD (2010), chronic dis-
eases are the main causes for disabilities and deaths through-
out the world, as 60% of the global population is estimated to
die from chronic diseases.
Recently, the concern over prevalence and management of
multiple chronic conditions, along with the increase in chronic
conditions, is rising (Lenhert et al., 2011). Results from various
studies indicate that prevalence of multiple chronic conditions
occurs in more than 65% of the elderly aged 65 years or older
(Lenhert et al., 2011). In Korea, 68.7% of people in their 50s
have at least one chronic disease, and the ratio grows to 83.7%
and 91.3% among those in their 60s and 70s, respectively
(Young-Ho Jung et al., 2011)2). Among patients who have mul-
tiple chronic conditions, those in their 50s have an average of
1) WHO, Noncommunicable Diseases - Country Profiles 2011, WHO, 20112) Young-Ho Jung et al., A Report on the Korea Health Panel Survey, Korea
Institute for Health and Social Affairs (KIHASA) and the National Health Insurance Service, 2011.
<<1 Introduction

4 Distribution and types of multiple chronic conditions in Korea
two chronic conditions, whereas those in their 60s have an
average of three conditions and those in their 70s have an
average of 3.5 chronic conditions (Young-Ho Jung, 2012)3).
We can see that the ratios of people who have chronic con-
ditions and multiple chronic conditions rise as they get older,
and thus, management of chronic diseases is one of the key
policy issues in today's society where population aging is swift-
ly occurring. However, there has been insufficient research on
multiple chronic conditions compared to that on chronic con-
ditions in general. Therefore, it is necessary to facilitate re-
search on and policy attention to multiple chronic conditions.
Based on this necessity, the study attempts to promote the un-
derstanding of multiple chronic conditions by analyzing the
types and distribution of these conditions among the elderly
patients who have multiple chronic conditions. Following
chapter 1, which provides the introduction, chapter 2 presents
the classification of chronic diseases and the concept of multi-
ple chronic conditions. Chapter 3 deals with the distribution of
comorbidity of major chronic conditions and use of medical
care; in more concrete terms, analysis was made on the co-
morbidity of hypertension and heart disease, comorbidity of
diabetes and heart disease, and comorbidity of hypertension
and diabetes. In chapter 4, types and constitution of multiple
3) Young-Ho Jung, 「Issues of Healthcare Delivery System」, presented at the policy forum held by the Korean Association of Health Economics and Policy and KIHASA, Oct. 6, 2012.

Introduction 5
chronic diseases among the elderly aged 65 or older and their
risks were analyzed. In the study, the Health Insurance Review
and Assessment Service's patient sample for 2011 was used for
the analysis of multiple chronic conditions, and logistic re-
gression was applied for the risk analysis. The final chapter
provides the discussion and conclusion of the study.


Chapter 2
Classification of chronic conditions and
concept of multiple chronic conditions
A. Classification of chronic conditions
B. Concept of multiple chronic conditiions


A. Classification of chronic conditions
Chronic conditions are conditions that are difficult to recov-
er from completely or which persist for a considerable amount
of time. To examine the types and distribution of multiple
chronic conditions of the elderly in Korea, the authors classi-
fied the scope of chronic conditions and concept of multiple
chronic conditions as follows. First, the scope of chronic con-
ditions was presented including the total of 46 groups sug-
gested by Bussche et al. (2011)4) so that the comparison be-
tween the results of this study and German experience can be
made. Bussche et al. (2011) proposed 46 disease groups after
selecting chronic diseases with 1% or higher prevalence rate
among a population aged 65 or more using German claim data
and classifying disease groups based on ICD-10 classification
through expert consultation. In the case of dementia, for ex-
ample, ICD-10 codes of F00-F03, F05.1, G30, G31 and R54 are
linked together under the condition of dementia.
4) van den Bussche et al. Which chronic diseases and disease combinations are specific to multimorbidity in the elderly? Results of a claims data based cross-sectional study in Germany. BMC Public Health 2011;11:101.
<<2 Classification of chronic conditions and concept of
multiple chronic conditions

10 Distribution and types of multiple chronic conditions in Korea
No. Chronic disease ICD-10 codes
1 Hypertension I10-I152 Lipid metabolism disorders E78
3 Chronic low back painM40-M45, M47, M48.0-M48.2, M48,5-M48.9, M50-M54
4 Severe vision reductionH17-H18, H25-H28, H31, H33, H34.1-H34.2, H34.8-H34.9, H35-H36, H40, H43, H47, H54
5 Osteoarthrosis M15-M196 Diabetes mellitus E10-E14
7Chronic ischemic heart disease
I20, I21, I25
8 Thyroid dysfunctionE01-305, E06.1-E06.3, E06.5, E06.9, E07
9 Cardiac arrhythmiasI44-I45, I46.0, I46.9, I47-I48, I49.1-I49.9
10 Obesity E66
11Purine/pyrimidine metabolism disorders/Gout
E79, M10
12 Prostatic hyperplasia N4013 Lower limbvaricosis I83, I87.2
14 Liver diseaseK70, K71.3-K71.5, K71.7, K72.7, K73-K74, K76
15 Depression F32-F3316 Asthma/COPD J40-J45, J47
17Noninflammatory gynecological problems
N81, N84-N90, N93, N95
18Atheriosclerosis/peripheral arterial occlusive disease
I65-I66, I67.2, I70, I73.9
19 Osteoporosis M80-M8220 Renal insufficiency N18-N19
21Cerebral ischemia/Chronic stroke
I60-I64, I69, G45
22 Cardiac insufficiency I50
23 Severe hearing lossH90, H91.0, H91.1, H91.3, H91.8, H91.9
24Chronic cholecystitis/Gallstones
K80, K81.1
25Somatoform disorders
F45
〈Table 1〉 Classification of chronic diseases

Classification of chronic conditions and concept of multiple chronic conditions 11
No. Chronic disease ICD-10 codes
26 Hemorrhoids I84
27Intestinal diverticulosis
K57
28Rheumatoid arthritis/Chronic polyarthritis
M05-M06, M79.0
29Cardiac valve disorders
I34-I37
30 Neuropathies G50-G64
31 Dizziness H81-H82, R42
32 Dementia F00-F03, F05.1, G30, G31, R54
33Urinary incontinence
N39.3-N39.4, R32
34Urinary tract calculi
N20
35 AnemiaD50-D53, D55-D58, D59.0-D59.2, D59.4-D59.9, D60.0, D60.8, D60.9, D61, D63-D65
36 Anxiety F40-F41
37 Psoriasis L40
38Migraine/chronic headache
G43-G44
39 Parkinson’s disease G20-G22
40 Cancers
C00-C14, C15-C26, C30-C39, C40-C41, C43-C44, C45-C49, C50, C51-C58, C60-C63, C64-C68, C69- C72, C73-C75, C81-C96, C76-C80, C97, D00-D09, D37-D48
41 AllergiesH01.1, J30, L23, L27.2, L56.4, K52.2, K90.0, T78.1, T78.4, T88.7
42Chronic gastritis/GERD
K21, K25.4-K25.9, K26.4-K26.9, K27.4-K27.9, K28.4-K28.9,K29.2-K29.9
43 Sexual dysfunction F52, N48,4
44 Insomnia G47, F51
45 Tobacco abuse F17
46 Hypotension I95
〈Table 1〉 Classification of chronic conditions (continued)
Note: ICD = International Classification of Diseases (10th edition)

12 Distribution and types of multiple chronic conditions in Korea
B. Concept of multiple chronic conditions
While comorbidity is defined as “any distinct clinical entity
that has coexisted or that may occur during the clinical course
of a patient who has the index disease under study (Feinstein,
1979),” multimorbidity is described as occurrence of multiple
chronic or acute diseases within one person (van den Akker et
al., 2001).
〔Figure 1〕 Distinction between comorbidity and multimorbidity
Source: Guthrie et al, 2011
Diabetes
Diabetes
Ischemicheart disease
Depression
Rheumatoid arthritis
Ischemicheart disease
Rheumatoid arthritis
Depression
Indexcondition
Comorbidities Multiple morbidities

Chapter 3
Distribution of comorbidity of
major chronic conditions
and use of medical care
A. Comorbidity of hypertension and heart disease
B. Comorbidity of diabetes and heart disease
C. Distribution of hypertension and diabetes


Comorbidity is a complex pathological condition in which a
patient has two or more diseases at the same time, and it can
not only have negative influence on health but also have an im-
pact bigger than those of individual diseases combined. Co-oc-
currence of these diseases may take place accidentally or due
to a certain association between diseases.
〈Table 2〉 Risk factors in ischemic heart diseases, diabetes and hypertension
DiseaseNon-modifiable
risk factorsModifiable risk factors
DiabetesAge, genetic factors, pregnancy, low birth-weight infant
Overweight, obesity, nutritional imbalance, insulin imbalance, physical inactivity
Ischemic heart disease
Age, genetic factors, family history
Overweight, obesity, nutritional imbalance, insulin imbalance, physical inactivity, smoking, hypertension, diabetes, liver disorder, arteriosclerosis, excessive drinking
Hypertension Age, genetic factorsOverweight, obesity, nutritional imbalance, physical inactivity, smoking, excessive drinking
Heart disease is one of the key causes of death in Korea, and
hypertension is one of the major risk factors for the occurrence
of heart disease. Diabetes is increasing with the advancement
<<3 Distribution of comorbidity of major chronic conditions
and use of medical care

16 Distribution and types of multiple chronic conditions in Korea
of population aging, and it causes complications including
heart disease and cerebral infarction.
In this part of the study, we will examine the distribution of
chronic diseases with a focus on diabetes and hypertension,
which are known as key risk factors of heart disease. Mortality
of Korean people due to diabetes is about 30 per 100,000 peo-
ple, which is 2 to 3 times higher than the OECD average rate
(OECD, 2012)5). Also, according to health insurance data6),
medical expenses arising due to hypertension and diabetes take
the No. 1 and No. 2 positions, respectively, in overall health in-
surance expenditure. In relation to this, the study aims to pro-
vide the basis for the design of health policies and development
of strategies for the prevention and management of diseases.
Data used for the study is the Health Insurance Review and
Assessment Service's patient sample for 2011. The patient sam-
ple consisted of 1,112,364 outpatients at medical or health
institutions.
5) OECD, Health Care Quality Review: Korea, OECD 2012.6) Health Insurance Review and Assessment Service, press release, Dec. 29,
2011.

Distribution of comorbidity of major chronic conditions and use of medical care 17
〔Figure 2〕 Composition of analysis data
Patient sample (2011)
6,999,999
⇩ ⇩ ⇩Inpatients Outpatients Others109,457 6,880,455 60
⇩Medical/health institutions
5,551,543
⇩Number of outpatients1)
1,112,364⇩ ⇩
Hypertension patients Diabetes patients
86,139 34,305
⇩ ⇩Ischemic heart disease
patients6,913
Note: 1) Patients of all ages excluding 47 patients whose ages were unknown
A. Comorbidity of hypertension and heart disease
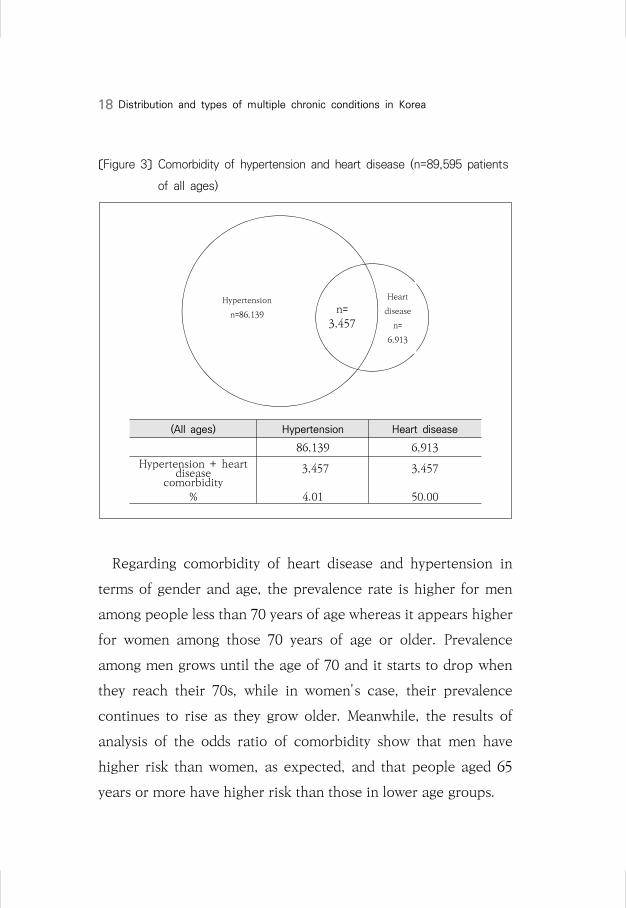
The results of a survey of patients of hypertension and heart
disease who had outpatient visits once or more in 2011 showed
that there were a total of 86,139 hypertension patients, 6,913
heart disease patients, and 3,457 who had both hypertension
and heart disease. About 4.01% of hypertension patients had
heart disease, while 50.00% of heart disease patients suffered
from hypertension.
18 Distribution and types of multiple chronic conditions in Korea
〔Figure 3〕 Comorbidity of hypertension and heart disease (n=89,595 patients
of all ages)
Hypertension
n=86,139n=
3,457
Heart
disease
n=
6,913
(All ages) Hypertension Heart disease
86,139 6,913
Hypertension + heart disease
comorbidity 3,457 3,457
% 4.01 50.00
Regarding comorbidity of heart disease and hypertension in
terms of gender and age, the prevalence rate is higher for men
among people less than 70 years of age whereas it appears higher
for women among those 70 years of age or older. Prevalence
among men grows until the age of 70 and it starts to drop when
they reach their 70s, while in women's case, their prevalence
continues to rise as they grow older. Meanwhile, the results of
analysis of the odds ratio of comorbidity show that men have
higher risk than women, as expected, and that people aged 65
years or more have higher risk than those in lower age groups.

Distribution of comorbidity of major chronic conditions and use of medical care 19
Classification
Hypertension Heart disease Comorbidity
(No. of
persons)(%) (명) (%)
(No. of
persons)(%)
Male
30~39 567 1.31 41 1.02 10 0.52
40~49 4,842 11.19 266 6.60 106 5.54
50~59 12,688 29.33 961 23.85 465 24.31
60~69 12,898 29.81 1,315 32.64 634 33.14
70~79 8,724 20.17 1,021 25.34 491 25.67
80 and above 3,542 8.19 425 10.55 207 10.82
Female
30~39 146 0.34 12 0.42 0 0.00
40~49 1,971 4.64 63 2.22 18 1.17
50~59 8,640 20.32 386 13.61 205 13.29
60~69 11,425 26.88 695 24.51 377 24.45
70~79 11,139 26.20 852 30.04 460 29.83
80 and above 9,189 21.62 828 29.20 482 31.26
Subtotal
30~39 713 0.83 53 0.77 10 0.87
40~49 6,813 7.94 329 4.79 124 8.04
50~59 21,328 24.87 1,347 19.62 670 24.89
60~69 24,323 28.36 2,010 29.28 1,011 28.36
70~79 19,863 23.16 1,873 27.28 951 23.14
80 and above 12,731 14.84 1,253 18.25 689 14.70
Total
Male 43,261 100.00 4,029 100.00 1,913 100.00
Female 42,510 100.00 2,836 100.00 1,542 100.00
Total 85,771 100.00 6,865 100.00 3,455 100.00
〔Figure 4〕 Ratio of hypertension patients among heart disease patients in
different age groups (30 and above)
〈Table 3〉 Comorbidity of heart disease and hypertension by age (30 and above)
Note: Based on the numbers of main and sub sick patients who had one or more outpatient visits
0.00
0.10
0.20
0.30
0.40
0.50
0.60
0.70
30-39세 40-49세 50-59세 60-69세 70-79세 80세이상
남 여 계
and above
Male Female Total

20 Distribution and types of multiple chronic conditions in Korea
〈Table 4〉 Odds ratio of comorbidity of ischemic heart disease and hypertension
Comorbidity Odds ratio SE p-value
Ischemic heart disease
Male vs. female 1.320 0.018 <.0001
Hypertension65 and above vs.
below 651.564 0.018 <.0001
B. Comorbidity of diabetes and heart disease
Among the diabetes and heart disease patients who made
outpatient visits once or more in 2011, there were 34,648 dia-
betes patients and 6.913 heart disease patients, and the per-
centage of those who had both diabetes and heart disease was
1.50%. In addition, 7.54% of heart disease patients also ap-
peared to have diabetes.
〔Figure 5〕 Comorbidity of heart disease and diabetes(n=41,040 patients of all ages)
Diabetesn=34,648
n=521
Heart
Disease
n=
6,913
(All ages) Diabetes Heart disease
34,648 6,913Diabetes + heart disease
comorbidity521 521
% 1.50 7.54

Distribution of comorbidity of major chronic conditions and use of medical care 21
〔Figure 6〕 Ratio of diabetes patients among heart disease patients in
different age groups (30 and above)
(Unit: %)
〈Table 5〉 Comorbidity of heart disease and diabetes by age (30 and above)
ClassificationDiabetes Heart disease Comorbidity
(No. of persons)
(%)(No. of
persons)(%)
(No. of persons)
(%)
Male
30~39 296 1.50 41 1.02 2 0.61
40~49 2,184 11.09 266 6.60 17 5.21
50~59 5,898 29.96 961 23.85 67 20.55
60~69 5,989 30.42 1,315 32.64 120 36.81
70~79 3,993 20.28 1,021 25.34 94 28.83
80 and above 1,329 6.75 425 10.55 26 7.98
Female
30~39 125 0.86 12 0.42 0 0.00
40~49 871 5.96 63 2.22 4 2.06
50~59 2,622 17.94 386 13.61 21 10.82
60~69 3,846 26.31 695 24.51 49 25.26
70~79 4,376 29.94 852 30.04 70 36.08
80 and above 2,776 18.99 828 29.20 50 25.77
Subtotal
30~39 421 1.23 53 0.77 2 0.38
40~49 3,055 8.91 329 4.79 21 4.04
50~59 8,520 24.84 1,347 19.62 88 16.92
60~69 9,835 28.67 2,010 29.28 169 32.50
70~79 8,369 24.40 1,873 27.28 164 31.54
80 and above 4,105 11.97 1,253 18.25 76 14.62
Total
Male 19,689 100.00 4,029 100.00 326 100.00
Female 14,616 100.00 2,836 100.00 194 100.00
Total 34,305 100.00 6,865 100.00 520 100.00
Note: Based on the numbers of main and sub sick patients who had one or more outpatient visits
0.0%
2.0%
4.0%
6.0%
8.0%
10.0%
30-39세 40-49세 50-59세 60-69세 70-79세 80세이상
남 여 계
and above
Male Female Total

22 Distribution and types of multiple chronic conditions in Korea
When the comorbidity of heart disease and diabetes is exam-
ined in terms of gender and age, men appear to have higher risk
(odds ratio = 1.365) than women, as expected, and people 65
years of age and above also have a higher odds ratio (1.513) com-
pared to younger age groups. Among men, those in their 60s have
the highest prevalence rate of 36.81%, whereas women's preva-
lence rate is the highest at 36.08% when they are in their 70s.
〈Table 6〉 Odds ratio of comorbidity of ischemic heart disease and diabetes
Comorbidity Odds ratio SE p-value
Ischemic heart disease
Male vs. female 1.365 0.047 0.001
Diabetes65 and above vs.
below 651.513 0.045 <.0001
C. Distribution of hypertension and diabetes
A total of 106,341 patients had hypertension or diabetes,
with 86,193 of them having hypertension and 34,648 having
diabetes. There were 14,447 patients who had both hyper-
tension and diabetes. Among hypertension patients, 16.77% al-
so had diabetes, and 41.69% of diabetes patients also had
hypertension.
Concerning the comorbidity of hypertension and diabetes,
prevalence rate for men was the highest at 32.49% in their 60s,
while prevalence for women was the highest at 32.86% in their
70s. The odds ratio of comorbidity showed that men as com-

Distribution of comorbidity of major chronic conditions and use of medical care 23
pared to women and those 65 years of age or older as com-
pared to younger age groups had more risk, at 1.222 and 1.406,
respectively.
〔Figure 7〕 Comorbidity of heart disease and diabetes (n=106,341 patients of
all ages)
Hypertension
n=86,139 n=
14,446
Diabetes
n=
34,648
(All ages) Hypertension Diabetes
86,139 34,648
Hypertension + diabetescomorbidity
14,446 14,446
% 16.77 41.69

24 Distribution and types of multiple chronic conditions in Korea
Classification
Hypertension Diabetes Comorbidity
(No. of persons)
(%)(No. of
persons)(%)
(No. of persons)
(%)
Male
30~39 567 1.31 296 1.50 66 0.83 40~49 4,842 11.19 2,184 11.09 615 7.77 50~59 12,688 29.33 5,898 29.96 2,177 27.50 60~69 12,898 29.81 5,989 30.42 2,572 32.49 70~79 8,724 20.17 3,993 20.28 1,860 23.50
80 and above 3,542 8.19 1,329 6.75 626 7.91
Female
30~39 146 0.34 125 0.86 18 0.28 40~49 1,971 4.64 871 5.96 187 2.88 50~59 8,640 20.32 2,622 17.94 922 14.18 60~69 11,425 26.88 3,846 26.31 1,714 26.37 70~79 11,139 26.20 4,376 29.94 2,136 32.86
80 and above 9,189 21.62 2,776 18.99 1,524 23.44
Subtotal
30~39 713 0.83 421 1.23 84 0.58 40~49 6,813 7.94 3,055 8.91 802 5.56 50~59 21,328 24.87 8,520 24.84 3,099 21.50 60~69 24,323 28.36 9,835 28.67 4,286 29.73 70~79 19,863 23.16 8,369 24.40 3,996 27.72
80 and above 12,731 14.84 4,105 11.97 2,150 14.91
〔Figure 8〕 Ratio of hypertension patients and diabetes patients in different
age groups
<Ratio of hypertension patients among diabetes patients>
<Ratio of diabetes patients among hypertension patients>
22.3%
28.2%
36.9%
42.9%46.6% 47.1%
14.4%21.5%
35.2%
44.6%48.8% 54.9%
0.0%
10.0%
20.0%
30.0%
40.0%
50.0%
60.0%
30-39세 40-49세 50-59세 60-69세 70-79세 80세이상
남 여
11.6%12.7%
17.2%
19.9%21.3%
17.7%
12.3%9.5%
10.7%
15.0%
19.2%
16.6%
0.0%
5.0%
10.0%
15.0%
20.0%
25.0%
30-39세 40-49세 50-59세 60-69세 70-79세 80세이상
남 여
〈Table 7〉 Comorbidity of hypertension and diabetes by age (30 and above)
80 and above
80 and above
FemaleMale FemaleMale

Distribution of comorbidity of major chronic conditions and use of medical care 25
Classification
Hypertension Diabetes Comorbidity
(No. of persons)
(%)(No. of
persons)(%)
(No. of persons)
(%)
TotalMale 43,261 100.00 19,689 100.00 7,916 100.00
Female 42,510 100.00 14616 100.00 6,501 100.00 Total 85,771 100.00 34305 100.00 14,417 100.00
Note: Based on the numbers of main and sub sick patients who had one or more outpatient visits
〈Table 8〉 Odds ratio of comorbidity of hypertension and diabetes
Comorbidity Odds ratio SE p-value
Hypertension Male vs. female 1.222 118.160 <.0001
Diabetes65 and above vs.
below 651.406 337.902 <.0001


Chapter 4
Types of multiple chronic
conditions of the elderly
A. Distribution of chronic conditions among the
elderly 65 years of age or older
B. Types and distribution of multiple chronic
conditions among the elderly aged 65 or older
C. Analysis of the risks of multiple chronic
conditions for the elderly


The study utilized the Health Insurance Review and
Assessment Service's patient sample for 2011 to examine the
composition of multiple chronic conditions among the elderly
aged 65 or older. The patient sample data is developed
through stratified sampling of all patients who used medical
services for one year according to gender and age groups, and
we used the data that consisted of a 3 percent sample of all
medical service users.
Of all the medical service usage data, 5,551,543 outpatient
visits were made to medical and health institutions, and among
them, 155,380 patients were 65 years of age or older.
<<4 Types of multiple chronic conditions of the elderly

30 Distribution and types of multiple chronic conditions in Korea
〔Figure 9〕 Composition of analysis data
Patient sample (2011)
6,999,999
⇩ ⇩ ⇩Inpatients Outpatients Others109,457 6,880,455 60
⇩Medical/health institutions
5,551,543
⇩Patients 65 years of age
or older155,380
⇩ ⇩No chronic condition Chronic conditions
7,297 148,083 ⇩
Multiple chronic conditions
93,961
A. Distribution of chronic conditions among the elderly 65 years of age or older
Concerning the distribution of chronic conditions among the
elderly 65 years of age or older, only 4.7% had no chronic con-
dition while 14.1% had one chronic condition, 20.7% had two
chronic conditions and 60.5% had three or more chronic
conditions.
The average age of the target patients included in the analy-
sis was 73.4 ( 72.5 for men and 74.0 for women). In the case of

Types of multiple chronic conditions of the elderly 31
patients who had three or more chronic conditions, the aver-
age number of chronic conditions for men was 4.5 and the
average number for women was 4.7.
〈Table 9〉 Demographic features of patients 65 years of age or older
Classification
No. of chronic diseases
Totalp-
valueNone 1 23 or more
No. of target
patients
(No.) 7,297 21,920 32,202 93,961 155,380
(%) 4.7 14.1 20.7 60.5 100.0
Average age
Male 71.7 71.9 72.2 72.8 72.5 <.000(sd) 5.9 6.0 5.8 5.7 5.8
Female 74.3 74.4 74.5 73.7 74.0 <.000(sd) 7.8 7.5 7.1 6.1 6.6
Total 72.9 73.2 73.5 73.4 73.4 <.000(sd) 7.0 6.9 6.7 6.0 6.3
Average number
of chronic diseases
Male 4.5 3.1 (sd) 1.7 2.1
Female 4.7 3.5 (sd) 1.7 2.1
Total 4.6 3.3 (sd) 1.7 2.1
Note: sd= standard deviation

32 Distribution and types of multiple chronic conditions in Korea
〔Figure 10〕 Distribution of prevalence of chronic diseases in patients 65
years of age or older
(Unit: %)
0.00
5.00
10.00
15.00
20.00
25.00
0 1 2 3 4 5 6 7 8 9 10 11 12 13 14 15 16
4.70
14.11
20.72
18.97
15.66
10.93
6.92
4.04
2.08 1.05
0.49 0.21 0.08 0.04 0.01 0.00 0.00
만성질환유병분포(%)
With regard to the average number of chronic diseases held
by patients of different age groups, people between 65 and 69
had an average of 3.15 chronic diseases, while those between
70 and 74 had 3.47 diseases, those between 75 and 80 had 3.61
diseases, and those 85 years old or above had 2.82 diseases.
This indicates that the increase in the number of chronic dis-
eases slows down somewhat after the age of 85.
Distribution of prevalence of chronic diseases (%)

Types of multiple chronic conditions of the elderly 33
No. Disease
Male Female Total
Prevalence rate(%)
RankPrevalence rate(%)
RankPrevalence rate(%)
Rank
1 Hypertension 44.34 1 51.86 1 48.84 1
42 Chronic gastritis/GERD 36.04 2 40.17 3 38.51 2
3 Chronic low back pain 28.23 3 41.17 2 35.96 3
5 Arthrosis 15.58 8 31.62 4 25.16 4
41 Allergies 23.85 4 21.32 5 22.34 5
6 Diabetes 20.26 5 19.27 6 19.67 6
4 Severe vision reduction 16.20 7 18.57 7 17.61 7
16 Asthma/ COPD 15.29 9 13.14 10 14.00 8
2 Lipid metabolism disorders 10.69 10 14.63 9 13.05 9
19 Osteoporosis 2.11 25 15.22 8 9.95 10
21 Cerebral ischemia/chronic stroke 8.08 12 7.34 12 7.63 11
12 Prostatic hyperplasia 18.71 6 - 44 7.52 12
31 Dizziness 6.00 14 8.24 11 7.34 13
7 Chronic ischemic heart disease 8.15 11 6.76 13 7.32 14
18Atheriosclerosis/peripheral arterial occlusive disease
5.85 15 5.99 14 5.93 15
30 Neuropathies 4.67 16 5.47 15 5.15 16
40 Cancers 6.84 13 3.25 22 4.69 17
44 Insomnia 4.33 17 4.76 17 4.59 18
36 Anxiety 3.36 19 4.84 16 4.24 19
32 Dementia 3.00 20 4.69 18 4.01 20
15 Depression 2.66 21 4.00 19 3.46 21
14 Liver disease 3.96 18 2.62 24 3.16 22
38 Migraine/chronic headache 2.24 23 3.54 20 3.02 23
8 Thyroid dysfunction 1.38 29 3.28 21 2.52 24
9 Cardiac arrhythmias 2.41 22 2.02 26 2.18 25
17 Noninflammatory gynecological - 46 2.82 23 1.68 26
〈Table 10〉Average number of chronic diseases in different age groups
ClassificationMale Female Total
Average SD Average SD Average SD
65~69 2.83 1.94 3.41 2.06 3.15 2.02
70~74 3.15 2.04 3.71 2.13 3.47 2.11
75~80 3.40 2.15 3.74 2.12 3.61 2.14
85 and above 3.06 2.09 2.74 1.78 2.82 1.88
Total 3.10 2.05 3.51 2.08 3.34 2.08
Note: SD = standard deviation
〈Table 11〉 Distribution of prevalence of 46 chronic diseases among the
elderly 65 years of age or older

34 Distribution and types of multiple chronic conditions in Korea
No. Disease
Male Female Total
Prevalence rate(%)
RankPrevalence rate(%)
RankPrevalence rate(%)
Rank
problems
22 Cardiac insufficiency 1.31 30 1.90 27 1.66 28
28Rheumatoid arthritis/ chronic polyarthritis
1.08 33 2.05 25 1.66 27
35 Anemia 1.53 27 1.61 29 1.58 29
23 Severe hearing loss 1.57 26 1.54 30 1.55 30
25 Somatoform disorders 1.10 32 1.62 28 1.41 31
39 Parkinson's disease 1.02 34 1.21 31 1.13 32
11Purine/pyrimidine metabolism disorders/gout
2.11 24 0.25 39 1.00 33
20 Renal insufficiency 1.42 28 0.70 34 0.99 34
26 Hemorrhoids 1.15 31 0.71 33 0.89 35
33 Urinary incontinence 0.28 39 0.99 32 0.71 36
13 Lower limb varicosis 0.50 38 0.57 35 0.54 37
24 Chronic cholecystitis/gallstones 0.57 35 0.43 36 0.49 38
34 Urinary tract calculi 0.54 36 0.25 40 0.37 40
37 Psoriasis 0.53 37 0.26 38 0.37 39
29 Cardiac valve disorders 0.24 40 0.32 37 0.29 41
46 Hypotension 0.15 42 0.05 41 0.09 42
43 Sexual dysfunction 0.17 41 - 45 0.07 43
27 Intestinal diverticulosis 0.06 43 0.05 42 0.06 44
10 Obesity 0.01 44 0.01 43 0.01 45

Types of multiple chronic conditions of the elderly 35
No. DiseaseMale Female Total
(%) Rank (%) Rank (%) Rank
3 Chronic low back pain 15.50 1 17.09 1 19.50 11 Hypertension 15.06 2 13.29 2 15.73 25 Arthrosis 6.72 5 9.87 4 11.03 342 Chronic gastritis/GERD 10.30 3 11.15 3 10.35 46 Diabetes 7.90 4 5.37 6 7.21 541 Allergies 5.58 6 5.55 5 4.54 64 Severe vision reduction 3.94 9 2.71 8 3.86 716 Asthma/COPD 4.17 8 2.67 9 3.37 82 Lipid metabolism disorders 2.43 10 3.59 7 2.91 919 Osteoporosis 0.50 25 2.55 10 2.44 1012 Prostatic hyperplasia 5.24 7 - 46 1.95 11
21Cerebral ischemia/chronic stroke
2.21 11 1.10 17 1.89 12
7 Chronic ischemic heart disease 1.94 13 1.04 18 1.64 1331 Dizziness 1.31 16 1.30 12 1.46 14
18Atheriosclerosis/peripheral arterial occlusive disease
1.43 15 1.12 16 1.34 15
30 Neuropathies 1.28 17 1.23 13 1.30 1640 Cancers 2.06 12 1.13 15 1.25 1744 Insomnia 1.23 18 1.02 20 1.13 1820 Renal insufficiency 1.45 14 0.75 22 0.98 1932 Dementia 0.73 22 0.53 26 0.94 2036 Anxiety 0.80 20 0.99 21 0.92 2115 Depression 0.74 21 1.03 19 0.90 2214 Liver disease 0.81 19 0.59 24 0.56 2338 Migraine/chronic headache 0.45 26 0.75 23 0.55 248 Thyroid dysfunction 0.28 30 1.16 14 0.51 259 Cardiac arrhythmias 0.53 24 0.29 29 0.45 26
28Rheumatoid arthritis/chronic polyarthritis
0.30 28 0.59 25 0.43 27
35 Anemia 0.42 27 0.43 27 0.37 2822 Cardiac insufficiency 0.28 31 0.24 30 0.37 2925 Somatoform disorders 0.26 33 0.33 28 0.31 3039 Parkinson's disease 0.29 29 0.17 33 0.30 31
17Noninflammatory gynecological problems
- 46 1.56 11 0.29 32
11Purine/pyrimidine metabolism disorders/ gout
0.63 23 0.05 39 0.27 33
23 Severe hearing loss 0.27 32 0.20 32 0.24 34
〈Table 12〉 Outpatient service usage for 46 chronic diseases among the
elderly aged 65 or older (2011)

36 Distribution and types of multiple chronic conditions in Korea
No. DiseaseMale Female Total
(%) Rank (%) Rank (%) Rank
26 Hemorrhoids 0.20 34 0.21 31 0.15 3533 Urinary incontinence 0.06 39 0.16 34 0.13 3613 Lower limb varicosis 0.10 37 0.15 35 0.11 3737 Psoriasis 0.15 35 0.08 36 0.09 3824 Chronic cholecystitis/gallstones 0.11 36 0.07 37 0.08 3934 Urinary tract calculi 0.09 38 0.06 38 0.06 4029 Cardiac valve disorders 0.05 40 0.05 40 0.06 4146 Hypotension 0.03 41 0.01 41 0.02 4227 Intestinal diverticulosis 0.01 43 0.01 42 0.01 4343 Sexual dysfunction 0.02 42 0.00 44 0.01 4410 Obesity 0.00 44 0.01 43 0.00 45
Concerning the average yearly medical expenses (excluding
uninsured medical fees) arising from outpatient service use by
the elderly aged 65 or above according to the numbers of
chronic diseases that patients have, those who didn't have any
chronic disease spent 50,201 won on outpatient services, and
the amount of their out-of-pocket payment excluding un-
insured fees was about 14,225 won.
Meanwhile, the out-of-pocket payment for outpatient care in
the case of those who had one chronic disease was 22,025 won
per year, and the out-of-pocket payment in the case of those
with three or more chronic diseases was 71,945 won. About
60% of the elderly aged 65 or above have three or more chronic
diseases, and they were shown to pay an average of 322,462
won in medical expenses per year, among which they paid
71,945 won in out-of-pocket payment.

Types of multiple chronic conditions of the elderly 37
No. DiseaseNo. of
patients
Total medical expenses
Out-of-pocket payment
(won) Rank (won) Rank
20 Renal insufficiency 1,533 2,470,012 1 283,101 146 Hypotension 140 1,339,942 2 176,350 234 Urinary tract calculi 570 590,712 5 173,223 335 Anemia 2,455 852,411 3 127,866 427 Intestinal diverticulosis 86 384,176 12 118,475 5
24Chronic cholecystitis/gallstones
762 386,501 11 113,795 6
15 Depression 5,380 440,663 8 112,367 78 Thyroid dysfunction 3,911 362,810 19 98,029 840 Cancers 7,291 716,708 4 93,422 930 Neuropathies 8,003 420,341 9 90,612 1036 Anxiety 6,593 363,125 18 89,913 1143 Sexual dysfunction 104 408,536 10 89,846 1239 Parkinson's disease 1,759 452,856 7 87,938 1325 Somatoform disorders 2,194 352,370 22 87,918 1444 Insomnia 7,127 377,109 13 87,166 1514 Liver disease 4,906 368,133 16 86,906 1629 Cardiac valve disorders 449 309,067 37 86,082 179 Cardiac arrhythmias 3,384 307,438 38 86,028 18
10 Obesity 15 489,523 6 85,913 19
〈Table 13〉 Average annual outpatient medical expenses according to the
number of chronic diseases (65 and above)
No. of chronic
diseases
No. of patientsTotal medical
expensesOut-of-pocket
payment
(No. of persons)
(%)Average annual
expenses(Korean won)
Average annual expenses
(Korean won)
None 7,297 4.7 50,201 14,225 1 21,920 14.1 97,266 22,025 2 32,202 20.7 147,005 32,025
3 or more 93,961 60.5 322,462 71,945 Total 155,380 100.0 241,544 53,919
Note: Based on the number of patients who had at least one outpatient visit Medical expenses and out-of-pocket payment exclude uninsured medical fees.
〈Table 14〉 Average annual outpatient medical expenses for 46 chronic
diseases among the elderly aged 65 or older (2011)

38 Distribution and types of multiple chronic conditions in Korea
No. DiseaseNo. of
patients
Total medical expenses
Out-of-pocket payment
(won) Rank (won) Rank
17Noninflammatory gynecological problems
2,618 336,499 26 85,540 20
26 Hemorrhoids 1,382 374,906 15 84,616 2132 Dementia 6,233 327,937 29 84,179 22
28Rheumatoid arthritis/ chronic polyarthritis
2,577 366,570 17 81,072 23
33 Urinary incontinence 1,099 351,340 23 80,849 247 Chronic ischemic heart disease 11,375 323,995 32 80,808 2513 Lower limb varicosis 838 356,535 21 79,159 2638 Migraine/chronic headache 4,690 336,024 27 78,757 2721 Chronic ischemia/chronic stroke 11,861 301,870 40 78,354 2823 Severe hearing loss 2,408 337,463 25 78,056 2912 Prostatic hyperplasia 11,691 356,583 20 77,307 30
11Purine/pyrimidine metabolism disorder/gout
1,555 376,526 14 77,228 31
4 Severe vision reducition 27,370 346,330 24 76,430 3231 Dizziness 11,402 325,169 30 75,084 3319 Osteoporosis 15,453 319,310 35 74,319 345 Osteoarthritis 39,100 329,038 28 72,648 3537 Psoriasis 569 320,858 33 72,511 366 Diabetes 30,562 320,334 34 71,953 373 Chronic low back pain 55,880 324,514 31 71,574 382 Lipid metabolism disorders 20,271 284,956 43 71,421 3922 Cardiac insufficiency 2,580 295,122 41 71,044 4016 Asthma/COPD 21,760 311,092 36 68,793 4142 Chronic gastritis/GERD 59,839 302,799 39 68,145 42
18Atheriosclerosis/peripheral arterial occlusive disease
9,218 281,404 44 65,831 43
41 Allergies 34,708 290,735 42 63,708 441 Hypertension 75,880 250,209 45 55,914 45

Types of multiple chronic conditions of the elderly 39
B. Types and distribution of multiple chronic conditions among the elderly aged 65 or older
Based on the research result that it is more valid to define
multimorbidity as the co-occurrence of three or more chronic
conditions in one elderly patient in the case of outpatients
rather than the co-occurrence of two or more chronic con-
ditions (Van den Akker et al. 2001)7), the study defined multi-
morbid patients as those who have three or more chronic
conditions.
As seen in the above, when multimorbid patients are defined
as those who have three or more chronic conditions, 60.5% of
the elderly aged 65 or older can be classified as multimorbid
patients. In the figure presented below, it is shown that the
average number of chronic conditions of the elderly who be-
long to the multimorbidity group grows as they grow older, ex-
cluding a few age groups.
7) Van den Akker et al., Problems in determining occurrence rates of multimorbidity. J Clin Epidemiol 2001;54:675-679.

40 Distribution and types of multiple chronic conditions in Korea
〔Figure 11〕 Average number of chronic conditions in multimorbidity group
and non-multimorbidity group
0.00
1.00
2.00
3.00
4.00
5.00
6.00
65 66 67 68 69 70 71 72 73 74 75 76 77 78 79 80 81 82 83 84 85 86 87 88 89 90+
multi_남
multi_여
non-multi_남
non-multi_여
male
non-multi_female
non-multi_male
multi_male
multi_female
Note: Multimorbidiy refers to patients who have three or more chronic conditions.
The table below shows 46 multiple chronic conditions listed
in three-disease combinations according to the order of preva-
lence, excluding gastritis, allergies, severe vision reduction,
dizziness, headache, anemia, obesity, hearing loss, psoriasis
and anxiety, which occur as a result of old age-related dysfunc-
tions or symptoms.
With regard to the multiple chronic disease combinations of
multimorbid patients, the combination of hypertension, chron-
ic low back pain and arthrosis has the highest percentage at
19.00% among all multimorbid patients, followed by the combi-
nation of hypertension, chronic low back pain and diabetes at
5.94% and the combination of hypertension, arthrosis and dia-
betes at 3.02%.

Types of multiple chronic conditions of the elderly 41
〈Table 15〉 Combinations of multiple chronic conditions among multimorbid
patients (65 and above)
Rank Combination type Prevalence (%)
1 HypertensionChronic low back pain
Arthrosis 19.00
2 HypertensionChronic low back pain
Diabetes 5.94
3 Hypertension Arthrosis Diabetes 3.02
4 HypertensionChronic low back pain
Asthma/COPD 2.96
5 HypertensionChronic low back pain
Lipid metabolism disorders
2.76
6Chronic low back pain
Arthrosis Diabetes 2.68
7Chronic low back pain
Arthrosis Asthma/COPD 2.31
8Chronic low back pain
Arthrosis Osteoporosis 2.10
9 Hypertension DiabetesLipid
metabolism disorders
1.58
10 Hypertension ArthrosisLipid
metabolism disorders
1.57
11 Hypertension Diabetes Asthma/COPD 1.55
12 Hypertension Arthrosis Asthma/COPD 1.36
13Chronic low back pain
ArthrosisLipid
metabolism disorders
1.24
14 HypertensionChronic low back pain
Stroke 1.12
15 HypertensionChronic low back pain
Ischemic heart disease
1.11
Total 2,497 persons 50.30
No. of multimorbid
patients64,630 persons1)
Note: 1) Common chronic conditions with the highest prevalence, such as gastritis, allergies, severe vision loss, dizziness, headache, anemia, severe hearing loss, psoriasis, anxiety, obesity and smoking, were excluded from chronic conditions here.

42 Distribution and types of multiple chronic conditions in Korea
RankMale Female
Combination typePrevalence
(%)Combination type
Prevalence(%)
1Hyperten-
sion
Chronic low back
painArthrosis 10.73
Hyperten-sion
Chronic low back
painArthrosis 23.46
2Hyperten-
sion
Chronic low back
painDiabetes 6.28
Hyperten-sion
Chronic low back
painDiabetes 5.76
3Hyperten-
sion
Chronic low back
pain
Asthma/COPD
3.40 Hyperten-
sionArthrosis Diabetes 3.34
4Hyperten-
sionArthrosis Diabetes 2.42
Chronic low back
painArthrosis Diabetes 3.14
5Hyperten-
sionDiabetes
Asthma/COPD
2.42 Hyperten-
sion
Chronic low back
pain
Lipid metabolis
m disorders
3.08
6Hyperten-
sion
Chronic low back
pain
Lipid metabolis
m disorders
2.17 Chronic low back
painArthrosis
Osteoporosis
3.01
7Hyperten-
sionDiabetes
Lipid metabolis
m disorders
2.15 Hyperten-
sion
Chronic low back
pain
Asthma/COPD
2.72
8Chronic low back
painArthrosis
Asthma/COPD
2.05 Chronic low back
painArthrosis
Asthma/COPD
2.44
9Chronic low back
painArthrosis Diabetes 1.83
Hyperten-
sionArthrosis
Lipid metabolis
m disorders
1.99
10Hyperten-
sion
Chronic low back
pain
Ischemic heart
disease1.28
Chronic low back
painArthrosisis
Lipid metabolism disorders
1.59
Combinations of multiple chronic disease in the top 15 ranks
account for 50.30% of the overall multimorbidity combinations.
Within the top 15 combinations, hypertension is included in 11
combinations, chronic low back pain in 10, arthrosis in 8 and
diabetes in 5 combinations.
〈Table 16〉 Combinations of multiple chronic conditions among multimorbid
patients by gender (65 and above)

Types of multiple chronic conditions of the elderly 43
RankMale Female
Combination typePrevalence
(%)Combination type
Prevalence(%)
11Hyperten-
sion
Chronic low back
painStroke 1.22
Hyperten-sion
ArthrosisAsthma/COPD
1.44
12Hyperten-
sionArthrosis
Asthma/COPD
1.20 Hyperten-
sionDiabetes
Lipid metabolis
m disorders
1.27
13Hyperten-
sion
Chronic low back
pain
Atherio-sclerosis
1.13 Hyperten-
sionArthrosis
Osteoporosis
1.23
14Hyperten-
sionDiabetes Stroke 1.12
Hyperten-sion
DiabetesAsthma/COPD
1.08
15Hyperten-
sionDiabetes
Ischemic heart
disease0.91
Hyperten-sion
Chronic low back
painStroke 1.07
Total 9,135 persons 40.31 23,765 persons 56.62
No. of multi-morbid patients
22,657 persons 41,973 persons
Note: Common chronic conditions that arise due to dysfunctions that come with age, such as gastritis, allergies, severe vision loss, dizziness, headache, anemia, severe hearing loss, psoriasis, anxiety, obesity and smoking, were excluded from chronic conditions here.
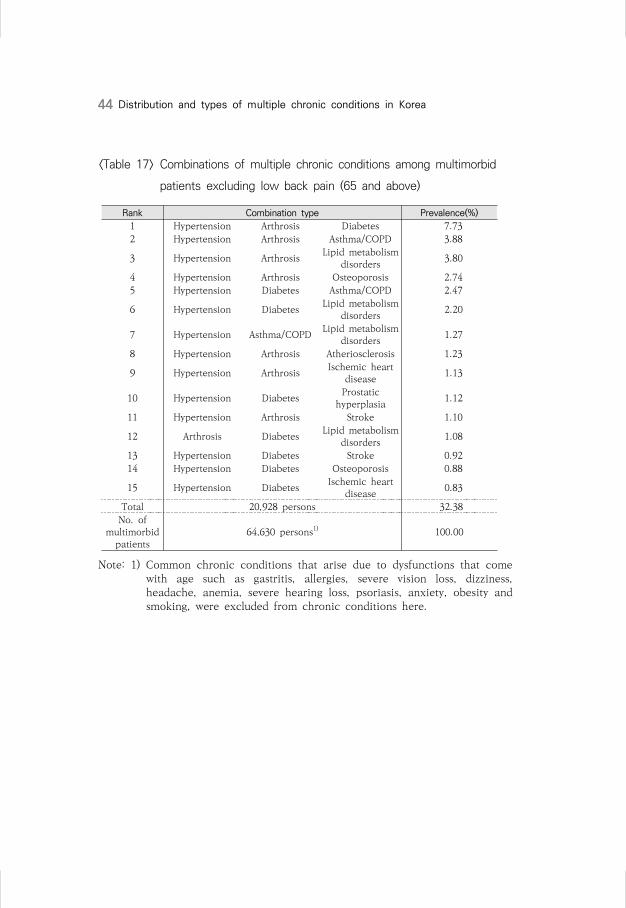
Combinations of three chronic conditions made after exclud-
ing chronic low back pain are presented in the table below.
After excluding chronic low back pain, the combination of hy-
pertension, arthrosis and diabetes took the highest percentage
at 7.73% among multimorbid patients. The combined preva-
lence rates of top 15 combinations of chronic conditions
reached 32.28% of all multimorbid patients.
44 Distribution and types of multiple chronic conditions in Korea
〈Table 17〉 Combinations of multiple chronic conditions among multimorbid
patients excluding low back pain (65 and above)
Rank Combination type Prevalence(%)
1 Hypertension Arthrosis Diabetes 7.73
2 Hypertension Arthrosis Asthma/COPD 3.88
3 Hypertension ArthrosisLipid metabolism
disorders 3.80
4 Hypertension Arthrosis Osteoporosis 2.74
5 Hypertension Diabetes Asthma/COPD 2.47
6 Hypertension DiabetesLipid metabolism
disorders 2.20
7 Hypertension Asthma/COPDLipid metabolism
disorders 1.27
8 Hypertension Arthrosis Atheriosclerosis 1.23
9 Hypertension ArthrosisIschemic heart
disease 1.13
10 Hypertension DiabetesProstatic
hyperplasia 1.12
11 Hypertension Arthrosis Stroke 1.10
12 Arthrosis DiabetesLipid metabolism
disorders 1.08
13 Hypertension Diabetes Stroke 0.92
14 Hypertension Diabetes Osteoporosis 0.88
15 Hypertension DiabetesIschemic heart
disease 0.83
Total 20,928 persons 32.38
No. of multimorbid
patients64,630 persons1) 100.00
Note: 1) Common chronic conditions that arise due to dysfunctions that come with age such as gastritis, allergies, severe vision loss, dizziness, headache, anemia, severe hearing loss, psoriasis, anxiety, obesity and smoking, were excluded from chronic conditions here.
Types of multiple chronic conditions of the elderly 45
RankMale Female
Combination typePrevalence
(%)Combination type
Prevalence(%)
1Hyperten-
sionArthrosis Diabetes 5.30
Hyperten-sion
Arthrosis Diabetes 9.04
2Hyperten-
sionDiabetes
Asthma/COPD
3.55 Hyperten-
sionArthrosis
Lipid metabolism disorders
4.95
3Hyperten-
sionDiabetes
Prostatic hyperplasia
3.20 Hyperten-
sionArthrosis
Asthma/COPD
4.44
4Hyperten-
sionArthrosis
Asthma/COPD
2.84 Hyperten-
sionArthrosis Osteoporosis 4.00
5Hyperten-
sionDiabetes
Lipid metabolism disorders
2.66 Hyperten-
sionDiabetes
Lipid metabolism disorders
1.96
6Hyperten-
sionArthrosis
Lipid metabolism disorders
1.66 Hyperten-
sionDiabetes
Asthma/COPD
1.88
7Hyperten-
sionAsthma/COPD
Lipid metabolism disorders
1.41 Hyperten-
sionArthrosis
Atheriosclerosis
1.36
8Hyperten-
sionDiabetes Stroke 1.13 Arthrosis Diabetes
Lipid metabolism disorders
1.29
9Hyperten-
sionDiabetes
Ischemic heart
disease1.00
Hyperten-sion
ArthrosisIschemic
heart disease
1.27
10Hyperten-
sionAsthma/COPD
Prostatic hyperplasia
1.00 Hyperten-
sionArthrosis Stroke 1.24
11Hyperten-
sionArthrosis
Atheriosclerosis
0.99 Hyperten-
sionDiabetes Osteoporosis 1.24
12Hyperten-
sionAsthma/COPD
Ischemic heart
disease0.99
Hyperten-sion
Asthma//COPD
Lipid metabolism disorders
1.19
13Hyperten-
sionArthrosis
Ischemic heart
disease0.87
Hyperten-sion
Diabetes Stroke 0.80
14Hyperten-
sionArthrosis Stroke 0.85
Hyperten-sion
Asthma/COPD
Osteoporosis 0.76
15Hyperten-
sionAsthma/COPD
Stroke 0.80 Hyperten-
sionDiabetes
Ischemic heart
disease0.74
Total 6,402 persons 28.25 15,182 persons 36.16
〈Table 18〉 Combinations of multiple chronic conditions among multimorbid
patients excluding low back pain by gender (65 and above)

46 Distribution and types of multiple chronic conditions in Korea
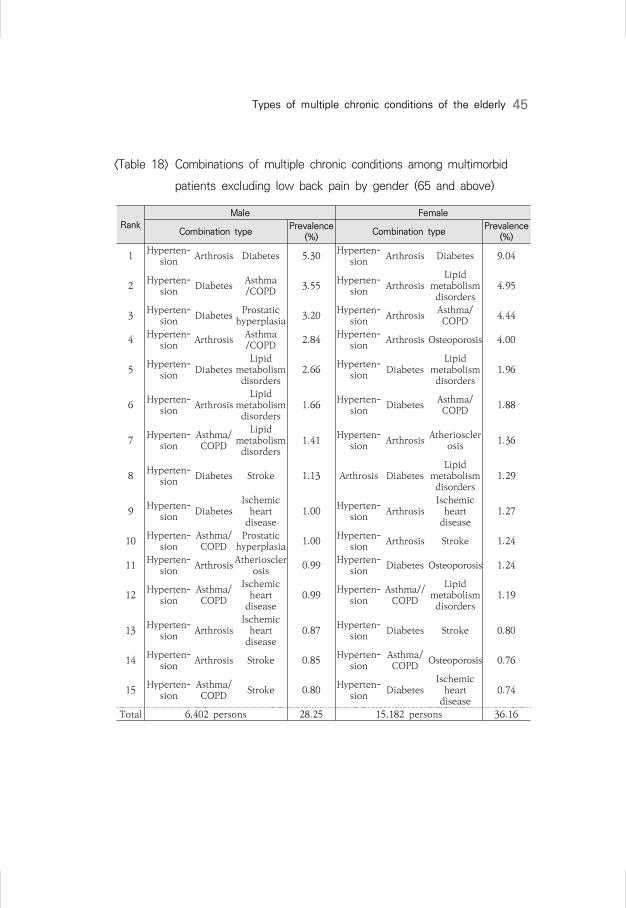
The following table shows the combinations of three chronic
conditions after excluding both low back pain and
hypertension. Among them, the combination with the highest
prevalence rate was that of arthrosis, diabetes and lipid metab-
olism disorders, with 2.17% of multimorbid patients belonging
to this combination group.
〈Table 19〉 Combinations of multiple chronic conditions among multimorbid
patients excluding low back pain and hypertension
Rank Combination type Prevalence (%)
1 Arthrosis DiabetesLipid metabolism
disorders2.17
2 Arthrosis Diabetes Asthma/COPD 1.68
3 Arthrosis Diabetes Osteoporosis 1.28
4 Arthrosis Asthma/COPDIschemic heart
disease0.60
5 Arthrosis Diabetes Neuropathies 0.54
6 Arthrosis Diabetes Stroke 0.52
7 ArthrosisLipid metabolism
disordersChronic ischemic
heart disease0.51
8 Arthrosis DiabetesIschemic heart
disease0.50
9 DiabetesLipid metabolism
disordersChronic stroke 0.49
10 DiabetesLipid metabolism
disordersChronic ischemic
heart disease0.49
11 Arthrosis Asthma/COPD Stroke 0.47
12 Arthrosis Asthma/COPD Atheriosclerosis 0.46
13 Arthrosis Asthma/COPD Neuropathies 0.46
14 ArthrosisLipid metabolism
disordersChronic stroke 0.43
15 Arthrosis Diabetes Atheriosclerosis 0.37
Total 7,090 persons 10.97
No. of multimorbid
patients64,630 persons1) 100.00
Note: 1) Common chronic conditions that arise due to dysfunctions that come with age such as gastritis, allergies, severe vision loss, dizziness, headache, anemia, severe hearing loss, psoriasis, anxiety, obesity and smoking, were excluded from chronic conditions here.

Types of multiple chronic conditions of the elderly 47
RankMale Female
Combination typePrevalence
(%)Combination type
Prevalence(%)
1 Arthrosis DiabetesAsthma/COPD
1.39 Arthrosis DiabetesLipid
metabolism disorders
2.61
2 Arthrosis DiabetesLipid
metabolism disorders
1.34 Arthrosis DiabetesOsteoporo-
sis1.84
3 ArthrosisAsthma/ COPD
Prostatic hyperplasia
0.90 Arthrosis DiabetesAsthma/ COPD
1.84
4 DiabetesLipid
metabolism disorders
Chronic ischemic
heart disease
0.79 ArthrosisAsthma/ COPD
Ischemic heart
disease0.62
5 DiabetesAsthma/ COPD
Prostatic hyperplasia
0.73 Arthrosis DiabetesNeuropa-
thies0.59
6 DiabetesLipid
metabolism disorders
Chronic stroke
0.65 ArthrosisLipid
metabolism disorders
Chronic ischemic
heart disease
0.59
7 Arthrosis DiabetesProstatic
hyperplasia0.60 Arthrosis
Lipid metabolismdisorders
Chronic stroke
0.53
8 DiabetesAsthma/ COPD
Ischemic heart
disease0.60 Arthrosis Diabetes Stroke 0.52
9 ArthrosisAsthma/ COPD
Ischemic heart
disease0.57 Arthrosis
Asthma/ COPD
Atherio-sclerosis
0.52
10 DiabetesLipid
metabolism disorders
Prostatic hyperplasia
0.55 Arthrosis DiabetesIschemic
heart disease
0.52
11 DiabetesAsthma/ COPD
Stroke 0.55 ArthrosisOsteoporo-
sisChronic stroke
0.52
12 Arthrosis Diabetes Stroke 0.53 ArthrosisAsthma/ COPD
Neuropa-thies
0.5
13 Arthrosis DiabetesNeuropath
ies0.45 Arthrosis
Asthma/ COPD
Stroke 0.5
14 Arthrosis DiabetesIschemic
heart disease
0.45 ArthrosisOsteoporo-
sis
Chronic ischemic
heart disease
0.5
15 ArthrosisAsthma/ COPD
Stroke 0.42 ArthrosisOsteoporo-
sis
Atheriosclerosis/peripheral arterial
occlusive disease
0.49
Total 2,390 10.52 5,320 12.69
〈Table 20〉 Combinations of multiple chronic conditions among multimorbid
patients excluding low back pain and hypertension by gender

48 Distribution and types of multiple chronic conditions in Korea
C. Analysis of the risks of multiple chronic conditions for the elderly
Logistic regression analysis was carried out on 155,380 peo-
ple aged 65 or older to estimate their risks of getting multiple
chronic conditions.
The risk of medical care beneficiaries to get multiple chronic
conditions was 1.47 times higher than that of health insurance
holders. This indicates that low-income groups are more vul-
nerable to multiple chronic diseases. In addition, men had
higher risk of getting multiple chronic conditions than women,
and the age group between 70 and 75 appeared to have higher
risk than people 85 years of age or older.
The result of analysis of the odds ratio to determine the rela-
tionship between chronic conditions and multiple chronic con-
ditions showed that people who had asthma/COPD had 16.7
times higher risk than those who did not. Asthma was followed
by chronic low back pain, insomnia, depression, urinary tract
calculi, urinary incontinence, hypotension, etc. in the order of
risk. Comparison between men and women showed that they
had similar overall risks, but in the case of gallstones (14.4) and
prostatic hyperplasia (13.5), men had a higher odds ratio than
women. Women were seen to have a higher odds ratio than
men with regard to chronic conditions including asthma (18.2),
urinary incontinence (16.6) and lower limb varicosis (15.3).

Types of multiple chronic conditions of the elderly 49
〈Table 21〉 Odds ratio of multiple chronic conditions among the elderly aged
65 or older
Classification Odds ratio SE p-valueMale 0.848 0.009 <.000165~70 1.762 0.015 <.000170~75 1.826 0.015 <.000175~80 1.722 0.017 <.000180~85 1.410 0.021 0.001585 and above 1.000Medical care benefits 1.470 0.051 0.0002Health insurance 1.000Asthma/COPD 16.686 0.015 <.0001Chronic low back pain 15.803 0.011 <.0001Insomnia 15.381 0.028 <.0001Depression 15.363 0.033 <.0001Urinary tract calculi 14.985 0.095 <.0001Urinary incontinence 13.978 0.075 <.0001Hypotension 13.959 0.204 <.0001Prostatic hyperplasia 13.773 0.019 <.0001Arthrosis 13.632 0.012 <.0001Liver disease 13.307 0.029 <.0001Neuropathies 13.178 0.028 <.0001Chronic cholecystitis/gallstones 12.862 0.072 <.0001Rheumatoid arthritis 12.137 0.045 <.0001Thyroid dysfunction 11.193 0.033 <.0001Osteoporosis 10.532 0.018 <.0001Lower limb varicosis 10.222 0.078 <.0001Ischemic heart disease 10.112 0.019 <.0001Renal insufficiency 10.079 0.047 <.0001Cancers 9.905 0.022 <.0001Cardiac valve disorders 9.881 0.084 <.0001Lipid metabolism disorders 9.758 0.014 <.0001Atheriosclerosis/peripheral arterial occlusive disease 9.320 0.020 <.0001Cardiac arrhythmias 8.938 0.033 <.0001Diabetes 8.407 0.012 <.0001Parkinson's disease 8.314 0.045 <.0001Stroke 7.927 0.017 <.0001Hypertension 7.685 0.009 <.0001Cardiac insufficiency 7.093 0.037 <.0001Dementia 6.338 0.023 <.0001
-2 Log L=208536.27LR=111989.245
Note: Results of logistic regression analysis (n=155,380).

50 Distribution and types of multiple chronic conditions in Korea
Male(Odds ratio)
Female(Odds ratio)
Hypotension 20.649 Asthma/COPD 18.156Insomnia 16.098 Depression 17.308Chronic low back pain 15.912 Urinary incontinence 16.562Asthma/COPD 15.238 Chronic low back pain 15.770Urinary tract calculi 14.877 Lower limb varicosis 15.323Chronic cholecystitis/ gallstones
14.359 Urinary tract calculi 15.155
Arthrosis 13.957 Insomnia 14.881Liver disease 13.815 Neuropathies 14.088Prostatic hyperplasia 13.504 Arthrosis 13.564Rheumatoid arthritis 13.408 Liver disease 12.636Depression 12.409 Rheumatoid arthritis 11.617Neuropathies 12.106 Chronic cholecystitis/
gallstones11.415
Cardiac valve disordesrs 11.051 Thyroid dysfunction 11.390Renal insufficiency 10.788 Osteoporosis 10.845Cancers 10.679 Chronic ischemic heart
disease10.422
Thyroid dysfunction 10.425 Lipid metabolism disorders 10.046Chronic ischemic heart disease
9.880 Cardiac arrhythmias 9.552
Parkinson's disease 9.288 Atheriosclerosis/peripheral arterial occlusive disease
9.521
Lipid metabolism disorders
9.287 Renal insufficiency 9.220
Atheriosclerosis/peripheral arterial occlusive disease
9.082 Cardiac valve disorders 9.179
Diabetes 8.699 Cancers 8.761Cardiac arrhythmias 8.359 Chronic stroke 8.22Osteoporosis 8.269 Diabetes 8.199Chronic stroke 7.593 Hypertension 7.838Hypertension 7.554 Parkinson's disease 7.766Urinary incontinence 7.192 Cardiac insufficiency 7.457Lower limb varicosis 7.045 Hypotension 7.265Dementia 6.755 Dementia 6.260Cardiac insufficiency 6.544
〈Table 22〉 Odds ratio of multiple chronic conditions among the elderly aged
65 or older by gender
Note: Results of logistic regression analysis

Types of multiple chronic conditions of the elderly 51
65~74 OR 75~84 OR 85 and above ORAsthma/COPD 16.99 Diabetes 19.11 Cardiac arrhythmias 62.25
Thyroid dysfunction 16.86 Arthrosis 17.66 Cancers 31.23
Atheriosclerosis/peripheral arterial occlusive disease
15.64
Neuropathies 17.36
Renal insufficiency 23.51
Renal insufficiency 15.11 Renal insufficiency 16.25 Insomnia 22.91
Diabetes 14.39
Asthma/COPD 15.67 Chronic cholecystitis/ gallstones
22.31
Arthrosis 13.99
Atheriosclerosis/peripheral arterial occlusive disease
15.01
Asthma/COPD 19.96
Cardiac valve disorders
13.25 Cardiac valve disorders
14.36 Chronic low back pain
19.75
Chronic stroke 13.16 Urinary tract calculi 14.01 Thyroid dysfunction 19.31
Neuropathies 12.40 Insomnia 13.90 Chronic stroke 19.16
Insomnia 12.32 Chronic stroke 13.84
Atheriosclerosis/peripheral arterial occlusive disease
17.92
Cardiac arrhythmias 12.31 Chronic low back pain
13.51 Chronic ischemic heart disease
16.87
Cancers 11.75 Thyroid dysfunction 13.02 Lipid metabolism disorders
16.33
Urinary tract calculi 11.38 Cancers 12.91 Cardiac insufficiency 16.21
Chronic cholecystitis/ gallstones
10.43 Chronic cholecystitis/ gallstones
12.04 Cardiac valve disorders
15.02
Dementia 10.25 Lower limb varicosis 11.18 Neuropathies 14.46
Liver disease 10.01 Lipid metabolism disoders
11.10 Liver disease 12.99
Parkinson's disease 9.80 Dementia 10.94 Urinary incontinence 11.84
Cardiac insufficiency 9.39 Cardiac arrhythmias 10.88 Depression 11.69
Lower limb varicosis 9.35 Cardiac insufficiency 10.06 Dementia 11.66
Lipid metabolism disorders
9.34 Liver disease 10.06 Hypertension 11.64
Urinary incontinence 9.31 Parkinson's disease 9.82 Urinary tract calculi 11.53
Rheumatoid arthritis 9.08 Urinary incontinence 9.05 Parkinson's disease 11.20
Chronic low back pain 8.91 Rheumatoid arthritis 8.57 Rheumatoid arthritis 11.05
Prostatic hyperplasia 8.36 Chronic ischemic heart disease
8.43 Lower limb varicosis 10.58
Depression 7.51 Prostatic hyperplasia 8.41 Arthrosis 10.05
Chronic ischemic heart disease
7.48 Hypertension 8.16 Prostatic hyperplasia 9.99
Hypertension 7.26 Osteoporosis 8.10 Hypotension 8.94
Osteoporosis 6.76 Depression 8.06 Diabetes 7.55
Hypotension 6.54 Hypotension 5.94 Osteoporosis 7.03
〈Table 23〉 Odds ratio of multiple chronic conditions among the elderly aged
65 or older by age
Note: Results of logistic regression analysis


Chapter 5
Discussion and conclusion


The distribution of multiple chronic conditions of the elderly
aged 65 or older shows that only 4.7% of them had no chronic
condition while 14.1% had one chronic condition, 20.7% had
two chronic conditions, and 60.5% had three or more chronic
conditions, suggesting that the elderly in general have consid-
erable difficulties due to multiple chronic conditions. After the
analysis of the risks of multiple chronic conditions according to
socioeconomic background, it appeared that the low-income
groups were more vulnerable to the risks of multiple chronic
conditions. Concerning the combinations of three or more
chronic conditions that occur frequently, the combination of
hypertension, chronic low back pain and arthrosis was the
most common among multimorbid patients at 19.0%, followed
by the combination of hypertension, chronic low back pain and
diabetes at 5.94% and the combination of hypertension, arthro-
sis and diabetes at 3.02%. Meanwhile, the top 15 multi-
morbidity combinations accounted for 50.30% of the overall
combinations. Among the top 15 combinations, hypertension is
included in 11 combinations, chronic low back pain in 10, ar-
throsis in 8 and diabetes in 5 combinations.
<<5 Discussion and conclusion

56 Distribution and types of multiple chronic conditions in Korea
If the current trend is maintained, the number of multi-
morbid patients with two or more chronic conditions will also
continue to grow. People who have multiple chronic conditions
tend to have short duration of survival and are more likely to be
hospitalized, with their quality of life declining. In addition, as
they are prescribed with numerous complex medications, their
management of medical doses is likely to be aggravated (Nobili
et al., 2011)8).
Disease management guidelines, clinical pathways for pa-
tients and clinical practice guidelines have been developed to
manage and promote the health of chronic disease patients,
but these guidelines are limited to individual diseases. This
kind of approach can underestimate the psychosocial factors
that affect patients' health, and it is necessary to develop mul-
tiple treatment systems to deal with interactions and side ef-
fects of different drugs and lack of long-term management. It is
seen that the strategy for management of patient care, rather
than diseases, should be developed in consideration of both
physical and psychosocial conditions.
Therefore, more efforts have to be made to set the policy di-
rection and develop the strategy for effective and appropriate
management of chronic conditions. In relation to this, first, it is
necessary to change the approach to the prevention and man-
agement of chronic conditions. There should be a shift from
8) Nobili et al. Multiple diseases and polyharm, Journal of Comorbidity, 2011.
Discussion and conclusion 57
the segmented chronic disease management model centered on
individual diseases and suppliers to continuous, integrated and
patient-centered wellness model to enable sustained pre-
vention and management throughout the periods before the
disease occurrence and during the retention and aggravation of
the disease.
Second, proper functions and roles as well as networking of
the central government and relevant institutions should be
made for the management of chronic conditions, and the ef-
forts for realignment of laws and regulations that link health
services, welfare services and social services are required to
provide wellness services to the socially disadvantaged groups
in the local communities.
Third, the foundation for the generation of valid basis on the
effects of chronic disease management programs should be
established. To achieve this goal, institutional measures need
to be taken to make health and medical data held by organ-
izations such as the National Health Insurance Service and the
Health Insurance Review and Assessment Service available for
the management of chronic conditions.
Fourth, continued self-care by the patients is more important
than anything. Efforts to develop effective programs that can
induce change in individual behaviors and help maintain
healthy life habits are required. While incentives should be
provided to change personal behaviors, there is a limitation to

58 Distribution and types of multiple chronic conditions in Korea
financial incentives. Also, various factors determine individual
behaviors or health consciousness. Thus, it is necessary to fa-
cilitate efforts for the development of cost-effective programs
and strategy through more in-depth analysis on diversified hu-
man behaviors.
It is time that we had a paradigm shift from the conventional
approach in order to alleviate the burden of (multiple) chronic
conditions, thereby contributing to the improvement of na-
tional public health and guaranteeing the sustainability of
healthcare financing.

References 59
References
Source book for the Forum for the Reinforcement of the Functions of
Public Health and Primary Care, June 17, 2013
Press release, National Health Insurance Service, December 29, 2011
Gwang-gi Kim et al., A Study for the Improvement of the Health
Hazard Factor Management System: With the Focus on Alcohol,
Smoking and Junk Food, Industry-University Cooperation Group
of Inje Institute of Advanced Studies and Korea Health
Promotion Foundation
Jeong-sun Kim et al., Epidemiology and Healthcare Management in
Local Communities, Seoul National University Press, 1996
Jong-yeon Park et al., Management of Chronic Diseases by Insurance
Holders: Mid- to Long-term Road Map (2008-2012), National
Health Insurance Service, 2007
Ministry of Health and Welfare, 2nd Comprehensive Plan on
Cardio-cerebrovascular Diseases (2011-2015), 2011
Chang-hyeon Seong, Plan for Reinforcement of Sustained Health
Management of Chronic Disease Patients who Use
Neighborhood Clinics, Policy Trends, Vol. 6, No.1, Health
Insurance Review and Assessment Service, 2012
Yeong-seok Shin et al., Improving the Sustainability of Healthcare
Delivery in Line with NHI Coverage Enhancement, Korea
Institute for Health and Social Affairs (KIHASA), 2013
Seok-jun Yoon, Future Directions of Chronic Disease Management in
South Korea, Journal of the Korean Medical Association, 55(5),
2012
Seok-jun Yoon, Source book for the Seminar for the Prevention of

60 Distribution and types of multiple chronic conditions in Korea
Chronic Diseases and Development of Disease Management
Model Based on Local Communities, Mar. 28, 2013
Gyeong-su Lee, Suggestions for the Design of Noncommunicable
Disease Management Model in Korea, paper presented at the 1st
Korea Noncommunicable Disease Forum, Oct. 2013
Ae-ju Lee and Sang-geon Lee, A Study on Perceived Value of Wine by
Using Two-step Cluster Analysis, Korean Journal of Tourism
Research, Vol. 27, No.2, pp393~411
Jae-ho Lee, Plan for Introduction of Attending Physician System,
discussion paper for policy debate, 2009
Young-Ho Jung et al., A Report on the 2010 Korea Health Panel
Survey, KIHASA and the National Health Insurance Service, 2011
Young-Ho Jung,「Issues of Healthcare Delivery System」, paper
presented at the policy forum held by the Korean Association of
Health Economics and Policy and KIHASA, Oct. 6, 2012.
Young-Ho Jung et al., A Study on the Health-friendly Fiscal Policy,
KIHASA, 2011
Young-Ho Jung et al., Comparison of Life Time Distribution of
Medical Costs of Obesity and Smoking and Analysis of Mid- to
Long-term Effects Based on Health Improvement, KIHASA and
the Healthcare Service Support Center, 2010
Young-Ho Jung et al., Socioeconomic Cost of Alcohol and
Cost-effectiveness of Interventions to Reduce Alcohol-related
Harm, KIHASA and the Korea Health Promotion Foundation,
2012
Young-Ho Jung, 「Issues of Healthcare Delivery System」, paper
presented at the policy forum held by the Korean Association of
Health Economics and Policy and KIHASA, Oct. 6, 2012.

References 61
Young-geon Ji, Physician Assistant System: In Relation to the
Management of Chronic Diseases, 47th Symposium of Korean
Academy of Health Policy and Management, 2011
Korea Centers for Disease Control and Prevention, 2011 White Paper
on Disease Control
Korea Centers for Disease Control and Prevention, Korea Health
Statistics, 2012
Young-sun Choi et al., Pilot Project on the Family Doctor System for
Chronic Diseases, National Health Insurance Service, 2009
Korea Health Promotion Foundation, Tobacco Control Issue Report,
2013
KIHASA, Health and Welfare Policies in the MB Administration:
Outcomes and Future Tasks, mimeo, 2012
Alliance for Health Reform, The Case for Prevention: Tales from the
Field, Alliance for Health Reform, 2009. 9.
Barlow J, Bancroft G, Turner A, Self-management training for people
with chronic disease: A shared learning experience. Journal of
Health Psychology 2005; 10(6): 863-872
Barr VJ, Robinson S, Marin-Link B, Underhill L, Dotts A, Ravensdale D,
et al. The expanded Chronic Care Model: an integration of
concepts and strategies from population health promotion and
the Chronic Care Model. Hosp Q 2003;7:73-82.
Buck and Frosini, "Clustering of unhealthy behaviours over time -
Implications for policy and practice", The Kings Fund
Cohen, Neumann, Weinstein, Does Preventive Care Save Money?
Healthy Economics and Presidential Candidates, The New
England Journal of Medicine(2008)
Department of Health and Human Services (US). HHS initiative on

62 Distribution and types of multiple chronic conditions in Korea
multiple chronic conditions, 2011.
http://www.hhs.gov/ash/initiatives/mcc/index.html
DeVol (2008), An unhealthy America : The Economic Burden of
Chronic Disease
Diagnosis and Management of COPD in Primary Care. Primary Care
Respiratory Society, UK www.pcrs-uk.org
Goetzel, Do Prevention Or Treatment Services Save Money? The
Wrong Debate, Health Affairs 28.1, 2008.
Kamerow et al., Desinging a High-Quality Package of Preventive
Services, Partnership for Prevention, 2008
Lalonde M., A new perspective on the health of Canadians: A working
document, Government of Canada, 1974.
Lindsay S. How and why the motivation and skill to self-manage
coronary heart disease are socially unequal. Research in the
Sociology of Health Care 2008;26: 17-39
Long term conditions strategy and vision 2012-2017
Mattke S, Seid M, Sai M. Evidence for the effect of disease
management: Is US$ 1 billion a year a good investment?
American Journal of Managed Care 2007;13: 670-676.
National Clinical Guideline Centre. (2010) Chronic obstructive
pulmonary disease: management of chronic obstructive
pulmonary disease in adults in primary and secondary care.
London: National Clinical Guideline Centre.
NHS Wales (2007), Improving Health and the Management of Chronic
Conditions in Wales: An Integrated Model and Framework for
Action
NHS, Managing multi-morbidity in practice; what lessons can be
learnt form the care of people with COPD and co-morbidities?,

References 63
2013
Nobili et al. (2011) Multiple diseases and polyharm Journal of
Comorbidity
Norusis MJ SPSS 12.0 Statictical procedures compaion, Upper Saddle
River, NJ: Prentice-Hall. 2003
Papekh A. Goodman R. Gordon C et al. Managing Multiple Chronic
Conditions: A Strategic Framework for Improving Health
Outcomes and Quality of Life. Public Health Reports / July– August 2011 / Volume 126
Partnership for Prevention, Guide to Smart Prevention Investments,
2001.
Partnership for Prevention, U.S. Could save 100,000 Lives a Year with
Five Basic Preventive Services, 2009, 2001.
PFCD and Partnership for prevention, The Value of Prevention, 2008.
Russell (2007), Prevention's potential for slowing the growth of
medical spending
Shahady(2006), Barriers to care in chronic diseases: How to bridge the
treatment gap, www.consultantlive.com
Trust for America's Health, Prevention for a Healthier America, 2008
van den Akker et al., Problems in determining occurrence rates of
multimorbidity. J Clin Epidemiol 2001;54:675-679.
van den Bussche et al. Which chronic diseases and disease
combinations are specific to multimorbidity in the elderly?
Results of a claims data based cross-sectional study in Germany.
BMC Public Health 2011;11:101.
Wagner EH. Chronic disease management: what will it take to improve
care for chronic illness? Eff Clin Pract 1998;1:2-4.
Waterloo Wellington Local Health Integrated Network(WWLHIN),

64 Distribution and types of multiple chronic conditions in Korea
Working Together for a Healthier Future: Integrated Health
Service Plan 2010-2013
Woolf et al., The Economic Argument for Disease Prevention:
Distinguishing Between Value and Savings, Partnership for
Prevention, 2009
World Health Organization. The Innovative Care for Chronic
Conditions framework (ICCC) [cited 2011 Mar 22].
WHO, Noncommunicable Diseases - Country Profiles 2011, WHO,
2011
OECD, Health Care Quality Review: Korea, OECD 2012
Woolf, Husten, Lewin et al., The Economic Argument for Disease
Prevention: Distinguishing Between Value and Savings,
Partnership for Prevention, 2009
Top Related