


Languages
Pages
Legal


Graph Comprehension:
Difficulties, Individual Differences, and Instruction
by
Ronit Ann Greenberg
A dissertation submitted in partial fulfillment of the requirements for the degree of
Doctor of Philosophy (Psychology)
in the University of Michigan 2014
Doctoral Committee:
Professor William J. Gehring, Co-Chair Professor Priti Shah, Co-Chair Assistant Professor Eytan Adar Professor J. Frank Yates

© Ronit Greenberg
All rights reserved 2014

ii
This work is dedicated to my paternal grandmother, Rachel Greenberg, whose inner
strength and spirit have been a true inspiration. As a holocaust survivor, she has always
promoted the pursuit of knowledge and she taught me that education is one of the most
important things in life, as education, once achieved, cannot be taken away from you. In
pursuing my own goals, I thank her for acting as a role model for accomplishment in the
face of adversity. From her life lessons, I know that no matter how hard the path, it is
imperative to hope and to continue working towards my goals. Although I do not have
the opportunity to see her often, she is always in my heart.

iii
Acknowledgements
Thank you to my advisor, Dr. Priti Shah, who has been an absolutely wonderful
mentor throughout the dissertation process. I really appreciate your continued support,
both academically and personally. You have been so welcoming ever since you adopted
me into your lab, and I feel that your guidance has been instrumental in my professional
growth. You really did make graduate school and research so much more fun and
exciting, and despite all the numerous demands on your time I always felt like you were
there for me when I most needed you.
I would also like to thank my dissertation committee members Eytan Adar, Bill
Gehring, and Frank Yates, for taking time out of their very busy schedules to read my
prospectus and dissertation, attend dissertation committee meetings, and provide their
expert opinions and valuable feedback on my research.
Thank you to all of my fellow lab members (Erin Bogan, Molly Garrett, Amira
Ibrahim, Benjamin Katz, Lauren Nemazi, Xingyu Pan, Rebecca Rhodes, and Zuowei
Wang) who provided me with feedback on my research, listened to all of my practice
talks, and helped me with materials or data collection. Rebecca, I especially want to
thank you for your advice and expertise regarding data analysis and study set-up in
Qualtrics and MTurk.
Thank you to all the research assistants who were integral to my data collection and
coding for the past several years, including Audriana Buchanan, Mollie Bush, Nicholas
Bruning, Rachel Dash, Melissa Durante, Neil Dwivedi, Akhil Gutta, Kathryn Hohs, Lisa
Lederman, Alex Lim, Victoria Ruiz, Kyce Soerries, Samuel Song, Jing Xiao, and Carlos
Yeguez. You all made my research possible.
Last, but not least, I would like to thank my family for their unwavering support and
unconditional love throughout my life and on the path that led me here. Thank you for
believing in me even during my moments of self-doubt. Mom, I especially love that you
are always willing to listen, even when you are not entirely sure what you are listening to.
Dad, I especially appreciate your sound advice even when I don’t seem to follow it, as
well as your varied analogies that are sometimes bizarre and yet make perfect sense. Gil,

iv
thanks for being so supportive and understanding even while working so hard towards
your own personal goals.
Aaron, thank you for your understanding when I had little or no time to spare, and
for all your emotional support along the way. Thank you for all the little things that make
me smile and for reminding me to enjoy the moments as they come. I hope we have
many more moments together.

v
Table of Contents
Dedication ........................................................................................................................... ii
Acknowledgments .............................................................................................................. iii
List of Figures .................................................................................................................. viii
List of Tables ..................................................................................................................... ix
List of Appendices ............................................................................................................. xi
Abstract ............................................................................................................................. xii
CHAPTER 1: INTRODUCTION ........................................................................................1
Why Are Graphs Important? ....................................................................................1
Graph Characteristics and Difficulty .......................................................................2
Graph Comprehension as a Construct and its Relation to Instruction .....................4
What Makes a “Good” Visualization or Graph? ......................................................6
Relating the Notion of “Desirable Difficulties” to Graphs ......................................7
The Role of Individual Differences .........................................................................9
Goals of the Current Research ...............................................................................12
CHAPTER 2: GRAPHS IN TEXTBOOK EXCERPTS ....................................................16
Introduction ............................................................................................................16
Experiment 1 ..........................................................................................................18
Method .......................................................................................................18
Results ........................................................................................................21
Discussion ..................................................................................................23

vi
CHAPTER 3: GRAPH COMPREHENSION IN IMMEDIATE AND LONG-TERM
MEMORY TASKS .....................................................................................28
Introduction ............................................................................................................28
Experiment 2 ..........................................................................................................29
Introduction ................................................................................................29
Method .......................................................................................................30
Results and Discussion ..............................................................................35
Experiment 3 ..........................................................................................................40
Introduction ................................................................................................40
Method .......................................................................................................40
Results and Discussion ..............................................................................43
General Discussion ................................................................................................46
CHAPTER 4: GRAPH COMPREHENSION INSTRUCTION ........................................61
Introduction ............................................................................................................61
Experiment 4 ..........................................................................................................63
Introduction ................................................................................................63
Method .......................................................................................................63
Results and Discussion ..............................................................................65
Experiment 5 ..........................................................................................................66
Introduction ................................................................................................66
Method .......................................................................................................66

vii
Results and Discussion ..............................................................................68
General Discussion ................................................................................................71
CHAPTER 5: CONCLUSION ..........................................................................................82
Summary of Findings .............................................................................................82
The Notion of Desirable Difficulties in Graph Comprehension ............................84
Individual Differences as Key Players in Graph Comprehension .........................87
Building an Effective Tool for Instruction .............................................................89
Appendices .........................................................................................................................93
References ........................................................................................................................120

viii
List of Figures
Figure 1.1 Automated Symmetry Span Task Sample Trial Sequence ........................14
Figure 3.1 Sample Screens of Graph Tutorial Explanations for Interactions and
Main Effects ...............................................................................................49
Figure 3.2 Example 2x2x2 Line Graphs .....................................................................50
Figure 3.3 Automated Symmetry Span Task Sample Trial Sequence ........................51
Figure 3.4 Experiment 3 Graph First Verification Task Sample Trial Sequence .......52
Figure 3.5 Experiment 3 Long-Term Memory Task Sample Trial Sequence .............53
Figure 3.6 Three-way Interaction between Working Memory Span, Time of Test,
and Graph Type for Experiment 3 .............................................................54
Figure 4.1 Example of Graph Tutorial “Static Builds” for the Mental Averaging
Process for Main Effects ............................................................................73
Figure 4.2 Experiments 4 and 5 Question First Verification Task Sample Trial
Sequence ....................................................................................................74
Figure 4.3 Example 2x2x2 Line Graphs .....................................................................75

ix
List of Tables
Table 1.1 Analysis of Graphs in Psychology Textbooks ...........................................15
Table 2.1 Means for Recognition Accuracy by Condition and Question Type .........26
Table 2.2 Between-Subjects ANOVA of Recognition Accuracy by Condition
with Need for Cognition (NFC) as a Covariate .........................................27 Table 3.1 Paired Comparisons for Proportions of Correct Responses by Graph
Type ...........................................................................................................55
Table 3.2 Means of Individual Difference Measures for Experiments 2 and 3 .........56
Table 3.3 Correlations between Individual Difference Measures and Task
Performance for Experiment 2 ...................................................................57
Table 3.4 Additional Correlations between Individual Difference Measures and
Task Performance for Experiment 2 ..........................................................58
Table 3.5 ANOVA of Task Accuracy and Response Time (RT) by Graph Type
and Task .....................................................................................................59
Table 3.6 Correlations between Individual Difference Measures and Graph First
Verification Task Performance for Experiment 3 ......................................60
Table 4.1 ANOVA for Task Accuracy and RT by Graph Type (Label/Legend)
and Experiment ..........................................................................................76
Table 4.2 Means of Individual Difference Measures for Experiments 2-5 ...............77
Table 4.3 Correlations between Individual Difference Measures and Task
Performance for Experiment 4 ...................................................................78
Table 4.4 Regression Analyses for Experiment 4 versus Experiment 5 with All
Individual Difference Measures .................................................................79

x
Table 4.5 Regression Analyses for Experiment 4 versus Experiment 5 with
Working Memory (WM) Span, Graph Literacy, and Need for
Cognition (NFC) ....................................................................................... 80
Table 4.6 Correlations between Individual Difference Measures and Task
Performance for Experiment 5 ...................................................................81

xi
List of Appendices
Appendix A Graph Literacy Scale ......................................................................93
Appendix B Actively Open-Minded Thinking (AOT) Scale .............................99
Appendix C Need for Cognition (NFC) Scale .................................................106
Appendix D Cognitive Reflection Test (CRT) .................................................110
Appendix E Experiment 1 Modified Textbook Excerpt ..................................111
Appendix F Experiment 1 Free-Response Question Coding Scheme .............114
Appendix G Demographic Questionnaire ........................................................115
Appendix H Exit Survey ...................................................................................117
Appendix I Experiment 2 Sample Open-ended Graph Description Task
Coding Scheme ............................................................................118
Appendix J Sample True-False Statements for Experiments 3-5 ...................119

xii
Abstract
Graphs are pervasive in our daily lives (e.g., newspapers, textbooks, scientific journals,
classrooms), and there is an implicit assumption that, although they are not explicitly
taught graphical literacy, people are capable readers of graphs. However, interpreting
multivariate data presented graphically is extremely challenging and few, if any,
instructional tools or guidelines exist for teaching complex graph interpretation.
Furthermore, designing graphs of multivariate data to make them more interpretable and
instructing individuals to interpret graphs are both complicated by the fact that numerous
factors likely influence the graph interpretation process: the type of display, individuals’
initial graphical literacy skills, their working memory (WM) capacity, and their attitudes
or dispositions towards thinking and avoiding belief bias. The goals of the current
research were to determine: (1) how well people comprehend main effects and
interactions in complex multivariate data presented graphically and the extent to which
some graph format characteristics influence the process; (2) whether students can be
taught to interpret main effects and interactions in complex graphs and what might
comprise such an instructional tutorial; and (3) the role of individual differences in
complex graph comprehension. To address these questions, five experiments were
conducted. Experiment 1 examined how much people attend to graphs, and whether the
existence of a graph to summarize data already described in a text help them remember or
understand the data. Experiments 2 and 3 examined students’ interpretation of
multivariate graphs in a self-paced, open-ended task and in immediate and long-term
memory tasks, and the effect of graph format in these various contexts. Finally,
Experiments 4 and 5 examined whether a tutorial could be an effective instructional tool
for improving graph skills, and how instruction is differentially impacted by individual
differences. In general, individual differences emerged as extremely influential factors in
graph comprehension and the training of graph skills, whereas graph format did not play
a key role in the current research. Additional research is suggested for further
development of the tutorial as an educational resource, and educators should promote
enjoyment of cognitive work in the classroom to increase benefit of instruction.

1
CHAPTER 1:
INTRODUCTION
Why Are Graphs Important?
In the current "Information Age", when a lot of complex data is readily accessible at
the press of a button, people are increasingly facing the task of analyzing and
communicating such information. Diagrams, graphs, and pictures are frequently used to
communicate information to learners in textbooks, research journals, power point
presentations, web pages, and educational software. Moreover, visualizations are
common in news sources such as USA Today and the New York Times and are used to
convey different types of data from which readers may make decisions such as who to
vote for or whether or not to consume red wine. Certainly, the use of graphs to depict
quantitative data has increased over the years, especially for academic journals and
newspapers (Zacks, Levy, Tversky, & Schiano, 2002).
The current research focuses specifically on graphs, especially those of complex data,
due to the following reasons. Although there has been an increase in research relating to
graph comprehension over the years, much of this research has corresponded to simpler
data sets that contain two-variable data or a small number of data points, and conclusions
from these studies do not usually generalize to graph comprehension of more complex
multivariate data (Canham & Hegarty, 2010; Ratwani & Trafton, 2008; Shah, Freedman,
& Vekiri, 2005; Trafton et al., 2000). Science standards (NSTA; NRC) emphasize the
importance for students to conceptually understand complex models in which two or
more variables interact to create outcomes. Additionally, psychologists and other social
scientists commonly use factorial designs in their experiments, which necessitates that
students be able to read and interpret complex data. Such data sets may contain
complicated relationships between variables, or main effects and interactions. Main
effects are the effects of one independent variable (a variable that was manipulated) on

2
the dependent variable (the variable being measured) while ignoring the effects of all
other independent variables. Interactions occur when the effect of one independent
variable on the dependent variable changes depending on the level of another
independent variable.
Furthermore, there seems to be an expectation that readers or students are capable of
understanding such complex graphs even when not explicitly taught to do so. For
example, I recently analyzed the contents of 30 psychology textbooks, written primarily
for undergraduate students ranging in publication dates from 1997 to 2013. These
textbooks included nine General or Introductory Psychology books, eight Cognitive
Psychology books, eight Research Methods books, two Cognitive Neuroscience books,
two Social Psychology books, and one Abnormal Psychology book. I found 1,345 graphs
depicting quantitative data. That is, approximately 45 graphs were present per
textbook. Of these graphs, at least 540 of them could be considered relatively complex as
they contained factorial designs of 2x2 or greater, and only a very small number of these
(less than 5) were extremely complex with three independent variables. However, some
of the graphs that would normally be considered extremely complex with three
independent variables are not included in this count, as they were shown side-by-side in
separate panels, possibly in the attempt to simplify the graph complexity or highlight
different aspects of the data. Additionally, at least 700 of the graphs contained labels, at
least 170 of them contained legends, and at least 370 of them contained both labels and
legends. Moreover, at least 630 of them were line graphs and at least 710 of them were
bar graphs. Thus, even in perusing a relatively small sample of textbooks, it is clear that
graphs are prevalent and that students are expected to understand them. A table
describing the information from this analysis is presented in Table 1.1.
Graph Characteristics and Difficulty
Given the underlying assumption that college students are capable of interpreting and
understanding such graphs in textbooks and other contexts, it is important to determine
whether this is a fair expectation. One reason why graphs are used so extensively is a
belief (often misguided) that they make quantitative data easier to understand (Linn,
Chang, Chiu, Zhang, & McElhaney, 2010; MacDonald-Ross, 1977; Tversky, 2001;

3
Winn, 1987). This is mostly true when concepts or important quantitative information
are explicitly depicted in graphs or other visualizations so that minimal cognitive
processing is required (Larkin & Simon, 1987; Pinker, 1990). However, most graphs are
actually not so easy to understand and require mental transformations and other cognitive
processes to comprehend them. How difficult is graph comprehension really?
Graph comprehension is generally thought to include three main components (Bertin,
1983; Carpenter & Shah, 1998; Pinker, 1990; Shah & Carpenter, 1995). Viewers first
encode and identify the important visual features of the graph. This first process can be
affected by inherent perceptual biases and limitations that influence the accuracy (e.g.,
Cleveland & McGill, 1984, 1985; Legge, Gui, & Luebker, 1989; Spence, 1990) and
grouping of the information encoded (e.g., Carpenter & Shah, 1998; Shah, Mayer, &
Hegarty, 1999). Then these features are mapped onto the corresponding quantitative or
conceptual relationships in the second component. This process is influenced by what
was encoded in the first process, how easy it is to map visual features to their referents,
and individuals’ graph schemas, or general knowledge about graphs (Pinker, 1990).
Finally, these quantitative or conceptual relationships are associated with the referents or
the variables of the graph, and this association can be influenced by expectations (Shah,
1995; Shah & Shellhammer, 1999). These three processes are both incremental and
interactive, in that viewers may complete these three processes for different parts of the
graph, and the more complex the graph, the longer it will take to interpret as these
processes will occur for each conceptual relationship (Carpenter & Shah, 1998).
Graph comprehension is unlike object recognition in that it is harder, it can take a
long time, and is limited with regards to how much viewers can process at a
time. Individuals can only keep track of so many variables at a time, and it seems that the
upper limit for processing load is four variables given that performance with five
variables is at chance levels (Halford, Baker, McCredden, & Bain, 2005). Halford et al.
(2005) manipulated processing load while keeping memory load constant, in order to
examine performance on 2, 3, or 4-way interactions in bar graphs. Accuracy and speed
decrease with increasing order of interaction, such as moving from a 2-way interaction to
a 3-way interaction or from a 3-way interaction to a 4-way interaction. Processing load

4
difficulties were not apparent until four variables were introduced, and persisted to
graphs that included five variables.
Indeed, interpreting multivariate data presented graphically is very challenging
(Halford et al., 2005; Shah & Carpenter, 1995; Shah & Freedman, 2011), even for those
who may be considered experts, such as graduate students with extensive research
experience (Shah & Carpenter, 1995). Comprehending moderately complex graphs may
take as long as, or even longer than, comprehending similar information presented
textually (Carpenter & Shah, 1998; Ratwani, Trafton, & Boehm-Davis, 2008). In one
study, for example, it took viewers from 30 seconds to a minute to interpret a graph; that
is about the time it takes to read a short paragraph and much longer than the time needed
to view an object (Carpenter & Shah, 1998). Even simple graphs can be difficult to
interpret (Culbertson & Powers, 1959; Guthrie, Weber, & Kimmerly, 1993; Romberg,
Fennema, & Carpenter, 1993; Vernon, 1946, 1950), particularly when important
information is less obviously depicted, thus leading to more errors and requiring more
effort (Bell & Janvier, 1981; Culbertson & Powers, 1959; Gattis & Holyoak, 1996;
Guthrie et al., 1993; Leinhardt, Zaslavsky, & Stein, 1996; Maichle, 1994; Shah et al.,
1999; Shah & Carpenter, 1995; Vernon, 1946, 1950). Graphs found in textbooks are not
excused either, as some studies have found that readers often misinterpret or fail to
determine the author’s intended message (e.g., Shah et al., 1999). Moreover, statistics
and research methods teachers frequently report that students have difficulty with such
graphs and that interpretation of such data is difficult to teach. Additionally, graph
comprehension can be difficult in that it is influenced by a variety of bottom-up and top-
down factors, including perceptual organization (Shah et al., 1999), graph format
(Ainsworth, 2006; Canham & Hegarty, 2010; Cheng, 1999; Shah et al., 1999; Shah &
Freedman, 2011; Simkin & Hastie, 1987), domain knowledge (Freedman & Shah, 2002;
Lowe, 1993; Shah & Freedman, 2011), and experience with graph conventions (Korner,
2005; Shah et al., 2005).
Graph Comprehension as a Construct and its Relation to Instruction
Graph comprehension has been defined by Friel, Curcio, & Bright (2001) as a
reader’s “ability to derive meaning from graphs created by others or by themselves” (p.

5
132), and is thought to develop gradually through practice in building and using multiple
types of graphs in contexts that require the learner to make sense of the data. Graph
comprehension has also been broken up into multiple competence levels (Curcio, 1989;
Friel et al., 2001): (1) the basic skill of reading the data or finding specific information in
a graph; (2) the intermediate skill of reading between the data, or finding relationships in
the data presented in a graph; and (3) the advanced skill of reading beyond the data, or
making inferences and predictions based on the data.
Although a considerable amount of research has been conducted on graph
comprehension across multiple domains, including mathematics, statistics, decision-
making, information visualization, and cognitive psychology, insufficient crosstalk has
occurred between fields communicating findings, and I have yet to find an evidence-
based consensus or guide for how to teach comprehension of complex multivariate
graphs. Most guides for teaching graphs seem to impart how to use specific software
packages to create graphs of different types or focus solely on graph display and design
(e.g., Kosslyn, 1994; Tufte, 1983), but do not directly address instruction of graph
comprehension. Fry (1981) and colleagues (e.g., Singer & Donlan, 1980) have suggested
that reading comprehension and graph comprehension are analogous, and thus reading
instructors should apply a similar approach to graph comprehension that they would use
for reading lessons. Still others have suggested direct and indirect implications of graph
comprehension research for teaching graphical literacy (e.g., Shah & Hoeffner, 2002), but
do not provide very explicit guidelines for how these implications would manifest in
instruction within the classroom. Some guidelines have been suggested regarding when
and what kinds of graphs (i.e., complexity) should be introduced to students (e.g., Friel et
al., 2001), but these were intended for students in grades K-8 and do not approach the
level of complexity inherent in multivariate data containing main effects and interactions.
Some researchers have also noted that until a better understanding of how the visual
system extracts relations from “chunked” information in graphs has been reached,
instructors will be unable to teach students how to parse graphical relationships
(Franconeri, Uttal, & Shah, 2011). The current models and frameworks posited in relation
to these perceptual processes have either been too specific to one type of graph (Ratwani
6
et al., 2008) or unsupported by direct evidence (e.g., Gillan & Lewis, 1994; Simkin &
Hastie, 1987).
Perhaps one reason why students find graph comprehension relatively hard is
because graphical literacy had not previously been a dedicated part of the school
curriculum, but rather was covered piecemeal as parts of other curricula or study skills
(Fry, 1981). Graph instruction is made even more difficult by some teachers’ limited
graph skills or low competence in building and interpreting graphs (Batanero, Arteaga, &
Ruiz, 2010; Bruno & Espinel, 2009; Gonzalez, Espinel, & Ainley, 2011; Monteiro &
Ainley, 2007). More specifically, some teachers fail to read between the data or read
beyond the data (Arteaga & Batenero, 2011). Although these studies were primarily
conducted with prospective primary school teachers, they highlight the issue of instructor
knowledge and how critical it is for teachers to receive the necessary training to increase
their knowledge of and competence with graphs in order to provide students with
effective instruction. Students cannot be expected to learn graph comprehension skills if
their instructors do not have the requisite knowledge or competence to teach them. Friel
et al. (2001) also make brief note of this important point, but make no recommendations
for how this would be accomplished other than to suggest the use of a manual for
elementary teachers to help them learn about statistics (Friel & Joyner, 1997). Therefore,
a guide or tutorial that provides instruction for complex graph comprehension would be a
valuable resource or tool for both teachers and students, especially as prior focus has
been K-8 teachers as opposed to high school and college instructors.
What Makes a “Good” Visualization or Graph?
Because of the increasing importance of visualizations like graphs, there has been an
increasing amount of research on the psychological processes involved in visualization
comprehension as well as the factors that make visualizations easy or difficult to
understand and remember. A major guideline developed based on this research is that
visualizations should simplify cognitive processes while emphasizing perceptual
processes in an attempt to reduce cognitive load on the part of the learner. According to
the Cognitive Efficiency View, visualizations such as graphs should present data as
clearly as possible by reducing distracting or irrelevant visual elements or information

7
(e.g. Bertin, 1983; Kosslyn, 1989; Pinker, 1990; Tufte, 1983). This commonly held
belief espouses that graphs should include no “chart junk” (i.e., embellishments
unessential to understanding the data), reduce cognitive processing, and rely on
perceptual processing rather than conceptual. Similarly, Canham & Hegarty (2010)
suggest that graphs should provide only task-relevant information (i.e., information
needed for the current task), especially when graphs are intended for those with limited
domain knowledge, as extraneous task-irrelevant information can impair task
performance. This could be because viewers are distracted and have to suppress
irrelevant information in a graph, particularly if the superfluous information is salient or
interesting (Sanchez & Wiley, 2006). Such additional processing may tax cognitive load
(Sweller & Chandler, 1994), especially for students with limited domain knowledge to
help them ascertain relevant from irrelevant information in the graph.
Yet, as more recent evidence suggests, these claims may not be uniformly true (see
Hullman, Adar, & Shah, 2011 for a review). For example, in one study (Bateman,
Mandryk, Gutwin, Genest, McDine, & Brooks, 2010) participants were asked to view
and remember data from one of two graph types, “Holmes” graphs (embellished graphs)
or plain graphs. Participants not only preferred the embellished graphs, but also
remembered the data from the “Holmes” graphs just as well as plain graphs at immediate
recall and better than plain graphs at long-term recall two to three weeks later. This
prompts the question of why sometimes deviating from the Cognitive Efficiency View
can actually be better for learning. Hullman and colleagues (2011) proposed the idea
that, in some cases, visualizations that require more difficult cognitive processing rather
than relying primarily on perceptual inferences may have some advantages. Thus, the
notion of desirable difficulties may be appropriate with regards to visualizations (see
Linn et al., 2010 for a similar argument).
Relating the Notion of “Desirable Difficulties” to Graphs
Desirable difficulties are learning activities that generally slow learning and often
increase errors in the short-term, but improve learning over the long-term (Bjork, 1994;
Bjork & Bjork, 2011). The term “desirable difficulties” is an umbrella term as there is a
rather broad range of activities or effects that fall into this category, including generation

8
(e.g., Hirshman & Bjork, 1988; Jacoby, 1978; Slamecka & Graf, 1978), testing or
retrieval practice (e.g., Roediger & Karpicke, 2006), spacing (e.g., Kornell, 2009,
Rawson & Dunlosky, 2011), interleaving (e.g., Kornell & Bjork, 2008; Rohrer & Taylor,
2007; Shea & Morgan, 1979), and varying learning conditions or contexts (e.g., Kerr &
Booth, 1978; Smith, Glenberg, & Bjork, 1978). Following from the research in this
domain, perhaps adding difficulties to processing can be beneficial or “desirable” to
visualization or graph users for at least three reasons. First, fluency or ease of reading a
graph can give viewers a strong but false sense of understanding (Linn et al.,
2010). Second, “easy” displays are processed passively rather than actively (e.g., Mayer,
Hegarty, Mayer, & Campbell, 2005). Because “easy” displays require less cognitive
effort, reading such displays is an automatic perceptual process that may lead to shallow
rather than deep processing of the data presented in the graph. Third, learners may spend
more time on harder to process material, perhaps in part because the more “difficult”
display is more aesthetically appealing than an “easier” to process, simplified display.
One specific challenge to graph interpretation stems from a large variety of design
choices, such as the use of labels or legends. Labels are favored in the graph literature
(e.g., Carpenter & Shah, 1998; Gillan, Wickens, Hollands, & Carswell, 1998; Kosslyn,
1994; Vaiana & McGlynn, 2002) because they fit with the Cognitive Efficiency View in
that they simplify the presented information (i.e., are easy to read and comprehend) and
reduce cognitive demand (i.e., labels are thought to “offload” cognitive demand as they
are less working memory demanding). Additionally, the use of labels has generally
resulted in improved accuracy and increased speed of graph comprehension (e.g.,
Culbertson & Powers, 1959; Lohse, 1993; Milroy & Poulton, 1978). However, legends
may function as a “desirable difficulty” in some contexts given that they require
additional search processes to identify different parts of the graphs (i.e., mapping lines or
bars with referents). Legends also slow down the learning process, increase the working
memory load (i.e., are more cognitively demanding), and change the sequential
processing or the order in which people look at different parts of a graph (legends can
provide key grouping principles or organization).

9
The Role of Individual Differences
Another challenge in graph comprehension is that of individual differences.
Individual differences relating to cognitive skills, such as graphical literacy and working
memory capacity, can be important influential factors in graph comprehension. For
example, college students unfamiliar with graphs take a long time, rely on general
knowledge, and make progressively more mistakes with increasing graph complexity
(Carpenter & Shah, 1998). Students, especially those with little graph interpretation
experience, tend to rely more on prior knowledge and will therefore make more mistakes
if a graph depicts relationships contrary to their expectations (Shah, 1995; Gattis &
Holyoak, 1996). Findings such as these further suggest the need for explicit training of
graph interpretation skills, especially for such complex data sets. Those with high graph
literacy likely know what to do with more difficult graph formats or can more easily learn
how to approach them with additional instruction (e.g., a graph tutorial). In contrast,
those with low graph literacy would likely require additional instruction or training to
improve their graph comprehension skills in order to avoid making more errors due to
unfamiliarity with complex graphs or reliance on expectations based on prior knowledge.
Thus, in the current research I included the Graph Literacy Scale (Galesic & Garcia-
Retamero, 2011; see Appendix A) as a measure of individuals’ familiarity wit h various
graphs. Although this measure does not include extremely complex multivariate graphs,
it does cover a variety of frequently used graph types, including line graphs, bar graphs,
pie charts, and icon arrays. The scale also measures the three main graphical
comprehension skills (Curcio, 1987; Friel et al., 2001) of reading the data, reading
between the data, and reading beyond the data.
Working memory (WM) span is also expected to play a large role in multivariate
graph comprehension. Individuals with low WM span may be overwhelmed when
confronted with complex multivariate graphs, as there are many variables to keep track
of, and thus might give up because interpretation is too daunting. Additionally,
demanding difficulties may only benefit those who have the WM capacity to deal with
them. For example, the benefit of introducing difficulties such as legends into a graph
could be constrained by the viewer’s cognitive skills (Hullman et al., 2011). Thus, added
visual difficulties such as legends may be detrimental for low WM span individuals who

10
find complex graphs without such added difficulties already hard to comprehend. The
current research therefore included the automated Symmetry Span (SSPAN) task
(Unsworth, Heitz, Schrock, & Engle, 2005; see Figure 1.1) as a measure of working
memory capacity, with the goal of investigating whether WM capacity mediates
performance on graph comprehension tasks, particularly for those graphs with added
visual difficulty (i.e., graphs with legends). This working memory span measure requires
participants to judge whether pictures are symmetrical, while they are also trying to recall
the location of squares on the screen in the correct sequential order. The automated
SSPAN task is strongly correlated with the traditional SSPAN task (Unsworth et al.,
2005), as well as with other WM measures (e.g., Broadway & Engle, 2010; Shelton,
Elliott, Hill, Calamia, & Gouvier, 2009).
Cognitive skills such as graphical literacy and WM capacity have been previously
documented as influential for graph comprehension. However, to my knowledge, more
dispositional individual differences have not been examined in the context of graph
comprehension. For the purposes of the current research these include open-mindedness,
need for cognition, and cognitive reflection. It is possible that these factors also mediate
graph comprehension, especially in the context of relatively little experience with graphs.
Baron (1985, 1993, 2008) was one of the first to describe actively open-minded
thinking (AOT) as a reasoning style. AOT was defined as the tendency to consider new
evidence contradictory to a favored belief, to spend sufficient time on a problem rather
than give up prematurely, and to carefully reflect on others’ opinions when forming one’s
own. Increased open-mindedness has been associated with better critical thinking skills,
as unbiased or objective reasoning about data is widely considered one crucial
characteristic of good critical thinking (Stanovich & West, 1997). Furthermore, a
decreased susceptibility to belief bias, or an increased ability to divorce prior knowledge
from analytical processes, has been associated with increased AOT (e.g., Macpherson &
Stanovich, 2007; Sa, West, & Stanovich, 1999; Stanovich & West, 1998). For example,
one study exploring the relationship between gaming and critical thinking found that
gamers who play strategy related games tend to rate higher on actively open-minded
thinking than gamers who play other genres of games (Gerber & Scott, 2011). Given that
graph comprehension consists of evaluating data and the relationships present in the data,

11
one might expect open-mindedness to similarly be important for graph comprehension as
it is for critical thinking. Individuals with increased open-mindedness, or increased
tendency for open-minded thinking and cognitive flexibility, would likely be more
willing to try to interpret multivariate graphs, even if they have not encountered such
complex graphs before. These individuals may also be more willing to consider data that
is inconsistent with their own domain knowledge, rather than misinterpret data due to a
reliance on expectations based on prior knowledge. Comparatively, less open-minded
individuals may rely on prior beliefs instead of interpreting the data, especially if they
have limited experience with graphs and the graphs are more difficult. Furthermore,
open-mindedness may impact the effectiveness of instruction, as less open-minded
individuals might not appreciate or benefit from graph comprehension training. In the
current research I measured open-mindedness with the Actively Open-minded Thinking
(AOT) scale (Stanovich & West, 1997, 2007; see Appendix B), in which higher scores
indicate a greater tendency for open-minded thinking and cognitive flexibility, while
lower scores indicate cognitive rigidity and resistance to belief change.
Need for cognition (NFC), or how likely one is to engage in and enjoy effortful
thinking (Cacioppo, Petty, & Kao, 1984), is another attitude that could critically impact
graph comprehension. High NFC was thought to reflect a greater likelihood to organize,
elaborate on, and evaluate information (Cohen, 1957). This dispositional measure has
been reliably associated with better achievement and deliberate or effortful information
processing (see Cacioppo, Petty, Feinstein, & Jarvis, 1996). High NFC individuals are
less likely to jump to conclusions unsupported by evidence (Kardash & Scholes, 1996),
more likely to make accurate judgments (Blais, Thompson, & Baranski, 2005), and are
more likely to persist in seeking out or acquiring information helpful to making accurate
judgments on estimation or forecasting tasks (Haran, Ritov, & Mellers, 2013). Some
research indicates that NFC may be related to self-control capacity in high-school
students (Bertrams & Dickhauser, 2009) and that NFC is associated with critical thinking
in college undergraduates (e.g., Stedman, Irani, Friedel, Rhoades, & Ricketts, 2009).
Some have defined NFC as a measure of intrinsic motivation for engaging in challenging
intellectual activity, while also pointing out the possibility that NFC reflects extrinsic
motivation such as success or avoidance of failure in an academic context (e.g., Steinhart

12
& Wyer, 2009). Taken together, NFC could be considered a proxy for cognitive effort or
attitude towards completing difficult work, which could be an incredibly informative
measure given the established difficulty of graph comprehension. Thus, the current
research included the NFC scale (Cacioppo et al., 1996; see Appendix C), in which
higher scores indicate a greater tendency to engage in and enjoy thinking. One might
expect that high NFC would be associated with better graph comprehension, as
understanding complex data may require more cognitive effort. Additionally, those with
low NFC may be less likely to seek external help or more likely to give up, while those
with high NFC may be more likely to meet and benefit from challenges. Moreover, those
who enjoy cognitive challenge would perhaps be more amenable to instruction or training
of graph comprehension skills, while those individuals with low NFC would benefit less,
or not at all.
Finally, cognitive reflection may also predict performance on graph comprehension
tasks. Cognitive reflection is the ability to suppress an intuitive, automatic, or
spontaneous incorrect response in order to come up with a more reflective and
deliberative correct answer, as measured by the Cognitive Reflection Test (CRT;
Frederick, 2005; see Appendix D) in the current research. Cognitive reflection has been
associated with avoiding biases (Oechssler, Roider, & Schmitz, 2009) and may be related
to the characteristic of searching out potential possibilities prior to making an inference
that was one component of Baron’s (1985, 1993, 2008) concept of AOT. Individuals
demonstrating increased cognitive reflection might make fewer errors in graph
comprehension because they are more likely to interpret the actual data presented in
multivariate graphs rather than rely on shortcuts or heuristics based on domain
knowledge or prior expectations. This measure may also reflect a willingness to work
hard interpreting complex graphs, especially when graph comprehension is made more
difficult with legends, which could potentially translate to greater benefit or improvement
from additional graph instruction or training.
Goals of the Current Research
In sum, it is important to gain a more thorough understanding of graph
comprehension for complex multivariate data, both in relation to people’s ability to do it
and to training or teaching people how to do it better, especially given the frequency with
13
which graphs are encountered in daily life and the implicit expectation that people should
be capable readers of such visualizations. Therefore, the current line of research aims to
address the following questions: (1) How well do people comprehend main effects and
interactions in complex multivariate data presented in graphs, and does graph format play
a role (i.e., do legends function as a desirable difficulty)? (2) Can students be trained or
taught to better identify and understand main effects and interactions inherent in graphs
of complex data sets, and what would comprise such an effective tutorial? (3) What role
do individual differences play in complex graph comprehension and the training of these
skills?
In order to address these questions, I completed five experiments. In Experiment 1, I
determined whether readers benefit from graphs presented alongside textual explanations
of data, and if such graphs provide an advantage in comparison to reading the text alone
or viewing an irrelevant picture with the text. In Experiments 2 and 3, I examined
whether students are able to identify main effects and interactions presented in graphs,
and whether this differs with graph format (i.e., labels versus legends), with tasks that
involve interpreting or describing presented data in an open-ended context and
remembering important aspects of a data set. In Experiments 4 and 5, I investigated
whether students understand main effects and interactions in graphs, whether graph
comprehension differs by graph format (labels versus legends), and whether students can
be trained to better identify and interpret such data using a graph tutorial that I
created. In all of these experiments I investigated the role of individual differences, as
one interest in the current research is in determining whether certain individual
differences mediate people’s graph comprehension, their ability to benefit from training,
or the potential for difficulties such as legends to be beneficial.

14
Figure 1.1. Automated Symmetry Span Task Sample Trial Sequence. This figure was modified from the one found in Redick et al. (2012).

15
Table 1.1
Analysis of Graphs in Psychology Textbooks
Book Subject
Number of
Textbooks
Total Graphs
Line Graphs
Bar Graphs
Graphs with
Labels
Graphs with
Legends
Graphs with
Labels & Legends
General or Introductory Psychology
9 409 146 263 241 23 137
Cognitive Psychology 8 333 168 165 169 83 37
Research Methods 8 206 139 67 144 16 33
Social Psychology 2 170 43 127 67 10 91
Cognitive Neuroscience 2 205 123 82 75 45 68
Abnormal Psychology 1 22 12 10 8 2 12
Totals 30 1345 631 714 704 179 378
Note. These values are approximations collected from actual psychology textbooks. Not shown are the total number of graphs for each category that contained neither labels nor legends.

16
CHAPTER 2:
GRAPHS IN TEXTBOOK EXCERPTS
Introduction
Given the widespread usage of graphs across many media (e.g., newspapers,
television, textbooks, scientific journals, and even classrooms) and the apparent
assumption made by publishers of these media that people are capable readers of
graphical information, a critical first question is whether people or students actually
benefit from the inclusion of graphs in order to remember the information presented
within the text. Thus, it is important to determine whether individuals use information
presented in graphs when reading textual information such as an article or textbook that
already contains a summary of the data, and, if they do use these graphs, whether the
graph is helpful. How does the addition of a graph compare to the inclusion of seductive
details such as irrelevant pictures?
According to the seductive details hypothesis, presenting interesting but irrelevant
information with a text can be detrimental in remembering the main points of the text, or
at best is no better than presenting the text by itself (e.g., Garner, Brown, Sanders, &
Menke, 1992; Garner, Gillingham, & White, 1989; Hidi & Baird, 1988; Mohr, Glover, &
Ronning, 1984; Shirey, 1992; Shirey & Reynolds, 1988; Wade, 1992; Wade & Adams,
1990). For example, including an irrelevant picture with a text (i.e., a seductive
illustration) is more harmful than providing no visualization with the text (e.g., Harp &
Mayer, 1997). Furthermore, people are more likely to remember these seductive details
than structurally critical information in the text (Garner, Alexander, Gillingham,
Kulikowich, & Brown, 1991; Garner et al., 1992; Hidi & Anderson, 1992; Hidi & Baird,
1986). Thus, when the goal of a textbook is centered on students learning and
remembering the main points within the text, presenting “interesting” pictures that offer

17
no relevant support to the cognitive structure of the concept can actually be
counterproductive.
By contrast, adding explanative summaries (i.e., material or illustrations that help the
reader understand the structure of the explanation in the text) to scientific texts can help
readers remember information and perform better on problem solving transfer tasks that
require understanding of the material (Mayer, 1989; Mayer, Bove, Bryman, Mars, &
Tapangco, 1996; Mayer, Steinhoff, Bower, & Mars, 1995). The aim of the current study
was to expand on this research by examining whether relevant graphs that depict data
already described in the text can be considered a type of explanative summary. If so, I
would expect participants to demonstrate a benefit from this added visualization with
regards to comprehension or memory of the text.
To evaluate the potential benefits of graphs, I conducted an experiment comparing
comprehension of the pattern of data presented in a text when there was no visualization
present, when there was an irrelevant “seductive” visualization present, and when there
was a bar graph summarizing the data present. I selected and slightly modified an
excerpt of text (and graph) from an actual psychology textbook (Goldstein, 2008), in
which the data or findings for a scientific study about experience-dependent plasticity
were explained (see Appendix E). Specifically, the text described data from a study by
Gauthier, Tarr, Anderson, Skudlarski, and Gore (1999), in which participants were
trained to view imaginary figures called “Greebles.” Prior to the training, they were
shown pictures of “Greebles” and faces, and only the faces activated the fusiform face
area (FFA). Following training, both “Greebles” and faces activated the FFA. To
understand the study and its conclusions, therefore, the participants would have to
understand a complex 2-way interaction. In the current experiment (Experiment 1),
participants first read the material and viewed the visualization, if present. As the focus
of Experiment 1 was on the comprehension of complex data presented in textbook
excerpts, participants then immediately answered questions about the data that was
described.
A second goal of the present study was to investigate the effect of need for cognition
(NFC; Cacioppo & Petty, 1982) on both understanding the data described in the text in
18
general, as well as to investigate whether NFC interacted with the inclusion of graphs or
seductive pictures in comprehending the information. In general, individuals higher on
NFC comprehend text better (Dai & Wang, 2006). But how does NFC interact with the
use of graphs in texts? It is possible that individuals with high NFC read the text with
more attention or care and thus do not require a summary graph. Therefore, individuals
with low NFC may benefit more from the inclusion of a graph than those with high NFC.
In contrast, it is possible that individuals with high NFC are interested in learning from
both the graph and the text and thus benefit more from a graph than those with low NFC.
Though seductive visualizations served primarily as a control condition in this study,
it is also possible to consider how NFC interacts with susceptibility to seductive
visualizations. Previous research on individual susceptibility to seductive details has
found that individuals with low working memory capacity are more affected by the
inclusion of seductive details than high working memory capacity individuals (Sanchez
& Wiley, 2006). Likewise, individuals high in NFC may exert relatively more effort to
comprehending text and ignoring irrelevant information.
Experiment 1
Method
Participants. Seventeen students (M = 18.41 years old; 14 women) from the University
of Michigan Psychology Subject Pool completed the study in the laboratory, and received
course credit for their participation. An additional 150 adult individuals (M = 34.77 years
old; 67 women) participated in the study online via Amazon Mechanical Turk
(MTurk). MTurk participants were compensated with $1.00 per approximately ten
minutes of participation, as is standard procedure in our lab for studies using this online
system. Most studies pay a much lower rate, so this higher rate of compensation was
meant to further motivate participants. Although MTurk participants tend to be more
diverse than typical American university samples, there is evidence to suggest that data
collected with MTurk are at least as reliable as those collected in the lab (e.g.,
Buhrmester, Kwang, & Gosling, 2011). In addition, there were no significant
differences in average performance in the laboratory and on MTurk. Therefore, the data

19
from these two populations were combined for analyses. Three participants were
excluded due to incorrect answers on questions intended to assess whether or not
participants were attending to the questions, one participant was excluded due to
incomplete or missing data, and three participants were excluded on the basis of having a
task completion time of less than four minutes, or less than two standard deviations from
the mean task completion time. This resulted in a final total of 160 participants (M =
33.51 years old; 80 women). The research protocol was approved by the University of
Michigan Institutional Review Board, and all participants provided written informed
consent.
Materials. The current experiment was conducted using Qualtrics (Qualtrics, Provo, UT)
for easy online testing both in the laboratory and on Amazon MTurk. As it involved
reading and comprehension questions, the experiment was self-paced such that
participants progressed through the online task without any timing restrictions other than
an automatic timing out of the webpage if not completed in less than one hour.
I chose to use a slightly modified excerpt of text (and graph) from an actual
psychology textbook (Goldstein, 2008), in which the data or findings for a scientific
study about experience-dependent plasticity were described (see Appendix E). This was a
between-subjects design, such that participants were randomly assigned to one of three
conditions. The excerpt was modified both in an attempt to slightly simplify the data set
(to allow for a somewhat simpler graph) and to correspond to the three different
conditions. In one condition, the text describing the study findings was presented by
itself, with no visualization. In a second condition, participants read the same brief text
presented with an irrelevant picture of a girl working at a computer. In a third condition,
participants read the same brief text presented with a relevant bar graph that
corresponded to the data described in the text.
Participants were tested on their comprehension immediately, such that there was no
delay between the reading and the comprehension questions for that reading. The
comprehension test included a single free-response question in which subjects were asked
to briefly describe the main findings of the study in their own words, a multiple-choice
question asking subjects to identify which bar graph correctly depicted the study findings,

20
and a multiple-choice question asking subjects to identify which line graph correctly
depicted the study findings. The inclusion of the line graph question was intended to
examine comprehension differences as a function of graph format and to capture potential
transfer of understanding of the data to a graph type that even those in the text with graph
condition would not have previously viewed. Those who completed the study in the
laboratory also completed a fourth question, an open-ended question in which they were
asked to draw a graph that represented the expected results for a different variable based
on what they knew of the study findings they read about. This question was intended as
an additional transfer test of participants’ comprehension of the findings, as they were
asked to extrapolate based on the information presented in the textbook excerpt.
However, this question was not included in the analyses as there were too few
participants who completed this additional question.
All participants also completed the Need for Cognition (NFC; Cacioppo et al., 1996)
scale. The NFC scale is an 18-item measure for which higher scores indicate a greater
tendency to engage in and enjoy thinking (see Appendix C). Participants decided how
characteristic of themselves each statement was, using a Likert scale ranging from 1
(“Does not describe me at all”) to 5 (“Describes me perfectly”). Some items were reverse
scored, and overall scores were obtained by summing responses to all of the items.
Procedure. All participants, including those who participated in the laboratory,
completed the study online, via Qualtrics. Participants were instructed to carefully read a
textbook excerpt about a scientific study, as they would be asked to answer some
questions about the reading later. All participants first read a short textbook excerpt
introducing the research study about experience-dependent plasticity. Following this
brief excerpt, participants were presented with a second page of the text that described
the study data, and this second page contained only the text, the text with an irrelevant
picture, or the text with a relevant graph. After participants read the two pages of
textbook material, they were asked to complete some comprehension questions about the
data set discussed in the text, the NFC scale, and some demographic questions.

21
Results
The free response question was coded by three independent raters according to the
coding scheme listed in Appendix F, such that responses were categorized according to
what participants described about the textbook excerpt they read (e.g., study methods,
study data or findings, general conclusions from the study). To assess the inter-rater
reliability between the three raters, Fleiss’ kappa was calculated with the use of an online
kappa calculator (Geertzen, 2012). Inter-rater agreement for the data set following
exclusions was moderate, with a kappa of .603. Select cases of disagreement were
resolved either by using the code agreed upon by two of the three raters or, in select cases
of no agreement among all three raters, by using the finalized coding of an independent,
more experienced fourth rater. Because I was most interested in comparing correct
descriptions of the excerpt’s study data to all other response types, and because not all
response categories occurred for all conditions, for the sake of analyses I combined the
codes for correct descriptions of methods, correct descriptions of general conclusions,
incorrect descriptions of the study data, and responses unrelated to the excerpt into a
single response category.
There was no statistically significant association between condition and response
type, X2(2, N = 160) =1.47, p = .480. Thus, format of the textbook excerpt does not seem
to significantly affect the likelihood of a participant responding with a correct description
of the study data or findings as opposed to a description of another kind. It is interesting
to note that in general (i.e., across conditions) there were proportionately less correct
descriptions of the study data (n = 62) than responses of some other type (n = 98), most
of which were descriptions of the study’s general conclusions (n = 78). This would
perhaps suggest that most participants understood the main conclusions drawn based on
the study findings even if they did not fully comprehend what these findings or data
actually were, although it is possible that participants explained the conclusions rather
than the actual data themselves due to misunderstanding the wording of the free response
question.
Means of recognition accuracy for each condition (i.e., text only, text with irrelevant
picture, text with graph) and question type (i.e., multiple choice line graph or bar graph

22
question) are presented in Table 2.1. Based on the literature, I expected that presenting
an irrelevant picture with the text would lead to worse performance than presenting the
text by itself. I also expected that presenting a relevant graph with the text would be
better in comparison to no visualization. Furthermore, I expected that, if participants
were actually looking at the included visualization, a relevant graph presented with the
text would result in much improved comprehension or memory for the text compared to
an irrelevant picture. To look at these effects of condition, as well as the influence of
individual differences (i.e., NFC) on comprehension, a between-subjects ANOVA was
conducted with NFC as a covariate (see Table 2.2). However, contrary to expectations,
there was no significant effect of condition (i.e., text only, text with irrelevant picture,
text with graph) on overall accuracy for the multiple-choice questions, F(4,310) = .910, p
= .459, Wilks’∧= .977. Interestingly, accuracy was lowest for the text only condition
and highest for the text with irrelevant picture condition, with accuracy for the text with
graph condition falling in-between, though these differences were not significant. There
was also no significant effect of condition on accuracy for the individual multiple-choice
questions, as F(2,154) =.07, p = .933 for the bar graph multiple-choice question and
F(2,154) = .73, p = .485 for the line graph multiple-choice question.
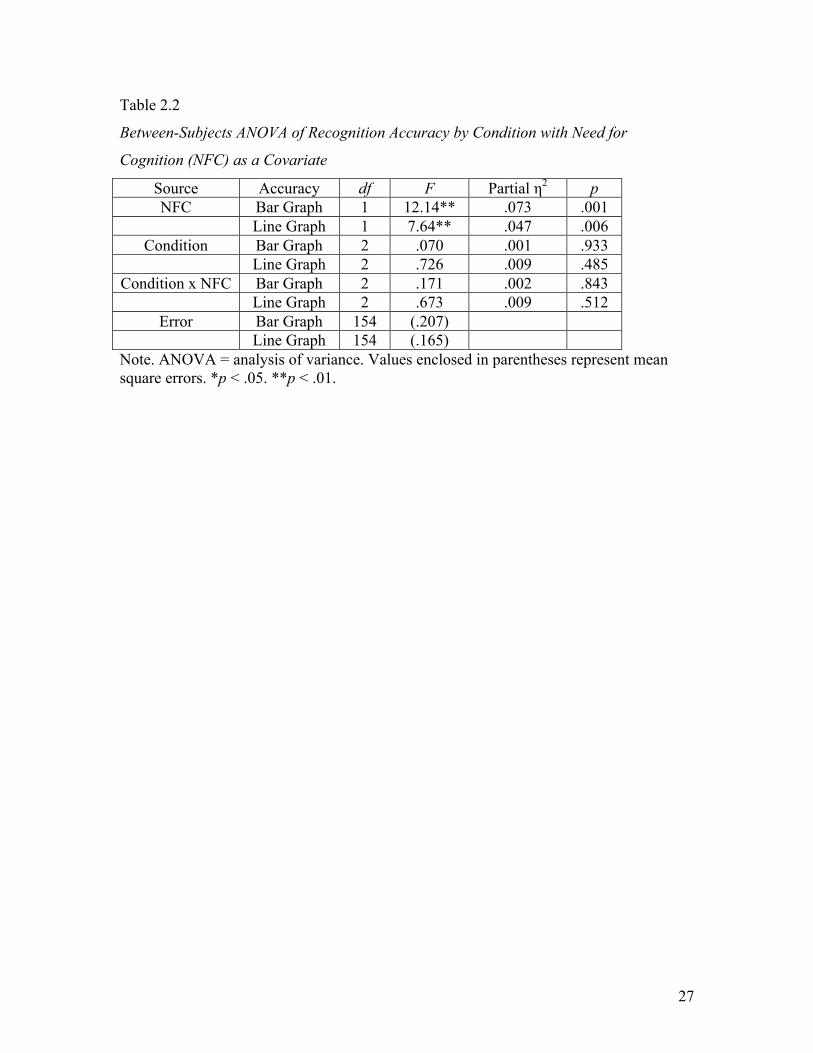
Need for cognition was significantly associated with overall accuracy for the
multiple-choice comprehension questions, F(2,153) = 7.88, p = .001, such that
individuals who enjoy more difficult thinking were more accurate in their responses to
the multiple-choice questions. This was also true for each of the multiple-choice
questions individually, as F(1,154) = 12.14, p = .001 for accuracy on the bar graph
multiple-choice question and F(1,154) = 7.64, p = .006 for accuracy on the line graph
multiple-choice question. These results indicate that although condition may not
influence immediate comprehension for textbook reading, dispositional factors such as
NFC certainly are influential for comprehension of complex data in textbook readings.
There was no significant interaction between NFC and condition for overall multiple-
choice accuracy (F(4,306) = .44, p = .780, Wilks’∧= .989), nor was there a significant
interaction between NFC and condition for either the bar graph multiple-choice question
(F(2,154) = .17, p = .843) or the line graph multiple-choice question (F(2,154) = .67, p =

23
.512) individually. These findings suggest that although NFC mediates comprehension
of textbook readings, higher or lower NFC does not benefit performance in this
experiment for one particular condition more than another condition.
Accuracy on the two multiple-choice questions, bar and line graph, were
significantly correlated with each other (r = .31, p < .001), which suggests that
participants who understood the data well enough to recognize the correct graphical
depiction of the data comprehended the excerpt well enough to do so regardless of graph
type. Higher accuracy on the two multiple-choice questions combined was associated
with a greater likelihood of correctly describing the excerpt’s study data (r = -.25, p =
.002), as was higher accuracy on the bar graph question (r = -.20, p = .013) alone and the
line graph question (r = -.20, p = .010) alone. This makes sense given that those who did
not understand the study data well enough to describe them in their own words would
likely have a difficult time coming up with a correct graphical representation of the study
data. Moreover, NFC was significantly correlated with accuracy on the bar graph
multiple-choice question (r = .28, p < .001), the line graph multiple-choice question (r =
.23, p = .004), and both of the multiple-choice questions combined (r = .31, p < .001).
Thus, the more participants enjoy difficult thinking, the more accurate they were on the
multiple-choice questions. These findings indicate that attitude towards effort, or
dispositional factors such as enjoyment of difficult thinking, plays an important role in
comprehension of textbook reading.
Discussion
Format of the textbook excerpt did not influence the likelihood of a participant to
respond with a correct description of the study data or findings as opposed to a
description of another kind. Most participants understood the main conclusions drawn
based on the study findings, even if they did not fully comprehend what these findings or
data actually were. Although no significant differences in accuracy were found between
textbook excerpt formats, a clear impact of individual differences was found. Individuals
with a higher need for cognition, or greater enjoyment of difficult thinking, were more
accurate in identifying the bar and line graphs that correctly depicted the study’s data in
the excerpt. However, there was no evidence to support the interaction of NFC with the

24
inclusion of graphs or seductive pictures in comprehending the information presented.
One possible alternative explanation is that differences in cognitive capacity may
underlie the relationship between NFC and performance. Future research should
differentiate between dispositional factors and cognitive factors.
The statistically non-significant differences in accuracy between conditions are
perhaps not so surprising, as some of the findings regarding seductive details indicate that
seductive details such as irrelevant pictures at best afford no advantage over text alone
and at worst are detrimental for performance compared to text alone. Although there was
no clear detriment observed from presenting an irrelevant picture with the textbook
excerpt in the current experiment, there was also no advantage from the inclusion of such
a seductive detail. These results are therefore still consistent with the seductive details
literature. With regards to the inclusion of a relevant graph, perhaps improved
comprehension did not occur for this condition in comparison to the others because
participants either did not use the graph or participants did try to use the graph but did not
understand the graph or find it helpful. Additional research would be necessary to
determine why the inclusion of relevant graphs are no better than reading the text alone
or reading the text with irrelevant pictures. Maybe the relevant graph does not act as an
explanative summary, as misunderstanding the graph would not help readers understand
the structure or relationships within the data described in the text. If readers are bad at
graph comprehension and thus graphs are not useful as explanative summaries, then
perhaps in this case a relevant graph actually serves as more of a seductive detail or
irrelevant and disruptive information for the reader.
Another potential explanation of the results is that the expected differences in
accuracy between conditions, particularly for the inclusion of a relevant graph, are not
clearly observable with an immediate test, but rather would be more apparent with a
longer delay period between the reading of the excerpt and the comprehension test items.
This would be consistent with findings in the learning and desirable difficulties literature.
Perhaps varying conditions of the textbook excerpt do not matter for an immediate test,
as the information read in the text is still active within memory, whereas a
comprehension test based on long-term memory may be more susceptible to differences

25
in processing of the reading due to the excerpt format. Thus, I would predict that the
advantage of a graph, if it serves as an explanatory summary, may be greater after a one-
week delay since conditions that affect learning, like the testing effect, have bigger
impact at delay than with immediate testing. In fact, with the testing effect, at immediate
test performance is better for the study condition, but with the delayed test performance is
better for those with repeated testing (Roediger & Karpicke, 2006). Although the effects
of seductive details and explanative summaries or illustrations have certainly been found
within tasks that immediately follow the reading of an excerpt, perhaps such differences
would be more pronounced in long-term memory. Therefore, additional research should
determine whether this is the reason for the findings in Experiment 1.

26
Table 2.1
Means for Recognition Accuracy by Condition and Question Type
Condition Question Type Line Graph Bar Graph Overall N
Text Only .740 (.054) .599 (.060) .670 (.045) 57 Text with
Irrelevant Picture .843 (.059) .733 (.066) .788 (.050) 48
Text with Graph .766 (.055) .699 (.061) .733 (.046) 55 Overall .783 (.032) .677 (.036) .730 (.027) 160
Note. Values enclosed in parentheses represent standard errors. “Overall” values indicate values collapsed across condition or question type.
27
Table 2.2
Between-Subjects ANOVA of Recognition Accuracy by Condition with Need for
Cognition (NFC) as a Covariate
Source Accuracy df F Partial η2 p NFC Bar Graph 1 12.14** .073 .001
Line Graph 1 7.64** .047 .006 Condition Bar Graph 2 .070 .001 .933
Line Graph 2 .726 .009 .485 Condition x NFC Bar Graph 2 .171 .002 .843
Line Graph 2 .673 .009 .512 Error Bar Graph 154 (.207)
Line Graph 154 (.165) Note. ANOVA = analysis of variance. Values enclosed in parentheses represent mean square errors. *p < .05. **p < .01.
28
CHAPTER 3:
GRAPH COMPREHENSION IN IMMEDIATE AND
LONG-TERM MEMORY TASKS
Introduction
Often, students are presented with graphs representing complex data with the
expectation that they are able to comprehend the main points of the data set such that they
could explain the data in their own words, and that they will be able to remember this
information to draw from it later. This is evidenced by the frequent inclusion of graphs
in textbooks, which clearly highlights the assumption that students comprehend and use
such information. However, students are not particularly good at interpreting graphs, as
seen both in the graph comprehension literature and in Experiment 1. As seen in
Experiment 1, students may not fully understand complex data presented textually, even
with the addition of a relevant graphical representation of the data. This leads to the
question of what people are actually doing when interpreting multivariate graphs, which
was the aim of Experiment 2. Do students come away from a graph with a clear
understanding of the data set, such that they can explain the relationships within the
graph?
Another question is whether students are able to identify the important information
or relationships in a complex graph and understand them well enough to remember this
information later from memory. If the goal of presenting data in graphs is to
communicate critical concepts or research findings or to provide supporting scaffolding
for textually presented information, then determining whether students grasp and
remember the conclusions to be drawn from these graphs is extremely important. This
question was the goal of Experiment 3. Additionally, there is some reason to believe that
legends may add visual difficulty to graphs that would be beneficial or advantageous for
task performance, particularly for long-term memory.

29
Therefore, in the next several experiments, I aimed to determine how well students
identify main effects presented in line graphs in realistic tasks that involve describing and
interpreting presented data in an open-ended context or remembering important aspects
of a data set. I was also interested in potential differences between graph formats (i.e.,
labels versus legends) on these various graph comprehension tasks. Once again, in each
of these experiments I also examined the role of individual differences on task
performance and whether certain individual characteristics lend themselves to greater
benefit from certain graph formats.
Experiment 2
Introduction
The goal of the current experiment was to examine what students actually identify as
important information when presented with complex multivariate graphs. An open-ended
graph description task would perhaps provide a better idea for what graphical
relationships students identify and report as important compared to the more commonly
used fact-retrieval task, in which students are asked a pointed question about a particular
relationship presented in the graph. Because students are not directed to attend to one
specific relationship in the graph in an open-ended task, and because each graph in the
task contains a total of seven potential relationships (i.e., three main effects, three 2-way
interactions, and one 3-way interaction) that could be described, this task may allow
students to better indicate the different types of information that they are attending to in
complex multivariate graphs.
Thus, in Experiment 2, I addressed students’ ability to identify main effects and
interactions in multivariate graphs within an open-ended context. I also investigated the
influence of graph format and individual differences on task performance. I predicted
that students would report a relatively fair proportion of the relationships in the data (i.e.,
at least 50%) given the open-ended and self-paced format of the task. I also hypothesized
that students would report more main effects than interactions. However, I expected that
students would report more complex relationships or interactions for graphs containing
legends than graphs containing labels, because I thought that students may be more likely

30
to identify such relationships in the data due to the built-in organization of the legend and
additional processing required by these graphs. Students with increased graph skills and
WM capacity were expected to correctly report more relationships in the data than
students with low graph skills and WM capacity, and increased WM span was predicted
to be especially important for graphs with legends compared to graphs with labels.
Increased NFC, open-mindedness, and cognitive reflection were hypothesized to relate to
correct identification of proportionately more relationships, particularly for graphs
containing legends, compared to lower scores on these dispositional measures.
Method
Participants. Sixty-three individuals volunteered to participate in this experiment for
course credit or for payment at the rate of $10 per hour. Two of these subjects were
excluded from the data set for not completing the study (n = 1) or for leaving some of the
test materials blank (n = 1), resulting in a total of 61 participants (M = 19.61 years; 19
women). Participants consisted of University of Michigan undergraduates from both the
University of Michigan Psychology Subject Pool and the Ann Arbor community.
Research protocols were approved by the University of Michigan Institutional Review
Board, and all participants provided written informed consent.
Materials.
Graph Tutorial. Participants first completed a graph tutorial program run online using
Qualtrics (Qualtrics, Provo, UT), which walked them through progressively more
difficult graphs and open-ended questions relating to these graphs. For some example
screenshots of the tutorial, see Figure 3.1. The concepts of main effects and interactions
were defined in the tutorial. The tutorial also explained how to use a mental averaging
procedure to answer questions about main effects relating to 2x2x2 line graphs (graphs
containing 3 independent variables) via “static builds.” Static builds in the context of this
tutorial are simply still frames that lay out the steps of the mental averaging process, one
at a time, and highlight important or relevant pieces of the graph at each step (e.g. using
color to highlight relevant lines or stars to mark averages). Finally, the tutorial provided

31
participants with several practice questions. This tutorial was set up such that participants
could type in their open-ended responses to each example.
Open-ended Graph Description Task. The open-ended graph description task was a
paper task consisting of six graphs, three with labels and three with legends (see Figure
3.2 for examples). Graphs with labels in one version of the task had legends in a second
version of the task, and vice versa. Graphs were black and white with some visual cues
to differentiate between the lines (i.e., solid and dotted lines, circle and square end-
points). Graph order was randomized for each participant. All graphs contained three
independent variables (2x2x2 graphs), such that any description of the data could
potentially include three main effects, three 2-way interactions, and one 3-way
interaction. Participants were instructed to respond to information about various
scenarios that depict information about a psychological study and data from the study
presented graphically. They were told to imagine that they were trying to convey the
information presented to them to someone who has little knowledge about the topic, and
that their goal was to convey the main points from the scenario and the graph in a way
that the person would fully understand without having to see the graph. Participants were
also instructed that the scenarios and graphs presented would be fairly complex and that
different people might highlight different information; thus, there are no right or wrong
answers, and we are interested in what they think is important information to
communicate about the data. Participants were requested to write about 2-5 sentences per
graph, and it was estimated that the task would take them approximately 25
minutes. Participants were also provided with three examples of scenarios with
corresponding graphs, along with sample answers for each data set that would be
considered reasonable potential responses.
Individual difference measures. Participants completed a battery of individual difference
measures, including the Edinburgh Handedness Inventory (Oldfield, 1971), Unusual Uses
Task (Guilford, 1967), Cognitive Reflection Test (CRT; Frederick, 2005), Actively
Open-minded Thinking Scale (AOT; Stanovich & West, 1997, 2007), Need for Cognition
Scale (NFC; Cacioppo, Petty, Feinstein, & Jarvis, 1996), automated Symmetry Span task

32
(SSPAN; Unsworth, Heitz, Schrock, & Engle, 2005), and Graph Literacy Scale (Galesic
& Garcia-Retamero, 2011).
Edinburgh Handedness Inventory. In this measure, participants indicated which hand(s)
they would use for each task listed (Oldfield, 1971). As this task was used as a filler task
and was not included in the analyses, it will not be discussed further with regards to
scoring or analyses.
Unusual Uses Task. This task is a creativity measure in which participants are asked to
generate as many possible uses for a common item (e.g. brick, bucket) as they can within
two minutes (Guilford, 1967). As this task was used as a filler task and was not included
in the analyses, it will not be discussed further with regards to scoring or analyses.
Cognitive Reflection Test. The CRT (Frederick, 2005) is a 3-item measure of an
individual’s ability to suppress an intuitive, automatic, or spontaneous incorrect response
in order to come up with a more reflective and deliberative correct answer (see Appendix
D). Scores were calculated by summing the total number of correct responses.
Actively Open-minded Thinking Scale. The AOT scale (Stanovich & West, 1997, 2007)
consisted of 41 items (see Appendix B). Participants were instructed to select a response
that best indicated their opinion for each item, using a Likert scale ranging from 1
(“strongly disagree”) to 6 (“strongly agree”). Scores were computed by summing the
responses to the questions. Some items were reverse scored, such that higher scores on
the AOT indicate a greater tendency for open-minded thinking and cognitive flexibility,
while lower scores indicate cognitive rigidity and resistance to belief change.
Need for Cognition Scale. This was the same measure as was used in Experiment 1. The
NFC scale (Cacioppo et al., 1996) is an 18-item measure for which higher scores indicate
a greater tendency to engage in and enjoy thinking (see Appendix C). Participants
decided how characteristic of themselves each statement was, using a Likert scale
ranging from 1 (“Does not describe me at all”) to 5 (“Describes me perfectly”). Some
items were reverse scored, and overall scores were obtained by summing responses to all
of the items.

33
Symmetry Span Task. Participants also completed a computerized automated SSPAN
task (Unsworth et al., 2005), a working memory span measure in which participants
judged whether pictures were symmetrical while also trying to recall the location of
squares on the screen in the correct sequential order (see Figure 3.3). This program was
run using E-Prime 2.0 (Psychology Software Tools, Pittsburgh, PA). There were three
practice sections prior to the actual trials: (1) practice on the storage task only (i.e.,
participants were presented with sequences of red squares that appeared within a 4x4
matrix and recalled and clicked on the locations of squares in the correct order on the
grid); (2) practice on only the processing task (i.e., determining whether pictures made by
filling in squares on an 8x8 matrix were symmetrical about the vertical axis); and (3)
interleaved processing and storage tasks (i.e., each symmetry question was followed by a
650 ms presentation of a square, and participants indicated the locations of the squares in
the correct sequential order at the end of a set). There were a total of 12 experimental
trials, as there were three trials of each set-size with list length ranging from two to
five. There was an individualized time limit for both the practice and actual trials of the
interleaved task that was based on an individual’s performance in the processing task
only practice portion (i.e., individual’s mean plus 2.5 standard deviations). Because the
task is automated, a random combination of trials and list lengths was generated for each
participant, and items to be recalled were distinct from the processing task. Feedback on
accuracy for both the storage and processing tasks was presented at the end of each trial.
The program automatically calculates five scores: (1) the absolute load score, or the
sum of all trials in which all items were recalled in the correct serial order; (2) the partial
load score, or the sum of items recalled in the correct serial position regardless of whether
the entire trial was recalled correctly; (3) processing errors, or the total number of errors
made on the processing task; (4) speed errors, or the number of processing problems that
were unanswered within the time limit; and (5) accuracy errors, or the number of
processing problems answered incorrectly. I used the partial load score for all of the
analyses as research indicates that partial-credit scoring is better than absolute scoring for
complex span tasks (i.e., operation span, reading span, symmetry span) with regards to
psychometric properties such as test-retest reliability, internal consistencies, and

34
convergent validity (Redick et al., 2012). Furthermore, partial scoring captures additional
variance that would not be captured with absolute scoring.
Graph Literacy Scale. This graph test (Galesic & Garcia-Retamero, 2011; see Appendix
A) is a 13-item measure that assesses the three main graphical comprehension skills
described by Friel et al. (2001): (1) the basic skill of reading the data or finding specific
information in a graph; (2) the intermediate skill of finding relationships in the data
presented in a graph; and (3) the advanced skill of making inferences and predictions
based on the data. This scale also covers some of the most frequently used types of
graphs, including line graphs, bar graphs, pie charts, and icon arrays. Scores were
calculated by summing the total number of correct responses.
Demographic Questionnaire. The Demographic Questionnaire (see Appendix G)
contains questions about gender, age, handedness, race, ethnicity, highest level of
completed education, and their major in school. Participants are also asked about their
familiarity with different types of graphs, how frequently they use graphs or tables,
whether they prefer graphs or tables, how many math and statistics courses they have
taken, their ACT or math SAT score, whether they consider themselves to be a math or
science person, how confident they are in their scientific reasoning skills, and whether
they are comfortable with numbers and graphs.
Exit Survey. Participants completed a brief Exit Survey at the end of the session (see
Appendix H), consisting of five questions pertaining to potential strategies used in the
study, what they thought was difficult in the study, their graph preferences, and what they
thought was the purpose of the study.
Procedure. Participants first completed the online graph tutorial on the computer. This
was followed by the open-ended graph description task. Next, participants completed a
battery of individual difference measures, starting with the Edinburgh Handedness
Inventory, followed by the Unusual Uses Task, the CRT, the AOT scale, the NFC
questionnaire, the automated SSPAN, and the Graph Literacy Scale. Finally, participants
filled out a demographic questionnaire as well as an exit survey prior to debriefing at the

35
conclusion of the experiment. Participants completed the study in approximately 1.5 to 2
hours.
Results and Discussion
Open-Ended Graph Description Task. Participants’ responses on the open-ended graph
description task were coded according to the scheme found in Appendix I for each
individual graph. First, responses were categorized by accuracy (correct or incorrect).
Then responses were grouped into one of the following categories: description, or a
description of the study related to the vignette or variables studied but that did not
address any relationships in the data; main effect of X, or main effect of the variable on
the x-axis; main effect of line, or main effect of the variable for which lines were
differentiated by solid and dotted lines; main effect of circle/square, or main effect of the
variable for which lines were differentiated by circle and square end-points; full 2-way
interaction of X and line, or interaction between the variable on the x-axis and the
variable for which lines were differentiated by solid and dotted lines; full 2-way
interaction of X and circle/square, or interaction between the variable on the x-axis and
the variable for which lines were differentiated by circle and square end-points; full 2-
way interaction of line and circle/square, or interaction between the variable for which
lines were differentiated by solid and dotted lines and the variable for which lines were
differentiated by circle and square end-points; partial 2-way interactions, or responses
that attempted to describe the relationship between two variables in the graph but that
only described one part of the relationship (e.g., mentioning what was happening with
one variable in relation to another but not vice versa); 3-way interaction, or interaction
between all three variables in the graph; and partial 3-way interaction, or responses that
attempted to describe the relationship between all three variables but only described part
of the relationship. These partial 3-way interactions often tended to be descriptions of a
single line in the graph. For partial 2-way interactions, the number of partial interactions
reported (i.e., 1 to 3 per graph) was recorded.
One trained individual coded all of the participants’ responses. A second rater coded
the responses of 20% of the sample (data from a randomly selected 12 participants). The
overall percent agreement between the two raters was 94.67%, with an “almost perfect”
36
Cohen’s kappa coefficient of .84. Percent agreement for correct responses was 93%
(with a substantial Cohen’s kappa of .83), while percent agreement for incorrect
responses was 98.59%. However, it is important to note that because there were very few
cases of incorrect responses (only three), the kappa statistic would not be informative in
this context (i.e., almost all of the agreement was that there were no incorrect responses)
and was therefore not calculated for incorrect responses. Percent agreement for correct
responses about main effects was 90.14% (with a substantial Cohen’s kappa of 0.80), and
the percent agreement for correct responses about interactions was 93.90% (with a
substantial Cohen’s kappa of 0.71). In the select cases of disagreement, the coding of the
second more experienced individual was used for analyses.
Because there were very few incorrect responses made on the open-ended graph
description task, the analyses focus on correct responses only. Additionally, all analyses
were computed using proportions calculated for each aforementioned category of answer
type. Thus, each proportion reflects the mean number of written statements provided by
subjects divided by the total potential statements possible to provide for that particular
category of answer type. For example, each 2x2x2 graph contains three possible main
effects, which multiplied by six graphs in the task yields 18 total possible main effects
that participants could mention in their responses on the task. A participant’s proportion
of main effects would therefore be the number of main effects they correctly describe
divided by 18.
The mean proportion for correct responses collapsed across main effects and
interactions was 0.19 (SE = .007), which is extremely low. Thus, overall, students report
relatively very few main effects and interactions compared to what they could report
given the amount and complexity of the relationships presented in the graphs. Students
did report significantly more main effects than interactions of any type (2-way or 3-way,
full or partial; M = .09, SE = .006), t(60) = 10.50, p < .001. Yet, the mean proportion of
total correct main effects reported was 0.46 (SE = .031), which is less than 50% of the
total main effects that students could have reported from the presented graphs.
Interestingly, there were no significant differences between the mean proportions of
reported main effects for main effects of the variable on the x-axis (M = .46, SE = .032),

37
main effects of the variable indicated by solid or dotted lines (M = .46, SE = .036), and
main effects of the variable indicated by circle or square end-points (M = .46, SE = .042),
F(2, 59) = .003, p = .997, which suggests that the specific main effects reported by
students were not attributable to the way in which those main effects were presented in
the graphs. In other words, students were just as likely to correctly report main effects
for each of the three variables of the multivariate data.
A series of paired t-tests were conducted to check for differences between proportions
for graphs with labels and graphs with legends for the various categories of possible
responses, but none of them were statistically significant (see Table 3.1). This suggests
that, contrary to expectations, there was no effect of graph format (labels versus legends)
in the open-ended graph description task. This was somewhat surprising, although upon
further review of the task there are a few potential explanations for this finding. One
explanation is that perhaps there is not a big enough difference between the stimuli in that
the placement of the legends in these graphs is not very far removed from the location of
the labels, and this may be why no effect of graph format was observed. Another, and
perhaps more likely, explanation is that maybe graph format matters less when the task is
predominately self-paced as well as open-ended. Additionally, it is possible that no
differences in graph format were observed because the coding scheme was too fine-
grained. Because there were many categories of responses, some categories had rather
small proportions of responses compared to others. Therefore, future research could use
a broader coding scheme to try to capture differences between graph formats that were
unobserved with the current coding scheme.
Individual Differences. For means for each of the individual difference measures, please
refer to Table 3.2. To determine the relationships between individual difference
measures and task performance, I computed Pearson product-moment correlation
coefficients (see Tables 3.3 and 3.4). Please note that one additional subject was
excluded from the correlational analyses due to not completing any of the individual
difference measures. Another four subjects were excluded from correlational analyses
due to the individual difference measures being completed out of order. Also, one
subject was excluded from correlations regarding the Graph Literacy Scale due to
38
missing data on that one measure, and two subjects were excluded from correlations
regarding the SSPAN task due to missing data on that measure. All correlations reported
were significant at the p < 0.05 level unless stated otherwise.
Higher graph literacy scores were significantly associated with more open-
mindedness and higher CRT scores. Higher working memory span was also correlated
with higher CRT scores, while greater need for cognition was associated with increased
open-mindedness and higher CRT scores. The overall proportion of correctly reported
relationships increased with increasing graph literacy (r = .24, p = .078), as did the
overall proportion of relationships described for graphs with labels (r = .25, p = .064).
Higher WM span was significantly correlated with both the overall proportion of
responses and the proportion of responses for graphs with legends, and was marginally
correlated with the proportion of responses for graphs with labels (r = .26, p = .056).
Increased CRT scores were significantly associated with a greater overall proportion of
responses, and this was also true both for graphs with labels and graphs with legends.
Correlations for Main Effects. Students with higher graph literacy scores were
marginally more likely to identify more main effects in general (r = .24, p = .082) and
specifically more main effects for graphs with labels (r = .23, p = .090). Those with
higher graph literacy were also more likely to identify main effects that corresponded to
variables differentiated by circle or square end-points (r = .26, p = .053), and this was
true for graphs with labels (r = .25, p = .064) but not for graphs with legends. Students
with higher WM span tended to identify more main effects in general (r = .23, p = .098)
and specifically more main effects for graphs with legends (r = .24, p = .082). Those
with high WM span were also more likely to identify main effects that corresponded to
variables differentiated by solid or dotted lines (r = .27, p = .052), and this was true for
graphs with legends (r = .24, p = .079) but not for graphs with labels. More open-
mindedness was associated with correct identification of more main effects that
corresponded to variables on the x-axis (r = .24, p = .076), and this was especially the
case when these graphs contained labels (r = .32).
Correlations for Interactions. Students with higher WM span identified more full 2-way
interactions for legend graphs, especially when these interactions involved the variable on

39
the x-axis and the variable shown using solid and dotted lines. Higher graph literacy was
associated with more reports of full 2-way interactions between variables on the x-axis
and variables shown using solid and dotted lines. Higher graph literacy was also
associated with fewer reports of full 2-way interactions between variables on the x-axis
and variables shown using circle and square end-points, especially when the graphs
contained legends. Greater NFC was correlated with fewer descriptions about full 2-way
interactions between variables shown using solid and dotted lines and variables shown
using circle and square end-points in graphs with legends. Increased cognitive reflection
was associated with more reports of full 2-way interactions between variables on the x-
axis and variables shown using circle and square end-points, as well as with more reports
of partial 3-way interactions and partial 3-way interactions for graphs with labels. More
open-mindedness was marginally associated with less identification of full 2-way
interactions for legend graphs (r = .27, p = .094). Higher WM span was marginally
negatively correlated with identification of full 2-way interactions between variables
shown using solid and dotted lines and variables shown using circle and square end-
points for graphs with labels (r = .23, p = .097). Finally, more reports of full 2-way
interactions between variables shown using solid and dotted lines and variables shown
using circle and square end-points were correlated with lower CRT scores (r = -.24, p =
.077).
In sum, graph literacy and WM span both predicted the mean proportion of correct
main effects reported in the open-ended graph description task, but attitude (e.g., open-
mindedness) was also an important factor. As expected, higher WM span appears
especially important for reporting proportionately more main effects and interactions for
graphs that contained legends. Additional dispositional characteristics (e.g., NFC and
cognitive reflection) were also relevant factors with regards to the proportion of
interactions reported.

40
Experiment 3
Introduction
Experiment 3 was intended to determine how well students identify main effects in
the context of a task involving immediate and long-term memory of important aspects of
data presented in graphs. In the current experiment, students must identify main effects
in an open-ended context before knowing what question may be asked. This is perhaps
more difficult than looking up information in a graph, as is the case in many fact-retrieval
tasks in the graph literature, and is also a more realistic scenario as students may not
know specifically which effects to look for in a graph prior to viewing it and would need
to be able to identify what is important information in the data set on their own.
Furthermore, much of the graph literature favors labels over legends, but many of the
studies upon which this recommendation is based consist of immediate fact-retrieval
tasks. According to the concept of desirable difficulties, introducing difficulties such as
legends may not benefit individuals in the short-term, but could benefit them in the long-
term. Thus, in Experiment 3, I also wanted to test whether graph format had a
differential effect in a long-term memory task (i.e., whether legends may actually benefit
graph comprehension in LTM, at least for some individuals). Students were expected to
be more accurate in responding to graphs containing legends than graphs containing
labels in the LTM task, but this difference was not expected in the immediate task.
Again, I also examined the role of individual differences in graph comprehension in the
current experiment. Greater familiarity with graphs and increased WM capacity were
hypothesized to be associated with better task performance in both immediate and LTM
tasks, as were increased NFC, open-mindedness, and cognitive reflection. WM capacity
was especially expected to influence accuracy for graphs with legends as compared to
graphs with labels.
Method
Participants. Seventy-one individuals volunteered to participate in this experiment for
course credit or for payment at the rate of $10 per hour. Fifteen of these participants
were excluded due to low task performance of less than 60% on the first task (n = 8),

41
equipment failure (n = 1), or failure to complete the study session (n= 6), resulting in a
total of 56 participants (M = 19.13 years; 26 women). Participants consisted of
University of Michigan undergraduates from both the University of Michigan Psychology
Subject Pool and the Ann Arbor community. Research protocols were approved by the
University of Michigan Institutional Review Board, and all participants provided written
informed consent.
Materials. Participants first completed a graph tutorial similar to the one used in
Experiment 2. However, this version of the graph tutorial only described main effects
and the mental averaging process and excluded explanations of interactions in order to
best correspond to the following experimental tasks. In contrast to Experiment 2, the
tutorial program was run on the computer using E-Prime 2.0 (Psychology Software
Tools, Pittsburgh, PA) instead of Qualtrics, with only slight modifications to match the
format of the tutorial with that of the Graph First Verification Task (e.g., graph was
viewed prior to the true-false statement, responses were true-false rather than open-
ended).
Because in this experiment I was interested in the effect of added visual difficulty
(i.e., legends) and individual differences on both immediate and long-term memory for
graphically presented data, I used two different computerized tasks, one to test immediate
memory (i.e., Graph First Verification Task) and one to test long-term memory
(LTM). The Graph First Verification Task (see Figure 3.4) included six 2x2x2 graphs
per condition (i.e., labels and legends; see Figure 3.2 for examples) and involved true-
false statements about potential main effects presented in the graphs (see Appendix J for
example statements). Students first read a brief description of the data set, and then they
viewed the graph for a fixed duration of one minute prior to viewing and responding to
the true-false statement. There was only one true-false question per graph in the Graph
First Verification Task, totaling 12 questions. A group of 24 true-false statements was
divided into two groups of 12. Thus, half of the participants were presented with one
group of 12 true-false statements in the Graph First Verification Task and the other half
were presented with the second set of 12 true-false statements. Trial order was

42
randomized for each participant, and graphs that appeared with labels for some subjects
appeared with legends for other subjects (and vice versa).
The LTM task (see Figure 3.5) was expected by the participants, as they had been
instructed during the Graph First Verification Task that they would be asked questions
about the graphs at a later time, and therefore the LTM task was not a surprise memory
test. This task did not include any graphs, but rather prompted subjects to recall the graph
or data set associated with each study description. Subjects first read a description of the
study (same description that appeared in the Graph First Verification Task) and then
responded to a true-false statement. They were then asked to indicate whether they had
clearly remembered the data set associated with that statement or if they had guessed
when responding to that statement. There were two true-false statements per data set, one
repeated from the Graph First Verification Task and one new (from the remaining set of
12 true-false questions unused in the Graph First Verification Task), totaling 24
questions. Participants were allotted a maximum of one minute for each statement, and
the screen advanced to the strategy question (i.e. remember or guess) upon
response. Trial order was randomized for each participant, both for the order of the
graphs and the order of the true-false statements.
All individual difference measures were the same as those used in Experiment 2.
All computer programs were run using E-Prime 2.0. True and false responses in the
graph tutorial, Graph First Verification Task, and LTM task were made using the “c” and
“m” keys on the keyboard, which were labeled “T” and “F” respectively. “Remember”
and “Guess” responses in the LTM task were also made using the “c” and “m” keys,
respectively. In the SSPAN task, all responses were made using the mouse.
Procedure. Participants first completed the graph tutorial program on the computer. Next
they completed the Graph First Verification Task. Students were instructed to pay close
attention to the graphs, as they would be asked questions about them later. This was
followed by approximately 20 minutes of individual difference measures (i.e., Edinburgh
Handedness Inventory, Unusual Uses Task, CRT, AOT, NFC), after which participants
completed the LTM task on the computer. Then subjects completed the remainder of the

43
individual difference measures (i.e., SSPAN, Graph Literacy Scale), followed by the
demographic questionnaire and exit survey. All participants were debriefed at the
conclusion of the experiment. Participants completed the study in approximately 1.5
hours.
Results and Discussion
Graph First Verification Task. Overall accuracy on this task was 84%. To assess the
effect of graph format (label or legend) on task accuracy and response time (RT), a 1x2
within-subjects ANOVA was conducted (see Table 3.5). All calculations of RT are
based on median RTs that have been filtered for correct responses only. There was no
significant effect of graph format on task accuracy (F(1,55) = 0.21, p = 0.646) in this
immediate task. Accuracy for graphs with labels (M = .85, SE = .017) was very similar to
accuracy for graphs with legends (M = .84, SE = .021). This finding suggests that both
graph formats, labels and legends, are effective for comprehension within the short-term.
Although I checked for an effect of graph format on RT, it is important to note that RT in
the current task is not an informative measure because the current task measures RT
when participants are viewing the true-false statements after a fixed graph encoding time.
Thus, in the current experiment a difference in RT was not predicted, and indeed no
significant effect of graph type on RT was found (F(1,55) = 1.14, p = 0.290).
Long-term Memory Task. For this analysis I computed accuracy on LTM trials as a
function of correct comprehension on the Graph First Verification Task trials. The
intuition was that these LTM trials would be the ones for which participants were more
likely to have actually encoded the graph since they correctly responded to a question
about the graph in the Graph First Verification Task. Based on only these trials, overall
accuracy in the LTM task was 79.6%. To determine whether graph format (label or
legend) had an effect on task accuracy and response time (RT), I conducted a repeated
measures ANOVA (see Table 3.5). Contrary to expectations, there was no significant
difference in accuracy between graph with labels (M = .79, SE = .022) and graphs with
legends (M = .80, SE = .019) in the LTM task, F(1, 55) = 0.25, p = .618. In the LTM
task, RT indicated how long it took participants to verify a true-false statement from
memory (without viewing the graph again). A difference in RT between graph formats
44
was not expected, and indeed no significant effect of graph format on RT was found (F(1,
55) = 0.30, p = .587).
These results suggest that introducing difficulties into a graph (i.e., legends) does not
benefit LTM more than other formats (i.e., labels). However, perhaps these difficulties
only benefit individuals who have the capacity to deal with the added difficulty and so
these differences are not observed within the data set as a whole. To address this
question, I conducted a mixed repeated measures ANOVA to examine the effect of
working memory ability (high versus low; between subjects) and graph format (label
versus legends; within subjects) on performance in the Graph First Verification Task and
the LTM task. Working memory groups were calculated based on a median split of the
data according to SSPAN partial load scores. For this analysis, all LTM task trials were
included as I was interested in accuracy change from immediate to LTM. Results
indicated a non-significant 3-way interaction (F(1, 54) = 1.43, p = .236), but results did
indicate a trend in the predicted direction, such that only individuals with high WM were
not disadvantaged from the inclusion of legends in the LTM task (see Figure 3.6). Those
with low WM span demonstrated an expected decline in performance from immediate to
LTM, but this difference in accuracy was more pronounced for graphs with legends.
These individuals had a relatively small decline in accuracy for graphs with labels from
the immediate task (M = .81, SE = .023) to the LTM task (M = .74, SE = .029), in
comparison to the greater decline in accuracy for graphs with legends from the immediate
task (M = .82, SE = .031) to the LTM task (M = .72, SE = .029). This is a different
pattern of results than what is found in the high WM span group. These individuals
demonstrate a slightly larger decline in performance from the immediate task to the LTM
task when graphs contained labels (M = .89, SE = .022 and M = .80, SE = .028,
respectively), compared to the smaller decline in performance across tasks for graphs that
contained legends (M = .85, SE = .030 and M = .80, SE = .028, respectively).
However, it is important to note that some items in the LTM task were repeated from
the Graph First Verification Task. Thus, it may be informative to examine repeated items
(i.e., how well individuals remembered the answer to questions answered previously)
separately from new items in the LTM task. For repeated items, this 3-way interaction

45
was marginally significant (F(1, 54) = 3.32, p = .074), with a similar pattern of results
observed for low and high WM span groups, as individuals in the low WM span group
were more detrimentally affected by legends from immediate to LTM than individuals in
the high WM group. This suggests that legends were more harmful for those who do not
have the capacity to deal with the added visual difficulty, especially when tested on the
same information again. This 3-way interaction was not statistically significant for new
items in the LTM task, and the pattern of results observed for the low and high WM span
groups were a little different. Although high WM individuals showed a similar pattern to
that observed in the prior analyses, individuals with low WM showed an almost equal
amount of decline from immediate to LTM in both graphs with labels and graphs with
legends. Collectively, these interaction results suggest that although high WM span
individuals may not benefit from difficulties such as legends in the long-term, they are
generally not disadvantaged by them as are low WM span individuals.
Also of interest was the relationship between reported memory for the individual
data sets in the LTM task and students’ actual performance on the LTM task. To
determine the effect of reported guessing or remembering as well as graph type on
students’ accuracy in the LTM task, a within-subjects repeated measures ANOVA was
conducted. Overall, as was expected, students’ accuracy on the LTM task was much
higher for questions for which they reported that they clearly remembered the data (M =
.81, SE = .023) compared to their accuracy for questions for which they reported guessing
(M = .62, SE = .029), F(1,46) = 35.66, p < .001. However, there was no interaction of
reported remembrance or guessing in the LTM task with graph type, F(1,46) = .001, p =
.978. Based on the desirable difficulties literature, I had predicted that LTM accuracy
would be higher for graphs with legends than for graphs with labels for items that
students reported clearly remembering, whereas I expected similar accuracy for both
label and legend graphs for questions on which students reported guessing. Yet, again
consistent with the prior analyses, this finding suggests that graph type did not influence
the effect of reported remembrance for LTM task questions on LTM task accuracy.
Individual Difference Measures. For means for each of the individual difference
measures, please refer to Table 3.2. To determine the relationships between individual

46
difference measures and task performance, I computed Pearson product-moment
correlation coefficients (see Table 3.6). Please note that two subjects were missing graph
literacy scores and thus were not included in the comparisons involving graph literacy.
All correlations reported were significant at the p < 0.05 level unless stated otherwise.
Increased open-mindedness was correlated with increased NFC. Higher CRT scores
were associated with higher graph literacy and increased WM span. Graph literacy and
WM span were correlated, such that higher graph literacy was associated with increased
WM span.
Individual Differences in the Graph Verification Task. Higher graph literacy predicted
overall accuracy on the Graph Verification Task and accuracy for graph with legends.
Higher WM span was marginally correlated with accuracy for graphs with labels (r = .23,
p = .096). Increased open-mindedness was associated with better overall accuracy on the
Graph Verification Task and was marginally associated with better accuracy for graphs
with legends (r = .26, p = .051). Decreased NFC was marginally associated with better
overall task accuracy (r = -.24, p = .076).
Individual Differences in the Long-term Memory Task. Correlational analyses indicated
that graph literacy (r = .39, p = .004) and WM span (r = .29, p = .032) measures both
predicted overall performance on the LTM task. Both higher graph literacy and higher
WM span were also associated with increased accuracy on graphs with legends in the
LTM task (r = .44, p = .001 and r = .33, p = .012, respectively). More open-minded
individuals generally performed better on the LTM task than less open-minded
individuals (r = .27, p = .048). Finally, higher scores on the CRT were marginally
associated with better performance on the LTM task (r = .25, p = .069).
General Discussion
Experiment 2 demonstrated that although students made very few errors in
describing multivariate graphs, they also reported only a small fraction of the total
possible relationships (main effects and interactions) existing in the data given the
complexity of the graphs. Although students did report primarily main effects rather than
interactions of any type (2-way or 3-way, full or partial), even the mean proportion of

47
total correct main effects reported was less than 50% of the total main effects that
students could have reported from the presented graphs. Thus, even when students report
main effects, they do not report all of them, although they are equally likely to report
main effects for each of the three variable types in a graph (variables on the x-axis,
variables indicated by solid or dotted lines, and variables indicated by circle or square
end-points). These results suggest that students may not grasp or understand all of the
relationships presented in multivariate data, even after some brief explanation of what
kinds of relationships are present in multivariate data and how to look for them in a
graph. Alternatively, perhaps students choose not to report more complex relationships
like interactions either because they do not fully understand them or because they are
unsure of their ability to correctly articulate them. Another potential possibility is that
students are simply not motivated to report such complex graphical relationships.
Additionally, results of Experiment 2 indicate that, contrary to expectations, there
was no effect of graph format (labels versus legends) on identification of main effects and
interactions in the open-ended graph description task. One plausible explanation is that
graph format matters less when the task is predominately self-paced as well as open-
ended. Alternatively, it is possible that no differences in graph format were observed
because the coding scheme was too fine-grained, and additional future analyses could use
a broader coding scheme to try to capture differences between graph formats that were
unobserved with the current coding scheme.
With regards to individual differences, results from Experiment 2 indicate that graph
literacy and WM span were both highly predictive of the proportion of correct main
effects and interactions students reported in an open-ended graph description task. Once
again, dispositional characteristics, such as open-mindedness and NFC, were also
influential with regards to task performance, both for identification of main effects and
interactions.
In Experiment 3, no effect of graph format on accuracy was found in either the
Graph First Verification Task or the LTM task. However, graph literacy and WM span
were both generally predictive of accuracy in the Graph First Verification Task and LTM
task. Individuals more highly skilled with graphs were more accurate in both immediate

48
and LTM tasks, especially for graphs containing legends. This is consistent with the
prediction that those more familiar with graphs would better know how to approach
complex graphs or more easily learn from the included graph comprehension instructions.
In contrast, WM span was more relevant for accuracy in the LTM task, especially for
graphs containing legends. There are two potential explanations for this finding. One is
that higher span individuals were better able to mentally transform the graphically
presented data once it had been retrieved from LTM, in order to re-identify important
relationships in the graph. Another explanation is that higher WM span individuals were
better able to encode the relationships between variables in the first place, in the
immediate task, because they perhaps were better able to keep track of the many
variables while first interpreting the graph than low WM span individuals.
Thinking dispositions such as open-mindedness, NFC, and cognitive reflection also
played a role in Experiment 3 task performance. Open-mindedness was influential for
overall accuracy in both the immediate and LTM tasks. Individuals with lower NFC
performed better in the immediate task than those with high NFC, perhaps because less
cognitive effort was involved in remembering within the short-term. Meanwhile, higher
cognitive reflection scores were associated with better overall accuracy in LTM,
suggesting that perhaps individuals who take the time or put in the required effort to
reach a more deliberate, correct answer better remember this information later.
Moreover, a trend in the data suggests that “desirable” difficulties may not be
beneficial for all individuals. Although perhaps not immediately apparent, individuals
need to have the WM capacity to deal with such difficulties, or else added difficulty may
actually be detrimental to task performance in the long-term. Additionally, increased
open-mindedness was associated more specifically with increased accuracy on graphs
containing legends in the immediate task. Thus, the potential benefits of desirable
difficulties (e.g., legends) may be highly dependent both on an individual’s ability to deal
with these demands and on an individual’s dispositions towards dealing with such
demands.

49
Figure 3.1. Sample Screens of Graph Tutorial Explanations for Interactions and Main Effects

50
(a)
Figure 3.2. Example 2x2x2 Line Graphs. In this figure, (a) shows a sample graph with labels, while (b) shows a sample graph with a legend.
(b)

51
Figure 3.3. Automated Symmetry Span Task Sample Trial Sequence. This figure was modified from the one found in Redick et al. (2012).

52
Figure 3.4. Experiment 3 Graph First Verification Task Sample Trial Sequence

53
Figure 3.5. Experiment 3 Long-Term Memory Task Sample Trial Sequence

54
Figure 3.6. Three-way Interaction between Working Memory Span, Time of Test, and Graph Type for Experiment 3. Each graph depicts graph format (label versus legend) by time of test (immediate versus long-term memory or LTM). The top graph depicts the low working memory (WM) group, while the bottom graph depicts the high WM group. WM groups were determined by a median split.

55
Table 3.1
Paired Comparisons for Proportions of Correct Responses by Graph Type
Graphs with Labels
Graphs with Legends
M SE M SE t p Overall .197 .008 .190 .007 1.15 .255
All Main Effects .470 .034 .450 .034 .755 .453 Main Effect of Variable on X-axis .454 .038 .470 .035 -.476 .636 Main Effect of Single/Dotted Lines .486 .042 .432 .044 1.18 .242
Main Effect of Circle/Square End-Points .470 .048 .448 .048 .468 .641 All Interactions .095 .007 .092 .008 .298 .767
All Full Interactions .049 .007 .045 .006 .426 .672 Full 2-way Interactions .060 .009 .058 .008 .148 .883
X-axis by Single/Dotted Line 2-way Interaction .142 .021 .148 .021 -.173 .863
X-axis by Circle/Square End-Points 2-way Interaction .016 .009 .016 .009 .000 1.00
Single/Dotted Line by Circle/Square End-Points 2-way Interaction .022 .011 .011 .008 1.00 .321
All Partial Interactions .141 .014 .140 .014 .075 .940 Partial 2-way Interactions .124 .013 .124 .013 -.001 .999 Full 3-way Interactions .016 .009 .006 .005 1.43 .159
Partial 3-way Interactions .191 .032 .186 .030 .155 .877 Note. None of these comparisons are statistically significant. Degrees of freedom (df) for all comparisons are 60.

56
Table 3.2
Means of Individual Difference Measures for Experiments 2 and 3
Graph Literacy SSPAN AOT NFC CRT
Experiment 2 11.73 (1.28) 28.56 (7.04) 176.23 (16.16) 60.59 (11.82) 1.45 (1.11) Experiment 3 11.52 (1.45) 30.48 (7.22) 177.14 (17.46) 62.82 (10.92) 1.30 (1.14) Note. Values in parentheses indicate standard deviations. For Experiment 2, N = 56 for all measures except for the Graph Literacy Scale (n = 55) and the SSPAN (n = 54). For Experiment 3, N = 56 for all measures except for the Graph Literacy Scale (n = 54).

57
Table 3.3
Correlations between Individual Difference Measures and Task Performance for Experiment 2
Graph Literacy SSPAN AOT NFC CRT
Overall Proportion .240† .327* -.030 .082 .363**
Overall Proportion for Graphs with Labels .251† .262† .124 .153 .337*
Overall Proportion for Graphs with Legends .174 .329* -.191 -.014 .309*
Proportion of Main Effects .236† .228† -.023 .010 .148
Proportion of Main Effects for Graphs with Labels .231† .182 .035 .011 .119
Proportion of Main Effects for Graphs with Legends .204 .239† -.078 .007 .154
Proportion of All Interactions -.099 .033 -.001 .102 .254†
Proportion of All Interactions for Graphs with Labels -.039 .028 .114 .195 .271*
Proportion of All Interactions for Graphs with Legends -.118 .024 -.110 -.029 .135
Proportion of Full Interactions .092 .151 -.174 -.105 .141
Proportion of Full Interactions for Graphs with Labels .091 -.009 -.011 .034 .164
Proportion of Full Interactions for Graphs with Legends .030 .243† -.249† -.198 .017
Proportion of Full 2-way Interactions .047 .142 -.132 -.141 .116 Proportion of Full 2-way Interactions for Graphs with
Labels .035 -.065 .041 .015 .141
Proportion of Full 2-way Interactions for Graphs with Legends .024 .270* -.226† -.209 .002
Proportion of Partial Interactions -.143 -.027 .070 .153 .218 Proportion of Partial Interactions for Graphs with Labels -.088 .036 .129 .193 .207
Proportion of Partial Interactions for Graphs with Legends -.137 -.073 -.015 .051 .137 Proportion of Partial 2-way Interactions -.188 -.089 .115 .097 .045
Proportion of Partial 2-way Interactions for Graphs with Labels -.156 -.044 .148 .183 .026
Proportion of Partial 2-way Interactions for Graphs with Legends -.129 -.088 .029 -.030 .041
Full 3-way Interactions .137 .080 -.164 .041 .112 Full 3-way Interactions for Graphs with Labels .177 .143 -.142 .062 .120
Full 3-way Interactions for Graphs with Legends .029 -.050 -.153 -.007 .068 Partial 3-way Interactions -.033 .054 -.011 .155 .330*
Partial 3-way Interactions for Graphs with Labels .033 .113 .047 .117 .330* Partial 3-way Interactions for Graphs with Legends -.092 -.025 -.069 .140 .211
Graph Literacy — .029 .297* .166 .276* SSPAN — -.102 .048 .283*
AOT — .501* .181 NFC — .460* CRT —
Note. *p < .05. **p < .01. †marginally significant (p < .10). All proportions listed are for correct responses only. Individual difference measures include Graph Literacy Scale scores, Symmetry Span partial load scores (SSPAN), Actively Open-Minded Thinking Scale scores (AOT), Need for Cognition Scale scores (NFC), and Cognitive Reflection Test scores (CRT).

58
Table 3.4
Additional Correlations between Individual Difference Measures and Task Performance
for Experiment 2
Graph Literacy SSPAN AOT NFC CRT
Proportion of Main Effects of Variable on X-axis .117 .150 .239† .085 .150 Proportion of Main Effects of Variable on X-axis
for Graphs with Labels .074 .130 .324* .164 .073
Proportion of Main Effects of Variable on X-axis for Graphs with Legends .136 .135 .093 -.018 .197
Proportion of Main Effects of Single/Dotted Lines .195 .266† -.108 -.130 .072
Proportion of Main Effects of Single/Dotted Lines for Graphs with Labels .203 .218 -.128 -.202 .086
Proportion of Main Effects of Single/Dotted Lines for Graphs with Legends .130 .241† -.057 -.020 .038
Proportion of Main Effects of Circle/Square End-Points .262† .157 -.143 .069 .146
Proportion of Main Effects of Circle/Square End-Points for Graphs with Labels .252† .088 -.070 .073 .116
Proportion of Main Effects of Circle/Square End-Points for Graphs with Legends .204 .185 -.180 .046 .138
Proportion of Full 2-way Interactions for X by Line .270* .214 -.037 -.051 .161
Proportion of Full 2-way Interactions for X by Line for Graphs with Labels .110 -.018 .148 .035 .093
Proportion of Full 2-way Interactions for X by Line for Graphs with Legends .253† .313* -.199 -.103 .125
Proportion of Full 2-way Interactions for X by Circle/Square -.475** .023 -.122 -.017 .122
Proportion of Full 2-way Interactions for X by Circle/Square for Graphs with Labels -.200 .097 -.152 .062 .336*
Proportion of Full 2-way Interactions for X by Circle/Square for Graphs with Legends -.452** -.066 -.016 -.086 -.169
Proportion of Full 2-way Interactions for Line by Circle/Square .005 -.185 -.130 -.245 -.238†
Proportion of Full 2-way Interactions for Line by Circle/Square for Graphs with Labels .052 -.228† -.068 -.100 -.169
Proportion of Full 2-way Interactions for Line by Circle/Square for Graphs with Legends -.078 .028 -.137 -.306* -.177
Note. *p < .05. **p < .01. †marginally significant (p < .10). All proportions listed are for correct responses only. Individual difference measures include Graph Literacy Scale scores, Symmetry Span partial load scores (SSPAN), Actively Open-Minded Thinking Scale scores (AOT), Need for Cognition Scale scores (NFC), and Cognitive Reflection Test scores (CRT).

59
Table 3.5
ANOVA of Task Accuracy and Response Time (RT) by Graph Type and Task
Source Measure df F Partial η2 p
Immediate Task
Graph Type
Accuracy 1 .213 .004 .646 RT 1 1.14 .020 .290
Error Accuracy 55 (.019) RT 55 (3219775.40)
Long-Term Memory Task
Graph Type
Accuracy 1 .252 .005 .618 RT 1 .299 .005 .587
Error Accuracy 55 (.015) RT 55 (1438250.75)
Note. ANOVA = analysis of variance. Values enclosed in parentheses represent mean square errors. *p < .05. **p < .01.

60
Table 3.6
Correlations between Individual Difference Measures and Graph First Verification Task Performance for Experiment 3
Graph Literacy SSPAN AOT NFC CRT
Overall Immediate Graph Accuracy .289* .117 .280* -.239† .065
Immediate Label Graph Accuracy .110 .225† .142 -.262† .010
Immediate Legend Graph Accuracy .298* -.020 .262† -.114 .078
Graph Literacy — .392** .155 -.097 .343*
SSPAN — .078 .032 .319*
AOT — .269* .094
NFC — .122
CRT —
Note. *p < .05. **p < .01. †marginally significant (p < .10). Individual difference measures include Graph Literacy Scale scores, Symmetry Span partial load scores (SSPAN), Actively Open-Minded Thinking Scale scores (AOT), Need for Cognition Scale scores (NFC), and Cognitive Reflection Test scores (CRT).

61
CHAPTER 4:
GRAPH COMPREHENSION INSTRUCTION
Introduction
As mentioned previously, students are not especially good at comprehending
multivariate graphs and no explicit guidelines on how to teach comprehension of
complex multivariate graphs currently exist, which makes it difficult for instructors to
create or find effective instructional tools for interpretation of such data. This suggests
the need for an instructional resource, such as a tutorial, that teachers could use to help
instruct their students. Such a tutorial would explain how to identify and interpret
important relationships within multivariate data presented graphically to help students
learn and improve on their existing graph comprehension skills.
The prior two experiments indicated that, even with the completion of a graph
tutorial prior to a graph comprehension task, students are not especially good at
extracting main effects and interactions from complex multivariate data in an open-ended
context, nor do they have excellent immediate or long-term memory for these important
relationships depicted in graphs. Therefore, the goal of the current experiment was to
determine the effectiveness of the tutorial I created as an instructional tool for students.
A general task-analysis approach was taken to develop the tutorial. Specifically, I
identified the visual/cognitive transformations required to understand each main effect in
a 2x2x2 graph. For each variable, participants are required to mentally compute the
average across the other two variables for each value of that target variable. Thus, to
compute the variable depicted by solid versus dotted lines, participants must first
mentally compute the midpoint of each solid line and then mentally compute the average
of these two midpoints. This average would be the overall value for the variable indicated

62
by solid lines. Participants would then compute the overall value for the variable
indicated by dotted lines using the same process, after which they would compare these
two averages (overall mean for solid lines and overall mean for dotted lines) to determine
the direction of the main effect, if one is present. In the tutorial, this mental averaging
process was laid out in steps, one at a time, with important or relevant pieces of the graph
highlighted at each step (e.g., using color to highlight relevant lines and stars to mark
averages). This was accomplished using “static builds”, or still frames of each step,
which can be seen in Figure 4.1. For example, when highlighting which two lines would
be mentally averaged to compute the overall average for boys (solid lines) and which two
lines would be mentally averaged to compute the overall average for girls (dotted lines),
the color orange was used to highlight the lines for girls and the color green was used to
highlight the lines for boys. The use of color was intended to provide an added visual cue
for grouping of the relevant information being compared in the example in the attempt to
make the information provided in the tutorial easier to follow and comprehend. Stars
were used to mark the estimated averages for boys (solid lines) and girls (dotted lines), to
make the mental averaging concept more concrete and easily visible to participants.
Color was also used for the stars, to help participants connect the appropriate averages to
each level of the variable being compared (i.e., orange star for girls’ average and green
star for boys’ average). After completing this mental averaging example containing
“static builds”, participants would then have to use the same mental averaging process to
determine whether a main effect was present for each of the other two variables (i.e., the
variable labeled on the x-axis and the variable indicated by circle and square end-points)
in the graph.
Thus, in the tutorial students are walked through progressively more difficult graphs
and questions relating to these graphs. When they reach the most difficult 2x2x2 graph,
“static builds” are used to demonstrate the mental averaging process required to identify
main effects in the sample graph. Finally, the tutorial provides participants with several
practice questions.
Thus, in the next two experiments, I address the question of whether students are
able to understand and interpret main effects presented in graphs in an immediate fact-

63
retrieval task and whether they can be trained to identify and better comprehend such data
using the tutorial I have created. Furthermore, I investigate the role of individual
differences in task performance to determine whether individual differences would play a
role both in students’ existing skill in comprehending main effects and in the training of
such complex data comprehension skills.
Experiment 4
Introduction
In Experiment 4, my aim was to determine how well students are able to identify
main effects without explicit prior instruction or training on how to do so. This
experiment would therefore provide a baseline for student performance, with which I
could later compare performance on the same task for students who received additional
instruction from the computerized tutorial (Experiment 5). Additionally, individual
differences were evaluated as critical factors in graph comprehension.
Method
Participants. Thirty-four individuals volunteered to participate in this experiment for
course credit or for payment at the rate of $10 per hour. Two of these participants were
excluded due to low task performance of less than 60%, resulting in a total of 32
participants (M = 19.63 years; 19 women). Participants consisted of University of
Michigan undergraduates from both the University of Michigan Psychology Subject Pool
and the Ann Arbor community. Research protocols were approved by the University of
Michigan Institutional Review Board, and all participants provided written informed
consent.
Materials.
Question First Verification Task. Participants were provided with two practice questions
prior to beginning the experimental trials. A trial began with a brief description about a
scientific study, followed by a single true-false statement (see Appendix J for sample
statements). Then a graph was presented and participants judged whether the statement
they had just read was true or false while viewing the graph. A sample trial is illustrated

64
in Figure 4.2. As in Experiment 3, each graph was a line graph depicting 2x2x2 data (see
Figure 4.3 for examples). Graphs were black and white with some visual cues to
differentiate between the lines (i.e., solid and dotted lines, circle and square end-
points). Half of the graphs contained labels and half of the graphs contained
legends. Participants were instructed to respond as quickly and as accurately as
possible. Graphs were presented for a maximum of one minute, and the graphs
terminated upon response. Then participants were given a second true-false statement
corresponding to the same data set, followed by the presentation of the graph for a second
time. Once again, participants judged whether the statement they had just read was true
or false while viewing the graph. There were 12 such trials in the Question First
Verification Task, totaling 24 true-false statements. These true-false questions were the
same as the ones used in Experiment 3. Trial order was randomized for each participant,
and graphs that appeared with labels for some subjects appeared with legends for other
subjects (and vice versa).
It is important to note that the key difference between the immediate task in the
current experiment and that of Experiment 3 is that in the Question First Verification
Task in Experiment 3 students must identify main effects in an open-ended context
before knowing what question may be asked, whereas in the current experimental task
students receive the question prior to viewing the graph and thus can focus only on
information pertaining to that individual question.
All individual difference measures were the same as the ones used in Experiments 2
and 3.
All computer programs were run using E-Prime 2.0 (Psychology Software Tools,
Pittsburgh, PA). In the graph tutorial and Question First Verification Task, true and false
responses were made using the “c” and “m” keys on the keyboard, which were labeled
“T” and “F” respectively. In the SSPAN task, all responses were made using the mouse.
Procedure. Participants first completed the Question First Verification Task on the
computer. Next, participants completed the same battery of individual measures as
described in Experiment 2. Finally, participants completed a demographic questionnaire

65
about themselves, as well as an exit survey about the study. All subjects were debriefed
at the end of the experiment. The duration of the study was approximately one hour.
Results and Discussion
Question First Verification Task. Overall, task accuracy was an above chance 0.77. To
assess the effect of graph format (label or legend) on task accuracy and response time
(RT), a 1x2 within-subject ANOVA was conducted (see Table 4.1). All calculations of
RT are based on median RTs that have been filtered for correct responses only. There
was a significant main effect of graph type on both accuracy (F(1,31) = 5.87, p = .021)
and RT (F(1,31) = 26.11, p < .001). Participants were significantly more accurate in
responding to graphs with labels (M = .81, SE = .023) than graphs with legends (M = .73,
SE = .023). This finding suggests that, as predicted, interpreting graphs with legends is
more difficult than interpreting graphs with labels. As expected based on prior data,
participants were also faster to respond to graphs with labels (M = 8088.17 ms, SE =
928.38) than to graphs with legends (M = 11658.73 ms, SE = 783.30).
Individual Differences. For means for each of the individual difference measures, please
refer to Table 4.2. To determine the relationships between individual difference
measures and task performance, I computed Pearson product-moment correlation
coefficients (see Table 4.3). Please note that one additional subject was excluded from
the correlational analyses due to prior familiarity with at least one of the individual
difference measures and one subject was excluded from correlations regarding the AOT
due to missing data for this measure. All correlations reported were significant at the p <
0.05 level unless stated otherwise.
Graph literacy was marginally correlated with overall task accuracy (r = .33, p =
.068) and with accuracy on graphs with labels (r = .35, p = .057). Interestingly, there was
no correlation between graph literacy and accuracy on graphs with legends. One possible
explanation is that using legends requires specialized skills and even those with graph
experience may not know how to approach interpretation of these kinds of graphs.
Higher CRT scores were significantly correlated with higher WM span, higher graph
literacy, and a greater NFC.
66
I then conducted a median split based on participants’ SSPAN partial load scores to
split the data into a low WM group (M = 22.36; n = 14) and a high WM group (M =
35.41; n = 17 for all measures except for the AOT, for which n = 16), to see if WM span
had a differential effect on whether individual differences would affect task
performance. For those with low WM capacity, open-mindedness was marginally
correlated with overall task performance (r = .51, p = .064) and with accuracy for graphs
with legends (r = .50, p = .070). For those with high WM capacity, graph literacy was
marginally predictive of overall task performance (r = .42, p = .090) and significantly
predictive of accuracy on graphs with labels (r = .59). Additionally, for the high WM
group, higher scores on the CRT were marginally correlated with accuracy on graphs
with labels (r = .45, p = .068). Therefore, dispositional factors such as open-mindedness
appear to play a larger role in graph comprehension when individuals have less capacity
to deal with difficulty.
Experiment 5
Introduction
As seen in Experiment 4, students who received no specialized instruction (i.e., no
graph tutorial) were capable of interpreting relatively complex graphs with above chance
accuracy. However, there was certainly room for improvement, as mean accuracy did not
approach ceiling. Therefore, the goal of Experiment 5 was to determine whether the
graph tutorial that I created is an effective instructional tool for the purpose of improving
students’ graph literacy skills. In the current experiment, students completed a graph
tutorial prior to completion of the same tasks used in Experiment 4. Student performance
in Experiment 5 is thus compared with student performance from Experiment 4 to
determine the success of the current graph tutorial. Additionally, I investigated the
impact of individual differences on instruction of graphical literacy.
Method
Participants. Sixty-six individuals volunteered to participate in this experiment for
course credit or for payment at the rate of $10 per hour. Four of these participants were
excluded due to low task performance of less than 60% (n = 2), failure to follow task

67
instructions (n = 1), or failure to complete the study session (n= 1), resulting in a total of
62 participants (M = 19.24 years; 35 women). Participants consisted of University of
Michigan undergraduates from both the University of Michigan Psychology Subject Pool
and the Ann Arbor community. Research protocols were approved by the University of
Michigan Institutional Review Board, and all participants provided written informed
consent.
Materials. Participants first completed the same graph tutorial program on the computer
that was used in Experiment 3, with only slight modifications to match the format of the
tutorial with that of the Question First Verification Task (e.g., the true-false statement
was viewed prior to the graph). For example screenshots of the tutorial see Figure 4.1.
Thus, the tutorial walked students through progressively more difficult graphs and true-
false questions relating to these graphs. The tutorial also explained how to use a mental
averaging procedure to answer questions about main effects relating to 2x2x2 line graphs
via “static builds.” Static builds in the context of our tutorial are simply still frames that
lay out the steps of the mental averaging process, one at a time, and highlight important
or relevant pieces of the graph at each step (e.g. using color to highlight relevant lines or
stars to mark averages). Finally, the tutorial provided participants with several practice
questions.
The same Question First Verification Task used in Experiment 4 and the same
individual difference measures used in Experiments 2-4 were used in Experiment 5. The
instructions for the Question First Verification Task were very subtly changed to reflect
the inclusion of the tutorial preceding it, but otherwise remained identical to the version
used in Experiment 4.
All computer programs were run using E-Prime 2.0 (Psychology Software Tools,
Pittsburgh, PA). In the graph tutorial and Question First Verification Task, true and false
responses were made using the “c” and “m” keys on the keyboard, which were labeled
“T” and “F” respectively. In the SSPAN task, all responses were made using the mouse.
Procedure. Participants first completed the graph tutorial program, followed by the
Question First Verification Task on the computer. Next, participants completed a battery
of individual difference measures, starting with the Edinburgh Handedness Inventory,

68
followed by the Unusual Uses Task, the CRT, the AOT scale, the NFC scale, the
automated SSPAN, and the Graph Literacy Scale. Finally, participants completed the
demographic questionnaire about themselves as well as an exit survey about the
study. All subjects were debriefed at the end of the experiment.
Results and Discussion
Question First Verification Task. Overall, task accuracy was 0.83. This is significantly
higher than the task accuracy of 0.77 in Experiment 4 (F(1,92) = 7.38, p = .008), as
determined by a mixed repeated measures 2x2 ANOVA of graph type (label or legend)
and tutorial use (tutorial or no tutorial). Thus, completing the Question First Verification
Task after the tutorial resulted in a significantly higher overall task accuracy than
completing the same task without the tutorial. This suggests that my tutorial is an
effective tool for teaching students how to identify main effects in these kinds of 2x2x2
line graphs. Alternatively, it is possible that the tutorial is increasing students’
motivation for completing the task or their attention to the task rather than, or in addition
to, improving students’ graph comprehension skills.
To assess the effect of graph format (label or legend) on task accuracy and response
time (RT) in the current experiment, a within-subjects ANOVA was conducted (see
Table 4.1). All calculations of RT are based on median RTs that have been filtered for
correct responses only. Consistent with prior research, participants were faster verifying
a statement when viewing graphs with labels (M = 7558.83 ms, SE = 464.42 ms) than
graphs with legends (M = 9777.08 ms, SE = 469.83 ms; F(1,61) = 32.17, p <
0.001). This also replicates the effect of graph type on RT found in Experiment 4.
However, there was no difference in accuracy between graphs with labels (M = 0.84, SE
= 0.014) and graphs with legends (M = 0.82, SE = 0.018; F(1,61) = 0.83, p = 0.365). This
is in contrast to the significant difference in accuracy that occurred in Experiment 4,
which would suggest that the inclusion of the tutorial in the current experiment might
have somehow lessened the overall difficulty of the legend graphs. I conducted a mixed
repeated measures 2x2 ANOVA of graph type (label or legend) and tutorial use (tutorial
or no tutorial) to determine whether this interaction between graph type and tutorial use
was significant. Results indicated a marginally significant interaction (F(1,92) = 2.78, p

69
= .099) between graph type and tutorial use. Thus, participants who did not complete the
tutorial performed worse on both graph types in the task compared to those who did
complete the tutorial, but this discrepancy in accuracy was especially notable for graphs
with legends. One potential explanation for this difference in results between
Experiments 4 and 5 is that the primary example in the graph tutorial that demonstrates to
participants how to identify main effects within a line graph contains a legend.
A regression analysis was conducted to ascertain which of the various individual
differences (i.e., graph literacy, WM span, open-mindedness, NFC) most impacted task
accuracy and whether this differed between those who received additional instruction
from the graph tutorial and those who did not. The CRT was not included in the model
due to its limited range of scores and thus small amount of variance. For regression
results see Table 4.4. However, because open-mindedness did not contribute to the
regression model for either Experiment 4 or 5, a separate regression was run without the
inclusion of open-mindedness in order to achieve the best possible fit of the model for the
data (see Table 4.5). Results of this regression analysis suggest that when students
receive no additional instruction, graph literacy is the only significant predictor of their
task performance, β = .389, t(26) = 2.10, p = .046. Thus, those who are more
knowledgeable about graphs will be more accurate in responding to true-false questions
about main effects presented in the graphs. This is consistent with the graphical literacy
literature, and is a rather intuitive finding. In contrast, for those students who do receive
additional instruction from the graph tutorial, other individual differences emerge as
significant predictors of task performance. It is extremely interesting that in this case
knowledge about graphs is a marginally significant predictor (β = .215, t(58) = 1.87, p =
.066), whereas WM capacity (β = .256, t(58) = 2.20, p = .032) and attitude towards
difficult thinking (β = .290, t(58) = 2.45, p = .017) matter more for performance. This
finding suggests that those with higher NFC or higher WM span will benefit more from
instruction than those who do not enjoy difficult thinking or have lower WM capacity.
Therefore, both WM capacity and attitude of the learner will impact the effectiveness of
additional graph instruction. Given that WM span and NFC are correlated such that
higher WM span is associated with higher NFC (see Table 4.6 and the correlational
analyses that follow), perhaps those with lower WM capacity do not enjoy difficult

70
thinking because it requires too much effort and they have less capacity to deal with
overcoming challenges. Therefore, maybe they do not benefit as much from instruction
because they do not engage with the material, are unable to keep track of all the relevant
information, or simply find the task of interpreting complex multivariate graphs too
effortful, hard, or overwhelming.
Individual Difference Measures. For means for each of the individual difference
measures, please refer to Table 4.2. To determine the relationships between individual
difference measures and task performance, I calculated Pearson product-moment
correlation coefficients (see Table 4.6). Please note that one subject was excluded from
correlations regarding the AOT due to missing data on that one measure. All correlations
reported were significant at the p < 0.05 level unless stated otherwise.
Working memory capacity and graph literacy each predicted overall accuracy on the
Question First Verification Task, as expected. WM capacity was more highly correlated
with accuracy for graphs with labels than for graphs with legends, although this was not a
significant difference (t(59) = 0.62, p = 0.27). Graph literacy was correlated with
accuracy for graphs with legends, but not for graphs with labels. NFC and the CRT also
both predicted task performance. Interestingly, NFC was more highly correlated with
task accuracy in the legend condition than in the label condition, though this was not a
significant difference (t(59) = -0.16, p = 0.57). Additionally, the CRT was correlated
with performance in the label condition, but not the legend condition. WM capacity was
also correlated with both the NFC and CRT measures. Performance on the CRT was
correlated both with graph literacy and open-mindedness. Graph literacy was marginally
correlated with open-mindedness (r = 0.24, p = .066) and NFC (r = 0.22, p = .089). As in
Experiment 4, these results suggest that dispositional factors such as need for cognition
and cognitive reflection play a substantial role in task performance, in addition to factors
more related to knowledge or skill (i.e., graph literacy and WM span).
I then conducted a median split based on participants’ WM partial load score to split
the data into a low WM group (M = 22.30; n = 30) and a high WM group (M = 34.22; n =
32), to see if WM had a differential effect on whether these other individual differences
would affect task performance. For those with low WM capacity, NFC was marginally
71
correlated with overall task accuracy (r = 0.35, p = .059). Performance on the CRT was
significantly correlated with graph literacy (r = 0.65) and with open-mindedness (r =
0.48). Graph literacy was only marginally correlated with open-mindedness (r = 0.35, p
= .056). Meanwhile, for those with high WM capacity, overall task accuracy was
predicted by graph literacy (r = 0.45), NFC (r = 0.39), open-mindedness (r = 0.37), and
CRT score (r = 0.45). Accuracy on graphs with labels was correlated with WM capacity
(r = 0.40), graph literacy (r = 0.35), and CRT score (r = 0.59), whereas accuracy on
graphs with legends was correlated with graph literacy (r = 0.40), NFC (r = 0.38), and
open-mindedness (r = 0.37). Performance on the CRT was also correlated with WM
capacity (r = 0.36) and graph literacy (r = 0.54). In contrast to the pattern of results
observed in Experiment 4, these results indicate that dispositional factors are important
for both low and high WM span groups. However, in this case it seems that more
dispositional factors are predictive of task performance for those with high WM span
rather than low WM span.
General Discussion
Experiment 4 demonstrated that students who receive no specialized training are
capable of interpreting relatively difficult graphs with above chance accuracy, although
there is certainly room for improvement, as mean accuracy did not approach ceiling.
Taken collectively, results from Experiments 4 and 5 indicate that students are faster to
verify true-false statements in an immediate fact-retrieval task when graphs contain labels
than when they contain legends, which is consistent with findings in the graph design
literature. Moreover, in comparing Experiments 4 and 5, although individuals who
received no specialized instruction were more accurate in responding to graphs with
labels than graphs with legends, this difference in accuracy between graph formats was
diminished with the use of a graph tutorial. This suggests that the graph tutorial was
potentially an effective tool for teaching students how to deal with difficulties in graph
comprehension. This also suggests that any potential differences in accuracy due to
varying graph format may have been unobserved in Experiments 2 and 3 because of the
inclusion of the tutorial. In other words, the tutorial may serve to negate possible

72
advantages of labels over legends by better familiarizing students with varying graph
formats and providing them with opportunities to practice interpreting such graphs.
With regards to individual differences, the general conclusion derived from
Experiments 4 and 5 is that dispositional factors (e.g., open-mindedness, NFC) play a
substantial role in graph comprehension, in addition to factors more related to knowledge
and skills (e.g., graph literacy, WM span). It remains unclear as of yet whether
dispositional factors play a larger role for low knowledge or lesser skilled individuals
(i.e., low graph literacy or WM span) as compared to individuals with greater knowledge
and skills (i.e., high graph literacy or WM span). However, it is apparent from these
experiments that although familiarity with graphs is important for graph comprehension,
WM capacity and attitude towards thinking hard are key factors in the effectiveness of
instruction of graph comprehension skills. Specifically, students who do not enjoy
effortful thinking are less likely to benefit from instruction, which suggests a need for
educators to foster enjoyment of cognitive work in order for training of graphical skills to
be effective.
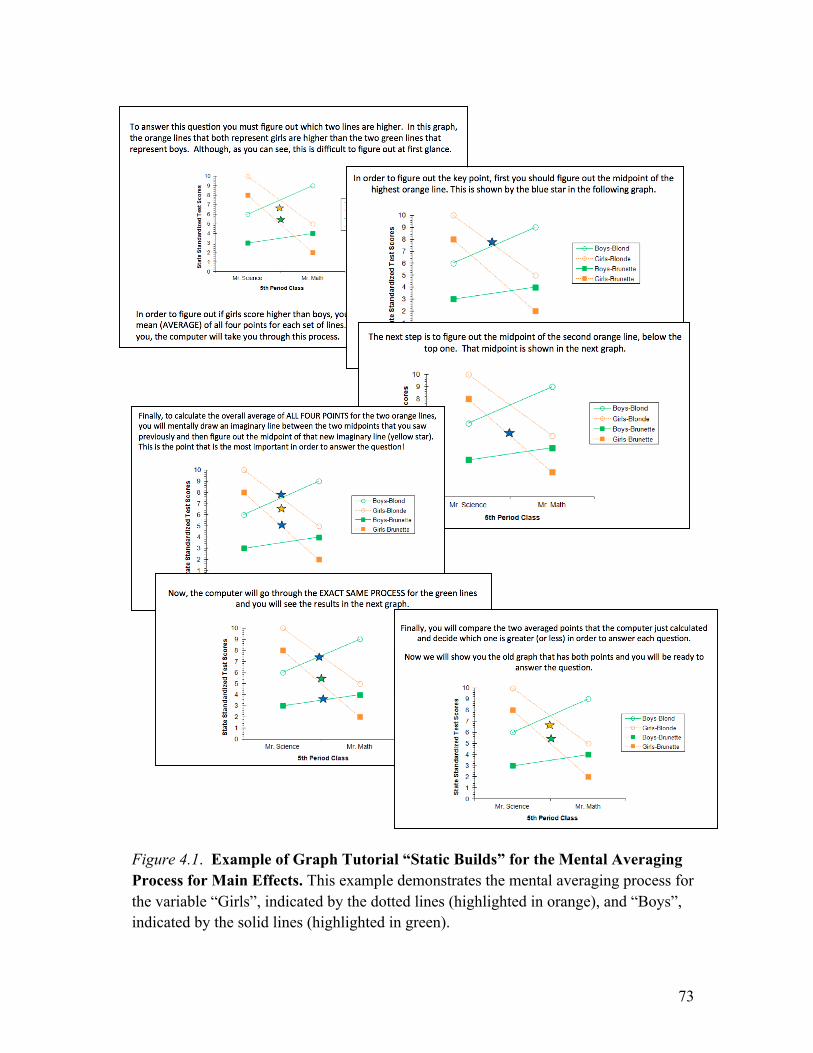
73
Figure 4.1. Example of Graph Tutorial “Static Builds” for the Mental Averaging Process for Main Effects. This example demonstrates the mental averaging process for the variable “Girls”, indicated by the dotted lines (highlighted in orange), and “Boys”, indicated by the solid lines (highlighted in green).

74
Figure 4.2. Experiments 4 and 5 Question First Verification Task Sample Trial Sequence

75
(a) (b)
Figure 4.3. Example 2x2x2 Line Graphs. In this figure, (a) shows a sample graph with labels, while (b) shows a sample graph with a legend.

76
Table 4.1 ANOVA for Task Accuracy and RT by Graph Type (Label/Legend) and Experiment Experiment Source Measure df F Partial η2 p
4 Graph Type Accuracy 1 5.87* .159 .021
RT 1 26.11** .457 .000
Within-group Error Accuracy 31 (.016) RT 31 (7812742.51)
5 Graph Type Accuracy 1 .832 .013 .365
RT 1 32.17** .345 .000
Within-group Error Accuracy 61 (.011) RT 61 (4741584.73)
Note. ANOVA = analysis of variance. Values enclosed in parentheses represent mean square errors. *p < .05. **p < .01.

77
Table 4.2
Means of Individual Difference Measures for Experiments 2-5
Graph Literacy SSPAN AOT NFC CRT
Experiment 2 11.73 (1.28) 28.56 (7.04) 176.23 (16.16) 60.59 (11.82) 1.45 (1.11) Experiment 3 11.52 (1.45) 30.48 (7.22) 177.14 (17.46) 62.82 (10.92) 1.30 (1.14) Experiment 4 11.77 (1.28) 29.52 (8.02) 180.93 (13.38) 65.42 (8.98) 1.52 (1.15) Experiment 5 11.21 (1.54) 28.45 (7.88) 179.54 (21.29) 63.90 (12.50) 1.23 (1.10) Note. Values enclosed in parentheses indicate standard deviations. For Experiment 2, N = 56 for all measures except for the Graph Literacy Scale (n = 55) and the SSPAN (n = 54). For Experiment 3, N = 56 for all measures except for the Graph Literacy Scale (n = 54). For Experiment 4, N = 31 for all measures except for the AOT (n = 30). For Experiment 5, N = 62 for all measures except for the AOT (n = 61).

78
Table 4.3 Correlations between Individual Difference Measures and Task Performance for Experiment 4
Graph Literacy SSPAN AOT NFC CRT
Overall Graph
Accuracy .332† .189 .266 -.152 .243
Label Graph
Accuracy .346† .278 .280 -.138 .282
Legend Graph
Accuracy .155 .000 .123 -.094 .081
Graph Literacy — .102 .079 .257 .510**
SSPAN — -.125 .137 .641**
AOT — -.058 .053
NFC — .466**
CRT —
Note. *p < .05. **p < .01. †marginally significant (p < .10). Individual difference measures include Graph Literacy Scale scores, Symmetry Span partial load scores (SSPAN), Actively Open-Minded Thinking Scale scores (AOT), Need for Cognition Scale scores (NFC), and Cognitive Reflection Test scores (CRT).

79
Table 4.4 Regression Analyses for Experiment 4 versus Experiment 5 with All Individual Difference Measures
Note. *p < .05. **p < .01. †marginally significant (p < .10). Factors included Working Memory (WM) span, Graph Literacy, Need for Cognition (NFC), and Actively Open-minded Thinking (AOT). The Cognitive Reflection Test (CRT) was excluded from the regression analyses due to its limited range and small variance.
Experiment 4 Experiment 5 B SE B β B SE B β
WM Span .002 .002 .195 .004 .002 .293* Graph Literacy .036 .019 .356† .015 .008 .226†
NFC -.003 .002 -.280 .002 .001 .268* AOT .002 .001 .246 .000 .001 -.019
R2 .15 .24 F 2.32† 5.60**
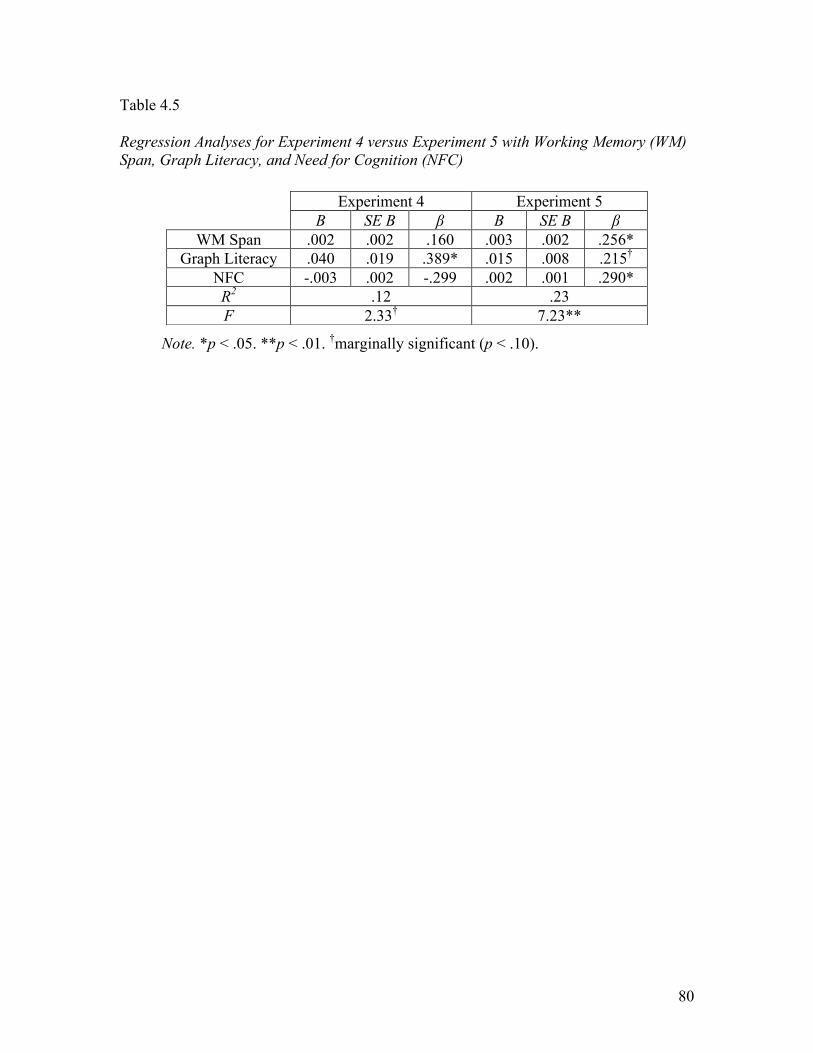
80
Table 4.5 Regression Analyses for Experiment 4 versus Experiment 5 with Working Memory (WM) Span, Graph Literacy, and Need for Cognition (NFC)
Note. *p < .05. **p < .01. †marginally significant (p < .10).
Experiment 4 Experiment 5 B SE B β B SE B β
WM Span .002 .002 .160 .003 .002 .256* Graph Literacy .040 .019 .389* .015 .008 .215†
NFC -.003 .002 -.299 .002 .001 .290* R2 .12 .23 F 2.33† 7.23**

81
Table 4.6 Correlations between Individual Difference Measures and Task Performance for Experiment 5
Graph Literacy SSPAN AOT NFC CRT
Overall Graph
Accuracy .302* .351** .114 .404** .310*
Label Graph
Accuracy .161 .338** .004 .314* .318*
Legend Graph
Accuracy .277* .250* .140 .337** .194
Graph Literacy — .092 .237† .218† .594**
SSPAN — .076 .261* .297*
AOT — .212 .303*
NFC — .165
CRT —
Note. *p < .05. **p < .01. †marginally significant (p < .10). Individual difference measures include Graph Literacy Scale scores, Symmetry Span partial load scores (SSPAN), Actively Open-Minded Thinking Scale scores (AOT), Need for Cognition Scale scores (NFC), and Cognitive Reflection Test scores (CRT).

82
CHAPTER 5:
CONCLUSION
Summary of Findings
The current research was comprised of three main goals: (1) to determine how well
people comprehend main effects and interactions in complex multivariate data presented
graphically, and whether graph format plays a role (i.e., whether legends function as a
desirable difficulty); (2) to determine whether students can be taught to better identify
and understand main effects and interactions inherent in graphs of complex data sets, and
what would comprise such an effective tutorial; and (3) to examine the role of individual
differences in complex graph comprehension, as well as in the training of these skills.
Given the widespread usage of graphs across many media and the apparent
assumption made by publishers of these media that people are capable readers of
graphical information, a critical first question is whether people use information
presented in graphs when reading textual information such as an article or textbook that
already contains a summary of the data, and, if they do use these graphs, whether the
graph is helpful. Results from Experiment 1 demonstrate that the format of textbook
readings (i.e., text only, text with irrelevant seductive picture, text with relevant graph)
does not affect immediate recognition accuracy for the presented study data, nor does it
affect the likelihood of an individual to correctly describe the study data as opposed to
describing something else from the textbook reading (e.g., study methods or general
conclusions drawn from the study). Most individuals seemed to understand the main
conclusions drawn based on the study findings even if they did not fully comprehend
what the findings of the study actually were. These results were still consistent with the
seductive details literature because although there was no clear detriment observed from
presenting an irrelevant picture with the textbook excerpt, there was also no advantage

83
from the inclusion of such a seductive detail. Future research would be necessary to
determine why the inclusion of relevant graphs are no better than reading the text alone
or reading the text with irrelevant pictures. Perhaps the relevant graph did not act as an
intended explanative summary because readers are bad at complex graph comprehension
and therefore the inclusion of the graph disrupted the processing of the data rather than
help readers understand the structure or relationships within the data described in the text.
This lack of differences between textbook reading formats could also be attributed to
the type of test. Perhaps these differences are not clearly observable with an immediate
test, but would be more apparent with a longer delay period between the reading of the
excerpt and the comprehension test items, which would be consistent with findings in the
learning and desirable difficulties literature. I would predict that the advantage of a
graph, if it serves as an explanatory summary, may be greater after a one-week delay
since conditions that affect learning, like the testing effect, have bigger impact at delay
than with immediate testing. In fact, with the testing effect, at immediate test
performance is better for the study condition, but with the delayed test performance is
better for those with repeated testing (Roediger & Karpicke, 2006).
In Experiment 2, students made very few errors in describing multivariate graphs,
but they also reported only a small fraction of the total possible relationships (main
effects and interactions) existing in the data given the graphs’ complexity. Although
students did report primarily main effects rather than interactions of any type, this mean
proportion was still less than 50% of the total main effects that students could have
reported from the presented graphs. Thus, even when students report main effects, they
do not report all of them, although they are equally likely to report main effects for each
of the three variables in a graph. This result contradicts the summarization by Shah and
Hoeffner (2002) that line graphs are best for emphasizing x-y relationships, but perhaps
this is because the tutorial included prior to the task and instructions for the task pointed
out the existence of relationships in graphically presented data for variables not on the x-
axis. Together, these results suggest that students may not understand all of the
relationships presented in multivariate graphs, even after some brief explanation of what
kinds of relationships are present in multivariate data and how to find them in graphs.

84
Alternatively, perhaps students choose not to report more complex relationships like
interactions either because they do not fully understand them or because they are unsure
of their ability to correctly articulate them.
Results from Experiment 4 demonstrated that although students who receive no
specialized training are capable of interpreting relatively difficult graphs with above
chance accuracy, their accuracy could still be much improved. Consistent with findings
in the graph design literature, results from Experiments 4 and 5 indicate that students are
faster to verify true-false statements in an immediate fact-retrieval task when graphs
contain labels than when they contain legends. Moreover, a comparison of Experiments
4 and 5 suggests that individuals who received no specialized instruction were more
accurate in responding to graphs with labels than graphs with legends, but this accuracy
difference is diminished with the use of the graph comprehension tutorial. Thus, the
graph tutorial is a potentially effective tool for teaching students how to deal with
difficulties in graph comprehension. Furthermore, the tutorial may serve to negate
possible advantages of labels over legends by better familiarizing students with varying
graph formats and providing them with opportunities to practice interpreting such graphs.
The Notion of Desirable Difficulties in Graph Comprehension
Perhaps surprisingly, collective findings from Experiments 2-5 indicate that, in
general, differences in graph format, at least for labels versus legends, do not critically
affect task performance for complex multivariate data, whether the proportion of main
effects and interactions described for a graph or the accuracy in responding to true-false
questions about main effects of a graph in either immediate or long-term memory. The
only exception was Experiment 4, wherein the graph tutorial was not completed prior to
completion of the graph comprehension task and both RT and accuracy results reflected
an advantage from labels. However, this task was an immediate fact retrieval task in
which labels are typically favored, and therefore results were consistent with
expectations. Thus, the idea of introducing legends into a graph as a potentially
beneficial added visual difficulty did not bear out in these studies. However, it is also
important to note that any potential differences in accuracy due to varying graph format
may have been unobserved in Experiments 2 and 3 because of the inclusion of the

85
tutorial, which possibly negated potential advantages of graph format by better
familiarizing students with these formats and providing them with opportunities to
practice interpreting such graphs.
In Experiment 3, no effect of graph format on accuracy was found in either the
immediate or LTM tasks. Yet, when individual differences such as WM capacity are
taken into consideration, there exists a trend in the data such that “desirable” difficulties
may not be beneficial for all individuals. Although perhaps not immediately apparent,
individuals need to have the WM capacity to deal with such difficulties, or else added
difficulty may actually be detrimental to task performance in the long-term. Results from
Experiment 3 suggest the potential that legends may actually harm some viewers (i.e.,
those with low WM span) some of the time (i.e., in the long-term). Additionally,
increased open-mindedness was associated more specifically with increased accuracy on
graphs containing legends in the immediate task. Thus, the potential benefits of desirable
difficulties (e.g., legends) may be highly dependent both on an individual’s ability to deal
with these demands and on an individual’s dispositions towards dealing with such
demands.
However, there were some limitations in the current research that should be
considered. First, “desirable difficulties” may only be desirable for certain kinds of tasks.
Immediate or short-term memory tasks, especially fact-retrieval tasks, were not expected
to show differences between graphs with added visual difficulties and those without.
After all, conditions that affect learning, like the testing effect, have bigger impact at
delay than with immediate testing. In fact, desirable difficulties such as retrieval practice
only demonstrate a benefit for performance with delayed testing, whereas at immediate
test performance is actually better for those conditions without added difficulty (e.g.,
Roediger & Karpicke, 2006). One potential reason why no differences between graph
formats was observed in the LTM task of Experiment 3 may be because the delay period
of 20 minutes between encoding and test was not long enough for the impact of added
visual difficulty to be noticeable. For instance, in the prior example (Roediger &
Karpicke, 2006), a longer delay period of one week elicited the beneficial testing effect.

86
Additionally, a task may lend itself better to a particular graph format depending on
its goals or demands. It is possible that the goals or demands inherent in an immediate
true-false verification task differ from the goals or demands inherent in an immediate or
even delayed memory task. Fact-retrieval tasks in which viewers are looking for a
particular piece of information or one specific relationship in the graph likely do not lend
themselves to the same level of processing and comprehension of the full data set that
would be expected to occur for a more open-ended task in which there is no single target
variable or relationship to identify. This could be an additional reason why no effect of
added difficulty was found in the LTM task of Experiment 3. Although viewers encoded
the graph prior to receiving a question about the graph, all questions were specific to
main effects in both immediate and LTM tasks and, consequently, viewers may not have
processed all possible relationships in the graph within the fixed study time.
Furthermore, retrieval based memory tasks such as those in the current study may be
inherently different than recognition-based memory tasks. For example, pilot data from
our lab showed that legends are more beneficial than labels for performance on a
recognition-based memory task in which participants decided whether the presented
graphs were the same or different than the ones they had viewed earlier. However, this is
a very different task compared to the ones used in the current research, and is arguably
much easier. Thus, desirable difficulties in graphs may be more beneficial in less
difficult tasks, wherein there are fewer pre-existing challenges in the graph beyond that of
the added difficulty, or in LTM tasks with much longer delays than in the current
research.
Another possible limitation in the current research is that label and legend graphs
may not have been different enough to elicit differential effects. Visual cues such as
dotted versus solid lines and circle versus square end-points were present in both label
and legend versions of the graphs, which may have led to double-encoding of variable
information from both the visual cues and labels or legends. This may have limited the
need to rely on either labels or legends, as it provided additional organizational or
chunking information. Thus, graphs with legends may not have been sufficiently more
challenging than graphs with labels in the current research. Additionally, the legend is
organized differently than the labeled lines in a graph, which could lead to differences in

87
the mapping process of individual lines to their referents. Future research could therefore
include non-redundant visual cues or manipulate the order in which variables are listed in
the legend compared to the order of labels on the graph.
Individual Differences as Key Players in Graph Comprehension
A much more crucial factor that has emerged from these studies is that of individual
differences. General knowledge about graphs and WM span are clearly influential for
task performance, as predicted by prior research relating to graph literacy and WM
capacity. For example, in Experiment 2 graph literacy and WM span were highly
predictive of the proportion of correct main effects and interactions students reported in
the open-ended graph description task. In Experiment 3, individuals more highly skilled
with graphs were more accurate in both immediate and LTM tasks, especially for graphs
containing legends. This is consistent with the prediction that those more familiar with
graphs would better know how to approach complex graphs or more easily learn from the
included graph comprehension instructions. In contrast, WM span was more relevant for
accuracy in the LTM task, especially for graphs containing legends. Two potential
explanations for this finding were postulated: (1) Higher span individuals are perhaps
better able to mentally transform the graphically presented data once it has been retrieved
from LTM, in order to re-identify important relationships in the graph; or (2) Higher WM
span individuals may be better able to encode the relationships between variables in the
first place, because they perhaps are better able to keep track of the many variables while
first interpreting the graph in the immediate task than low WM span individuals. Finally,
Experiments 4 and 5 demonstrated that familiarity with graphs is important for graph
comprehension, and WM capacity can impact the effectiveness of graph comprehension
instruction since low WM span individuals benefited less from the graph tutorial than
those with high WM span.
It has also been consistently shown across all five experiments that attitude or
disposition can have a very large impact on graph comprehension across varying tasks
and within both immediate and long-term memory. For example, Experiment 1
demonstrates that although format of the textbook reading may not influence immediate
comprehension for that reading, attitude towards effortful thinking certainly is influential

88
for comprehension of complex data in textbooks, such that individuals who enjoy more
difficult thinking were more accurate in their immediate recognition responses. In
Experiment 2, dispositional characteristics such as open-mindedness and NFC were both
highly predictive of the proportion of correct main effects and interactions students
reported in the open-ended graph description task. Experiment 3 demonstrated that open-
mindedness, NFC, and cognitive reflection can affect graph comprehension. Open-
mindedness was influential for overall accuracy in both the immediate and LTM tasks.
Individuals with lower NFC performed better in the immediate task than those with high
NFC, perhaps because less cognitive effort was involved in remembering within the
short-term, whereas high NFC individuals may have found the immediate true-false
verification task less challenging or engaging. Meanwhile, higher cognitive reflection
scores were associated with better overall accuracy in LTM, suggesting that perhaps
individuals who take the time or put in the required effort to reach a more deliberate,
correct answer better remember this information later. Moreover, as seen in Experiments
4 and 5, attitude towards difficult thinking is a critical predictor of whether graph
comprehension skills can be improved with instruction (i.e., some individuals may be
more amenable to instruction or training than others). Specifically, students who do not
enjoy effortful thinking are less likely to benefit from instruction, which suggests a need
for educators to foster enjoyment of cognitive work in order for training of graphical
skills to be effective.
Given that WM span has been consistently demonstrated as a limiting factor for
graph comprehension task performance, as well as for instruction of graph
comprehension skills, one important consideration for future research would be to further
explore interactions between WM span level and desirable difficulties. Perhaps low WM
capacity individuals could be trained to increase their WM span to help them avoid
detrimental effects of added visual difficulties. Future research should also further
examine interactions between WM span level and dispositions such as open-mindedness
and NFC. Educators should consider ways in which to develop and encourage
dispositions that are favorable for the improvement of much needed graph
comprehension skills and, more generally, attitudes that are advantageous for work
requiring cognitive effort. Such encouragement could be especially important for

89
students who are already disadvantaged by low graphical literacy or low WM capacity, as
positive dispositions may help close the gap between low and high skill students by
providing low skill students with a helpful approach towards dealing with challenge.
However, these suggestions raise the question of whether thinking dispositions such as
AOT, NFC, and cognitive reflection can be taught or improved. Although several studies
have shown improved thinking skills and processes potentially related to AOT with
training intended to reduce susceptibility to bias (Baron, Badgio, & Gaskins, 1986) or
increase evaluation of all relevant arguments (Perkins, Bushey, and Faraday, 1986), it
remains unclear whether these interventions have long-lasting positive effects.
Additional research on the teaching or training of thinking dispositions would provide
valuable insight for educators hoping to encourage advantageous attitudes towards
difficult thinking.
The current research focused on individual differences relating to graph skills and
WM capacity, as well as dispositional factors like open-mindedness and NFC. However,
future research could examine other individual differences that might play an influential
role in graph comprehension, such as math or graph anxiety, more generalized test
anxiety, and even susceptibility to stereotype threat. These particular factors would be
predicted to detrimentally affect performance on graph comprehension tasks, and further
understanding the nature of such disadvantages could help lead to successful
interventions for coping with or alleviating them.
Building an Effective Tool for Instruction
Although the current research has demonstrated increased accuracy in questions
relating to main effects with the use of a computerized graph tutorial, additional research
is necessary to further develop this tutorial and to determine what aspects of the tutorial
are most effective and what aspects should be changed or improved. A more
theoretically grounded tutorial based on errors and a process model of graph
interpretation would be an ideal to strive for with future research. One possibility would
be to include both bar graphs and line graphs in the tutorial, with the idea that exposure to
the same concepts in multiple graph formats would perhaps result in improved
comprehension of main effects and interactions. Another possibility is to include

90
demonstrations with only line graphs in the tutorial, for which transfer of the same
concepts to a bar graph could then be checked (or vice versa). The ideal instructional end
product would thus be tested on both comprehension and transfer.
A separate line of questioning could further investigate the concept of “static builds”
used in the tutorial. Progressive animated builds are when graphs are progressively built
up over time using some sort of animation, such as in power point or some other
presentation software. Static builds are similar to these, except that, rather than using
animation, graphs are gradually built by laying them out as separate frames on a
page. These are more likely encountered in paper resources such as textbooks and
handouts wherein it is not possible to include animations, and inclusions of static builds
is a relatively frequent occurrence in some psychology textbooks. This is also similar to
the concept of storytelling in the information visualization literature, whereby a story is
laid out in a series of steps and each step contains visualizations based on data (Kosara &
Mackinlay, 2013). In the graph tutorial of the current research, static builds are used to
explain how to determine whether there are main effects present in 2x2x2 line graphs,
although the effectiveness of static builds such as these have not yet been
established. Thus, future research should examine whether sequential processing based
static builds specifically are an effective method of improving graph comprehension, as
this would also help to further develop a useful and effective graph tutorial for
experimental and classroom applications.
Another possibility would be to consider switching from static builds to complete
animations. Computer animations have been demonstrated as helpful for developing
visualization skills, the ability to think about concepts or processes on a microscopic
scale, and to build mental representations or models of concepts in a variety of fields,
including chemistry (e.g., Dalton, 2003, as cited in Tasker & Dalton, 2006; Sanger,
Phelps, & Fienhold, 2000; Williamson & Abraham, 1995), physics (e.g., Adams et al.,
2008, parts I and II; Finkelstein et al., 2005; Kohnle, Douglass, Edwards, Gillies, Hooley,
& Sinclair, 2010), and biology (e.g., Rotbain, Marbach-Ad, & Stavy, 2008). The benefit
of computer animations has also been demonstrated in a wide range of age groups, from
middle school (e.g., Kombartzky, Ploetzner, Schlag, & Metz, 2010) to high school (e.g.,

91
Rotbain et al., 2008) to college students (e.g., Kohnle et al., 2010; Williamson &
Abraham, 1995). Some studies have even demonstrated that animations are more
beneficial than static diagrams or visualizations presented on the board or in
transparencies in class (e.g., Sanger et al., 2000) or better than a series of static pictures
taken from the same animation (Kombartzky & Ploetzner, 2007). Animation could be
useful in the context of simpler graphs, as it would allow for continuity of labels such that
viewers would not need to re-identify them (Becker, Cleveland, & Wilks, 1988; Huber,
1987; Mackinlay, Robertson, & Card, 1991; Stuetzle, 1987).
It is important to note, however, that there are also some studies that demonstrate no
benefit or even worse learning outcomes with the use of animations as compared to other
types of external representations (e.g., Betrancourt, Morrison, & Tversky, 2002;
Betrancourt & Tversky, 2000; Boucheix & Schneider, 2009; Mayer et al., 2005), though
this may be due to differences in students’ abilities to deal with the spatial and temporal
demands inherent in many animations (Carpenter & Just, 1992; Lowe, 2003; Ploetzner,
Bodemer, & Neudert, 2008). Therefore, it is unclear whether the benefits of animations
would expand to include concepts relating to graph comprehension, or if static builds as
defined in the current research would provide such a benefit in this context. It would be
interesting to examine other types of static builds (e.g., bar graphs) and perhaps even
move on to progressive animations to determine if progressive animations provide any
benefit beyond that of static builds.
Finally, with the goal of further developing the current graph tutorial for application
in experimental research and classroom education, additional research is needed to
examine what types of graphs (e.g., line graphs, bar graphs, or both) are best for teaching
main effects and interaction concepts. Line graphs seem to be best for emphasizing x-y
trends (Carswell, Emery, & Lonon, 1993; Carswell & Wickens, 1987; Shah et al., 1999;
Zacks & Tversky, 1999), so much so that viewers sometimes fail to completely interpret
the remaining data in a complex graph or to recognize the same data plotted differently
(Shah & Carpenter, 1995). Including only line graphs in a tutorial for graph
comprehension may therefore be problematic for transfer of skills to other graph types.
In contrast, bar graphs better emphasize discrete comparisons (Carswell & Wickens,

92
1987; Shah et al., 1999; Zacks & Tversky 1999) and are less biasing than line graphs with
regards to what relationships in the data viewers will describe (Shah & Shellhammer,
1999).
Furthermore, future research should examine within-subject improvement with the
use of a graph comprehension tutorial, as the current research compared student
performance between groups. Improvement demonstrated in a pre- to post-tutorial graph
comprehension measure would better demonstrate the tutorial as an effective instructional
tool. Another interesting consideration would be whether the use of an effective tutorial
can help alleviate the potentially detrimental effect of dispositional factors like math and
graph anxiety or stereotype threat on performance on graph comprehension tasks. If so,
such a tutorial would be a wonderful behavioral intervention that could potentially assist
students in improving their academic performance for those subjects that rely heavily on
graphical representations of data.

93
Appendix A
Graph Literacy Scale
Here is some information about cancer therapies.
Q1. What percentage of patients recovered after chemotherapy?
%
Q2. What is the difference between the percentage of patients who recovered after a
surgery and the percentage of patients who recovered after radiation therapy?
%
94
Here is some information about different forms of cancer.
Q3. Of all the people who die from cancer, approximately what percentage dies from
lung cancer? %
Q4. Approximately what percentage of people who die from cancer die from colon
cancer, breast cancer, and prostate cancer taken together?
%

95
Here is some information about an imaginary disease called Adeolitis. Percentage of people with Adeolitis
Q5. Approximately what percentage of people had Adeolitis in the year 2000?
% Q6. When was the increase in the percentage of people with Adeolitis higher?
From 1975 to 1980………………………………………..1 From 2000 to 2005………………………………………..2 Increase was the same in both intervals…….......................3 Don’t know………………………………………………..4
Q7. According to your best guess, what will the percentage of people with Adeolitis be in
the year 2010? %

96
The following figure shows the number of men and women among patients with disease X. The total number of circles is 100.
Q8. Of 100 patients with disease X, how many are women? Q9. How many more men than women are there among 100 patients with disease X?
men
Q10. In a magazine you see two advertisements, one on page 5 and another on page 12. Each is for a different drug for treating heart disease, and each includes a graph showing the effectiveness of the drug compared to a placebo (sugar pill).
Compared to the placebo, which treatment leads to a larger decrease in the percentage of patients who die?
Crosicol………………………..1 Hertinol………………………..2 They are equal…………………3 Can’t say………………………4

97
Q11. In the newspaper you see two advertisements, one on page 15 and another on page 17. Each is for a different treatment of psoriasis, and each includes a graph showing the effectiveness of the treatment over time.
Which of the treatments contributes to a larger decrease in the percentage of sick patients?
Apsoriatin………………….1 Nopsorian………………….2 They are equal……………..3 Can’t say…………………...4
98
Q12. Here is some information about the imaginary diseases Coliosis and Tiosis.
Between 1980 and 1990, which disease had a higher increase in the percentage of people affected?
Coliosis……………………………1 Tiosis……………………………...2 The increase was equal……………3 Can’t say…………………………..4
Q13. Here is some information about cancer therapies.
What is the percentage of cancer patients who die after chemotherapy?
%

99
Appendix B
Actively Open-Minded Thinking Scale
For each of the statements below, mark the alternative that best describes your opinion. There are no right or wrong answers so do not spend too much time deciding on an answer. The first thing that comes to mind is probably the best response.
1. A person should always consider new possibilities.
2. A group which tolerates too much difference of opinion among its members cannot exist for long.
3. Abandoning a previous belief is a sign of strong character.
4. Basically, I know everything I need to know about the important things in life.
5. Beliefs should always be revised in response to new information or evidence.

100
6. Certain beliefs are just too important to abandon no matter how good a case can be made against them.
7. Changing your mind is a sign of weakness.
8. Coming to decisions quickly is a sign of wisdom.
9. Considering too many different opinions often leads to bad decisions.
10. Difficulties can usually be overcome by thinking about the problem, rather than through waiting for good fortune.
11. Even though freedom of speech for all groups is a worthwhile goal, it is unfortunately necessary to restrict the freedom of certain political groups.
12. Even if my environment (family, neighborhood, schools) had been different, I probably would have the same religious views.

101
13. I believe we should look to our religious authorities for decisions on moral issues.
14. I tend to classify people as either for me or against me.
15. I believe letting students hear controversial speakers can only confuse and mislead them.
16. I believe that loyalty to one's ideals and principles is more important than "open-mindedness."
17. I believe that laws and social policies should change to reflect the needs of a changing world.
18. I believe that the "new morality" of permissiveness is no morality at all.
19. I believe that the different ideas of right and wrong that people in other societies have may be valid for them.

102
20. I consider myself broad-minded and tolerant of other people's lifestyles.
21. I think that if people don't know what they believe in by the time they're 25, there's something wrong with them.
22. I think there are many wrong ways, but only one right way, to almost anything.
23. If I think longer about a problem I will be more likely to solve it.
24. Intuition is the best guide in making decisions.
25. It is a noble thing when someone holds the same beliefs as their parents.
26. It is important to persevere in your beliefs even when evidence is brought to bear against them.

103
27. It makes me happy and proud when someone famous holds the same beliefs that I do.
28. Most people just don't know what's good for them.
29. My beliefs would not have been very different if I had been raised by a different set of parents.
30. My blood boils over whenever a person stubbornly refuses to admit he's wrong.
31. No one can talk me out of something I know is right.
32. Of all the different philosophies which exist in the world there is probably only one which is correct.
33. Often, when people criticize me, they don't have their facts straight.

104
34. One should disregard evidence that conflicts with your established beliefs.
35. People should always take into consideration evidence that goes against their beliefs.
36. Someone who attacks my beliefs is not insulting me personally.
37. There are basically two kinds of people in this world, good and bad.
38. There are two kinds of people in this world: those who are for the truth and those who are against the truth.
39. There are a number of people I have come to hate because of the things they stand for.
40. There is nothing wrong with being undecided about many issues.

105
41. What beliefs you hold have more to do with your own personal character than the experiences that may have given.

106
Appendix C
Need for Cognition Scale
For each of the statements below, please indicate to what extent the statement is characteristic of you. If the statement is extremely uncharacteristic of you (not at all like you) please mark a “1”; if the statement is extremely characteristic of you (very much like you) please mark a “5”. There are no right or wrong answers so do not spend too much time deciding on an answer. The first thing that comes to mind is probably the best response. There is no time limit, but work as quickly as possible.
1. I would prefer complex to simple problems.
2. I like to have the responsibility of handling a situation that requires a lot of thinking.
3. Thinking is not my idea of fun.
4. I would rather do something that requires little thought than something that is sure to challenge my thinking abilities.

107
5. I try to anticipate and avoid situations where there is likely a chance I will have to think in depth about something.
6. I find satisfaction in deliberating hard and for long hours.
7. I only think as hard as I have to.
8. I prefer to think about small, daily projects to long-term ones.
9. I like tasks that require little thought once I’ve learned them.
10. The idea of relying on thought to make my way to the top appeals to me.

108
11. I really enjoy a task that involves coming up with new solutions to problems.
12. Learning new ways to think doesn’t excite me very much.
13. I prefer my life to be filled with puzzles that I must solve.
14. The notion of thinking abstractly is appealing to me.
15. I would prefer a task that is intellectual, difficult and important to one that is somewhat important but does not require much thought.
16. I feel relief rather than satisfaction after completing a task that required a lot of mental effort.

109
17. It’s enough for me that something gets the job done; I don’t care how or why it works.
18. I usually end up deliberating about issues even when they do not affect me personally.

110
Appendix D
Cognitive Reflection Test Below are three items that vary in difficulty. Answer as many as you can.
(1) A bat and a ball cost $1.10 in total. The bat costs $1.00 more than the ball. How much does the ball cost? _____ cents
(2) If it takes 5 machines 5 minutes to make 5 widgets, how long would it take 100 machines to make 100 widgets? _____ minutes
(3) In a lake, there is a patch of lily pads. Every day, the patch doubles in size. If it takes 48 days for the patch to cover the entire lake, how long would it take for the patch to cover half of the lake? _____ days

111
Appendix E
Experiment 1 Modified Textbook Excerpt (Goldstein, 2008) Introductory page for all conditions:

112
Text Only Condition:
Text with Irrelevant Picture Condition:

113
Text with Relevant Graph Condition:

114
Appendix F
Experiment 1 Free Response Question Coding Scheme 0 = No response 1 = Response completely unrelated to textbook excerpt or Greeble study data or findings 2 = More general conclusion of textbook excerpt (not specific to actual Greeble study data or findings) 3 = Correct description of Greeble study data or findings (e.g., overall, FFA response to faces was more than FFA response to Greebles; FFA response to faces was constant, while FFA response to Greebles increased from pre- to post-training) 4 = Incorrect description of Greeble study data or findings 5 = Describes study method, but not actual data or findings or more general conclusions based on findings

115
Appendix G
Demographic Questionnaire Participant information is collected primarily for the purpose of reporting demographic data to funding institutions. Your name and email will not be reported. 1. Gender _____ F _____ M 2. Education (highest level attained or most recent year of school completed) ____________________________________ 3. Current Major ________________________ Minor ________________
4. Birthdate ____/_____/_______ 5. Age _______________
6. Are you right or left handed? 7. Ethnicity (Please select only one) __ Right ___ Hispanic __ Left ___Not Hispanic 8. Race (Please select only one) __ American Indian/Alaska Native __ Asian __ Native Hawaiian or Other Pacific Islander __ Black or African American __ White/Caucasian __ More than one __ Other/Unknown
9. Do you consider yourself familiar with (mark all that apply): __ Line Graphs __ Wireframe (3d) graphs __ Bar Graphs __ Pie Charts __ Contour plots 10. Do you use graphs frequently in your occupation/courses? _____________ 11. Do you prefer graphs or tables if you need to look at some numerical data?________

116
12. How many statistics classes have you taken in college?____________ Please list titles
________________________________________________________ ________________________________________________________ ________________________________________________________ 13. How many math classes have you taken in college?_____________ Please list titles ________________________________________________________ ________________________________________________________ ________________________________________________________ 14. What was your Math Section SAT Score (out of 800)/ACT Math Score?__________ 15. Do you think of yourself as a math person? Do you think of yourself as a scientific person? How confident are you with your scientific reasoning skills? 16. Are you comfortable with looking at numbers and statistics? 17. Do you feel comfortable with looking at graphs and understanding graphs?

117
Appendix H
Exit Survey Thank you for your participation!! As part of our research, we are interested in your input and impressions of the experiment you have just completed. Please answer the following questions to the best of your ability: 1. Did you employ any strategies or “tricks” to help you in the experiment?
2. Did you think that certain graphs were more difficult than others? If so, what made them more or less difficult?
3. Did you have a preference for certain graphs over other graphs? If so, what did you prefer and why?
4. Which of the following type of graph did you prefer (circle one)? Graphs with Labels OR Graphs with Legends
5. What do you think the point of the experiment was? What kind of thinking or memory was it testing?

118
Appendix I
Experiment 2 Sample Open-ended Graph Description Task Coding Scheme
Graph 1: ____________________ Correct
1. Description of Study (not data) Yes No 2. Main Effect of __________________________________ Yes No 3. Main Effect of __________________________________ Yes No 4. Main Effect of __________________________________ Yes No 5. 2-way Interaction of ______________________________________ Yes No 6. 2-way Interaction of ______________________________________ Yes No 7. 2-way Interaction of ______________________________________ Yes No 8. Partial 2-way Interaction Yes No How many?_________ 9. Partial 3-way Interaction Yes No
Incorrect 1. Description of Study (not data) Yes No 2. Main Effect of __________________________________ Yes No 3. Main Effect of __________________________________ Yes No 4. Main Effect of __________________________________ Yes No 5. 2-way Interaction of _______________________________________ Yes No 6. 2-way Interaction of _______________________________________ Yes No 7. 2-way Interaction of _______________________________________ Yes No 8. Partial 2-way Interaction Yes No How many?_________ 9. Partial 3-way Interaction Yes No

119
Appendix J
Sample True-False Statements for Experiments 3-5
1. On average, the mice that were in a simple learning environment took more time to reach the platform than those that were in a complex learning environment. (FALSE)
2. On average, the mice that did not receive a transplant took less time to reach the platform than the mice that did receive a transplant. (FALSE)
3. On average, students who had low levels of achievement performed better on the task than those students who had high levels of achievement. (TRUE)
4. On average, students who were motivated intrinsically scored lower than those
students who were motivated extrinsically. (TRUE)
5. On average, people who do not drink alcohol rate both themselves and others as being riskier than those people who do drink alcohol. (FALSE)
6. On average, people rate themselves as being greater risk takers than their peers.
(TRUE)
7. On average, children engaged in play activities rated their partner as more creative than those children who were engaged in academic activities. (FALSE)
8. On average, children who were correctly informed about their partner’s level of
art instruction rated their partner as having a higher creativity rating than those who were misinformed. (TRUE)
9. On average, women had fewer domestic violence arrests than men. (TRUE)
10. On average, people who did not receive counseling had more domestic violence
arrests than people who did receive counseling. (FALSE)
120
References
Adams, W. K., Reid, S., LeMaster, R., McKagan, S. B., Perkins, K. K., Dubson, M., & Wieman, C. E. (2008). A study of educational simulations part I: Engagement and learning. Journal of Interactive Learning Research, 19(3), 397-419.
Adams, W. K., Reid, S., LeMaster, R., McKagan, S. B., Perkins, K. K., Dubson, M., & Wieman, C. E. (2008). A study of educational simulations part II: Interface design. Journal of Interactive Learning Research, 19(4), 551-577.
Ainsworth, S. (2006). DeFT: a conceptual framework for considering learning with multiple representations. Learning and Instruction, 16, 183-198.
Arteaga, P., & Batanero, C. (2011). Relating graph semiotic complexity to graph comprehension in statistical graphs produced by prospective teachers. In Proceedings of the Seventh Congress of the European Society for Research in Mathematics Education (in press).
Baron, J. (1985). Rationality and intelligence. New York: Cambridge University Press.
Baron, J. (1993). Why teach thinking? An essay. Applied Psychology: An International Review, 42, 191-214.
Baron, J. (2008). Thinking and deciding. New York: Cambridge University Press. (4th edition).
Baron, J., Badgio, P. C., & Gaskins, I. W. (1986). Cognitive style and its improvement: A normative approach. In R. J. Sternberg (Ed.), Advances in the Psychology of Human Intelligence (pp. 173-220). London: Lawrence Erlbaum Associates.
Batanero, C., Arteaga, P., & Ruiz, B. (2010). Statistical graphs produced by prospective teachers in comparing two distributions. In V. Durand-Guerrier, S. Soury-Lavergne, & F. Arzarello (Eds.), Proceedings of the Sixth Congress of the European Society for Research in Mathematics Education. Lyon: ERME.
Bateman, S., Mandryk, R. L., Gutwin, C., Genest, A., McDine, D., & Brooks, C. (2010). Useful junk? The effects of visual embellishment on comprehension and memorability of charts.
Becker, R. A., Cleveland, W. S., & Wilks, A. R. (1988). Dynamic graphics for data analysis. In W. S. Cleveland & M. E. McGill (Eds.), Dynamic graphics for statistics (pp. 1-50). Belmont, CA: Wadsworth.
Bell, A., & Janvier, C. (1981). The interpretation of graphs representing situations. For the Learning of Mathematics, 2(1), 34-42.
Bertin, J. (1983). Semiology of graphics (W. Berg, Trans.). Madison, WI: University of Wisconsin Press.

121
Bertrams, A., & Dickhauser, O. (2009). High-school students’ need for cognition, self-control capacity, and school achievement: Testing a mediation hypothesis. Learning and Individual Differences, 19, 135-138.
Bétrancourt, M., Morrison, J., & Tversky, B. (2002). Animation: Can it facilitate? International Journal of Human-Computer Studies, 57, 247-262.
Bétrancourt, M., & Tversky, B. (2000). Effect of computer animation on users’ performance: A review. Le Travail Humain, 63(4), 311-329.
Bjork, R. A. (1994). Memory and metamemory considerations in the training of human beings. In J. Metcalfe and A. Shimamura (Eds.), Metacognition: Knowing about knowing (pp. 185–205). Cambridge, MA: MIT Press.
Bjork, E. L., & Bjork, R. A. (2011). Making things hard on yourself, but in a good way: Creating desirable difficulties to enhance learning. In M. A. Gernsbacher, R. W. Pew, L. M. Hough, & J. R. Pomerantz (Eds.), Psychology and the real world: Essays illustrating fundamental contributions to society (pp. 56-64). New York: Worth Publishers.
Blais, A. R., Thompson, M. M., & Baranski, J. V. (2005). Individual differences in decision processing and confidence judgments in comparative judgment tasks: The role of cognitive styles. Personality and Individual Differences, 38, 1701-1713.
Boucheix, J.-M., & Schneider, E. (2009). Static and animated presentations in learning dynamic mechanical systems. Learning and Instruction, 19, 112-127.
Broadway, J. M., & Engle, R. W. (2010). Validating running memory span: Measurement of working memory capacity and links with fluid intelligence. Behavior Research Methods, 42, 563-570.
Bruno, A., & Espinel, M. C. (2009). Construction and evaluation of histograms in teacher training. International Journal of Mathematical Education in Science and Technology, 40(4), 473-493.
Buhrmester, M., Kwang, T., & Gosling, S. D. (2011). Amazon’s Mechanical Turk: A new source of inexpensive, yet high-quality, data? Perspectives on Psychological Science, 6(1), 3-5.
Cacioppo, J. T., & Petty, R. E. (1982). The need for cognition. Journal of Personality and Social Psychology, 42(1), 116-131.
Cacioppo, J. T., Petty, R. E., Feinstein, J. A., & Jarvis, W. B. G. (1996). Dispositional differences in cognitive motivation: The life and times of individuals varying in need for cognition. Psychological Bulletin, 119, 197–253.
Cacioppo, J. T., Petty, R. E., & Kao, C. F. (1984). The efficient assessment of need for cognition. Journal of Personality Assessment, 48, 306-307.

122
Canham, M. & Hegarty, M. (2010). Effects of knowledge and display design on comprehension of complex graphics. Learning and Instruction, 20, 155-166.
Carpenter, P. A., & Just, M. A. (1992). Understanding mechanical systems through computer animation and kinematic imagery (Report No. ONR 92-1). Arlington, VA: Office of Naval Research.
Carpenter, P. A., & Shah, P. (1998). A model of the perceptual and conceptual processes in graph comprehension. Journal of Experimental Psychology: Applied, 4(2), 75-100.
Carswell, C. M., Emery, C., & Lonon, A. M. (1993). Stimulus complexity and information integration in the spontaneous interpretation of line graphs. Applied Cognitive Psychology, 7(4), 341-357.
Carswell, C. M., & Wickens, C. D. (1987). Information integration and the object display: An interaction of task demands and display superiority. Ergonomics, 30(3), 511-527.
Cheng, P. C.-H. (1999). Interactive law encoding diagrams for learning and instruction. Learning and Instruction, 9, 309-309.
Cleveland, W. S., & McGill, R. (1984). Graphical perception: Theory, experimentation, and application to the development of graphical methods. Journal of the American Statistical Association, 79(387), 531-554.
Cleveland, W. S., & McGill, R. (1985). Graphical perception and graphical methods for analyzing scientific data. Science, 229(4716), 828-833.
Cohen, A. R. (1957). Need for cognition and order of communication as determinants of opinion change. In C. I. Hovland (Ed.), The Order of Presentation in Persuasion (pp.79-97). New Haven: Yale University Press.
Culbertson, H. M., & Powers, R. D. (1959). A study of graph comprehension difficulties. Audio Visual Communication Review, 7, 97-100.
Curcio, F. R. (1989). Developing graph comprehension. Reston, VA: National Council of Teachers of Mathematics.
Dai, D. Y., & Wang, X. (2006). The role of need for cognition and reader beliefs in text comprehension and interest development. Contemporary Educational Psychology, 32, 332-347.
Dalton, R. M. (2003). The development of students’ mental models of chemical substances and processes at the molecular level, PhD Thesis, University of Western Sydney.
Finkelstein, N. D., Adams, W. K., Keller, C. J., Kohl, P. B., Perkins, K. K., Podolefsky, N. S., Reid, S., & LeMaster, R. (2005). When learning about the real world is better

123
done virtually: a study of substituting computer simulations for laboratory equipment. Physical Review Special Topics Physics Education Research, 1.
Franconeri, S., Uttal, D., & Shah, P. (2011). Teaching perceptual and conceptual processes in graph interpretation. Grant funded by the United States Institute for Educational Sciences.
Frederick, S. (2005). Cognitive reflection and decision making. Journal of Economic Perspectives, 19(4), 25-42.
Freedman, E. G., & Shah, P. (2002). Toward a model of knowledge-based graph comprehension. In M. Hegarty, B. Meyer, & N. H. Narayanan (Eds.), Diagrammatic representation and inference (pp. 8-31). Berlin: Springer.
Friel, S. N., Curcio, F. R., & Bright, G. W. (2001). Making sense of graphs: Critical factors influencing comprehension and instructional implications. Journal for Research in Mathematics Education, 32(2), 124-158.
Friel, S. N., & Joyner, J. M. (Eds.). (1997). Teach-stat for teachers: Professional development manual. Palo Alto, CA: Dale Seymour.
Fry, E. (1981). Graphical literacy. Journal of Reading, 24(5), 383-389.
Galesic, M., & Garcia-Retamero, R. (2011). Graph literacy: A cross-cultural comparison. Medical Decision Making, 31, 444-457.
Garner, R., Alexander, P., Gillingham, M., Kulikowich, J., & Brown, R. (1991). Interest and learning from text. American Educational Research Journal, 28, 643-659.
Garner, R., Brown, R., Sanders, S., & Menke, D. (1992). "Seductive details" and learning from text. In K. A. Renninger, S. Hidi, & A. Krapp (Eds.), The role of interest in learning and development (pp. 239-254). Hillsdale, NJ: Erlbaum.
Garner, R., Gillingham, M., & White, C. (1989). Effects of "seductive details" on macroprocessing and microprocessing in adults and children. Cognition and Instruction, 6, 41-57.
Gattis, M., & Holyoak, K. (1996). Mapping conceptual to spatial relations in visual reasoning. Journal of Experimental Psychology: Learning, Memory, and Cognition, 22, 1-9.
Gauthier, I., Tarr, M. J., Anderson, A. W., Skudlarski, P., & Gore, J. C. (1999). Activation of the middle fusiform “face area” increases with expertise in recognizing novel objects. Nature Neuroscience, 2, 568-573.
Geertzen, J. (2012). Inter-rater agreement with multiple raters and variables. Available from https://mlnl.net/jg/software/ira/
Gillan, D. J., Wickens C. D., Hollands, J. G., & Carswell, C. M. (1998). Guidelines for presenting quantitative data in HFES publications. Human Factors, 40(1), 28-41.

124
Goldstein, E. B. (2008). Cognitive psychology: Connecting mind, research, and everyday experience (2nd ed.). Belmont, CA: Cengage Learning.
Gonzalez, T., Espinel, C., & Ainley, J. (2011). Teachers’ graphical competence. In C. Batanero, G. Burrill & C. Reading (Eds.), Teaching statistics in school mathematics-Challenges for teaching and teacher education: A joint ICMI/IASE study. New York: Springer.
Guthrie, J. T., Weber, S., & Kimmerly, N. (1993). Searching documents: Cognitive processes and deficits in understanding graphs, tables, and illustrations. Contemporary Educational Psychology, 18, 186-221.
Halford, G. S., Baker, R., McCredden, J. E., & Bain, J. D. (2005). How many variables can humans process? Psychological Science, 16(1), 70-76.
Haran, U., Ritov, I., & Mellers, B. A. (2013). The role of actively open-minded thinking in information acquisition, accuracy, and calibration. Judgment and Decision Making, 8(3), 188-201.
Harp, S. F., & Mayer, R. E. (1997). The role of interest in learning from scientific text and illustrations: On the distinction between emotional and cognitive interest. Journal of Educational Psychology, 89, 92-102.
Hidi, S., & Anderson, V. (1992). Situational interest and its impact on reading expository writing. In K. A. Renninger, S. Hidi, & A. Krapp (Eds.), The role of interest in learning and development (pp. 215-238). Hillsdale, NJ: Erlbaum.
Hidi, S., & Baird, W. (1986). Interestingness: A neglected variable in discourse processing. Cognitive Science, 10, 179-194.
Hidi, S., & Baird, W. (1988). Strategies for increasing text-based interest and students' recall of expository text. Reading Re- search Quarterly, 23, 465-483.
Hirshman, E., & Bjork, R. A. (1988). The generation effect: Support for a two-factor theory. Journal of Experimental Psychology: Learning, Memory, and Cognition, 14(3), 484-494.
Huber, P. J. (1987). Experiences with three-dimensional scatterplots. Journal of the American Statistical Association, 82, 448-453.
Jacoby, L. (1978). On interpreting the effects of repetition: Solving a problem versus remembering a solution. Journal of Verbal Learning and Verbal Behavior, 17, 649-667.
Kardash, C. M., & Scholes, R. J. (1996). Effects of preexisting beliefs, epistemological beliefs, and need for cognition on interpretation of controversial issues. Journal of Educational Psychology, 88, 260-271.
Kerr, R., & Booth, B. (1978). Specific and varied practice of a motor skill. Perceptual and Motor Skills, 46, 395–401.
125
Kohnle, A., Douglass, M., Edwards, T. J., Gillies, A. D., Hooley, C. A., & Sinclair, B. D. (2010). Developing and evaluating animations for teaching quantum mechanics concepts. European Journal of Physics, 31, 1441-1455.
Kombartzky, U., & Ploetzner, R. (2007). Beneficial effects of learning from animations. In W. Chen, & H. Ogata (Eds.), Learning by effective utilization of technologies: Facilitating intercultural understanding. Supplementary Proceedings of the 15th International Conference of Computers in Education (pp. 3-4). Amsterdam: IOS Press.
Kombartzky, U., Ploetzner, R., Schlag, S., & Metz, B. (2010). Developing and evaluating a strategy for learning from animations. Learning and Instruction, 20, 424-433.
Kornell, N. (2009). Optimizing learning using flashcards: Spacing is more effective than cramming. Applied Cognitive Psychology, 23, 1297–1317.
Kornell, N., & Bjork, R. A. (2008). Learning concepts and categories: Is spacing the “enemy of induction”? Psychological Science, 19, 585–592.
Körner, C. (2005). Concepts and misconceptions in comprehension of hierarchical graphs. Learning and Instruction, 15(4), 281-296.
Kosara, R., & Mackinlay, J. (2013). Storytelling: The next step for visualization. Computer, 46(5), 44-50.
Kosslyn, S. M. (1989). Understanding charts and graphs. Applied Cognitive Psychology, 3, 185–225.
Kosslyn, S. M. (1994). Elements of graph design. New York: Freeman.
Larkin, J. H., & Simon, H. A. (1987). Why a diagram is (sometimes) worth ten thousand words. Cognitive Science, 11(1), 65-100.
Legge, G. E., Gu, Y., & Luebker, A. (1989). Efficiency of graphical perception. Perception and Psychophysics, 46(4), 365-374.
Leinhardt, G., Zaslavsky, O., & Stein, M. K. (1990). Functions, graphs, and graphing: Tasks, learning, and teaching. Review of Educational Research, 60(1), 1-64.
Linn, M. C., Chang, H.-Y., Chiu, J., Zhang, H., & McElhaney, K. (2010). Can desirable difficulties overcome deceptive clarity in scientific visualizations? In A. Benjamin (Ed.), Successful remembering and successful forgetting: A Festschrift in honor of Robert A. Bjork (pp. 239–262). New York: Routledge.
Lohse, G. L. (1993). A cognitive model for understanding graphical perception. Human-Computer Interaction, 8, 313–334.
Lowe, R. K. (1993). Constructing a mental representation from an abstract technical diagram. Learning and Instruction, 3, 157-179.

126
Lowe, R. K. (2003). Animation and learning: selective processing of information in dynamic graphics. Learning and Instruction, 13, 157-176.
MacDonald-Ross, M. (1977). Graphics in texts. Review of Research in Education, 5, 49-85.
Mackinlay, J. D., Robertson, G. G., & Card, S. K. (1991). The perspective wall: Detail and context smoothly integrated. Proceedings of the Association of Computing Machinery CHI'91 Conference on Human Factors in Computing Systems (pp. 173-179). New York: ACM.
Macpherson, R., & Stanovich, K. E. (2007). Cognitive ability, thinking dispositions, and instructional set as predictors of critical thinking. Learning and Individual Differences, 17, 115-127.
Maichle, U. (1994). Cognitive processes in understanding line graphs. In W. Schnotz & R. W. Kulhavy (Eds.), Comprehension of graphics. Amsterdam: Elsevier.
Mayer, R. E. (1989). Systematic thinking fostered by illustrations in scientific text. Journal of Educational Psychology, 81, 240-246.
Mayer, R. E., Bove, W., Bryman, A., Mars, R., & Tapangco, L. (1996). When less is more: Meaningful learning from visual and verbal summaries of textbook lessons. Journal of Educational Psychology, 88, 64-73.
Mayer, R. E., Hegarty, M., Mayer, M., & Campbell, J. (2005). When static media promote active learning: Annotated illustrations versus narrated animations in multimedia instruction. Journal of Experimental Psychology: Applied, 11(4), 256-265.
Mayer, R. E., Steinhoff, K., Bower, G., & Mars, R. (1995). A generative theory of textbook design: Using illustrations to foster meaningful learning of science text. Educational Technology Research and Development, 43, 31-43.
Milroy, R., & Poulton, E. C. (1978). Labeling graphs for improved reading speed. Ergonomics, 21(1), 55-61.
Mohr, P., Glover, J., & Ronning, R. R. (1984). The effect of related and unrelated details on the recall of major ideas in prose. Journal of Reading Behavior, 16, 97-109.
Monteiro, C., & Ainley, J. (2007). Investigating the interpretation of media graphs among student teachers. International Electronic Journal of Mathematics Education, 2(3), 188-207.
Oechssler, J., Roider, A., & Schmitz, P. W. (2009). Cognitive abilities and behavioural biases. Journal of Economic Behavior & Organization, 72, 147-152.
Oldfield, R. C. (1971). The assessment and analysis of handedness: The Edinburgh inventory. Neuropsychologia, 9, 97-113.

127
Perkins, D., Bushey, B., & Faraday, M. (1986). Learning to reason. Final report, Grant No. NIE-G-83-0028, Project No030717. Harvard Graduate School of Education.
Pinker, S. (1990). A theory of graph comprehension. In R. Freedle (Ed.), Artificial intelligence and the future of testing (pp.73–126). Hillsdale, NJ: Erlbaum.
Ploetzner, R., Bodemer, D., & Neudert, S. (2008). Successful and less successful use of dynamic visualisations in instructional texts. In R. K. Lowe, & W. Schnotz (Eds.), Learning with animation: Research implications for design (pp. 71-91). New York: Cambridge University Press.
Ratwani, R. M., & Trafton, J. G. (2008). Shedding light on the graph schema: Perceptual features versus invariant structure. Psychonomic Bulletin & Review, 15, 757–762.
Ratwani, R. M., Trafton, J. G., & Boehm-Davis, D. A. (2008). Thinking graphically: Connecting vision and cognition during graph comprehension. Journal of Experimental Psychology: Applied, 14(1), 36-49.
Rawson, K. A., & Dunlosky, J. (2011). Optimizing schedules of retrieval practice for durable and efficient learning: How much is enough? Journal of Experimental Psychology: General, 140(3), 283–302.
Redick, T. S., Broadway, J. M., Meier, M. E., Kuriakose, P. S., Unsworth, N., Kane, M. J., & Engle, R. W. (2012). Measuring working memory capacity with automated complex span tasks. European Journal of Psychological Assessment, 28(3), 164-171.
Roediger, H.L., & Karpicke, J.D. (2006). Test-enhanced learning: Taking memory tests improves long-term retention. Psychological Science, 17, 249–255.
Rohrer, D., & Taylor, K. (2007). The shuffling of mathematics practice problems improves learning. Instructional Science, 35, 481–498.
Romberg, T. A., Fennema, E., & Carpenter, T. P. (Eds.). (1993). Integrating research on the graphical representation of functions. Hillsdale, NJ: Erlbaum.
Rotbain, Y., Marbach-Ad, G., & Stavy, R. (2008). Using a computer animation to teach high school molecular biology. Journal of Science Education and Technology, 17(1), 49-58.
Sa, W. C., West, R. F., & Stanovich, K. E. (1999). The domain specificity and generality of belief bias: Searching for a generalizable critical thinking skill. Journal of Educational Psychology, 91, 497-510.
Sanchez, C. A., & Wiley, J. (2006). An examination of the seductive details effect in terms of working memory capacity. Memory and Cognition, 34, 344-355.
Shah, P. (1995). Cognitive processes in graph comprehension. Unpublished doctoral dissertation. Carnegie Mellon University, Pittsburgh, PA.

128
Shah, P., & Carpenter, P. A. (1995). Conceptual limitations in comprehending line graphs. Journal of Experimental Psychology: General, 124, 43-62.
Shah, P., & Freedman, E. G. (2011). Bar and line graph comprehension: An interaction of top-down and bottom-up processes. Topics in Cognitive Science, 3, 560-578.
Shah, P., Freedman, E. G., & Vekiri, I. (2005). The comprehension of quantitative information in graphical displays. In P. Shah, & A. Miyake (Eds.), The Cambridge handbook of visual spatial thinking (pp. 426-476). New York: Cambridge University Press.
Shah, P., & Hoeffner, J. (2002). Review of graph comprehension research: Implications for instruction. Educational Psychology Review, 14(1), 47-69.
Shah, P., Mayer, R. E., & Hegarty, M. (1999). Graphs as aids to knowledge construction: Signaling techniques for guiding the process of graph construction. Journal of Educational Psychology, 91(4), 690-702.
Shah, P., & Shellhammer, D. (1999). The role of domain knowledge and graph reading skills in graph comprehension. Paper presented at the 1999 Meeting of the Society for Applied Research in Memory and Cognition, Boulder, CO.
Shea, J.B., & Morgan, R.L. (1979). Contextual interference effects on the acquisition, retention, and transfer of a motor skill. Journal of Experimental Psychology: Human Learning and Memory, 5, 179–187.
Shelton, J. T., Elliott, E. M., Hill, B. D., Calamia, M. R., & Gouvier, W. D. (2009). A comparison of laboratory and clinical working memory tests and their prediction of fluid intelligence. Intelligence, 37, 283-293.
Shirey, L. (1992). Importance, interest, and selective attention. In K. A. Renninger, S. Hidi, & A. Krapp (Eds.), The role of interest in learning and development (pp. 281-296). Hillsdale, NJ: Erlbaum.
Shirey, L., & Reynolds, R. (1988). Effect of interest on attention and learning. Journal of Educational Psychology, 80, 159-166. Wade, S. (1992). How interest affects learning from text. In K. A. Renninger, S. Hidi, & A. Krapp (Eds.), The role of interest in learning and development (pp. 255-277). Hillsdale, NJ: Erlbaum.
Simkin, D. K., & Hastie, R. (1987). An information-processing analysis of graph perception. Journal of the American Statistical Association, 82, 454-465.
Singer, H., & Donlan, D. (1980). Reading and learning from text. Boston, Massachusetts: Little, Brown.
Slamecka, N., & Graf, P. (1978). The generation effect: Delineation of a phenomenon. Journal of Experimental Psychology: Human Learning and Memory, 14, 592-604.
Smith, S. M., Glenberg, A. M., & Bjork, R. A. (1978). Environmental context and human memory. Memory & Cognition, 6, 342–353.

129
Spence, I. (1990). Visual psychophysics of simple graphical elements. Journal of Experimental Psychology: Human Perception and Performance, 16(4), 683-692.
Stanovich, K. E., & West, R. F. (1997). Reasoning independently of prior belief and individual differences in actively open-minded thinking. Journal of Educational Psychology, 89, 342–357.
Stanovich, K. E., & West, R. F. (1998). Individual differences in rational thought. Journal of Experimental Psychology: General, 127, 161-188.
Stanovich, K. E., & West, R. F. (2007). Natural myside bias is independent of cognitive ability. Thinking & Reasoning, 13, 225–247.
Stedman, N. L. P., Irani, T. A., Friedal, C., Rhoades, E. B., & Ricketts, J. C. (2009). Relationships between critical thinking disposition and need for cognition among undergraduate students enrolled in leadership courses. North American Colleges and Teachers of Agriculture Journal, 62-70.
Steinhart, Y., & Wyer, Jr., R. S. (2009). Motivational correlates of need for cognition. European Journal of Social Psychology, 39, 608-621.
Stuetzle, W. (1987). Plot windows. Journal of the American Statistical Association, 82, 466-475.
Sweller, J., & Chandler, P. (1994). Why some material is difficult to learn. Cognition and Instruction, 12, 185-185.
Tasker, R., & Dalton, R. M. (2006). Research into practice: Visualisation of the molecular world using animations. Chemistry Education Research and Practice, 7(2), 141-159.
Trafton, J. G., Kirschenbaum, S. S., Tsui, T. L., Miyamoto, R. T., Ballas, J. A., & Raymond, P. D. (2000). Turning pictures into numbers: Extracting and generating information from complex visualizations. International Journal of Human Computer Studies, 53, 827-850.
Tufte, E. R. (1983). The visual display of quantitative information. Cheshire, CT: Graphics.
Tversky, B. (2001). Spatial schemas in depictions. In M. Gattis (Ed.), Spatial schemas and abstract thought (pp. 79-111). Cambridge: MIT Press.
Unsworth, N., Heitz, R. P., Schrock, J. C., & Engle, R. W. (2005). An automated version of the operation span task. Behavior Research Methods, 37, 498-505.
Vaiana, M. E., & McGlynn, E. A. (2002). What cognitive science tells us about the design of reports for consumers. Medical Care Research and Review, 59(1), 3-35.

130
Vernon, M. D. (1946). Learning from graphical material. British Journal of Psychology, 36, 145-158.
Vernon, M. D. (1950). The visual presentation of factual information. British Journal of Educational Psychology, 20, 174-185.
Wade, S., & Adams, R. (1990). Effects of importance and interest on recall of biographical text. Journal of Reading Behavior, 22, 331-353.
Williamson, V. M., & Abraham, M. R. (1995). The effects of computer animation on the particulate mental models of college chemistry students. Journal of Research in Science Teaching, 32(5), 522-534.
Winn, B. (1987). Charts, graphs, and diagrams in educational materials. In D. Willows & H. A. Houghton (Eds.), The psychology of illustration. New York: Springer.
Zacks, J., & Tversky, B. (1999). Bars and lines: A study of graphic communication. Memory and Cognition, 27(6), 1073-1079.
Zacks, J., Levy, E., Tversky, B., & Schiano, D. (2002). Graphs in print. In M. Anderson, B. Meyer, & P. Olivier (Eds.), Diagrammatic representation and reasoning (pp. 187-206). London: Springer-Verlag.
Top Related