


Languages
Pages
Legal


DIGIT.B4 – Big Data PoC
RTD – Health papers
everis Spain S.L.U
D02.02 Technological Architecture
2
DIGIT.B4 D02.02 Technological Architecture everis Spain S.L.U
Table of contents
1 Introduction ............................................................................................................ 5
2 Methodological Approach ..................................................................................... 6
2.1 Business understanding ................................................................................... 7
2.2 Data linguistic understanding ........................................................................... 7
2.3 Data preparation .............................................................................................. 8
2.4 Modelling ......................................................................................................... 8
2.5 Evaluation ...................................................................................................... 11
2.6 Deployment .................................................................................................... 11
3 Technical Architecture ......................................................................................... 12
3.1 Information gathering ..................................................................................... 13
3.2 Information Store ........................................................................................... 13
3.3 Data Processing ............................................................................................. 13
3.4 Data Analytics ................................................................................................ 14
3.5 Governance ................................................................................................... 14
3.6 Decision Support/Utilization ........................................................................... 14

3
DIGIT.B4 D02.02 Technological Architecture everis Spain S.L.U
Table of tables
Table 1- Information gathering .................................................................................... 13
Table 2 - Information Store ......................................................................................... 13
Table 3 - Data Processing .......................................................................................... 13
Table 4 - Data Analytics .............................................................................................. 14
Table 5 - Governance ................................................................................................. 14
Table 6 - Decision Support/Utilization ......................................................................... 14

4
DIGIT.B4 D02.02 Technological Architecture everis Spain S.L.U
Table of figures
Figure 1 - Data analysis main flow ................................................................................ 6
Figure 2 - Methodology phases flow ............................................................................. 6
Figure 3 - Documents to corpus transformation ............................................................ 7
Figure 4 - Completeness and business standpoint analysis .......................................... 7
Figure 5 - Data preparation process .............................................................................. 8
Figure 6 - Dictionary application process ...................................................................... 8
Figure 7 - Clustering process ........................................................................................ 9
Figure 8 - Classification process ................................................................................... 9
Figure 9 - Wordcloud .................................................................................................. 10
Figure 10 - Occurrence matrices ................................................................................. 10
Figure 11 - Semantic network ..................................................................................... 10
Figure 12 - System Architecture .................................................................................. 12
5
DIGIT.B4 D02.02 Technological Architecture everis Spain S.L.U
1 INTRODUCTION
The construction of the proof of concept is based on the definition of a technical architecture. The best way to define it is first to ensure that the PoC is built by following a solid methodological approach, and then to define a technical architecture supporting it.
The elements above are analysed in this document, which includes the following sections:
Methodological Approach.
Definition of the Technical Architecture.

6
DIGIT.B4 D02.02 Technological Architecture everis Spain S.L.U
2 METHODOLOGICAL APPROACH
From a methodological point of view, the main tasks that will be carried out are:
Text-mining treatment: transform the abstract of the documents into a format
that serves as an input for modelling algorithms
Clustering: make homogenous groups of similar documents
Classification model: obtain the rules to classify a document in one of the
categories defined
Draw conclusions from the classification of documents
Figure 1 - Data analysis main flow
The activities are based on the CRISP-DM (Cross Industry Standard Process for Data Mining) methodology. This methodology is the most commonly used standard process model in both academic and industrial fields, and provides a solid framework for data mining projects.
The methodology displays a process in six phases which accounts for all the activities required to gather, classify, store and analyse the data. The CRISP-DM methodology has been chosen due to previous success cases in everis using it.
Figure 2 - Methodology phases flow

7
DIGIT.B4 D02.02 Technological Architecture everis Spain S.L.U
2.1 Business understanding
The objective of this phase is to understand the project objectives and requirements from a business perspective, and then convert this knowledge into a text mining problem definition.
The business orientation of the problem is to obtain a better understanding of the main topics that are being treated to support the orientation of research funds.
The available sources will be analyzed to establish the best suited solution to the problem.
2.2 Data linguistic understanding
Once de data is loaded, a corpus (large collections of texts representing a sample of a variety presented a machine -readable form) is created to make analysis in order to understand the information contained in the scientific papers received and ensure the data quality and the project viability.
Figure 3 - Documents to corpus transformation
The main checks to make are:
Completeness: the volume of documents and different words must be sufficient
to allow reliable analysis.
Quality: the words to be used for the analysis must be grammatically correct.
Business point of view: the most frequent terms are analysed to validate quality
from a business point of view.
Figure 4 - Completeness and business standpoint analysis

8
DIGIT.B4 D02.02 Technological Architecture everis Spain S.L.U
2.3 Data preparation
In this phase, the necessary tasks are performed to transform the original text in a final dataset (set of keywords) that can be use by the algorithms in the modelling phase.
Figure 5 - Data preparation process
The steps to transform the corpus are:
Delete stop words: words that don’t give any information and have no effect on
how the rest of the words are related with each other.
Correction of spelling errors.
Stemming: the word stem is kept to unify conjugations.
Create dictionaries: used to unify different terms that are expressing the same
concepts
Synonym and hyperonymic: used to unify terms that often appear together
(these relations should be consistent from the perspective of business).
Figure 6 - Dictionary application process
2.4 Modelling
During this phase, the statistics models are built to achieve the main objectives of the project and to assign a cluster and a classification to each document.
The first step is building the term document matrix (TDM) that will be the input for the LSA algorithm (will be explained later). This matrix contains the frequency of each term in every document.

9
DIGIT.B4 D02.02 Technological Architecture everis Spain S.L.U
Using this TDM, the score of relevance will determine which words are significant for clustering documents.
With these inputs, latent semantic analysis (LSA) is used to analyze links between a set of documents and the terms they contain by producing a set of concepts related to the documents.
Once the main clusters are defined, they are assed to a concept classification (defined in the Health Research Classification System). New concepts may be created as they have a sufficient size and a meaning from the perspective of business.
Figure 7 - Clustering process
This clustering is use as an input for a classification models. The result of executing a classification model is a set of rules that let us classify a new document based on the terms that appear in it.
Figure 8 - Classification process
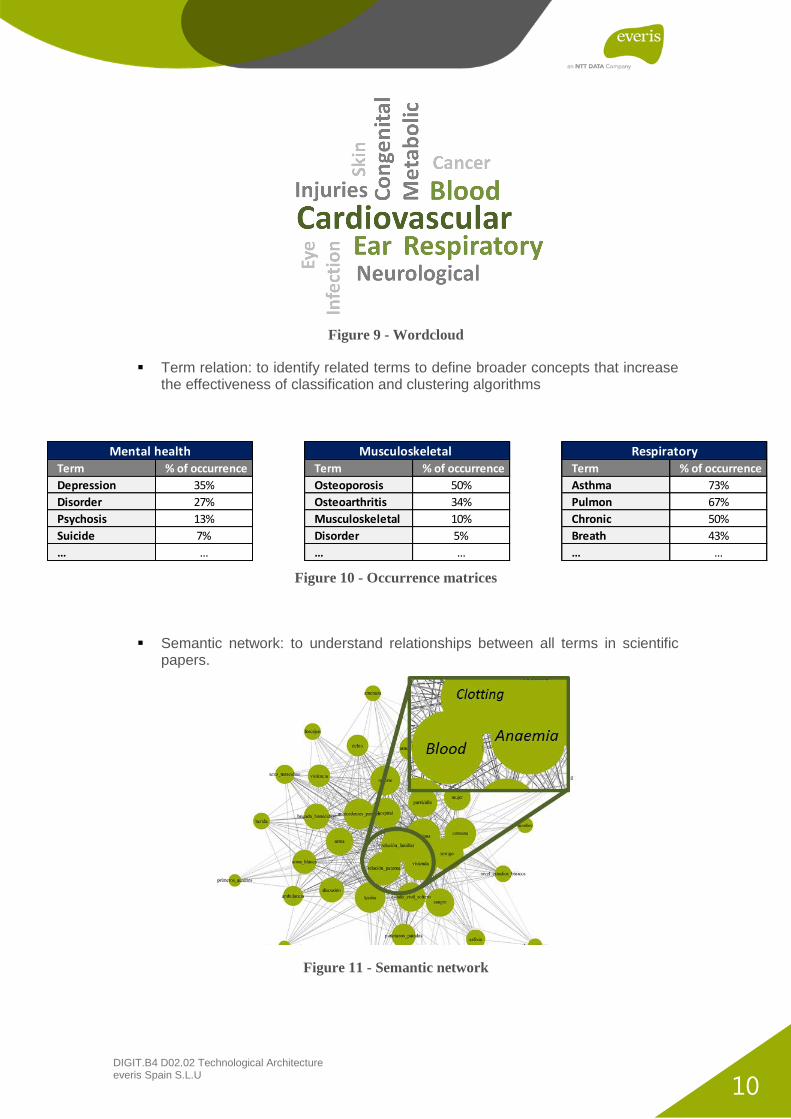
Before the execution of LSA and the classification model, others modelling tasks and analysis are made to know how to approach the main models:
Wordcloud: to understand most frequent terms.
10
DIGIT.B4 D02.02 Technological Architecture everis Spain S.L.U
Figure 9 - Wordcloud
Term relation: to identify related terms to define broader concepts that increase
the effectiveness of classification and clustering algorithms
Figure 10 - Occurrence matrices
Semantic network: to understand relationships between all terms in scientific
papers.
Figure 11 - Semantic network
Term % of occurrence Term % of occurrence Term % of occurrence
Depression 35% Osteoporosis 50% Asthma 73%
Disorder 27% Osteoarthritis 34% Pulmon 67%
Psychosis 13% Musculoskeletal 10% Chronic 50%
Suicide 7% Disorder 5% Breath 43%
… … … … … …
Mental health Musculoskeletal Respiratory

11
DIGIT.B4 D02.02 Technological Architecture everis Spain S.L.U
2.5 Evaluation
In this phase some analysis are performed to ensure the quality of the generated models. It runs parallel to the modeling phase.
All analysis and results of the execution of algorithms are tested to ensure statistical validity and check that they make sense from a business standpoint.
2.6 Deployment
Transform the results obtained after modelling in the analysis and conclusions required for the project.
Support results for presentation and visualization.
12
DIGIT.B4 D02.02 Technological Architecture everis Spain S.L.U
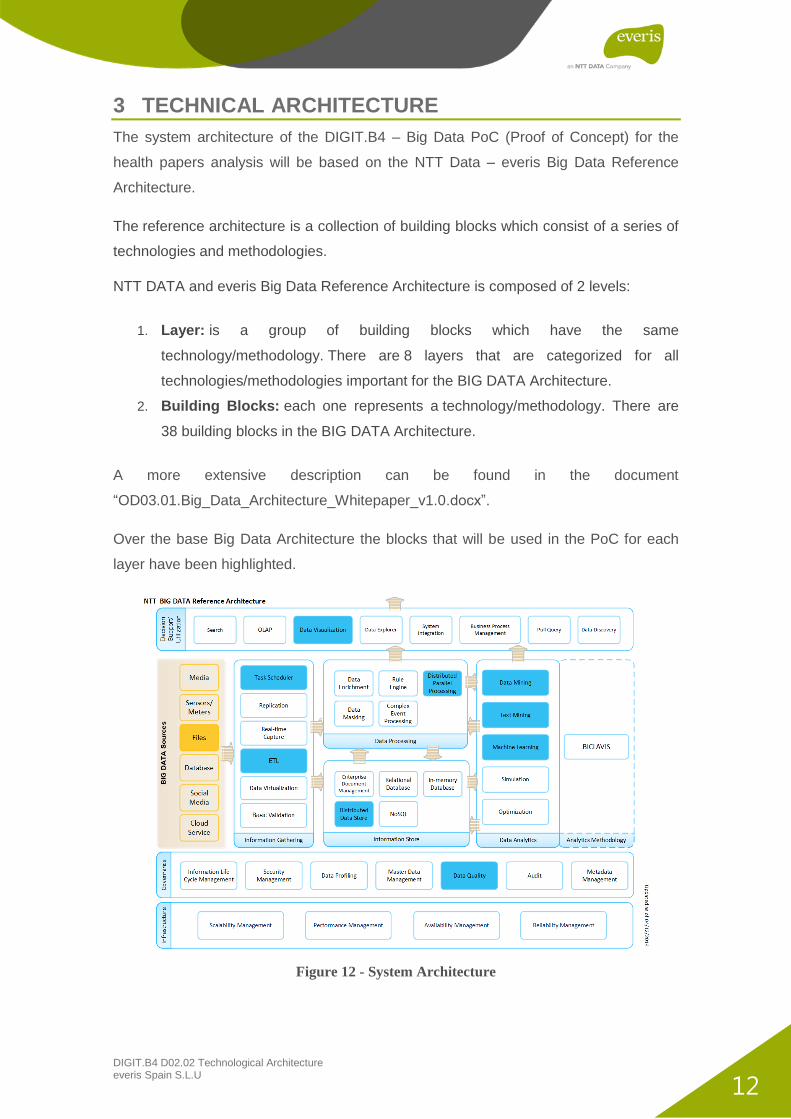
3 TECHNICAL ARCHITECTURE
The system architecture of the DIGIT.B4 – Big Data PoC (Proof of Concept) for the
health papers analysis will be based on the NTT Data – everis Big Data Reference
Architecture.
The reference architecture is a collection of building blocks which consist of a series of
technologies and methodologies.
NTT DATA and everis Big Data Reference Architecture is composed of 2 levels:
1. Layer: is a group of building blocks which have the same
technology/methodology. There are 8 layers that are categorized for all
technologies/methodologies important for the BIG DATA Architecture.
2. Building Blocks: each one represents a technology/methodology. There are
38 building blocks in the BIG DATA Architecture.
A more extensive description can be found in the document
“OD03.01.Big_Data_Architecture_Whitepaper_v1.0.docx”.
Over the base Big Data Architecture the blocks that will be used in the PoC for each
layer have been highlighted.
Figure 12 - System Architecture

13
DIGIT.B4 D02.02 Technological Architecture everis Spain S.L.U
The technologies chosen for each building block are listed, and the descriptions for the
use that the PoC will make of each highlighted block are listed below:
3.1 Information gathering
Task Scheduler
Building Block description A task or job scheduler is a computer application for controlling unattended background program execution (commonly called batch processing).
Building Block PoC use The data gathering and classification are periodic tasks that have to be scheduled.
Building Block technologies Cron
ETL (Extract, Transform and Load)
Building Block description Extract, Transformation and Load (ETL) is an industry standard term used to represent the data movement and transformation processes.
Building Block PoC use The files obtained from the data sources have to be transformed to other formats in order to be readable by the classification model.
Building Block technologies R, python
Table 1- Information gathering
3.2 Information Store
Distributed Data Store
Building Block description Distributed file systems are file systems that enable the sharing of storage resources by storing data on plural servers connected by a network. Distributed file systems make possible extensibility and fault-tolerance by distributing the resources on different servers.
Building Block PoC use Because of the file sizes, data has to be stored in a file system that allows parallel processing.
Building Block technologies HDFS (Hadoop Distributed File System)
Table 2 - Information Store
3.3 Data Processing
Distributed Parallel Processing
Building Block description Parallel computing is concerned with designing computer programs that can run on multiple processors, or cores, which cooperate with each other to solve a single problem.
Building Block PoC use The data classification has to be done in parallel because of the amount of data and the time required to perform the process.
Building Block technologies Apache Spark
Table 3 - Data Processing
14
DIGIT.B4 D02.02 Technological Architecture everis Spain S.L.U
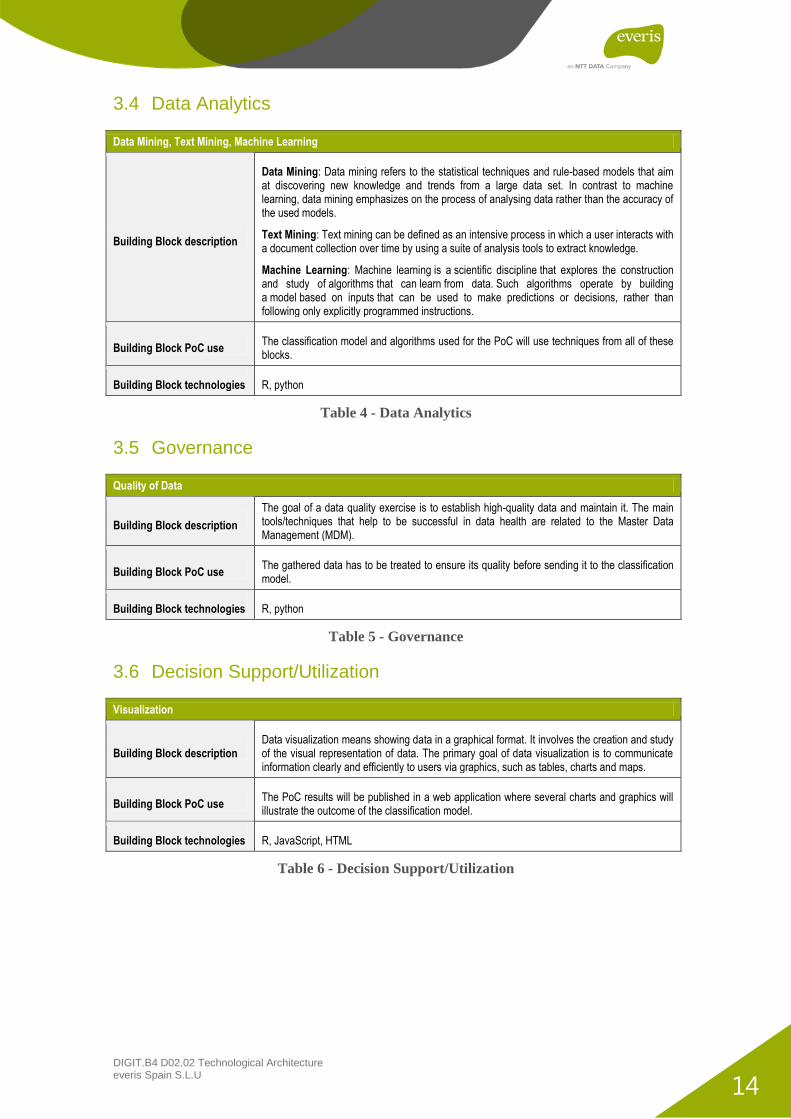
3.4 Data Analytics
Data Mining, Text Mining, Machine Learning
Building Block description
Data Mining: Data mining refers to the statistical techniques and rule-based models that aim at discovering new knowledge and trends from a large data set. In contrast to machine learning, data mining emphasizes on the process of analysing data rather than the accuracy of the used models.
Text Mining: Text mining can be defined as an intensive process in which a user interacts with a document collection over time by using a suite of analysis tools to extract knowledge.
Machine Learning: Machine learning is a scientific discipline that explores the construction and study of algorithms that can learn from data. Such algorithms operate by building a model based on inputs that can be used to make predictions or decisions, rather than following only explicitly programmed instructions.
Building Block PoC use The classification model and algorithms used for the PoC will use techniques from all of these blocks.
Building Block technologies R, python
Table 4 - Data Analytics
3.5 Governance
Quality of Data
Building Block description
The goal of a data quality exercise is to establish high-quality data and maintain it. The main tools/techniques that help to be successful in data health are related to the Master Data Management (MDM).
Building Block PoC use The gathered data has to be treated to ensure its quality before sending it to the classification model.
Building Block technologies R, python
Table 5 - Governance
3.6 Decision Support/Utilization
Visualization
Building Block description Data visualization means showing data in a graphical format. It involves the creation and study of the visual representation of data. The primary goal of data visualization is to communicate information clearly and efficiently to users via graphics, such as tables, charts and maps.
Building Block PoC use The PoC results will be published in a web application where several charts and graphics will illustrate the outcome of the classification model.
Building Block technologies R, JavaScript, HTML
Table 6 - Decision Support/Utilization
Top Related