


Languages
Pages
Legal


DIGITAL ROCK PHYSICS FOR MULTISCALE CHARACTERIZATION OF
HETEROGENEOUS PETROLEUM GEOMATERIALS
by
Jan Goral
A thesis submitted to the faculty of
The University of Utah
in partial fulfillment of the requirements for the degree of
Master of Science
Department of Mining Engineering
The University of Utah
August 2017

Copyright © Jan Goral 2017
All Rights Reserved

T h e U n i v e r s i t y o f U t a h G r a d u a t e S c h o o l
STATEMENT OF THESIS APPROVAL
The thesis of Jan Goral
has been approved by the following supervisory committee members:
Michael G. Nelson , Chair 3.17.2017 Date Approved
Ilija Miskovic , Member 3.17.2017 Date Approved
Raymond A. Levey , Member 3.17.2017 Date Approved
and by Michael G. Nelson , Chair/Dean of
the Department/College/School of Mining Engineering
and by David B. Kieda, Dean of The Graduate School.

ABSTRACT
The ever-growing energy demand and recent discoveries of vast unconventional
oil and gas reservoirs have brought significant attention to shale oil and gas resources as
potential game-changers for the petroleum industry and energy markets worldwide.
Although shale reservoirs are large in scale and offer the potential for long-lived
production, extremely low matrix porosity and permeability, as well as complex
heterogeneity, pose major challenges in obtaining economically viable oil and gas. A lack
of predictive understanding of microstructure-based heterogeneity in shale rock limits the
effectiveness of currently used exploration and production technologies. Hence,
addressing the challenges of shale oil and gas exploration and production technology
requires an in-depth understanding of microstructural features that control the oil and gas
subsurface transport phenomena.
A new holistic approach for characterization of multiscale structural heterogeneity
in shale, presented in this thesis, couples micro- and nano-X-ray microscopy (micro- and
nano-XRM) with focused ion beam scanning electron microscopy (FIB-SEM). This
integrated approach provides a unique opportunity to characterize in great detail the
complex three-dimensional (3D) microstructure of shale rock over multiple length scales,
from the centimeter length scale to the single nanometers. To explore the practical
significance and reach of this newly developed analytical framework, samples from the
Woodford Shale and the Marcellus Shale were imaged several times with non-destructive

iv
XRM at successively higher resolutions, and then finally imaged with the high-resolution
by destructive FIB-SEM serial-sectioning. Subsequently, in order to quantify the
evolution of porosity associated with both organic and nonorganic (mineral) matter, the
organic- and nonorganic-matter pore networks within both samples were extracted using
the FIB-SEM models.
The digital rock physics (DRP) 3D image-based characterization revealed the
Woodford Shale and the Marcellus Shale samples to be primarily composed of varying
amounts of organic and mineral matter. The findings also indicate complex pore systems,
both within organic and nonorganic matrices. The pore network modeling (PNM)
analysis suggested that pores and microfractures located at the interface between organic
and mineral matter were the most abundant pore types in analyzed shale rock samples,
and have the potential for better connectivity. Finally, representative pore/fracture
networks, for continuum and non-continuum fluid flow studies, were separated and
transformed into finite element models for future works.

To My Family

TABLE OF CONTENTS
ABSTRACT ....................................................................................................................... iii
LIST OF TABLES ........................................................................................................... viii
LIST OF FIGURES ........................................................................................................... ix
ACKNOWLEDGMENTS ................................................................................................ xii
Chapters
1. INTRODUCTION .......................................................................................................... 1
2. LITERATURE REVIEW ............................................................................................... 3
2.1 Conventional and Unconventional Oil and Gas................................................... 3 2.2 Reservoir Quality and Completion Quality ......................................................... 5 2.3 Pore-, Core-, and Reservoir-Scale Characterization ............................................ 6 2.4 Organic vs. Nonorganic (Mineral) Matter ........................................................... 7
2.5 Heterogeneous Shale Reservoir Pore Systems .................................................... 9
2.6 Digital Rock Physics (DRP) .............................................................................. 10 2.6.1 X-ray Microscopy (XRM) ..................................................................... 11 2.6.2 Focused Ion Beam Scanning Electron Microscopy (FIB-SEM) ............ 13 2.6.3 XRM/FIB-SEM Correlative Microscopy .............................................. 14
3. RESEARCH STATEMENT ......................................................................................... 21
4. METHODS ................................................................................................................... 23
4.1 Sample Preparation for SEM and/or FIB-SEM ................................................. 24 4.2 XRM/FIB-SEM Correlative Microscopy for the Woodford Shale and the
Marcellus Shale ........................................................................................................ 25
4.2.1 Case Study I: The Woodford Shale ....................................................... 25
4.2.2 Case Study II: The Marcellus Shale....................................................... 28
5. RESULTS AND DISCUSSION ................................................................................... 36
5.1 Case Study I: The Woodford Shale ................................................................... 36
5.1.1 Pore Network Modeling (PNM) in the Woodford Shale ....................... 39
5.2 Case Study II: The Marcellus Shale................................................................... 42
5.2.1 Pore Network Modeling (PNM) in the Marcellus Shale ....................... 43

vii
5.3 Woodford Shale vs. Marcellus Shale Reservoir Pore System ........................... 44 5.4 Image to Simulation Workflow for Continuum and Non-Continuum Transport
Phenomena in Heterogeneous Shale Reservoir Pore Systems ................................. 45
5.4.1 A Workflow for Continuum Fluid Flow in Heterogeneous Shale
Reservoir Pore Systems .................................................................................. 46 5.4.2 A workflow for Non-Continuum Fluid Flow in Heterogeneous Shale
Reservoir Pore Systems .................................................................................. 47
6. CONCLUSIONS........................................................................................................... 68
REFERENCES ................................................................................................................. 70

LIST OF TABLES
Tables
4.1. Woodford Shale and Marcellus Shale samples’ location information....................... 30
5.1. Phase separation and quantification of the focused ion beam scanning electron
microscopy (FIB-SEM) model of the Woodford Shale of the region I. ........................... 48
5.2. Phase separation and quantification of the focused ion beam scanning electron
microscopy (FIB-SEM) model of the Woodford Shale of the region II. .......................... 49
5.3. Phase separation and quantification of the focused ion beam scanning electron
microscopy (FIB-SEM) model of the Marcellus Shale. ................................................... 50
5.4. Tetrahedron volume mesh of the pore network, organic matter, and nonorganic
matter. ............................................................................................................................... 51

LIST OF FIGURES
Figures
2.1. Shale oil and gas plays in the United States. ............................................................. 15
2.2. Shale gas production from selected plays in the United States through the years
2002-2016. ........................................................................................................................ 16
2.3. Tight oil production from selected plays in the United States through the years 2002-
2016................................................................................................................................... 17
2.4. Dry natural gas production by source in the United States through the years 1990-
2040................................................................................................................................... 18
2.5. Shale rock matrix composition classification. ........................................................... 19
2.6. Focused ion beam (FIB) scanning electron microscopy (SEM) serial-sectioning. ... 20
4.1. Sample preparation with argon ion beam milling system. ......................................... 30
4.2. Correlative micro-X-ray microscopy (micro-XRM), nano-X-ray microscopy (nano-
XRM), and focused ion beam scanning electron microscopy (FIB-SEM) workflow for the
Woodford Shale. ............................................................................................................... 31
4.3. Schematic diagram illustrating the principles of operation of micro-X-ray microscope
(micro-XRM). ................................................................................................................... 32
4.4. Schematic diagram illustrating the principles of operation of nano-X-ray microscope
(nano-XRM). ..................................................................................................................... 33
4.5. Sample preparation with laser ablation system. ......................................................... 33
4.6. Correlative (micro and nano) X-ray microscopy (XRM) workflow for the Woodford
Shale. ................................................................................................................................. 34
4.7. Schematic diagram illustrating the principle of operation of focused ion beam
scanning electron microscope (FIB-SEM)........................................................................ 34
4.8. Correlative nano-X-ray microscope (nano-XRM) and focused ion beam scanning
electron microscopy (FIB-SEM) workflow for the Marcellus Shale................................ 35

x
5.1. Scanning electron microscopy (SEM) image of the Woodford Shale. ...................... 52
5.2. Automated mineralogy and petrography (A) 10 um resolution and (B) 2 um
resolution mosaic image of the Woodford Shale. ............................................................. 52
5.3. (A) 25-mm diameter micro-XRM (25 um resolution), (B) 2.5-mm diameter micro-
XRM (2.5 um resolution), and (C) 65-m diameter nano-XRM (150 nm resolution)
models of the Woodford Shale. ........................................................................................ 53
5.4. From image processing and segmentation, through model reconstruction and
visualization, to pore network modeling workflow. ......................................................... 53
5.5. Focused ion beam scanning electron microscopy (FIB-SEM) model of (A) organic
matter, (B) nonorganic matter, and (C) pore network within the Woodford Shale. ......... 54
5.6. Pore types within 5 μm3 shale rock matrix. ............................................................... 55
5.7. Pore network separation into (A) organic-matter-hosted pores and (B) nonorganic-
matter-hosted pores within the Woodford Shale. ............................................................. 56
5.8. Pore size distribution of the organic-matter-hosted pores within the Woodford Shale.
........................................................................................................................................... 57
5.9. Pore size distribution of the nonorganic-matter-hosted pores within the Woodford
Shale. ................................................................................................................................. 58
5.10. Connected pore network model of (A) organic-matter-hosted and (B) nonorganic-
matter-hosted pores within the Woodford Shale. ............................................................. 59
5.11. Focused ion beam scanning electron microscopy (FIB-SEM) model of the
Woodford Shale divided into (A) region I and (B) region II. ........................................... 60
5.12. Pore network separation into (A) organic-matter-related and (B) nonorganic-matter-
related pore network within the Woodford Shale in the region I. .................................... 61
5.13. Pore network separation into (A) organic-matter-related and (B) nonorganic-matter-
related pore network within the Woodford Shale in the region II. ................................... 61
5.14. Focused ion beam scanning electron microscopy (FIB-SEM) model of (A) organic
matter, (B) nonorganic matter, (C) total pore network, and (D) connected pore network
within the Marcellus Shale................................................................................................ 62
5.15. Pore network separation into (A) organic-matter-hosted pores and (B) nonorganic-
matter-hosted pores within the Marcellus Shale. .............................................................. 63
5.16. Pore size distribution of the organic-matter-hosted pores within the Marcellus
Shale. ................................................................................................................................. 64

xi
5.17. Pore size distribution of the nonorganic-matter-hosted pores within the Marcellus
Shale. ................................................................................................................................. 64
5.18. Connected pore network model of (A) organic-matter-hosted and (B) nonorganic-
matter-hosted pores within the Marcellus Shale. .............................................................. 65
5.19. Pore network separation into (A) organic-matter-related pores and (B) nonorganic-
matter-related pores within the Marcellus Shale. ............................................................. 66
5.20. Tetrahedron volume mesh of the pore/fracture network. ......................................... 67
5.21. Three-phase (pore network, organic matter, and nonorganic matter) 1 µm x 1 µm x
2 µm region of interest (ROI) of the FIB-SEM model of the Woodford Shale. ............... 67

ACKNOWLEDGMENTS
The author would like to express his sincere gratitude to his supervisor, Dr. Ilija
Miskovic, for a constant supply of encouragement, guidance, and advice. Additionally,
the author wishes to gratefully acknowledge the help and support of his committee
members, Dr. Michael Nelson and Dr. Raymond Levey.
The thesis programme would not have been possible without constant advice and
cooperation from professors, graduate students, and academic staff of the College of
Mines and Earth Sciences at the University of Utah.
Special credit is due to Dr. Jan Hupka for his help and support.
Special gratitude is due to the Idaho National Laboratory (INL), particularly Dr.
Earl Mattson and Dr. Hai Huang for their precious guidance and suggestions during my
internship.
Further thanks are due to the Carl Zeiss Microscopy, including Jack Kasahara and
Jeff Gelb, for supporting much of this work.
Further gratitude is due to National Energy Technology Laboratory (NETL) and
U.S. Geological Survey (USGS) Core Research Center for providing access to core rock
materials.
Finally, my sincere thanks to my family, for their encouragement, support, and
patience.

CHAPTER 1
INTRODUCTION
Owing to depleting conventional hydrocarbon reserves, unconventional oil and
gas resources have grown in importance as global energy demand has increased. Shale oil
and gas is expected to be a major unconventional energy source for future generations in
all parts of the world. Despite the discovery of a large number of proven shale oil and gas
reserves across the world, the oil and gas industry is facing numerous technical and
environmental challenges that are limiting feasibility of the shale oil and gas production.
The main challenge is that only a small fraction can be recovered using the latest
technology, due to the lack of basic science needed to understand the technology and to
guide additional advances. Concepts and theories developed for conventional oil and gas
reservoirs cannot be readily transferred and applied to shale oil and gas systems. Today,
there is still wide gap in the knowledge and understanding of the relevant fundamental
physics that ultimately control the transport phenomena in the subsurface. Filling these
gaps could facilitate the development and deployment of effective technology in
important energy and environmental applications.
In this study, in Chapter 2, I will start with a brief literature review on reservoir
quality and completion quality in the context of unconventional oil and gas exploration
and production. Later in this thesis, in Chapter 4, I will introduce digital rock physics

2
technology, as an emerging multiscale characterization method for heterogeneous
petroleum geomaterials, followed by the experimental procedure (in Chapter 5) applied to
study Woodford Shale and Marcellus Shale rock samples. In Chapter 6, I will present
pore network modeling results supported with a discussion. Finally, I will end with
conclusions in Chapter 7.

CHAPTER 2
LITERATURE REVIEW
Before the recent downturn in the upstream petroleum industry sector, development
of unconventional oil and gas resources had a terrific run and had a profound impact on
hydrocarbons supply, especially in the United States and Canada.
“A downturn gives us some time to step back, review what has been done, and think
about possible improvements and innovations” (Ma and Holditch 2016).
2.1 Conventional and Unconventional Oil and Gas
The number of conventional oil and gas discoveries had been growing for several
decades until the mid-1980s, when it started to decrease along with the decreasing
amount of reserves found each year (Hyne 2012). Unconventional oil and gas resources,
such as heavy oil sands, shale oil and gas, tight gas sandstones, coalbed methane, and gas
hydrates, will become more important with time to replace conventional oil and gas.
Conventional oil and gas resources usually accumulate in favorable structural or
stratigraphic traps in which the formation is porous and permeable (above 0.1 mD), but
also sealed by an impermeable layer that prevents hydrocarbons from escaping.
Conventional reservoirs are those that have good reservoir quality and generally can be

4
economically developed using vertical wellbores and without the use of massive
hydraulic fracture stimulation treatment.
On the other hand, unconventional subsurface hydrocarbon resources reside in
tight formations, which are of lower reservoir quality and are much more difficult in
terms of hydrocarbons extraction. Unconventional reservoirs are often characterized by
very low porosity and permeability (below 0.1 mD) and must be developed using a
combination of horizontal drilling and multistage hydraulic fracturing to produce
hydrocarbons at an acceptable recovery rate (Ambrose et al. 2010 and 2012, Bai 2011,
Ding et al. 2012, King 2012). For example, the typical recovery factor for shales is
estimated to be about 15 to 35% of the gas in place (Hyne 2012).
One of the tight formations are shales and they are the most abundant sedimentary
rock on Earth. Shale formations are combination of source rock, reservoir rock, and a
seal, that has generated oil and gas, but not all the hydrocarbons have been expelled from
the rock. The oil and gas are contained in pore spaces, natural fractures, and adsorbed
onto organic matter. There is a very large number of shale plays in the United States,
Canada, and throughout the world. Some of the most prolific oil and gas producing shale
formations in the U.S. include Barnett Shale in north-central Texas, Fayetteville Shale in
northern Arkansas, Haynesville Shale in eastern Texas and north Louisiana, Woodford
Shale in Oklahoma, Eagle Ford in southern Texas, and Marcellus Shale and Utica Shale
in northern Appalachia (Figure 2.1).
Figure 2.2 and Figure 2.3 depict total shale gas and tight oil production (from
different shale formations) in the United States from 2012 to 2016. Estimates by the U.S.
Energy Information Administration (EIA) suggest that the United States has

5
approximately 610 Tcf of technically recoverable shale natural gas resources, and 59
billion barrels of technically recoverable tight oil resources (EIA 2014). Note that the
term “tight oil” refers to all resources, reserves, and production associated with low-
permeability formations that produce oil, including those associated with shale
formations.
According to EIA, production from shale gas and tight oil plays is the largest
contributor to U.S. oil and gas, and is expected to increases from 50% in 2015 to 69% in
2040, growing by more than 15 Tcf, from 13.6 Tcf in 2015 to 29 Tcf in 2040, as depicted
in Figure 2.4 (EIA 2014).
2.2 Reservoir Quality and Completion Quality
There is no unique geological, geophysiochemical, or geomechanical parameter
that can determine oil or gas production, but two categories of variables are important:
reservoir quality (RQ) and completion quality (CQ).
RQ describes oil or gas potential, the amount of oil and gas in place, and oil and
gas deliverability of the rock formation. The important variables in reservoir quality
include lithology, thermal maturity, organic and nonorganic (mineral) content, total
organic carbon (TOC), total and connected (effective) porosity, absolute/effective/relative
permeability, fluid saturations, and formation pressure (Passey et al. 2010).
CQ, on the other hand, describes stimulation potential or the ability to create and
maintain natural and induced fracture surface area. Completion quality is highly
dependent on geomechanical properties and mineralogical composition of the rock
formation, including in-situ stress regime and rock fracturability (Nadimi et al. 2016,

6
Waters et al. 2011, Weng et al. 2015). For example, one principle in selecting a zone for
hydraulic fracturing based on completion quality is to target the rocks that have a high
Young’s modulus and a low Poisson ratio (Ma 2016). A brittle rock responds to hydraulic
fracturing better than an elastic rock. Shales with some silica or calcium carbonate are
more brittle than shales with more clay minerals (Hyne 2012).
Evaluation of shale oil and gas resources, by judging whether a given shale
formation has a sufficient amount of technically recoverable hydrocarbons, requires a
multidisciplinary approach (see Chapter 2.3). It must correlate all of the geological,
petrophysical, and geomechanical variables in the reservoir and completion quality so
that horizontal drilling and hydraulic fracturing (e.g., lateral length, stage count, frac fluid
composition, and proppant tonnage) are designed optimally for achieving the best
economics.
2.3 Pore-, Core-, and Reservoir-Scale Characterization
Shale oil and gas reservoirs are heterogeneous at many scales – pore-, core-, and
reservoir-scale – and are often referred to as statistical plays due to their degree of
anisotropy, which presents tremendous challenge for exploration and production (Nadimi
2015). The heterogeneity of gas- and liquid-rich shale reservoirs is manifested as
variability in reservoir properties, including geological, geophysicochemical, and
geomechanical characteristics. It results from the combination of different physical,
chemical, and biogenic processes occurring during, and shortly after, sediment deposition
(Aplin and Macquaker 2011). For instance, porosity/permeability (por/perm) of a shale
reservoir is never a constant value, because reservoir por/perm heterogeneity is very high.

7
This makes these unconventional reservoirs extremely complex and challenging to assess
reservoir or completion quality. Therefore, evaluation and development of shale
reservoirs is not a straightforward process and requires a multidisciplinary approach that
must integrate geological, petrophysical, and geomechanical variables including:
lithology, thermal maturity, organic and mineral content, TOC, pore/fracture network,
permeability, fluid saturations, formation pressure, fluid/rock interaction, etc. By
integrating all the available information over multiple scales into the workflow, this
should enable better characterization of reservoir properties, ranking critical parameters,
and optimizing production, managing and reducing the uncertainty and risk in developing
unconventional resources.
2.4 Organic vs. Nonorganic (Mineral) Matter
As previously mentioned, shale is the most common sedimentary rock (~ 99%)
and is composed of finely-grained organic matter and nonorganic (mineral) matter.
Depending on the organic content, the color of shale commonly ranges from black to
gray. The darker the shale, the higher the organic content. Black shale is common source
rock for oil and gas. A gray shale can be a caprock on a reservoir rock in a petroleum
trap. Shales are commonly deposited on river floodplains and on the bottom of lakes or
oceans. Depending on the depositional environment, there are two types of organic matter
that can be found in shale rocks: land-derived and aquatic-algae-derived. A combination
of time, temperature, and pressure converts organic matter into kerogen and then into
hydrocarbons over three main stages of maturation: diagenesis, catagenesis, and
metagenesis (Pathak at al. 2015a). Converting kerogen into hydrocarbons often causes

8
increased pressure and porosity within the source rock (see Chapter 2.5). The amount of
oil and gas generated is determined by the kerogen type and the heating rate (thermal
maturity). There are four types of kerogen found (separately or together) in shale:
lacustrine oil prone type I, marine oil and gas prone (depending on the kerogen maturity)
type II, terrestrial gas or condensate prone type III, and type IV (with little capacity for
hydrocarbons generation) (Pathak et al. 2017a). Kerogen type and its evolution into oil
and gas can be illustrated by the Van Krevelen diagram (Pathak et al. 2017b). The type of
kerogen present in a shale formation determines source rock quality (the more oil-prone a
kerogen, the higher its quality). Examples of oil-bearing organic-rich shales are Bakken,
Monterey, and Eagle Ford Shale formations, while the examples of gas-bearing organic-
rich shales are Barnett, Fayetteville, and Marcellus Shale formations (Ma 2016). In
unconventional reservoirs, similarly to organic matter, mineral matter composition plays
an important role in reservoir and completion quality evaluation, as it may govern fluid
flow and storage (Heath et al. 2011). In general, shales can be mineralogically described
using a ternary diagram with three dominant mineral components: clay, carbonates, and
silicates. Figure 2.5 depicts shale rock matrix composition classification. Most well-
known productive shale reservoirs are highly siliceous, but a few known shale reservoirs
have high calcareous content, like Niobrara or Eagle Ford Shale formations (Ma 2016).
However, individual shale reservoirs can vary considerably in mineralogy, due to
unconventional reservoir heterogeneity. Therefore, a proper understanding of geological
settings of the shale reservoir along with its mineralogical mix is essential.

9
2.5 Heterogeneous Shale Reservoir Pore Systems
Heterogeneous shale reservoir pore systems have been the focus of many academic
institutions and industrial research and development groups (Curtis et al. 2010, Dewers et
al. 2012, Goral el al. 2015a, Lonoy 2006, Milliken et al. 2013, Pommer and Milliken 2015).
Their studies have shown that both the organic and mineral matter found within shale rock
matrix have a variety of pore networks that can be any combination of pore types and
(natural or induced) microfractures of different pore sizes, from a few nanometers to
several microns in size. Both pores and microfractures form the flow pathways for
hydrocarbon migration in shale reservoirs. According to Loucks et al. (2010 and 2012),
there are three main categories of pore types in shales classified based on their relationship
with grains: organic-matter intragranular pores, mineral-matter intragranular pores, and
mineral-matter intergranular pores. Intergranular pores are located between grains and
crystals, whereas intragranular pores are found within particles. Organic-matter
intragranular pores, also known as intraparticle pores, appear to be related to thermal
maturation of organic matter, whereas mineral-matter intraparticle and interparticle pores
are strongly affected by mechanical and chemical diagenesis (Curtis et al. 2011). Organic-
matter porosity is often correlated to TOC (Alqahtani and Tutuncu 2014, Lu et al. 2015)
and thermal maturity (Ma 2016). Organic-rich shales with high TOC and thermal maturity
often have high organic-matter porosity because the conversion from kerogen to
hydrocarbons often leads to an increase in porosity and permeability.

10
2.6 Digital Rock Physics (DRP)
Traditional characterization methods commonly used to assess porosity and
permeability, such as nuclear magnetic resonance (NMR) and mercury injection capillary
pressure (MICP) developed for conventional reservoirs, are insufficient for characterizing
unconventional reservoirs. They have been reported to be expensive, inaccurate,
incomplete, and time-consuming to complete, requiring months or even years for
characterization of a single well site (Nelson 2009). Their applicability for highly
heterogeneous unconventional reservoirs is limited. Therefore, the data obtained by these
techniques may be biased and highly uncertain (Bertoncello and Honarpour 2013). This
adds to the difficulties of exploration and production, and has caused researchers to
search for a new solution to supplement the existing characterization techniques.
Many modern researchers are now turning to the technique of digital rock physics
as a potential solution for multiscale characterization of heterogeneous petroleum
geomaterials, owing to the power of modern microscopes to reliably and precisely image
various rocks (Curtis et al. 2012, Curtis 2014, Goral et al. 2016, Loucks et al. 2009, Saraji
2014, Tono 2008, Wang 2014).
Increased interest in shale oil and gas reservoir characterization has sparked novel
approaches to reservoir rock analysis, incorporating many modern scientific digital two-
dimensional (2D) or three-dimensional imaging techniques, such as micro- and nano-X-
ray microscopy, focused ion beam scanning electron microscopy, and (scanning)
transmission electron microscopy (S/TEM), among others. Recent advancements in X-ray
and electron microscopy provide a tremendous opportunity for surveying rock samples and

11
zooming in to capture the intricate nature of heterogeneous and nanostructured
geomaterials (Blunt et al. 2013, Lopez et al. 2012, Zhang et al. 2011).
Despite the abilities of each technique to image structures across particular
magnification ranges, these scientific digital imaging methods, individually, are limited
by the sample size or imaging resolution and no single technique is capable of fully
capturing the multiscale heterogeneity of a shale rock. A major challenge in the proper
identification and characterization of reservoir heterogeneity is the need for balance
between inspection volume and spatial resolution. Any characterization approach must
incorporate sufficient resolution to identify nanometer scale features while being able to
survey how these features relate to the larger-scale volumes, on the scale of hundreds of
microns to millimeters and beyond.
To this end, a sequential investigation at different scales, using multiple
techniques, is necessary to bridge a range of scales and properly characterize and
correlate distributions of the shale microstructural properties. Therefore, this study
illustrates the concept of coupled XRM and FIB-SEM analysis as a correlative approach
for 3D investigation of heterogeneous shales to provide a representative and uniquely
informative perspective on rock properties (Knackstedt et al. 2012).
2.6.1 X-ray Microscopy (XRM)
X-ray imaging systems, or X-ray computed tomography (XCT) scanners, have
historically been very important to reservoir characterization because of their unique
abilities to acquire 3D images of rock specimens at various scales and resolutions. The
nondestructive nature of the technique allows specimens to be physically preserved

12
during imaging, retaining them for subsequent analytical or image-based analysis
(Goldstein et al. 1981, Merkle et al. 2014).
In the XCT technique, several 2D projection radiographs are collected while
rotating the specimen through 180° (“parallel-beam” configuration) or 360° (“cone-
beam” configuration). These projection radiographs are reconstructed using standard
procedures, such as filtered-back projection or Feldkamp-Davis-Kress (FDK), to produce
digital, 3D volumetric representations of the structure of the specimen (Herman 2009).
The different gray scale values, or computed tomography (CT) numbers, found within the
reconstruction volumes, correspond to different X-ray absorption rates, which incorporate
localized compositional and structural heterogeneities as well as mass-absorption
coefficient for each material.
X-ray microscopy expands on the traditional CT techniques and incorporates X-
ray optics, such as a tunable detection system, providing high spatial resolutions across a
range of specimen sizes (Merkle and Gelb 2013). It is used for many different types of
reservoir rocks and has recently gained favor for mudstones, due to resolution
improvements in the instrumentation (Gelb et al. 2011). The maximum spatial resolution
ranges to the sub-micron regime for specimen sizes into the tens of millimeters and has
demonstrated resolution to the tens of nanometers for specimen sizes in the tens of
microns. The XRM technique has demonstrated many unique advantages for localized
3D characterization without disturbing the specimen structure, which has increased its
popularity for DRP applications (Gelb et al. 2012).

13
2.6.2 Focused Ion Beam Scanning Electron Microscopy (FIB-SEM)
XRM alone provides access to data across a unique range of length scales, but is
not sufficient to characterize the smallest features of the rock microstructure. For this
reason, SEM has grown in popularity in recent years as a technique to capture, for
example, the smaller pores in shale (Huang et al., 2013). Commercial SEM systems can
provide spatial resolutions on the order of single nanometers, which represent an
important length scale for understanding fluid transport dynamics. SEM alone, however,
only provides 2D information, and it is often the 3D nature of these features that is of
interest to DRP modeling protocols (e.g., pore connectivity). This has led to novel
approaches for 3D SEM.
The combination of focused ion beam (FIB) systems with high-resolution
scanning electron microscopes has grown in popularity in recent years for high-resolution
analysis of localized 3D volumes. The FIB-SEM technique relies on using a focused ion
beam to polish away a thin (~10 nm) layer of material, exposing a layer below the
original front surface of the specimen. A high-resolution field-emission SEM is used to
image the structure, and then the process is repeated. This gives rise to a serial-sectioning
approach to 3D imaging, as the layers may be digitally assembled into a 3D
representation for subsequent analysis and modeling (Figure 2.6). Using this method, 3D
imaging with resolution of a few nanometers has been made possible, leading to new
insights into rock fabric, porosity, and permeability (Lemmens et al. 2011). This allows
for accurate characterization of shale rock and for direct modeling and simulation of flow
in the 3D datasets, with resolutions on the order of single nanometers.

14
2.6.3 XRM/FIB-SEM Correlative Microscopy
The flexibility of the FIB-SEM imaging system is high, but it has two unfortunate
drawbacks. The technique is both destructive and highly localized. Nevertheless, this
method of 3D reconstruction gives access to a variety of valuable microstructural
information and may be extended to chemical information using correlative energy-
dispersive X-ray spectroscopy (EDS). Although the resolution for this technique lies in
the single nanometers, the volumes have historically been correspondingly small and
often not representative of overall rock properties, so some guidance is necessary prior to
3D imaging with FIB-SEM. In other words, to make the FIB-SEM technique most
effective, it must be directed using some “a priori” knowledge. For this reason, the
current state-of-the-art digital rock laboratories are turning toward a correlative
technique, using XRM and FIB-SEM in concert to survey a material, identify a region of
interest (ROI) for further inspection, and then localize with higher resolution, all in 3D.
This allows the unique strengths of both X-ray and electron microscopy to be effectively
used together, for an accurate characterization of the sample. In cases of highly
heterogeneous formations, such as shale reservoirs, this correlative technique suggests an
efficient future pathway for digital rock investigations.

15
Figure 2.1. Shale oil and gas plays in the United States. Source: U.S. Energy
Information Administration (EIA) Annual Energy Outlook 2014.

16
Figure 2.2. Shale gas production from selected plays in the United States through
the years 2002-2016. Source: U.S. Energy Information Administration (EIA)
Annual Energy Outlook 2014.
0
5
10
15
20
25
30
35
40
45
50
Shal
e G
as P
roduct
ion [
BC
F/D
ay]
Year
Antrim (MI, IN, & OH) Bakken (ND & MT)
Woodford (OK) Barnett (TX)
Fayetteville (AR) Eagle Ford (TX)
Haynesville (LA & TX) Marcellus (PA, WV, OH & NY)
Utica (OH, PA, & WV) Other

17
Figure 2.3. Tight oil production from selected plays in the United States through
the years 2002-2016. Source: U.S. Energy Information Administration (EIA)
Annual Energy Outlook 2014.
0
0.5
1
1.5
2
2.5
3
3.5
4
4.5
5
Tig
ht
Oil
Pro
duct
ion [
MM
bbl/
day
]
Year
Monterey (CA) Austin Chalk (LA & TX)
Granite Wash (OK & TX) Woodford (OK)
Marcellus (PA, WV, OH, & NY) Haynesville
Niobrara-Codell (CO & WY) Wolfcamp (TX & NM Permian)
Bonespring (TX & NM Permian) Spraberry (TX & NM Permian)
Bakken (ND & MT) Eagle Ford (TX)
Yeso & Glorieta (TX & NM Permian) Delaware (TX & NM Permian)
Utica (OH, PA, & WV)

18
Figure 2.4. Dry natural gas production by source in the United States through the years
1990-2040. Source: U.S. Energy Information Administration (EIA) Annual Energy
Outlook 2014.
0
5
10
15
20
25
30
35
40
45
1990 1995 2000 2005 2010 2015 2020 2025 2030 2035 2040
Gas
Pro
duct
ion [
TC
F]
Year
Shale Gas Tight Gas Other Offshore Gas Coalbed Methane Gas from Alaska

19
Figure 2.5. Shale rock matrix composition classification.
Shale Rock Matrix
Organic Matter
Kerogen
Type I
Type II
Type III
Type IV
Nonorganic (Mineral) Matter
Clay
Bentonite
Kaolinite
Illite
Chlorite
Smectite
Carbonates
Calcite
Dolomite
Phosphate
Siderite
Magnesite
Silicates
Quartz
Mica
Feldspar
Sulfides
Pyrite

20
Figure 2.6. Focused ion beam (FIB) scanning electron microscopy (SEM) serial-
sectioning.

CHAPTER 3
RESEARCH STATEMENT
The heterogeneity associated with complex shale reservoir pore systems has
broad implications on the development of the unconventional oil and gas industry.
Recent studies have indicated that shale pores significantly vary in number, size (from
nano- to micropores), and classification (organic and nonorganic pores). Thus far, the
role of pore network and, more specifically, what pores contribute the most to the oil
and gas storage, or to the production process, is not well understood and remains largely
unknown. Hence, it is vital to determine how well different pores are connected and
how they create possible flow pathways for hydrocarbon migration. Moreover, in the
context of shale oil and gas production, factors, such as pore and fracture network
architecture or fluid-rock interaction, are expected to significantly influence the
hydrocarbons storage and transport mechanisms. There is a limited number of research
studies focusing on either quantification of the geometry of individual pores and
fractures, or modeling and simulation of the transport phenomena in nanostructured
shale rock matrix based on the 3D high-resolution scientific digital imaging data.
Therefore, in this study, a comprehensive digital rock physics framework is
presented for pore network modeling in the Woodford Shale and the Marcellus Shale
rock matrix using correlative micro- and nano-X-ray microscopy and focused ion beam

22
scanning electron microscopy serial-sectioning. Properties of pore types and networks,
together with estimates of pore connectivity, are investigated – organic and nonorganic
pore systems are quantified as representative pore networks for future finite element
modeling and simulation studies of continuum or non-continuum transport phenomena
within heterogeneous petroleum geomaterials.

CHAPTER 4
METHODS
The Woodford Shale and the Marcellus Shale are important hydrocarbon source
rocks and are recognized as two of the "magnificent seven" along with the Barnett,
Fayetteville, Haynesville, Horn River, and Montney. Horizontal drilling and hydraulic
fracturing tandem have made the Woodford Shale and the Marcellus Shale formations
prolific and self-sourced unconventional reservoirs that yield both gas and liquids.
The Woodford Shale formation produces gas, condensate, and oil at thermal
maturities from mature (>0.5% Ro) to postmature (2-3% Ro). The Devonian organic-rich
Woodford Shale’s bulk organic matter type is type II kerogen (Cardott 2012).
The Devonian Marcellus Shale from Appalachian Basin contains one of the
largest world-class shale gas plays in North America. It is divided into two members,
more organic-rich lower Marcellus (Union Springs Shale) and less organic-rich upper
Marcellus (Oatka Creek Shale), which are separated by the Cherry Valley and Purcell
Limestones (Zagorski et al. 2012). Thermal maturity (vitrinite reflectance) of the black
shale of the Appalachian Basin is Ro = 1.6 and above throughout most of the play, and
total organic carbon (TOC) is 2-10% (Bruner and Smosna 2011). The Marcellus Shale
contains both marine liquids-prone Type II kerogen and terrestrial gas-prone Type III
kerogen (Chen et al. 2015).

24
The location information of the Woodford Shale (Woods County in Oklahoma)
(provided by U.S. Geological Survey (USGS) Core Research Center) and (Oatka Creek)
Marcellus Shale (Green Country in Pennsylvania) (provided by National Energy
Technology Laboratory (NETL)) samples used in this study is given in Table 4.1.
4.1 Sample Preparation for SEM and/or FIB-SEM
Both Woodford Shale and Marcellus Shale samples were first prepared for
preliminary SEM imaging and analysis. The shale rock sample preparation procedure
protocol is given below.
a) First, we cut the rock with a mechanical saw at 200-250 RPM to the desired size
and attach it to a SEM stub. Alternatively, rock cuttings can be submerged into
epoxy resin to avoid later fracture creation. Later, we let the sample dry under
vacuum (to avoid bubble creation).
b) Second, we mechanically polish the shale rock sample surface with a sequence of
silicon carbide paper. We start with 60 grit (260 micron), and then proceed with
finer grits of 600 (26 micron), 800 (22 micron), and 1200 (15 micron).
Subsequently, we mechanically polish the shale rock sample surface with 3
micron and 1 micron diamond lapping film discs. We use kerosene as a
lubricating and cooling media during this operation.
c) Third, we let the sample dry in an oven in approximately 200 °C.
d) Next, if available, we mill the top surface of the shale rock sample with an argon
ion beam milling device. This corresponds to approximately 0.05 micron diamond
lapping film disc mechanical polishing. Sheer force-free milling allows for an
25
artifact-free surface. We set the right and left beams to 4 kV voltage, 45% focus,
and 4° beam angle, as shown on Figure 4.1. We mill for approximately 1.5 hours.
e) Shale rock is a nonconductive sample that charges during the SEM analysis.
Therefore, to avoid charging effect, we coat the sample with about 10-20 nm of
carbon. The deposited carbon thickness typically does not affect SEM analysis but
keeps the sample from accumulating charge and drifting.
4.2 XRM/FIB-SEM Correlative Microscopy for the Woodford Shale
and the Marcellus Shale
4.2.1 Case Study I: The Woodford Shale
The Woodford Shale sample was imaged several times using XRM at
successively higher magnifications (higher resolutions with correspondingly smaller
characterization volumes), and then finally imaged by FIB-SEM serial-sectioning. As
described below, at some stages the specimen was imaged intact, and at other stages the
sample was milled to a smaller size to increase the achievable spatial resolution. Figure
4.2 summarizes the correlative (nano and micro) X-ray and scanning electron microscopy
workflow for the Woodford Shale.
4.2.1.1 Micro-XRM
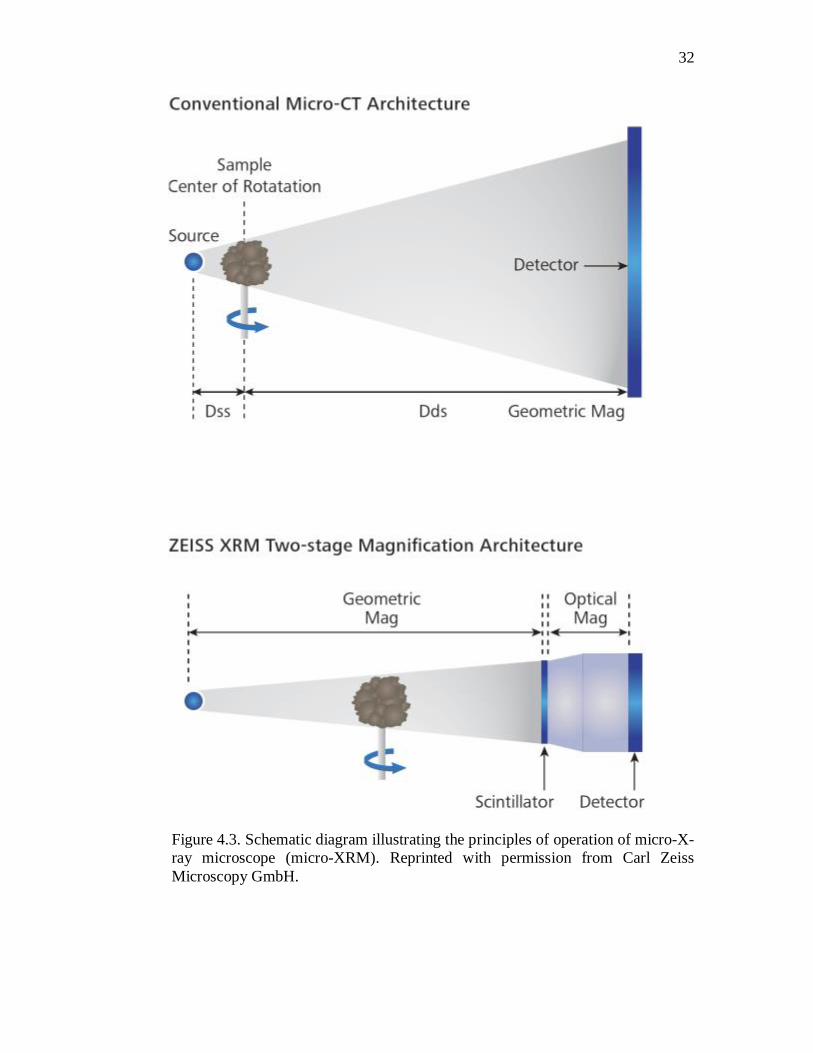
The end trim of a 25 mm core plug was mounted to a sample holder for 3D
imaging with micro-XRM (Figure 4.3). This microscope achieves tunable spatial
resolution by using a system of visible light objective lenses, each coupled to a
scintillating screen, which allows a range of different magnifications to be achieved

26
without further trimming to the specimen. Three-dimensional datasets were produced by
collecting a series of 2D X-ray projection radiographs, which provided 3D volumetric
data using an FDK reconstruction algorithm. The XRM detection system is capable of
producing volumetric data up to 2048 × 2048 × 2048 voxels, but in the present
experiment, the pixel size was binned to a 1024 × 1024 × 1024 volume to increase the
effective throughput in the experimental data.
The initial XRM experiments were carried out in three stages. In the first stage,
data from the entire 25 mm diameter plug were captured using a 0.4X objective lens,
which was tuned to provide a voxel size of 29 μm. This allowed inspection of the long-
length scale features, in order to inspect the specimen for bulk heterogeneity and select
smaller regions for higher-resolution investigation. From this dataset, a region that
appeared to represent the specimen as a whole was identified and optically enlarged. A
4X objective was used for this subsequent scan with a voxel size of 2.5 μm, collecting
data through a cylindrical volume of 2.5 mm in each dimension. This second scan used
the technique of interior tomography, where the specimen was left as an intact 25 mm
plug, to eliminate any potential errors introduced by specimen preparation on the higher-
resolution data.
4.2.1.2 Nano-XRM
To achieve higher throughput for characterizing features on a smaller length scale,
a nano-XRM (Figure 4.4) was used. This instrument is capable of providing down to 50
nm spatial resolution for suitably prepared samples, with a switchable “large field of
view” mode that provides 150 nm resolution across a 65 μm isotropic volume. The

27
nanoscale XRM system necessitates a smaller sample geometry, for which an Oxford
Lasers laser ablation system (Figure 4.5) was employed. The laser milling process
provides nonmechanical material removal, minimizing the chances of additional fractures
being introduced in the sample preparation. Using parameters provided by the
manufacturer to minimize damage caused by localized heating, a cylindrical pillar ~100
μm in diameter was created at the top surface of the end trim. This specimen was
characterized following a similar procedure of radiograph collection and 3D
reconstruction using the large field of view mode (200X magnification), resulting in a
cylindrical data volume 65 μm in each dimension on a 1024 × 1024 × 1024 voxel volume
(64 nm voxel size).
Figure 4.6 presents correlative (micro and nano) X-ray microscopy (XRM)
workflow. Nano- and micro-XRM 3D models are visualized by the ORS Visual SI
software.
4.2.1.3 FIB-SEM
Although the XRM volumes provided data across a range of length scales, still
finer features were suspected based on prior research (Bai et al. 2013). To continue the
nanoscale investigation, a correlative microscopy approach was employed using the Atlas
5 software platform. The specimen was transferred to a SEM equipped with a high-
current FIB (Figure 4.7). Using 100 nA milling current on the FIB, the upper mass on the
pillar was milled away until the same volume captured in the nanoscale XRM was
reached. After locating a suitable region of interest, the site was prepared for FIB-SEM
serial-sectioning by standard methods. Approximately 3000 serial images were then
28
collected in a single-batch acquisition spanning a total depth greater than 21 μm, with
each image capturing a 40 μm × 10 μm field of view. To observe nanoporosity in the
organic matter, a voxel size and slice thickness of 7 nm were selected, resulting in an
image stack comprised of approximately 5700 × 1800 × 3000 voxels.
The rapid data acquisition rate was possible because each section was imaged
with the SEM sequentially with FIB milling. Furthermore, a duplex signal was collected
for each section. As the electron beam was rastered across the surface, dwelling briefly
on each pixel, the secondary electron signal was acquired with the secondary electron
secondary ion (SESI) detector and the backscattered electron signal was simultaneously
acquired with the energy-selective backscatter (EsB) detector. The complementary
information from these two signals was then blended into a single image to optimize
contrast across various minerals, organic bodies, and matrix pores.
4.2.2 Case Study II: The Marcellus Shale
Similarly to the Woodford Shale sample, in order to characterize the Marcellus
Shale sample at various length scales and identify the region of interest (ROI), a
correlative microscopy approach was employed incorporating a nondestructive nano-X-
ray microscopy and destructive focused ion beam scanning electron microscopy serial-
sectioning. Due to limited time and budget, only nano-XRM and FIB-SEM were used to
image and analyze the Marcellus Shale sample (Figure 4.8).

29
4.2.2.1 Nano-XRM
A 1 mm mini plug was prepared from a 12 mm x 12 mm x 3 mm cuboid of
Marcellus Shale using an Oxford Lasers laser ablation system. The laser ablation system
utilized a 2.5 W, 532 nm pulsed laser, designed to minimize the depth of rock affected by
the heat of the laser. From this 1 mm mini plug, a 65 micron diameter pillar was created
using the same sample preparation tool.
The 65 micron pillar was then imaged with nano-XRM, creating a 3D dataset
comprised of 65 nm voxels, with a spatial resolution of 150 nm. The emission from a 5.4
keV chromium source was focused onto the sample via capillary condenser lens and X-
ray transmission through the sample, measured at different specimen rotation angles, was
magnified using a Fresnel zone plate X-ray lens. The resulting image was further
magnified with a scintillator-coupled visible light objective, producing a signal that was
captured by a 16-bit CCD camera. As the sample rotated through 180°, 901 two-
dimensional X-ray radiographs were captured. The resulting computed tomography
radiograph acquisitions were reconstructed using a filtered back projection algorithm to
create a 3D dataset (Tkachuk et al. 2007).
4.2.2.2 FIB-SEM
Using the nano-XRM data to prescriptively navigate to a volume within the 65
µm pillar that required higher resolution imaging, a 22 µm x 22 µm x 10 µm volume was
imaged with FIB-SEM using 10 nm/voxel at 1.5 kV.

30
Table 4.1. Woodford Shale and Marcellus Shale samples’ location information.
Formation Name Woodford Marcellus
Well Latitude 36.794039 N 38.818654 N
Well Longitude 98.903786 W 80.169192 W
Sample Depth 1982 m 2390 m
Figure 4.1. Sample preparation with argon ion beam milling system.

31
Figure 4.2. Correlative micro-X-ray microscopy (micro-XRM), nano-X-ray
microscopy (nano-XRM), and focused ion beam scanning electron microscopy
(FIB-SEM) workflow for the Woodford Shale.
32
Figure 4.3. Schematic diagram illustrating the principles of operation of micro-X-
ray microscope (micro-XRM). Reprinted with permission from Carl Zeiss
Microscopy GmbH.

33
Figure 4.4. Schematic diagram illustrating the principles of operation of nano-X-
ray microscope (nano-XRM). Reprinted with permission from Carl Zeiss
Microscopy GmbH.
Figure 4.5. Sample preparation with laser ablation system (after Goral et
al. 2015b).

34
Figure 4.6. Correlative (micro and nano) X-ray microscopy (XRM) workflow for
the Woodford Shale.
Figure 4.7. Schematic diagram illustrating the principle of operation of focused ion
beam scanning electron microscope (FIB-SEM). Reprinted with permission from
Carl Zeiss Microscopy GmbH.

35
Figure 4.8. Correlative nano-X-ray microscope (nano-XRM) and focused ion beam
scanning electron microscopy (FIB-SEM) workflow for the Marcellus Shale.

CHAPTER 5
RESULTS AND DISCUSSION
5.1 Case Study I: The Woodford Shale
The Woodford Shale sample was observed to be anisotropic and heterogeneous
across a range of scales. Figures 5.1 and 5.2 provide scanning electron microscopy and
automated mineralogy and petrography images of the sample, respectively. SEM imaging
was performed in a SESI-EsB mode, so that grey levels on the flat shale surface vary
with mean atomic number and thus correlate with different mineral phases. In Figure 5.1,
black regions depict pores and micro-fractures, dark gray represents organic matter
(kerogen), gray is silicate (feldspar, clay, quartz), light gray is carbonate (dolomite), and
white objects are sulfide (pyrite). Figure 5.2 depicts a mineral and structural mosaic map
of the shale rock sample. The QEMSCAN analysis showed presence of feldspar (88.6%),
quartz (9.9%), dolomite (0.1%), and pyrite (1.4%) minerals. Both the SEM and
automated mineralogy and petrography highlight a wide range of pore sizes and material
properties without apparent spatial relationships within the specimen.
Shales exhibit microstructural and mineralogical heterogeneity over scales
ranging from millimeters to nanometers. Thus, a multiscale characterization approach is
required to provide a representative and uniquely informative perspective of sample
properties. Any imaging procedure must balance the dual requirements of providing

37
sufficient resolution to identify characteristic microstructural features while also ensuring
a sufficient characterization volume to represent the bulk microstructure. While X-ray
and focused ion beam scanning electron microscopy can provide detailed images of rock
matrix at the micro- and nanoscale, the high magnification required means that the total
volume of the rock imaged is small, and therefore the results can be statistically
questionable. It is thus very important to determine the sample volume size that must be
examined to understand the oil or gas reserves contained in a shale reservoir, as the small
features require a very high-resolution imaging system, which comes with limited field of
view (Fogden 2014, Guan et al. 2011, Shearing et al. 2009). The ability to conduct
imaging analysis over a variety of scales is therefore critical. However, establishing
locations where imaging should be carried out remains a challenge, overshadowed only
by the upscaling issues involved, when data are extrapolated to the reservoir-scale
(Hooghan 2014). When performing nanometer scale examination of shale samples, it is
important to consider the scale of the observation and the scale of interest. Image analysis
provides a visual appreciation of the pore network in shales but is not yet a statistically
valid method to evaluate shale oil and gas reservoirs (Chalmers et al. 2012). It is typical
that a micron-sized volume is imaged, whereas a target interval may be on the order of
kilometers. This unavoidably leads to concerns about taking representative samples and
upscaling (Silin and Kneafsey 2011). Thus, to use 3D pore structure for analysis and
simulation, the relative scale needs to be considered and intelligent volume selection, for
example with XRM, may play a pivotal role in this analysis.
Figure 5.3 presents XRM reconstruction results. All three models present shale
heterogeneity across different scales. Different features are seen in each of these models.

38
Figure 5.3a, made with micro-XRM (25 μm resolution), provides information about
larger features (e.g., microfractures). However, pores are not visible. In Figure 5.3b,
produced by micro-XRM at a higher resolution (2.5 μm resolution), some minerals start
to be visible (pores are still not visible). Figure 5.3c, made with nano-XRM at 150 nm
resolution, starts to resolve some of the bigger pores, but still the resolution is too low to
resolve all of them, and they are difficult to discriminate from organics with this method.
Within these volumes, several tiny pores were observed, barely discernable at the
best resolution of the XRM method. Although XRM images reveal the mineralized
structure of shale, they cannot fully resolve the pore network of the sample. However,
micro-XRM and nano-XRM were found to serve as a useful bridge from pore- to core-
scale, which may further be used for correlation of all of the scales and, ultimately, for
upscaling to the whole core and up to the entire reservoir.
The past decade has witnessed enormous advances in imaging software for image
processing and analysis and image-based modeling and simulation. Equipped with 3D
datasets from FIB-SEM, 3D digital rock models may be produced that represent the
sample volume. Proper segmentation is the key to generating a 3D porosity network, as
well as organic and mineral models. Segmentation is achieved by associating a phase
with a specific range of gray levels in the 3D dataset and rendering the images into 3D
block models (Figure 5.4). Visualizing the resulting models reveals the full detail of the
rock geometry and material composition, hence providing important guidance to
reconstruct real-world geometries, as well as templates for future simulation comparisons
(Goral and Miskovic 2015, Takhar and Zhang 2009, Vega 2013).

39
It should be noted that image analysis of 3D datasets is, in itself, a challenging
task as organic phases and pores may have similar gray levels. Porosity measurement has
been found to be very sensitive to the threshold value. Improper segmentation can lead,
for instance, to misidentification of organic material as pore space, resulting in
overestimation of porosity and permeability (Schluter et al. 2014).
A FIB-SEM reconstructed and segmented model (performed at the same location
as the nano-XRM) is better suited for investigation of the fine pore network structure.
Figures 5.5a and 5.5b depict 3D models of organic and mineral matter, respectively,
resulting from the FIB-SEM acquisition. A 3D pore network was then extracted to enable
microstructure modeling and further simulations performed (Figure 5.5c). Having these
high-resolution models, several important trends in the rock structure have been
identified. Pore size distribution is strongly anisotropic, as expected for shale, and imaged
porosity is equal to 1.56% (0.92% connected porosity). Segmentation of the Woodford
Shale images revealed 2.69% and 95.75% of presumably organic and mineral matter,
respectively. Note that the microcrack pores may be induced by coring or sample
preparation, and may not be an in-situ feature, which may have influenced the porosity
measurement.
5.1.1 Pore Network Modeling (PNM) in the Woodford Shale
Shale consists of organic and nonorganic (mineral) matter, and a variety of
nanometer- to micrometer-sized pores.
There are four different pore types identified within the present study:
• Intraparticle organic-matter-hosted pore (located within a single organic particle),

40
• Intraparticle nonorganic-matter-hosted pore (located within a single mineral
particle),
• Interparticle nonorganic-matter-hosted pore (located between mineral grains and
crystals), and
• Interparticle non/organic-matter-hosted pore (located at the interface of organic and
mineral phases).
An example of a 3D DRP model along with four main (organic and nonorganic)
pore types embedded within shale rock matrix can be found in Figure 5.6. Thus far, the
role of the pore network within this highly heterogeneous porous media is under
investigation and has been a subject of many recent studies.
In this study, we present two general approaches for pore network modeling. We
investigate both (non)organic-matter-hosted and (non)organic-matter-related pore
systems. The two approaches slightly differ from each other and depend on organic-
porosity interpretation. The first interpretation classifies organic-porosity as pores
surrounded by the organic matter, while the second interpretation, alternatively,
categorizes organic-porosity as pores attached to the organic matter. The reason for the
need of both approaches is that the origin of these pores is unknown.
5.1.1.1 Organic- and Nonorganic-Matter-Hosted Pore Network
Modeling (PNM in the Woodford Shale
From the 3D datasets, one can obtain an understanding of the 3D pore network, its
connectivity, and the location and distribution of organic and mineral phases. Therefore,
the pore network has been separated into pores associated with organic and mineral

41
matter. Only pores surrounded by organic matter are classified as an organic-matter-
hosted pore system. The remaining pores within the mineral matter and pores at the
interface of organic and mineral phases are classified as nonorganic-matter-hosted
porosity (Figure 5.7).
Estimated pore size (equivalent circular diameter) distribution showed that pores
are 22.76 nm to 658.11 nm in diameter for the organic-matter-hosted pore network, as
shown in Figure 5.8, and 19.89 nm to 1649.47 nm in diameter for the nonorganic-matter-
hosted pore system (Figure 5.9). Therefore, it has been shown that the organic-matter-
hosted pores are, in general, much smaller than the nonorganic-matter-hosted pores.
The resulting geometries of the organic-matter-hosted and nonorganic-matter-
hosted connected pore networks were then skeletonized to identify the level of
connectivity between pores and microcrack pores. The organic-matter-hosted and
nonorganic-matter-hosted connected pore network models are shown in Figure 5.10.
The porosity of the nonorganic-matter-hosted and organic-matter-hosted pore
systems is equal to 1.23% (0.81% effective porosity) and 0.33% (0% effective porosity),
respectively.
5.1.1.2 Organic- and Nonorganic-Matter-Related Pore Network
Modeling (PNM) in the Woodford Shale
Later in this study, the Woodford Shale FIB-SEM model was separated into two
regions, region I and region II, for comparison, eliminating a large microfracture through
the center of the imaged region, suspected to be due to coring or sample preparation
(Figure 5.11). Quantitative analysis of the 3D pore network models of a region I and

42
region II indicated a porosity of 0.66% and 0.55% for region I and region II, respectively,
showing reasonable agreement between the two regions and suggesting that each volume
was representative at the nanometer length scale. Percentages for each individual phase
of both regions are given in Table 5.1 and 5.2.
Further, the pore networks of both regions ware separated into pores associated
with organic and nonorganic phases (Figure 5.12 and 5.13). Alternatively to the previous
PNM classification, in this approach, any pore object adjacent to, or surrounded by,
organic matter is classified as an organic-matter-related pore network.
Quantitative volumetric analysis revealed that 99.45% of the pores within region I
and 81.53% of the pores within region II were connected to the organic phase, while the
remaining pores were classified as nonorganic-matter-related pores. The difference in the
organic-matter-related pore network fraction number between region I and region II
comes from the difference in organic content within both regions, where the organic
phase volume fraction accounted for 2.16% and 1.03% for region I and II, respectively.
5.2 Case Study II: The Marcellus Shale
Similar to the Woodford Shale, the Marcellus FIB-SEM dataset was processed,
segmented, and reconstructed, using the Avizo software, into five different phases (pores,
organic matter, silicate, carbonate, and sulfide) of the shale sample microstructure. The
3D reconstructions of organic and nonorganic matter are shown in the segmented images
in Figure 5.14a and 5.14b, respectively. The 3D renderings of the shale volume
reconstructed from serial-sectioning and imaging allow for quantitative analysis (voxel
counts) of each phase volume and pore connectivity across the volume. The analysis

43
revealed 95.24% nonorganic content within the specimen. Organic content in this sample
is relatively high at 2.32%. Quantitative analysis of the segmented 3D pore system image
(Figure 5.14c) indicates a porosity of 2.44% with 1.12% of that being connected (Figure
5.14d). Volume fractions for each individual phase of the Marcellus Shale sample from
the FIB-SEM study area are given in Table 5.3.
5.2.1 Pore Network Modeling (PNM) in the Marcellus Shale
5.2.1.1 Organic- and Nonorganic-Matter-Hosted Pore Network
Modeling (PNM) in the Marcellus Shale
The same as in the case of the Woodford Shale, porosity in the Marcellus Shale
sample was observed to be prevalent in either the organic matter or the mineral matrix.
Therefore, first, the pore network was separated into organic-matter-hosted and
nonorganic-matter-hosted pores (Figure 5.15).
Similar to the Woodford Shale, it has been shown that the organic-matter-hosted
pores are, in general, much smaller than the nonorganic-matter-hosted pores. Pores are
measured to be approximately 22.55 nm to 438.88 nm in diameter for the organic-matter-
hosted pore network, as shown in Figure 5.16, and 12.41 nm to 4324.53 nm in diameter
for the nonorganic-matter-hosted pore system (Figure 5.17).
The resulting geometries of the organic-matter-hosted and nonorganic-matter-
hosted connected pore networks were then skeletonized to identify the level of
connectivity between pores and microcrack pores. The organic-matter-hosted and
nonorganic-matter-hosted connected pore network models are shown in Figure 5.18.

44
The porosity of the nonorganic-matter-hosted and organic-matter-hosted pore
systems are equal to 2.42% (0.93% connected porosity) and 0.02% (0% connected
porosity), respectively.
5.2.1.2 Organic- and Nonorganic-Matter-Related Pore Network
Modeling (PNM) in the Marcellus Shale
Subsequently, the pore network is separated into pores associated with organic
and nonorganic phases, namely organic- and nonorganic-matter-related porosity (Figure
5.19). Any pore object adjacent to, or surrounded by, organic matter is classified as an
organic-matter-related pore network.
Quantitative analysis indicates organic-matter-related porosity of 1.93%, and
nonorganic-matter-related porosity of 0.51%.
5.3 Woodford Shale vs. Marcellus Shale Reservoir Pore System
The pore network modeling study has shown that both the Woodford Shale and
the Marcellus Shale consist of intraparticle organic- and nonorganic-matter-hosted pores,
interparticle nonorganic (mineral) pores, and pores located at the interface of organic and
mineral phases (interparticle non/organic-matter-hosted pores).
The results suggest that pores developed at the interface of organic and mineral
phases strongly dominate over any other pore types within both the Woodford Shale and
the Marcellus Shale FIB-SEM models. Interparticle non/organic-matter-hosted pore
network has been demonstrated to have the potential for better connectivity than
intraparticle organic- and nonorganic-matter-hosted pore systems.

45
Discontinuous pore networks, characterized by a large number of isolated pores,
present a tremendous challenge for hydrocarbons production, as they are not effectively
connected with existing natural or hydraulic fractures. This study, somehow, opens a
door to more detailed study on three-dimensional heterogeneous shale reservoir pore
systems, their connectivity, and their relationship with oil and gas production
mechanisms.
Note that other shale-dominated formations will have their own characteristic
pore systems and those pore networks may actually vary spatially within any shale
reservoir. It is debatable whether the small volumes investigated in this thesis constitute a
representative elementary volume (REV), but this is beyond the scope of this study,
requiring much more detailed characterization of heterogeneity at all scales of the shale
samples than is attempted here.
5.4 Image to Simulation Workflow for Continuum and Non-Continuum Transport
Phenomena in Heterogeneous Shale Reservoir Pore Systems
Shale reservoir pore systems are strong modifiers of sedimentary basin fluid
dynamics and have a critical role in the distribution of hydrocarbons and containments of
injected fluids (Bustin et al. 2008). Understanding the multiscale transport mechanisms
between both organic and nonorganic pores and relatively larger fracture systems is of
great importance for accurate predictions of hydrocarbon storage capacity and recovery
rates (Chen et al. 2013, Shi et al. 2013, Solano 2014). It is well recognized that flow and
transport processes in unconventional oil and gas reservoirs must be studied across
multiple scales, and reservoir-scale simulations need to account for the impact of small-

46
scale heterogeneity (Geiger et al. 2012). In shale oil and gas reservoirs, the transport
mechanism does not only follow the continuum Darcy’s fluid flow equation, widely
applied for conventional reservoirs (Alharthy et al. 2012, Amann-Hildenbrand et al.
2012, Collell et al. 2015, Darabi et al. 2012, Javadpour et al. 2007, Pathak et al. 2015b,
Zhai et al. 2014). To describe the transport phenomena in ultra-tight porous media more
accurately, a combination of continuum as well as non-continuum fluid flow modeling
and simulation is required (Xia et al. 2017).
Having the representative shale reservoir pore systems, identified with X-ray and
electron microscopy, we can now transform these pore networks into finite element
models for any further continuum and non-continuum fluid flow modeling and simulation
studies.
5.4.1 A Workflow for Continuum Fluid Flow in Heterogeneous
Shale Reservoir Pore Systems
Large portions of connected pores and fractures from the volume shown in Figure
5.5d have been isolated as a network and can be further examined for continuum (e.g.,
fracture) flow properties. Therefore, the 3D geometry of the Woodford Shale’s
pore/fracture network was meshed to a tetrahedron volume mesh. The mesh was further
simplified to reduce the computational cost of further simulation. The mesh resulted in
113,910 cells with mean edge length of 130 nm (Figure 5.20).

47
5.4.2 A Workflow for Non-Continuum Fluid Flow in Heterogeneous
Shale Reservoir Pore Systems
A critical step in performing non-continuum (e.g., pore) fluid flow simulation is
identification and extraction of a representative ROI. Due to the structural complexity
and high level of detail of the reconstructed sample, as well as extremely high
computational costs, fluid flow modeling and simulation over the entire pore network
model is not practical. To overcome this limitation and provide a viable domain for
numerical simulation, a box with dimensions of 1 µm x 1 µm x 2 µm is selected from the
FIB-SEM model of the Woodford Shale.
Importantly, having the information regarding nonorganic/organic content
surrounding pore geometries, as shown in Figure 5.21, we can adequately assign
boundary condition properties to realistically reflect the subsurface reservoir conditions
that may significantly affect, for example, fluid-rock interaction.
Next, the pore geometry of the Woodford Shale is meshed to a tetrahedron
volume mesh. The mesh resulted in 40,000 cells, for pore network, with mean edge
length of 20 nm. Table 5.4 provides meshed three-phase (pore network, organic matter,
and nonorganic matter) 1 µm x 1 µm x 2 µm ROI of the Woodford Shale rock sample.
The presented image-to-simulation framework provides a viable tool for
discretization and modeling of complex nanoscopic features identified using XRM and
FIB-SEM. Structural information generated using this approach may be further utilized as
a high-fidelity computational domain for studies of multiscale transport phenomena in
heterogeneous petroleum geomaterials.

48
Table 5.1. Phase separation and quantification of the focused ion beam scanning electron
microscopy (FIB-SEM) model of the Woodford Shale of the region I.
Phase Fraction
Pore Network 0.66%
Organic Matter 2.16%
Nonorganic
Matter
Silicate 91.66%
Carbonate 5.17%
Sulfide 0.35%

49
Table 5.2. Phase separation and quantification of the focused ion beam scanning electron
microscopy (FIB-SEM) model of the Woodford Shale of the region II.
Phase Fraction
Pore Network 0.53%
Organic Matter 1.03%
Nonorganic
Matter
Silicate 90.57%
Carbonate 7.34%
Sulfide 0.53%

50
Table 5.3. Phase separation and quantification of the focused ion beam scanning electron
microscopy (FIB-SEM) model of the Marcellus Shale.
Phase Fraction
Pore Network 2.44%
Organic Matter 2.32%
Nonorganic
Matter
Silicate 83.06%
Carbonate 10.96%
Sulfide 1.22%

51
Table 5.4. Tetrahedron volume mesh of the pore network, organic matter, and nonorganic
matter.
Phase Tetrahedron Volume Mesh
Pore Network
Organic Matter
Nonorganic Matter

52
Figure 5.1. Scanning electron microscopy (SEM) image of the Woodford Shale.
Figure 5.2. Automated mineralogy and petrography (A) 10 um resolution and (B)
2 um resolution mosaic image of the Woodford Shale.

53
Figure 5.3. (A) 25-mm diameter micro-XRM (25 um resolution), (B) 2.5-mm
diameter micro-XRM (2.5 um resolution), and (C) 65-m diameter nano-XRM
(150 nm resolution) models of the Woodford Shale.
Figure 5.4. From image processing and segmentation, through model
reconstruction and visualization, to pore network modeling workflow (red color
indicates segmented pores and microfractures).
A) B) C)

54
Figure 5.5. Focused ion beam scanning electron microscopy (FIB-SEM) model of
(A) organic matter, (B) nonorganic matter, and (C) pore network (gray – total pores
and microfractures, black – organic matter, green – silicate, blue – carbonate,
yellow – sulfide) within the Woodford Shale.
A)
B)
C)

55
Figure 5.6. Pore types within 5 μm3 shale rock matrix: (a) intraparticle organic-
matter-hosted pore located within single organic particle, (b) intraparticle
nonorganic-matter-hosted pore located within single mineral particle, (c)
interparticle nonorganic-matter-hosted pore located between mineral grains and
crystals, and (d) interparticle non/organic-matter-hosted pore located at the
interface of organic and mineral phases (gray – pores, black – organic matter, green
– silicate, blue – carbonate, yellow – sulfide).

56
Figure 5.7. Pore network separation into organic-matter-hosted pores and
nonorganic-matter-hosted pores (gray – total pore network, red – organic-matter-
hosted pores, green – nonorganic-matter-hosted pores) within the Woodford Shale.
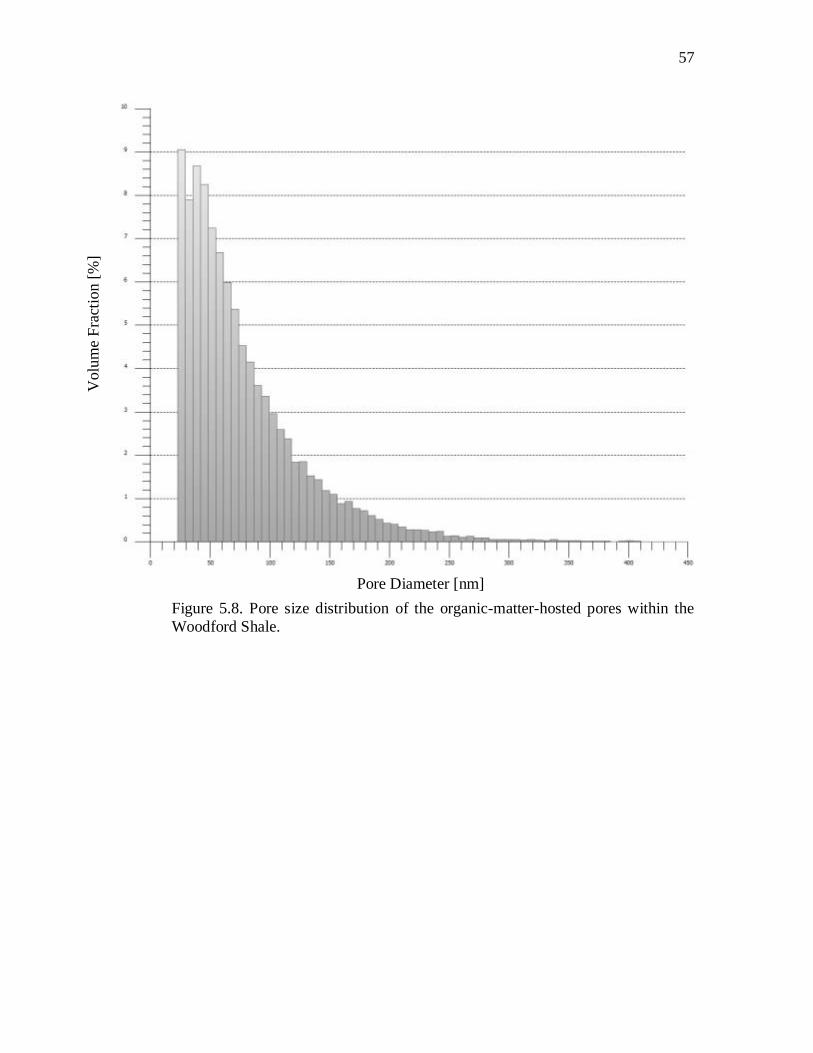
57
Figure 5.8. Pore size distribution of the organic-matter-hosted pores within the
Woodford Shale.
Pore Diameter [nm]
Volu
me
Fra
ctio
n [
%]

58
Figure 5.9. Pore size distribution of the nonorganic-matter-hosted pores within the
Woodford Shale.
Pore Diameter [nm]
Volu
me
Fra
ctio
n [
%]

59
Figure 5.10. Connected pore network model of organic-matter-hosted and
nonorganic-matter-hosted pores (red – organic-matter-hosted pores, green –
nonorganic-matter-hosted pores) within the Woodford Shale.
No Connected Pores

60
Figure 5.11. Focused ion beam scanning electron microscopy (FIB-SEM) model
of the Woodford Shale divided into (A) region I and (B) region II (gray – pore
network, black – organic matter, green – silicate, blue – carbonate, yellow –
sulfide).
A) B)

61
Figure 5.12. Pore network separation into organic-matter-related and nonorganic-
matter-related pore network within the Woodford Shale in the region I (gray – total
pore network, red – organic-matter-related pore network, green – nonorganic-
matter-related pore network).
Figure 5.13. Pore network separation into organic-matter-related and nonorganic-
matter-related pore network within the Woodford Shale in the region II (gray –
total pore network, red – organic-matter-related pore network, green – nonorganic-
matter-related pore network).

62
Figure 5.14. Focused ion beam scanning electron microscopy (FIB-SEM) model
of (A) organic matter, (B) nonorganic matter, (C) total pore network, and (D)
connected pore network (gray – total pores and microfractures, orange – connected
pores and microfractures, black – organic matter, green – silicate, blue – carbonate,
yellow – sulfide) within the Marcellus Shale.
A) B)
C)
D)

63
Figure 5.15. Pore network separation into organic-matter-hosted pores and
nonorganic-matter-hosted pores (gray – total pore network, red – organic-matter-
hosted pores, green – nonorganic-matter-hosted pores) within the Marcellus Shale.

64
Figure 5.16. Pore size distribution of the organic-matter-hosted pores within the
Marcellus Shale.
Figure 5.17. Pore size distribution of the nonorganic-matter-hosted pores within
the Marcellus Shale.
Pore Diameter [nm]
Pore Diameter [nm]
Volu
me
Fra
ctio
n [
%]
Volu
me
Fra
ctio
n [
%]

65
Figure 5.18. Connected pore network model of organic-matter-hosted and
nonorganic-matter-hosted pores (red – organic-matter-hosted pores, green –
nonorganic-matter-hosted pores) within the Marcellus Shale.
No Connected Pores

66
Figure 5.19. Pore network separation into organic-matter-related pores and
nonorganic-matter-related pores (gray – total pore network, red – organic-matter-
related pores, green – nonorganic-matter-related pores) within the Marcellus Shale.

67
Figure 5.20. Tetrahedron volume mesh of the pore/fracture network.
Figure 5.21. Three-phase (pore network, organic matter, and nonorganic matter) 1
µm x 1 µm x 2 µm region of interest (ROI) of the FIB-SEM model of the Woodford
Shale.

CHAPTER 6
CONCLUSIONS
In recent years, the development of shale reservoirs has attracted wide attention
from the international energy industry. Increased interest in shale reservoir characterization
has sparked development of novel approaches to reservoir analysis, incorporating many
modern imaging instruments and powerful modeling, simulation, and visualization
techniques. Because the success of unconventional oil and gas development is highly
dependent on understanding the effect of matrix morphology and its properties on transport
phenomena over multiple scales in the shale reservoirs, core measurements should occur
at the front end of formation evaluation.
In this study, an investigation has been performed on heterogeneous shale rock
matrix using samples from the Woodford Shale and the Marcellus Shale.
• Correlative micro-X-ray microscopy (micro-XRM), nano-X-ray microscopy
(nano-XRM), and focused ion beam scanning electron microscopy (FIB-SEM)
multiscale scientific digital imaging and digital rock physics workflow has been
shown to be a powerful characterization technique for heterogeneous shale
geomaterials. A comparison of the multiscale (micro-XRM, nano-XRM, and FIB-
SEM) models suggests that no single method can fully capture the highly variable
and complex nature of these rocks.

69
• In this study, there are two general approaches for pore network modeling
presented. Both (non)organic-matter-hosted and (non)organic-matter-related pore
systems were investigated. The PNM study has shown that both the Woodford
Shale and the Marcellus Shale consist of intraparticle organic- and nonorganic-
matter-hosted pores, interparticle nonorganic (mineral) pores, and pores located at
the interface of organic and mineral phases (interparticle non/organic-matter-hosted
pores). The results suggest that pores developed at the interface of organic and
mineral phases strongly dominate over any other pore types within both the
Woodford Shale and the Marcellus Shale FIB-SEM models. Interparticle
non/organic-matter-hosted pore network has been demonstrated to have the
potential for better connectivity than intraparticle organic- and nonorganic-matter-
hosted pore systems. This study opens a door to more detailed study on three-
dimensional heterogeneous shale reservoir pore systems, their connectivity, and
their relationship with oil and gas production mechanisms. These problems will be
addressed in future works.
• In this study, an image-to-simulation framework is also presented that provides a
viable tool for finite element mesh generation of complex pore/fracture networks,
identified using XRM and FIB-SEM, for any further modeling and simulation of
continuum or non-continuum fluid flow in heterogeneous petroleum geomaterials.

REFERENCES
Alharthy, N. S., Al Kobaisi, M., Kazemi, H., & Graves, R. M. (2012, January).
Physics and modeling of gas flow in shale reservoirs. In Abu Dhabi International
Petroleum Conference and Exhibition. Society of Petroleum Engineers.
Alqahtani, A. A., & Tutuncu, A. N. (2014, August). Quantification of total
organic carbon content in shale source rocks: An Eagle Ford case study.
In Unconventional Resources Technology Conference, Denver, Colorado, 25-27 August
2014 (pp. 382-398). Society of Exploration Geophysicists, American Association of
Petroleum Geologists, Society of Petroleum Engineers.
Amann-Hildenbrand, A., Ghanizadeh, A., & Krooss, B. M. (2012). Transport
properties of unconventional gas systems. Marine and Petroleum Geology, 31(1), 90-99.
Ambrose, R. J., Hartman, R. C., Diaz Campos, M., Akkutlu, I. Y., & Sondergeld,
C. (2010, January). New pore-scale considerations for shale gas in place calculations.
In SPE Unconventional Gas Conference. Society of Petroleum Engineers.
Ambrose, R. J., Hartman, R. C., Diaz-Campos, M., Akkutlu, I. Y., & Sondergeld,
C. H. (2012). Shale gas-in-place calculations part I: New pore-scale considerations. SPE
Journal, 17(01), 219-229.
Aplin, A. C., & Macquaker, J. H. (2011). Mudstone diversity: Origin and
implications for source, seal, and reservoir properties in petroleum systems. AAPG
Bulletin, 95(12), 2031-2059.
Bai, M. (2011, January). Improved understanding of stimulating tight shale gas
reservoirs. In SPE Production and Operations Symposium. Society of Petroleum
Engineers.
Bin, B., Rukai, Z., Songtao, W., Wenjing, Y. A. N. G., Gelb, J., Gu, A., ... &
Ling, S. U. (2013). Multi-scale method of Nano (Micro)-CT study on microscopic pore
structure of tight sandstone of Yanchang Formation, Ordos Basin. Petroleum Exploration
and Development, 40(3), 354-358.
Bertoncello, A., & Honarpour, M. M. (2013, September). Standards for
characterization of rock properties in unconventional reservoirs: Fluid flow mechanism,
quality control, and uncertainties. In SPE Annual Technical Conference and Exhibition.
Society of Petroleum Engineers.

71
Blunt, M. J., Bijeljic, B., Dong, H., Gharbi, O., Iglauer, S., Mostaghimi, P., ... &
Pentland, C. (2013). Pore-scale imaging and modelling. Advances in Water
Resources, 51, 197-216.
Bruner, K. R. (2011). A comparative study of the Mississippian Barnett shale,
Fort Worth basin, and Devonian Marcellus shale, Appalachian basin. DOE/NETL-
2011/1478
Bustin, R. M., Bustin, A. M., Cui, A., Ross, D., & Pathi, V. M. (2008, January).
Impact of shale properties on pore structure and storage characteristics. In SPE Shale Gas
Production Conference. Society of Petroleum Engineers.
Cardott, B. J. (2012). Thermal maturity of Woodford Shale gas and oil plays,
Oklahoma, USA. International Journal of Coal Geology, 103, 109-119.
Chalmers, G. R., Bustin, R. M., & Power, I. M. (2012). Characterization of gas
shale pore systems by porosimetry, pycnometry, surface area, and field emission
scanning electron microscopy/transmission electron microscopy image analyses:
Examples from the Barnett, Woodford, Haynesville, Marcellus, and Doig units. AAPG
Bulletin, 96(6), 1099-1119.
Chen, C., Hu, D., Westacott, D., & Loveless, D. (2013). Nanometer‐scale
characterization of microscopic pores in shale kerogen by image analysis and pore‐scale
modeling. Geochemistry, Geophysics, Geosystems, 14(10), 4066-4075.
Chen, R., Sharma, S., Bank, T., Soeder, D., & Eastman, H. (2015). Comparison of
isotopic and geochemical characteristics of sediments from a gas-and liquids-prone wells
in Marcellus shale from Appalachian Basin, West Virginia. Applied Geochemistry, 60,
59-71.
Collell, J., Galliero, G., Vermorel, R., Ungerer, P., Yiannourakou, M., Montel, F.,
& Pujol, M. (2015). Transport of multicomponent hydrocarbon mixtures in shale organic
matter by molecular simulations. The Journal of Physical Chemistry C, 119(39), 22587-
22595.
Curtis, M. E., Ambrose, R. J., & Sondergeld, C. H. (2010, January). Structural
characterization of gas shales on the micro-and nano-scales. In Canadian Unconventional
Resources and International Petroleum Conference. Society of Petroleum Engineers.
Curtis, M. E., Ambrose, R. J., Sondergeld, C. H., & Rai, C. S. (2011, January).
Investigation of the relationship between organic porosity and thermal maturity in the
Marcellus Shale. In North American Unconventional Gas Conference and Exhibition.
Society of Petroleum Engineers.
Curtis, M. E., Sondergeld, C. H., Ambrose, R. J., & Rai, C. S. (2012).
Microstructural investigation of gas shales in two and three dimensions using nanometer-
scale resolution imaging. AAPG Bulletin, 96(4), 665-677.

72
Curtis, M. (2014). Mapping of organic matter distribution in shales on the
centimeter scale with nanometer resolution. Unconventional Resources Technology
Conference (URTEC).
Darabi, H., Ettehad, A., Javadpour, F., & Sepehrnoori, K. (2012). Gas flow in ultra-
tight shale strata. Journal of Fluid Mechanics, 710, 641.
Dewers, T. A., Heath, J., Ewy, R., & Duranti, L. (2012). Three-dimensional pore
networks and transport properties of a shale gas formation determined from focused ion
beam serial imaging. International Journal of Oil, Gas and Coal Technology, 5(2-3), 229-
248.
Ding, W., Li, C., Li, C., Xu, C., Jiu, K., Zeng, W., & Wu, L. (2012). Fracture
development in shale and its relationship to gas accumulation. Geoscience Frontiers, 3(1),
97-105.
Fogden, A., McKay, T., Turner, M., Marathe, R., & Senden, T. (2014, August).
Micro-CT analysis of pores and organics in unconventionals using novel contrast
strategies. In Unconventional Resources Technology Conference, Denver, Colorado, 25-
27 August 2014 (pp. 960-969). Society of Exploration Geophysicists, American
Association of Petroleum Geologists, Society of Petroleum Engineers.
Geiger, S., Schmid, K. S., & Zaretskiy, Y. (2012). Mathematical analysis and
numerical simulation of multi-phase multi-component flow in heterogeneous porous
media. Current Opinion in Colloid & Interface Science, 17(3), 147-155.
Gelb, J., Gu, A., Fong, T., Hunter, L., Lau, S. H., & Yun, W. (2011, September).
A closer look at shale: Representative elementary volume analysis with laboratory 3D X-
Ray computed microtomography and nanotomography. International Symposium of the
Society of Core Analysts.
Gelb, J., Roth, S., Dong, H., Li, D., Gu, A., Yun, S., & Yun, W. (2012). Non-
destructive local X-ray tomography for multi-length scale analysis of reservoir rocks:
Validations and observations. International Symposium of the Society of Core Analysts.
Goldstein, J.I., Newbury, D.E., Echlin, P., Joy, D.C., Fiori, C., & Lifshin, E.
(1981). Scanning electron microscopy and X-ray microanalysis. A text for biologists,
materials scientists, and geologists. Plenum Publishing Corporation.
Goral, J., & Miskovic, I. (2015). A workflow for multi-scale modeling and
simulation of transport phenomena in Woodford Shale rock matrix. Unconventional
Resources Technology Conference (URTEC).
Goral, J., Miskovic, I., Gelb, J., & Kasahara, J. (2015a, November). Pore network
investigation in Marcellus Shale rock matrix. In SPE Asia Pacific Unconventional
Resources Conference and Exhibition. Society of Petroleum Engineers.

73
Goral, J., Miskovic, I., Gelb, J., & Andrew, M. (2015b, December). Correlative
XRM and FIB-SEM for non/organic pore network modeling in Woodford Shale rock
matrix. In International Petroleum Technology Conference. International Petroleum
Technology Conference.
Goral, J., Miskovic, I., Gelb, J., & Marsh, M. (2016). Correlative X-ray and electron
microscopy for multi-scale characterization of heterogeneous shale reservoir pore systems. AAPG Memoir, 112, 77–88.
Guan, Y., Li, W., Gong, Y., Liu, G., Zhang, X., Chen, J., ... & Wang, H. (2011).
Analysis of the three-dimensional microstructure of a solid-oxide fuel cell anode using
nano X-ray tomography. Journal of Power Sources, 196(4), 1915-1919.
Heath, J. E., Dewers, T. A., McPherson, B. J., Petrusak, R., Chidsey, T. C.,
Rinehart, A. J., & Mozley, P. S. (2011). Pore networks in continental and marine
mudstones: Characteristics and controls on sealing behavior. Geosphere, 7(2), 429-454.
Herman, G. T. (2009). Fundamentals of computerized tomography: Image
reconstruction from projections. Springer Science & Business Media.
Hooghan, K. N. (2014). Protocol for finalizing locations for FIB/SEM cubes on
shale samples: General guidelines with up scaling in mind. Unconventional ResourcesTechnology Conference (URTEC).
Huang, J., Cavanaugh, T., & Nur, B. (2013). 1 An introduction to SEM
operational principles and geologic applications for shale hydrocarbon reservoirs. AAPG Memoir, 102, 1–6.
Hyne, N. J. (2012). Nontechnical guide to petroleum geology, exploration,
drilling, and production. PennWell Books.
Javadpour, F., Fisher, D., & Unsworth, M. (2007). Nanoscale gas flow in shale
gas sediments. Journal of Canadian Petroleum Technology, 46(10).
King, G. E. (2012, January). Hydraulic fracturing 101: What every representative,
environmentalist, regulator, reporter, investor, university researcher, neighbor and
engineer should know about estimating frac risk and improving frac performance in
unconventional gas and oil wells. In SPE Hydraulic Fracturing Technology Conference.
Society of Petroleum Engineers.
Knackstedt, M., Golab, A., & Riepe, L. (2012, June). Petrophysical
characterization of unconventional reservoir core at multiple scales. In SPWLA 53rd
Annual Logging Symposium. Society of Petrophysicists and Well-Log Analysts.
Lemmens, H. J., Butcher, A. R., & Botha, P. W. S. K. (2011). FIB/SEM and
SEM/EDX: Anew dawn for the SEM in the core lab?. Petrophysics, 52(06), 452-456.

74
Lopez, O., Mock, A., Øren, P. E., Long, H., Kalam, Z., Vahrenkamp, V., ... & Al
Hosni, H. (2012, August). Validation of fundamental carbonate reservoir core properties
using digital rock physics. In International Symposium of the Society of Core Analysts,
SCA2012-19.
Loucks, R. G., Reed, R. M., Ruppel, S. C., & Jarvie, D. M. (2009). Morphology,
genesis, and distribution of nanometer-scale pores in siliceous mudstones of the
Mississippian Barnett Shale. Journal of Sedimentary Research, 79(12), 848-861.
Loucks, R. G., Reed, R. M., Ruppel, S. C., & Hammes, U. (2010). Preliminary
classification of matrix pores in mudrocks. Gulf Coast Association of Geological Societies Transactions, 60, 435-441.
Loucks, R. G., Reed, R. M., Ruppel, S. C., & Hammes, U. (2012). Spectrum of
pore types and networks in mudrocks and a descriptive classification for matrix-related
mudrock pores. AAPG Bulletin, 96(6), 1071-1098.
Lu, J., Ruppel, S. C., & Rowe, H. D. (2015). Organic matter pores and oil
generation in the Tuscaloosa marine shale. AAPG Bulletin, 99(2), 333-357.
Ma, Y. Z., & Holditch, S. (2015). Unconventional oil and gas resources
handbook: Evaluation and development. Gulf Professional Publishing.
Merkle, A. P., & Gelb, J. (2013). The ascent of 3D X-ray microscopy in the
laboratory. Microscopy Today, 21(02), 10-15.
Merkle, A. P., Gelb, J., Orchowski, A., & Fuchs, J. (2014). X-ray microscopy:
The cornerstone for correlative characterization methods in materials research and life
science. Microscopy and Microanalysis, 20(S3), 986-987.
Milliken, K. L., Rudnicki, M., Awwiller, D. N., & Zhang, T. (2013). Organic
matter–hosted pore system, Marcellus formation (Devonian), Pennsylvania. AAPG
Bulletin, 97(2), 177-200.
Nadimi, S. (2015). State-based peridynamics simulation of hydraulic fracture
phenomenon in geological media (The University of Utah).
Nadimi, S., Miscovic, I., & McLennan, J. (2016). A 3D peridynamic simulation
of hydraulic fracture process in a heterogeneous medium. Journal of Petroleum Science
and Engineering, 145, 444-452.
Nelson, P. H. (2009). Pore-throat sizes in sandstones, tight sandstones, and
shales. AAPG Bulletin, 93(3), 329-340.
Lønøy, A. (2006). Making sense of carbonate pore systems. AAPG Bulletin, 90(9),
1381-1405.

75
Pathak, M., Deo, M. D., Panja, P., & Levey, R. A. (2015, October). The effect of
kerogen-hydrocarbons interaction on the pvt properties in liquid rich shale plays. InSPE/CSUR Unconventional Resources Conference. Society of Petroleum Engineers.
Pathak, M., Pawar, G., Huang, H., & Deo, M. D. (2015, November). Carbon
dioxide sequestration and hydrocarbons recovery in the gas rich shales: An insight from
the molecular dynamics simulations. In Carbon Management Technology Conference.
Carbon Management Technology Conference.
Pathak, M., Panja, P., Levey, R., & Deo, M. (2017). Effect of the presence of
organic matter on bubble points of oils in shales. AIChE Journal, 63, 3083-3095.
Pathak, M., Cho, H., & Deo, M. (2017). Experimental and molecular modeling
study of bubble points of hydrocarbon mixtures in nanoporous media. Energy &
Fuels, 31(4), 3427-3435.
Pommer, M., & Milliken, K. (2015). Pore types and pore-size distributions across
thermal maturity, Eagle Ford Formation, southern Texas. AAPG Bulletin, 99(9), 1713-
1744.
Saraji, S. (2014). High-resolution three-dimensional characterization of pore
networks in shale reservoir rocks. Unconventional Resources Technology Conference
(URTEC).
Schlüter, S., Sheppard, A., Brown, K., & Wildenschild, D. (2014). Image
processing of multiphase images obtained via X‐ray microtomography: A review. Water
Resources Research, 50(4), 3615-3639.
Shearing, P. R., Golbert, J., Chater, R. J., & Brandon, N. P. (2009). 3D
reconstruction of SOFC anodes using a focused ion beam lift-out technique. Chemical
Engineering Science, 64(17), 3928-3933.
Shi, J., Zhang, L., Li, Y., Yu, W., He, X., Liu, N., ... & Wang, T. (2013,
November). Diffusion and flow mechanisms of shale gas through matrix pores and gas
production forecasting. In SPE Unconventional Resources Conference Canada. Society
of Petroleum Engineers.
Solano, N. A., Krause, F. F., & Clarkson, C. R. (2014, August). Characterization
of cm-scale heterogeneities in a tight oil reservoir using X-ray computed tomography, profile permeability measurements and 3-D image analysis. In Unconventional Resources Technology Conference, Denver, Colorado, 25-27 August 2014 (pp. 1057- 1062). Society of Exploration Geophysicists, American Association of Petroleum Geologists, Society of Petroleum Engineers.
Passey, Q. R., Bohacs, K., Esch, W. L., Klimentidis, R., & Sinha, S. (2010,
January). From oil-prone source rock to gas-producing shale reservoir-geologic and
petrophysical characterization of unconventional shale gas reservoirs. In International oil
and gas conference and exhibition in China. Society of Petroleum Engineers.

76
Takhar, P. S., & Zhang, S. (2009). Drying of corn kernels: From experimental
images to multiscale multiphysics modeling. In Proc. of the COMSOL Conf., Boston.
Tkachuk, A., Duewer, F., Cui, H., Feser, M., Wang, S., & Yun, W. (2007). X-ray
computed tomography in Zernike phase contrast mode at 8 keV with 50-nm resolution
using Cu rotating anode X-ray source. Zeitschrift für Kristallographie-Crystalline
Materials, 222(11/2007), 650-655.
Tono, H. (2008). Computing properties from 3-D imaging. Hart's E & P, 81(11),
100-101.
Outlook, A. E. (2010). Energy information administration. Department of
Energy, 92010(9), 1-15.
Vega, B., Andrews, J. C., Liu, Y., Gelb, J., & Kovscek, A. (2013, August).
Nanoscale visualization of gas shale pore and textural features. In Unconventional
resources technology conference (pp. 1603-1613). Society of Exploration Geophysicists,
American Association of Petroleum Geologists, Society of Petroleum Engineers.
Wang, C., Chen, Z., Yao, J., Sun, H., Yang, Y., & Wu, K. (2014, August).
Organic and inorganic pore structure analysis in shale matrix with superposition method.
In Unconventional Resources Technology Conference, Denver, Colorado, 25-27 August
2014 (pp. 1079-1084). Society of Exploration Geophysicists, American Association of
Petroleum Geologists, Society of Petroleum Engineers.
Waters, G. A., Lewis, R. E., & Bentley, D. (2011, January). The effect of
mechanical properties anisotropy in the generation of hydraulic fractures in organic
shales. In SPE Annual Technical Conference and Exhibition. Society of Petroleum
Engineers.
Weng, X., Cohen, C. E., & Kresse, O. (2015). Impact of preexisting natural fractures on hydraulic fracture simulation. In Y.Z. Ma and S. A. Holditch, eds., Unconventional Oil and Gas Resources Handbook: Evaluation and Development, 289.
Xia, Y., Goral, J., Huang, H., Miskovic, I., Meakin, P., & Deo, M. (2017). Many-
body dissipative particle dynamics modeling of fluid flow in fine-grained nanoporous
shales. Physics of Fluids, 29(5), 056601.
Zagorski, W. A., Wrightstone, G. R., & Bowman, D. C. (2012). The Appalachian
Basin Marcellus gas play: Its history of development, geologic controls on production,
and future potential as a world-class reservoir, in J. A. Breyer, ed., Shale reservoirs
—Giant resources for the 21st century. AAPG Memoir, 97, 172–200.
Silin, D. B., & Kneafsey, T. J. (2011, January). Gas shale: From nanometer-scale
observations to well modeling. In Canadian Unconventional Resources Conference.
Society of Petroleum Engineers.

77
Zhang, S., Maestra, F. D., Combaret, N., Klimentidis, R., Barthelemy, P., Albou,
R., & Bernard, D. (2011, March). The analysis and simulation of rock properties using
FIBSEM and Virtual Material Studio. In NAFEMS World Congress 2011 (pp. 22-26).
Zhai, Z., Wang, X., Jin, X., Sun, L., Li, J., & Cao, D. (2014). Adsorption and
diffusion of shale gas reservoirs in modeled clay minerals at different geological
depths. Energy & Fuels, 28(12), 7467-7473.
Top Related