


Languages
Pages
Legal

Developmental Biology 321 (2008) 319–330
Contents lists available at ScienceDirect
Developmental Biology
j ourna l homepage: www.e lsev ie r.com/deve lopmenta lb io logy
Limb bud and flank mesoderm have distinct “physical phenotypes” that maycontribute to limb budding
Brooke J. Damon a,1, Nadejda V. Mezentseva b,1, Jaliya S. Kumaratilake b,c,Gabor Forgacs a,d,⁎, Stuart A. Newman b,⁎a Department of Physics and Astronomy, University of Missouri-Columbia, Columbia, MO 65211, USAb Department of Cell Biology and Anatomy, New York Medical College, Valhalla, NY 10595. USAc Discipline of Anatomical Sciences, University of Adelaide, Adelaide, SA 5005, Australiad Department of Biological Sciences, University of Missouri-Columbia, Columbia, MO 65211, USA
⁎ Corresponding authors. G. Forgacs is to be contactedAstronomy, University of Missouri-Columbia, Columbia
E-mail addresses: [email protected] (G. Forgacs(S.A. Newman).
1 These authors contributed equally to this work.
0012-1606/$ – see front matter © 2008 Elsevier Inc. Aldoi:10.1016/j.ydbio.2008.06.018
a b s t r a c t
a r t i c l e i n f oArticle history:
Limb bud outgrowth in ch Received for publication 17 October 2007Revised 9 May 2008Accepted 4 June 2008Available online 20 June 2008Keywords:Limb budSurface tensionActive responseα-smooth muscle actin
icken embryos is initiated during the third day of development by FibroblastGrowth Factor 8 (FGF8) produced by the newly formed apical ectodermal ridge (AER). One of the earliesteffects of this induction is a change in the properties of the limb field mesoderm leading to bulging of thelimb buds from the body wall. Heintzelman et al. [Heintzelman, K.F., Phillips, H.M., Davis, G.S., 1978. Liquid-tissue behavior and differential cohesiveness during chick limb budding. J. Embryol. Exp. Morphol. 47, 1–15.]suggested that budding of the limbs is caused by a higher liquid-like cohesivity of limb bud tissue comparedwith flank. We sought additional evidence relevant to this hypothesis by performing direct measurements ofthe effective surface tension, a measure of relative tissue cohesivity, of 4-day embryonic chickenwing and legbud mesenchymal tissue, and adjacent flank mesoderm. As predicted, the two types of limb tissues were 1.5-to 2-fold more cohesive than the flank tissue. These differences paralleled cell number and volume densitydifferences: 4-day limb buds had 2- to 2.5-fold as many cells per unit area of tissue as surrounding flank, adifference also seen at 3 days, when limb budding begins. Exposure of flank tissue to exogenous FGF8 for 24 hincreased its cell number and raised its cohesivity to limb-like values. Four-day flank tissue exhibited a noveland unique active rebound response to compression, which was suppressed by the drug latrunculin andtherefore dependent on an intact actin cytoskeleton. Correspondingly, flank at this stage expressed highlevels of α-smooth muscle actin (SMA) mRNA and protein and a dense network of microfilaments. Treatmentof flank with FGF8 eliminated the rebound response. We term material properties of tissues, such ascohesivity and mechanical excitability, the “physical phenotype”, and propose that changes thereof aredriving forces of morphogenesis. Our results indicate that two independent aspects of the physicalphenotype of flank mesoderm can be converted to a limb-like state in response to treatment with FGF8. Thehigher tissue cohesivity induced by this effect will cause the incipient limb bud to phase separate from thesurrounding flank, while the active mechanical response of the flank could help ensure that the limb budbulges out from, rather than becoming engulfed by, this less cohesive tissue.
© 2008 Elsevier Inc. All rights reserved.
Introduction
The morphogenesis of the vertebrate limb begins with the bulgingof the limb buds from the body wall at four sites along the embryo'ssurface. In the avian embryo, the lateral plate mesoderm is induced byparaxial signals (Saito et al., 2006) to generate limb buds at the axiallevels of the cervical-thoracic (forelimb or wing) and lumbosacral(hindlimb or leg) somites by the third day of development (Nowicki et
at Department of Physics andMO 65211, USA.), [email protected]
l rights reserved.
al., 2003). The mesenchymal cells of the limb buds and adjacent flankare spatially homogeneous and morphologically similar until sub-populations within the limb buds begin to condense into cartilaginousprimordia and premuscle masses more than a day later.
Exposure of the limb field mesoderm to Fibroblast Growth Factor-8(FGF8) and/or other FGFs secreted from the apical ectodermal ridge(AER) is essential in promoting limb bud outgrowth (Mahmood et al.,1995; Vogel et al., 1996; Crossley et al., 1996; Ohuchi et al., 1997;Lewandoski et al., 2000; Moon and Capecchi, 2000; Sun et al., 2002).The limb vs. flank difference, however, is manifested in avian andmammalian species even earlier than the initial bulging (Min et al.,1998; Xu et al., 1998; Sekine et al., 1999; Kawakami et al., 2001;Agarwal et al., 2003; Tanaka and Tickle, 2004; Saito et al., 2006).
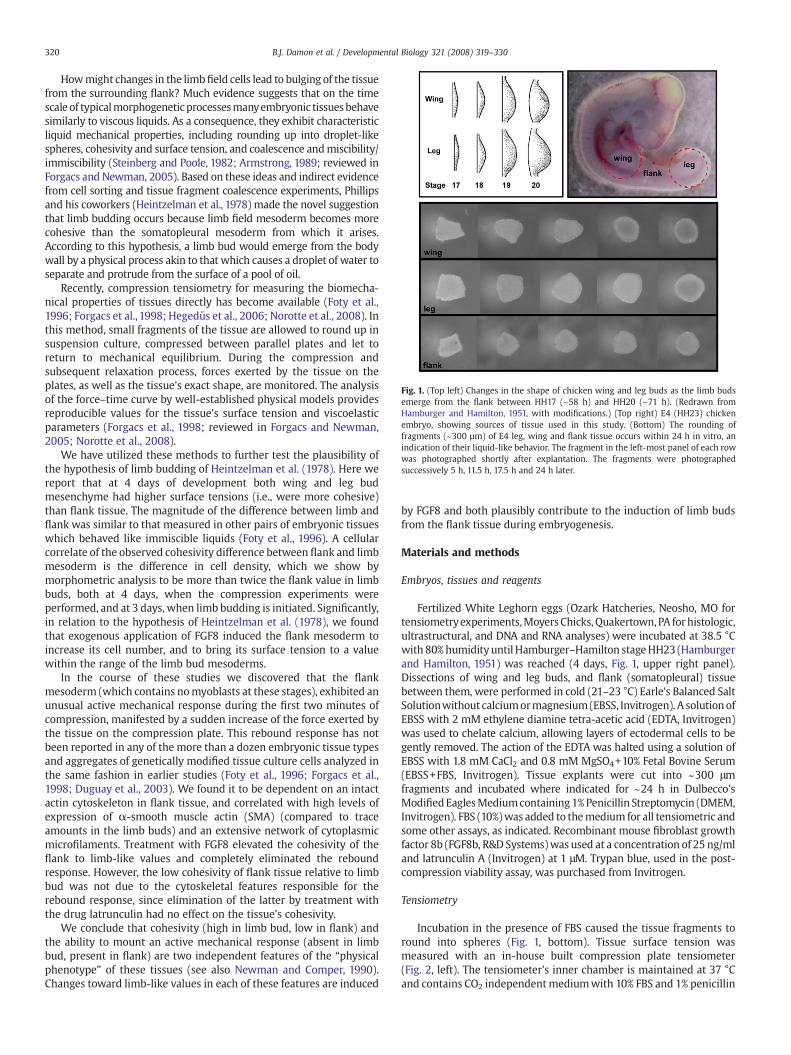
Fig. 1. (Top left) Changes in the shape of chicken wing and leg buds as the limb budsemerge from the flank between HH17 (~58 h) and HH20 (~71 h). (Redrawn fromHamburger and Hamilton, 1951, with modifications.) (Top right) E4 (HH23) chickenembryo, showing sources of tissue used in this study. (Bottom) The rounding offragments (~300 µm) of E4 leg, wing and flank tissue occurs within 24 h in vitro, anindication of their liquid-like behavior. The fragment in the left-most panel of each rowwas photographed shortly after explantation. The fragments were photographedsuccessively 5 h, 11.5 h, 17.5 h and 24 h later.
320 B.J. Damon et al. / Developmental Biology 321 (2008) 319–330
Howmight changes in the limbfield cells lead to bulging of the tissuefrom the surrounding flank? Much evidence suggests that on the timescale of typicalmorphogeneticprocessesmanyembryonic tissuesbehavesimilarly to viscous liquids. As a consequence, they exhibit characteristicliquid mechanical properties, including rounding up into droplet-likespheres, cohesivity and surface tension, and coalescence andmiscibility/immiscibility (Steinberg and Poole, 1982; Armstrong, 1989; reviewed inForgacs and Newman, 2005). Based on these ideas and indirect evidencefrom cell sorting and tissue fragment coalescence experiments, Phillipsand his coworkers (Heintzelman et al., 1978) made the novel suggestionthat limb budding occurs because limb field mesoderm becomes morecohesive than the somatopleural mesoderm from which it arises.According to this hypothesis, a limb bud would emerge from the bodywall by a physical process akin to that which causes a droplet of water toseparate and protrude from the surface of a pool of oil.
Recently, compression tensiometry for measuring the biomecha-nical properties of tissues directly has become available (Foty et al.,1996; Forgacs et al., 1998; Hegedűs et al., 2006; Norotte et al., 2008). Inthis method, small fragments of the tissue are allowed to round up insuspension culture, compressed between parallel plates and let toreturn to mechanical equilibrium. During the compression andsubsequent relaxation process, forces exerted by the tissue on theplates, as well as the tissue's exact shape, are monitored. The analysisof the force–time curve by well-established physical models providesreproducible values for the tissue's surface tension and viscoelasticparameters (Forgacs et al., 1998; reviewed in Forgacs and Newman,2005; Norotte et al., 2008).
We have utilized these methods to further test the plausibility ofthe hypothesis of limb budding of Heintzelman et al. (1978). Here wereport that at 4 days of development both wing and leg budmesenchyme had higher surface tensions (i.e., were more cohesive)than flank tissue. The magnitude of the difference between limb andflank was similar to that measured in other pairs of embryonic tissueswhich behaved like immiscible liquids (Foty et al., 1996). A cellularcorrelate of the observed cohesivity difference between flank and limbmesoderm is the difference in cell density, which we show bymorphometric analysis to be more than twice the flank value in limbbuds, both at 4 days, when the compression experiments wereperformed, and at 3 days, when limb budding is initiated. Significantly,in relation to the hypothesis of Heintzelman et al. (1978), we foundthat exogenous application of FGF8 induced the flank mesoderm toincrease its cell number, and to bring its surface tension to a valuewithin the range of the limb bud mesoderms.
In the course of these studies we discovered that the flankmesoderm (which contains nomyoblasts at these stages), exhibited anunusual active mechanical response during the first two minutes ofcompression, manifested by a sudden increase of the force exerted bythe tissue on the compression plate. This rebound response has notbeen reported in any of the more than a dozen embryonic tissue typesand aggregates of genetically modified tissue culture cells analyzed inthe same fashion in earlier studies (Foty et al., 1996; Forgacs et al.,1998; Duguay et al., 2003). We found it to be dependent on an intactactin cytoskeleton in flank tissue, and correlated with high levels ofexpression of α-smooth muscle actin (SMA) (compared to traceamounts in the limb buds) and an extensive network of cytoplasmicmicrofilaments. Treatment with FGF8 elevated the cohesivity of theflank to limb-like values and completely eliminated the reboundresponse. However, the low cohesivity of flank tissue relative to limbbud was not due to the cytoskeletal features responsible for therebound response, since elimination of the latter by treatment withthe drug latrunculin had no effect on the tissue's cohesivity.
We conclude that cohesivity (high in limb bud, low in flank) andthe ability to mount an active mechanical response (absent in limbbud, present in flank) are two independent features of the “physicalphenotype” of these tissues (see also Newman and Comper, 1990).Changes toward limb-like values in each of these features are induced
by FGF8 and both plausibly contribute to the induction of limb budsfrom the flank tissue during embryogenesis.
Materials and methods
Embryos, tissues and reagents
Fertilized White Leghorn eggs (Ozark Hatcheries, Neosho, MO fortensiometryexperiments,MoyersChicks, Quakertown,PA forhistologic,ultrastructural, and DNA and RNA analyses) were incubated at 38.5 °Cwith 80%humidity until Hamburger–Hamilton stageHH23 (Hamburgerand Hamilton, 1951) was reached (4 days, Fig. 1, upper right panel).Dissections of wing and leg buds, and flank (somatopleural) tissuebetween them, were performed in cold (21–23 °C) Earle's Balanced SaltSolutionwithout calciumormagnesium(EBSS, Invitrogen). A solutionofEBSS with 2 mM ethylene diamine tetra-acetic acid (EDTA, Invitrogen)was used to chelate calcium, allowing layers of ectodermal cells to begently removed. The action of the EDTA was halted using a solution ofEBSS with 1.8 mM CaCl2 and 0.8 mM MgSO4+10% Fetal Bovine Serum(EBSS+FBS, Invitrogen). Tissue explants were cut into ~300 μmfragments and incubated where indicated for ~24 h in Dulbecco'sModifiedEaglesMediumcontaining1%Penicillin Streptomycin (DMEM,Invitrogen). FBS (10%)was added to themedium for all tensiometric andsome other assays, as indicated. Recombinant mouse fibroblast growthfactor 8b (FGF8b, R&D Systems)was used at a concentration of 25 ng/mland latrunculin A (Invitrogen) at 1 μM. Trypan blue, used in the post-compression viability assay, was purchased from Invitrogen.
Tensiometry
Incubation in the presence of FBS caused the tissue fragments toround into spheres (Fig. 1, bottom). Tissue surface tension wasmeasured with an in-house built compression plate tensiometer(Fig. 2, left). The tensiometer's inner chamber is maintained at 37 °Cand contains CO2 independentmediumwith 10% FBS and 1% penicillin
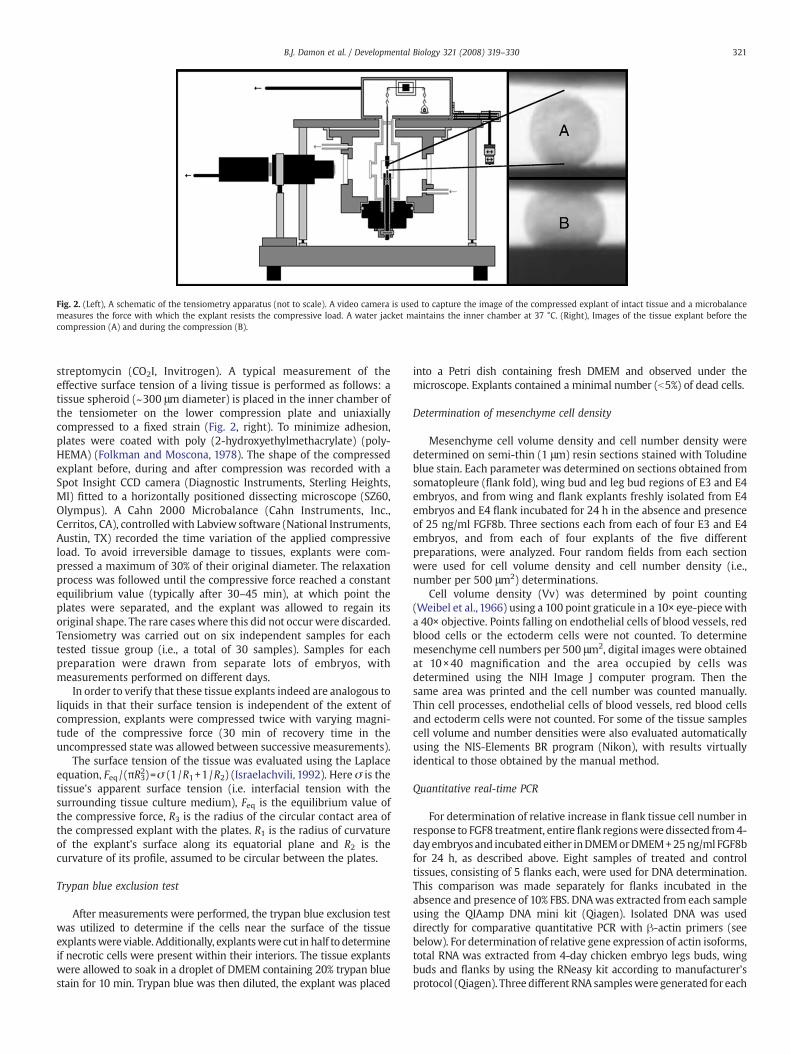
Fig. 2. (Left), A schematic of the tensiometry apparatus (not to scale). A video camera is used to capture the image of the compressed explant of intact tissue and a microbalancemeasures the force with which the explant resists the compressive load. A water jacket maintains the inner chamber at 37 °C. (Right), Images of the tissue explant before thecompression (A) and during the compression (B).
321B.J. Damon et al. / Developmental Biology 321 (2008) 319–330
streptomycin (CO2I, Invitrogen). A typical measurement of theeffective surface tension of a living tissue is performed as follows: atissue spheroid (~300 μm diameter) is placed in the inner chamber ofthe tensiometer on the lower compression plate and uniaxiallycompressed to a fixed strain (Fig. 2, right). To minimize adhesion,plates were coated with poly (2-hydroxyethylmethacrylate) (poly-HEMA) (Folkman and Moscona, 1978). The shape of the compressedexplant before, during and after compression was recorded with aSpot Insight CCD camera (Diagnostic Instruments, Sterling Heights,MI) fitted to a horizontally positioned dissecting microscope (SZ60,Olympus). A Cahn 2000 Microbalance (Cahn Instruments, Inc.,Cerritos, CA), controlled with Labview software (National Instruments,Austin, TX) recorded the time variation of the applied compressiveload. To avoid irreversible damage to tissues, explants were com-pressed a maximum of 30% of their original diameter. The relaxationprocess was followed until the compressive force reached a constantequilibrium value (typically after 30–45 min), at which point theplates were separated, and the explant was allowed to regain itsoriginal shape. The rare cases where this did not occur were discarded.Tensiometry was carried out on six independent samples for eachtested tissue group (i.e., a total of 30 samples). Samples for eachpreparation were drawn from separate lots of embryos, withmeasurements performed on different days.
In order to verify that these tissue explants indeed are analogous toliquids in that their surface tension is independent of the extent ofcompression, explants were compressed twice with varying magni-tude of the compressive force (30 min of recovery time in theuncompressed state was allowed between successive measurements).
The surface tension of the tissue was evaluated using the Laplaceequation, Feq / (πR32)=σ (1 /R1+1/R2) (Israelachvili, 1992). Here σ is thetissue's apparent surface tension (i.e. interfacial tension with thesurrounding tissue culture medium), Feq is the equilibrium value ofthe compressive force, R3 is the radius of the circular contact area ofthe compressed explant with the plates. R1 is the radius of curvatureof the explant's surface along its equatorial plane and R2 is thecurvature of its profile, assumed to be circular between the plates.
Trypan blue exclusion test
After measurements were performed, the trypan blue exclusion testwas utilized to determine if the cells near the surface of the tissueexplantswere viable. Additionally, explantswere cut in half to determineif necrotic cells were present within their interiors. The tissue explantswere allowed to soak in a droplet of DMEM containing 20% trypan bluestain for 10 min. Trypan blue was then diluted, the explant was placed
into a Petri dish containing fresh DMEM and observed under themicroscope. Explants contained a minimal number (b5%) of dead cells.
Determination of mesenchyme cell density
Mesenchyme cell volume density and cell number density weredetermined on semi-thin (1 μm) resin sections stained with Toludineblue stain. Each parameter was determined on sections obtained fromsomatopleure (flank fold), wing bud and leg bud regions of E3 and E4embryos, and from wing and flank explants freshly isolated from E4embryos and E4 flank incubated for 24 h in the absence and presenceof 25 ng/ml FGF8b. Three sections each from each of four E3 and E4embryos, and from each of four explants of the five differentpreparations, were analyzed. Four random fields from each sectionwere used for cell volume density and cell number density (i.e.,number per 500 μm2) determinations.
Cell volume density (Vv) was determined by point counting(Weibel et al., 1966) using a 100 point graticule in a 10× eye-piece witha 40× objective. Points falling on endothelial cells of blood vessels, redblood cells or the ectoderm cells were not counted. To determinemesenchyme cell numbers per 500 μm2, digital images were obtainedat 10×40 magnification and the area occupied by cells wasdetermined using the NIH Image J computer program. Then thesame area was printed and the cell number was counted manually.Thin cell processes, endothelial cells of blood vessels, red blood cellsand ectoderm cells were not counted. For some of the tissue samplescell volume and number densities were also evaluated automaticallyusing the NIS-Elements BR program (Nikon), with results virtuallyidentical to those obtained by the manual method.
Quantitative real-time PCR
For determination of relative increase in flank tissue cell number inresponse to FGF8 treatment, entire flank regionswere dissected from4-dayembryos and incubated either inDMEMorDMEM+25ng/ml FGF8bfor 24 h, as described above. Eight samples of treated and controltissues, consisting of 5 flanks each, were used for DNA determination.This comparison was made separately for flanks incubated in theabsence and presence of 10% FBS. DNAwas extracted from each sampleusing the QIAamp DNA mini kit (Qiagen). Isolated DNA was useddirectly for comparative quantitative PCR with β-actin primers (seebelow). For determination of relative gene expression of actin isoforms,total RNA was extracted from 4-day chicken embryo legs buds, wingbuds and flanks by using the RNeasy kit according to manufacturer'sprotocol (Qiagen). Three different RNA sampleswere generated for each
322 B.J. Damon et al. / Developmental Biology 321 (2008) 319–330
tissue type. Total (RNA 500 ng) was used for reverse transcription in a20-μl reaction with oligo(dT)18 and AMV (Fisher) at 42 °C for 1 h. qPCRreactionswere in 20 μl with 1 μl of cDNA,10 μl of 2× Brilliant SYBRGreen2× master mix (Stratagene), and 150 nM forward and reverse primers.The qPCR reactions were performed by using the Mx3005P Real-TimeqPCR instrument (Stratagene). The reaction conditions were 95 °C for10min, then 35 cycles of 95 °C for 30 s, 55 °C for 1min and 72 °C for 30 s.Emitted fluorescence was measured once at the end of extension(72 °C). The threshold cycle (Ct) was determined as the mean of threebiological replicates by using the adaptive baseline algorithm in theMX3005P software package. Analysis was performed on the dataoutput usingOrigin 8 (OriginLab, Northampton,MA). Allmeasurementswere normalized to GAPDHexpression and analyzed by the “delta deltaCt” method (Livak and Schmittgen, 2001). Primers pairs were asfollows: chickenα-actin (NM_001031229), sense: TGGATTGGAGGCTC-TATTCTTGC, antisense: TTGCGGTGAACGATGGATGG (product size 101base pairs); chicken β-actin (NM_205518), sense: CGGTACCAAT-TACTGGTGTTAGATG, antisense: GCCTTCATTCACATCTATCACTGG (pro-duct size 163 base pairs); chicken GAPDH (AF047874), sense:CCACTGGTGTCTTCACCACC, antisense: GGCAGCACCTCTGCCATCTC(product size 317 base pairs).
Immunoblot analysis
Leg and wing buds, and flanks, were lysed in Lysis-M solutioncontaining Complete inhibitor (Roche). Protein concentration wasmeasured by the BCA method (Pierce). Samples containing equalamounts of protein were loaded into SDS 4–20% Tris–HCl Criterion gel(Bio-Rad). Proteins were transferred to nitrocellulose membrane (Bio-Rad) by electroblotting for 1 h in Tris–Glycine/20% methanol.Membranes were blocked for 1 h at room temperature in 3% nonfatmilk (Bio-Rad)+TTBS (Tris buffered saline, 0.1% Tween), thenincubated overnight at 4 °C with primary antibody diluted in blockingsolution. Blots were washed in TTBS, incubated for 1 h with secondaryantibody and washed again in TTBS. Signal was visualized bymeans ofHRP ECL western blotting substrate (Pierce). Primary antibodies weredirected against the N-terminus of human smooth muscle α-actin(Abcam ab 5694; dilution 1:500) and β-actin (Abcam ab 6276; dilution1:2000), which was used as a loading control. Secondary antibodieswere goat anti mouse-horseradish peroxidase (HRP) (Jackson Immu-noresearch) or goat anti rabbit-HRP (Santa Cruz). The dilution of thesecondary antibodies was 1:5000.
Immunohistochemistry
Chicken embryos at 4 days of incubation (E4) were fixed for 12–18 h in 4% paraformaldehyde prepared in 0.1 M phosphate bufferedsaline (PBS) with 8% sucrose (pH 7.4). The trunk (just inferior to theheart, extending to the tail bud) of the embryo was dissectedhorizontally into three segments: those including the wing and leg
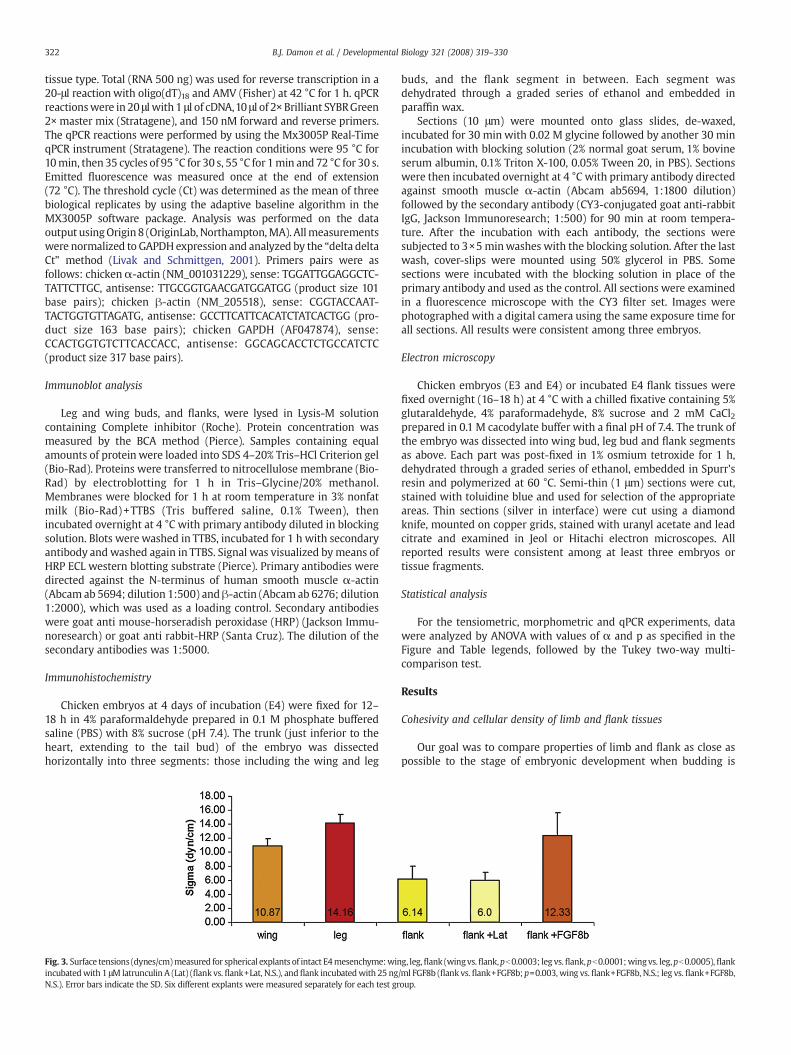
Fig. 3. Surface tensions (dynes/cm)measured for spherical explants of intact E4mesenchyme:winincubatedwith 1 μM latrunculin A (Lat) (flank vs. flank+Lat, N.S.), andflank incubatedwith 25 ngN.S.). Error bars indicate the SD. Six different explants were measured separately for each test gr
buds, and the flank segment in between. Each segment wasdehydrated through a graded series of ethanol and embedded inparaffin wax.
Sections (10 μm) were mounted onto glass slides, de-waxed,incubated for 30 min with 0.02 M glycine followed by another 30 minincubation with blocking solution (2% normal goat serum, 1% bovineserum albumin, 0.1% Triton X-100, 0.05% Tween 20, in PBS). Sectionswere then incubated overnight at 4 °C with primary antibody directedagainst smooth muscle α-actin (Abcam ab5694, 1:1800 dilution)followed by the secondary antibody (CY3-conjugated goat anti-rabbitIgG, Jackson Immunoresearch; 1:500) for 90 min at room tempera-ture. After the incubation with each antibody, the sections weresubjected to 3×5 minwashes with the blocking solution. After the lastwash, cover-slips were mounted using 50% glycerol in PBS. Somesections were incubated with the blocking solution in place of theprimary antibody and used as the control. All sections were examinedin a fluorescence microscope with the CY3 filter set. Images werephotographed with a digital camera using the same exposure time forall sections. All results were consistent among three embryos.
Electron microscopy
Chicken embryos (E3 and E4) or incubated E4 flank tissues werefixed overnight (16–18 h) at 4 °C with a chilled fixative containing 5%glutaraldehyde, 4% paraformadehyde, 8% sucrose and 2 mM CaCl2prepared in 0.1 M cacodylate buffer with a final pH of 7.4. The trunk ofthe embryo was dissected into wing bud, leg bud and flank segmentsas above. Each part was post-fixed in 1% osmium tetroxide for 1 h,dehydrated through a graded series of ethanol, embedded in Spurr'sresin and polymerized at 60 °C. Semi-thin (1 μm) sections were cut,stained with toluidine blue and used for selection of the appropriateareas. Thin sections (silver in interface) were cut using a diamondknife, mounted on copper grids, stained with uranyl acetate and leadcitrate and examined in Jeol or Hitachi electron microscopes. Allreported results were consistent among at least three embryos ortissue fragments.
Statistical analysis
For the tensiometric, morphometric and qPCR experiments, datawere analyzed by ANOVA with values of α and p as specified in theFigure and Table legends, followed by the Tukey two-way multi-comparison test.
Results
Cohesivity and cellular density of limb and flank tissues
Our goal was to compare properties of limb and flank as close aspossible to the stage of embryonic development when budding is
g, leg,flank (wingvs.flank,pb0.0003; leg vs.flank,pb0.0001;wingvs. leg,pb0.0005),flank/ml FGF8b (flank vs. flank+FGF8b;p=0.003, wing vs. flank+FGF8b, N.S.; leg vs. flank+FGF8b,oup.
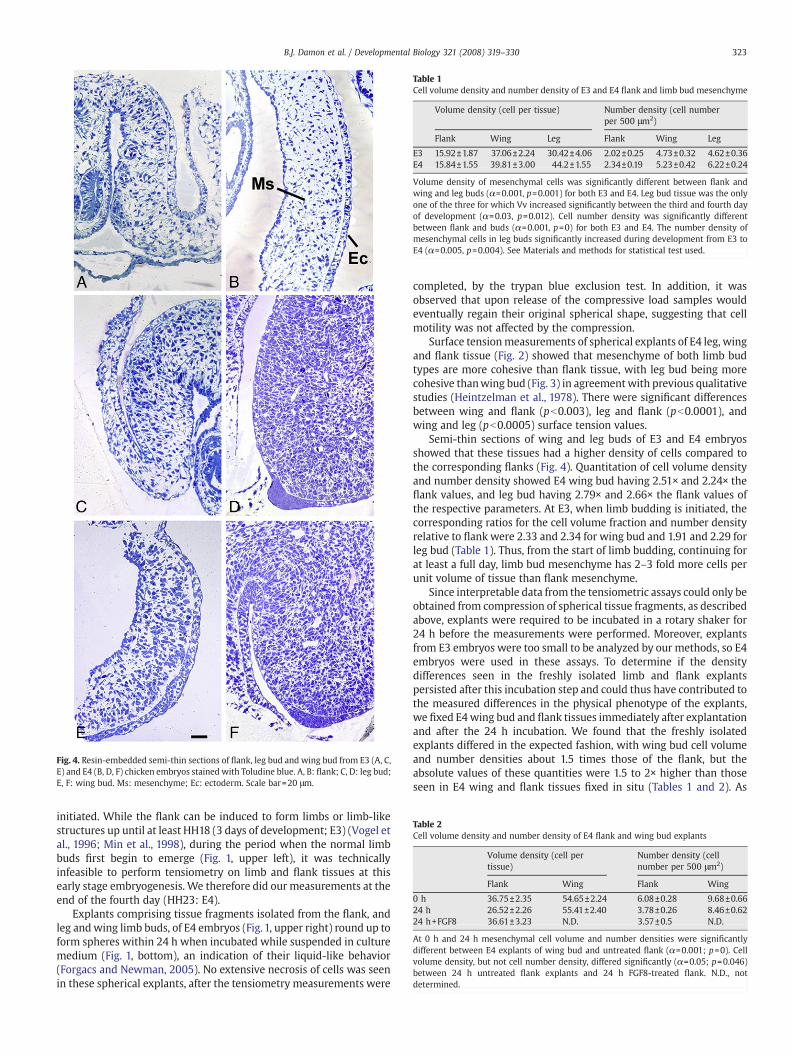
Table 2Cell volume density and number density of E4 flank and wing bud explants
Volume density (cell pertissue)
Number density (cellnumber per 500 μm2)
Flank Wing Flank Wing
0 h 36.75±2.35 54.65±2.24 6.08±0.28 9.68±0.6624 h 26.52±2.26 55.41±2.40 3.78±0.26 8.46±0.6224 h+FGF8 36.61±3.23 N.D. 3.57±0.5 N.D.
At 0 h and 24 h mesenchymal cell volume and number densities were significantlydifferent between E4 explants of wing bud and untreated flank (α=0.001; p=0). Cellvolume density, but not cell number density, differed significantly (α=0.05; p=0.046)between 24 h untreated flank explants and 24 h FGF8-treated flank. N.D., notdetermined.
Fig. 4. Resin-embedded semi-thin sections of flank, leg bud and wing bud from E3 (A, C,E) and E4 (B, D, F) chicken embryos stained with Toludine blue. A, B: flank; C, D: leg bud;E, F: wing bud. Ms: mesenchyme; Ec: ectoderm. Scale bar=20 μm.
Table 1Cell volume density and number density of E3 and E4 flank and limb bud mesenchyme
Volume density (cell per tissue) Number density (cell numberper 500 μm2)
Flank Wing Leg Flank Wing Leg
E3 15.92±1.87 37.06±2.24 30.42±4.06 2.02±0.25 4.73±0.32 4.62±0.36E4 15.84±1.55 39.81±3.00 44.2±1.55 2.34±0.19 5.23±0.42 6.22±0.24
Volume density of mesenchymal cells was significantly different between flank andwing and leg buds (α=0.001, p=0.001) for both E3 and E4. Leg bud tissue was the onlyone of the three for which Vv increased significantly between the third and fourth dayof development (α=0.03, p=0.012). Cell number density was significantly differentbetween flank and buds (α=0.001, p=0) for both E3 and E4. The number density ofmesenchymal cells in leg buds significantly increased during development from E3 toE4 (α=0.005, p=0.004). See Materials and methods for statistical test used.
323B.J. Damon et al. / Developmental Biology 321 (2008) 319–330
initiated. While the flank can be induced to form limbs or limb-likestructures up until at least HH18 (3 days of development; E3) (Vogel etal., 1996; Min et al., 1998), during the period when the normal limbbuds first begin to emerge (Fig. 1, upper left), it was technicallyinfeasible to perform tensiometry on limb and flank tissues at thisearly stage embryogenesis. We therefore did our measurements at theend of the fourth day (HH23: E4).
Explants comprising tissue fragments isolated from the flank, andleg andwing limb buds, of E4 embryos (Fig. 1, upper right) round up toform spheres within 24 h when incubated while suspended in culturemedium (Fig. 1, bottom), an indication of their liquid-like behavior(Forgacs and Newman, 2005). No extensive necrosis of cells was seenin these spherical explants, after the tensiometry measurements were
completed, by the trypan blue exclusion test. In addition, it wasobserved that upon release of the compressive load samples wouldeventually regain their original spherical shape, suggesting that cellmotility was not affected by the compression.
Surface tensionmeasurements of spherical explants of E4 leg, wingand flank tissue (Fig. 2) showed that mesenchyme of both limb budtypes are more cohesive than flank tissue, with leg bud being morecohesive thanwing bud (Fig. 3) in agreementwith previous qualitativestudies (Heintzelman et al., 1978). There were significant differencesbetween wing and flank (pb0.003), leg and flank (pb0.0001), andwing and leg (pb0.0005) surface tension values.
Semi-thin sections of wing and leg buds of E3 and E4 embryosshowed that these tissues had a higher density of cells compared tothe corresponding flanks (Fig. 4). Quantitation of cell volume densityand number density showed E4 wing bud having 2.51× and 2.24× theflank values, and leg bud having 2.79× and 2.66× the flank values ofthe respective parameters. At E3, when limb budding is initiated, thecorresponding ratios for the cell volume fraction and number densityrelative to flank were 2.33 and 2.34 for wing bud and 1.91 and 2.29 forleg bud (Table 1). Thus, from the start of limb budding, continuing forat least a full day, limb bud mesenchyme has 2–3 fold more cells perunit volume of tissue than flank mesenchyme.
Since interpretable data from the tensiometric assays could only beobtained from compression of spherical tissue fragments, as describedabove, explants were required to be incubated in a rotary shaker for24 h before the measurements were performed. Moreover, explantsfrom E3 embryos were too small to be analyzed by our methods, so E4embryos were used in these assays. To determine if the densitydifferences seen in the freshly isolated limb and flank explantspersisted after this incubation step and could thus have contributed tothe measured differences in the physical phenotype of the explants,we fixed E4wing bud and flank tissues immediately after explantationand after the 24 h incubation. We found that the freshly isolatedexplants differed in the expected fashion, with wing bud cell volumeand number densities about 1.5 times those of the flank, but theabsolute values of these quantities were 1.5 to 2× higher than thoseseen in E4 wing and flank tissues fixed in situ (Tables 1 and 2). As
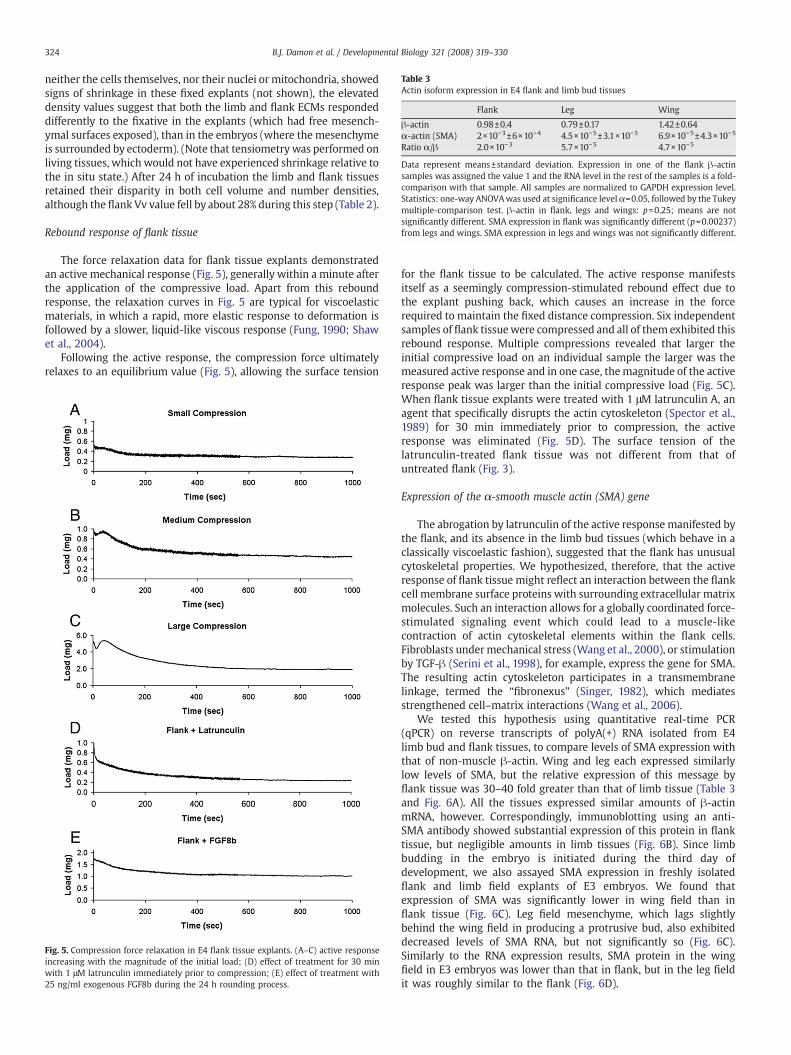
Table 3Actin isoform expression in E4 flank and limb bud tissues
Flank Leg Wing
β-actin 0.98±0.4 0.79±0.17 1.42±0.64α-actin (SMA) 2×10⁻³±6×10⁻⁴ 4.5×10⁻⁵±3.1×10⁻⁵ 6.9×10⁻⁵±4.3×10⁻⁵
Ratio α/β 2.0×10⁻³ 5.7×10⁻⁵ 4.7×10⁻⁵
Data represent means±standard deviation. Expression in one of the flank β-actinsamples was assigned the value 1 and the RNA level in the rest of the samples is a fold-comparison with that sample. All samples are normalized to GAPDH expression level.Statistics: one-way ANOVAwas used at significance level α=0.05, followed by the Tukeymultiple-comparison test. β-actin in flank, legs and wings: p=0.25; means are notsignificantly different. SMA expression in flank was significantly different (p=0.00237)from legs and wings. SMA expression in legs and wings was not significantly different.
324 B.J. Damon et al. / Developmental Biology 321 (2008) 319–330
neither the cells themselves, nor their nuclei or mitochondria, showedsigns of shrinkage in these fixed explants (not shown), the elevateddensity values suggest that both the limb and flank ECMs respondeddifferently to the fixative in the explants (which had free mesench-ymal surfaces exposed), than in the embryos (where the mesenchymeis surrounded by ectoderm). (Note that tensiometrywas performed onliving tissues, which would not have experienced shrinkage relative tothe in situ state.) After 24 h of incubation the limb and flank tissuesretained their disparity in both cell volume and number densities,although the flank Vv value fell by about 28% during this step (Table 2).
Rebound response of flank tissue
The force relaxation data for flank tissue explants demonstratedan active mechanical response (Fig. 5), generally within a minute afterthe application of the compressive load. Apart from this reboundresponse, the relaxation curves in Fig. 5 are typical for viscoelasticmaterials, in which a rapid, more elastic response to deformation isfollowed by a slower, liquid-like viscous response (Fung, 1990; Shawet al., 2004).
Following the active response, the compression force ultimatelyrelaxes to an equilibrium value (Fig. 5), allowing the surface tension
Fig. 5. Compression force relaxation in E4 flank tissue explants. (A–C) active responseincreasing with the magnitude of the initial load; (D) effect of treatment for 30 minwith 1 μM latrunculin immediately prior to compression; (E) effect of treatment with25 ng/ml exogenous FGF8b during the 24 h rounding process.
for the flank tissue to be calculated. The active response manifestsitself as a seemingly compression-stimulated rebound effect due tothe explant pushing back, which causes an increase in the forcerequired to maintain the fixed distance compression. Six independentsamples of flank tissuewere compressed and all of them exhibited thisrebound response. Multiple compressions revealed that larger theinitial compressive load on an individual sample the larger was themeasured active response and in one case, themagnitude of the activeresponse peak was larger than the initial compressive load (Fig. 5C).When flank tissue explants were treated with 1 μM latrunculin A, anagent that specifically disrupts the actin cytoskeleton (Spector et al.,1989) for 30 min immediately prior to compression, the activeresponse was eliminated (Fig. 5D). The surface tension of thelatrunculin-treated flank tissue was not different from that ofuntreated flank (Fig. 3).
Expression of the α-smooth muscle actin (SMA) gene
The abrogation by latrunculin of the active response manifested bythe flank, and its absence in the limb bud tissues (which behave in aclassically viscoelastic fashion), suggested that the flank has unusualcytoskeletal properties. We hypothesized, therefore, that the activeresponse of flank tissue might reflect an interaction between the flankcell membrane surface proteins with surrounding extracellular matrixmolecules. Such an interaction allows for a globally coordinated force-stimulated signaling event which could lead to a muscle-likecontraction of actin cytoskeletal elements within the flank cells.Fibroblasts undermechanical stress (Wang et al., 2000), or stimulationby TGF-β (Serini et al., 1998), for example, express the gene for SMA.The resulting actin cytoskeleton participates in a transmembranelinkage, termed the “fibronexus” (Singer, 1982), which mediatesstrengthened cell–matrix interactions (Wang et al., 2006).
We tested this hypothesis using quantitative real-time PCR(qPCR) on reverse transcripts of polyA(+) RNA isolated from E4limb bud and flank tissues, to compare levels of SMA expression withthat of non-muscle β-actin. Wing and leg each expressed similarlylow levels of SMA, but the relative expression of this message byflank tissue was 30–40 fold greater than that of limb tissue (Table 3and Fig. 6A). All the tissues expressed similar amounts of β-actinmRNA, however. Correspondingly, immunoblotting using an anti-SMA antibody showed substantial expression of this protein in flanktissue, but negligible amounts in limb tissues (Fig. 6B). Since limbbudding in the embryo is initiated during the third day ofdevelopment, we also assayed SMA expression in freshly isolatedflank and limb field explants of E3 embryos. We found thatexpression of SMA was significantly lower in wing field than inflank tissue (Fig. 6C). Leg field mesenchyme, which lags slightlybehind the wing field in producing a protrusive bud, also exhibiteddecreased levels of SMA RNA, but not significantly so (Fig. 6C).Similarly to the RNA expression results, SMA protein in the wingfield in E3 embryos was lower than that in flank, but in the leg fieldit was roughly similar to the flank (Fig. 6D).
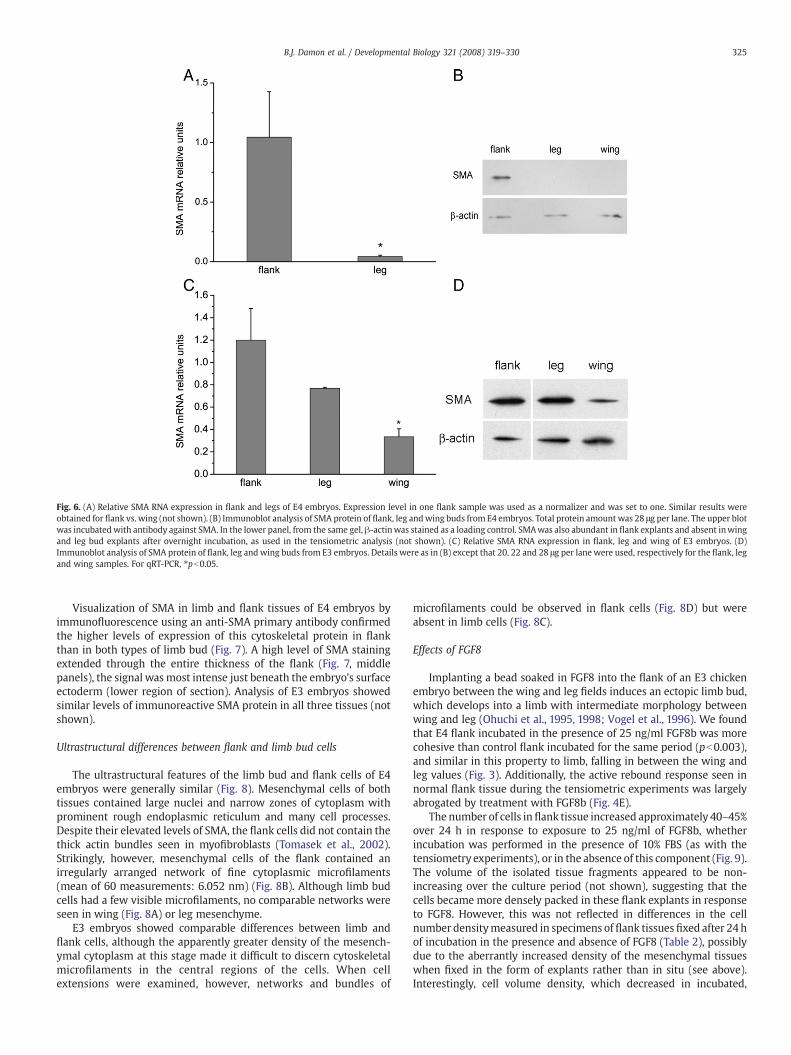
Fig. 6. (A) Relative SMA RNA expression in flank and legs of E4 embryos. Expression level in one flank sample was used as a normalizer and was set to one. Similar results wereobtained for flank vs. wing (not shown). (B) Immunoblot analysis of SMA protein of flank, leg andwing buds from E4 embryos. Total protein amount was 28 μg per lane. The upper blotwas incubatedwith antibody against SMA. In the lower panel, from the same gel, β-actinwas stained as a loading control. SMAwas also abundant in flank explants and absent inwingand leg bud explants after overnight incubation, as used in the tensiometric analysis (not shown). (C) Relative SMA RNA expression in flank, leg and wing of E3 embryos. (D)Immunoblot analysis of SMA protein of flank, leg andwing buds from E3 embryos. Details were as in (B) except that 20, 22 and 28 μg per lane were used, respectively for the flank, legand wing samples. For qRT-PCR, ⁎pb0.05.
325B.J. Damon et al. / Developmental Biology 321 (2008) 319–330
Visualization of SMA in limb and flank tissues of E4 embryos byimmunofluorescence using an anti-SMA primary antibody confirmedthe higher levels of expression of this cytoskeletal protein in flankthan in both types of limb bud (Fig. 7). A high level of SMA stainingextended through the entire thickness of the flank (Fig. 7, middlepanels), the signal wasmost intense just beneath the embryo's surfaceectoderm (lower region of section). Analysis of E3 embryos showedsimilar levels of immunoreactive SMA protein in all three tissues (notshown).
Ultrastructural differences between flank and limb bud cells
The ultrastructural features of the limb bud and flank cells of E4embryos were generally similar (Fig. 8). Mesenchymal cells of bothtissues contained large nuclei and narrow zones of cytoplasm withprominent rough endoplasmic reticulum and many cell processes.Despite their elevated levels of SMA, the flank cells did not contain thethick actin bundles seen in myofibroblasts (Tomasek et al., 2002).Strikingly, however, mesenchymal cells of the flank contained anirregularly arranged network of fine cytoplasmic microfilaments(mean of 60 measurements: 6.052 nm) (Fig. 8B). Although limb budcells had a few visible microfilaments, no comparable networks wereseen in wing (Fig. 8A) or leg mesenchyme.
E3 embryos showed comparable differences between limb andflank cells, although the apparently greater density of the mesench-ymal cytoplasm at this stage made it difficult to discern cytoskeletalmicrofilaments in the central regions of the cells. When cellextensions were examined, however, networks and bundles of
microfilaments could be observed in flank cells (Fig. 8D) but wereabsent in limb cells (Fig. 8C).
Effects of FGF8
Implanting a bead soaked in FGF8 into the flank of an E3 chickenembryo between the wing and leg fields induces an ectopic limb bud,which develops into a limb with intermediate morphology betweenwing and leg (Ohuchi et al., 1995, 1998; Vogel et al., 1996). We foundthat E4 flank incubated in the presence of 25 ng/ml FGF8b was morecohesive than control flank incubated for the same period (pb0.003),and similar in this property to limb, falling in between the wing andleg values (Fig. 3). Additionally, the active rebound response seen innormal flank tissue during the tensiometric experiments was largelyabrogated by treatment with FGF8b (Fig. 4E).
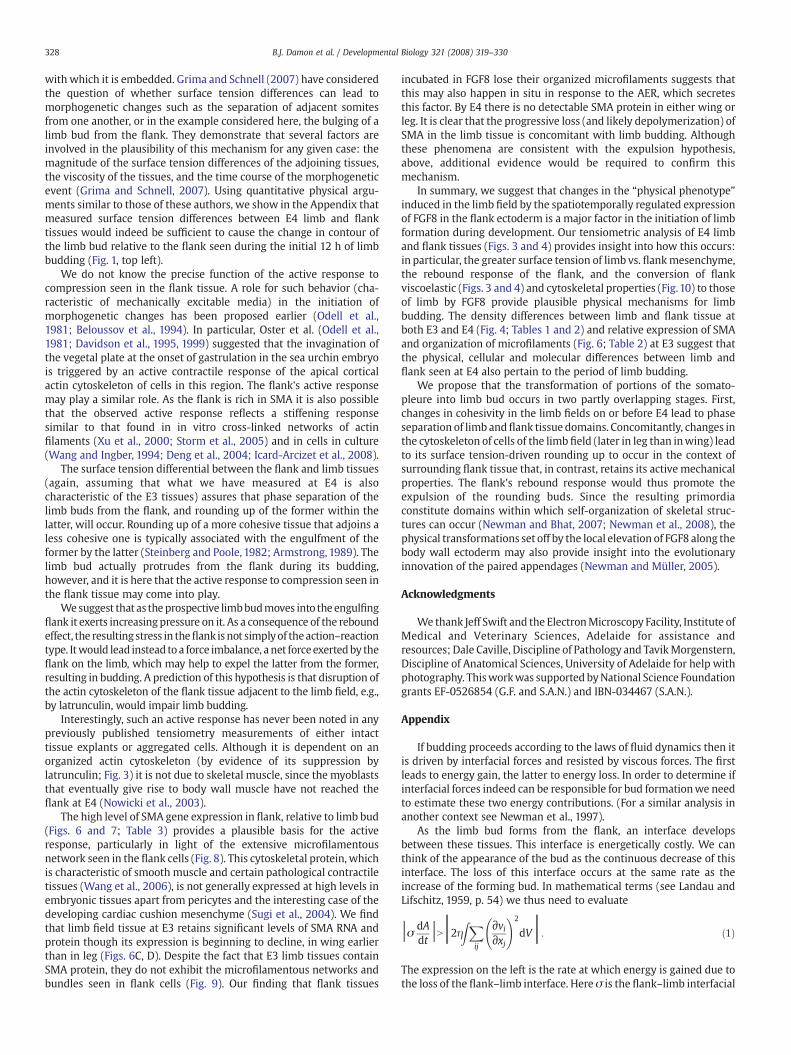
The number of cells in flank tissue increased approximately 40–45%over 24 h in response to exposure to 25 ng/ml of FGF8b, whetherincubation was performed in the presence of 10% FBS (as with thetensiometry experiments), or in the absence of this component (Fig. 9).The volume of the isolated tissue fragments appeared to be non-increasing over the culture period (not shown), suggesting that thecells became more densely packed in these flank explants in responseto FGF8. However, this was not reflected in differences in the cellnumber densitymeasured in specimens of flank tissues fixed after 24 hof incubation in the presence and absence of FGF8 (Table 2), possiblydue to the aberrantly increased density of the mesenchymal tissueswhen fixed in the form of explants rather than in situ (see above).Interestingly, cell volume density, which decreased in incubated,

Fig. 7. Immunolocalization of SMA in wing bud, flank and leg bud of an E4 chicken embryo. Left panels, phase contrast images; right panels, corresponding immunofluorescentimages: A and B, wing bud; C and D, flank; E and F, leg bud. Inset, flank no primary antibody control. Objective magnification 16×. All exposure times, including that of the inset, werethe same. Asterisk: mesenchyme; arrow: ectoderm. Scale bar=100 μm.
326 B.J. Damon et al. / Developmental Biology 321 (2008) 319–330
relative to freshly isolated, flank did not do so when FGF8 was present(Table 2).
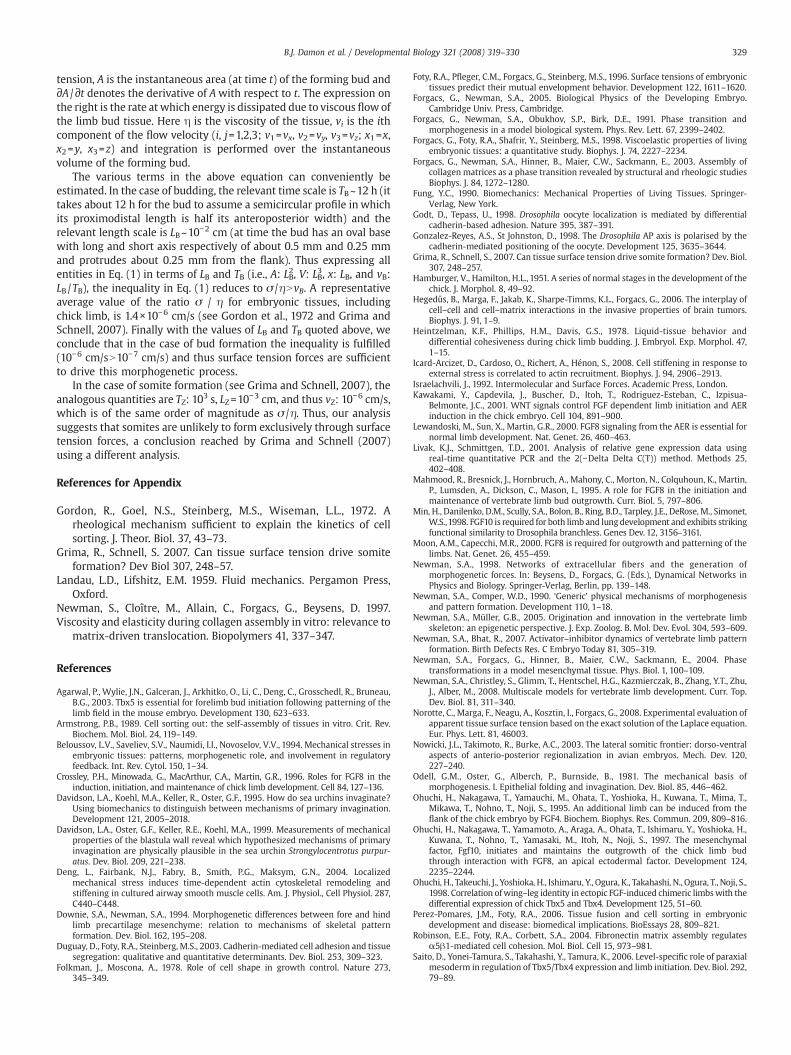
Treatment of flank tissue with FGF8 did not significantly change itslevel of expression of SMA RNA (not shown). Nonetheless, themicrofilamentous network seen in flank tissue (Figs. 8B, D), whilepersisting in the untreated flank after incubation for 24 h (Fig. 10A),was not observed in flank cells that had been exposed to FGF8 (Fig.10B). These results paralleled the tensiometric ones (Fig. 5), where thepresence of FGF8 eliminated the rebound response.
Discussion
The above findings demonstrate that limb bud tissues have a largersurface tension, and are thus more cohesive, than the surroundingflank tissue in agreement with what can be termed the “limb buddingby phase separation” proposal of Heintzelman et al. (1978). Thisproposal was based, in turn, on themore general Differential AdhesionHypothesis (DAH) of Steinberg (Steinberg 1963, 1978, 1998), amorphogenetic principle that underlies many developmental andpathological processes (Godt and Tepass, 1998; Gonzalez-Reyes and StJohnston, 1998; Perez-Pomares and Foty, 2006). The DAH states thatrelative arrangements of cells within complex tissues, and tissuesrelative to one another within organs, can be predicted, underappropriate conditions, by the relative adhesive strengths of the
cells or cohesivities of the tissues, measured, respectively, on commonquantitative scales.
Cohesivity differences in mesenchymal tissues, however, cannothave the same underlying cellular basis as in epithelioid tissues, theparadigmatic cases for the DAH. In epithelioid tissues, in which cellsadhere to one another directly via cell adhesion molecules (CAMs),cohesivity differences can be attributed to different strengths ofadhesion, which can be arranged on a quantitative scale regardless ofwhich CAMs are involved. Mesenchymal tissues, in contrast, consist ofcells embedded in an extracellular matrix (ECM). Cohesivity differ-ences in mesenchymal tissues have been attributed to global networkproperties of ECM fibers (Forgacs et al., 1991, 2003; Newman, 1998;Newman et al., 2004) and cell–ECM interactions (Robinson et al.,2004), or both (reviewed in Forgacs and Newman, 2005). The presentstudy suggests that an increased density of cells in limb buds vs. flanktissue, which is present both at 3 and 4 days of development (Fig. 4;Table 1), may account, in part, for the relatively higher values ofcohesivity of limb bud tissues in E4 explants (Fig. 3). Treatment offlank with FGF8 increased its cohesivity (Fig. 3) and cell number (Fig.9), during the incubation period, but induced differences in celldensity could not unambiguously be determined (Table 2), possiblybecause of the contraction seen in the explants relative to intactembryonic tissue during fixation (Tables 1 and 2). This contractionwould not pertain to the living tissues analyzed tensiometrically,
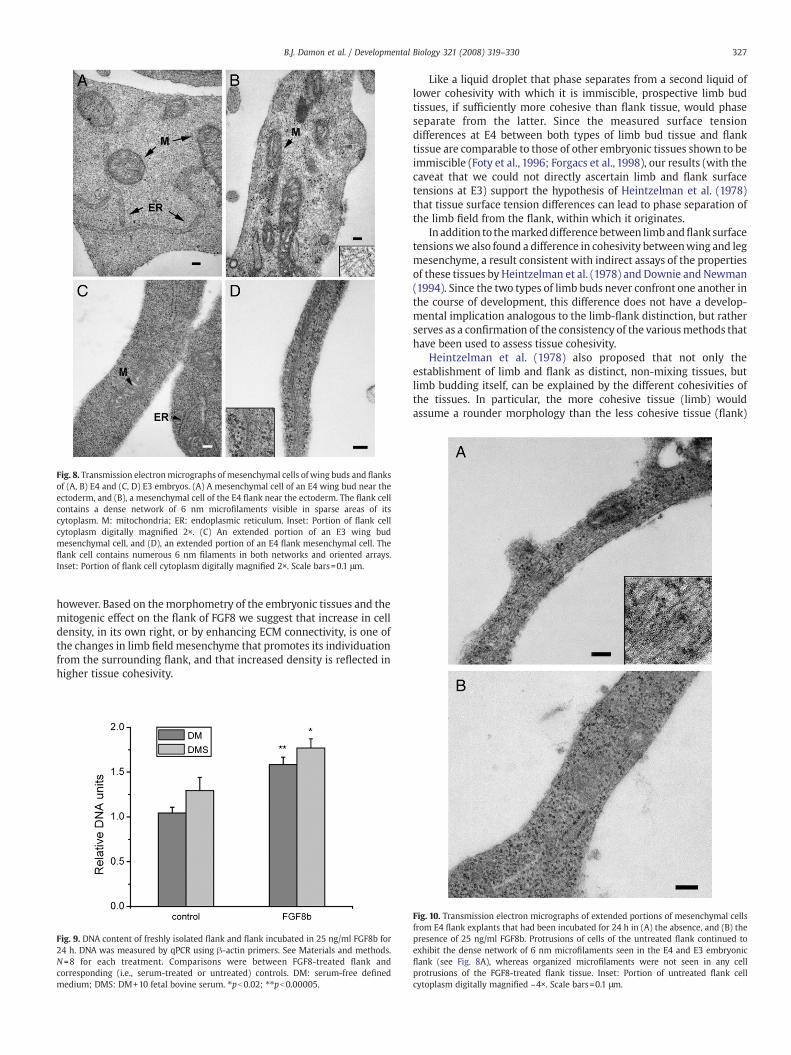
Fig. 8. Transmission electronmicrographs of mesenchymal cells of wing buds and flanksof (A, B) E4 and (C, D) E3 embryos. (A) A mesenchymal cell of an E4 wing bud near theectoderm, and (B), a mesenchymal cell of the E4 flank near the ectoderm. The flank cellcontains a dense network of 6 nm microfilaments visible in sparse areas of itscytoplasm. M: mitochondria; ER: endoplasmic reticulum. Inset: Portion of flank cellcytoplasm digitally magnified 2×. (C) An extended portion of an E3 wing budmesenchymal cell, and (D), an extended portion of an E4 flank mesenchymal cell. Theflank cell contains numerous 6 nm filaments in both networks and oriented arrays.Inset: Portion of flank cell cytoplasm digitally magnified 2×. Scale bars=0.1 μm.
327B.J. Damon et al. / Developmental Biology 321 (2008) 319–330
however. Based on themorphometry of the embryonic tissues and themitogenic effect on the flank of FGF8 we suggest that increase in celldensity, in its own right, or by enhancing ECM connectivity, is one ofthe changes in limb field mesenchyme that promotes its individuationfrom the surrounding flank, and that increased density is reflected inhigher tissue cohesivity.
Fig. 9. DNA content of freshly isolated flank and flank incubated in 25 ng/ml FGF8b for24 h. DNA was measured by qPCR using β-actin primers. See Materials and methods.N=8 for each treatment. Comparisons were between FGF8-treated flank andcorresponding (i.e., serum-treated or untreated) controls. DM: serum-free definedmedium; DMS: DM+10 fetal bovine serum. ⁎pb0.02; ⁎⁎pb0.00005.
Like a liquid droplet that phase separates from a second liquid oflower cohesivity with which it is immiscible, prospective limb budtissues, if sufficiently more cohesive than flank tissue, would phaseseparate from the latter. Since the measured surface tensiondifferences at E4 between both types of limb bud tissue and flanktissue are comparable to those of other embryonic tissues shown to beimmiscible (Foty et al., 1996; Forgacs et al., 1998), our results (with thecaveat that we could not directly ascertain limb and flank surfacetensions at E3) support the hypothesis of Heintzelman et al. (1978)that tissue surface tension differences can lead to phase separation ofthe limb field from the flank, within which it originates.
In addition to themarkeddifference between limbandflank surfacetensionswe also found a difference in cohesivity betweenwing and legmesenchyme, a result consistent with indirect assays of the propertiesof these tissues by Heintzelman et al. (1978) and Downie and Newman(1994). Since the two types of limb buds never confront one another inthe course of development, this difference does not have a develop-mental implication analogous to the limb-flank distinction, but ratherserves as a confirmation of the consistency of the variousmethods thathave been used to assess tissue cohesivity.
Heintzelman et al. (1978) also proposed that not only theestablishment of limb and flank as distinct, non-mixing tissues, butlimb budding itself, can be explained by the different cohesivities ofthe tissues. In particular, the more cohesive tissue (limb) wouldassume a rounder morphology than the less cohesive tissue (flank)
Fig. 10. Transmission electron micrographs of extended portions of mesenchymal cellsfrom E4 flank explants that had been incubated for 24 h in (A) the absence, and (B) thepresence of 25 ng/ml FGF8b. Protrusions of cells of the untreated flank continued toexhibit the dense network of 6 nm microfilaments seen in the E4 and E3 embryonicflank (see Fig. 8A), whereas organized microfilaments were not seen in any cellprotrusions of the FGF8-treated flank tissue. Inset: Portion of untreated flank cellcytoplasm digitally magnified ~4×. Scale bars=0.1 μm.
328 B.J. Damon et al. / Developmental Biology 321 (2008) 319–330
with which it is embedded. Grima and Schnell (2007) have consideredthe question of whether surface tension differences can lead tomorphogenetic changes such as the separation of adjacent somitesfrom one another, or in the example considered here, the bulging of alimb bud from the flank. They demonstrate that several factors areinvolved in the plausibility of this mechanism for any given case: themagnitude of the surface tension differences of the adjoining tissues,the viscosity of the tissues, and the time course of the morphogeneticevent (Grima and Schnell, 2007). Using quantitative physical argu-ments similar to those of these authors, we show in the Appendix thatmeasured surface tension differences between E4 limb and flanktissues would indeed be sufficient to cause the change in contour ofthe limb bud relative to the flank seen during the initial 12 h of limbbudding (Fig. 1, top left).
We do not know the precise function of the active response tocompression seen in the flank tissue. A role for such behavior (cha-racteristic of mechanically excitable media) in the initiation ofmorphogenetic changes has been proposed earlier (Odell et al.,1981; Beloussov et al., 1994). In particular, Oster et al. (Odell et al.,1981; Davidson et al., 1995, 1999) suggested that the invagination ofthe vegetal plate at the onset of gastrulation in the sea urchin embryois triggered by an active contractile response of the apical corticalactin cytoskeleton of cells in this region. The flank's active responsemay play a similar role. As the flank is rich in SMA it is also possiblethat the observed active response reflects a stiffening responsesimilar to that found in in vitro cross-linked networks of actinfilaments (Xu et al., 2000; Storm et al., 2005) and in cells in culture(Wang and Ingber, 1994; Deng et al., 2004; Icard-Arcizet et al., 2008).
The surface tension differential between the flank and limb tissues(again, assuming that what we have measured at E4 is alsocharacteristic of the E3 tissues) assures that phase separation of thelimb buds from the flank, and rounding up of the former within thelatter, will occur. Rounding up of a more cohesive tissue that adjoins aless cohesive one is typically associated with the engulfment of theformer by the latter (Steinberg and Poole, 1982; Armstrong, 1989). Thelimb bud actually protrudes from the flank during its budding,however, and it is here that the active response to compression seen inthe flank tissue may come into play.
Wesuggest that as theprospective limbbudmoves into theengulfingflank it exerts increasingpressure on it. As a consequence of the reboundeffect, the resulting stress in theflank is not simplyof theaction–reactiontype. Itwould lead instead to a force imbalance, a net forceexertedby theflank on the limb, which may help to expel the latter from the former,resulting in budding. A prediction of this hypothesis is that disruption ofthe actin cytoskeleton of the flank tissue adjacent to the limb field, e.g.,by latrunculin, would impair limb budding.
Interestingly, such an active response has never been noted in anypreviously published tensiometry measurements of either intacttissue explants or aggregated cells. Although it is dependent on anorganized actin cytoskeleton (by evidence of its suppression bylatrunculin; Fig. 3) it is not due to skeletal muscle, since the myoblaststhat eventually give rise to body wall muscle have not reached theflank at E4 (Nowicki et al., 2003).
The high level of SMA gene expression in flank, relative to limb bud(Figs. 6 and 7; Table 3) provides a plausible basis for the activeresponse, particularly in light of the extensive microfilamentousnetwork seen in the flank cells (Fig. 8). This cytoskeletal protein, whichis characteristic of smooth muscle and certain pathological contractiletissues (Wang et al., 2006), is not generally expressed at high levels inembryonic tissues apart from pericytes and the interesting case of thedeveloping cardiac cushion mesenchyme (Sugi et al., 2004). We findthat limb field tissue at E3 retains significant levels of SMA RNA andprotein though its expression is beginning to decline, in wing earlierthan in leg (Figs. 6C, D). Despite the fact that E3 limb tissues containSMA protein, they do not exhibit the microfilamentous networks andbundles seen in flank cells (Fig. 9). Our finding that flank tissues
incubated in FGF8 lose their organized microfilaments suggests thatthis may also happen in situ in response to the AER, which secretesthis factor. By E4 there is no detectable SMA protein in either wing orleg. It is clear that the progressive loss (and likely depolymerization) ofSMA in the limb tissue is concomitant with limb budding. Althoughthese phenomena are consistent with the expulsion hypothesis,above, additional evidence would be required to confirm thismechanism.
In summary, we suggest that changes in the “physical phenotype”induced in the limb field by the spatiotemporally regulated expressionof FGF8 in the flank ectoderm is a major factor in the initiation of limbformation during development. Our tensiometric analysis of E4 limband flank tissues (Figs. 3 and 4) provides insight into how this occurs:in particular, the greater surface tension of limb vs. flankmesenchyme,the rebound response of the flank, and the conversion of flankviscoelastic (Figs. 3 and 4) and cytoskeletal properties (Fig.10) to thoseof limb by FGF8 provide plausible physical mechanisms for limbbudding. The density differences between limb and flank tissue atboth E3 and E4 (Fig. 4; Tables 1 and 2) and relative expression of SMAand organization of microfilaments (Fig. 6; Table 2) at E3 suggest thatthe physical, cellular and molecular differences between limb andflank seen at E4 also pertain to the period of limb budding.
We propose that the transformation of portions of the somato-pleure into limb bud occurs in two partly overlapping stages. First,changes in cohesivity in the limb fields on or before E4 lead to phaseseparation of limb andflank tissue domains. Concomitantly, changes inthe cytoskeleton of cells of the limb field (later in leg than inwing) leadto its surface tension-driven rounding up to occur in the context ofsurrounding flank tissue that, in contrast, retains its active mechanicalproperties. The flank's rebound response would thus promote theexpulsion of the rounding buds. Since the resulting primordiaconstitute domains within which self-organization of skeletal struc-tures can occur (Newman and Bhat, 2007; Newman et al., 2008), thephysical transformations set off by the local elevation of FGF8 along thebody wall ectoderm may also provide insight into the evolutionaryinnovation of the paired appendages (Newman and Müller, 2005).
Acknowledgments
We thank Jeff Swift and the ElectronMicroscopy Facility, Institute ofMedical and Veterinary Sciences, Adelaide for assistance andresources; Dale Caville, Discipline of Pathology and TavikMorgenstern,Discipline of Anatomical Sciences, University of Adelaide for help withphotography. Thisworkwas supported byNational Science Foundationgrants EF-0526854 (G.F. and S.A.N.) and IBN-034467 (S.A.N.).
Appendix
If budding proceeds according to the laws of fluid dynamics then itis driven by interfacial forces and resisted by viscous forces. The firstleads to energy gain, the latter to energy loss. In order to determine ifinterfacial forces indeed can be responsible for bud formationwe needto estimate these two energy contributions. (For a similar analysis inanother context see Newman et al., 1997).
As the limb bud forms from the flank, an interface developsbetween these tissues. This interface is energetically costly. We canthink of the appearance of the bud as the continuous decrease of thisinterface. The loss of this interface occurs at the same rate as theincrease of the forming bud. In mathematical terms (see Landau andLifschitz, 1959, p. 54) we thus need to evaluate
jσ dAdtjNj2ηZX
ij
∂vi∂xj
!2
dVj: ð1Þ
The expression on the left is the rate at which energy is gained due tothe loss of the flank–limb interface. Here σ is the flank–limb interfacial
329B.J. Damon et al. / Developmental Biology 321 (2008) 319–330
tension, A is the instantaneous area (at time t) of the forming bud and∂A /∂t denotes the derivative of Awith respect to t. The expression onthe right is the rate at which energy is dissipated due to viscous flow ofthe limb bud tissue. Here η is the viscosity of the tissue, vi is the ithcomponent of the flow velocity (i, j=1,2,3; v1=vx, v2=vy, v3=vz; x1=x,x2=y, x3=z) and integration is performed over the instantaneousvolume of the forming bud.
The various terms in the above equation can conveniently beestimated. In the case of budding, the relevant time scale is TB~12 h (ittakes about 12 h for the bud to assume a semicircular profile in whichits proximodistal length is half its anteroposterior width) and therelevant length scale is LB~10−2 cm (at time the bud has an oval basewith long and short axis respectively of about 0.5 mm and 0.25 mmand protrudes about 0.25 mm from the flank). Thus expressing allentities in Eq. (1) in terms of LB and TB (i.e., A: LB2, V: LB3, x: LB, and vB:LB/TB), the inequality in Eq. (1) reduces to σ /ηNvB. A representativeaverage value of the ratio σ / η for embryonic tissues, includingchick limb, is 1.4×10⁻⁶ cm/s (see Gordon et al., 1972 and Grima andSchnell, 2007). Finally with the values of LB and TB quoted above, weconclude that in the case of bud formation the inequality is fulfilled(10−6 cm/sN10−7 cm/s) and thus surface tension forces are sufficientto drive this morphogenetic process.
In the case of somite formation (see Grima and Schnell, 2007), theanalogous quantities are TZ: 103 s, LZ=10−3 cm, and thus vZ: 10−6 cm/s,which is of the same order of magnitude as σ /η. Thus, our analysissuggests that somites are unlikely to form exclusively through surfacetension forces, a conclusion reached by Grima and Schnell (2007)using a different analysis.
References for Appendix
Gordon, R., Goel, N.S., Steinberg, M.S., Wiseman, L.L., 1972. Arheological mechanism sufficient to explain the kinetics of cellsorting. J. Theor. Biol. 37, 43–73.
Grima, R., Schnell, S. 2007. Can tissue surface tension drive somiteformation? Dev Biol 307, 248–57.
Landau, L.D., Lifshitz, E.M. 1959. Fluid mechanics. Pergamon Press,Oxford.
Newman, S., Cloître, M., Allain, C., Forgacs, G., Beysens, D. 1997.Viscosity and elasticity during collagen assembly in vitro: relevance to
matrix-driven translocation. Biopolymers 41, 337–347.
References
Agarwal, P., Wylie, J.N., Galceran, J., Arkhitko, O., Li, C., Deng, C., Grosschedl, R., Bruneau,B.G., 2003. Tbx5 is essential for forelimb bud initiation following patterning of thelimb field in the mouse embryo. Development 130, 623–633.
Armstrong, P.B., 1989. Cell sorting out: the self-assembly of tissues in vitro. Crit. Rev.Biochem. Mol. Biol. 24, 119–149.
Beloussov, L.V., Saveliev, S.V., Naumidi, I.I., Novoselov, V.V., 1994. Mechanical stresses inembryonic tissues: patterns, morphogenetic role, and involvement in regulatoryfeedback. Int. Rev. Cytol. 150, 1–34.
Crossley, P.H., Minowada, G., MacArthur, C.A., Martin, G.R., 1996. Roles for FGF8 in theinduction, initiation, and maintenance of chick limb development. Cell 84, 127–136.
Davidson, L.A., Koehl, M.A., Keller, R., Oster, G.F., 1995. How do sea urchins invaginate?Using biomechanics to distinguish between mechanisms of primary invagination.Development 121, 2005–2018.
Davidson, L.A., Oster, G.F., Keller, R.E., Koehl, M.A., 1999. Measurements of mechanicalproperties of the blastula wall reveal which hypothesized mechanisms of primaryinvagination are physically plausible in the sea urchin Strongylocentrotus purpur-atus. Dev. Biol. 209, 221–238.
Deng, L., Fairbank, N.J., Fabry, B., Smith, P.G., Maksym, G.N., 2004. Localizedmechanical stress induces time-dependent actin cytoskeletal remodeling andstiffening in cultured airway smooth muscle cells. Am. J. Physiol., Cell Physiol. 287,C440–C448.
Downie, S.A., Newman, S.A., 1994. Morphogenetic differences between fore and hindlimb precartilage mesenchyme: relation to mechanisms of skeletal patternformation. Dev. Biol. 162, 195–208.
Duguay, D., Foty, R.A., Steinberg, M.S., 2003. Cadherin-mediated cell adhesion and tissuesegregation: qualitative and quantitative determinants. Dev. Biol. 253, 309–323.
Folkman, J., Moscona, A., 1978. Role of cell shape in growth control. Nature 273,345–349.
Foty, R.A., Pfleger, C.M., Forgacs, G., Steinberg, M.S., 1996. Surface tensions of embryonictissues predict their mutual envelopment behavior. Development 122, 1611–1620.
Forgacs, G., Newman, S.A., 2005. Biological Physics of the Developing Embryo.Cambridge Univ. Press, Cambridge.
Forgacs, G., Newman, S.A., Obukhov, S.P., Birk, D.E., 1991. Phase transition andmorphogenesis in a model biological system. Phys. Rev. Lett. 67, 2399–2402.
Forgacs, G., Foty, R.A., Shafrir, Y., Steinberg, M.S., 1998. Viscoelastic properties of livingembryonic tissues: a quantitative study. Biophys. J. 74, 2227–2234.
Forgacs, G., Newman, S.A., Hinner, B., Maier, C.W., Sackmann, E., 2003. Assembly ofcollagen matrices as a phase transition revealed by structural and rheologic studiesBiophys. J. 84, 1272–1280.
Fung, Y.C., 1990. Biomechanics: Mechanical Properties of Living Tissues. Springer-Verlag, New York.
Godt, D., Tepass, U., 1998. Drosophila oocyte localization is mediated by differentialcadherin-based adhesion. Nature 395, 387–391.
Gonzalez-Reyes, A.S., St Johnston, D., 1998. The Drosophila AP axis is polarised by thecadherin-mediated positioning of the oocyte. Development 125, 3635–3644.
Grima, R., Schnell, S., 2007. Can tissue surface tension drive somite formation? Dev. Biol.307, 248–257.
Hamburger, V., Hamilton, H.L., 1951. A series of normal stages in the development of thechick. J. Morphol. 8, 49–92.
Hegedűs, B., Marga, F., Jakab, K., Sharpe-Timms, K.L., Forgacs, G., 2006. The interplay ofcell–cell and cell–matrix interactions in the invasive properties of brain tumors.Biophys. J. 91, 1–9.
Heintzelman, K.F., Phillips, H.M., Davis, G.S., 1978. Liquid-tissue behavior anddifferential cohesiveness during chick limb budding. J. Embryol. Exp. Morphol. 47,1–15.
Icard-Arcizet, D., Cardoso, O., Richert, A., Hénon, S., 2008. Cell stiffening in response toexternal stress is correlated to actin recruitment. Biophys. J. 94, 2906–2913.
Israelachvili, J., 1992. Intermolecular and Surface Forces. Academic Press, London.Kawakami, Y., Capdevila, J., Buscher, D., Itoh, T., Rodriguez-Esteban, C., Izpisua-
Belmonte, J.C., 2001. WNT signals control FGF dependent limb initiation and AERinduction in the chick embryo. Cell 104, 891–900.
Lewandoski, M., Sun, X., Martin, G.R., 2000. FGF8 signaling from the AER is essential fornormal limb development. Nat. Genet. 26, 460–463.
Livak, K.J., Schmittgen, T.D., 2001. Analysis of relative gene expression data usingreal-time quantitative PCR and the 2(−Delta Delta C(T)) method. Methods 25,402–408.
Mahmood, R., Bresnick, J., Hornbruch, A., Mahony, C., Morton, N., Colquhoun, K., Martin,P., Lumsden, A., Dickson, C., Mason, I., 1995. A role for FGF8 in the initiation andmaintenance of vertebrate limb bud outgrowth. Curr. Biol. 5, 797–806.
Min, H., Danilenko, D.M., Scully, S.A., Bolon, B., Ring, B.D., Tarpley, J.E., DeRose, M., Simonet,W.S.,1998. FGF10 is required for both limb and lungdevelopment and exhibits strikingfunctional similarity to Drosophila branchless. Genes Dev. 12, 3156–3161.
Moon, A.M., Capecchi, M.R., 2000. FGF8 is required for outgrowth and patterning of thelimbs. Nat. Genet. 26, 455–459.
Newman, S.A., 1998. Networks of extracellular fibers and the generation ofmorphogenetic forces. In: Beysens, D., Forgacs, G. (Eds.), Dynamical Networks inPhysics and Biology. Springer-Verlag, Berlin, pp. 139–148.
Newman, S.A., Comper, W.D., 1990. ‘Generic’ physical mechanisms of morphogenesisand pattern formation. Development 110, 1–18.
Newman, S.A., Müller, G.B., 2005. Origination and innovation in the vertebrate limbskeleton: an epigenetic perspective. J. Exp. Zoolog. B. Mol. Dev. Evol. 304, 593–609.
Newman, S.A., Bhat, R., 2007. Activator–inhibitor dynamics of vertebrate limb patternformation. Birth Defects Res. C Embryo Today 81, 305–319.
Newman, S.A., Forgacs, G., Hinner, B., Maier, C.W., Sackmann, E., 2004. Phasetransformations in a model mesenchymal tissue. Phys. Biol. 1, 100–109.
Newman, S.A., Christley, S., Glimm, T., Hentschel, H.G., Kazmierczak, B., Zhang, Y.T., Zhu,J., Alber, M., 2008. Multiscale models for vertebrate limb development. Curr. Top.Dev. Biol. 81, 311–340.
Norotte, C., Marga, F., Neagu, A., Kosztin, I., Forgacs, G., 2008. Experimental evaluation ofapparent tissue surface tension based on the exact solution of the Laplace equation.Eur. Phys. Lett. 81, 46003.
Nowicki, J.L., Takimoto, R., Burke, A.C., 2003. The lateral somitic frontier: dorso-ventralaspects of anterio-posterior regionalization in avian embryos. Mech. Dev. 120,227–240.
Odell, G.M., Oster, G., Alberch, P., Burnside, B., 1981. The mechanical basis ofmorphogenesis. I. Epithelial folding and invagination. Dev. Biol. 85, 446–462.
Ohuchi, H., Nakagawa, T., Yamauchi, M., Ohata, T., Yoshioka, H., Kuwana, T., Mima, T.,Mikawa, T., Nohno, T., Noji, S., 1995. An additional limb can be induced from theflank of the chick embryo by FGF4. Biochem. Biophys. Res. Commun. 209, 809–816.
Ohuchi, H., Nakagawa, T., Yamamoto, A., Araga, A., Ohata, T., Ishimaru, Y., Yoshioka, H.,Kuwana, T., Nohno, T., Yamasaki, M., Itoh, N., Noji, S., 1997. The mesenchymalfactor, Fgf10, initiates and maintains the outgrowth of the chick limb budthrough interaction with FGF8, an apical ectodermal factor. Development 124,2235–2244.
Ohuchi, H., Takeuchi, J., Yoshioka, H., Ishimaru, Y., Ogura, K., Takahashi, N., Ogura, T., Noji, S.,1998. Correlation ofwing–leg identity in ectopic FGF-induced chimeric limbswith thedifferential expression of chick Tbx5 and Tbx4. Development 125, 51–60.
Perez-Pomares, J.M., Foty, R.A., 2006. Tissue fusion and cell sorting in embryonicdevelopment and disease: biomedical implications. BioEssays 28, 809–821.
Robinson, E.E., Foty, R.A., Corbett, S.A., 2004. Fibronectin matrix assembly regulatesα5β1-mediated cell cohesion. Mol. Biol. Cell 15, 973–981.
Saito, D., Yonei-Tamura, S., Takahashi, Y., Tamura, K., 2006. Level-specific role of paraxialmesoderm in regulation of Tbx5/Tbx4 expression and limb initiation. Dev. Biol. 292,79–89.
330 B.J. Damon et al. / Developmental Biology 321 (2008) 319–330
Sekine, K., Ohuchi, H., Fujiwara, M., Yamasaki, M., Yoshizawa, T., Sato, T., Yagishita, N.,Matsui, D., Koga, Y., Itoh, N., Kato, S., 1999. FGF10 is essential for limb and lungformation. Nat. Genet. 21, 138–141.
Serini, G., Bochaton-Piallat, M.L., Ropraz, P., Geinoz, A., Borsi, L., Zardi, L., Gabbiani, G.,1998. The fibronectin domain ED-A is crucial for myofibroblastic phenotypeinduction by transforming growth factor-1. J. Cell Biol. 142, 873–881.
Shaw, T., Winston, M., Rupp, C.J., Klapper, L., Stoodley, P., 2004. Commonality of elasticrelaxation in biofilms. Phys. Rev. Lett. 93, 098102–098191.
Singer, I.I., 1982. Association of fibronectin and vinculin with focal contacts and stressfibers in stationary hamster fibroblasts. J. Cell Biol. 92, 398–408.
Spector, I., Shochet, N.R., Blasberger, D., Kashman, Y., 1989. Latrunculins — novel marinemacrolides that disrupt microfilament organization and affect cell growth: I.Comparison with cytochalasin D. Cell Motil. Cytoskelet. 13, 127–144.
Steinberg, M.S., 1963. Reconstruction of tissues by dissociated cells. Some morphoge-netic tissue movements and the sorting out of embryonic cells may have a commonexplanation. Science 141, 401–408.
Steinberg, M.S., 1978. Specific cell ligands and the differential adhesion hypothesis: howdo they fit together? In: Garrod, D.R. (Ed.), Specificity of Embryological Interactions.Chapman and Hall, London, pp. 97–130.
Steinberg, M.S., 1998. Goal-directedness in embryonic development. Integr. Biol. 1, 49–59.Steinberg,M.S., Poole, T.J.,1982. Liquid behavior of embryonic tissues. In: Bellairs, R., Curtis,
A.S.G. (Eds.), Cell Behavior. Cambridge University Press, Cambridge, pp. 583–607.Storm, C., Pastore, J.J., MacKintosh, F.C., Lubensky, T.C., Janmey, P.A., 2005. Nonlinear
elasticity in biological gels. Nature 435, 191–194.Sun, X., Mariani, F.V., Martin, G.R., 2002. Functions of FGF signalling from the apical
ectodermal ridge in limb development. Nature 418, 501–508.
Sugi, Y., Yamamura, H., Okagawa, H., Markwald, R.R., 2004. Bone morphogeneticprotein-2 can mediate myocardial regulation of atrioventricular cushion mesench-ymal cell formation in mice. Dev. Biol. 269, 505–518.
Tanaka, M., Tickle, C., 2004. Tbx18 and boundary formation in chick somite and wingdevelopment. Dev. Biol. 268, 470–480.
Tomasek, J.J., Gabbiani, G., Hinz, B., Chaponnier, C., Brown, R.A., 2002. Myofibroblastsand mechano-regulation of connective tissue remodelling. Nat. Rev., Mol. Cell Biol.3, 349–363.
Vogel, A., Rodriguez, C., Izpisúa-Belmonte, J., 1996. Involvement of FGF8 ininitiation, outgrowth and patterning of the vertebrate limb. Development 122,1737–1750.
Wang, N., Ingber, D.E., 1994. Control of cytoskeletal mechanics by extracellular matrix,cell shape, and mechanical tension. Biophys. J. 66, 2181–2189.
Wang, J., Seth, A., McCulloch, C.A., 2000. Force regulates smooth muscle actin in cardiacfibroblasts. Am. J. Physiol., Heart Circ. Physiol. 279, H2776–2785.
Wang, J., Zohar, R., McCulloch, C.A., 2006. Multiple roles of α-smooth muscle actin inmechanotransduction. Exp. Cell Res. 312, 205–214.
Weibel, E.R., Kistler, G.S., Scherle, W.F., 1966. Practical stereological methods formorphometric cytology. J. Cell Biol. 30, 23–38.
Xu, X.L., Weinstein, M., Li, C.L., Naski, M., Cohen, R.I., Ornitz, D.M., Leder, P., Deng, C.X.,1998. Fibroblast growth factor receptor 2 (FGFR2)-mediated reciprocal regulationloop between FGF8 and FGF10 is essential for limb induction. Development 125,753–765.
Xu, J.Y., Tseng, Y., Wirtz, D., 2000. Strain hardening of actin filament networks—regulation by the dynamic cross-linking protein α-actinin. J. Biol. Chem. 275,35886–35892.
Top Related