


Languages
Pages
Legal

PEER Meeting, San Francisco, 10/16/2009
Development of 3D Confinement Models of Circular Bridge Columns of Different sizes Khalid M. Mosalam, PhD, PE Professor and Vice Chair, University of California, Berkeley [email protected]
Selim Günay, Post-Doc Mohamed Aly (MS/PhD Student)
Outline
Motivation and Objectives
Milestones and Deliverables
Previous Relevant Work
Current Relevant Work
Parametric Study

1) Confined concrete models (internal transverse reinforcement or external jacketing) are limited to effect of axial load.
2) A developed theoretical model focused on circular cross-sections with relatively small diameter calibrated with tests of RC circular columns with FRP jackets for different axial load eccentricities.
3) Questions remain on the effectiveness of confinement for circular columns with large diameter.
4) The goal is to address bridge column size effect in confinement models of concrete when it is subject to axial, shear and bending stresses using a theoretical/computational approach.
Motivation

1) Literature review of tests and models for circular RC columns with confining media, internal and external.
2) Theoretical model for confined RC circular sections addressing the size effect in a rigorous manner.
3) Computational model with nonlinear 3D FEM for confined RC circular sections.
4) Calibrate the models using past tests of circular columns of different sizes, e.g. PEER column database.
5) Use recent tests in Japan on large size circular columns and future tests by the PI for a Caltrans project of shaking table tests (hrz. and vl. shaking).
6) Implement a 3D constitutive model of confined RC sections, based on the 3D FE model, into OpenSees.
Objectives
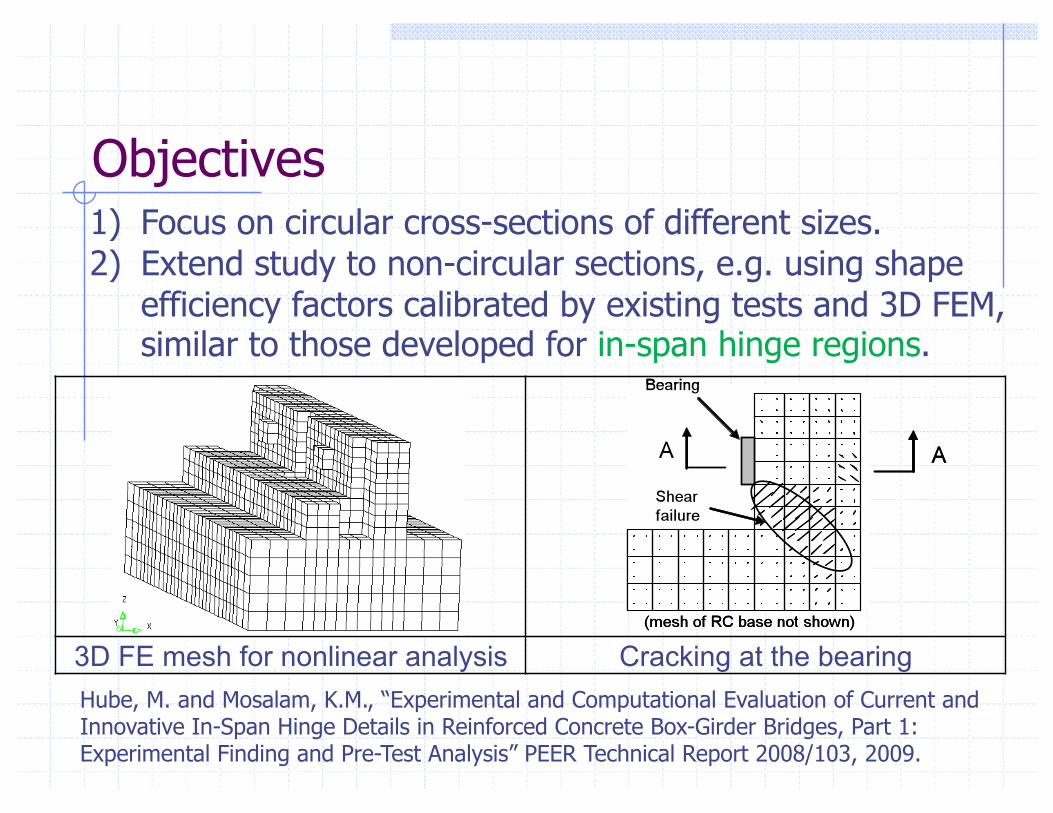
1) Focus on circular cross-sections of different sizes. 2) Extend study to non-circular sections, e.g. using shape
efficiency factors calibrated by existing tests and 3D FEM, similar to those developed for in-span hinge regions.
3D FE mesh for nonlinear analysis Cracking at the bearing Hube, M. and Mosalam, K.M., “Experimental and Computational Evaluation of Current and Innovative In-Span Hinge Details in Reinforced Concrete Box-Girder Bridges, Part 1: Experimental Finding and Pre-Test Analysis” PEER Technical Report 2008/103, 2009.
Objectives

1) Augment existing PEER database on columns with data from tests on confined circular columns from US and Japan.
2) Accurate implementation of confined concrete material and section models for RC bridge columns of different sizes as extension of model by the PI in OpenSees.
Talaat, M. and Mosalam, K.M., “Computational Modeling of Progressive Collapse in Reinforced Concrete Frame Structures,” PEER Technical Report 2007/10, 2008.
Milestones and Deliverables

Previous Relevant Work
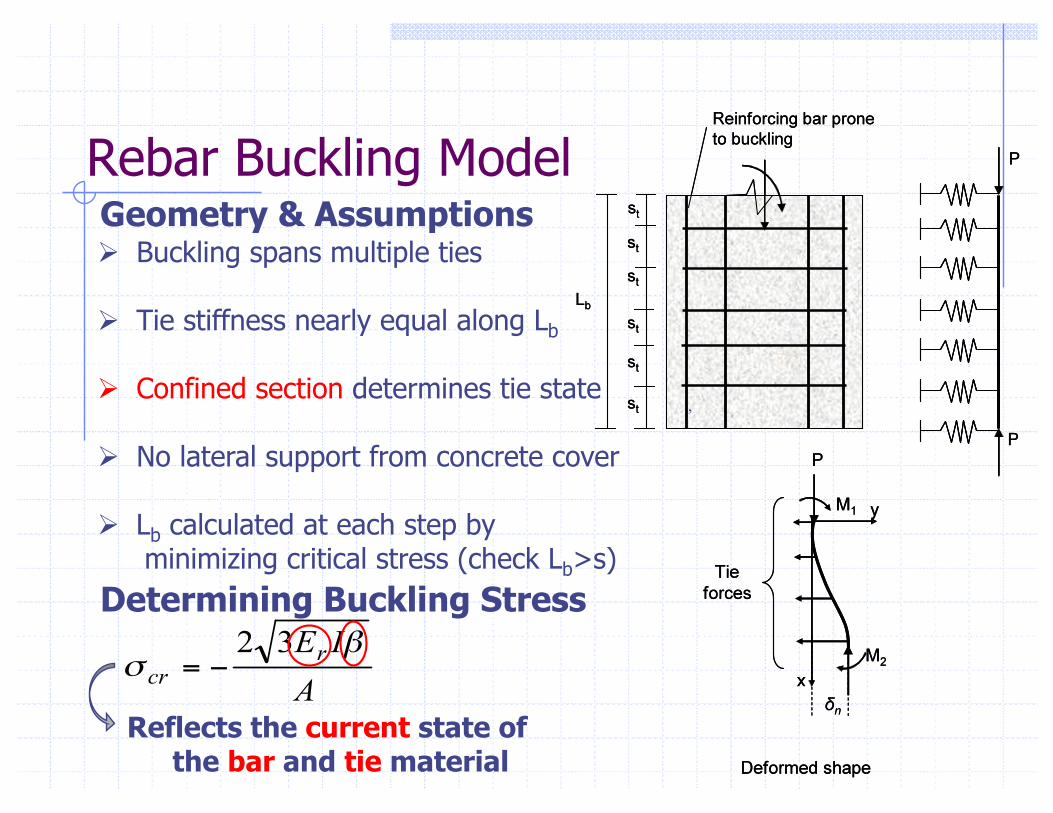
Rebar Buckling Model
Reflects the current state of the bar and tie material
,
Buckling spans multiple ties
Tie stiffness nearly equal along Lb
Confined section determines tie state
No lateral support from concrete cover
Lb calculated at each step by minimizing critical stress (check Lb>s)
Geometry & Assumptions
Determining Buckling Stress

Strain decomposition scheme
+
Assumed initial imperfection (δi lateral offset) Assumed harmonic shape function Stress-free initial shortening-stress, εbi = f(δi
2 )≈0 Imperfection amplified by loading to δ(δi, EI, σ/σcr) Post-buckling, δ becomes excessive Corresponding increase in εb Resulting decrease in εs and axial stress
P=0
δi Unloaded, εt=ΔL/Lb=εbi ≈0
ΔLi P>0
δ> δi
Loaded, εt=ΔL/Lb=εs+εb
ΔL
Fiber mimics axial response of a deflected beam under axial and flexure loads
Post-Buckling Response
= Buckling-induced shortening εb=f(δ2)
Steel effective strain εs
Total (observed) strain εt=ΔL/Lb

Bar compression behavior, variable slenderness ratio Experimental Validation (1/2)
*Bae, S., Mieses, A.M. and Bayrak, O. (2005). "Inelastic Buckling of Reinforcing Bars." Journal of Structural Engineering
*
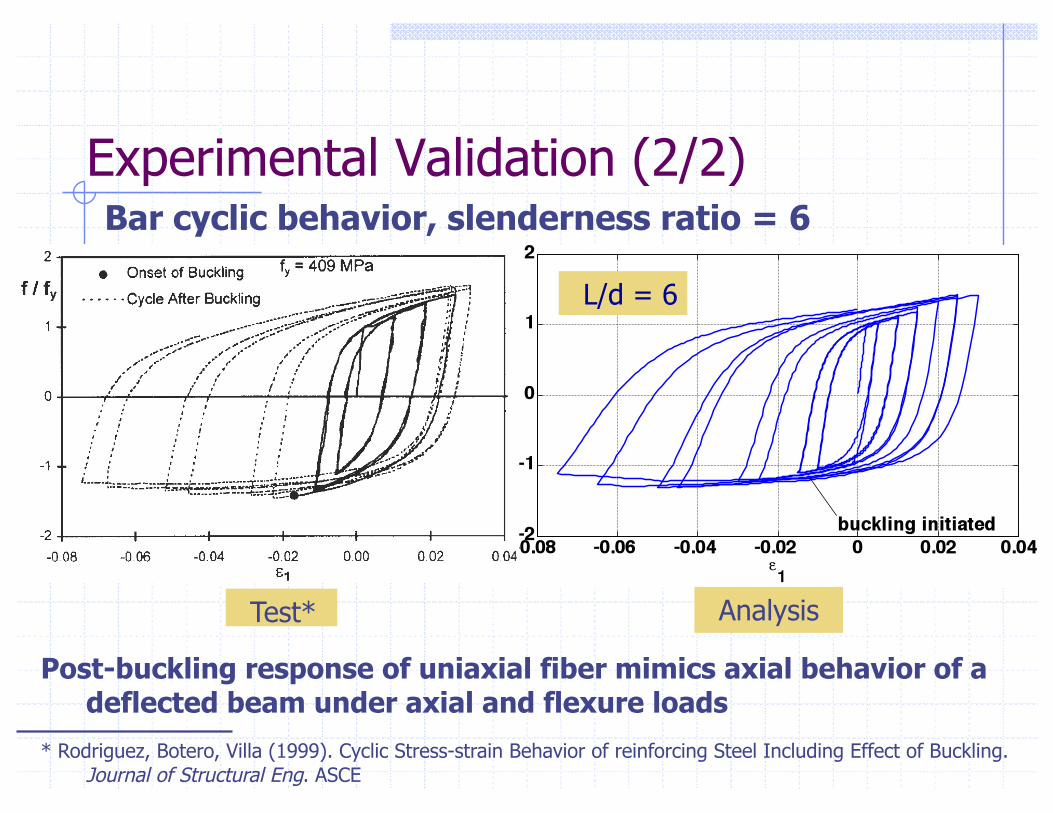
Bar cyclic behavior, slenderness ratio = 6
L/d = 6
* Rodriguez, Botero, Villa (1999). Cyclic Stress-strain Behavior of reinforcing Steel Including Effect of Buckling. Journal of Structural Eng. ASCE
Test* Analysis
Post-buckling response of uniaxial fiber mimics axial behavior of a deflected beam under axial and flexure loads
Experimental Validation (2/2)

Constitutive material models: steel stress-strain Confinement-sensitive bond-slip* Compatibility of strain (strain decomposition):
Equilibrium: Bond stress and axial stress along bar
Geometry and stress fields
*Xiao, Ma (1997) Seismic Retrofit of RC Circular Columns using Prefabricated Composite Jacketing. ASCE J. Str. Eng.
Deficient Lap Splice
+ = Bond (εbs) Steel (εse) Response(εst)
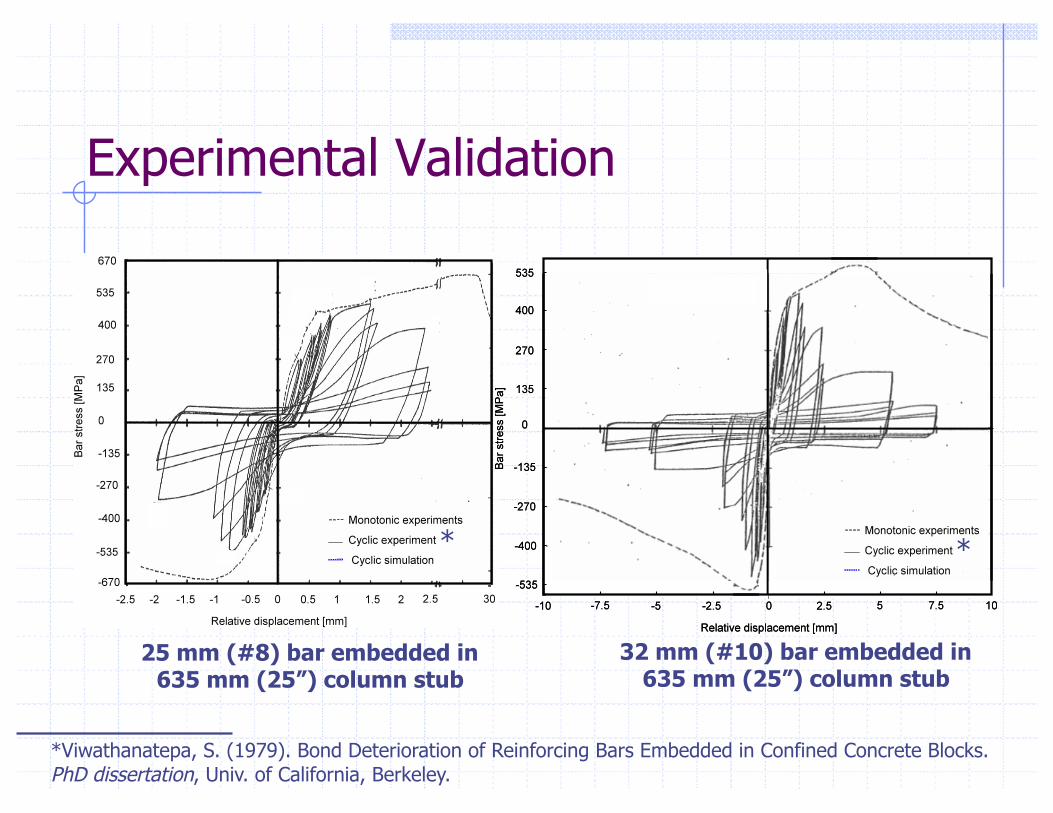
Experimental Validation
*Viwathanatepa, S. (1979). Bond Deterioration of Reinforcing Bars Embedded in Confined Concrete Blocks. PhD dissertation, Univ. of California, Berkeley.
25 mm (#8) bar embedded in 635 mm (25”) column stub
32 mm (#10) bar embedded in 635 mm (25”) column stub
* *
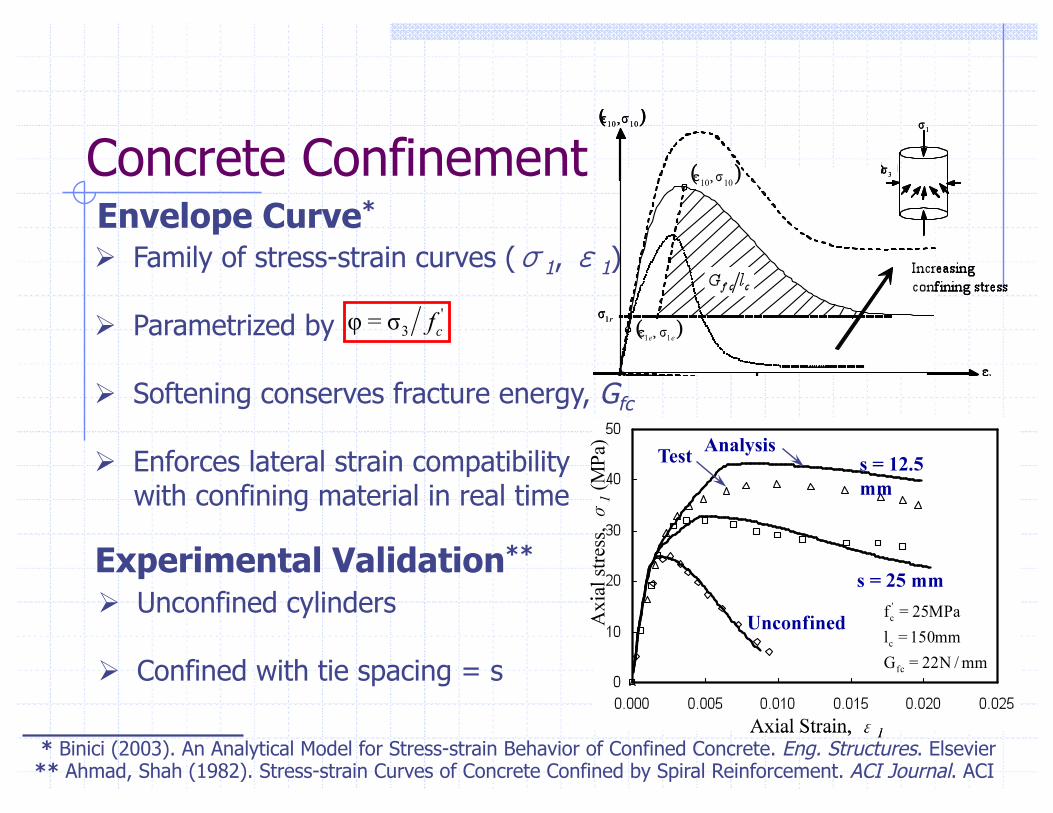
Family of stress-strain curves (σ1, ε1)
Parametrized by
Softening conserves fracture energy, Gfc
Enforces lateral strain compatibility with confining material in real time
Envelope Curve*
* Binici (2003). An Analytical Model for Stress-strain Behavior of Confined Concrete. Eng. Structures. Elsevier ** Ahmad, Shah (1982). Stress-strain Curves of Concrete Confined by Spiral Reinforcement. ACI Journal. ACI
Experimental Validation**
Unconfined cylinders
Confined with tie spacing = s
Analysis Test
Concrete Confinement
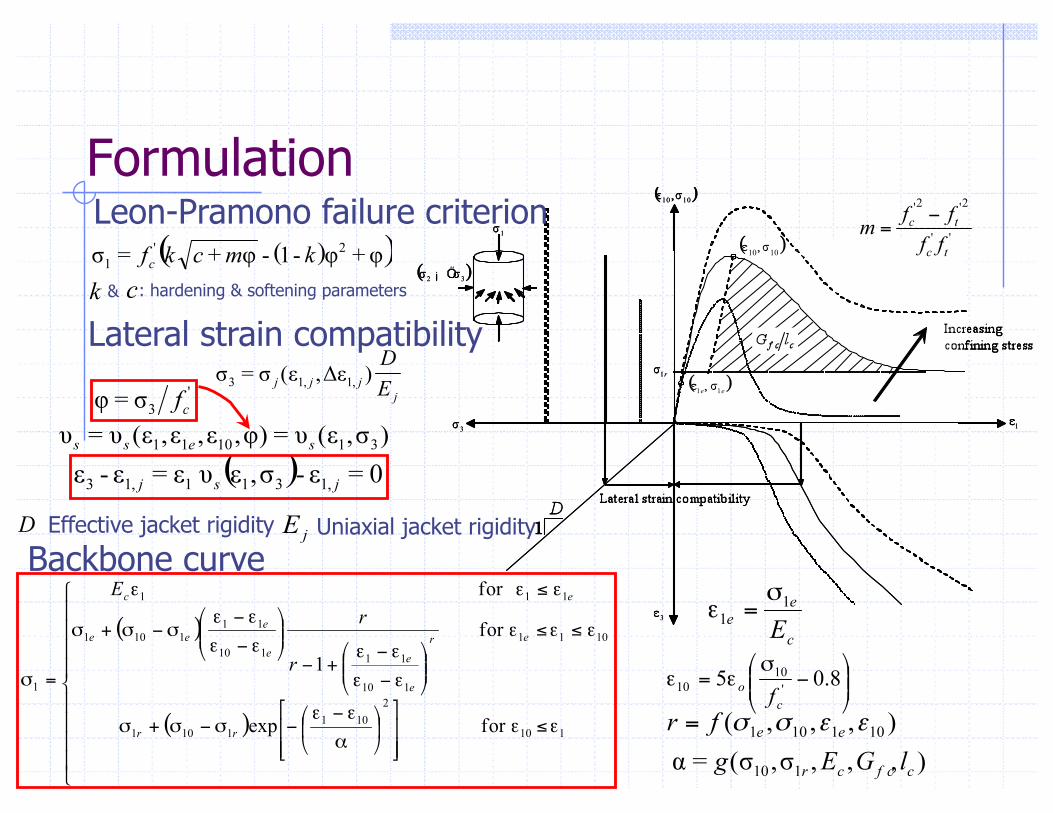
Backbone curve
Leon-Pramono failure criterion
& : hardening & softening parameters
Effective jacket rigidity Uniaxial jacket rigidity
Lateral strain compatibility
Formulation
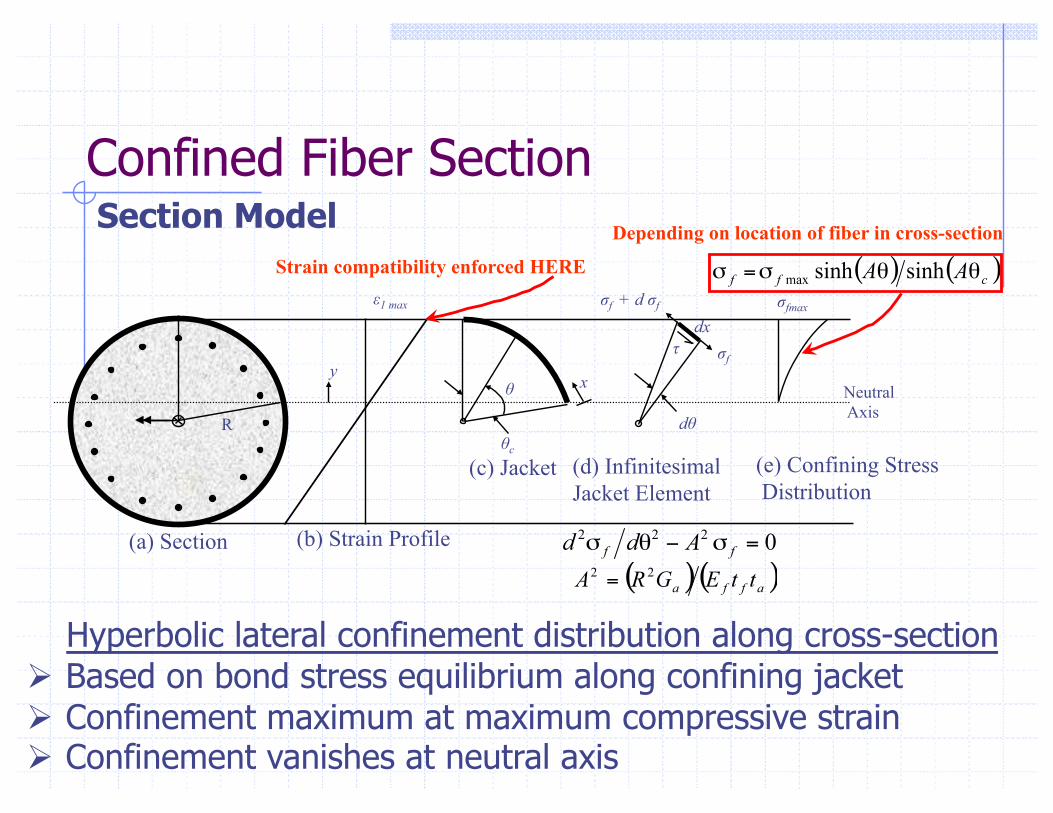
ε1 max σfmax
R θc
σf + d σf
σf τ
x θ Neutral Axis
dθ
dx
(a) Section (b) Strain Profile
(c) Jacket (d) Infinitesimal Jacket Element
(e) Confining Stress Distribution
y
Strain compatibility enforced HERE
Depending on location of fiber in cross-section Section Model Confined Fiber Section
Hyperbolic lateral confinement distribution along cross-section Based on bond stress equilibrium along confining jacket Confinement maximum at maximum compressive strain
Confinement vanishes at neutral axis
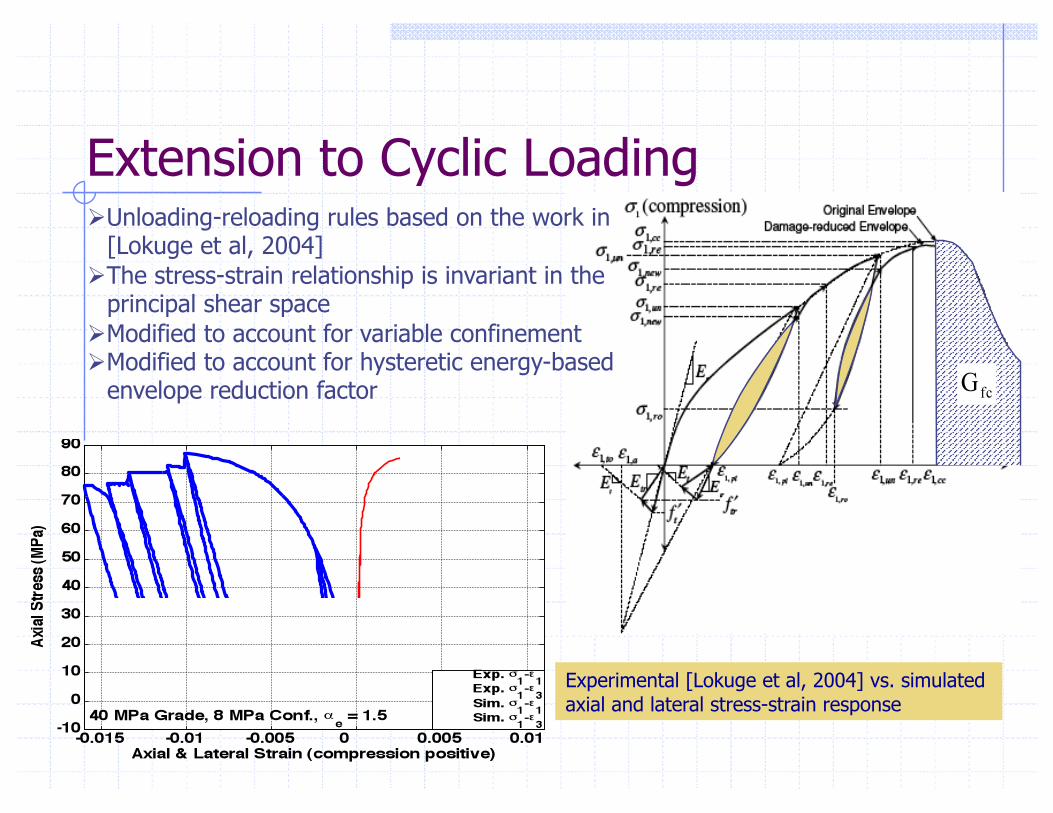
Experimental [Lokuge et al, 2004] vs. simulated axial and lateral stress-strain response
Unloading-reloading rules based on the work in [Lokuge et al, 2004]
The stress-strain relationship is invariant in the principal shear space
Modified to account for variable confinement Modified to account for hysteretic energy-based
envelope reduction factor
Extension to Cyclic Loading
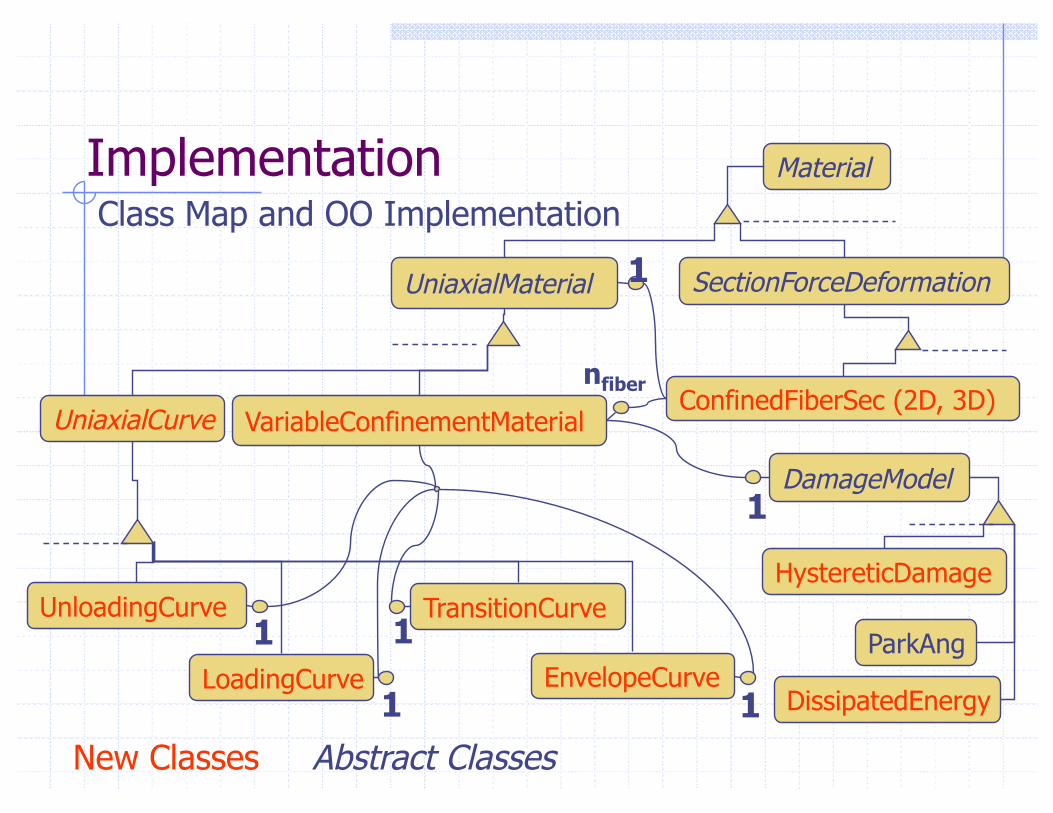
Class Map and OO Implementation
VariableConfinementMaterial UniaxialCurve
LoadingCurve
UnloadingCurve TransitionCurve
EnvelopeCurve
UniaxialMaterial
ConfinedFiberSec (2D, 3D)
HystereticDamage
SectionForceDeformation
Material
DamageModel
ParkAng
1
1
1
1
1
nfiber
1
DissipatedEnergy
New Classes Abstract Classes
Implementation
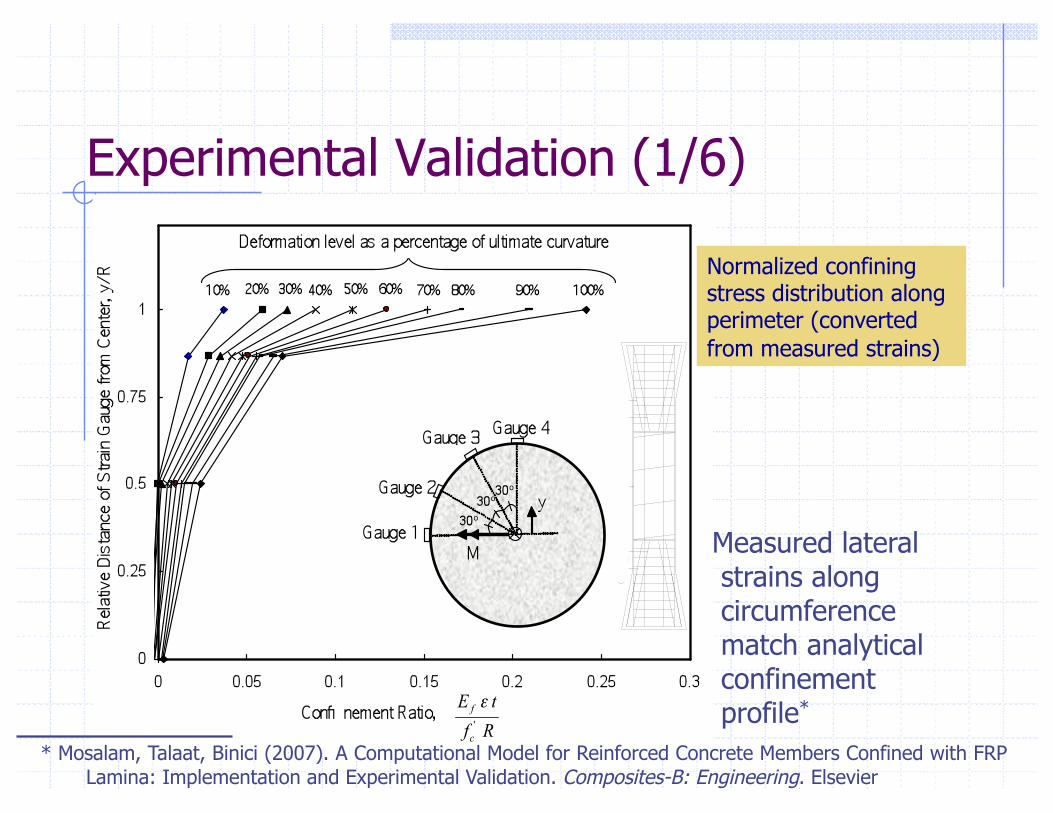
* Mosalam, Talaat, Binici (2007). A Computational Model for Reinforced Concrete Members Confined with FRP Lamina: Implementation and Experimental Validation. Composites-B: Engineering. Elsevier
Measured lateral strains along circumference match analytical confinement profile*
Normalized confining stress distribution along perimeter (converted from measured strains)
Experimental Validation (1/6)
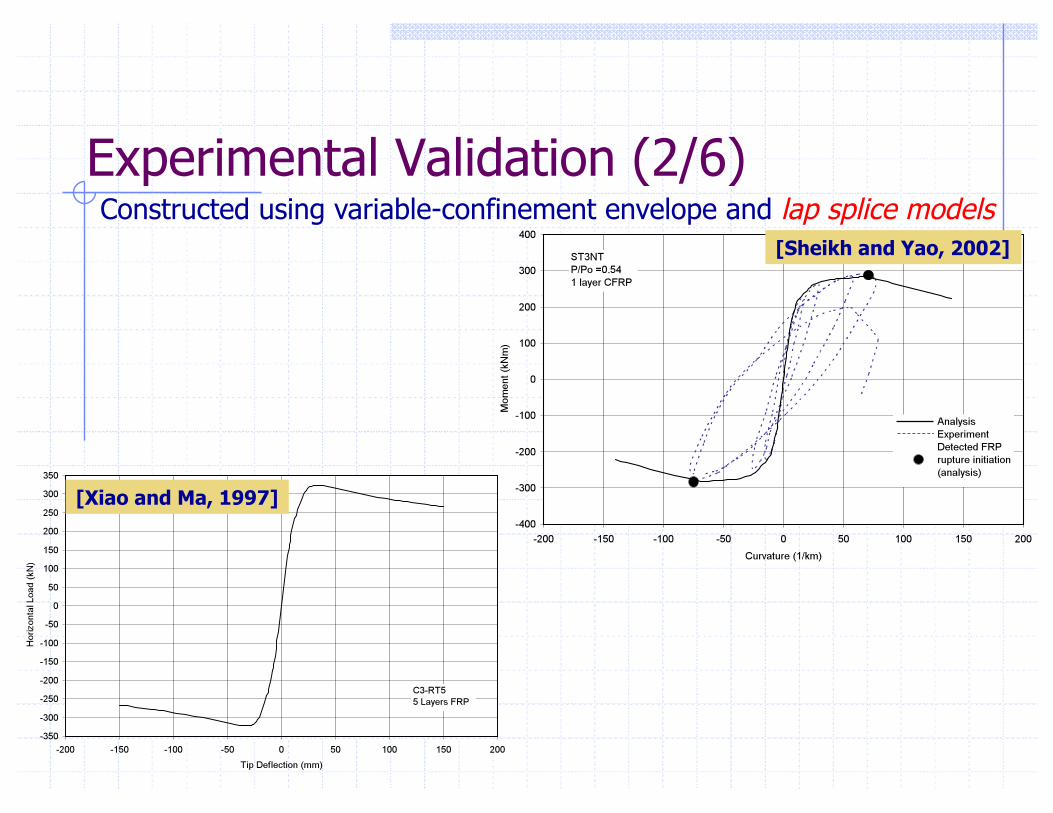
Constructed using variable-confinement envelope and lap splice models [Sheikh and Yao, 2002]
[Xiao and Ma, 1997]
Experimental Validation (2/6)

chuck Jack
Load cell
LVDT
cable
Eccentricity
FRP rupture
Test Setup Specimen Geometry
Tested Specimens 4 pin-pin columns: 1 as-built, 3 CFRP-retrofitted Axial load under fixed eccentricity 3 different eccentricity levels
Experimental Validation (3/6)

22
0 500 1000 1500 0
5
10
15
20
curvature [rad/km] M
omen
t [kN
m] Specimen 2
Specimen 1
Specimen 3 Estimates loss of confinement in as-built and retrofitted columns
-.016 -.012 -.008 -.004 0 .004 .008 .012 .016 .02 0
200
400
600
800
Strain (compression positive)
Axia
l Loa
d (k
N)
Max. Lateral Strain Avg. Axial Strain
__ Pure Axial Load --- 15 mm eccentricity
Experimental Computational
Experimental Validation (4/6)
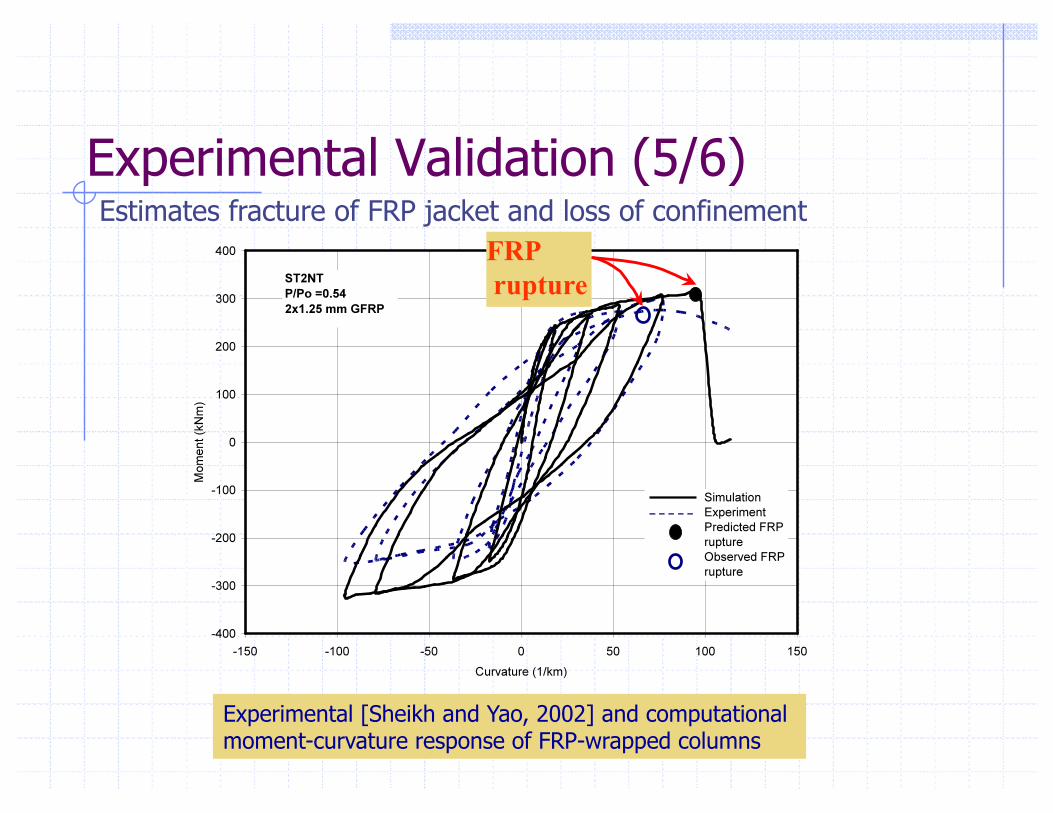
Estimates fracture of FRP jacket and loss of confinement
FRP rupture
Experimental [Sheikh and Yao, 2002] and computational moment-curvature response of FRP-wrapped columns
Experimental Validation (5/6)

Estimates bar buckling for different confining effects
Experimental [Henry, 1999] and computational force-deformation relationships
Experimental Validation (6/6)
Specimen 415P 0.66% trans. reinf. ratio
Specimen 415S 0.33% trans. reinf. ratio

Current Relevant Work

Prototype: Plumas-Arboga Overpass
Prof. Kunnath, UC-Davis
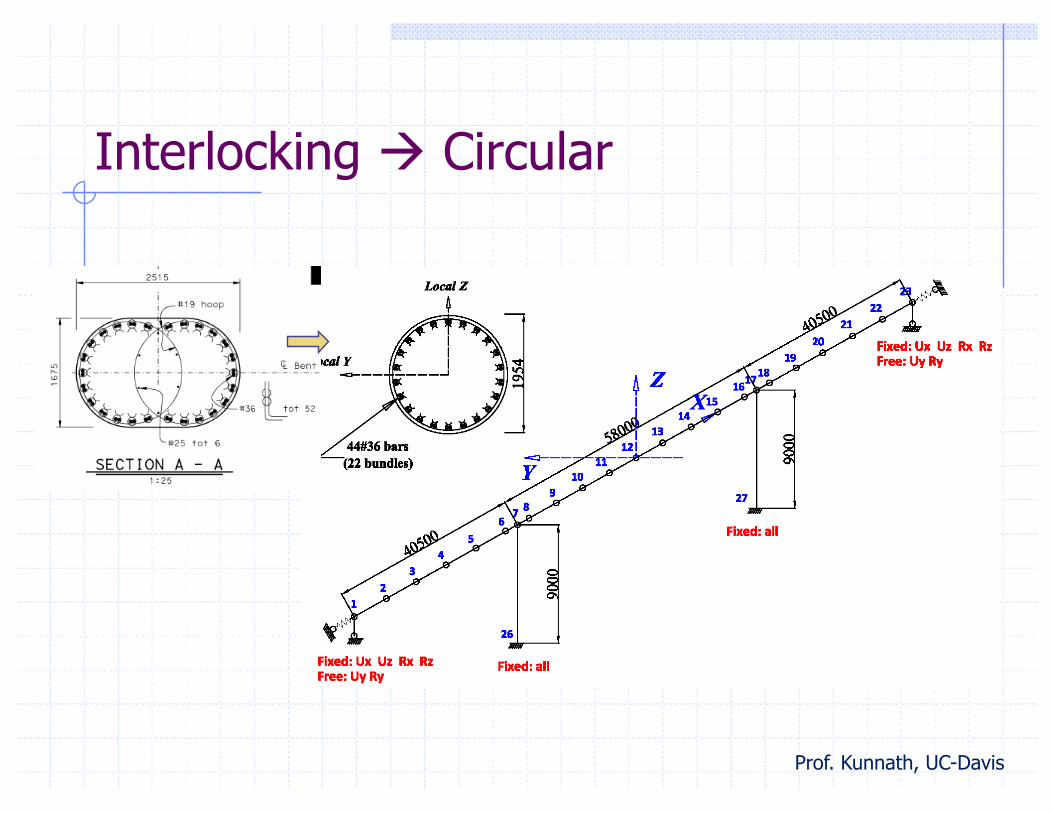
Interlocking Circular
Prof. Kunnath, UC-Davis
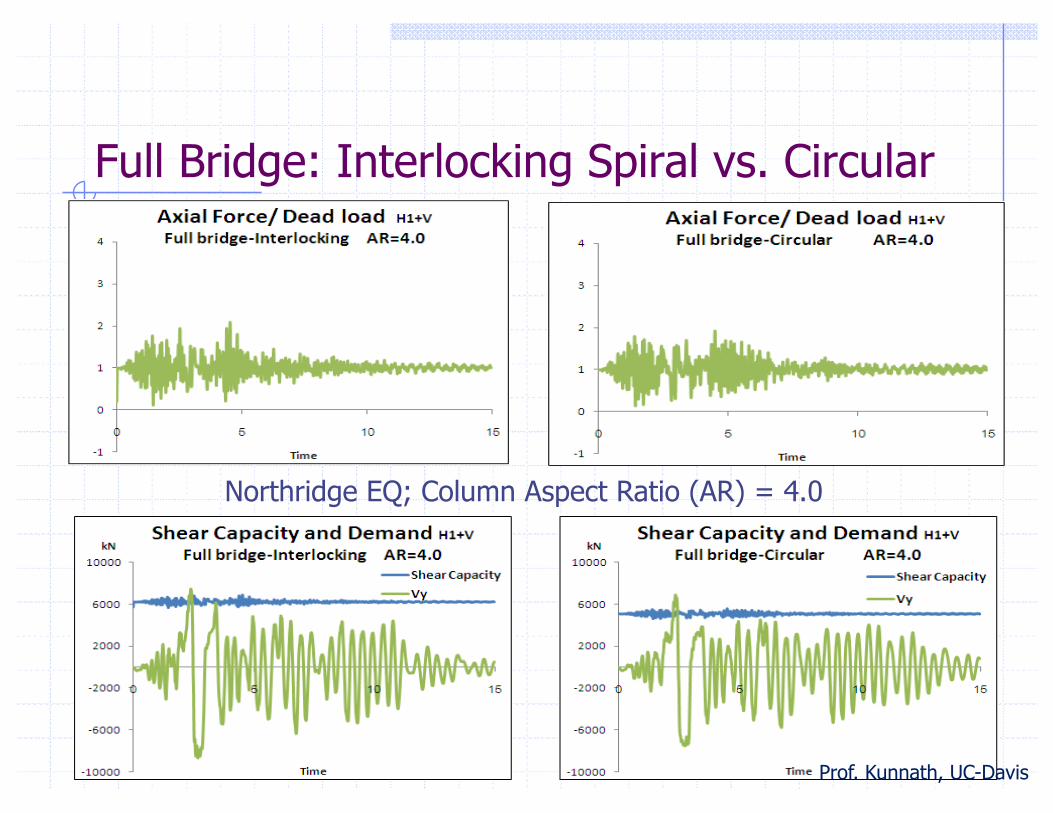
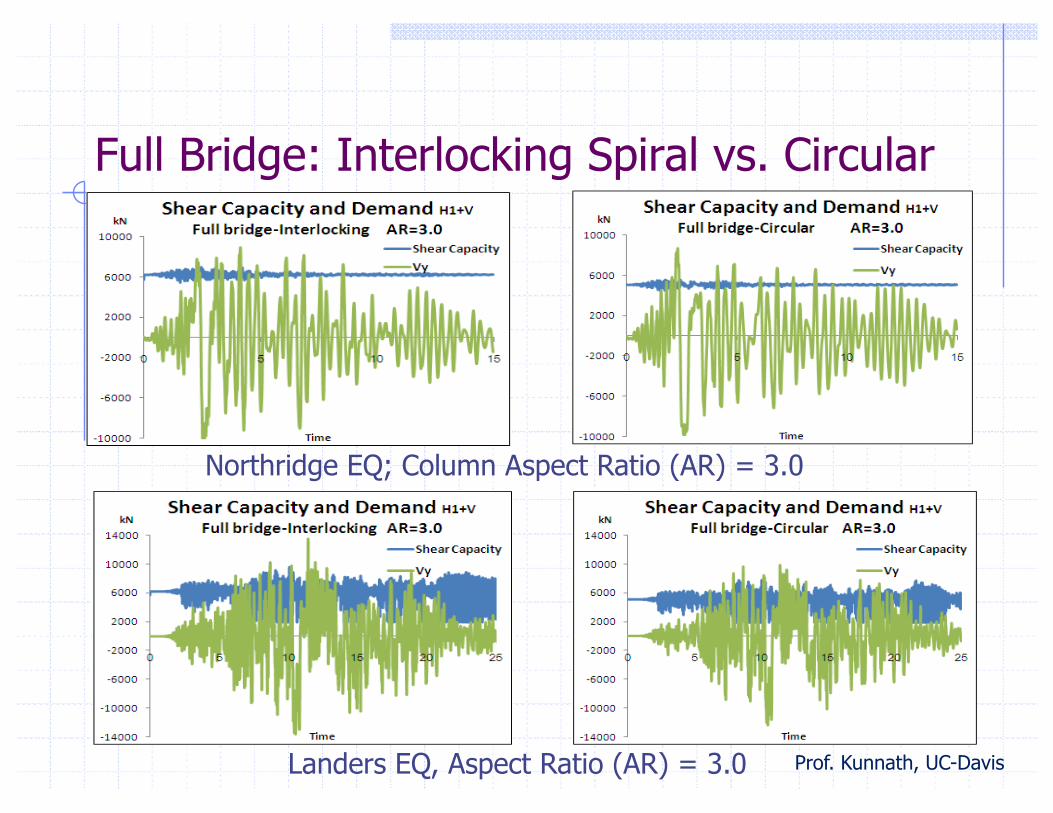
Full Bridge: Interlocking Spiral vs. Circular
Northridge EQ; Column Aspect Ratio (AR) = 4.0
Prof. Kunnath, UC-Davis
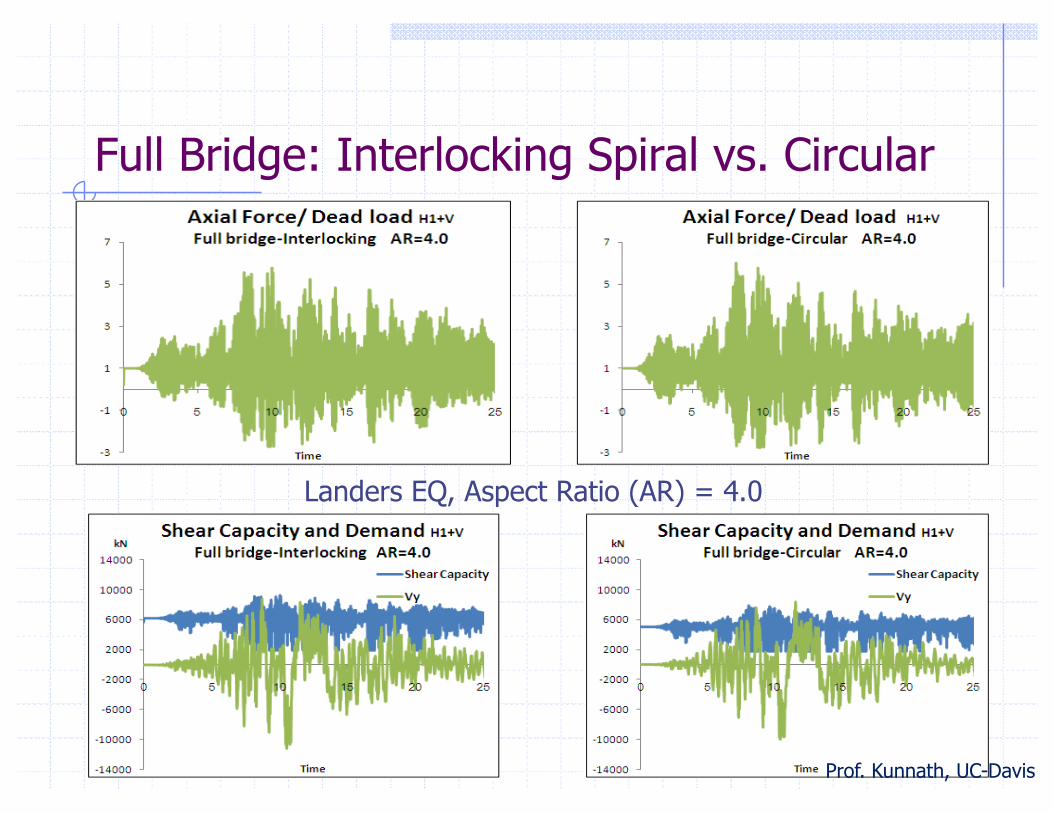
Full Bridge: Interlocking Spiral vs. Circular
Northridge EQ; Column Aspect Ratio (AR) = 3.0
Landers EQ, Aspect Ratio (AR) = 3.0 Prof. Kunnath, UC-Davis
Full Bridge: Interlocking Spiral vs. Circular
Landers EQ, Aspect Ratio (AR) = 4.0
Prof. Kunnath, UC-Davis
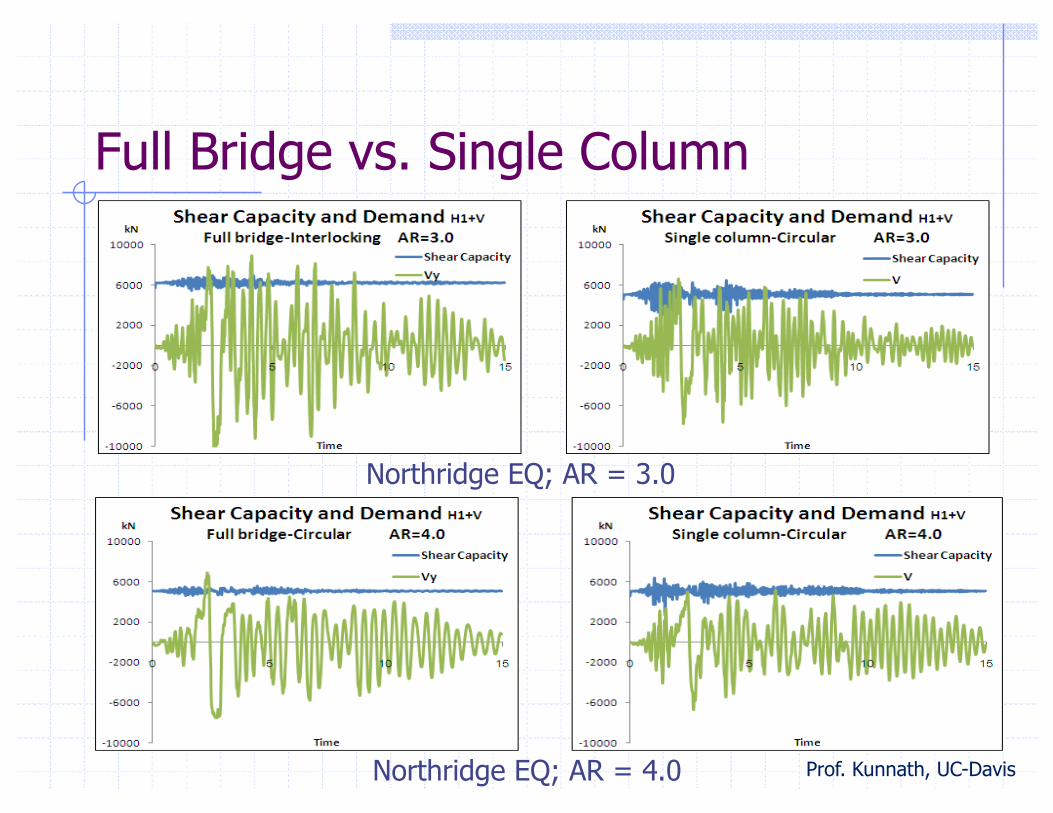
Full Bridge vs. Single Column
Northridge EQ; AR = 3.0
Northridge EQ; AR = 4.0 Prof. Kunnath, UC-Davis

• Withandwithoutmassmomentofiner1a
• AspectRa1o=2.5,3.0,3.5,4.0,4.5,5.0• BWHelementwithfibersec1on,HingelengthbyCaltrans
Parametric Study

meanofabs{(withver1cal/wover1cal)‐1}(fromtheen1rePEERNGAdatabase)
Type1 Type2
Parametric Study
AspectRa.o

AR=4.0,PacoimaDam(RSN1051)
kN
Sec
Parametric Study

CASE H (m)
D (m)
Aspect Ratio
Long Reinf. Spiral Reinf.
Long Reinf. Ratio
Spiral Reinf. Ratio
Mass (ton)
Mass Moment of Inertia
(MMI) (ton m2)
T (sec)
1 8 1.33 6 30 #29 #19 @ 160 mm 1.4% 0.54% 800 6000 1.82
2 8 2 4 44 #36 #19 @ 105 mm 1.4% 0.54% 800 6000 0.80
3 8 4 2 70 #57 #19 @ 53 mm 1.4% 0.54% 800 6000 0.20
• Case 2 is very similar to the equivalent cross section of the
Prototye Plumas Bridge
• Cases 1 and 3 are modified from Case 2
• MMI from hat shaped mass configuration s.t. centroid of mass
coincides with top of column
• Axial load level is 10% of Agf’c
• Confined concrete section [Talaat and Mosalam, 2007]
Parametric Study
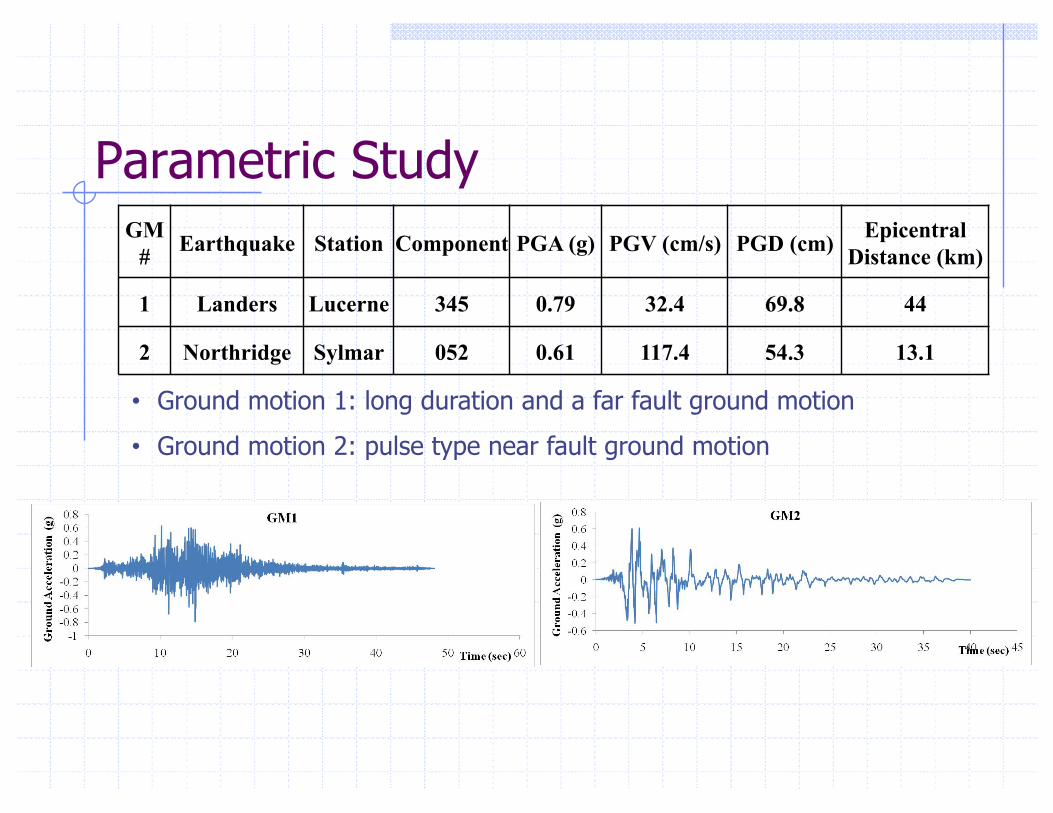
GM # Earthquake Station Component PGA (g) PGV (cm/s) PGD (cm) Epicentral
Distance (km)
1 Landers Lucerne 345 0.79 32.4 69.8 44
2 Northridge Sylmar 052 0.61 117.4 54.3 13.1
• Ground motion 1: long duration and a far fault ground motion
• Ground motion 2: pulse type near fault ground motion
Parametric Study

Parametric Study

Questions, Comments
Top Related