


Languages
Pages
Legal


• Jennifer Kaminski, PhD, is now with the National Center on Birth Defects and Developmental Disabilities, Centers for
Disease Control and Prevention, 1600 Clifton Rd, MS-E88, Atlanta, GA 30333, Phone 404.498.4159, E-mail
Journal of Research in Character Education, 7(2), 2009, pp. 51–73 ISSN 1543-1223
DEVELOPMENT AND VALIDATION OF
OUTCOME MEASURES FOR THE
SCHOOL-BASED SOCIAL AND CHARACTER
DEVELOPMENT PROGRAM
Jennifer Wyatt Kaminski Corinne David-Ferdon
National Center for Injury Prevention and Coordinating Center for Environment Health and
Control Centers for Disease Control and Prevention Injury Prevention Centers for Disease Control and
Prevention
Victor A. Battistich The Social and Character Development
Center for Character and Citizenship Research Consortium
,University of Missouri–St. Louis
The Social and Character Development (SACD) research program was designed to evaluate the effectiveness
of seven elementary-school-based programs developed to promote social and emotional competence, positive
behavior, a positive school climate, and academic achievement, and to decrease negative behavior. Procedures
undertaken by the SACD Consortium to optimize the outcome measures used in the multiprogram evaluation
are described. Preliminary analyses of the reliability and validity of the original scales, largely selected from
previous research, suggested that a smaller set of outcome measures with stronger psychometric properties
could be derived. The factor structure of these measures was examined using exploratory and confirmatory
factor analyses to distill the child outcome measures into a more parsimonious and practicable set of measures
for these programs. Support was found for a 5-, 3-, and 10-factor solution for the teacher, primary caregiver,
and child reports, respectively, which were stable across three assessment times, robust to different statistical
assumptions, and invariant across gender, race/ethnicity, and program site. A multitrait, multimethod analysis
confirmed construct convergence across reporters but also indicated significant reporter effects. In addition to
the measures’ utility in evaluating the effects of the SACD program, the process used and knowledge gained
are discussed to offer guidance to others who design and conduct evaluations of school-based programs. These
include the importance of using multiple reporters of data, assessing actual performance of a measure even if
previously published, and including measurement of altruistic behaviors as a unique feature of children’s
behavior.
52 Journal of Research in Character Education Vol. 7, No. 2, 2009
All too often, large-scale policy or program
initiatives lack an evaluation component to
assess their success in preventing or promoting
the intended outcomes (Koplan, Liverman,
Kraak, & Wisham, 2007; Lyons, Palmer,
Jayaratne, & Scherpf, 2006). Without such
information, the extent to which initiatives
should be continued, altered, or discontinued
cannot be appropriately determined (Elliott &
Tolan, 1999). Rigorous evaluation that
includes valid, reliable measurement is thus
needed to inform decision makers and practi-
tioners about program effectiveness. This arti-
cle describes the process by which a team of
researchers selected, developed, and validated
measures used to assess the effects of the inter-
ventions in the Social and Character Develop-
ment (SACD) research program on student
outcomes.
As detailed by Haegerich et al. and Flay et
al. (both in this volume), the SACD research
program was designed to evaluate the effec-
tiveness of seven different school-based inter-
ventions to promote social and emotional
competence, increase prosocial behavior,
decrease problem behavior, promote a positive
school climate, and support student academic
achievement. Although the approaches used
by each of the seven programs varied, they
consistently focused on accomplishing these
outcomes. Thus, in addition to specific, inde-
pendent evaluations of each program, the
SACD research study also included a
multiprogram evaluation based on a common
set of measures to determine the overall effects
of the seven programs combined and program-
specific effects on these outcomes.
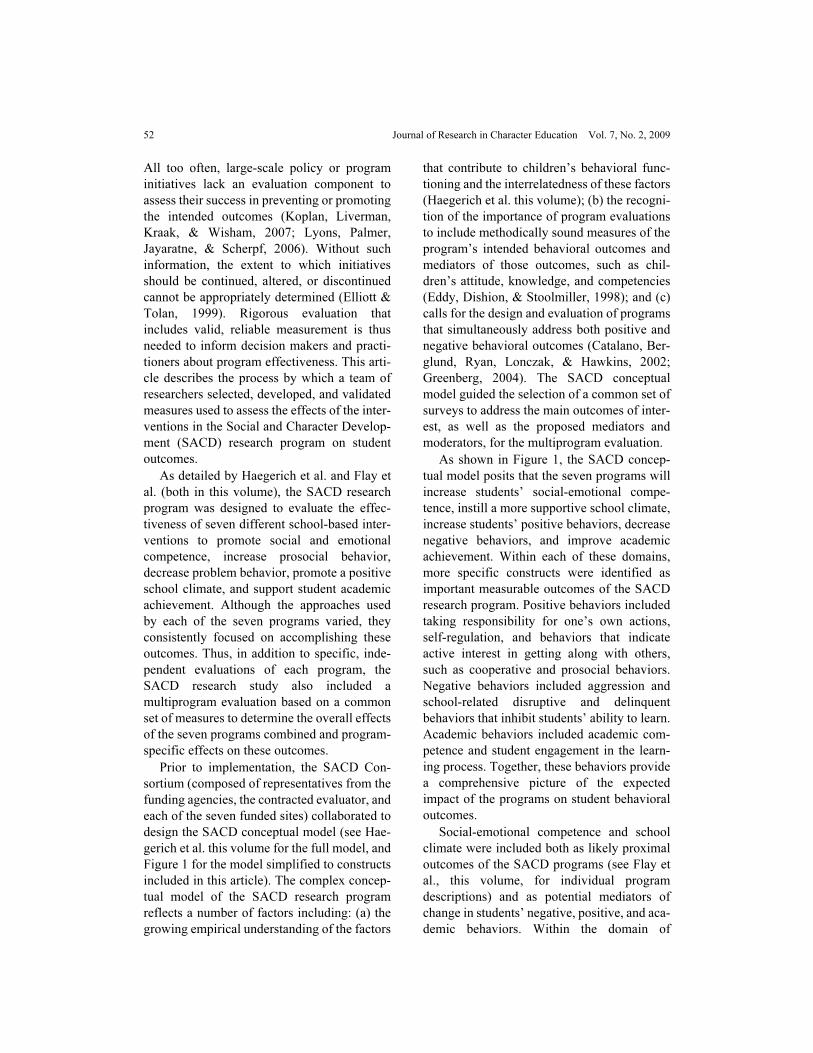
Prior to implementation, the SACD Con-
sortium (composed of representatives from the
funding agencies, the contracted evaluator, and
each of the seven funded sites) collaborated to
design the SACD conceptual model (see Hae-
gerich et al. this volume for the full model, and
Figure 1 for the model simplified to constructs
included in this article). The complex concep-
tual model of the SACD research program
reflects a number of factors including: (a) the
growing empirical understanding of the factors
that contribute to children’s behavioral func-
tioning and the interrelatedness of these factors
(Haegerich et al. this volume); (b) the recogni-
tion of the importance of program evaluations
to include methodically sound measures of the
program’s intended behavioral outcomes and
mediators of those outcomes, such as chil-
dren’s attitude, knowledge, and competencies
(Eddy, Dishion, & Stoolmiller, 1998); and (c)
calls for the design and evaluation of programs
that simultaneously address both positive and
negative behavioral outcomes (Catalano, Ber-
glund, Ryan, Lonczak, & Hawkins, 2002;
Greenberg, 2004). The SACD conceptual
model guided the selection of a common set of
surveys to address the main outcomes of inter-
est, as well as the proposed mediators and
moderators, for the multiprogram evaluation.
As shown in Figure 1, the SACD concep-
tual model posits that the seven programs will
increase students’ social-emotional compe-
tence, instill a more supportive school climate,
increase students’ positive behaviors, decrease
negative behaviors, and improve academic
achievement. Within each of these domains,
more specific constructs were identified as
important measurable outcomes of the SACD
research program. Positive behaviors included
taking responsibility for one’s own actions,
self-regulation, and behaviors that indicate
active interest in getting along with others,
such as cooperative and prosocial behaviors.
Negative behaviors included aggression and
school-related disruptive and delinquent
behaviors that inhibit students’ ability to learn.
Academic behaviors included academic com-
petence and student engagement in the learn-
ing process. Together, these behaviors provide
a comprehensive picture of the expected
impact of the programs on student behavioral
outcomes.
Social-emotional competence and school
climate were included both as likely proximal
outcomes of the SACD programs (see Flay et
al., this volume, for individual program
descriptions) and as potential mediators of
change in students’ negative, positive, and aca-
demic behaviors. Within the domain of
Development and Validation of Outcome Measures 53
SO
CIA
L A
ND
CH
AR
AC
TE
R
DE
VE
LO
PM
EN
T
IN
TE
RV
EN
TIO
NS
SO
CIA
L E
MO
TIO
NA
L
CO
MP
ET
EN
CE
Attitu
des ab
ou
t ag
gressio
n
Self-efficacy
Em
path
y
PE
RC
EP
TIO
NS O
F
SC
HO
OL
C
LIM
AT
E
� Sch
oo
l co
nn
ected
ness
Victim
izatio
n
Feelin
gs o
f safety
at sch
oo
l
BE
HA
VIO
R
Positive B
eh
avior
������������ ����
������ ���� ����
���������� ����
������ ����
Negative b
eh
avior
����������
����������������
����������� ��������� ����
AC
AD
EM
IC
S
� �� ����������������
�� �������� �������
� �
FIG
UR
E 1
Co
nce
ptu
al m
od
el f
or
the
So
cial
an
d C
har
acte
r D
evel
op
men
t p
rog
ram
sim
pli
fied
to
co
nst
ruct
s ex
amin
ed i
n m
easu
rem
ent
mo
del
.
54 Journal of Research in Character Education Vol. 7, No. 2, 2009
social-emotional competence, children’s
beliefs about the acceptability of aggression
were identified for their documented associa-
tion with aggressive behaviors (e.g., Guerra,
Huesmann, Tolan, VanAcker, & Eron, 1995).
Empathy was the second competence selected,
as it has been shown to relate to both negative
and positive behaviors (e.g., Schultz, Izard, &
Bear, 2004). These two constructs relate
mostly to children’s motivation to engage in
negative or positive behaviors, but do not nec-
essarily address children’s ability to enact
desirable behaviors. Thus, children’s per-
ceived self-efficacy for engaging in social
interaction was also identified as an important
outcome. These social-emotional competen-
cies, hypothesized to be gained as a result of
program exposure, were expected to translate
into behavioral changes by providing students
the skills and tools to be successful in their
social and academic endeavors.
Within the domain of school climate, three
specific outcomes were included to determine
the extent to which the SACD programs
increased the warmth, caring, and safety of the
school’s social environment. School connect-
edness entails the degree to which individuals
feel like an integral part of a cohesive, support-
ive, school community and is likely to contrib-
ute to increased academic performance and
positive behaviors and decreased negative
behaviors (e.g., Battistich, Solomon, Watson,
& Schaps, 1997). Conversely, the degrees to
which students feel unsafe or are actually vic-
timized by peers are likely to decrease aca-
demic performance and positive behaviors and
increase negative or defensive behaviors (e.g.,
Orpinas & Horne, 2006). By increasing posi-
tive and decreasing negative experiences at
school, the programs were expected to
enhance students’ social and academic behav-
ioral outcomes.
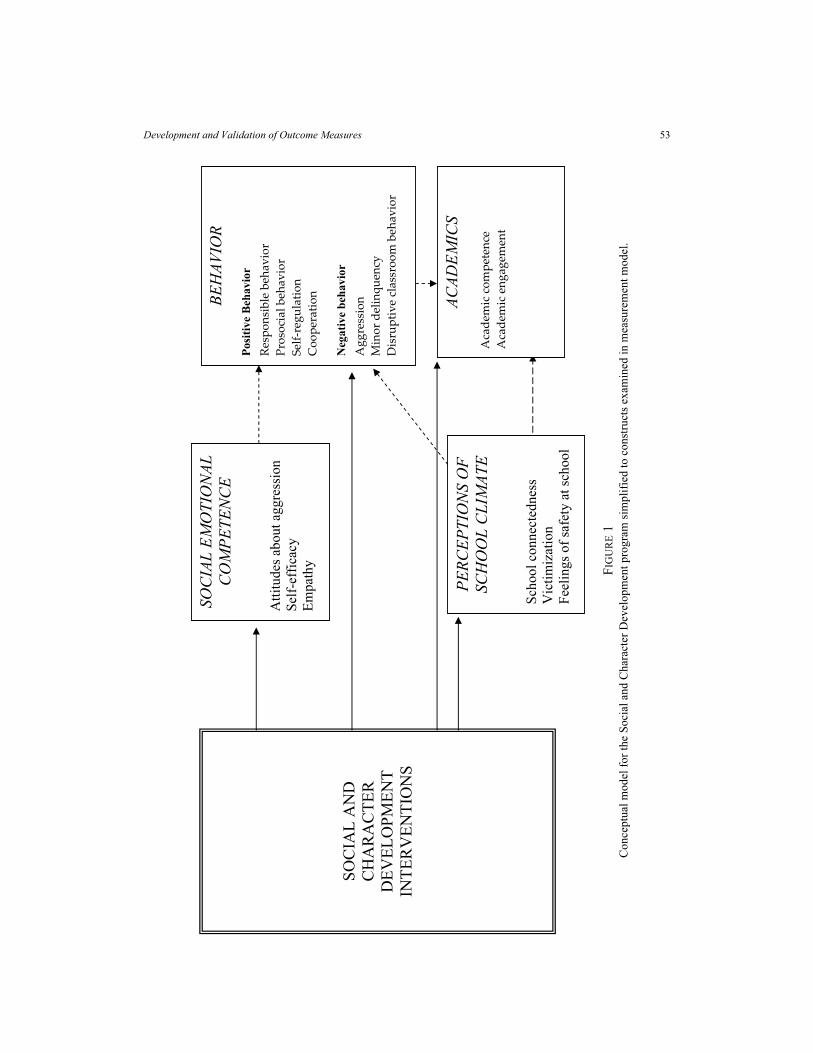
Each SACD program site administered a
core set of common measures (described below
and in Table 1), largely derived from previous
research, to assess the key child outcome
domains of interest. Whenever possible, sur-
veys validated with elementary-school-aged
children were selected, as were measures that
have been used to evaluate the effects of other
interventions. In order to reduce the impact of
potential reporter bias and increase confidence
in the obtained results, reports of child behav-
ior were elicited from multiple sources. By
assessing different reporters’ perspectives of a
child’s behavior and academic competence and
by assessing those behaviors in different set-
tings, a multi-informant approach offers a more
complete picture of child behaviors (Kraemer
et al., 2003; Noordhof, Oldehinkel, Verhulst, &
Ormel, 2008). Surveying the students directly
was included to provide otherwise unobtain-
able data on self-perceptions of attitudes and
behaviors. This comprehensive core set of
measures, used at all seven sites, was intended
to allow for conclusions about the social and
character development model across a variety
of specific program approaches.
When designing the evaluation of the
SACD model, several methodological chal-
lenges and considerations were recognized by
the SACD Consortium. For instance, validated
surveys that measured some proposed model
variables (e.g., responsibility-taking behavior)
were not available, and new measures had to
be developed. The psychometric properties of
even well-established measures of other vari-
ables required examination because measures
validated for one population may not be appli-
cable or methodically sound when used with
different populations (Farrell, Meyer, Kung, &
Sullivan, 2001; Joreskog & Sorbom, 2001;
Okazaki & Sue, 1995). Additionally, most of
the model variables and selected measures had
not previously been used in concert with each
other. Though the use of multiple informant
reports for similar behaviors was a potential
strength of the study, it necessitated a thorough
examination of the convergent and discrimi-
nant validity of the measures and method
effects (Campbell & Fiske, 1959; Eid et al.,
2008; Lance, Noble, & Scullen, 2002). This
article describes how these challenges were
addressed in developing valid and optimal
measures (Floyd & Widaman, 1995; Reise,
Development and Validation of Outcome Measures 55
TA
BL
E 1
Ch
ild
Ou
tco
me
Mea
sure
s S
elec
ted
fo
r In
clu
sio
n i
n t
he
Cro
ss-S
ite
Ev
alu
atio
n,
by
Do
mai
n o
f th
e S
AC
D P
rog
ram
Mo
del
Outc
om
e D
om
ain
Mea
sure
Mea
sure
Sourc
eR
esponden
t(s)a
Num
ber
of
Item
sb
Cro
nbach
’s
Alp
ha a
t
Base
line
Soci
al-
Em
oti
on
al
Com
pet
ence
Norm
ativ
e B
elie
fs A
bout
Aggre
ssio
nH
ues
man
n &
Guer
ra (
1997)
C8
.82
Chil
dre
n’s
Sel
f-E
ffic
acy f
or
Pee
r In
tera
ctio
ns
Sca
le
Whee
ler
& L
add (
1982)
C22
.83
Chil
dre
n’s
Em
pat
hy Q
ues
tionnai
reF
unk, E
llio
tt,
Jenks,
Bec
hto
ldt,
& T
savouss
is (
2001)
C16
.80
Sch
ool
Cli
mate
Sen
se o
f S
chool
as a
Com
munit
y S
cale
Rober
ts, H
orn
, &
Bat
tist
ich (
1995)
C14
.84
Fee
lings
of
Saf
ety a
t S
chool
Cre
ated
by S
AC
D C
onso
rtiu
m
C5
.73
Vic
tim
izat
ion S
cale
Orp
inas
, H
orn
e, &
Sta
nis
zew
ski
(2003)
C6
.86
Posi
tive
Beh
avio
rs
Soci
al C
om
pet
ence
Conduct
Pro
ble
ms
Pre
ven
tion R
esea
rch G
roup (
1991)
PC
/T19
.86/.
96
Alt
ruis
m S
cale
Solo
mon, B
atti
stic
h, W
atso
n,
Sch
aps,
& L
ewis
(2000)
C/P
C/T
8.8
8/.
88/.
89
Res
ponsi
bil
ity S
cale
Cre
ated
by S
AC
D C
onso
rtiu
mP
C/T
8.8
1/.
91
Neg
ati
ve
Beh
avio
rs
Aggre
ssio
n S
cale
Orp
inas
& F
rankow
ski
(2001)
C6
.83
BA
SC
Aggre
ssio
n S
ubsc
ale
Rey
nold
s &
Kam
phau
s (1
998)
PC
/T13/1
4.7
7/.
94
BA
SC
Conduct
Pro
ble
ms
Subsc
ale
Rey
nold
s &
Kam
phau
s (1
998)
PC
/T11/1
0.5
9/.
67
Fre
quen
cy o
f D
elin
quen
t B
ehav
ior
Dunfo
rd &
Ell
iott
(1984)
C7
.71
Att
enti
on-D
efic
it/H
yper
acti
vit
y D
isord
er (
AD
HD
)
Sym
pto
molo
gy
Inat
tenti
on/O
ver
acti
vit
y i
tem
s fr
om
Loney
& M
ilic
h (
1982)
and
item
s ad
apte
d f
rom
AD
HD
cri
teri
a fr
om
Am
eric
an P
sych
iatr
ic
Ass
oci
atio
n (
2000)
per
Pel
ham
et
al (1
992)
T10
.91
Aca
dem
ic B
ehavio
rs
Aca
dem
ic C
om
pet
ence
and M
oti
vat
ion
Adap
ted i
tem
s fr
om
Ach
enbac
h (
1991)
and G
resh
am &
Ell
iott
(1990)
T5
.96
Stu
den
t B
ehav
iora
l E
ngag
emen
t S
ubsc
ale
of
the
Engag
emen
t vs.
Dis
affe
ctio
n w
ith L
earn
ing S
cale
Furr
er &
Skin
ner
(2003)
C10
.67
a C
= c
hil
d,
PC
= p
rim
ary
car
egiv
er,
T =
tea
cher
.b T
he
num
ber
of
item
s fr
om
the
ori
gin
al m
easu
re s
elec
ted f
or
incl
usi
on i
n t
he
pil
ot
asse
ssm
ent
pac
kag
e. F
oll
ow
ing p
ilot
test
ing o
f th
e m
easu
res,
10 i
tem
s fr
om
th
e C
hil
dre
n’s
Sel
f-E
ffic
acy
fo
r P
eer
Inte
ract
ion
s sc
ale
and
1 i
tem
fro
m t
he
Fre
qu
ency
of
Del
inq
uen
t B
ehav
ior
scal
e w
ere
dro
pp
ed.

56 Journal of Research in Character Education Vol. 7, No. 2, 2009
Waller, & Comrey, 2000) to evaluate the
effects of the SACD program.
Initially, a comprehensive assessment bat-
tery was developed from a combination of
published and newly developed instruments
and was administered to students and their
teachers and primary caregivers. Baseline data
collected from this assessment battery were
then examined through a series of exploratory
and confirmatory factor analyses to develop a
parsimonious, practicable, and analytically
sound set of outcome measures for this SACD
multiprogram evaluation. The results provide
not only a description of a psychometrically
validated set of outcome measures, but also
lessons to guide future evaluations of similar
programs.1
METHODS
Participants
The seven research teams recruited a total
of 84 public elementary schools (42 interven-
tion and 42 control schools) into the study and
began the baseline data collection in fall 2004.
The average school enrollment was 567 stu-
dents, and 61% of students at the participating
schools were eligible for free or reduced-price
lunch. The average number of full-time teach-
ers per school was 39. Over half of the schools
(56%) were located in urban areas, 27% were
in suburban areas, and 17% served rural areas.
Informed consent (for primary caregivers and
teachers) and assent (for children) procedures
were followed per the protocols approved by
each site’s Institutional Review Board.
Approximately 65% of primary caregivers
consented to having their Grade 3 child and
child’s teacher participate in survey adminis-
tration, of which 94% of the child surveys and
96% of the teacher surveys were completed.
Primary caregivers’ own consent rate was
63%, with 92% of those consented returning
completed surveys.
The vast majority of primary caregivers
(86%) were mothers and stepmothers, with an
average age of 36 years. More than half of pri-
mary caregivers (57%) were married. The edu-
cational attainment of primary caregivers was
relatively high, with 61% having attended
some college or obtained a bachelor’s or
higher degree. A total of 847 third-grade teach-
ers completed surveys, most of whom were
female (88%) and White, non-Hispanic (75%).
These teachers had an average of almost 13
years of teaching experience. The baseline data
included in the analyses of this article repre-
sent approximately2 4,000 child self-reports,
primary caregiver reports for 3,780 children,
and teacher reports for 4,100 children col-
lected at intervention and control schools. As
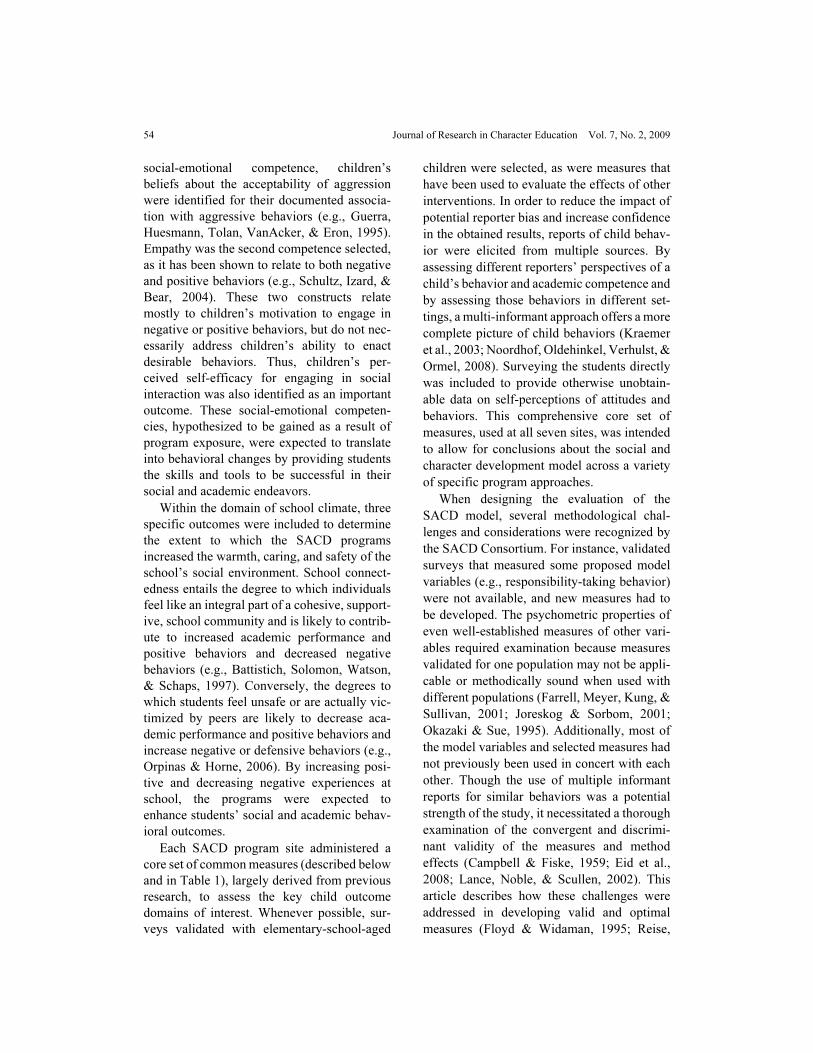
can be seen from the demographic information
on students in Table 2, there was considerable
variability across sites with respect to race/eth-
nicity and household income, indicating a
diversity of student populations included in the
SACD study.
Measures
Social-Emotional Competence. Previously
published and validated measures were readily
available for the three social-emotional com-
petencies identified in the SACD conceptual
model. Specifically, children’s attitudes about
the acceptability of aggression were assessed
by the eight General Approval of Aggression
items from the Normative Beliefs about
Aggression scale (Huesmann & Guerra, 1997).
These items (e.g., It is okay to yell at others
and say bad things; It is wrong to get into
physical fights with others) ask children to rate
the degree to which they feel that verbal and
physical aggression are appropriate.
With respect to children’s self-efficacy,
although a number of general measures were
available, the specific form of self-efficacy
most relevant to the SACD model and pro-
grams was a child’s sense of how capable they
feel interacting with peers. The Self-Efficacy
for Peer Interactions Scale (Wheeler & Ladd,
1982) was thus selected. This scale asks chil-
dren to rate how hard or easy it is to assert
themselves in 22 peer interaction situations.

Development and Validation of Outcome Measures 57
TA
BL
E 2
Pri
mar
y C
areg
iver
Rep
ort
ed D
emo
gra
ph
ic I
nfo
rmat
ion
of
Sam
ple
at
Bas
elin
e (F
all,
20
04
).
Tota
l Sam
ple
(n =
3770)
Sit
e 1
(n =
490)
Sit
e 2
(n =
420)
Sit
e 3
(n =
500)
Sit
e 4
(n =
620)
Sit
e 5
(n =
590)
Sit
e 6
(n =
590)
Sit
e 7
(n =
570)
Ch
ild
’s G
end
er
Mal
e47.5
48.3
42.5
50.1
48.0
50.4
46.3
46.9
Fem
ale
52.5
51.7
57.5
49.9
52.0
49.6
53.7
53.1
Ch
ild
’s R
ace
/Eth
nic
ity
Whit
e, n
on-H
ispan
ic42.1
5.3
56.1
32.7
64.9
82.9
6.0
46.6
Bla
ck, non-H
ispan
ic31.0
40.5
22.3
41.2
21.1
6.6
51.1
34.5
His
pan
ic19.2
45.9
11.5
17.3
7.9
4.7
37.4
9.9
Oth
er7.7
8.3
10.1
8.8
6.1
5.8
5.5
9.1
Tota
l H
ou
seh
old
In
com
e
Les
s th
an $
20,0
00
33.2
51.7
29.1
40.7
24.1
2.2
55.4
29.1
$20,0
00 t
o $
39,9
99
24.4
25.9
18.3
34.0
22.4
10.1
28.1
31.7
$40,0
00 t
o $
59,9
99
15.1
9.9
17.2
16.2
19.9
11.2
10.2
21.2
$60,0
00 o
r hig
her
27.3
12.5
35.5
9.1
33.5
76.5
6.3
18.0
Note:
All
cel
l v
alu
es r
epre
sen
t p
erce
nt
(%)
of
a sa
mp
le r
epo
rtin
g t
hat
cat
egory
. S
ample
siz
es r
eport
ed a
re r
ounded
to t
he
nea
rest
ten
, p
er S
AC
D R
estr
icte
d D
ata
Use
Ag
reem
ent.2

58 Journal of Research in Character Education Vol. 7, No. 2, 2009
Two types of peer-interaction situations are
included: conflict and nonconflict. For exam-
ple, one conflict situation item asks how hard
or easy it is to tell another child to stop teasing
a friend. One nonconflict item asks how hard
or easy it is to ask to sit with a group at lunch.
To assess children’s empathy, the 16-item
version of the Children’s Empathy Question-
naire (Funk, Elliott, Jenks, Bechtoldt, & Tsa-
voussis, 2001) was selected for its use of
concrete situations to assess empathic reac-
tions. The measure describes situations likely
to be encountered frequently by children and
asks children to respond whether they experi-
ence a particular emotion associated with each
situation (e.g., When I’m mean to someone, I
usually feel bad about it later; When I see
someone who is happy, I feel happy too).
School Climate. The Sense of School as a
Community Scale (Roberts, Horn, & Battis-
tich, 1995) was selected to assess general
aspects of school climate. For this scale, chil-
dren respond with their extent of agreement
with 14 statements about respect, caring, and
support within their school (e.g., Teachers and
students treat each other with respect; The stu-
dents in this school don’t really care about
each other; I can talk to the teachers in this
school about things that are bothering me).
Children were also asked to respond to a short-
ened, 6-item version of the Victimization
Scale (Orpinas, Horne, & Staniszewski, 1995)
to assess the frequency with which they expe-
rienced verbal, physical, or relational aggres-
sion at the hands of their peers. A final aspect
of school climate (i.e., perceptions about per-
sonal safety) lacked readily available and vali-
dated measures for elementary grade children
beyond single-item assessments used in previ-
ous research. Thus, the SACD Consortium
designed a new measure for this evaluation,
which is called the Feelings of Safety at School
scale. For this measure, children were asked to
rate their agreement or disagreement with five
statements about how safe students perceive
the school to be. Three statements were about
generally feeling safe or afraid at school, and
two were specific to feeling afraid that some-
one would bully or tease them at school.
Positive Social Behaviors. To assess
self-regulation, prosocial behavior, coopera-
tion, and responsible behavior, a combination
of previously validated and newly developed
scales was included. The Social Competence
Scale (Conduct Problems Prevention
Research Group, 1991) was selected to tap
into aspects of children’s positive social inter-
actions and control over their emotional and
behavioral responses. To maintain consis-
tency across reporters and provide outcome
data on the same child behaviors, the Emotion
Regulation Skills and Prosocial/Communica-
tion Skills subscales from the Teacher Ver-
sion were administered to both teachers and
primary caregivers. These two reporters
responded to 19 descriptions of discrete
behaviors (e.g., Resolves peer problems on
her/his own; Copes well with failure; Acts
friendly towards others) on how often the
child exhibits each self-regulatory or socially
appropriate behavior. To assess the extent to
which children exhibit prosocial behaviors
that more explicitly foster others’ success and
well-being, a specific measure of altruistic
behaviors was included. The Altruism Scale
(Solomon, Battistich, Watson, Schaps, &
Lewis, 2000) describes nine situations of
physical or emotional helping behaviors, and
asks how often a child has engaged in those
behaviors. For example, the prosocial situa-
tions include: cheered up someone who was
sad, helped someone who fell down, and
helped a younger child who was lost. All
three reporters (children, primary caregivers,
and teachers) reported on children’s altruistic
behaviors using this scale. One item, stopped
someone from hurting an animal, was omitted
from this evaluation due to concerns that it
might be disturbing to participants.
The final hypothesized positive behavior of
the SACD programs was the child’s expressed
degree of responsibility-taking for his/her
actions. As a literature search produced no pre-
viously published measures that had been suc-
cessfully used with children this young, it was
Development and Validation of Outcome Measures 59
necessary to create a new scale for the SACD
multiprogram evaluation. Working from how
the construct had been previously measured
with older children (e.g., Wentzel, 1991), the
SACD Consortium first generated a list of
behaviors that would be considered socially
responsible (e.g., keeping promises, taking
care of borrowed materials, asking permission,
taking responsibility). A decision was made to
use parent and teacher reports of children’s
responsible behaviors, and thus selected
behaviors from the list that would be readily
observable.
The final set of items for the Responsibility
Scale described six routinely available oppor-
tunities for children to exhibit accountability
and conscientiousness (i.e., asks before bor-
rowing or taking something, takes responsibil-
ity for one’s actions, apologizes when s/he has
done something wrong, takes care of borrowed
belongings, returns borrowed belongings, and
takes care of own things) and two irresponsible
behaviors (i.e., denies wrongdoing even when
confronted with evidence, and tries to get away
with things s/he knows are wrong). These
items not only represented situations in which
the failure of a child to act responsibly would
initiate action by primary caregivers or teach-
ers (e.g., returning an item borrowed without
permission; taking away materials not being
treated appropriately), but were also behav-
ioral indicators of the child’s internalization of
social agreements and conventions. Primary
caregivers and teachers rated the frequency
with which children engaged in each behavior.
Negative Social Behaviors. Aggressive
behaviors, minor delinquency, and disruptive
behaviors were assessed by a series of pub-
lished measures. Specifically, children were
asked to report on their own aggressive behav-
iors using a 6-item version of the Aggression
Scale (Orpinas & Frankowski, 2001). These
items include verbal (e.g., teasing, name-call-
ing), physical (pushing/shoving/hitting), and
relational (e.g., making up rumors) aggression.
Children also indicated how often they
engaged in rule-breaking behaviors using the
Frequency of Delinquent Behavior scale (Dun-
ford & Elliott, 1984). To minimize overlap
with the Aggression Scale, only seven items of
the Frequency of Delinquent Behavior scale
were selected and modified to reflect delin-
quent behavior in school, such as being sent
home from school, stealing at school, and skip-
ping class.
For teacher and primary caregiver reports of
children’s disruptive and oppositional/defiant
behaviors, the Aggression Subscale from the
Behavioral Assessment System for Children
(BASC; Reynolds & Kamphaus, 1998) was
selected. The 14-item teacher-report and
13-item primary-caregiver-report versions
include items that measures verbal (e.g., threat-
ening) and physical (e.g., hitting) aggression
and other disruptive behaviors (e.g., complains
about rules). The BASC Conduct Problems
Subscale (Reynolds & Kamphaus, 1998) was
also included to assess the frequency with
which teachers and caregivers observe children
breaking rules or not adhering to social conven-
tions. The 10 teacher-reported and 11 pri-
mary-caregiver-reported behaviors ranging
from relatively minor (e.g., showing a lack of
concern for others feelings) to very serious
(e.g., being suspended from school or in trou-
ble with the police).
To assess the degree to which children had
difficulty sustaining their attention and control-
ling their impulses, symptoms of attention def-
icits, impulsivity and hyperactivity were
gauged with a set of teacher-reported items
from two sources. First, the five Inattention/
Overactivity items from the IOWA Conners
Teacher’s Rating Scale (Loney & Milich,
1982) were selected. To augment the IOWA
Conners items, five items based on diagnostic
criteria for Attention-Deficit/Hyperactivity
Disorder (ADHD) from the Diagnostic and
Statistical Manual for Mental Disorders,
Fourth Edition (DSM; American Psychiatric
Association, 2000) were added. These items
have been shown to have the highest Positive
Predictive Power for ADHD diagnoses in
school settings (Pelham, Gnagy, Greenslade, &
Milich, 1992). The final set of 10 items
assessed a range of symptoms of ADHD, such
60 Journal of Research in Character Education Vol. 7, No. 2, 2009
as inattention, distractibility, verbal and physi-
cal impulsivity, losing things, and difficulty
organizing activities. Although respondent
burden considerations prohibited the use of an
entire DSM-based list of ADHD symptoms, a
recent review documents that brief symptom
lists, such as that utilized in this evaluation, are
as effective as longer, DSM-based lists in iden-
tifying ADHD (Pelham, Fabiano, & Massetti,
2005).
Academic Behavior. Five items from the
Social Skills Rating System (Gresham &
Elliott, 1990) and the Teacher Report Form of
the Child Behavior Checklist (Achenbach,
1991) were adapted to assess students’ school
performance and motivation for school suc-
cess. Teachers were asked to rate each child’s
performance in reading and math and overall
intellectual and academic performance relative
to grade-level standards and to rate each
child’s motivation to succeed academically
relative to the average student. In order to
assess children’s self-perceptions of commit-
ment to learning, the Student Behavioral
Engagement subscale of the Engagement ver-
sus Disaffection with Learning Scale (Furrer &
Skinner, 2003) was selected. This subscale
contains 10 child-reported items to assess the
extent of effort and attention that children
expend in their school work (e.g., When I’m in
class, I listen very carefully; I don’t try very
hard at school).
To simplify administration, scales were
grouped by the nature of the items (e.g., atti-
tudinal statements, descriptive scenarios with
questions) and by the type of response
required (e.g., degree of agreement, frequency
of behavior). Items from different scales were
then interspersed within groups. This format
simplified the number of different possible
response sets and different instructions,
thereby likely reducing measurement error,
especially for the child self-report. Children
were asked to respond based on the “past cou-
ple of weeks.” For primary caregivers and
teachers, the time frame given was the past 30
days. A 4-point frequency scale of Never,
Sometimes, Often, or Almost Always was used
for the teacher and primary caregiver report of
responsible behavior, social competence,
aggression, and conduct problems, and for the
teacher report of ADHD symptomology. A
4-point frequency scale of Never, Once or
Twice, A Few Times, or Many Times was used
for all three respondents’ reports of altruistic
behavior, and for children’s reports of aggres-
sion, minor delinquency, and victimization at
school. Children’s reports of empathy were
assessed with a 3-point scale of Yes, Some-
times, and No. For self-efficacy in peer inter-
actions, the four response options were Really
Easy, Sort of Easy, Sort of Hard, and Really
Hard. For acceptability of aggression, the four
response options were Really Wrong, Sort of
Wrong, Sort of Ok, and Perfectly Ok. School
connectedness, engagement with learning, and
feelings of safety at school were assessed with
a 4-point scale that ranged from Disagree a
Lot to Agree a Lot. Teachers’ reports of aca-
demic competence and motivation were rated
on 5-point scales. For academic competence,
the lowest and highest options were Far
Below Grade Level and Far Above Grade
Level, respectively. For academic motivation,
the lowest and highest options were Extremely
Low and Extremely High, respectively.
Procedures
Baseline administration of the assessment
package occurred in the fall of 2004, when
students were beginning the third grade. Sur-
veys were group-administered to students
with a proctor reading the directions, items,
and responses aloud as children followed
along in their survey booklets during a
50-minute classroom session. Teacher surveys
were self-administered and took approxi-
mately 15 minutes for each consented student
in their classroom. Primary caregivers either
self-administered the surveys or were con-
tacted by a researcher and completed the sur-
veys with a computer-assisted telephone
interview. Primary caregiver surveys took
approximately 15 minutes to complete.

Development and Validation of Outcome Measures 61
Postintervention data were collected in the
spring of 2005 and spring of 2006.
A pilot test of the measures and procedures
was conducted in December 2003. Based on
data and respondent feedback, a number of
revisions were made. Most changes were
minor, such as slight rewording or restructur-
ing of items to improve respondent under-
standing. Due to respondent fatigue concerns,
the relatively long (22-item) Self-Efficacy for
Peer Interactions scale was shortened to 12
items, which were selected based upon pre-
liminary analyses of the scale’s psychometric
properties. One additional item, taking things
from school without paying for them, such as
food from the lunchroom, was dropped from
the Frequency of Delinquent Behavior scale.
Pilot assessors reported that several children
who receive free lunch at school had diffi-
culty with this item. The SACD Consortium
agreed that, given the schools recruited into
the study, a sizeable number of students were
likely to have the same difficulty. The item
was therefore deleted from the assessment
protocol.
RESULTS
Reliability and Validity of Original
Scales
Examination of the internal consistency of
the scales administered at baseline revealed
that although most performed adequately (i.e.,
Cronbach’s alphas ≥ .80, see Table 1), six
scales did not. Three evidenced unacceptable
internal consistency (i.e., Cronbach’s alphas <
0.70). In addition, several scales were highly
inter-correlated, especially those from the
same informant (e.g., the correlation between
teacher report on the Responsibility Scale and
the Social Competence Scale was .90). These
indicators suggested that the selected scales as
originally defined might not represent the
most efficient set of child outcome instru-
ments.
Construction of a New Measurement
Model
Because of the low internal consistency of
some measures and strong relationship
between some scales, the SACD Consortium
conducted a set of increasingly rigorous analy-
ses to derive a more parsimonious set of out-
come measures with better psychometric
characteristics. The SACD Consortium deter-
mined that the best approach would be to con-
duct those analyses beginning at the individual
item level, irrespective of the scale of origin,
separately for each reporter. The analytic plans
involved an exploratory analysis to empirically
derive a measurement model with one ran-
domly selected half-sample, followed by a
series of confirmatory analyses to validate the
model on the remaining half-sample and with
increasingly conservative sets of validation
parameters and criteria.
As a first step, principal axis factor analyses
were conducted using SPSS to identify the
underlying structure of the measurement tool.3.
Individual items, rather than composite scale
scores, were analyzed, using data from a ran-
domly selected half of the baseline sample, and
analyses were conducted via listwise deletion
of missing values. Although a small number of
measures were administered to more than one
respondent group, most of the measures were
administered to only a single group of respon-
dents (see Table 1). Thus, teacher-report, pri-
mary-caregiver-report, and child-report items
were factor analyzed separately. Theoretical
(e.g., factor comprehensibility) and empirical
(i.e., eigenvalues and scree plots) criteria were
used to examine the solutions for each reporter
generated using Promax rotation. Based on
those examinations, different numbers of fac-
tors were extracted and those different solu-
tions and item assignments to factors
inspected. In comparing alternate factor solu-
tions, consideration was given to conceptual
clarity of the factors (i.e., whether the factors in
a solution made intuitive sense), the nature and
extent of cross-loading of items (i.e., how
many and which items were assigned to more

62 Journal of Research in Character Education Vol. 7, No. 2, 2009
than one factor), whether some factors were
defined by a very small number of items (or
single items), and parsimony (i.e., the absence
of multiple factors appearing to assess the same
basic construct).
On the basis of these comparisons, the 75
teacher items, 59 primary caregiver items, and
91 child items were optimally represented by
5, 3, and 10 underlying factors, respectively.
The five-factor teacher-report model resulted
in an eigenvalue of 2.52 and accounted for
57.85% of the variance of the items. Selection
of this solution was based on a clear visual
break in the scree plot (and corresponding dis-
continuity in eigenvalues), and because this
solution minimized the number of cross-load-
ing items (i.e., items with a loading of ≥.30 on
more than one factor; Field, 2005) while keep-
ing conceptually similar items within the same
factor. For example, in the four-factor solu-
tion, items purportedly measuring ADHD
symptoms were split across several other fac-
tors in a way that was not supported by previ-
ous literature. The three-factor primary
caregiver-report model was selected for clarity
of the factors, a minimized number of items
that did not load strongly on any factor, and for
a lack of cross-loaded items. For the three-fac-
tor model, the eigenvalue of 2.90 and the
cumulative variance accounted for (34.90%)
represented a clear break in the scree plot. The
ten-factor child-report model represented the
last clear break in the scree plot with an eigen-
value of 1.48 and variance accounted for
(44.00%). Although an eigenvalue > 1.00 cut-
off would have suggested 18 factors, the incre-
mental increase in variance explained in each
factor between 10 and 18 was extremely small.
As well, the 10-factor solution had no concep-
tual anomalies (e.g., theoretically unrelated
items loading onto the same factor), unlike
other solutions examined. Based on those
empirical and conceptual criteria, these factor
solutions were considered to have the strongest
justification to guide further measurement
modeling.
A small number of items were dropped
from the new measurement model at this stage
because they did not produce a standardized
coefficient ≥ 0.30 on any factor (Field, 2005).
These were three teacher-rated and five pri-
mary-caregiver-rated conduct problem items,
one primary-caregiver-rated aggression item,
five child empathy items, two engagement
with learning items, and one school connected-
ness item. Another small number of items
(e.g., being suspended from school) had very
low frequency of occurrence. As a result, these
items had somewhat lower correlations with
other items on the same factor. However, such
items were retained if they loaded only on a
single factor, were conceptually congruent
with other items on the factor, and contributed
to the reliability of the measure (i.e., their
omission would not have increased the mea-
sure’s estimated internal consistency). The
nine items that cross-loaded on multiple fac-
tors (i.e., items with standardized coefficients
≥ 0.30 on more than one factor)������������
��� ������ ������������� �� loading was stron-
ger. Seven of those items were from the
teacher report (one aggression item, four
ADHD symptomology items, and two social
competence items). Two cross-loaded items
came from the child’s report of school con-
nectedness.
Factors representing two constructs (Altru-
istic Behavior and Problem Behavior) were
identified for all three respondent groups. A
factor representing a third construct (Positive
Social Behavior) was identified for both teach-
ers and primary caregivers, and a factor repre-
senting two highly related constructs was
identified for children and teachers (Engage-
ment with Learning and Academic Compe-
tence and Motivation, respectively). The
remaining identified factors were specific to
each respondent group: teacher-reported
ADHD Symptomology and child-reported
Approval of Aggression, Self-Efficacy for
Peer Interactions, Empathy, Positive School
Orientation, Negative School Orientation, Stu-
dents Afraid at School, and Victimization at
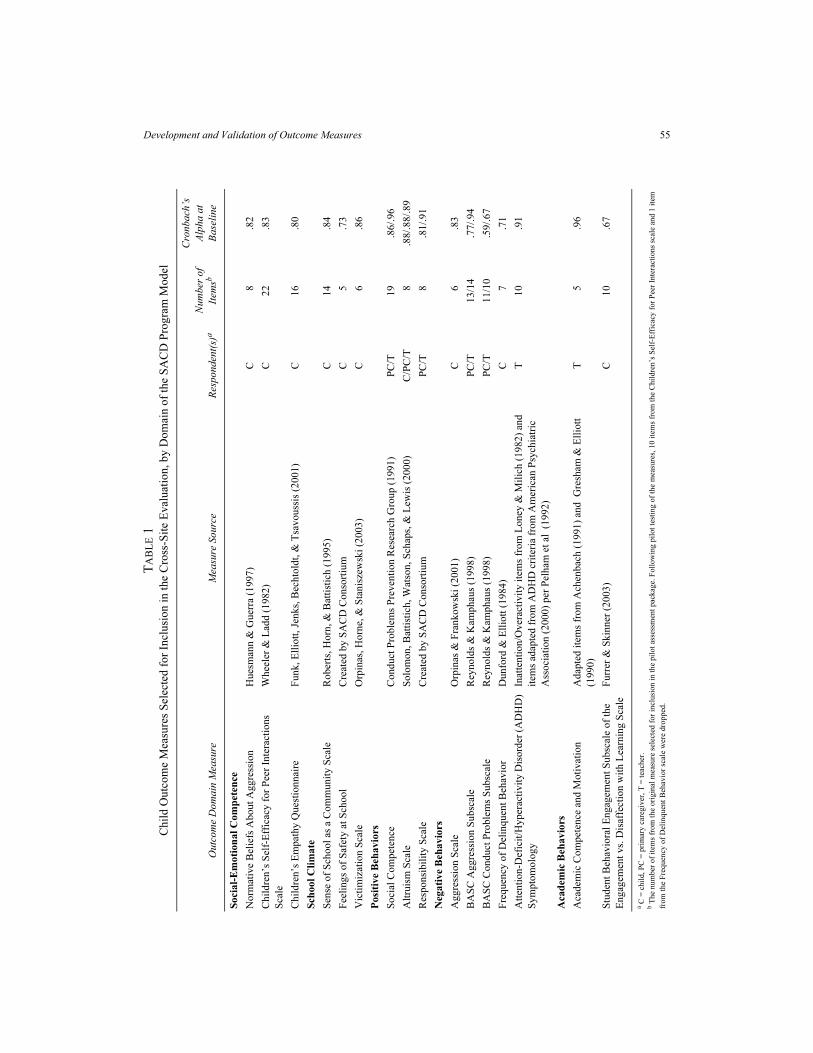
School. Each new factor, sources of items and
internal consistency coefficients are shown in
Table 3. Cronbach’s alphas for the 18 scales
Development and Validation of Outcome Measures 63
(given scale construction via equal weighting
of each relevant item) ranged from 0.78 to
0.97, suggesting that the factor solutions pro-
duced scales with high internal consistency.
Thus, the pool of items from the 22 original
scales could be distilled into a smaller set of 18
coherent factors, with psychometrically prob-
lematic items removed and measurement error
reduced.
Stability of the New Measurement Model
The exploratory nature of the above analy-
ses raises the question of whether the identi-
fied set of empirically derived factors is
specific to the randomly selected half of the
baseline sample or provides a stable and repro-
ducible measurement model. To address this
question, a series of confirmatory analyses
were undertaken to validate these factors with
other samples and subsamples. First, the
potential outcome measures identified in the
exploratory analyses were subjected to confir-
matory factor analyses in LISREL using the
remaining half of the baseline data (the “vali-
dation” sample), again separately by reporter
and employing listwise deletion of missing
data.4 Following conventional measurement
modeling techniques (e.g., Kline, 1998), each
analysis estimated the fit of the proposed mea-
surement structure to the validation sample’s
data, including item loadings from the respec-
tive latent variables, correlations among latent
variables, and error terms for the items. For
example, the results for the primary caregiver
survey reveal the degree to which the three fac-
tors (Positive Social Behavior, Problem
Behavior, and Altruistic Behavior) explain
variability in the 53 child behavior items to
which the caregivers were asked to respond.
Results for each of the three confirmatory
models tested indicated that the hypothesized
factor structures provided a good fit to the val-
idation sample’s data. Three indices of model
fit available are reported here: the χ2/df ratio
(for which smaller values indicate better fit;
Kline, 1998) the Comparative Fit Index (CFI;
for which values above 0.90 represent good fit;
Bentler, 1990) and the Root-Mean-Square
Error of Approximation (RMSEA; for which
values less than 0.10 are desirable; Browne &
Cudeck, 1992). For the 71 items in the teacher
survey, the confirmatory factor analysis of five
latent factors yielded a χ2/df ratio of 10.20, a
CFI of 0.98 and an RMSEA of 0.090 (90%
confidence interval [CI] = 0.089, 0.091). For
the 53 primary caregiver items, the confirma-
tory factor analysis of three latent factors
yielded a χ2/df ratio of 10.09, a CFI of 0.94
and an RMSEA of 0.087 (90% CI = 0.086,
0.088). For the 83 child items, the confirma-
tory factor analysis of 10 latent factors yielded
a χ2/df ratio of 7.18, a CFI of 0.91 and an
RMSEA of 0.060 (90% CI = 0.059, 0.061).5
These results confirm that the exploratory
models (i.e., the 5-factor teacher, 3-factor pri-
mary caregiver, and 10-factor child models)
generated using one half of the baseline data
were also appropriate to explain relationships
among item responses from the validation
sample. Thus, the new factors appear to repre-
sent the data well across both halves of the
baseline sample.
At this stage we also examined the patterns
of intercorrelation among latent factors. For the
five teacher-report factor the highest intercor-
relations (ranging from absolute values of .36
to .87) were among Positive Social Behaviors,
Problem Behaviors, Academic Competence
and Motivation, and ADHD Symptomology.
The Altruistic Behavior Scale was less strongly
related to each of those (with correlations rang-
ing from absolute values of .10 to .22). The
Altruistic Behavior Scale behaved similarly in
the primary caregiver report, with results sug-
gesting minimal correlations (correlation <
.15) with Positive and Negative Behavior.
These two latent factors had a strong correla-
tion of -.71. With a 10-factor child report solu-
tion, and 45 intercorrelations among latent
factors, patterns are more difficult to discern.
The strongest correlations (with absolute val-
ues ranging from .55 to .68) involved the Posi-
tive and Negative School Orientation factors
and Engagement with Learning. Once again,
the Altruistic Behaviors factor evidenced the

64 Journal of Research in Character Education Vol. 7, No. 2, 2009
least overlap with the remaining factors, corre-
lating moderately (absolute value >.30) with
only two factors: Empathy and Victimization at
School.
Although some of the original selected
measures had previously been extensively val-
idated with different demographic groups
(e.g., the BASC), most of the measures had
not. The exploratory and confirmatory tests of
the new measurement model above might
mask potentially important differences in
model fit for different subgroups or different
program sites. In other words, the new mea-
surement model might or might not work
equally well with different populations. Given
the demographic variability across sites (see
Table 2), a series of multigroup comparisons
were next conducted to examine the appropri-
ateness of the measurement model for different
groups defined by gender, race/ethnicity, and
site-specific sample.
These comparisons were conducted via
multigroup confirmatory factor analysis,
which separates a sample into subsamples
(e.g., boys and girls) and simultaneously tests
the proposed measurement model on each
group to determine whether the model fits each
group’s data equally well. Following conven-
tional methods (Bentler, 1995; Joreskog &
Sorbom, 2001), these analyses were conducted
by testing a series of nested models in which
three different sets of estimated parameters
(i.e., the factor loadings onto individual items,
the covariances among latent factors, and the
error variances) were constrained to be equal
across groups. The most conservative model
(i.e., in which all estimated parameters are
constrained to be equal across groups) is con-
sidered to be overly restrictive and is unlikely
to achieve adequate fit (e.g., Byrne, 1998). The
fit of slightly less restrictive models, such as
those that require only the factor loadings and
factor covariances to be equal across groups,
are considered more realistic indicators of
measurement invariance across groups. The
series of results is then inspected to determine
the point at which the factor structure achieves
adequate fit across subsamples. Each of the
three reporter-specific models (teacher, parent/
caregiver, and child) was examined separately
using multigroup comparisons on groups
defined by gender, race/ethnicity, and program
site, resulting in nine multigroup confirmatory
factor analyses.
As an example, the five-factor
teacher-report model was tested for invariance
across race/ethnicity (i.e., non-Hispanic
White, non-Hispanic Black, Hispanic, and
other). The completely restrictive model
(which tests the model fit if all parameters are
constrained to be equal for the four race/eth-
nicity groups), was a relatively poor fit to the
validation sample data. Although the χ2/df
ratio for that model was 5.93, the CFI was 0.69
and the RMSEA was 0.14. The next model
tested was the slightly less conservative, but
more realistic, model in which the factor load-
ings onto items and factor covariances were
constrained to be equal (i.e., the error vari-
ances were allowed to vary across groups).
This model evidenced adequate fit to the data,
with a χ2/df ratio of 0.48, a CFI of 1.00 and an
RMSEA of < 0.01. The χ2-difference between
the two models was significant [χ2 (213) =
54,940.73, p < .001], indicating an improve-
ment in fit with the release of the unrealistic
restriction. Thus, the five teacher-report fac-
tors represented the data from children of dif-
ferent racial/ethnic groups equally well,
allowing for measurement error to vary across
those groups.
In all nine of the multigroup comparisons,
this pattern was found, and thus the measure-
ment models were found to adequately repre-
sent the data across the variety of subgroups
tested. In summary, while a completely restric-
tive model did not fit the data well, the more
realistic model in which all factor loadings and
factor covariances were constrained to be
equal (but error variances were allowed to dif-
fer across groups) was a significant improve-
ment over the completely restrictive model and
provided a good fit to the multigroup data (all
χ2/df ratios were < 3.90, all CFIs were > 0.92
and all RMSEAs were < 0.08 for the less
restrictive second models, and all χ2-differ-

Development and Validation of Outcome Measures 65
ence tests were significant between first and
second models). The basic measurement
model therefore proved to be invariant across
child gender, across child race/ethnicity, and
across sites.
Finally, we examined the stability of the
measurement model over time by comparing
the confirmatory factor and multigroup confir-
matory analyses from data at baseline with
data collected 9 months later (in the spring of
2005, after one academic year of intervention)
and 21 months later (in the spring of 2006,
after two academic years of intervention). The
confirmatory factor analyses revealed that the
measurement model fit the baseline, 9-month,
and 21-month data equally well. Multigroup
analyses also indicated that, as with the base-
line data, the measurement model tested using
the 9-month and 21-month data were robust
across subsamples based on child gender and
race/ethnicity, and program site. In summary,
these multigroup comparisons provide strong
evidence that the factor structure does not vary
significantly across the different demographic
and geographic characteristics of the popula-
tion represented by the sample in this study.
Convergent Validity
The 18 scales shown in Table 3 represent
the final set of child outcome measures as
reported by the children, their primary caregiv-
ers, and their teachers. As can be seen, a few
similar outcome constructs (e.g., Altruistic
Behavior, Positive Social Behavior, and Prob-
lem Behavior) were identified from more than
one respondent group. The next step was to
investigate the extent of construct convergence
across respondents in the commonly measured
outcomes. In other words, is the primary care-
giver report of altruistic behavior assessing the
same construct as the child report of altruistic
behavior? A multitrait, multimethod confirma-
tory factor analysis (Marsh & Grayson, 1995)
was thus designed to identify the commonali-
ties across reporters. Such an analysis would
not only further validate the measurement
model by showing similarity of constructs, but
would also distinguish construct variance (i.e.,
variability in children’s scores due to actual
differences in children’s behavior) from sys-
tematic variance due to the respondent (e.g.,
primary caregivers’ general perceptions of
their child) and random measurement error.
Of the 18 outcome measures derived from
the exploratory and confirmatory analyses
above, only those assessing observable child
behaviors, for which multiple reporters were
possible, were appropriate for inclusion. Mea-
sures of children’s personal attitudes, affective
states, and perceptions of the school environ-
ment were not appropriate, leaving 11 behav-
ioral scales to be analyzed in a multitrait,
multireporter model. This analysis tested the
fit of the data from the 11 scales to a model
including “Reporter” latent variables (child,
primary caregiver, and teacher) to represent
variability common across child behaviors
assessed by the same respondent, and “Con-
struct” latent variables (Problem Behavior,
Positive Social Behavior, and Altruistic
Behavior) to represent variability common
across respondents about the same child
behaviors. Each of the scales would have two
paths, one from the relevant Reporter latent
variable and one from the relevant Construct
latent variable.
Despite repeated attempts and providing
starting values for the iterative estimation pro-
cedures, we were unsuccessful at achieving
convergence on a solution for a completely
explanatory model. However, convergence
and acceptable fit were attained with a model
that included the three Construct latent vari-
ables and two of the three Reporter latent vari-
ables and allowed the error variances of the
teacher-reported measures to be correlated.6
This model produced acceptable fit statistics
(χ2/df ratio = 2.26, CFI = 0.99, RMSEA =
0.03). In addition, all path weights were signif-
icantly different from zero and in the expected
direction. Inspection of the relative influence
of Construct and Reporter latent variables on
the measures revealed no discernable pattern.
For some measures, the Reporter path value
was greater than the Construct path value; for

66 Journal of Research in Character Education Vol. 7, No. 2, 2009
TA
BL
E 3
Ou
tco
me
Mea
sure
s D
eriv
ed F
rom
Ite
m-L
evel
Ex
plo
rato
ry F
acto
r A
nal
yse
s (b
y R
epo
rter
) o
f B
asel
ine
Dat
a
Rep
ort
er
Fact
or
Sourc
e of
Item
sC
ronbach
’s a
lpha
Ch
ild
Sel
f R
eport
Alt
ruis
tic
Beh
avio
r8 i
tem
s fr
om
Alt
ruis
m S
cale
0.8
8
Pro
ble
m B
ehav
ior
6 ite
ms
from
Fre
quen
cy o
f D
elin
quen
t B
ehav
ior
scal
e an
d 6
ite
ms
from
Aggre
ssio
n
scal
e
0.8
6
Engag
emen
t w
ith L
earn
ing
4 i
tem
s fr
om
Engag
emen
t vs.
Dis
affe
ctio
n w
ith L
earn
ing S
cale
0.8
4
Appro
val
of
Aggre
ssio
n8 i
tem
s fr
om
Norm
ativ
e B
elie
fs A
bout
Aggre
ssio
n s
cale
0.8
3
Sel
f-E
ffic
acy f
or
Pee
r In
tera
ctio
ns
12 i
tem
s fr
om
Chil
dre
n’s
Sel
f-E
ffic
acy f
or
Pee
r In
tera
ctio
n s
cale
0.8
3
Em
pat
hy
11 i
tem
s fr
om
Chil
dre
n’s
Em
pat
hy Q
ues
tionnai
re0.7
8
Posi
tive
Sch
ool
Ori
enta
tion
9 i
tem
s fr
om
Sen
se o
f S
chool
as a
Com
munit
y a
nd 1
ite
m f
rom
Fee
lings
of
Saf
ety
at S
chool
0.8
6
Neg
ativ
e S
chool
Ori
enta
tion
4 i
tem
s fr
om
Engag
emen
t vs.
Dis
affe
ctio
n w
ith L
earn
ing s
cale
and 4
ite
ms
from
Sen
se o
f S
chool
as a
Com
munit
y s
cale
0.7
8
Stu
den
ts A
frai
d a
t S
chool
4 i
tem
s fr
om
Fee
lings
of
Saf
ety a
t S
chool
scal
e0.7
9
Vic
tim
izat
ion a
t S
chool
6 i
tem
s fr
om
Vic
tim
izat
ion s
cale
0.8
6
Pri
mary
Care
giv
er R
eport
Alt
ruis
tic
Beh
avio
r8 i
tem
s fr
om
Alt
ruis
m S
cale
0.8
8
Pro
ble
m B
ehav
ior
12 ite
ms
from
BA
SC
Aggre
ssio
n s
ubsc
ale,
6 ite
ms
from
BA
SC
Conduct
Pro
ble
ms
subsc
ale,
and 2
ite
ms
fro
m t
he
Res
ponsi
bil
ity s
cale
0.8
6
Posi
tive
Soci
al b
ehav
ior
6 i
tem
s fr
om
Res
ponsi
bil
ity S
cale
and 1
9 i
tem
s fr
om
Soci
al C
om
pet
ence
sca
le0.9
3
Tea
cher
Rep
ort
Alt
ruis
tic
Beh
avio
r8 i
tem
s fr
om
Alt
ruis
m s
cale
0.8
9
Pro
ble
m B
ehav
ior
14 ite
ms
from
BA
SC
Aggre
ssio
n S
ubsc
ale,
7 ite
ms
from
BA
SC
Conduct
Pro
ble
ms
Subsc
ale,
and 2
ite
ms
from
Res
ponsi
bil
ity s
cale
0.9
5
Posi
tive
Soci
al B
ehav
ior
6 i
tem
s fr
om
Res
ponsi
bil
ity s
cale
and 1
9 i
tem
s fr
om
the
Soci
al C
om
pet
ence
sca
le0.9
7
Aca
dem
ic C
om
pet
ence
and
Moti
vat
ion
5 i
tem
s fr
om
Aca
dem
ic C
om
pet
ence
and M
oti
vat
ion s
cale
0.9
5
AD
HD
Sym
pto
molo
gy
5 i
tem
s fr
om
DS
M-I
V C
rite
ria
for
AD
HD
and 5
ite
ms
from
IO
WA
-Conner
s
Tea
cher
’s R
atin
g s
cale
0.9
1

Development and Validation of Outcome Measures 67
other measures, the reverse was true. No
reporter’s influence appeared to dominate
across all three Construct latent variables.
Thus, measures of child behavior were
affected by both the behavior construct being
assessed and by the person reporting on that
behavior.
DISCUSSION
To evaluate the effects of the seven SACD pro-
grams, a comprehensive assessment battery
was developed from a combination of pub-
lished and newly developed instruments and
administered to elementary school students
and their teachers and primary caregivers. A
series of increasingly rigorous analyses, which
included the examination of the scales’ psy-
chometric properties and exploratory and con-
firmatory factor analyses, were conducted to
validate and optimize the reliability of the out-
come measures. These analyses distilled the
individual items from 22 scales of children’s
attitudes, perceptions, and behaviors into a set
of 18 reliable and valid outcome measures.
The original assessment battery that included
75 teacher items, 59 primary caregiver items,
and 91 child items was optimally represented
by 5, 3, and 10 underlying factors, respec-
tively.
These measures thus provide empirical
benchmarks by which outcomes of the
school-based SACD initiative on elementary
school students can be monitored. Specifically,
the outcomes identified and validated were
measures of children’s: problem behaviors;
altruistic and other positive social behaviors;
symptoms of inattention, overactivity, and
impulsivity; academic competence, motiva-
tion, and engagement; positive and negative
school orientation; empathy; perceptions of
school safety and connectedness; and beliefs
about the acceptability of aggression. These
outcome measures may be of interest to school
administrators and other school-based pro-
grams intending to promote social and emo-
tional competence, increase positive behavior,
decrease negative behavior, promote a positive
school climate, and support student academic
achievement (Greenberg et al., 2003; Mans-
field, Alexander, Farris, & Westat, 1991).
This process and the resulting measures
also offer new knowledge and lessons learned
to others who are involved in evaluating simi-
lar programs. In the exploratory analyses, 17
of the original 225 items were dropped from
remaining analyses due to lack of consistency
with other items even from the same original
scales. While the dropped items only represent
7.5% of the total, for some measures the
dropped items represented 30-50% of the
items from the original full scale. The other
notable change from the measures as previ-
ously published was that 8 of the 18 validated
factors contained items from multiple scales.
This suggests a degree of redundancy among
the measures originally selected or created.
The extent to which items were dropped or
combined with items from other scales to form
the final validated factors means that most of
the measures required some adjustment during
this validation process.
The SACD Consortium’s evaluation strat-
egy and subsequent analyses suggest that
while it is considered good science to select
outcome measures based on previously pub-
lished and validated scales whenever possible,
such choices do not guarantee that a measure
will be appropriate in its entirety, for a particu-
lar situation, or in combination with other
closely related scales. Although we are not
suggesting that school-based program evalua-
tions routinely incorporate the level of analytic
examination described here or pick and choose
items from previously validated measures,
basic steps to investigate the utility and valid-
ity of existing measures for the population and
intervention of interest can usually be under-
taken. At minimum, internal consistency coef-
ficients for groups of items and bivariate
correlations among measures should be com-
puted with baseline data. If there are noticeable
discrepancies with previously published valid-
ity and reliability estimates for measures, or
correlations suggest unexpected patterns of
68 Journal of Research in Character Education Vol. 7, No. 2, 2009
relationships or a substantial degree of over-
lap, further investigation is warranted. The
inclusion of a large number of measures that
tap a variety of constructs may be necessary to
fully assess a complex model that guides the
development and evaluation of interventions,
such as the SACD programs. However, sizable
assessment batteries have a cost in terms of
project resources, a school’s ability and will-
ingness to continue participation across time,
and participant fatigue. More efficient mea-
surement of outcomes will allow programs to
optimize resources spent on evaluation.
This process also highlights the value in
obtaining data from multiple reporters of con-
structs whenever possible. Consistent with the
examination by others (Kraemer et al., 2003;
Noordhof et al., 2008), the results from the
multitrait, multimethod analysis suggest that
reports of child behaviors are influenced not
only by the behavior being reported upon, but
also by the reporter. It is important to acknowl-
edge that we cannot know from the current
analyses what the variance attributable to
reporter truly represents. Reporter variance
might represent unwanted reporter bias, such
as if children felt compelled to give socially
desirable responses, if primary caregivers
reported based on a particular positive or neg-
ative view of their children, or if teachers
reported based on only the salient behaviors
that rise to their attention over and above the
behaviors of the child’s classmates. Alterna-
tively, variance attributable to reporter might
reflect real behavioral differences associated
with the different types of information avail-
able to each respondent when rating behaviors
(Coie, Lochman, Terry, & Hyman, 1992; Kei-
ley, Bates, Dodge, & Pettit, 2000). For exam-
ple, primary caregivers and teachers likely
differ in their overall familiarity with the child,
in the amount of time they spend directly
observing the child, and in the nature of the sit-
uations in which they are able to observe the
child’s behavior. These differences in avail-
able information are quite likely to influence
their judgments about the child’s characteris-
tics and how they rate the child’s behavior.
Thus, systematic variance between respon-
dents may not necessarily be indicative of
error in observation, recollection, or reporting,
but may represent actual differences in child
behavior across multiple contexts. Sin-
gle-respondent reports of child behavior are
unlikely to capture accurately the complexity
of different child behavior types in different
situations and under different circumstances,
and therefore unlikely to assess the potential
full impact of an intervention.
This process unexpectedly revealed an
important finding regarding the inclusion of
measurement of altruistic behaviors. Such
behaviors are included in evaluations of child
behavioral interventions less often than aggres-
sive, delinquent or disruptive behaviors. Our
collective experience suggests this is partially
due to the historically prevailing deficit-based
approach to prevention, and partially due to a
relatively common belief that prosocial behav-
iors are merely the converse of antisocial
behaviors. Based on the consistently low corre-
lations of the Altruistic Behavior factors (in
child, primary caregiver, and teacher report)
with other factors, we have documented that
prosocial behaviors, such as helping or sharing,
are a distinct set of behaviors. These results
provide strong evidence that by not including
measurement of prosocial behaviors, evalua-
tions of child behavioral interventions will
miss an important, unique aspect of children’s
behavior and possible program effects.
As with any study, limitations exist in the
data and in the analyses conducted to model
those data. The data included here are represen-
tative of students in public schools similar to
those that each funded site successfully
recruited into an evaluation of school-based
SACD programs. The data also reflect the char-
acteristics and behaviors of third-grade stu-
dents whose primary caregivers provided
informed consent to participate in the research.
While the site-specific samples appear to be
relatively diverse demographically, we cannot
know the extent to which these results general-
ize beyond the population represented by the
sample included here.
Development and Validation of Outcome Measures 69
Although observational measures of
school- and classroom-level variables were
included in the overall SACD evaluation, they
were not used in the assessment of individual
child behavioral outcomes. Thus, the process
described here includes only a set of surveys
administered to children, primary caregivers
and teachers. We do not know the extent to
which the results would generalize to other
common modes of data collection for children
in this age range, such as naturalistic observa-
tion, laboratory tasks, or peer reports. How-
ever, the final model tested using all three
reporters’ data suggests only a moderate
degree of correlation among child behavioral
ratings obtained from self report, teacher
report and primary caregiver report. Future
research could include other modes of data
collection to help elucidate the degree to which
reporter differences are based on actual behav-
ioral differences in different contexts (e.g.,
home vs. school) or on biased reporting.
With respect to the analyses, we
acknowledged and took into consideration the
controversy over the use of exploratory ana-
lytic methods (e.g., Fabrigar, Wegener, Mac-
Callum, & Strahan, 1999; Hurley et al., 1997).
We specifically designed the extensive set of
confirmatory analyses to overcome many of
the concerns and limitations of data-driven
strategies. The measurement model was first
validated on a sample whose data were col-
lected concurrently with the data from the
exploratory analyses, to assure that the model
was not specific to a particular sample. Next,
measurement invariance was confirmed across
subgroups defined by gender, race/ethnicity,
and program site. The confirmatory and multi-
group confirmatory analyses were then
repeated using data collected at 9 and 21
months after baseline. Analyses were also con-
ducted to rule out anomalous findings with
respect to different statistical assumptions
regarding treatment of missing data and
decisions made based upon the use of different
statistical software packages. Finally, more
complex multitrait, multimethod
analyses investigated the extent of convergent
validity of the constructs across reporter and
highlighted the influence of reporter on child
behavior outcome measures. Few single scales
receive this degree of statistical scrutiny, and we
are aware of no equally rigorous examination of
a collection of scales. The typical arguments
against exploratory analyses, such as the
question of generalizability (or specificity) of
the results, are believed to have been adequately
addressed by the confirmatory analyses.
As highlighted by recent guides and
reviews (e.g., U.S. Department of Education,
2002; Hahn et al., 2007), school-based inter-
ventions have the potential to improve some
children’s social, behavioral, and academic
functioning. Without valid and reliable indica-
tors of outcomes, school systems cannot deter-
mine whether intervention resources are being
invested wisely. Accordingly, the use of theo-
retically meaningful and empirically sound
assessments in the evaluation of these inter-
ventions is essential to monitoring outcomes
and informing modifications of the programs.
Relying on a measure’s performance in past
research, may not provide the most valid,
reliable, or efficient method for assessing out-
comes.
AUTHORSHIP NOTES
The findings reported here are based on
research conducted as part of the Social and
Character Development (SACD) Research
Program funded by the Institute of Education
Sciences (IES), U.S. Department of Education,
under contract ED-01-CO- 0039/0006 to
Mathematica Policy Research (MPR), Prince-
ton, NJ, in collaboration with the Centers for
Disease Control and Prevention’s Division of
Violence Prevention (DVP), and the recipients
of SACD cooperative agreements. The SACD
Consortium consists of representatives from
IES, DVP, and the national evaluation contrac-
tor (MPR), and each cooperative agreement
site participating in the evaluation. Research
institutions in the SACD program (and princi-
70 Journal of Research in Character Education Vol. 7, No. 2, 2009
pal researchers) include: IES Amy Silverman,
Edward Metz, Elizabeth Albro, Caroline
Ebanks; DVP Tamara M. Haegerich (previ-
ously, IES), Corinne David-Ferdon, Le’Roy
Reese (Moorehouse School of Medicine; pre-
viously DVP); MPR Karen Needels, John A.
Burghardt, Heather Koball, Laura M. Kalb,
Peter Z. Schochet, Victor Battistich (Univer-
sity of Missouri—St. Louis); Childrens Insti-
tute Deborah B. Johnson, Hugh F. Crean; New
York University J. Lawrence Aber, Stephanie
M. Jones (Harvard University), Joshua L.
Brown (Fordham University); University at
Buffalo, The State University of New York Wil-
liam Pelham, Greta M. Massetti (CDC), Dan-
iel A. Waschbusch; Oregon State University
Brian R. Flay, Carol G. Allred (Positive
Action), David L. DuBois (University of Illi-
nois at Chicago), Michael L. Berbaum (Uni-
versity of Illinois at Chicago), Peter Ji
(University of Illinois at Chicago), Vanessa
Brechling, (University of Illinois at Chicago);
University of Maryland Gary D. Gottfredson,
Elise T. Pas, Allison Nebbergall; University of
North Carolina at Chapel Hill Mark W.
Fraser, Thomas W. Farmer (Penn State Uni-
versity), Maeda J. Galinsky, Kimberly Dadis-
man; and Vanderbilt University Leonard
Bickman, Catherine Smith.
Acknowledgment: The authors wish to
thank the Consortium reviewers who com-
mented on earlier drafts of this article. The
findings and conclusions in this report are
those of the authors and do not necessarily
represent the official position of the Institute
of Education Sciences, Centers for Disease
Control and Prevention, Mathematica Policy
Research, Inc., or every Consortium member,
nor does mention of trade names, commercial
products, or organizations imply endorsement
by the U.S. Government.
NOTES
1. Data analyses for all 3 years of the SACD eval-
uation will be reported in a publication
authored by the SACD Research Consortium
and released by Institute of Education Sciences
(IES), U.S. Department of Education. Slight
variation in the reported data and statistics in
this article and a future publication may result
from small differences in the dataset used for
this article and the final dataset for this multisite
evaluation.
2. Per the SACD Restricted Data Use Agreement,
all unweighted, disaggregated samples sizes are
reported as rounded to the nearest 10 (e.g., 194
would be rounded to 190).
3. We thank an anonymous reviewer for the sug-
gestion that the extent of clustering (i.e., by
classroom or school) could be examined and
accounted for by reanalysis with currently
available software. While we are unable to do
so for the measurement model, potential effects
of the clustering of data are being accounted for
in the actual outcome analyses (articles in pro-
cess).
4. Although missing responses to individual sur-
vey items were infrequent (≤ 5% of responses
were missing for any item), and missing
item-response data did not appear to vary sys-
tematically, missing data might have influenced
the results of the confirmatory model testing in
unknown ways. Thus, the confirmatory analy-
ses were also conducted with a dataset in which
missing item responses were imputed using the
Expectation-Maximization (EM) algorithm
(Dempster, Laird, & Rubin, 1977), which cal-
culates the most likely response to a missing
item based on how that respondent answered
other items. As expected, in each of the confir-
matory analyses the use of EM imputation
resulted in a fit as good as, or better than, mod-
els that were tested using listwise deletion.
5. The fit index values reported throughout were
obtained via LISREL. For the same model and
same data, LISREL and EQS (Bentler, 1995)
will produce the same normal theory
chi-squared and RMSEA values, but produce
different measures of relative fit (such as the
CFI), which are calculated based on the inde-
pendence model (Schumacker & Lomax,
1996). To investigate the effects of this assump-
tion, confirmatory analyses were repeated via
EQS, resulting in similar conclusions of ade-
quate fit of the models to the data. Thus, the
measurement models were robust to the differ-
ent statistical techniques used and assumptions
employed by these two software packages.

Development and Validation of Outcome Measures 71
6. The only difference between this successful
model and the ideal model is whether the com-
mon variance shared only by teacher-reported
child behaviors (i.e., not attributable to latent
behavioral constructs) is attributable to a single
source (modeled by a single Teacher Report
latent variable in the ideal model) or to multiple
sources (modeled by multiple intercorrelated
error variances in the successful model).
Although this distinction is important in a full
structural model, it makes little difference for
the purpose of examining common construct
variance among the outcome measures to be
used in the SACD evaluation.
REFERENCES
Achenbach, T. M. (1991). Manual for the Teacher’s
Report Form and 1991 Profile. Burlington, VT:
University of Vermont, Department of
Psychiatry.
American Psychiatric Association. (2000). Diag-
nostic and Statistical Manual of Mental Disor-
ders, Fourth Edition, Text Revision.
Washington, DC: Author.
Battistich, V., Solomon, D., Watson, M., & Schaps,
E. (1997). Caring school communities. Educa-
tional Psychologist, 32, 137−151.
Bentler, P. M. (1990). Comparative fit indices in
structural models. Psychological Bulletin, 107,
238−246.
Bentler, P. M. (1995). EQS: Structural equations
program manual. Encino, CA: Multivariate
Software.
Browne, M. W., & Cudeck, R. (1992). Alternative
ways of assessing model fit. Sociological Meth-
ods Research, 21, 230−258.
Byrne, B. M. (1998). Structural equation modeling
with LISREL, PRELIS, and SIMPLIS: basic con-
cepts, applications, and programming. Hills-
dale, NJ: Lawrence Erlbaum.
Campbell, D. T., & Fiske, D. W. (1959). Conver-
gent and discriminant validation by the multi-
trait-multimethod matrix. Psychological
Bulletin, 56, 81−105.
Catalano, R. F., Berglund, M. L., Ryan, J. A. M.,
Lonczak, H. S., & Hawkins, J. D. (2002). Posi-
tive youth development in the United States:
Research findings on evaluations of positive
youth development programs. Prevention &
Treatment, 5, no pagination specified.
Coie, J. D., Lochman, J. E., Terry, R., & Hyman, C.
(1992). Predicting early adolescent disorder
from childhood aggression and peer rejection.
Journal of Consulting and Clinical Psychology,
60, 783−792.
Conduct Problems Prevention Research Group.
(1991). Technical report. Durham, NC: Depart-
ment of Psychology, Duke University.
Dempster, A. P., Laird, N. M., & Rubin, D. B.
(1977). Maximum likelihood estimation from
incomplete data via the EM algorithm. Journal
of the Royal Statistical Society Series B, 39,
1−38.
Dunford, F. W., & Elliott, D. S. (1984). Identifying
career offenders using self-reported data. Jour-
nal of Research in Crime and Delinquency, 21,
57−86.
Eddy, J. M., Dishion, T. J., & Stoolmiller, M.
(1998). The analysis of intervention change in
children and families: Methodological and con-
ceptual issues embedded in intervention studies.
Journal of Abnormal Child Psychology, 26,
53−69.
Eid, M., Nussbeck, F. W., Geiser, C., Cole, D. A.,
Gollwitzer, M., & Lischetzke, T. (2008). Struc-
tural equation modeling of multitrait-multim-
ethod data: Different models for different types
of methods. Psychological Methods, 13,
230-253.
Elliott, D. S., & Tolan, P. H. (1999). Youth violence
prevention, intervention, and social policy: An
overview. In D. J. Flannery & C. R. Huff (Eds.),
Youth violence prevention, intervention, and
social policy (pp. 3-46). Washington, DC:
American Psychiatric Press.
Fabrigar, L. R., Wegener, D. T., MacCallum, R. C.,
& Strahan, E. J. (1999). Evaluating the use of
exploratory factor analysis in psychological
research. Psychological Methods, 4, 272−299.
Farrell, A. D., Meyer, A. L., Kung, E. M., & Sulli-
van, T. N. (2001). Development and evaluation
of school-based violence prevention programs.
Journal of Clinical Child Psychology, 30,
207−220.
Field, A. (2005). Discovering statistics using SPSS,
2nd edition. Thousand Oaks, CA: SAGE.
Floyd, F. J., & Widaman, K. F. (1995). Factor anal-
ysis in the development and refinement of clini-
cal assessment instruments. Psychological
Assessment, 7, 286−299.
Funk, J., Elliott, R., Jenks, J., Bechtoldt, H., & Tsa-
voussis, A. (2001). The Children’s Empathy
Questionnaire. Unpublished raw data.

72 Journal of Research in Character Education Vol. 7, No. 2, 2009
Furrer, C., & Skinner, E. (2003). Sense of related-
ness as a factor in children’s academic engage-
ment and performance. Journal of Educational
Psychology, 95, 148−162.
Greenberg, M. T. (2004). Current and future chal-
lenges in school-based prevention: The
researcher perspective. Prevention Science, 5,
5−13.
Greenberg, M. T., Weissberg, R. P., Utne O’Brien,
M., Zins, J. E., Fredericks, L., Resnik, H., et al.
(2003). Enhancing school-based prevention and
youth development through coordinated social,
emotional, and academic learning. American
Psychologist, 58, 466−474.
Gresham, F. M., & Elliott, S. N. (1990). Social
Skills Rating System. Circle Pines, MN: Ameri-
can Guidance Service.
Guerra, N. G., Huessman, L. R., Tolan, P. H.,
VanAcker, R. & Eron, L. D. (1995). Stressful
events and individual beliefs as correlates of
economic disadvantage and aggression among
urban children. Journal of Consulting and Clini-
cal Psychology, 63, 518−528.
Hahn, R., Fuqua-Whitley, D., Wethington, H.,
Lowy, J., Crosby, A., Fullilove, M., et al.
(2007). Effectiveness of universal school-based
programs to prevent violent and aggressive
behavior: A systematic review. American Jour-
nal of Preventive Medicine, 33 (Suppl. 2),
114−129.
Huesmann, L. R., & Guerra, N. G. (1997). Chil-
dren’s normative beliefs about aggression and
aggressive behavior. Journal of Personality and
Social Psychology, 72, 408−419.
Hurley, A. E., Scandura, T. A., Schriesheim, C. A.,
Brannick, M. T., Seers, A., Vandenberg, R. J., et
al. (1997). Exploratory and confirmatory factor
analysis: Guidelines, issues, and alternatives.
Journal of Organizational Behavior, 18,
667−683.
Joreskog, K., & Sorbom, D. (2001). LISREL: Users
reference guide. Lincolnwood, IL: Scientific
Software International.
Keiley, M. K., Bates, J. E., Dodge, K. A., & Pettit,
G. S. (2000). A cross-domain growth analysis:
Externalizing and internalizing behaviors during
8 years of childhood. Journal of Abnormal Child
Psychology, 28, 161−179.
Kline, R. B. (1998). Principles and practices of
structural equation modeling. New York: Guil-
ford Press.
Koplan, J. P., Liverman, C. T., Kraak, V. I., &
Wisham, S. L. (Eds.). (2007). Progress in pre-
venting childhood obesity: How do we measure
up? Washington, DC: Institute of Medicine
National Academies Press.
Kraemer, H. C., Measelle, J. R., Ablow, J. C.,
Essex, M. J., Boyce, W. T., & Kupfer, D.J.
(2003). A new approach to integrating data from
multiple informants in psychiatric assessment
and research: Mixing and matching contexts and
perspectives. American Journal of Psychiatry
160, 1566–1577.
Lance, C. E., Noble, C. L., & Scullen, S. E. (2002).
A critique of the correlated trait-correlated
method and correlated uniqueness models of
multitrait-multimethod data. Psychological
Methods, 7, 228−244.
Loney, J., & Milich, R. (1982). Hyperactivity, inat-
tention, and aggression in clinical practice.
Advances in Developmental Behavioral Pediat-
rics, 3, 113−147.
Lyons, A. C., Palmer, L., Jayaratne, K. S. U., &
Scherpf, E. (2006). Are we making the grade? A
national overview of financial education and
program evaluation. Journal of Consumer
Affairs, 40, 208−235.
Mansfield, W., Alexander, D., Farris, E., & Westat,
Inc. (1991). Fast Response Survey System,
Teacher survey on safe, disciplined, and
drug-free schools (NCES 91-091). Washington,
DC: National Center for Education Statistics,
Office of Educational Research and Improve-
ment, U.S. Department of Education.
Marsh, H. W., & Grayson, D. (1995). Latent vari-
able models of multitrait-multimethod data. In
R. H. Hoyle (Ed.) Structural equation modeling:
Concepts, issues, and applications. (pp.
177−198). Thousand Oaks, CA: SAGE.
Noordhof, A., Oldehinkel, A. J., Verhulst, F. C., &
Ormel, J. (2008). Optimal use of multi-infor-
mant data on co-occurrence of internalizing and
externalizing problems: The TRAILS study.
International Journal of Methods in Psychiatric
Research, 17, 174−183.
Okazaki, S., & Sue, S. (1995). Methodological
issues in assessment research with ethnic minor-
ities. Psychological Assessment, 7, 367−375.
Orpinas, P., & Frankowski, R. (2001). The Aggres-
sion Scale: A self-report measure of aggressive
behavior for young adolescents. Journal of Early
Adolescence, 21, 50−67.
Orpinas, P., & Horne, A. M. (2006). Bullying pre-
vention: Creating a positive school climate and
developing social competence. Washington, DC:
American Psychological Association.
Development and Validation of Outcome Measures 73
Orpinas, P., Horne, A. M., & Staniszewski, D.
(2003). School bullying: Changing the problem
by changing the school. School Psychology
Review, 32, 431−444.
Pelham, W. E., Fabiano, G. A., & Massetti, G. M.
(2005). Evidence-based assessment of atten-
tion-deficit/hyperactivity disorder in children
and adolescents. Journal of Clinical Child and
Adolescent Psychology, 34, 449−476.
Pelham, W. E., Gnagy, E. M., Greenslade, K. E., &
Milich, R. (1992). Teacher ratings of DSM-III-R
symptoms for the disruptive behavior disorders.
Journal of the American Academy of Child and
Adolescent Psychiatry, 31, 210−218.
Reise, S. P., Waller, N. G., & Comrey, A. L. (2000).
Factor analysis and scale revision. Psychological
Assessment, 12, 287−297.
Reynolds, C. R., & Kamphaus, R.W. (1998). Behav-
ioral Assessment System for Children. Circle
Pines, MN: American Guidance Service.
Roberts, W., Horn, A., & Battistich, V. (April,
1995). Assessing students’ and teachers’ sense
of the school as a caring community. Paper pre-
sented at the American Educational Research
Association, San Francisco, CA.
Schultz, D., Izard, C., & Bear, G. (2004). Children’s
emotion processing: Relations to emotionality
and aggression. Development and Psychopathol-
ogy, 16, 371−187.
Schumacker R. E., & Lomax, R. G. (1996). A begin-
ner’s guide to structural equation modeling.
Hillsdale, NJ: Lawrence Erlbaum.
Solomon, D., Battistich, V., Watson, M., Schaps,
R., & Lewis, C. (2000). A six-district study of
educational change: Direct and mediating effects
of the Child Development Project. Social Psy-
chology of Education, 4, 3−51.
United States Department of Education. (2002).
Exemplary and promising safe, disciplined, and
drug-free schools programs 2001. Washington,
DC: U.S. Department of Education.
Wentzel, K.R. (1991). Relations between social
competence and academic achievement in early
adolescence. Child Development, 62,
1066−1078.
Wheeler, V.A., & Ladd, G.W. (1982). Assessment
of children’s self-efficacy for social interactions
with peers. Developmental Psychology, 18,
795−805.

Copyright of Journal of Research in Character Education is the property of Information Age Publishing and its
content may not be copied or emailed to multiple sites or posted to a listserv without the copyright holder's
express written permission. However, users may print, download, or email articles for individual use.
Top Related