


Languages
Pages
Legal

Developing Africa:
Toward Customer Oriented Urban Transport Policy
By Wendell Cox
Demographia,
St. Louis-Missouri/Illinois Metropolitan Area (USA)
www.demographia.com
Paper presented to
CODATU XV Congress
African Union Headquarters
Addis Abeba, Ethiopia
23 October 2012

Keywords: Sub-Saharan Africa, cities, urban access, informal transport, mass transit, automobiles, 2-
wheelers, poverty
SUMMARY
Poverty eradication was identified in the recent Rio +20 conference as an “indispensible requirement” for
sustainability.”1 Developing Africa's poverty is intense and the cities, which are capturing most
population growth remain generally poorer than in other parts of the world. Economic research indicates
that better urban access (mobility) facilitates economic growth. Because of this relationship, this paper
suggests a policy approach to urban transport in Africa that would focus on maximizing spatial access in
the urban area. It is thus proposed that improving household affluence, including the eradication of
poverty, may be the most important policy objective of urban transport (collective and individual).
The proposed economic policy focus contrasts with emphasis on regulatory systems or travel modes. The
perspective is that the means of urban transport (both regulatory systems and travel modes) may be best
derived from strategies that maximize urban access, toward the end of improving household affluence.
Because of the present and expanding spatial geographies of African cities, the limitation of mode choice
to walking for many low income households would seem to be a significant barrier to improved
household affluence and poverty eradication.
Much of the international research is unfavorable toward the existing and largely informal mass transit
systems in developing Africa. Yet, for all of the criticisms, people have often chosen informal transport
over formal transport and the systems are strongly patronized. Any improvements in urban transport
would be likely contribute more to improved affluence and poverty eradication if they improve access
within urban areas.
Because of severely limited incomes, economically sustainable urban transport systems must be virtually
self-sustaining, financed by revenues generated commercially. Urban access indicators are proposed that
can be used to assist in meeting the objective of maximizing spatial access toward the objective of
improving household affluence.
1.0 INTRODUCTION
The recent Rio +20 Conference declared that (Rio +20 The Future We Want, 2012):
Eradicating poverty is the greatest global challenge facing the world today and an
indispensable requirement for sustainable development. In this regard we are committed to
free humanity from poverty and hunger as a matter of urgency.
This emphasis on poverty eradication is particularly appropriate in developing Africa.2 The gross
domestic product per capita in developing Africa is the lowest in the world. Improved urban transport has
an important role to play in improving incomes.
1 A revised title has been adopted in response to comments suggesting a need to more clearly describe the “policy”
focus of the contribution, to differentiate it from papers on service provision alternatives and regulatory frameworks. 2 Developing Africa, which in this paper refers to all of sub-Saharan Africa (as defined by the United Nations)
except for the middle income nations of South Africa and Botswana.

2.0 CITIES IN CONTEXT
Large cities are a relatively new development in human history (Figure 1). Before 1800, few cities ever
exceeded 1,000,000 population and virtually none retained that population level (Chandler, 1987).
Bagdad and Hangzhou may have briefly reached 1.5 million population (Modelski, 2000). By 1750, there
were no cities with 1,000,000 or more population, while one, Beijing, exceeded 1,000,000 in 1800
(Chandler, 1987). The spatial expansion of cities was constrained by the prevailing urban transport, which
was walking.
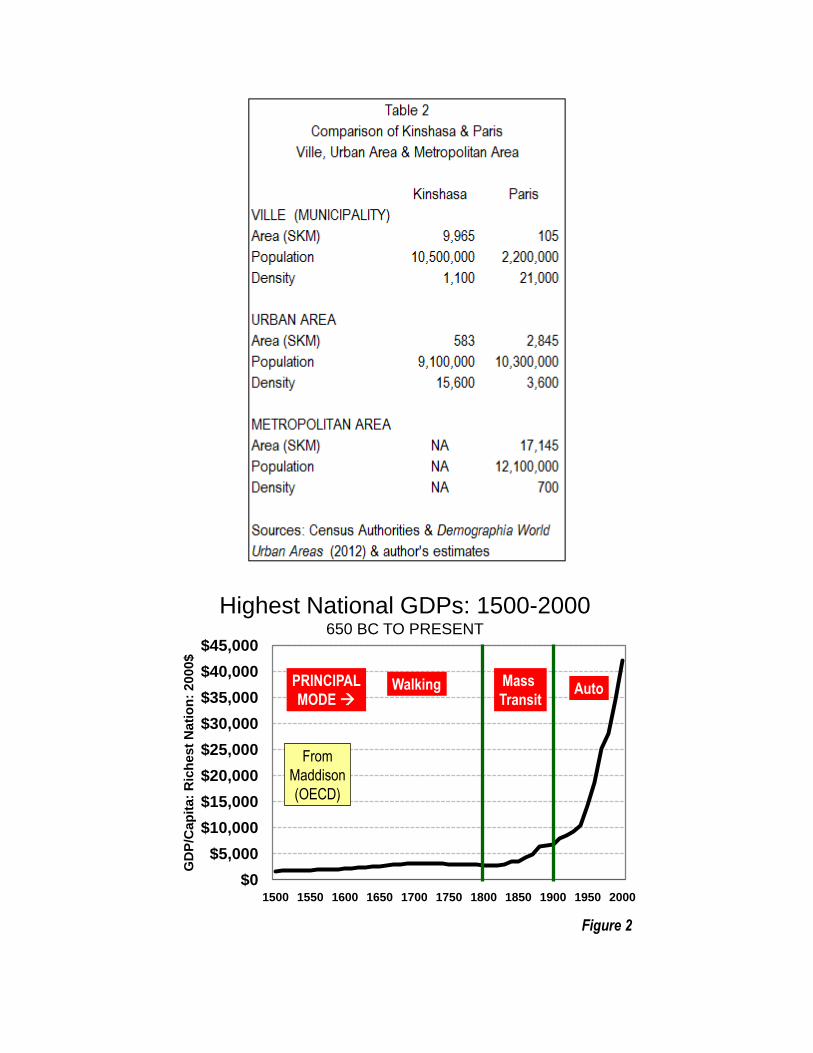
Since 1800, however, cities have increased substantially in population and spatial expanse. Urban
transport has been an important facilitator of that growth. By 1900, with the mass transit and the resulting
greater urban access (see Box), the largest city in the world (London) reached more than 6 million
population and 15 exceeded 1,000,000 (Chandler, 1987). In 2012, with the automobile and even greater
access, the largest city in the world (Tokyo) exceeds 35 million (Table 1), 53 cities exceed 6 million and
there are approximately 450 cities with 1,000,000 or more population (Demographia, 2012).
Box: Urban Access
Urban access can be measured at the urban area level to between locations within the urban area. Urban
access may be defined as follows:
Urban access is the percentage of metropolitan area employment that can be reached (door-to-
door) by the urban transport system in a specified period of time (such as 30 minutes).
2.1 Why Cities Grow: In 1800, less than 10 percent of the world population lived in urban areas.
Recently, the urban population exceeded 50 percent, for the first time. People moved to the cities to take
advantage of opportunities they anticipated would be better than where they came from. The draw of the
city, and thus its principal purpose is the economic advance of its residents. While many cities of the less
developed world have grinding poverty, the overall reality is that for the urban poor, conditions are not
sufficiently distressful to induce an exodus back to the even poorer rural areas from which they came.
Even with less than optimal choices, the city is usually better than the countryside.3
3 There is a report that "counter-urbanization" has been occurring in some developing African nations, because of
"weak urban economies." This could be related, at least in part, to insufficient urban access (Sporton, 2012).

Bertaud (2004) expresses the "economic" rationale of cities as follows:
The raison d’être of large cities is the increasing return to scale inherent to large labor markets.
The cities’ economic efficiency requires, therefore, avoiding any spatial fragmentation of labor
markets.
0
5
10
15
20
25
30
35
650B
C
400B
C
200B
C
100A
D
500
900
1000
1100
1200
1300
1400
1500
1600
1700
1800
1850
1900
1950
2000
Po
pu
lati
on
(M
illio
ns)
Year: (Irregular Scale)
World’s Largest Cities (Urban Areas)650 BC TO 2000
Figure 1
From
Chandler
2.2 What is the City? The city may be thought of as an urban organism in two dimensions: (1) The
functional city, also called the metropolitan area or the labor market area. The functional city includes
rural territory beyond the urban fringe from which people commute. (2) The physical city, which is the
area of continuous development, or built environment (Hall, Gracey & Drewett, 1973). The physical city
may also be called the urban area or the urban agglomeration. The urban area contains only developed
land and no rural land.
2.3 Conceptions of the City: There is considerable confusion, even among academics, about the level at
which cities (urban organisms) are appropriately compared. Average4 urban population density is best
compared at the urban area level.5
This is illustrated by comparing the two largest French language cities in the world, Paris and Kinshasa
(Table 2). Both the "ville de Paris" (municipality of Paris) and the ville de Kinshasa (municipality of
4 Sub-city density comparisons between cities are appropriate, but require great caution. It must be ensured that the
sub-city units are comparable. For example, "core" municipalities are often compared, simply because data at
smaller levels is not broadly available. However, such comparisons fall far short of the optimal, given the significant
differences between core cities, as the Paris-Kinshasa example (following) indicates. 5 The urban area is not defined by administrative boundaries, such as city limits or provincial boundaries. It is
defined by continuous urbanization, composed of very small geographical units (such as the small communes of
France or census tracts in the United States), so that the impact of adjacent rural areas is minimized (most nations do
not designate specific urban areas).

Kinshasa) are municipalities and higher (regional) level jurisdictions.6 The ville de Paris is much smaller
than its corresponding urban area and even smaller relative to its metropolitan area. On the other hand, the
ville of Kinshasa is larger than its urban area and is would probably be larger than a reasonably defined
metropolitan area (none is defined).7
The differences are particularly obvious at the municipality level. The ville Paris is nearly 20 times as
dense than the ville de Kinshasa. This is understandable, since the ville de Paris is confined to the dense
core of the urban area, which continues outside the municipal boundaries to encompass 25 times the land
of the municipality. By contrast, the ville de Kinshasa is principally (95%) low density rural land, rather
than urban land. Yet, the Kinshasa urban area is nearly 4.5 times as dense as the Paris urban area. This
illustrates the necessity avoiding (or using extreme caution in) comparisons at the municipal level.
Neither municipality is an urban organism (the urban area or the metropolitan area), as noted above. The
only exceptions would be city states or island cities, such as Hong Kong, Singapore or Male (Maldives).
The appropriate level for comparing average urban densities is the urban area, since the metropolitan area
includes large rural areas, which by definition are not urban.8
3.0 URBAN ACCESS AND ECONOMIC GROWTH
The economic literature generally indicates that where there is greater access to employment, shopping
and services, urban economic performance will be stronger. For decades this assumption has been a
principle of transport planning. Projects are routinely evaluated, at least in a part, based upon the amount
of time that they will save users.
Prud’homme and Lee (1998) showed a 0.18% productivity increase for each 1% increase in the size of the
effective labor market --- the geographic size of the area that can be accessed in a specific time. Other
research reaches similar conclusions, such as Cervero (2000), Hartgen and Fields (2009) and Cox
(2004b). There also appears to be a strong historical relationship between improved access in the city
(Figure 3).
Further, as cities grow, they tend to become more productive. Bettencourt, et al, (2007) have shown that
as cities double in population, they tend to improve their economic productivity by 15 percent.9
Thus, the objective of maximizing urban access could lead improved economic growth in the cities of
developing Africa
6 Demographia World Urban Areas provides urban land area, population and urban density estimates for all
identified urban areas with more than 500,000 population in the world. 7 There are no international standards for designating metropolitan areas (most nations do not designate metropolitan
areas). In the United States, large geographical building blocks (counties) can result in large expanses being
included that cannot be remotely considered to be a part of the labor market, because in some parts of the nation,
counties are geographically very large. The largest county (and the largest metropolitan county, San Bernardino, in
the Riverside-San Bernardino, California metropolitan area), covers more land area than Slovakia. 8 The spatial differences between urban areas and metropolitan areas can be huge. For example, the land area of the
Paris metropolitan area is approximately six times that of the Paris urban area (Table 1). In the United States, the 51
metropolitan areas with more than 1,000,000 population in 2010 covered six times their respective principal urban
areas (http://demographia.com/db-msauza2010.pdf). 9 This finding relates to metropolitan area population and though does not relate to urban density, as the authors
make clear.
$0
$5,000
$10,000
$15,000
$20,000
$25,000
$30,000
$35,000
$40,000
$45,000
1500 1550 1600 1650 1700 1750 1800 1850 1900 1950 2000
GD
P/C
ap
ita
: R
ich
es
t N
ati
on
: 2
00
0$
Walking Mass
Transit
Highest National GDPs: 1500-2000650 BC TO PRESENT
AutoPRINCIPAL
MODE
Figure 2
From
Maddison
(OECD)
.
4.0 CITIES IN DEVELOPING AFRICA
Developing Africa is urbanizing rapidly. In 2011, 37 percent of sub-Saharan Africa lived in cities. Over
the next 20 years, urban areas are projected to comprise 60 percent of growth. This would drive the share
of the population in cities to 45 percent (United Nations, 2012).
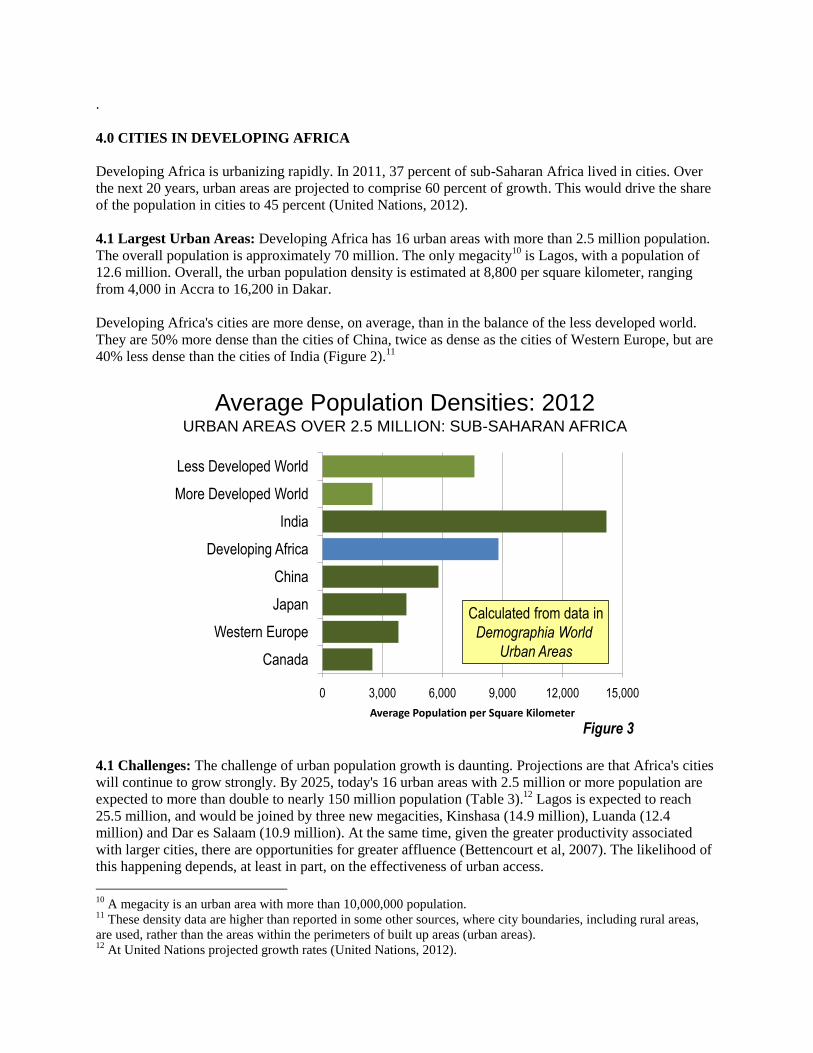
4.1 Largest Urban Areas: Developing Africa has 16 urban areas with more than 2.5 million population.
The overall population is approximately 70 million. The only megacity10
is Lagos, with a population of
12.6 million. Overall, the urban population density is estimated at 8,800 per square kilometer, ranging
from 4,000 in Accra to 16,200 in Dakar.
Developing Africa's cities are more dense, on average, than in the balance of the less developed world.
They are 50% more dense than the cities of China, twice as dense as the cities of Western Europe, but are
40% less dense than the cities of India (Figure 2).11
0 3,000 6,000 9,000 12,000 15,000
Canada
Western Europe
Japan
China
Developing Africa
India
More Developed World
Less Developed World
Average Population per Square Kilometer
Calculated from data in
Demographia World
Urban Areas
Average Population Densities: 2012URBAN AREAS OVER 2.5 MILLION: SUB-SAHARAN AFRICA
Figure 3
4.1 Challenges: The challenge of urban population growth is daunting. Projections are that Africa's cities
will continue to grow strongly. By 2025, today's 16 urban areas with 2.5 million or more population are
expected to more than double to nearly 150 million population (Table 3).12
Lagos is expected to reach
25.5 million, and would be joined by three new megacities, Kinshasa (14.9 million), Luanda (12.4
million) and Dar es Salaam (10.9 million). At the same time, given the greater productivity associated
with larger cities, there are opportunities for greater affluence (Bettencourt et al, 2007). The likelihood of
this happening depends, at least in part, on the effectiveness of urban access.
10
A megacity is an urban area with more than 10,000,000 population. 11
These density data are higher than reported in some other sources, where city boundaries, including rural areas,
are used, rather than the areas within the perimeters of built up areas (urban areas). 12
At United Nations projected growth rates (United Nations, 2012).

At the same time, it can be expected that the organic spatial expansion of cities ("urban sprawl") will
continue, as has been the case in virtually all cities of both the more developed and less developed
world.13
Moreover, attempts to limit spatial expansion could encounter the same difficulties as in middle-
income Latin America, where burgeoning populations built informal settlements on vacant land, virtually
regardless of ownership or regulation. Angel, et al (2010) projected that the land area of sub-Saharan
cities will expand by more than 250 percent in the next 20 years (in their middle scenario).
5.0 URBAN ACCESS IN DEVELOPING AFRICA
A World Bank report (Kumar and Barrett, 2008) provides urban transport data for seven of the above
cities and is summarized (along with an 8th) in Table 4. Some more formal systems have ceased
operation, because government subsidies were unsustainable in comparison to the cost structures.
5.1 Motorized Urban Transport: The conventional large vehicle mass transit systems accounted for just
13 percent of motorized trips. Less formal (or informal) systems account for 87 percent of motorized
trips. This includes smaller transit vehicles (such as minibuses and shared-ride taxis) and personal
vehicles. Personal motorized transportation, including automobiles and two-wheelers have already
reached nearly one quarter of the less formal market share.
13
Even notably planned cities, such as Washington, Brasilia and Belo Horizonte are surrounded by urban expansion
that can be generally characterized as "unplanned" and certainly not in accord with the original plans.

5.2 Walking: Walking also accounts for a large share of urban trips the cities of developing Africa. For
example, in Kinshasa (where only walking data is available), 60% to 80% of trips are by walking, while
60 percent of travel is by walking in Douala and Addis Ababa. Among the six cities for which data is
available (including Kinshasa), an average of 38 percent of travel is by walking.
Walking is the most sustainable form of urban travel. However, the cities of developing Africa, with their
large urban footprints, are not walking cities. The walking cities of history were much smaller in area.
Chang'an (modern Xi'an in China) reached perhaps the largest urban expanse of any pre-motorized city, at
78 square kilometers around 700 C.E. (Benn, 2003). As is noted above, the largest cities of developing
Africa are much larger, ranging from 2.5 times (Dakar) to 12 times (Lagos and Khartoum) the largest
expanses of historic walking cities.
However sustainable, walking cannot provide access to the broader employment opportunities that exist
throughout the city. In Nairobi, it is estimated that 65 percent of slum-dwellers walk to work because they
cannot afford the fares on the informal transit system (Salon & Gulyani, 2008). The economic research
(above) would suggest that this lack of access to employment opportunities throughout most of the urban
area restricts household incomes and is likely to retard the economic growth, while increasing
unemployment and poverty. The cities of developing Africa may have long since become too spatially
large for walking to suffice as a principal mode of access without hobbling economic growth and
ingraining high levels of poverty.
5.3 International Reviews of Mass Transit in Developing Africa: There has been considerable
criticism of developing Africa's informal mass transit systems. The small vehicles are criticized for
congesting city roadways, which are themselves often sub-standard. There is criticism of service that is
insufficiently coordinated, and of a quality that would repel Western customers. These systems, however,
appear to be well patronized. According to Lomme (2010):
...it is arguable on the contrary that the quality of service provided by the minibus taxi industry
compares quite favorably with that of its formal competitors and that its operational flaws and
negative externalities are blatantly overstated.
The less formal services may provide the only transport that can enable many customers to reach large
parts of the city that are beyond walking distance. More formal systems may not be capable of replicating
the extent of urban that is accomplished by less formal systems.
For example, as inconvenient as it may seem to sit in a minibus while the driver seeks to fill up the
vehicle, the trip may be so long that walking is an even less viable option. Some people might not be able
to reach employment sufficiently quickly and lose their jobs.
The extent of urban access provided by various service provision alternatives cannot be known in the
absence of urban access data at the city and sub-city zone levels.
6.0 APPROACHES TO URBAN ACCESS IN DEVELOPING AFRICA
As governments seek to reduce poverty in developing Africa, it will be important to review the
comparative urban access that can be afforded by potential service and regulatory approaches. Five
examples are reviewed (they are by no means exhaustive).
6.1 Conventional "Western" Mass Transit
There are often calls for mass transit systems that emulate the systems of affluent western cities, relying
principally on large buses and, to a lesser degree urban rail systems.
A mass transit system that could provide proximate (within 400 meters) access from each point to every
other point in an urban area could effectively meet the need for comprehensive access throughout the
urban areas of developing Africa. However, such a system is not feasible or affordable, whether in the
more developed world or the less developed world. A mass transit system that met such a specification
could cost, on an annual basis from 42%. to more than 340 percent of the GDP of lower-income world
megacities (Ziv and Cox, 2007). Even in the more developed world, the cost was found to be prohibitive,
at from 20% to 80% of annual GDP.
In the more developed world, mass transit does not provide comprehensive access throughout the urban
area, nor does it need to. Most motorized travel is by personal vehicle.14
Mass transit often provides the
most effective mobility to the urban core or within the core area, but generally does not provide for the
dispersed travel patterns that predominate outside these areas.
The limited access provided by mass transit is illustrated in the United States. A Brookings Institution
report (Tomer, et al, 2011) indicates that the average major metropolitan area resident can access only six
percent of jobs in 45 minutes. That is nearly twice the average commute time by car. More than 75
percent of US metropolitan area workers travel less than 45 minutes to work.
14
Automobiles and two-wheelers account for more than 50 percent of motorized travel in all but three of the more
than 60 more developed world urban areas covered by the Millennium Cities Database (UITP, 2001), Hong Kong,
Tokyo and Osaka-Kobe-Kyoto.

The limitation of access by mass transit is also indicated in Europe. Residents of Paris new towns served
by suburban metro stations can reach twice as many jobs in an hour by car as by mass transit (Fouchier &
Michelon, 1999).
Western cities owe their superior urban mobility not only to effective urban core-oriented mass transit
systems, but even more, to their access by personal vehicles. Developing Africa does not share this
advantage. In Africa, the less formal collective modes provide most of the motorized access, taking the
place of the personal vehicle sector that dominates in the more developed world.
6.2 Rationalizing the Informal Mass Transit Sector
While rationalization of service may appeal to Western perspectives, the outcomes may not meet the
needs of customers.
This is illustrated by the "rationalization" of the previous bus system, which relied more on smaller
vehicles and required fewer transfers Santiago (Chile). The rationalized “Transantiago” system was so
ineffective in meeting the needs of riders that many abandoned the buses and there were claims that the
reaction nearly toppled the national government. Many walked long distances to the Metro, which was
strained to beyond its capacity. The system required considerably more in government operating subsidies
than had been foreseen (Muñoz, Ortuzar & Gschwende, 2008). This is a particular concern in developing
Africa, where formal mass transit systems have not been affordable for government budgets.
Moreover, rationalization may not reduce traffic congestion. While informal vehicles can be banned, if
access is retarded (door to door travel times), the result could be greater use of motorized alternatives,
such as cars and 2-wheelers. The ultimate choice might not be between informal systems and less traffic
congestion, but rather between traffic congestion from informal transit vehicles and traffic congestion
made even more intense by broader use of cars and 2-wheelers.
6.3 One Dimensional Focus on GHG Emission Reduction
Some transport and land use planning in developing world nations focuses on greenhouse gas (GHG)
emission reduction, to the exclusion of other factors. This emphasis is in opposition to the Rio +20
declaration and the recognition that poverty eradication is an indispensable requirement for sustainable
development.
The reality of this concern is illustrated, for example, by China and India denoting their GHG emission
reduction targets intensity relative to the gross domestic product, rather that outright volume reductions.
One dimensional GHG emission based planning in the developing world carries significant political risk.
Virtually all governments ultimately require the consent of the governed to stay in power (democracies or
not). Governments may not be able to stand up to public opinion that perceives them to have traded away
materially improved affluence to reduce GHG emissions.15
This sense was expressed by Rajendra
Pachauri, chair of the Intergovernmental Panel on Climate Change, as his native India seeks to climb out
of poverty (Bryson 2011).
15
The political risk is not limited to the developing world. The resistance electorates in the European Union and the
United States to austerity measures deemed necessary due to economic challenges portends serious political limits to
the economic sacrifices people would be willing to make for emission reductions.

Can you imagine 400 million people who do not have a light bulb in their homes?" … You
cannot, in a democracy, ignore some of these realities and as it happens with the resources of
coal that India has, we really don't have any choice but to use coal.
Angel (2012) criticizes such planning because "protection of our planet would likely come at the expense
of the poor."
6.4 Manila (and Dakar)
The Manila mass transit system may provide the greatest access of any system in the world. The Manila
mass transit system is similar to those of developing Africa, in its dependence on private, small vehicles
that provide service accessing much of the area. The Manila "Jeepneys." and tri-cycles provide locally
oriented service that can be supplemented for longer trips with transfers to the Metro (in the very limited
parts of the urban area that it operates).16
According to data in the Millennium Cities Database (UITP,
2001), no surveyed urban area had service levels as high as Manila. Manila's mass transit service density
(service kilometers per urban square kilometer) was nearly double that of Hong Kong (the high-income
world's most dense major urban area), nearly 15 times that of Tokyo (with the world's highest ridership
mass transit system) and 30 times that of Paris (with perhaps the most extensive mass transit system in the
Western world).
Dakar, with its strong minibus sector, ranked above Singapore and all surveyed cities in Western Europe,
the United States and Canada (Figure 4) in mass transit service density. It is also possible that other
African cities would have rated similarly if they had been included in the UITP (2001) research.
0 1 2 3 4 5 6 7 8 9
Denver
Vancouver
New York
Toronto
Paris
Tokyo
Vienna
Zurich
Singapore
Dakar
Hong Kong
Manila
Average Vehicle Kilometers per Square Kilometer
Mass Transit Service DensitiesMILLENNIUM CITIES DATABASE: 1995
Figure 4
Calculated from data in
Millennium Cities Database
(UITP)
16
Referred to as such because of its full grade separation, though parts of the system are called "light rail."
6.5 Viet Nam
Viet Nam has achieved a high rate of personal mobility, with the dominance of 2-wheelers in cities like
Hanoi and Ho Chi Minh City (formerly Saigon). This is despite Viet Nam's status as a lower income
nation.
Ho Chi Minh City represents a model of a less developed world urban area that has already transitioned
nearly completely to personal motorized transport and has achieved a high degree of urban access. Ho Chi
Minh City may have the highest personal transportation market share outside Australia, Canada, New
Zealand and the United States. The motorized personal vehicle (2-wheeler and car) share of travel is 92%,
leaving just 8% for mass transit. Ho Chi Minh's 2-wheelers provide door-to-door access throughout the
metropolitan area. Their mobility advantages are summarized by Dapice, Gomez-Ibanez, & Thanh
(2010):
...the motorcycle offers many of the conveniences of a private automobile, such as on-demand,
door-to-door service, and the ability to make intermediate stops and carry packages and extra
passengers. Many Vietnamese have more than one job and children to drop off and pick up at
school, and thus value the flexibility of a motorcycle.
Ho Chi Minh City's 2-wheelers provide personal mobility throughout the metropolitan area. It seems
likely that, as a result, urban access is greater in Ho Chi Minh City than in most other urban areas in the
less developed world (and perhaps even in the more developed world).
As Viet Nam becomes more affluent, automobile ownership is likely to increase. While the high volume
of 2-wheelers creates substantial traffic congestion, 2-wheelers themselves appear to consume
approximately the same space on urban roadways as bicycles, measured in passenger car equivalents
(Dapice, Gomez-Ibanez, & Thanh, 2010).
Ho Chi Minh City is developing motorways (freeways) and a Metro, which will provide mobility
opportunities. At the same time, consistent with trends throughout the developing world, the Ho Chi Minh
City area is rapidly decentralizing (Cox, 201217
). According to municipality projections cited in MVA
Asia & Asian Development Bank (2010), the core area population will decline modestly by 2025, while
nearly all population and employment growth will be in suburban and exurban areas, as spatial expansion
continues. This decentralization is likely to ease the impacts of rising automobile ownership, moderating
the growth of traffic congestion, which is likely to still be intense. Decentralization could also lead to
greater economic growth (Gordon and Richardson, 2011).18
7.0 POLICIES FOR URBAN ACCESS
Government officials need comprehensive urban access data to address the policy objective of
maximizing urban access. Urban access time indicators need to be developed at the urban area level and
between small zones within urban areas for the various public and private modes of travel. Useful models
are supplied by Prud'homme and Lee (1998) and Tomer, et al (2011). These would include the following
indicators:
17
This series (The Evolving Urban Form) documents similar trends all less developed world cities reviewed thus far,
including Beijing, Cairo, Delhi, Dhaka, Guangzhou-Foshan, Jakarta, Kolkata, Manila, Mexico City, Moscow,
Mumbai, Sao Paulo, Shanghai and Shenzhen (Cox, 2012a). 18
Gordon and Lee (2012) have shown that work trip travel times in the United States are take less time to dispersed
employment locations than to central business districts or secondary business centers (such as "Edge Cities").

Employment (Enterprise) access: The employee access indicator would estimate the number of
jobs in an urban area that can be reached by workers from specific zones and overall within a
fixed period (such as 30 minutes).
Employee (Worker) access: The work force access indicator would estimate the number of
potential employees in an urban area that could reach employment locations in specific zones and
overall within a fixed period (such as 30 minutes).
Consistent with the emphasis on urban access, resources can be most efficiently used if major transport
investment decisions are based upon the performance standard of the least out-of-pocket government cost
per reduced hour of transport delay (Ellis, Lomax, Pisarski, Cox and McEwan, 2006 and Cox, 2004a). In
view of the limited government funding, services would be more economically sustainable if they are
supported by commercial revenue, a rarity even in the affluent urban areas of the more developed world.19
In proceeding with mass transit improvements, the situation in developing Africa suggests a policy focus
on outputs (objectives ). This is likely to produce more favorable urban access than focusing on inputs
(regulatory systems and service provision alternatives). From a policy perspective, the driving issue is
more how much of the city people can they reach in a reasonable period of time than how they travel.
Urban transport systems (collective and personal) that maximize access in the cities of developing Africa
would likely improve the potential for addressing the challenge of eradicating poverty and facilitating
greater economic growth.
Bibliography
Angel, S (2012). Planet of Cities, Lincoln Institute of Land Policy.
Angel, S. with J. Parent, D. L. Civco, & A. M. Blei (2010), Making Room for a Planet of Cities, Lincoln
Institute of Land Policy.
Benn, C. D. (2004), China's Golden Age: Everyday Life in the Tang Dynasty, Oxford University Press.
Bertaud, A. (2001), The Spatial Organization of Cities: Deliberate Outcome or Unforeseen
Consequence? Background paper, World Development Report 2003, Dynamic Development in a
Sustainable World, The World Bank.
Bettencourt. L., J. Lobo, D. Helbing, C. Kuhnert and G. West (2007), “Growth, innovation, scaling, and
the pace of life in cities,” PNAS.
Robert Bryson (2012) “When 600 Million People Lost Power,” The Wall Street Journal,
http://online.wsj.com/article/SB10000872396390443687504577565041028069420.html 12 August.
Cervero, R. (2000), Efficient Urbanization: Economic Performance and the Shape of the Metropolis,
Lincoln Institute of Land Policy Working Paper, http://www.lincolninst.edu/pubs/88_Efficient-
Urbanization.
19
According to data in UITP (2001), mass transit fare revenues exceed its total costs (capital and operating) only in
three urban areas, Tokyo, Osaka and Hong Kong. Outside of these urban areas, all have commercial revenues 80%
or less of total costs.

Chandler, T. (1987) Four Thousand Years of Urban Growth: An Historical Census, The Edwin Mellen
Press.
Cox, W. (2004a) " Objective based transport planning: A model for emerging urban areas," paper
presented to CODATU XI Congress, http://www.publicpurpose.com/c11-gbc.pdf.
Cox, (2004b), “Public Transport Performance Indicators: Implications for Emerging Urban Areas,”
presentation to the CODATU X Congress.
Cox (2012a), "The Evolving Urban Form: Development Profiles of World Urban Areas" (Index),"
http://www.newgeography.com/category/story-topics/evolving-urban-form.
Cox (2012b), "The Evolving Urban Form: Ho Chi Minh City,"
http://www.newgeography.com/content/002738-the-evolving-urban-form-ho-chi-minh-city-saigon.
Dapice, C., Gomez-Ibanez, J.A. & Thanh, N.X. (2010), Ho Chi Minh City: The Challenges of Growth,
UNDP – Harvard Policy Dialogue Papers
Demographia (2012), Demographia World Urban Areas, http://demographia.com/db-worldua.pdf,
Ellis, D., T. Lomax, A. Pisarski, W. Cox and J. McEwan (2006), Shaping the Competitive Advantage of
Texas Metropolitan Regions: The Role of Transportation, Housing and Aesthetics, Texas Governor's
Business Council, http://www.texasgbc.org/Reports3.htm.
Fouchier V. & S. Michelon (1999), “Isochrones autour des villes nouvelles aux heures de pointe.”
DREIF & Groupe Central des Villes Nouvelles.
Gonzales, E. J., C. Chavis, Y. Li, & C. Daganzo (2009), "Multimodal Transport Modeling for Nairobi,
Kenya: Insights and Recommendations with an Evidence-Based Model," UC Berkeley Center for Future
Urban Transport, http://escholarship.ucop.edu/uc/item/6dv195.
Gordon, P. and B. Lee (2012), "Spatial Structure and Travel: Trends in Commuting and Non-Commuting
Travels in US Metropolitan Areas," draft chapter for the International Handbook on Transport and
Development edited by Robin Hickman, David Bonilla, Moshe Givoni and David Banister.
Gordon, P. & H. Richardson (2011), "Urban Structure and Economic Growth," in Brooks, N., K.
Donaghy and G. Knaap, The Oxford Handbook of Urban Economics and Planning, Oxford University
Press.
Hall, P., R., T. H. Gracey and R. Drewett (1973), The Containment of Urban England, George Allen &
Unwin.
Hartgen, D. T. and G. Fields (2009), “Accessibility, Traffic Congestion and Regional Economic
Performance,” Reason Foundation.
Lomme, Roland (2010), "Should South African Minibus-Taxis be Scrapped? Formalizing Information
Urban Transport in a Developing County," paper presented to CODATU XIII Congress.
Kumar, A. and F. Barrett (2008), Stuck in Traffic: Urban Transport in Africa,
siteresources.worldbank.org/.../Resources/Stuck-in-Traffic.pdf

Maddison, A. (2003), The World Economy: Volume 1: A Millennial Perspective and Volume 2: Historical
Statistics, OECD Publishing.
Modelski, G. (2000), World Cities: –3000 to 2000, FAROS
Muñoz, J. C., J. D. Ortuzar & A. Gschwende (2008), "Transantiago: The Fall and Rise of a Radical Public
Transport Intervention," ttp://politicaspublicas.uc.cl/media/publicaciones/pdf/20100705173436.pdf
MVA Asia & Asian Development Bank (2010), Ho Chi Minh City: Urban Mass Rapid Transit Line 2
Project: Final Report (November 2010).
Prud’homme, R. & Lee, C. (1998), “Size, Sprawl, Speed, and the Efficiency of Cities,” Obervatoire de
l’Économic et des Institutions Locals.
Rio +20 The Future We Want (2012), The Future We Want: Outcome Document Adopted at Rio +20,
http://www.uncsd2012.org/content/documents/727The%20Future%20We%20Want%2019%20June%201
230pm.pdf.
Salon, D. & S. Gulyani (2008), " Mobility, Poverty, and Gender: Travel “Choices” of Slum Residents in
Nairobi, Kenya," http://www.its.ucdavis.edu/people/faculty/salon/Salon-Gulyani_Slum_2008.pdf,
Sporton, Deborah (2012), "Meeting Summary: Population Growth and Demographic Trends: Implications
for African States and Regions," Chatham House.
http://www.chathamhouse.org/sites/default/files/public/Research/Africa/260912summary.pdf
Tomer, A, E. Kneebone, A. Berube, & R. Puentes, R. (2011), "Missed Opportunity: Transit and Jobs in
Metropolitan America," Brookings Institution.
UITP (2001), Millennium Cities Database.
UITP (2008), Overview of Public Transport in Sub-Saharan Africa,
www.uitp.org/knowledge/pics/2009/transafrica.pdf
United Nations (2012), "World Urbanization Prospects: The 2011 Revision."
Ziv, J-C. and W. Cox (2007). “Megacities and Affluence: Transport and Land Use Considerations,” paper
presented to the World Conference on Transport Research, Berkeley, 2007:
http://www.publicpurpose.com/ut-wctrs2007.pdf.
Top Related