


Languages
Pages
Legal


International Journal of Arts and Commerce ISSN 1929-7106 www.ijac.org.uk
120
DETERMINANTS OF INVESTMENT INTENTIONS:
AN INDIVIDUAL RETAIL INVESTOR’S PERSPECTIVE FROM
NAIROBI SECURITIES EXCHANGE
Peter Kamau Njuguna *
Jomo Kenyatta University of Agriculture and Technology (JKUAT),
Kenya
Prof. Gregory. S. Namusonge
Professor, School of Entrepreneurship, Procurement & Management, JKUAT,
Kenya
Prof. Christopher Kanali
Associate professor, Biomechanical and Environmental Engineering Department,
College of Engineering and Technology, JKUAT, Kenya
* Corresponding Author:
Peter Kamau Njuguna
P.O.Box 1032 - 00100, GPO
Nairobi, Kenya
Email: [email protected]
Abstract
The purpose of this study was to assess the determinants of investment intentions of individual stock market
investors in Nairobi Securities Exchange. The specific objectives of this study were to investigate the effect
of expected investment value, expected sacrifices, subjective investment knowledge, compatibility and
perceived behavioral control on investment intention of individual investors in Kenya. In addition, the study
sought to build a theoretical model to explain investment intentions in financial securities by individual
investors by examining the relationships between subjective investment knowledge, expected sacrifice,
expected investment value, compatibility, perceived behavioral control and investment intentions. A cross
sectional survey, multi-stage sampling technique involving 423 randomly selected individual investors
participated. Data was collected using structured questionnaires and interview guides. Using hierarchical
regression analysis, empirical results showed that subjective investment knowledge, expected investment
value, compatibility, perceived behavioral control had a positive and statistically significant effect on
investment intentions of individual investors. The effect of expected sacrifices on investment intention of
individual investors was positive but statistically not significant.
Keywords: Expected investment value, Expected sacrifices, Subjective investment knowledge,
Compatibility, Perceived behavioral control, Investment intention

International Journal of Arts and Commerce Vol. 5 No. 6 August, 2016
121
1.0 Introduction
Economic and financial theories presume that individuals act rationally and would consider all available
information in the investment decision-making process. Behavioral finance therefore has been used to throw
more light on why people buy or sell stocks and even why they do not buy stocks at all (Thaler, 2003).
Investment behaviors of investor are defined as how the investors judge, predict, analyze and review the
procedures for decision making, which includes investment psychology, information gathering, defining and
understanding, research and analysis (Alfredo & Vicente, 2010).
Standard finance is built on rules on how investors should behave rather than trying to observe how they
actually behave (Pompian, 2011) and the traditional finance theories derived from neo-classical economic
theory assumes investors to be rational and competent (Popescu, 2008). The market actor makes decisions
according to the axioms of expected utility theory. In this equilibrium securities are priced according to the
efficient market hypothesis (EMH).
Whereas traditional financial and economic theories assume that investors are rational problem solvers, the
decision-making theories in behavioral finance and economics study the limitations of one’s decision
making (bounded rationality) that affect the investment behavior (Puustinen, 2012). Particularly the works
of Kahneman and Tversky in the 1970s played an important role in the development of behavioral finance
theory (Pompian, 2011). They created one of the most important theories in behavioral finance, the prospect
theory, to explain how people are assumed to make choices under risk (Kahneman & Tversky, 1979). Their
research showed that mental illusions are actually the rule rather than the exception when making decisions
under uncertainty. Furthermore, their theories suggest that an individual’s investment decision-making
process is influenced by social, cognitive, and emotional factors (Tversky & Kahneman, 1986).
Decision theorist Howard Raiffa introduced to the analysis of decisions three approaches that provided a
more accurate view of a real person’s thought process and thus challenged the prevailing decision making
models (Raiffa 1968, in Pompian 2011). Kahneman and Riepe (1998) tied together Raiffa’s decision theory
and financial advising. In their research, they stated that advisors need to have a clear understanding of the
emotional as well as cognitive weaknesses of investors that affect their decision-making. Owen (2002)
contends that people are irrational and make decisions for many reasons, few of which involve a judicious
analysis of available data. Popescu (2008) opines that individual behavior dwells on the fact that people fall
into psychological traps including over confidence, anchoring and adjustment, improper framing, irrational
commitment escalation and the confirmation trap.
Majority of investors tend to utilize a limited subset of information in the markets hence having uninformed
competing investors (Glosten & Milgrom, 1985). In reality, investors do not receive all information freely;
they have to decide whether and which information to gather prior to trading. Investors end up staying
afloat in a sea of uncertainty (Gary & Uri, 2003) which in turn affects their level of awareness. According to
Luigi, Sapienza and Zingales (2005), individuals who are knowledgeable are significantly more likely to buy
stocks and risky assets and also invest in stock. Most individual investors hold undiversified portfolios.
The investors’ limited knowledge of the investment process can compromise the risk management
mechanisms available today. Better decisions are made by knowing the mechanism for making investment
decision and it does constitute an important step to risk control management. Harbaugh (2003) affirms that
simple economic models are often poor predictors of human behavior. The need for more detailed studies of

International Journal of Arts and Commerce ISSN 1929-7106 www.ijac.org.uk
122
human behavior in the process of making investment decisions cannot be underscored in order to improve
theory.
Existing studies carried out in Kenya seem to have a mixed view with Waweru, Munyoki, and Uliana (2008)
in support of market rationality and use of market fundamentals to make investment decisions. Werah
(2006) suggested that the behavior of investors at the NSE is to some extent irrational in regard to
fundamental estimations as a result of anomalies such as herd behavior, regret aversion, overconfidence and
anchoring. Werah (2006) proved irrationality at NSE while Aduda and Muimi (2011) tested overreaction
hypothesis at the NSE as an anomaly in the stock market and the conclusion was in support of overreaction
as an anomaly. Investigations into the IPO market in Kenya by Fredrick (2012) showed that, on average,
IPOs provided abnormal return in the immediate aftermarket to investors who purchased at the initial
offering.
Olweny, Namusonge and Onyango (2012) contend that investors who have invested in the securities market
before are more risk tolerant when compared to those who had never ventured into the market due to their
previous exposure to market. It was concluded that the securities market positively influences the economy
having studied the relationship between economic growth in Kenya and the securities market. This is
because the findings of their study showed that when the NSE 20 share index increases, it is an indicator of
the market‘s anticipation of greater corporate profits and higher dividends, and subsequently greater
economic development.
2.0 Literature review
2.1 Perceived investment value
Perceived value in the pre-purchase stage is based on investors’ expectations (Karkkila 2008), and thus the
pre-purchase value-ratio is the investor’s belief about what he or she expects to receive in comparison to
what needs to be given up (Woodruff & Gardial, 1996). According to Zeithaml and Bitner (2003),
expectations can be separated into desires and predictions. The predicted and desired expectations are
influenced by past experience, word-of-mouth communications, as well as explicit and implicit promises
(ibid). Whereas the first two are self-explanatory, the explicit promises refer to the personal and non-
personal statements about the service or product made by the organization and implicit promises are service
or product related cues such as price (Zeithaml & Bitner, 2003).
Ojasalo (2001) categorized different types of expectations into fuzzy, explicit-implicit, and unrealistic-
realistic. When investors have fuzzy expectations, they have an unclear understanding of the value in an
offering and they are not sure what they even want. Explicit expectation refers to precise assumptions or
desires relating to the product or service, whereas implicit expectation refers to something that is not
actively or consciously thought of but rather taken as self-evident. Unrealistic expectations are unlikely for
any service provider to fulfill whereas realistic expectations are likely to come across (ibid). Building on
this idea, value can be seen as a continuum of different types of expectations (Heinonen, 2004).
2.2 Expected Sacrifices
The dimensions of expected sacrifice represent the investor’s anticipation of the give components of the
value formulation, and thus are expected to decrease the investor’s perception of value. However, no
consensus or agreement on the sacrifice dimensions exists among scholars. Whereas early research defined
investor sacrifice only as the monetary price of the product or service (Dodds & Monroe, 1985), today most

International Journal of Arts and Commerce Vol. 5 No. 6 August, 2016
123
scholars separate the dimensions of sacrifice at least to two main categories: monetary and non-monetary
(Cronin et al., 2000). Most commonly used non-monetary sacrifices include time and effort, yet many
academics differentiate also psychological costs (Zeithaml, 1988), even though the constructs are
conceptually related. Psychological costs refer to the investor’s emotional investment or mental stress, while
time and effort costs refer to non-emotional sacrifices (Baker et al., 2002). Grönroos (1997) divides
sacrifices into price, direct, indirect and psychological costs. According to Verma (2009) buying generally
includes time, inconvenience, search efforts and psychological discomfort.
2.3. Subjective Investment Knowledge
According to behavioral economics, the amount, source, and nature of the information individuals receive
about saving and investing are likely to influence their financial decisions. After all, to be able to make a
decision between investment products, an investor is expected to possess a clear understanding of the
characteristics of the alternatives as well as their own preferences (Costanzo & Ashton, 2006). Lusardi and
Mitchell (2005) detected that investors with higher perceived financial knowledge were more likely to
engage in financial planning and financial preparations for retirement. Thus, their findings highlight the
connection between knowledge, intentions, and behavior. Their results are consistent with the familiarity
heuristic, according to which people are more likely to involve in a behavior if they feel more competent
(Ackert & Deaves, 2010).
Whereas the ambiguity aversion heuristic refers to a situation where people prefer risk to uncertainty, Heath
and Tversky (1991) found that individuals do not prefer an option with known risk to an option with
unknown risks when the choice options are familiar. According to Fox and Tversky (1995), this is due to
comparative ignorance. The comparative ignorance hypothesis proposes that people’s confidence is
weakened as individuals compare their limited knowledge in the relevant domain with their superior
knowledge about another domain, or when they compare themselves with more informed individuals (Fox &
Tversky 1995). This causes the feeling of ignorance, which makes people judge the situation ambiguous and
to avoid it. Therefore, investors who are aware of their limited investment skills are less likely to participate
in risky asset markets, (Campbellet al., 2011), and might even avoid investment/savings decisions altogether
(Lusardi & Mitchell 2005).
2.4 Perceived Behavioral Control
Since the theory of planned behavior is one of the most significant and popular behavioral model among
researchers (Ajzen, 2002) and has been found to explain intentions and different behaviors quite well
(Karjaluoto, 2002), there exists plenty of evidence on the relationship between perceived behavioral control
and behavioral intention. Armitage and Conner (2010) conducted a literature review on 185 independent
studies using theory that were published before 1998, and found that generally perceived behavioral control
(PBC) accounted for substantial amounts of variance in intention and behavior. Moreover, in the research of
East (1993) on investor motivations to make applications for shares in privatized British industries,
perceived behavioral control was found to affect one’s investment intention. In this research the limiting
factor is defined as the investor’s perception of his or her financial resources. Thus, it is predicted that one
would only invest when he or she perceives his or her current financial resources to be sufficient for
investing. Therefore, when one perceives his or her self-efficacy higher, he or she is more likely to invest.
International Journal of Arts and Commerce ISSN 1929-7106 www.ijac.org.uk
124
2.5 Compatibility
In this study it is predicted that investor’s intention to invest is also affected by his or her perception of the
degree to which the investment alternative fits his or her life. After all, as compatibility is perceived to be
higher, using or purchasing the product is perceived to require only little learning or change in behavior
(Chakravarty & Dubinsky, 2005). Hence, if the investor feels that there exists an option for wealth allocation
that is more compatible with his or her current needs or situation (e.g. investment time) and which requires
less change in one’s existing habits, then he or she is more likely to invest in that particular
investment/saving alternative. This causes investors to become locked-in to certain products (Murray &
Häubl, 2007). For example, if investors consider that keeping their assets on a bank account requires the
least amount change in behavior, they perceive bank accounts more compatible than stocks or investment
funds. After all, investors tend to follow habits and are prone to choosing solutions that require the least
amount of effort (Collan, 2007; Collan & Tetard, 2007). This discussion leads us to the conclusion that if
investment and saving decisions are similar to other consumption choices, compatibility should have a
positive relationship with an individual’s intention to invest.
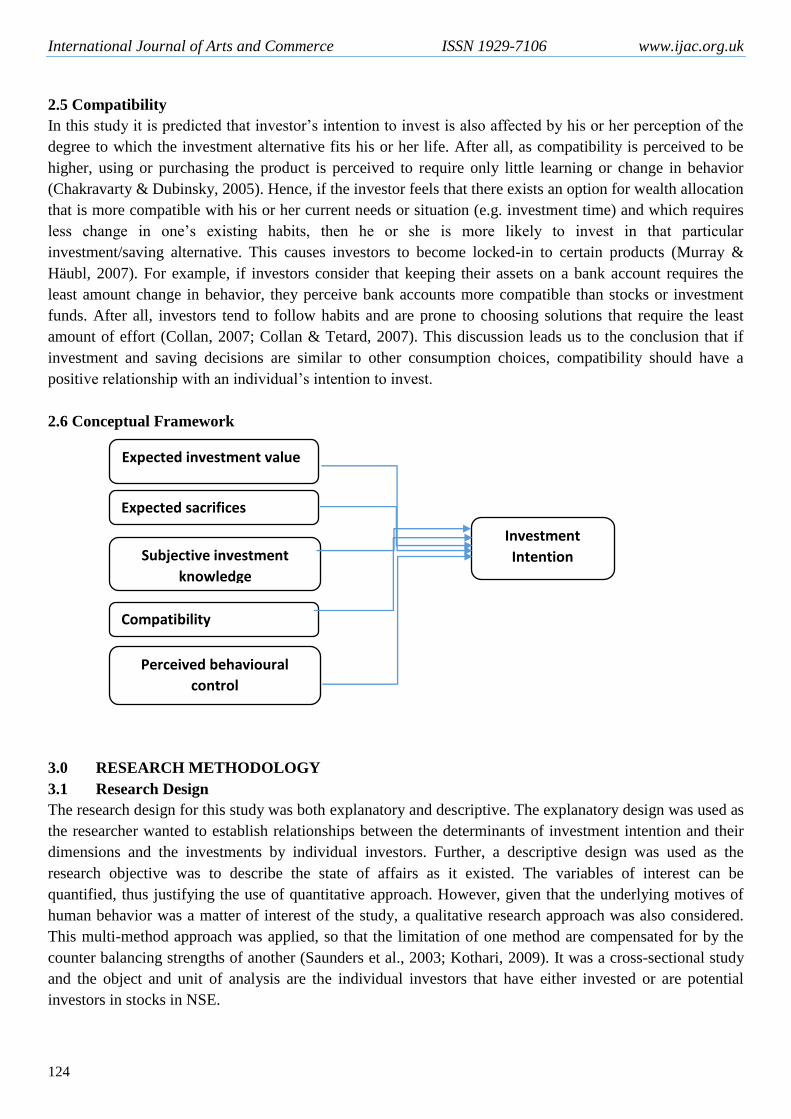
2.6 Conceptual Framework
3.0 RESEARCH METHODOLOGY
3.1 Research Design
The research design for this study was both explanatory and descriptive. The explanatory design was used as
the researcher wanted to establish relationships between the determinants of investment intention and their
dimensions and the investments by individual investors. Further, a descriptive design was used as the
research objective was to describe the state of affairs as it existed. The variables of interest can be
quantified, thus justifying the use of quantitative approach. However, given that the underlying motives of
human behavior was a matter of interest of the study, a qualitative research approach was also considered.
This multi-method approach was applied, so that the limitation of one method are compensated for by the
counter balancing strengths of another (Saunders et al., 2003; Kothari, 2009). It was a cross-sectional study
and the object and unit of analysis are the individual investors that have either invested or are potential
investors in stocks in NSE.
Subjective investment
knowledge
Expected sacrifices
Perceived behavioural
control
Compatibility
Expected investment value
Investment
Intention

International Journal of Arts and Commerce Vol. 5 No. 6 August, 2016
125
3.2 Target Population, Sampling Technique and Sample size
This is the population from which a sample was obtained and conclusions based on it. The target population
for this study was the average household investors and stock market brokers in Nairobi Securities Exchange.
To provide a desirable degree of homogeneity among the respondents, the study only considered investors
who were within a radius of 50 km from Nairobi.
The sampling frame was drawn from individual investor’s directory as captured in the Kingdom securities
limited investor directory with a clientele base was 189,063 investors as at close of year 2015. Additionally,
the sample frame also consisted of the individuals who had never invested in Nairobi Securities exchange.
These individuals have a potential to invest in stocks but they had not.
The sample was decided on by use of a multi-stage sampling technique where in the first stage, stratified
sampling technique was used. The individual investors were stratified based on whether they have ever
invested in the stock market or not and from each stratum, using proportional allocation the proportion of the
size for each strata was computed. In the second stage, simple random sampling technique using random
numbers (Cooper and Emory, 2000) was used to select the individual investors from each of the stratum to
be involved in the study. A sample size of 423 participants was used for this study.
3.3 Research Instruments, Data Collection and Analysis
The study used questionnaire, interviewing and secondary data review methods to collect data. The
questionnaire was structured and the measurement was done using a five item Likert scale. The second
method of collecting data was by the use of interview guide that was used to gather in-depth information
from individual investors and finally the secondary data was collected by the use of published data. To
ascertain the validity and reliability of questionnaire, the questionnaire was pretested with 31 individuals’
investors. All the variables had an alpha score of above 0.8.
4.0 RESULTS AND DISCUSSIONS
4.1 Description of individual investors and their characteristics
Table 1 presents a summary description of characteristics of the 313 individual investors who responded to
the questionnaire. A significant majority of the respondents were male (61.3%) while the female were
38.7%. About 32.6% of the respondents were singe, 63.3% were married, 2.3% widows and widowers, 0.3%
divorced while 1.6% had separated. A significant majority of the respondents (57.5%) were aged between 30
and 40 years, 30% of the respondent were aged below 30 years, 9.3% were aged between 40 and 50 years,
2.6% were aged between 50 and 60years while 0.6% were aged above 60 years . About 4.2% had gross an
income below 20,000 Kenya shillings per month and 14.1% an income between 20,000 and 50,000 Kenya
shillings, 19.5% were in the 50,000 – 80,000 Kenya shilling income category, 17.3% had an income
between 80,000 and 100,000 Kenya shilling while 45% of the respondents had an income of above 100,000
Kenya shillings a month.
As for education, 0.3% had primary education, 3.5 % had secondary education, 9.6% had tertiary education,
and 53.7% had a bachelor’s degree while 32.9% had a postgraduate level degree. On investment experience,
the respondents were also asked whether they had previously invested in securities such as stocks. 82.7% of
the respondents had the experience while 17.3% had never invested in stocks. Of those respondents with
experience, 8.9% of them had less than a years’ experience, 39.3% had an investment experience of between
a year and five years and 26.5% of the respondents had an experience of between five to ten years while 8%
of the respondents had an investment experience of over ten years. As regards to whether the respondents
are currently investor in the stock market, only 60.1% of the responds indicated that they had current

International Journal of Arts and Commerce ISSN 1929-7106 www.ijac.org.uk
126
investments in the stock market. Additional descriptive information can be found in Table 2, which presents
the descriptive analysis for all research items.
Table 1: Individual Investors Demographics
Variable Frequency Percentage
(%)
Respondent’s Gender Male 192 61.3
Female 121 38.70
Marital Status Single 102 32.6
Married 198 63.3
Widow 3 1.0
Divorced 1 .3
Widower 4 1.3
Separated 5 1.6
Respondents’ age Below 30 Years 94 30.0
31 -40 Years 180 57.5
41-50 years 29 9.3
51-60 years 8 2.6
Over 60 years 2 .6
Gross Monthly Income Below Ksh 20,000 13 4.2
Btwn Ksh 20,000 to 50,000 44 14.1
Btwn Ksh 50,001 to 80,000 61 19.5
Btwn Ksh 80,001 to 100,000 54 17.3
Above Ksh 100,000 141 45.0
Education level Primary 1 .3
Secondary 11 3.5
Tertiary 30 9.6
Undergraduate 168 53.7
Post Graduate 103 32.9
Experience of Investing in
stock
Less than 1 year 28 8.9
1-5 years 123 39.3
5-10 years 83 26.5
Over 10 years 25 8.0
I have never invested in NSE 54 17.3
Current investor No 125 39.9
Yes 188 60.1

International Journal of Arts and Commerce Vol. 5 No. 6 August, 2016
127
Table 2: Results of descriptive statistics
Expected
Investment
Value
Expected
Sacrifice
Subjective
investment
knowledge
Compatibility Perceived
behavioral control
Mean 4.1134 4.2428 4.1917 4.2796 5.5367
Std. Error of Mean .07728 .08320 .06716 .07892 .07324
Median 4.0000 4.5000 4.5000 4.0000 6.0000
Mode 4.00 4.00 5.00 5.00 6.00
Std. Deviation 1.36723 1.47201 1.18821 1.39630 1.29574
Variance 1.869 2.167 1.412 1.950 1.679
Skewness -.312 -.297 -.454 -.266 -.958
Kurtosis -.469 -.386 -.270 -.403 .827
Range 6.00 6.00 6.00 6.00 6.00
Minimum 1.00 1.00 1.00 1.00 1.00
Maximum 7.00 7.00 7.00 7.00 7.00
Sum 1287.50 1328.00 1312.00 1339.50 1733.00
Count 313 313 313 313 313
4.2 Correlation analysis
A Pearson product-moment correlation test was used to measure interrelationships between variables:
control variable, independent variables and dependent variables. This test was conducted to examine the
presence of multicollinearity (Pallant, 2007). As the model hypotheses were tested using Hierarchical
Multiple Regression, correlation tests were first carried out to rule out the presence of multicollinearity.
Table 3 shows the correlation coefficients of all the variables.
Table 3: Correlations Matrices
Gender Mstatus Age Income EDUC EXPE C_INV PIV ES COMP PBC SIK II
Gender 1
Mstatus -.009 1
Age .075 .346** 1
Income .246** .075 2.93** 1
EDUC .083 -.082 -.066 .485** 1
EXPE -.020 .065 .024 -.052 .004 1
C_INV -.085 .080 .275** .330** .235** -.316** 1
PIV .006 .122* .118* .030 -.028 -.081 .216** 1
ES .013 -.036 -.061 -.077 -.177* -.039 -.089 .003 1
COMP -.008 -.036 .019 .104 .076 -.152** .273** .412** -.026 1
PBC -.061 .007 .058 .043 .042 -.014 .217* .265** .014 .498** 1
SIK .228** .034 .111* .276** .231** -.170** .313** .164** -.068 .269** .193** 1
II .143* -.019 .029 .102 .078 -.180** .258** .297** .003 .383** .313** .433** 1

International Journal of Arts and Commerce ISSN 1929-7106 www.ijac.org.uk
128
4.3 DISCUSSIONS
4.3.1 Characteristics of Individual Stock Market Investors
On the characteristic of the individual stock market investors, majority of respondents were male (192),
those that were married were 192 while majority of them were within the age range of 31 -40 years. The
findings revealed that most respondents had strong academic qualification, prior investment experience and
high monthly income, characteristics previously found to influence intention to invest. Of the 313
respondents, 259 were found to have had an experience of investing in shares. One hundred and eighty-eight
(188) of those who had the experience of investing are currently holding investments in the Nairobi
Securities Exchange. This mean that 71 of the respondents with experience in stock market investing had
divested and are no longer investing in shares.
4.3.2 Expected Investment Value
A positive relationship was found between the expected investment value and investment intention. The
Pearson Correlation coefficient 0.297 was significant (p=0.01) to support this conclusion. Empirical results
from regression analysis indicated that expected investment value is a significant predictor (t=5.309,
p<0.001) of investment Intention. While controlling for the effect of investor experience, investor income
and education levels, expected investment value explained 7.8 percent variation in investment intention of
individual investors. These findings supports the position by Puustinen (2012), Puustinen et al. (2013) and
Lounio (2014) that expected investment value is indeed a critical determinants of investment intention for
investors. In summary, the results from both multivariate and qualitative data analysis support the
proposition that expected investment value is a critical factor in determining the investment intention of
individual investors.
4.3.3 Expected Sacrifices
The dimensions of expected sacrifices had an Alpha value of 0.825 and this was considered very reliable.
The mean score was 4.24 and a standard deviation of 1.472. This points to the fact that, on average,
individual investors consider the sacrifices they have to make in order to invest. A positive relationship was
found between the expected sacrifices and investment intention. The Pearson Correlation coefficient 0.003
was not significant (p=0.01) to support this conclusion. Empirical results from regression analysis indicated
that expected sacrifices is not a significant predictor (t=0.117, p<0.907) of investment intention of individual
investors in Kenya. While controlling for the effect of investor experience, investor income and education
levels, expected sacrifices explained 0.3% variation in investment intention of individual investors. These
findings are inconsistent with the findings by Puustinen (2012), Puustinen et al. (2013) and Lounio (2014)
that expected sacrifice is indeed a critical determinants of investment intention for investors. Results from
qualitative data analysis pointed towards a positive relationships between expected sacrifice and investment
intention. The results from both multivariate and qualitative data analysis had mixed results. The findings
support to the proposition that expected sacrifice is a critical factor in determining the investment intention
of individual investors was therefore inconclusive.
4.3.4 Subjective Investment Knowledge
The subjective investment knowledge had an Alpha value of 0.896 and this was considered very reliable.
The mean score was 4.19 and a standard deviation of 1.188. This points to the fact that, majority of
individual investors consider the investment knowledge that the need to have in order to make a successful
investment. A positive relationship was found between the subjective investment knowledge and investment
intention. The Pearson Correlation coefficient 0.383 was significant (p=0.01) to support this conclusion.

International Journal of Arts and Commerce Vol. 5 No. 6 August, 2016
129
Empirical results from regression analysis indicated that subjective investment knowledge is a significant
predictor (t=7.785, p<0.010) of investment intention of individual investors in Kenya. While controlling for
the effect of investor experience, investor income and education levels, expected sacrifices explained 15.6%
variation in investment intention of individual investors. These findings are consistent with the findings by
Lounio (2014) that subjective investment knowledge is indeed a critical determinants of investment
intention for investors. The results from both multivariate and qualitative data analysis supports the
proposition that subjective investment knowledge is a critical factor in determining the investment intention
of individual investors in Nairobi securities exchange.
4.3.5 Compatibility
The compatibility had an Alpha value of 0.881 and this was considered very reliable. The mean score was
4.28 and a standard deviation of 1.396. This points to the fact that, majority of individual investors consider
the investment knowledge that the need to have in order to make a successful investment. Individual
investors also seem to be more concerned about the changes in behavior that stock investing would require.
A positive relationship was found between the compatibility and investment intention. The Pearson
Correlation coefficient 0.313 was significant (p=0.01) to support this conclusion. Empirical results from
regression analysis indicated that compatibility is a significant predictor ((t=6.759, p<0.010) of investment
intention of individual investors in Kenya. While controlling for the effect of investor experience, investor
income and education levels, expected sacrifices explained 12.2% variation in investment intention of
individual investors. The findings support to the proposition that compatibility is a critical factor in
determining the investment intention of individual investors in Nairobi securities exchange is inconclusive.
4.3.6 Perceived Investment Behavior
The perceived behavioral control had an Alpha value of 0.874 and this was considered very reliable. The
mean score was 5.54 and a standard deviation of 1.296. This points to the fact that, majority of individual
investors consider the investment knowledge that the need to have in order to make a successful investment.
Individual investors also seem to be more concerned about the changes in behavior that stock investing
would require. A positive relationship was found between the perceived behavioral control and investment
intention. The Pearson Correlation coefficient 0.433 was significant (p=0.01) to support this conclusion.
Empirical results from regression analysis indicated that perceived behavioral control is a significant
predictor (t=5.786, p<0.010) of investment intention of individual investors in Kenya. While controlling for
the effect of investor experience, investor income and education levels, expected sacrifices explained 9.2%
variation in investment intention of individual investors. The findings support to the proposition that
perceived behavioral control is a critical factor in determining the investment intention of individual
investors in Nairobi securities exchange is inconclusive.
5.3 Conclusions
From the study results, it’s evident that expected value is an important factor in shaping investment intention
of individual investors in pursuit of improved economic status. Moreover, the promise of economic benefits
was found to have the highest impact in stimulating the intentions to invest. Additionally, the findings also
shows that functional, emotional and symbolic benefits indicators have very little or no effect in determining
whether to invest in stock or not.
The effect of expected sacrifices on investment intention of individual investors remains inconclusive.
Although interviewed stock brokers and investment managers considered expected sacrifices as a key

International Journal of Arts and Commerce ISSN 1929-7106 www.ijac.org.uk
130
contributing factor to investment intention, the results from regression analysis did not support this view.
Investors expect less value from investing when they anticipate investing to require a lot of sacrifices. Of the
dimensions of expected sacrifices, monetary cost and time cost were found to explain the highest variations
in investor’s intention to invest while effort and financial risk were found to explain very little variation in
investment intention.
Both the results from regression analysis and the interview from stock brokers and investment managers
supported the existence of the effect of subjective investment knowledge on investment intention of
individual investors. The findings of this study highlight the connection between knowledge, intentions, and
behavior and are consistent with the familiarity heuristic, according to which people are more likely to
involve in a behavior if they feel more competent. Subjective investment knowledge was found to have a
very strong direct effect on investment intentions.
Compatibility had a somewhat stronger effect on investment intentions of individual investor as per the
findings of the study. However, the effect of compatibility on investment intention of individual investors
remains inconclusive. Although the results from regression analysis supported the existence of the effect, the
interviewed stock brokers and investment managers did not consider compatibility as a key contributing
factor to investment intention.
The effect of perceived behavioral control on investment intention of individual investors remains
inconclusive. Although the results from regression analysis supported the existence of the effect, the
interviewed stock brokers and investment managers did not consider perceived behavioral control as a key
contributing factor to investment intention. The findings of this research established that there is a
significant effect of perceived behavioral control on investment intention of individual investors.
5.0 REFERENCES
Ackert, L.F. & Deaves, R. (2010). Behavioral Finance: Psychology, Decision-making and Markets. Mason,
OH: South-Western.
Aduda, J. & Muimi, P. (2011). Test for Investor Rationality for Companies Listed at the Nairobi Stock
Exchange, Journal of Modern Accounting and Auditing, ISSN 1548-6583 August 2011, Vol. 7, No.
8, 827-840.
Aduda, J., Oduor, O. E., &Onwonga, M. (2012). The Behaviour and Financial Performance of Individual
Investors in the Trading Shares of Companies Listed at the Nairobi Stock Exchange, Kenya.
Journal of Finance and Investment Analysis, 1(3), 33-60.
Ajzen, I. (2002). Perceived behavioral control, self-efficacy, locus of control, and the theory of planned
behavior. Journal of Applied Social Psychology, 32, 665-683.
Armitage, J., & Conner, M. (2001). Efficacy of the theory of planned behavior: A meta-analytic review.
British Journal of Social Psychology, 40, 471-499.
Baker, B., Parasuraman, A., Grewal, D. & Voss, G. (2002). The influence of multiple store environmental
cues on perceived merchandise value and patronage intentions. Journal of Marketing, 66 (2), 120-
141.
Barber, M. & T. Odean (2008). All that Glitters: The Effect of Attention on the Buying Behavior of
Individual and Institutional Investors. Review of Financial Studies, 21: 785-818.

International Journal of Arts and Commerce Vol. 5 No. 6 August, 2016
131
Campbell, J.Y., Jackson, H.E., Madrian, B.C., & Tufano, P. (2011). Consumer financial protection. The
Journal of Economic Perspectives, 25(1), 91-113.
Collan, M. (2007). Lazy user behavior. Working paper [online]. [Accessed March 20th 2014]. Available:
http://mpra.ub.uni-muenchen.de/4330/.
Collan, M. & Tetard, F. (2007). Lazy user theory of solution selection. In Proceedings of the Celda
conference, 273-279.
Cooper-Martin, E. (1994). Measures of cognitive effort. Marketing Letters, 5 (1), 43-56.
Costanzo, L.A. & Ashton, J.K (2006). Product innovation and consumer choice in the UK financial services
industry. Journal of Financial Regulation and Compliance, 14 (3), 285-303.
Cronin, J.J., Brady, M.K., & Hult, G.T. (2000). Assessing the effects of quality, value, and customer
satisfaction on consumer behavioral intentions in service environments. Journal of Retailing, 76
(2), 193-218.
Dodds, W.B. & Monroe, K.B. (1985). The effect of brand and price information on subjective product
evaluations. Advances in Consumer Research, 12 (1), 85-90.
East, R. (1993). Investment decisions and the theory of planned behavior. Journal of Economic Psychology,
14, 337-375.
Fox, C.R. & Tversky, A. (1995). Ambiguity aversion and comparative ignorance. Quarterly Journal of
Economics, 110(3), 585–603
Gary, C. & Uri, G. (2003). Portfolio Choice and Risk Attitudes: An Experiment.Economics Working Paper
Series, Department of Economics, UC Santa Barbara.
Glosten, L., & Milgrom, P. (1985). Bid, Ask, and Transaction Prices in a specialist Market with
Heterogeneously Informed Traders. Journal of Financial Economics, 13, 71– 100.
Grewal, D., Monroe, K. B. & Krishnan, R. (1998). The effects of price-comparison advertising on buyers’
perceptions of acquisition value, transaction value, and behavioral intentions. Journal of Marketing,
62 (April), 46-59.
Grönroos, C. (1997). Value driven relational marketing: from products to resources and competencies.
Journal of Marketing Management, 13, 407-419.
Heath, C. & Tversky, A. (1991). Preference and belief: Ambiguity and competence in choice under
uncertainty. Journal of Risk and Uncertainty 4(1), 5–28.
Heinonen, K. (2004). Time and Location As Customer Perceived Value Drivers. Doctoral Dissertation.
Publications of the Swedish School of Economics and Business Administration.
Kahneman, D. & Tversky, A. (1979). Prospect theory: an analysis of decision under risk. Econometrica,
47(2), 263-292.
Karjaluoto, H. (2002). Electronic Banking in Finland - Consumer Beliefs, Attitudes, Intentions, and
Behaviors. Doctoral Dissertation. University of Jyväskylä.
Karkkila, H. (2008). Consumer Pre-Purchase Decision Taxonomy. Doctoral Dissertation. Acta Universitatis
Ouluensis; 297, University of Oulu.
Kothari, C. R. (2009). Research Methodology: Methods and Techniques. New Delhi: Willy Eastern.
Lounio, M. (2014) Factors Affecting Consumer Investment Intentions. Empirical Evidence from Finland.
Masters dissertation, Lappeenranta School of Business, Lappeenranta University of Technology
Lusardi, A., & Mitchell, O.S (2006), Financial Literacy and Planning: Implications for Retirement
Wellbeing, Pension Research Working Paper, Pension Research Council, Wharton School
University of the University of Pennsylvania, Philadelphia
Mitchell, V.W. (1999). Consumer perceived risk: conceptualizations and models. European Journal of
Marketing, 33 (1-2), 163- 195.

International Journal of Arts and Commerce ISSN 1929-7106 www.ijac.org.uk
132
Murray, K .B. & Häubl, G. (2007). Explaining cognitive lock-in: the role of skill-based habits of use in
consumer choice. Journal of Consumer Research, 34 (6), 77-88.
Ojasalo, J. (2001). Managing customer expectations in professional services. Managing Service Quality,
11(3), 200 – 212.
Olweny, T., Namusonge, G. S., & Onyango, S. (2012). The Influence of Social Cultural Background on
Individual Risk Tolerance at Nairobi Stock Exchange, Kenya. International Journal of Arts and
Commerce, 1, 87-106.
Owen, S., (2002). Behavioral finance and the decision to invest in high-tech stocks. Working paper No.119,
school of finance and economics, University of Technology, Sidney.
Pallant, J. (2007). SPSS survival manual: Step by step guide to data analysis using SPSS. Sydney: Allen &
Unwin.
Pompian, M.M. (2011). Behavioral Finance and Wealth Management: How to Build Optimal Portfolios
That Account for Investor Biases, 2nd ed. New Jersey, USA: Wiley Finance.
Popescu, D., (2008). Behaviour finance, technical analysis defined and their relationships. Paper presented
to the Montreal CFA, May 21, 2008.
Puustinen, P. (2012). Towards a Consumer-Centric Definition of Value in the Non-Institutional Investment
Context - Conceptualization and Measurement of Perceived Investment Value. Doctoral
Dissertation. Acta Universitatis Tamperensis; 1726, Tampere University.
Puustinen, P., Maas, P. & Karjaluoto, H. (2013). Development and validation of the perceived investment
value (PIV). Journal of Economic Psychology, 36, 41-54.
Saunders, M., Lewis, P., & Thornhill, A. (2003). Research methods for business students. (3rd
edn.), Prentice
Hall, London.
Tversky, A. & Kahneman, D. (1986), Rational choice and the framing of decisions, The Journal of Business,
59 (4), 251-78.
Verma, H.V. (2009). Services Marketing: Text and Cases. Delhi, India: Pearson education.
Waweru, M., Munyoki, E. & Uliana, E. (2008). The effects of behavioral factors in investment decision-
making: a survey of institutional investors operating at the Nairobi Stock Exchange. International
Journal of Business and Emerging Markets, 1 (1): 24-42
Werah (2006). A survey of the influence of behavioral factors on investor activities at the Nairobi Stock
Exchange. Unpublished MBA research project; University of Nairobi.
Woodruff, R.B. & Gardial, F.S. (1996) Know Your Customer: New Approaches to Understanding Customer
Value and Satisfaction. Blackwell Publishers.
Zeithaml, V.A. (1988). Consumer perceptions of price, quality and value: a means-end model and synthesis
of evidence. Journal of Marketing, 52 (3), 2-22.
Zeithaml, V.A. & Bitner, M.J. (2003). Services marketing: Integrating customer focus across the firm. 3rd
ed. New York: McGraw-Hill Irwin.
Top Related