


Languages
Pages
Legal


© 2017. Juma Sonny Nyeko & Cosmas Ogenmungu. This is a research/review paper, distributed under the terms of the Creative Commons Attribution-Noncommercial 3.0 Unported License http://creative commons. org/licenses/by-nc/3.0/), permitting all non-commercial use, distribution, and reproduction inany medium, provided the original work is properly cited.
Determinants of Electronic Learning Adoption in Higher Institutions of Learning in Uganda: A Learners’ Perspective
By Juma Sonny Nyeko & Cosmas Ogenmungu
Makerere University Business School
Abstract- The introduction of electronic learning (EL) has been initiated in Higher Institutions of Learning (HIL) as an attempt to improve on education institutions’ service delivery. By adopting the Technology-Organization-Environment (TOE) framework, this study was aimed at investigating the determinants of the e-learning adoption in HIL where eight TOE factors were examined. The study adopted a quantitative approach, a descriptive research and cross-sectional survey for the research design. A questionnaire was developed based on the eight identified TOE study constructs and administered to a population of 5438 students in three Faculties of Makerere University Business School (MUBS). In regard to data analysis, factor analysis and assessment of reliability and validity of the measurements items was done. Finally, a multiple regression analysis was carried out to evaluate the relationship between the predictor variables and e-learning adoption.
Keywords: electronic learning adoption, higher institution of learning, TOE factors.
GJCST-H Classification: J.4, K.4.2
DeterminantsofElectronicLearningAdoptioninHigherInstitutionsofLearninginUgandaALearnersPerspective
Strictly as per the compliance and regulations of:
Online ISSN: 0975-4172 & Print ISSN: 0975-4350Publisher: Global Journals Inc. (USA)Type: Double Blind Peer Reviewed International Research JournalVolume 17 Issue 1 Version 1.0 Year 2017Information & TechnologyGlobal Journal of Computer Science and Technology: H

Determinants of Electronic Learning Adoption in Higher Institutions of Learning in Uganda: A
Learners’ PerspectiveJuma Sonny Nyeko & Cosmas Ogenmungu
Abstract-
The introduction of electronic learning (EL) has been initiated in Higher Institutions of Learning (HIL) as an attempt to improve on education institutions’ service delivery. By adopting the Technology-Organization-Environment (TOE) framework, this study was aimed at investigating the determinants of the e-learning
adoption in HIL where
eight TOE factors were examined. The study adopted a quantitative approach, a descriptive research and cross-sectional survey for the research design. A questionnaire was developed based on the eight identified TOE study constructs and administered to a population of 5438 students in three Faculties of Makerere University Business School (MUBS). In regard to data analysis, factor analysis and assessment of reliability and validity of the measurements items was done. Finally, a multiple regression analysis was carried out to evaluate the relationship between the predictor variables and e-learning adoption. The findings of this study imply that the TOE can be used to analyze E-Learning adoption in Universities and other HIL as
relative advantage, complexity, compatibility, size, competitive intensity and regulatory environment were identified as significant predictors of EL adoption. Whereas top management support and IT/IS knowledge are insignificant
predictors in the adoption of EL. The outcomes may provide insights to the education sector and stakeholders in developing countries when considering rollover of the technology.
I.
Introduction
Author α : Department of Business Computing, Makerere University Business School, Kampala, Uganda. e-mails: [email protected],
σ
Globa
l Jo
urna
l of C
ompu
ter Sc
ienc
e an
d Te
chno
logy
V
olum
e XVII
Issu
e I Versio
n I
7
Year
2017
(
)H
© 2017 Global Journals Inc. (US)
Keywords: electronic learning adoption, higher institution of learning, TOE factors.
nformation systems (IS) projects, as a result of wide spread usage of the Internet, have been initiated in public Universities and other institutions of learning in
developing countries over the past decade as an attempt to improve on public service delivery by investing million of United States (US) dollars in IT infrastructural development. Deng and Tavares (2013) also confirm this assertion that the latest development of Internet technologies has led to a lot of universities investing considerable resources in e-learning systems to support teaching and learning. Among them is the introduction of education information system (EIS) in
I
higher institutions of learning (HIL), an electronic learning (e-learning) approach that support learning,
research and administrative operations through the use of the Internet and computer facilities (Raymond, 2000; Roffe, 2002) in HIL. Henry (2001) defines e-learning as an appropriate application of the Internet that support the delivery of learning in a student-centered learning environment by delivering the required knowledge, skills and in a holistic approach not limited to any particular courses, technologies, or infrastructures. Whereas Koo-hang and Harman (2005) defined e-learning as the delivery of all educational activities relevant to instructing, teaching, and learning through various electronic media such as the Internet, intranets, extranets, satellite TV, video / audio tape, and/or CD ROM. According to Yining et al., (2012) the specific learning objectives and applications that e-learning technologies are expected to support include:-instruction (lecture, demonstration, webinars, literature, ebooks); collaboration (virtual chat room, discussion board, study group, mentored exercise, instant message); practice (interactive tutorials, online labs, simulation, role playing schemes); and assessment (performance testing, proficiency evaluation, feedback mechanism). Thus e-learning is the attainment of knowledge facilitated and supported through the exploitation of information and communication technologies (ICTs).
Considering educational establishments across the globe, e-learning is becoming more widely adopted with the European Union Report (2014) observing that no less than 96% of the institutions surveyed in Europe use e-learning. Gaebel et al., (2014) attribute the drivers to the adoption of e-learning (EL) in European Higher Institutions of Learning due: - to opportunity to gain employment while studying; flexible use of time and space, physical distance/residence in remote areas; professional development and continued education; family and other social obligations and socio-economic situations of students and the need for accessible and flexible access to education lifelong (Blin et al., 2008).Globalization, aging society; growing competition between higher educational institutions both national and international, and rapid technological development are also drivers of educational technologies. In addition, other significant drivers to the adoption of EL include:-the reduction of overall cost (instructors’ salaries, travel costs, and meeting room rentals), as well as access to quality education, the provision of convenience and a
α σ
reduced environmental impact through lower paper use and energy consumption (Gill, 2000; Roy et al.,
2008).
III.
Research Model and Hypotheses
The TOE framework, developed by Tornatzky and Fleischer (1990), was the research model used to study cloud computing adoption by firms (Low et al.,
2011) and e-learning adoption (Shin-Yuan
et al.,
2009). As indicated in Figure 1 below; Tornatzky and Fleischer (1990); Low et al.,
(2011) and Shin-Yuan
et al.,
(2009)
formed the basis of the conceptual framework of this study.
Globa
l Jo
urna
l of C
ompu
ter Sc
ienc
e an
d Te
chno
logy
V
olum
e XVII
Issu
e I Versio
n I
8
Year
2017
(
)
© 2017 Global Journals Inc. (US)1
HDeterminants of Electronic Learning Adoption in Higher Institutions of Learning in Uganda: A Learners’
Perspective
Notwithstanding some lately promising initia-tives, for the adoption of e-learning (EL), there are some concerns for slow e-learning adoption witnessed in higher institutions of learning in developing countries due to some noteworthy barriers hampering their efforts (Al-Fadhali, 2011) compared to developed countries. According to the Giga Information Group, nearly 75 percent of the 129 top US Universities use e-learning systems (Wang & Wang, 2009). Nevertheless, EL has recently become more popular in some developing countries (Alkhalaf et al., 2012) as much as its upscale is low. However, there are limited studies done in the field of e-learning adoption in institutions of higher learning in developing countries, public Universities in particular and yet the Internet usage is on the rise. According to the Uganda Communications Commission (UCC), Inter- net penetration has in the last two decades exhibited tremendous growth by 79.3% by 2014. Therefore, app- lying technology, organization and environmental (TOE) framework, this study was aimed at examining the deter- minants of e-learning adoption in Ugandan University context.
II. Literature Review
E-Learning is becoming more popular as the most effective method of teaching and learning, while disseminating information and knowledge in institutions of higher learning and organizations in general (Noh et al., 2012). In view of that, E-learning has relentlessly played an essential role to the advancement of the performance of teaching staff and learners, and the enhancement in the quality of teaching methods. E-learning engages the use of a computer or electronic device in some way to offer educational or learning materials, and e-manage data, information, and knowledge to improve student’ performance (Agarwal et al., 2004). E-learning has resulted in increased popularity of education in different educational institutions (Basheer and Ibrahim, 2011) and generally its pervasiveness in higher institu- tions of learning due to the accessibility of the Internet. Liu and Wang (2009) observe that the characteristic of e-learning process was mainly based on the Internet; information dissemination and knowledge flows in form of network courses among others. E-learning has provi- ded several benefits to both the academic and adminis- trative staff and students alike. E-learning enable students at a higher educational level to obtain their education in parallel with pursing their personal goals and maintaining their own careers, without a need to attend classes and be subjected to a rigid schedule (Borstorff and Lowe, 2007). This has resulted to an increase in the number of online courses due to attained benefits for both University and learners as also reported by (Kartha,
2006). This has also improved in the quality of education as it triggers competition amongst educational institu-tions.
E-learning systems can be categorized into two types; the Course Management Systems (CMS) and the Learning Management Systems (EMS). Course Management System is a set of tools that allow the instructor to create online course materials and post it on the Web without having to handle HTML or other programming languages (Janssen, 2015). It’s also referred to as Content management systems available since the late 1990s and considered as an integral part of higher education in recent times. Its administrative components involve class rosters and student grade records. Whereas the teaching component of CMS include all aspects of teaching, student-teacher interaction; learning objects, quizzes, class exercises, tools for real-time chat, or asynchronous bulletin board type communications and tests (Technopedia, 2015).
On the other hand, Learning Management Systems (LMS) are software programs for the administration, documentation, tracking, reporting and delivery of electronic educational technology (also called e-learning) courses or training programs (Ellis, 2009) that handles all aspects of the learning process. Mindflash (2015) suggest that they are the infrastructure that distributes and manages instructional content, identifies and assesses individual and organizational learning and training goals as well as to automating, record keeping and supporting employee registration.
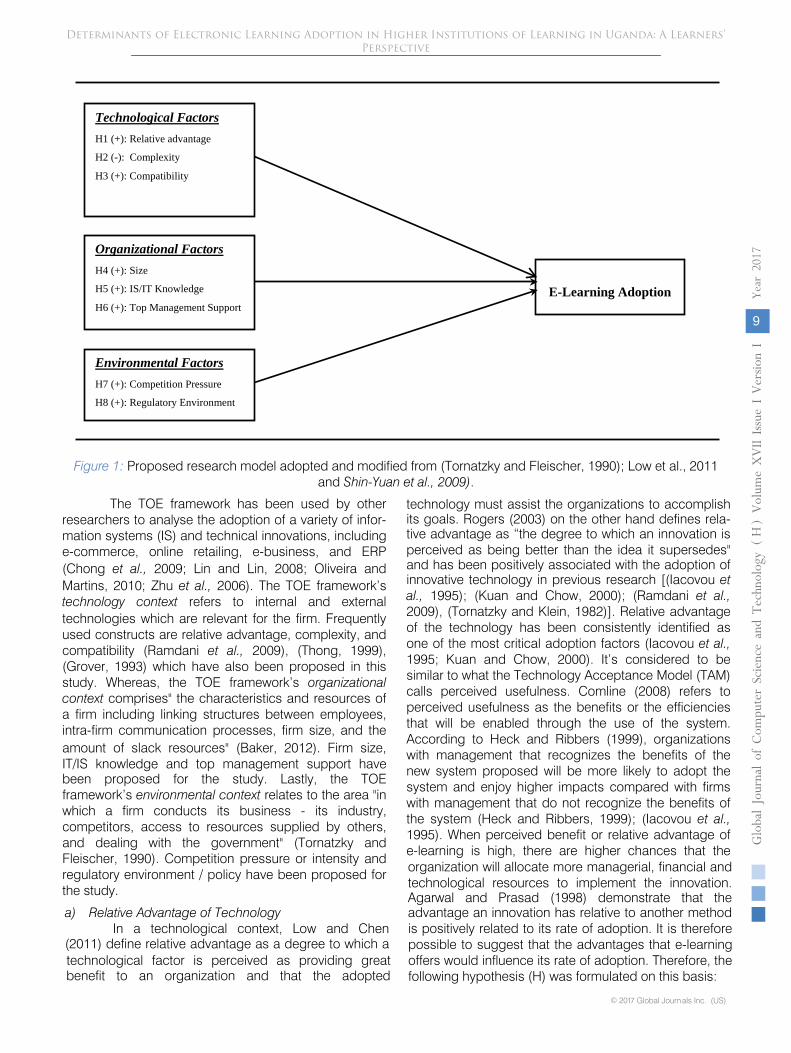
Figure 1:
Proposed research model adopted and modified from (Tornatzky and Fleischer, 1990); Low et al., 2011 and Shin-Yuan et al., 2009).
The TOE framework has been used by other researchers to analyse the adoption of a variety of infor-
mation systems (IS) and technical innovations, including e-commerce, online retailing, e-business, and ERP (Chong et al.,
2009; Lin and Lin, 2008; Oliveira and Martins, 2010; Zhu et al.,
2006). The TOE framework’s technology context refers to internal and external technologies which are relevant for the firm. Frequently used constructs are relative advantage, complexity, and compatibility (Ramdani et al.,
2009), (Thong, 1999), (Grover, 1993) which have also been proposed in this study. Whereas, the TOE framework’s organizational context comprises" the characteristics and resources of a
firm including linking structures between employees,
intra-firm communication processes, firm size, and the
amount of slack resources" (Baker, 2012). Firm size, IT/IS knowledge and top management
support have been proposed for the study.
Lastly,
the TOE framework’s environmental context relates to the area "in which a firm conducts its business -
its industry, competitors, access to resources
supplied by others, and dealing with the government" (Tornatzky and Fleischer, 1990). Competition pressure or intensity and regulatory environment / policy have been proposed for the study.
a)
Relative Advantage of Technology
In a technological context, Low and Chen (2011) define relative advantage as a degree to which a technological factor is perceived as providing great
Technological FactorsH1 (+): Relative advantage
H2 (-): Complexity
H3 (+): Compatibility
Organizational FactorsH4 (+): Size
H5 (+): IS/IT Knowledge
H6 (+): Top Management Support
Environmental FactorsH7 (+): Competition Pressure
H8 (+): Regulatory Environment
E-Learning Adoption
Globa
l Jo
urna
l of C
ompu
ter Sc
ienc
e an
d Te
chno
logy
V
olum
e XVII
Issu
e I Versio
n I
9
Year
2017
(
)H
benefit to an organization and that the adopted
technology must assist the organizations to accomplish its goals. Rogers (2003) on the other hand defines rela-tive advantage as “the degree to which an innovation is perceived as being better than the idea it supersedes" and has been positively associated with the adoption of innovative technology in previous research [(Iacovou et al., 1995); (Kuan and Chow, 2000); (Ramdani et al.,2009), (Tornatzky and Klein, 1982)]. Relative advantage of the technology has been consistently identified as one of the most critical adoption factors (Iacovou et al.,1995; Kuan and Chow, 2000). It’s considered to be similar to what the Technology Acceptance Model (TAM) calls perceived usefulness. Comline (2008) refers to perceived usefulness as the benefits or the efficiencies that will be enabled through the use of the system. According to Heck and Ribbers (1999), organizations with management that recognizes the benefits of the new system proposed will be more likely to adopt the system and enjoy higher impacts compared with firms with management that do not recognize the benefits of the system (Heck and Ribbers, 1999); (Iacovou et al., 1995). When perceived benefit or relative advantage of e-learning is high, there are higher chances that the organization will allocate more managerial, financial and technological resources to implement the innovation. Agarwal and Prasad (1998) demonstrate that the advantage an innovation has relative to another method is positively related to its rate of adoption. It is therefore possible to suggest that the advantages that e-learning offers would influence its rate of adoption. Therefore, the following hypothesis (H) was formulated on this basis:
Determinants of Electronic Learning Adoption in Higher Institutions of Learning in Uganda: A Learners’ Perspective
© 2017 Global Journals Inc. (US)
b)
Complexity of Technology
Complexity refers to the degree of difficulty users’ encounter in understanding or using an inno-
vation (Rogers, 2003) and (Jianyuan and Zhaofang, 2009). The level of difficulty of using an innovation is inversely related to its adoption (Meuter et al.,
2005); (Jianyuan and Zhaofang, 2009); and (Taylor & Todd, 1995). Higher (perceived) complexity will create higher uncertainty related to a successful implementation (Grover, 1993), (Tornatzky and Klein, 1982). Jianyuan and Zhaofang (2009) in their study on adoption of B2B E-Marketplace in China, indicate that the complexity of an IT system has a negative correlation with the final adoption of the system. They further pointed out that, the more difficulty it is to use or train users on an IT system, the less likely it is for an organization to adopt the new system. Thus, the complexity of an IT system can be seen as having a negative impact in adopting innovation (Low and Cheng, 2011). Consequently, the greater the perceived complexity of using e-learning, the less likely its adoption will be. Thus, the study sought to verify:
c)
Compatibility of Technology
Rogers (1995) defines compatibility as the deg-
ree to which innovation is consistent with the adopter’s current culture, lifestyle, values, needs, processes and technological requirements. Previous research most frequently singles out compatibility’s influence on the adoption of innovative technology; it correlates positively with the diffusion of innovations (Tornatzky and Klein, 1982). The lack of compatibility had led many organizations to doubt the potential of the innovation in relation to their current environment (Jianyuan and Zhaofang, 2009). Organizations are more likely to adopt a technology when it is compatible with their existing practices and values (Rogers, 2003). Prior studies such as Teo et al.,
(2007) and Tan et al.,
(2009) provide evidence suggesting organizations are more likely to adopt and use technology that is compatible with the organizations existing technology infrastructure, business processes and value systems. The study also intended to verify that:
d)
Organization Size/Firm Size
Firm size refers to the number of employees, size of the target market and capital invested in an organization (Anand and Kulshreshtha, 2007) and has been recognized as an
important facilitator for the adop-
tion of technology
innovations [(Tornatzky and Fleischer, 1990), (Thong, 1999)]. Anand and Kulshre-
shtha (2007)
further point out that, large organizations have more resources that can be used to finance innovation and plays a key role in determining IT innovation (Pan and Jang, 2008). Consequently, large organizations stand to benefit greatly out of technology adoption due to greater flexibility and risk-taking ability (Liu, 2008; Oliveira and Martins, 2011; Wang et al.,
2010) and also often are more well-equipped with resources and infrastructure to facilitate innovation adoption (Thong, 1999; Levenburg et al., 2006). Organizational and firm size is constantly found to be positive with regard to the organizational inclination to adopt an innovation (Rogers, 1995). Jeya-
raj et al., (2006) also revealed that organizational size is one of the best predictors of IT adoption by organi-
zations. This is consistent with the study done by (Gibbs and
Kraemer, 2004; Grover, 1993; Zhu et al.,
2003) who also suggested that organizational size positively influe-nced the organizational adoption of IT innovations.
Globa
l Jo
urna
l of C
ompu
ter Sc
ienc
e an
d Te
chno
logy
V
olum
e XVII
Issu
e I Versio
n I
10
Year
2017
(
)
© 2017 Global Journals Inc. (US)1
H
Montazemi (1988) also affirms that the probable reason for the significant positive relationship between organi-zational size and IT adoption is the greater size of the organizations as they generally have more slack in their resources and therefore assign more organizational resources (e.g., financial, technical, and human resou-rces) for the adoption of any new IT innovation. Derived from the above theoretical arguments and empirical support, it can be argued that larger Universities with more students number is linked to a large sized Unive-rsity thus more likely to adopt e-learning. Thus, thefollowing hypothesis was formulated on the basis of the above evidence:
e) Information System (IS) / IT KnowledgeInformation system (IS) expertise or knowledge
also referred to as technological readiness and the IT/IS human resources and infrastructures of a particular firm. Knowledge about IS enables organisations to manage effectively the risks associated with investing in an innovation (Teo et al., 2007). Those organizations that do not have much IT/IS expertise and experience may not be aware of new technologies and may not desire to take a risk by adopting them (Ramdani et al., 2009). Relevant IS/IT experience variables have been investi-gated in many studies (Lee et al., 2004; Lertwongsatien and Wongpinunwatana, 2003). Dholakia and Kshetri (2002) suggest that the experience of already available technologies in the organization will influence the adop-tion of similar technology in the future. Moreover, Kuan and Chou (2001) also found that prior IS experience influences the adoption of new technologies. Previous researchers identified their technology knowledge as a crucial factor influencing adoption decisions [(Grover, 1993), (Chau and Jim, 2002); (Fichman, 1992); (Zhu et al., 2002). Considering that increasingly non-IT employ-yees - or at least their management – are involved in strategic IT decisions, their perception and under-
Determinants of Electronic Learning Adoption in Higher Institutions of Learning in Uganda: A Learners’ Perspective
• H1: Relative advantage is positively associated with e-learning adoption.
• H2: Technical complexity is negatively associated with e-learning adoption.
• H3: Technical compatibility is positively associated with e-learning adoption.
• H4: University size is positively associated with e-learning adoption.
standing of the targeted technologies is important. Van Grembergen and De Haes (2008)
also state that IT
knowledge within business divisions contributes to a
creative and innovative environment. There are also some empirical evidence that shows the positive relationship between employees’ IS knowledge and the decision to adopt IS (Thong, 1999). Therefore, the following hypothesis can be formulated on this basis on technology readiness of the non-IT human resources:
with environmental factors affecting technological adop-
tion (Iacovou et al.,
1995). Organizations may adopt and use a technology to keep up with competing organi-
zations (Joo and Kim, 2004). Competitive pressure forces organizations to be more innovative in order to stay in the business.
Various studies have indicated that the intensity of competition in an industry is a major adoption determinant factor [(Wu and Subramaniam,
Globa
l Jo
urna
l of C
ompu
ter Sc
ienc
e an
d Te
chno
logy
V
olum
e XVII
Issu
e I Versio
n I
11
Year
2017
(
)H
2009); (Jianyuan and Zhaofang, 2009); (Oliveira and Martins, 2011); (Kuan & Chou, 2001); (Low and Cheng, 2011) and (Chong and Ooi, 2008)]. Thus, competition increases the likelihood of innovation adoption (Thong, 1999) as organisations also allocate more resources toinnovations (Grover, 1993). Hence, derived from the above theoretical arguments, the following hypothesis was devised:
h) Regulatory Environment / PolicyBaker (2012) points out that government regu-
lation can have a favorable or negative impact on orga-nizations, depending on whether its policy encourages or discourages innovation. Organizational regulation tendencies are aimed at accommodating audit trails and legislative compliance. Firms operating in a well-regu-lated environment have to balance legal requirements with the adoption of technology innovations. Govern-ments can support technology innovation by providing tax advantages by introducing regulation that force firms to adopt certain technology standards (Zhu, Xu, and Dedrick, 2003). In order to be well accepted the e-learning solutions need to meet some legal rules and security issues (Betts et al., 2006). Adversely, govern-ments can also pass constraining regulation and restric-tions; for example restrictions for trading with specific countries, local legislations or disaster regula- tions (Quayle, 2005). Hence, derived from the above theor-etical arguments, the following hypothesis was formulated:
IV. Research Methodology
a) Research Design, Sampling and Research Instrument
The study examined the determinants of e-lear-ning adoption in a higher institution of learning, speci-fically Makerere University Business School (MUBS). The study used a quantitative, descriptive and cross-sectional research designs. Cross-sectional research design collects and uses data for only a specific point in time. The study population included MUBS students from three (3) Faculties of Computing and Management Science (FCMS); Faculty of Graduate Studies and Rese-arch (FGSR) and in Faculty of Vocational and Distance Education (FVDE) with the number of respondents indicated in Table 1 below.
Determinants of Electronic Learning Adoption in Higher Institutions of Learning in Uganda: A Learners’ Perspective
© 2017 Global Journals Inc. (US)
• H5: IS/IT knowledge is positively associated with e-learning adoption.
• H7: Competition pressure is positively associated with e-learning adoption.
• H8: Regulatory environment/policy is positively associated with e-learning adoption.
f) Top Management SupportTop management support refers to the level of
support extended by the higher management to adopting the technological innovations for use (Grover, 1993). The review of the IT adoption literature; Jeyaraj et al., (2006) suggests, top management support as one of the three best predictors for IT innovation adoption at the organizational level and can contribute to the adoption of innovations by creating a fertile environment and by providing resources [(Ramdani et al., 2009), (Grover, 1993), (Premkumar and Roberts, 1991)]. Indeed, it reduces barriers and resistance to change (Teo et al., 2006). Previous studies on IT innovation adoption based on TOE framework have also suggested that top management support has a positive relationship to the organizational decision to adopt an innovation (Chong et al., 2009; Grover, 1993; Lee et al., 2009; Ramdani et al., 2009; Teo et al., (2006). Quinn (1985) argued that there happen to be two different grounds for justifying the positive relationship between top management support and technological innovation adoption. In the first instance, powerful top management support can make sure of the ample distribution of organizational resources (e.g., financial, technical, and human) for flawless adoption and implementation of an IT innovation (Oliveira and Martin, 2011) and also have the ability to send innovation importance and accep-tance messages across the organization (Wang, Wang and Yang, 2010). Secondly, such support lessens organizational disagreement on adopting an IT inno-vation as top management can provide long-term vision, proposals, support, and the obligation to generate an affirmative environment for the IT innovation (Quinn, 1985). Innovations that receive management support are therefore easily adopted in organizations. Therefore, it would be highly likely that the organizations with stron-ger top management support for e-learning adoption would also be more likely to adopt such applications. Therefore, based on the previous theoretical arguments, the following hypothesis was formulated:
g) Competitive PressuresCompetitive pressure refers to the degree of
pressure experienced by organisations within the indu-stry (Oliveira and Martin, 2011) and usually associated
• H6: Top management support is positively associated with e-learning adoption.

Table 1:
Sample Size
Faculty
Sample Size
Faculty of Computing and Management Science (FCMS)
1671
Faculty of Graduate Studies and Research (FGSR)
663
Faculty of Vocational and Distance Education (FVDE)
3104
Total
5438
Out of the 5438 sample size
in Table 1 above that was conveniently selected, 4743 questionnaires were returned, implying 87.2% response rate. However, some 95 questionnaires were found to be incomplete and others inconsistent in the way questions were answered. These were therefore removed from the analysis. Consequently, 4648 questionnaires representing 85.5% of the sample were analyzed. Even
after the removal of 95 questionnaires, 85.5% representation of the study results was very adequate. The response rate was very good because the survey was conducted during exams period when most students are available at the Campus.
Table 2:
Social Demographic Characteristics
Frequency
Percentage
Gender
Male
Female
2216
2432
47.7
52.3
Total
4648
100
Age
19 years and below
20 –
25 years
26 –
30 years
31 –
35 years
Above 35 years
56
2928
856
584
224
1.20
63.0
18.4
12.6
4.80
Total
4648
100
Education Level
Certificate
416
9.0
Globa
l Jo
urna
l of C
ompu
ter Sc
ienc
e an
d Te
chno
logy
V
olum
e XVII
Issu
e I Versio
n I
12
Year
2017
()
© 2017 Global Journals Inc. (US)1
H
Diploma BachelorsMasters
28481120240
61.324.15.2
Total 4648 100
The number of female and male respondents is almost even with the female representing a slightly higher percentage of 52.3% against 47.7% for male respondents. The gender composition reflects the student population trend in across all Universities in Uganda whereby female students constitute the majority of the student enrollments as indicated in Table 2 above. The numbers of respondents 19 years and below constitute 1.2%; 20 – 25 years constitute 63%; 26 – 30 years constitute 18.4%; 31 – 35 years constitute 12.6%
and lastly, above 35 years constitute 4.8%. Considering the education background of respondents, Certificate constitute 9%; Diploma constitute 61.3%; Bachelors constitute 24.1% and finally Masters respondents constitute 5.2% as shown in Table 2 above.
b) Reliability and Validity of Measurement Instruments A questionnaire was developed based on the
study constructs of several information systems adoption studies in Table 3 below.
Table 3: Reliability and Validity Measures
Constructs & Sources Construct Measurement Items Cronbach’s Alpha
Factor Loadings
Relative Advantage
(Ali & Green, 2007); (De Haes & Van Grembergen, 2008); (Lee et al., 2008a); (Nfuka & Rusu, 2010); (Nfuka & Rusu, 2011). (Wang et al., 2010); Yen et al., 2013; Alshamaila et al. 2012; Low et al., 2011;Jang, 2010);Dublin, L. (2004)
• EL usage increases user satisfaction and leads to improved academic performance.
• EL offer convenience in service provision.• EL usage is better than the use of previous
manual systems in an institutions setting.• Using EL improves on operational efficiencies
as a result of cost reduction in service delivery.
• Using EL improves on effectiveness in performance through the provision of new opportunities.
0.675 1. 0.5682. 0.6363. 0.5664. 0.6735. 0.692
Determinants of Electronic Learning Adoption in Higher Institutions of Learning in Uganda: A Learners’ Perspective
Table 2 below represents the social demographic characteristics of respondents about their gender, age and education level.
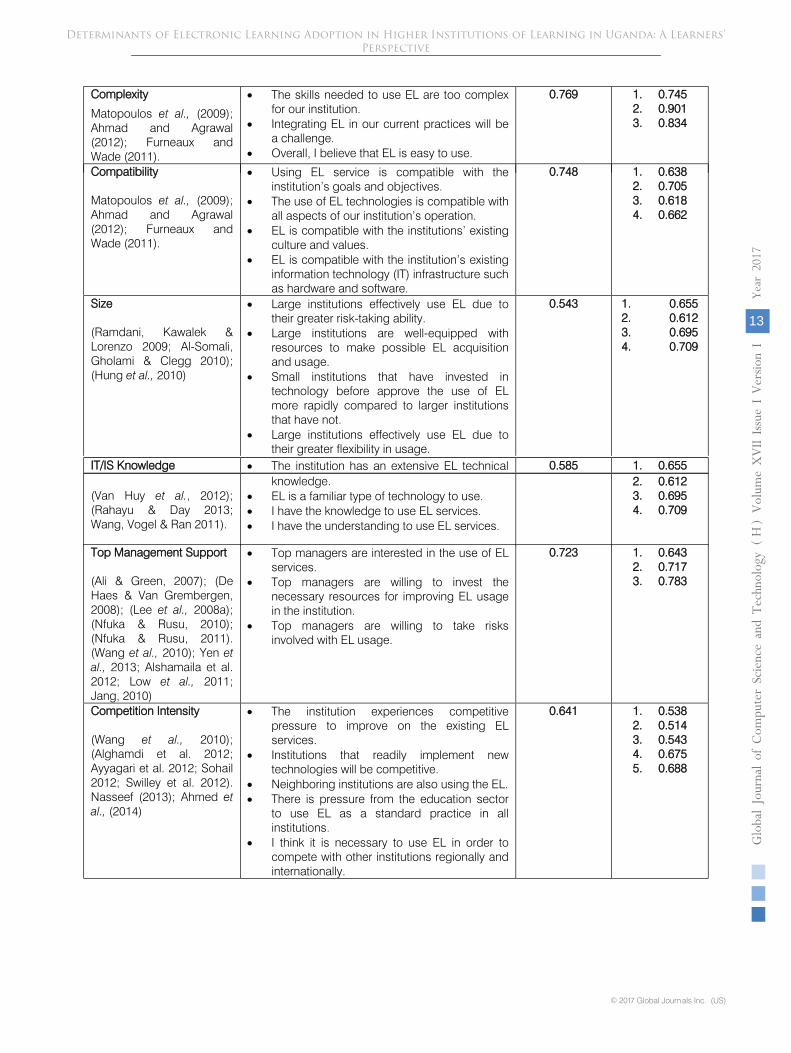
Complexity
Matopoulos et al.,
(2009); Ahmad and Agrawal (2012); Furneaux and Wade (2011).
•
The skills needed to use EL are too complex for our institution.
•
Integrating EL in our current practices will be a challenge.
•
Overall, I believe that EL is easy to use.
0.769
1. 0.745
2. 0.901
3. 0.834
Compatibility
Matopoulos et al.,
(2009); Ahmad and Agrawal (2012); Furneaux and Wade (2011).
•
Using EL service is compatible with the institution’s goals and objectives.
•
The use of EL technologies is compatible with all aspects of our institution’s operation.
•
EL is compatible with the institutions’ existing culture and values.
•
EL is compatible with the institution’s
existing information technology (IT) infrastructure such as hardware and software.
0.748
1. 0.638
2. 0.705
3. 0.618
4. 0.662
Size
(Ramdani, Kawalek & Lorenzo 2009; Al-Somali, Gholami & Clegg 2010); (Hung et al.,
2010)
•
Large institutions effectively use EL due to their greater risk-taking ability.
•
Large institutions are well-equipped with resources to make possible EL acquisition and usage.
•
Small institutions that have invested in technology before approve the use of EL more rapidly compared to larger institutions that have not.
•
Large institutions effectively use EL due to their greater flexibility in usage.
0.543
1.
0.655
2.
0.612
3.
0.695
4.
0.709
IT/IS Knowledge
•
The institution has an extensive EL technical 0.585
1. 0.655
Globa
l Jo
urna
l of C
ompu
ter Sc
ienc
e an
d Te
chno
logy
V
olum
e XVII
Issu
e I Versio
n I
13
Year
2017
(
)H
(Van Huy et al., 2012); (Rahayu & Day 2013; Wang, Vogel & Ran 2011).
knowledge.• EL is a familiar type of technology to use.• I have the knowledge to use EL services.• I have the understanding to use EL services.
2. 0.6123. 0.6954. 0.709
Top Management Support
(Ali & Green, 2007); (De Haes & Van Grembergen, 2008); (Lee et al., 2008a); (Nfuka & Rusu, 2010); (Nfuka & Rusu, 2011). (Wang et al., 2010); Yen et al., 2013; Alshamaila et al. 2012; Low et al., 2011; Jang, 2010)
• Top managers are interested in the use of EL services.
• Top managers are willing to invest the necessary resources for improving EL usage in the institution.
• Top managers are willing to take risks involved with EL usage.
0.723 1. 0.6432. 0.7173. 0.783
Competition Intensity
(Wang et al., 2010); (Alghamdi et al. 2012; Ayyagari et al. 2012; Sohail 2012; Swilley et al. 2012). Nasseef (2013); Ahmed et al., (2014)
• The institution experiences competitive pressure to improve on the existing EL services.
• Institutions that readily implement new technologies will be competitive.
• Neighboring institutions are also using the EL.• There is pressure from the education sector
to use EL as a standard practice in all institutions.
• I think it is necessary to use EL in order to compete with other institutions regionally and internationally.
0.641 1. 0.5382. 0.5143. 0.5434. 0.6755. 0.688
Determinants of Electronic Learning Adoption in Higher Institutions of Learning in Uganda: A Learners’ Perspective
© 2017 Global Journals Inc. (US)
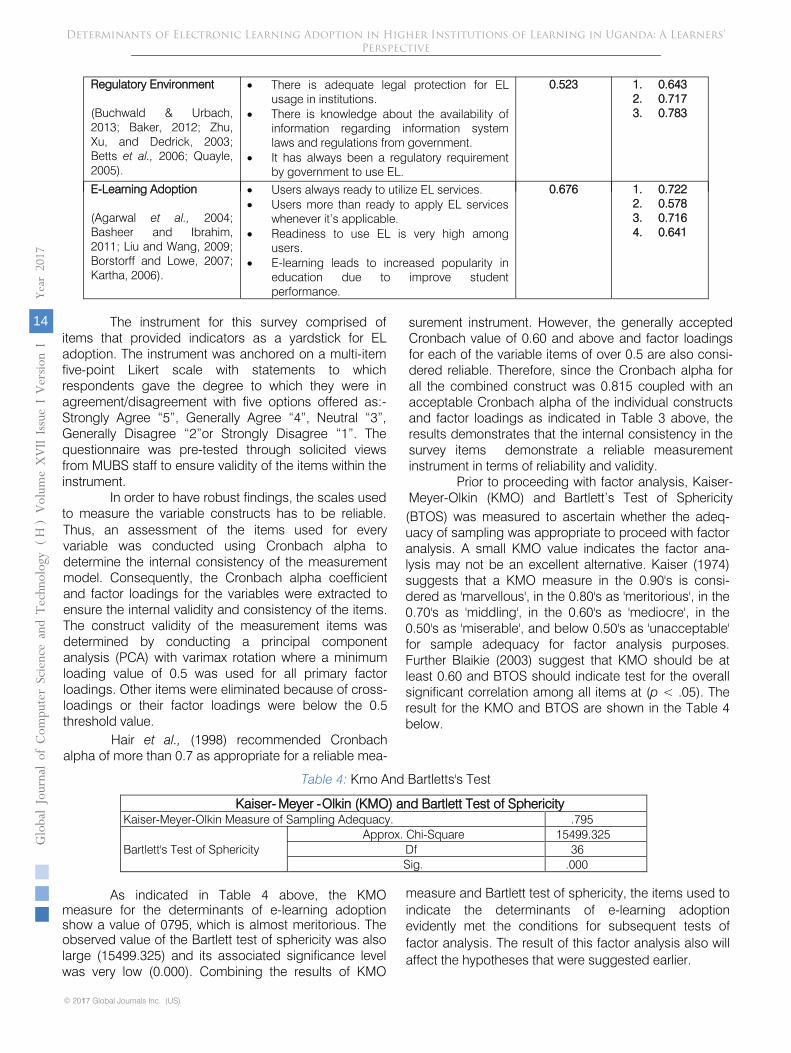
Regulatory Environment
(Buchwald & Urbach, 2013;
Baker, 2012; Zhu, Xu, and Dedrick, 2003; Betts et al.,
2006; Quayle, 2005).
•
There is adequate legal protection for EL usage in institutions.
•
There is knowledge about the availability of information regarding information system laws and regulations from government.
•
It has always been a regulatory requirement by government to use EL.
0.523
1. 0.643
2. 0.717
3. 0.783
E-Learning Adoption
(Agarwal et al.,
2004; Basheer and Ibrahim, 2011; Liu and Wang, 2009; Borstorff and Lowe, 2007; Kartha, 2006).
•
Users always ready to utilize EL services.
•
Users more than ready to apply EL services whenever it’s applicable.
•
Readiness to use EL is very high among users.
•
E-learning leads to increased popularity in education due to improve student performance.
0.676
1. 0.722
2. 0.578
3. 0.716
4. 0.641
The instrument for this survey comprised of items that provided indicators as a yardstick for EL adoption. The instrument was anchored on a multi-item five-point Likert scale with statements to which respondents gave the degree to which they were in agreement/disagreement with five options offered as:-
Strongly Agree “5”, Generally Agree “4”, Neutral “3”, Generally Disagree “2”or Strongly Disagree “1”. The questionnaire was pre-tested through solicited views from MUBS staff to ensure validity of the items within the instrument.
In order to have robust findings, the scales used to measure the variable constructs has to be reliable. Thus, an assessment of the items used for every variable was conducted using Cronbach alpha to determine the internal consistency of the measurement model. Consequently, the Cronbach alpha coefficient and factor loadings for the variables were extracted to ensure the internal validity and consistency of the items. The construct validity of the measurement items was determined by conducting a principal component analysis (PCA) with varimax rotation where a minimum loading value of 0.5 was used for all primary factor loadings. Other items were eliminated because of cross-loadings or their factor loadings were below the 0.5 threshold value.
Globa
l Jo
urna
l of C
ompu
ter Sc
ienc
e an
d Te
chno
logy
V
olum
e XVII
Issu
e I Versio
n I
14
Year
2017
(
)
© 2017 Global Journals Inc. (US)1
H
(BTOS) was measured to ascertain whether the adeq-uacy of sampling was appropriate to proceed with factor analysis. A small KMO value indicates the factor ana-lysis may not be an excellent alternative. Kaiser (1974) suggests that a KMO measure in the 0.90's is consi-dered as 'marvellous', in the 0.80's as 'meritorious', in the 0.70's as 'middling', in the 0.60's as 'mediocre', in the 0.50's as 'miserable', and below 0.50's as 'unacceptable' for sample adequacy for factor analysis purposes. Further Blaikie (2003) suggest that KMO should be at least 0.60 and BTOS should indicate test for the overall significant correlation among all items at (p < .05). The result for the KMO and BTOS are shown in the Table 4 below.
Hair et al., (1998) recommended Cronbach alpha of more than 0.7 as appropriate for a reliable mea-
surement instrument. However, the generally accepted Cronbach value of 0.60 and above and factor loadings for each of the variable items of over 0.5 are also consi-dered reliable. Therefore, since the Cronbach alpha for all the combined construct was 0.815 coupled with an acceptable Cronbach alpha of the individual constructs and factor loadings as indicated in Table 3 above, the results demonstrates that the internal consistency in the survey items demonstrate a reliable measurement instrument in terms of reliability and validity.
Prior to proceeding with factor analysis, Kaiser-Meyer-Olkin (KMO) and Bartlett’s Test of Sphericity
Table 4: Kmo And Bartletts's Test
Kaiser- Meyer -Olkin (KMO) and Bartlett Test of SphericityKaiser-Meyer-Olkin Measure of Sampling Adequacy. .795
Bartlett's Test of SphericityApprox. Chi-Square 15499.325
Df 36Sig. .000
As indicated in Table 4 above, the KMO measure for the determinants of e-learning adoption show a value of 0795, which is almost meritorious. The observed value of the Bartlett test of sphericity was also large (15499.325) and its associated significance level was very low (0.000). Combining the results of KMO
measure and Bartlett test of sphericity, the items used to indicate the determinants of e-learning adoption evidently met the conditions for subsequent tests of factor analysis. The result of this factor analysis also will affect the hypotheses that were suggested earlier.
Determinants of Electronic Learning Adoption in Higher Institutions of Learning in Uganda: A Learners’ Perspective
V.
Analysis of Results
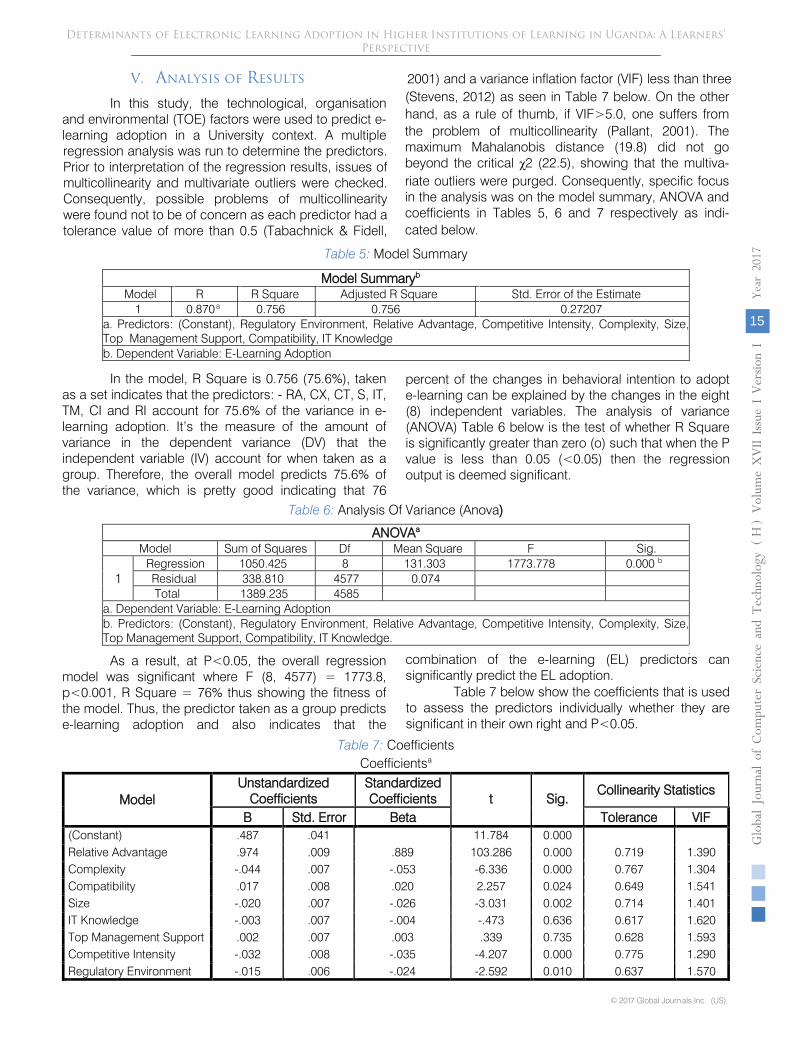
In this study, the technological, organisation and environmental (TOE) factors were used to predict e-learning adoption in a University context. A multiple regression analysis was run to determine the predictors. Prior to interpretation of the regression results, issues of multicollinearity and multivariate outliers were checked. Consequently, possible problems of multicollinearity were found not to be of concern as each predictor had a tolerance value of more than 0.5 (Tabachnick & Fidell,
2001) and a variance inflation factor (VIF) less than three (Stevens, 2012) as seen in Table 7 below. On the other hand, as a rule of thumb, if VIF>5.0, one suffers from the problem of multicollinearity (Pallant, 2001). The maximum Mahalanobis distance (19.8) did not go beyond the critical χ2 (22.5), showing that the multiva-
riate outliers were purged.
Consequently, specific focus in the analysis was on the model summary, ANOVA and coefficients in Tables 5, 6 and 7 respectively as indi-
cated below.
Table 5:
Model Summary
Model Summaryb
Model
R
R Square
Adjusted R Square
Std. Error of the Estimate
1
0.870a
0.756
0.756
0.27207
a. Predictors: (Constant), Regulatory Environment, Relative Advantage, Competitive Intensity, Complexity, Size, Top Management Support, Compatibility, IT Knowledge
b. Dependent Variable: E-Learning Adoption
In the model, R Square is 0.756 (75.6%), taken as a set indicates that the predictors: -
RA, CX, CT, S, IT, TM, CI and RI account for 75.6% of the variance in e-learning adoption. It’s the measure of the amount of variance in the dependent variance (DV) that the independent variable (IV) account for when taken as a group. Therefore, the overall model predicts 75.6% of the variance, which is pretty good indicating that 76
percent of the changes in behavioral intention to adopt e-learning can be explained by the changes in the eight (8) independent variables.
The analysis of variance
(ANOVA) Table 6 below is the test of whether R Square is significantly greater than zero (o) such that when the P value is less than 0.05 (<0.05) then the regression output is deemed significant.
Globa
l Jo
urna
l of C
ompu
ter Sc
ienc
e an
d Te
chno
logy
V
olum
e XVII
Issu
e I Versio
n I
15
Year
2017
(
)H
Table 6: Analysis Of Variance (Anova)
ANOVAa
Model Sum of Squares Df Mean Square F Sig.
1Regression 1050.425 8 131.303 1773.778 0.000 b
Residual 338.810 4577 0.074Total 1389.235 4585
a. Dependent Variable: E-Learning Adoption b. Predictors: (Constant), Regulatory Environment, Relative Advantage, Competitive Intensity, Complexity, Size, Top Management Support, Compatibility, IT Knowledge.
As a result, at P<0.05, the overall regression model was significant where F (8, 4577) = 1773.8, p<0.001, R Square = 76% thus showing the fitness of the model. Thus, the predictor taken as a group predicts e-learning adoption and also indicates that the
combination of the e-learning (EL) predictors can significantly predict the EL adoption.
Table 7: CoefficientsCoefficientsa
Determinants of Electronic Learning Adoption in Higher Institutions of Learning in Uganda: A Learners’ Perspective
© 2017 Global Journals Inc. (US)
Table 7 below show the coefficients that is used to assess the predictors individually whether they are significant in their own right and P<0.05.
ModelUnstandardized
CoefficientsStandardized Coefficients t Sig.
Collinearity Statistics
B Std. Error Beta Tolerance VIF(Constant) .487 .041 11.784 0.000Relative Advantage .974 .009 .889 103.286 0.000 0.719 1.390Complexity -.044 .007 -.053 -6.336 0.000 0.767 1.304Compatibility .017 .008 .020 2.257 0.024 0.649 1.541Size -.020 .007 -.026 -3.031 0.002 0.714 1.401IT Knowledge -.003 .007 -.004 -.473 0.636 0.617 1.620Top Management Support .002 .007 .003 .339 0.735 0.628 1.593Competitive Intensity -.032 .008 -.035 -4.207 0.000 0.775 1.290Regulatory Environment -.015 .006 -.024 -2.592 0.010 0.637 1.570

a)
Dependent Variable: E-Learning Adoption
Considering the coefficient Table 7 above, the P value for Relative Advantage (RA) as one of the
e-learning (EL) adoption predictors is 0.000. This is less than 0.05 hence RA is a significant predictor of e-learning adoption. Similarly, complexity with a P value of 0.000 is also a significant predictor of e-learning adoption since the P value is less
than 0.05. Furthermore, Compatibility (0.024), Size (0.002), Competitive Intensity (0.000) and Regulatory Environment (0.010) all with P values less than 0.05 are also all significant predictors of e-learning adoption. However, IT knowledge (P=0.636) and Top Management Support (P=0.735) are not significant predictors of e-learning adoption since their P values are all greater than 0.05.
VI.
Discussion on the Findings
Set of hypotheses H1 to H8 was derived from a review of the literature on e-learning adoption
numbered to correspond to the labels shown in Figure 1 in Section 3 (on page 5) indicating the anticipated effect each predictor variable would have on the criterion variable is shown as a plus sign (positive effect) or minus sign (negative effect). The hypotheses were used to test the research model involving both the independent and dependent variables. The independent variables of this study are
relative advantage (RA); technical complexity (CX); technical compatibility (CT); size (S); IT/IS knowledge (IT); top management support (TM), competition intensity (CI) and regulatory environment (RI).
These independent variables may be the determinants that influence the dependent variable (represented by REL), that is, the intention to adopt e-learning
among students respondents of MUBS in Uganda.
Hypothesis H1, Relative Advantage was found to have the most significant positive influence (t = 103.3, p-value <0.01) on the students’ intention to adopt e-learning services in the University. The finding was consistent with past studies conducted related to adoption of e-learning services (Ansong et al.,
2016; Yen
Globa
l Jo
urna
l of C
ompu
ter Sc
ienc
e an
d Te
chno
logy
V
olum
e XVII
Issu
e I Versio
n I
16
Year
2017
(
)
© 2017 Global Journals Inc. (US)1
H
et al., 2013; Alshamaila et al., 2012; Low et al., 2011; Jang, 2010) due to benefits derived from EL adoption. It also matches the results of Islam (2013) and Motaghian et al., (2013) who found a significant relationship between expected benefits and e-learning adoption. Raouf et al., (2012) affirm that Universities that adopt e-learning provide better services in their functions consequently, opening up new opportunities in the fields of teaching and transferring knowledge to the learners. This result implied that e-learning services will be embraced provided it leads to improved student performance thus increases user satisfaction; being very convenient; improves operational efficiencies and effectively through the provision of new opportunities.
Hypothesis H2, complexity was found to have significant negative impact (t = -6.336, p-value <0.01) on the students’ intention to adopt e-learning services in the University. It shows an inverse relationship with e-learning adoption. Complexity in EL implies that as technology becomes more complex in a University it will lead to EL being less adopted. Other studies suggest that integrating EL in University practices is a challenge and the skills needed to use EL are also complex as demonstrated in previous studies (Matopoulos et al.,2009; Ansong et al., 2016; Ahmad and Agrawal, 2012; Furneaux and Wade, 2011). Nevertheless, they agree that it’s easy to use EL. This is so because they are already users of EL services.
Hypothesis H3, compatibility was found to have significant positive influence (t = 2.257, p-value <0.01) on the students’ intention to adopt e-learning services in the University. The result was also consistent with past studies by (Matopoulos et al., 2009; Ahmad and Agrawal, 2012; Furneaux and Wade, 2011). This is also complements the findings of several studies that IT infrastructure has a significant impact on the adoption of e-learning (Namisiko et al., 2014; Eze et al., 2013). They argue that IT infrastructure in the Universities is a necessity in promoting the adoption of e-learning systems as they are viewed as key constituents of technological advancement of a University. The research results highlighted that EL adoption can be influenced by the compatibility of the EL technology with the University’s operations, goals, objectives, existing culture and values and also the existing information technology (IT) infrastructure such as hardware and software.
Hypothesis H4, size was found to have significant negative impact (t = -3.031, p-value <0.01) on the students’ intention to adopt e-learning services in the University which supported the hypothesis. The result was consistent with several past studies by (Ramdani et al., 2009; Al-Somali, et al., 2010; Hung et al., 2010). Thus, the study also implies that large institutions are well-equipped with resources to make possible EL acquisition and usage. Furthermore, adoption of EL services is possible by large Universities, because they have more students and programmes, due to their greater risk-taking ability and greater flexibility in usage.
Hypothesis H5, IT knowledge was found to have insignificant negative impact (t = -0.473, p-value >0.01) on the students’ intention to adopt e-learning services in the University thus the hypothesis was not supported. Previous studies had the hypothesis supported (Van Huy et al., 2012); Rahayu & Day 2013; Wang et al., 2011). It means that the students were technologically prepared to use the EL platform. Technology readiness in this study refers to the degree to which technological infrastructure and human resources are ready to support technology adoption. It can be assumed that organizations whose non-IT
Determinants of Electronic Learning Adoption in Higher Institutions of Learning in Uganda: A Learners’ Perspective
Similarly, hypothesis H6, top management support was also found to be have insignificant positive impact (t = 0.339, p-value >0.01) on the students’ intention to adopt e-learning services in the University thus the hypothesis also was not supported. Previous studies had the hypothesis supported (Wang et al.,
2010; Yen et al.,
2013; Alshamaila et al.,
2012; Low et al.,
2011; Jang, 2010). Both H5 and H6 are not very strange findings in regard to this research because the students had some prior training in the use of IT integrated in their year one curricular; therefore there was no need of top management support as far as the use of EL platform was concerned. They also see
no need of having any IT expert to take them through the usage of the platform.
Hypothesis H7, competition intensity was found to have significant negative impact (t = -4.207, p-value <0.01) on the students’ intention to adopt e-learning services in the University which supported the hypothesis. The result was consistent with several past studies by (Ansong et al.,
2016; Wang et al.,
2010; Alghamdi et al.,
2012; Ayyagari et al.,
2012; Sohail,
2012; Swilley et al.,
2012; Nasseef, 2013; Ahmed et al.,2014). Thus, the study also implies that Universities that adopt EL do so due to improve on the existing EL services and implement new technologies as a result of competition in the education sector. Universities are in effect in a competition for supremacy, esteem, popularity, recognition and for the best products in the market. Furthermore, the Universities embrace the usage of EL due to global changes and standard practice pressure.
Hypothesis H8, regulatory environment
was also found to have significant negative impact (t = -
Globa
l Jo
urna
l of C
ompu
ter Sc
ienc
e an
d Te
chno
logy
V
olum
e XVII
Issu
e I Versio
n I
17
Year
2017
(
)H
4.592, p-value <0.01) on the students’ intention to adopt e-learning services in the University which supported the hypothesis. The result was demonstrated with previous studies by (Buchwald & Urbach, 2013;Baker, 2012; Zhu, Xu, and Dedrick, 2003; Betts et al.,2006; Quayle, 2005). Thus, the study also implies that Universities that adopt EL do so due to existence of adequate legal protection for EL usage and knowledge about the availability of information regarding information system laws and regulatory requirement from government.
VII. Conclusion and Recommendations
The aim of the study was to examine the deter-minants of EL adoption in Universities in a developing country context. The eight technology, organization and environmental (TOE) factors and predictor variables examined in this study are relative advantage, comp-lexity, compatibility, top management support, size, IT/IS knowledge, competitive pressure or intensity and regu-latory environment. The results point to six (6) factors,
that is; relative advantage, complexity, compatibility, size, competitive pressure or intensity and regulatory environment identified as significant predictors of EL adoption. Whereas top management support and IT/IS knowledge are insignificant predictors in the adoption of EL in HIL. The factor having the strongest relationship on the adoption and usage of EL is relative advantage because students are more interested in their academic performance.
The implication of the top management support and IT/IS knowledge results being insignificant shows that there is need to have the same study in a University that does not have IT based course units in year one of their curriculum for sake of comparison. Perhaps, the scope of the study was also limited, so a comprehensive study should be done at MUBS to include all the six (6) Faculties instead of only three (3) before generalizing results.
As a recommendation, since E-Learning is still at its infant stage in Universities in developing countries, in order to promote its usage, Universities have to encourage both staff and students to positively embrace the EL system. Furthermore, based on the result of IT knowledge and top management support as insigni-ficant to the adoption of EL, Universities should incorp-orate IT related course units in all their study program-mmes during First year of study. The findings are envisioned to present government, education stakeho-lders and educational institutions better understanding of the e-learning adoption determinants before rolling the E-Learning system to other institutions of higher learning, perhaps including supporting private Univer-sities. Therefore, the study will ignite the process of the formulation of national policies and strategies to enhance and support e-learning initiatives to counter and address the existing and future e-learning challe-nges given the foreseen potential of e-learning in higher education. The study will also contribute to the gaps in educational information systems adoption literature.
References Références Referencias
1. Al-Fadhli, S., Factors Influencing the acceptance of distance-learning. International Journal of Instruc-tional Media, 2011.
2. Alkhalaf, S., Drew, S., AlGhamdi, R., & Alfarraj, O. (2012). E-learning system on higher education insti-tutions in KSA: attitudes and perceptions of faculty members. Procedia –Social and Behavioral Scien-ces 47, 1199 – 1205.
3. Ansong E, S. L. Boateng, R. Boateng and J. Effah, "Determinants of E-Learning Adoption in Univer-sities: Evidence from a Developing Country," 2016 49th Hawaii International Conference on System Sciences (HICSS), Koloa, HI, 2016, pp. 21-30.
4. Babbie, Earl, The Practice of Social Research (8th
Edition), Wadsworth Publishing Co., Albany, New York, 1998
Determinants of Electronic Learning Adoption in Higher Institutions of Learning in Uganda: A Learners’ Perspective
students are ready to use a technological innovation are more prepared to adopt technology innovation.
© 2017 Global Journals Inc. (US)
Dwivedi, M. R. Wade, and S. L. Schneberger, Eds., ed New York: Springer, 2012, pp. 231-245.
6.
Bhattarai, P, (2011), 'Curbing Procurement Corru-
ption', Voices Against Corruption. [On-line].
Available at
http://voices-against-corruption.ning.com/profiles
/blogs/curbing-
procurement-
corruption
[Retrieved on January 17, 2014)
7.
Betts,M., Black, P., Christensen, S.A., Dawson, E., Du, R., Duncan, W., Foo, E., & Nieto,
J.G. (2006). Towards secure and legal e-tendering. Journal of Information Technology in
Construction, 11, 89-102.
8.
Blaikie, N. (2003) Analyzing Quantitative Data: From Description to Explanation. London: Sage.
9.
Chau P. Y. and C. C. Jim, "Adoption of Electronic Data Interchange in Small and Medium-Sized Enter-
prises," Journal of Global Information Management, vol. 10, pp. 61-85, 2002.
10.
Chong, A. Y., Ooi, K., Lin, B., & Raman, M. (2009). Factors affecting the adoption level of E-Commerce: An empirical study. The Journal of Computer Inform-
ation Systems 50 (2), 13
11.
Cronbach, L. J. (1951). Coefficient Alpha and the Internal Structure of Tests: Psychometrika, Vol. 16, 297-334.
12.
Cooper, D., and P. Schindler. 2010. Business Research Methods. Tenth edition. Burr
Ridge, Illinois: Irwin/McGraw-Hill.
Globa
l Jo
urna
l of C
ompu
ter Sc
ienc
e an
d Te
chno
logy
V
olum
e XVII
Issu
e I Versio
n I
18
Year
2017
(
)
© 2017 Global Journals Inc. (US)1
H
13. Dawson, C., (2002), Practical Research Methods, New Delhi, UBS Publishers’ Distributors,
14. De Haes S., and W. Van Grembergen, "Information Technology Governance Best Practices in Belgian Organizations," in 39th Hawaii International Confe-rence on System Sciences, Kauai, 2006, p. 193.
15. Deng, L., & Tavares, N. J. (2013). From Moodle to Faceexperiences in online communities. Computers & Education, 68, 167–176.
16. Dublin, L. (2004). The nine myths of e-learning Implementation: Ensuring the real return on your e-learning investment. Industrial and Commercial Trai-ning, 36(7), 291-294.
17. Ellis, R. K. (2009). Field Guide to Learning Manage-ment Systems. ASTD Learning Circuits.
18. Eze, S. C., Awa, H. O., Okoye, J. C., Emecheta, B. C., & Anazodo, R. O. (2013). Determinant Factors of Information Communication Technology (ICT) Adop-tion by Government Owned Universities in Nigeria-A qualitative approach. Journal of Enterprise Infor-mation Management Vol. 26 No. 4, 427-443.
book: exploring students’ motivation and
19. Gill, M., ``E-learning technology and strategy for organisations''. The Business of E-learning: Bringing your Organization in the Knowledge E-conomy, University of Technology, Sydney, 2000.
20. Grover V., "An empirically derived model for the adoption of customer Based Inter Organizational
Society. Proceedings 32nd Hawaii International Conference on System Sciences 1-9
22. Henriksen, H.Z., & Mahnke, V. (2005). E-Procu-rement Adoption in the Danish Public Sector.Scandinavian Journal of Information Systems, 17(2), 85–106.
23. Henry, P. (2001). "E-Learning Technology, Content and Services," Education & Training, 43 (4/5), 249-255.
24. Islam, A. N. (2013). Investigating E-learning system usage outcomes in the university context. Compu-ters & Education 69, 387–399.
25. Janssen, C. (2015). Course Management System (CMS). Retrieved July 20, 2016, from Techno-pedia.com: http://www.techopedia.com/definition/6651/course-management-system-cms
26. Iacovou, A.L., Benbasat, I. and Dexter, A (1995). Electronic Data Interchange and Small Organiza-tions: Adoption and Impact of Technology, MIS. 465–485Leung, E. W. C. & Li, Q. (2006). "Distance Learning in Hong Kong," International Journal of Distance Education Technologies, 4 (3), 1-5.
28. Lin, H., & Lin, S. (2008). Determinants of e-business diffusion: A test of the technology diffusion perspe-ctive. Technovation, 28(3), 135-145.
29. Low, C., Chen, Y., & Wu, M. (2011). Understanding the determinants of cloud computing adoption. Industrial Management + Data Systems, 111(7), 1006-1023.
30. Koohang, A. and K. Harman, Open source: A meta-phor for e-learning. Informing Science: InternationalJournal of an Emerging Transdiscipline, 2005. 8: p. 75-86.
31. Kumar, R. (2005). Research Methodology-A Step-by-Step Guide for Beginners, (2nd Ed.), Singapore Pear-son Education
32. Manheim, Henry, (1977) Sociological Research: Philosophy & Methods, Dorsey Press, Illinois,1977.
33. Mindflash. (2015). Types of Learning Management Systems. Retrieved July 27, 2016, from Mindflash.com:https://www.mindflash.com/learning-management-systems/types-of-learningmanagement-systems
34. Myers, Michael D. "Qualitative Research in Informa-tion Systems," MIS Quarterly, Vol. 21, No. 2, 1997, pp. 241-242.
35. Meyer, T. (2011). Efficiency & Effectiveness, Bench-
High Impact Services with Pan-European Scope Interoperability Policy. Deutsche Bank Research.
marking e Procurement Services for Businesses
36. Motaghian, H., Hassanzadeh, A., & Moghadam, D. K. (2013). Factors affecting university instructors’ adoption of web-based learning systems: Case study of Iran. Computers & Education 61, 158–167.
Determinants of Electronic Learning Adoption in Higher Institutions of Learning in Uganda: A Learners’ Perspective
Heck, E.V. & Ribbers, P.M. (1999). The Adoption and Impact of EDI in Dutch SME’s. IEEE Computer
5. Baker J., "The technology-organization-environment framework," in Information Systems Theory, Y. K.
21.
27.

38.
Neuman, L. (2006). Social Research Methods:
Qualitative and quantitative approaches. 6th
Ed Pearson Intern ational, London.
39.
Nitithamyong, P. and Skibniewski, M.J. (2007), Key success/failure factors and their impacts on
system performance of web-based project management systems in construction, ITcon, Vol. 12, 39–59.
http://www.itcon.org/data/works/att/2007_3.content.06655.pdf [Date Retrieved 27/7/2016]
40.
Noh,
N. M., Isa, P. M., Samah, S. A., & Isa, M. A. (2012). Establishing an Organisational E learning
Culture to Motivate Lecturers to Engage in E-learning in UiTM. Procedia -
Social and Behavioral
Sciences 67, 436 –
443.
Globa
l Jo
urna
l of C
ompu
ter Sc
ienc
e an
d Te
chno
logy
V
olum
e XVII
Issu
e I Versio
n I
19
Year
2017
(
)H
Universities in Kenya. Journal of Computer Science and Information Technology Vol.2 (2), 131-148.
41. Nunnally J.C., Psychometric Theory, McGraw-Hill, New York, 1978.
42. Pallant, J. (2001) SPSS Survival Manual 5th Edition. Google Books
43. Premkumar G., and M. Roberts, "Adoption of new Information Technologies in Rural Small Busine-sses," The International Journal of Management Science, vol. 27, pp.467-484, 1999.
44. Preston, A. (2001) “Paper Free Tendering – A 21st Century Alternative”. Available at: ww. publicservice.co. uk Accessed 15 September 2008.
45. Ramanathan S, “Diffusion of e-Procurement in the Public Sector - Revisiting Centralization versus Decentralization Debates as a Twist in the Tale,” ECIS 2004 Proceedings, Paper 114: 2004.
46. Ramdani B, P. Kawalek, and O. Lorenzo, "Predicting SMEs' adoption of enterprise systems," Journal of Enterprise Information Management, vol. 22, pp. 10-24, 2009
47. Raymond, F., (2000). Delivering distance education through technology – a pioneer’s experience, Cam-pus-Wide Information Systems 17(1), 49-55
48. Raouf, J. B., Naser, I. S., & Jassim, B. K. (2012). Determinants of E-learning Implementation Success in the Iraqi MoHE. Eng. &Tech. Journal, Vol. 30, No.4, 659-671.
49. Roffe, I., (2002). E-learning– engagement, enhance-ment and execution, Quality Assurance in Education 10 (1), 40-50
50. Rogers E. M., Diffusion of innovations, 5th edition ed. New York: Free Press, 2003.
51. Roy, R., S. Potter, and K. Yarrow, Designing low carbon higher education systems: Environmental impacts of campus and distance learning systems. International journal of sustainability in higher edu-cation, 2008. 9(2): p. 116-130.
52. Oliveira, T., & Martins, M. (2010). Firms patterns of e-business adoption: Evidence for the European Union-27. Electronic Journal of Information Systems Evaluation, 13(1), 47-55.
53. Quayle, M. (2005). The (Real) Management Implications of E-procurement: The Importance of Involving People. The journal of general manage-ment , 31(1) 23-39.
54. Sekaran (1992). Research method for business. A skill building approach. New York: John Wiley & Sons.
55. Stevens, J. P. (2012). Applied multivariate statistics for the social sciences. London, New York: Rout-ledge.
56. Tabachnick, B. G., & Fidell, L. S. (2001). Using multivariate statistics. MA: Allyn and Bacon.
57. Technopedia. (2015). Course Management System (CMS). Retrieved June 18, 2016, from Technopedia.
com:http://www.techopedia.com/definition/6651/ course -management-system-cms
58. Tornatzky L. G. and M. Fleischer, Process of techno-logic alinnovation. Massachusetts/ Toronto Lexing-ton Books, 1990
59. Tornatzky L. G., and K. J. Klein, "Innovation Charac-teristics and Innovation Adoption Implementation: a meta-analysis of findings," IEEE Transactions on Engineering Management, vol. 29, pp. 28-45, 1982.
60. Thong, J.Y.L.; Yap, C.S.; Raman, K.S. Environments for information systems implementation in small businesses. J. Org. Comput. Electron.Commer. 1997, 7, 253–278.
61. Thong, J.Y.L. Resource constraints and information systems implementation in Singaporean small businesses. Omega 2001, 29
62. Thong, J.Y.L. An integrated model of information systems adoption in small businesses. J.] Manage-ment Information Systems 1999, 15, 187–214.
63. Van Grembergen and S. De Haes (2008). Imple-menting Information Technology Governance:Models, Practices and Cases. Hershey: IGI Global, 2008.
64. UN (1999), 'Procurement Reforms: Resolution / Adopted by the General Assembly (A/RES/54/866)',
65. Zhu K. , K. L. Kraemer, and S. Xu, "A Cross-country Study of Electronic Business Adoption Using the Technology-Organization-Environment framework," in 23rd International Conference on Information Systems, Barcelona, 2002, pp.337-348
66. Zhu, K., Kraemer, K. L., & Xu, S. (2006). The pro-cess of innovation assimilation by firms in different countries: A technology diffusion perspective on e-business. Management Science, 52(10), 1557-1576.
67. Zhu K., S. Xu, and D. Dedrick, "Assessing Drivers of E-busines Value: Results of a Cross Country Study," in 24th International Conference on Information Systems, Seattle, 2003
Determinants of Electronic Learning Adoption in Higher Institutions of Learning in Uganda: A Learners’ Perspective
37. Namisiko, P., Munialo, C., & Nyongesa, S. (2014). Towards an Optimization Framework for E-learning in Developing Countries: A Case of Private
© 2017 Global Journals Inc. (US)

Thousand Oaks, CA: Sage Publications.
70.
Yining Chen, Harold T. Little Jr., Mark T. Ross and Qin Zhao (2012). Factors Motivating the
Adoption of e-Learning Technologies, Journal of e-Learning & Higher Education Vol. 2012 (2012),
IBIMA Publishing
71.
Zikmund, William, Business Research Methods, The Dryden Press, Chicago, 1988
Globa
l Jo
urna
l of C
ompu
ter Sc
ienc
e an
d Te
chno
logy
V
olum
e XVII
Issu
e I Versio
n I
20
Year
2017
(
)
© 2017 Global Journals Inc. (US)1
H
.Stake, R. (1995). The art of case research,
Determinants of Electronic Learning Adoption in Higher Institutions of Learning in Uganda: A Learners’ Perspective
68. Yin, R. Case Study research design and methods, third edition. Sage Publications, 2003.
69. Yin R. K., Case Study Research: Design and Methods, Sage Publications, Inc, 4-th edition, 2009
Top Related