


Languages
Pages
Legal


Contact: Email: [email protected] Press office: 020 7783 8300 Public enquiries: 0370 000 2288
Destinations of key stage 4 and key stage 5
students, England, 2016/17
16 October 2018
Percentage of pupils in sustained destinations after key stage 4 remains unchanged from 2015/16
Overall, 94% of pupils were in sustained
education, employment or apprenticeships in
the year after key stage 4, unchanged from
2015/16.
86% of pupils were in sustained education, up
4 percentage points since 2010/11 and 1
percentage point down from 2015/16.
Percentage of students in sustained education and employment after key stage 5 remains high
Overall, 89% of students were in sustained
education, employment or apprenticeship
destinations after key stage 5, a 1 percentage
point decrease from 2015/16.
61% of students were in sustained education
destinations, a 1 percentage point decrease
from 2015/16 that has led to the small
decrease in overall education, employment
and apprenticeship destinations.
Disadvantaged students are less likely to be employed or in higher education after key stage 5
Overall, 85% of disadvantaged students were
in any sustained education, employment or
apprenticeship destination after key stage 5, 5
percentage points lower than all other students
(90%) and a 1 percentage point decrease
compared to 2015/16.
Disadvantaged students (46%) are less likely
to progress into sustained higher education
compared to all other students (51%) and
show a 1 percentage point decrease
compared to 2015/16 (47%).
Contact: Email: [email protected] Press office: 020 7783 8300 Public enquiries: 0370 000 2288
Contents
Contents........................................................................................................................................... 2
What are destination measures? ........................................................................................ 5
What is a ‘sustained’ destination? ............................................................................................. 5
What has changed? ................................................................................................................... 5
Sustained destinations after KS4 ........................................................................................ 6
Changes over time..................................................................................................................... 7
Impact of apprenticeship changes on time series ...................................................................... 8
Pupil destinations after KS4 by pupil characteristics ......................................................... 10
Gender ..................................................................................................................................... 10
Special educational needs (SEN) ............................................................................................ 10
................................................................................................................................................ 10
Disadvantage and free school meals ....................................................................................... 10
Ethnicity ................................................................................................................................... 11
Apprenticeships ....................................................................................................................... 12
Destinations after key stage 4 by prior attainment ............................................................ 13
Achievement at key stage 4 (age 16) ...................................................................................... 13
Achievement at key stage 2 (age 11) ...................................................................................... 14
Destinations after key stage 4 for state-funded mainstream schools by region ................ 14
Destinations after KS4 for state-funded mainstream institutions by type .......................... 15
Destinations for state-funded mainstream institutions by funding type .................................... 15
Apprenticeships ....................................................................................................................... 16
Disadvantage and its interactions with other factors ......................................................... 17
Disadvantage and gender ........................................................................................................ 17
Disadvantage and ethnicity ...................................................................................................... 17
Disadvantage and prior attainment .......................................................................................... 18
Destinations for other school types ................................................................................... 19
Special schools ........................................................................................................................ 19
Alternative provision (AP) ........................................................................................................ 19
Sustained destinations after KS5 ...................................................................................... 21
Change over time .................................................................................................................... 22
Education participation over time ............................................................................................. 23
Apprenticeship participation over time ..................................................................................... 23
Impact of apprenticeship changes on time series .................................................................... 24
Contact: Email: [email protected] Press office: 020 7783 8300 Public enquiries: 0370 000 2288
Student destinations after KS5 by student characteristics ................................................ 25
Gender ..................................................................................................................................... 25
Disadvantage and free school meals ....................................................................................... 25
Ethnicity ................................................................................................................................... 26
Apprenticeships ....................................................................................................................... 27
Student destinations after KS5 by prior attainment ........................................................... 28
Achievement at key stage 5 (16 to 18 study) ........................................................................... 28
Achievement at key stage 4 (age 16) ...................................................................................... 29
Achievement at key stage 2 (age 11) ...................................................................................... 29
Destinations after key stage 5 by region ........................................................................... 30
Student destinations after KS5 by institution type ............................................................. 31
Destinations after key stage 5 for state-funded mainstream schools and colleges .................. 31
Destinations for state-funded mainstream schools and colleges by type ................................ 31
Apprenticeships ....................................................................................................................... 33
Disadvantage and interactions with other characteristics ................................................. 34
Disadvantage and gender ........................................................................................................ 34
Disadvantage and ethnicity ...................................................................................................... 34
Disadvantage and prior attainment .......................................................................................... 35
Destinations after key stage 5 for special schools ............................................................ 36
Future developments ........................................................................................................ 37
Feedback .......................................................................................................................... 37
Accompanying tables ........................................................................................................ 38
Key stage 4 tables ................................................................................................................... 38
Key stage 5 tables ................................................................................................................... 39
When reviewing the tables, please note that: .......................................................................... 40
Further information ........................................................................................................... 41
Official Statistics ............................................................................................................... 42
Technical information ........................................................................................................ 42
Get in touch ...................................................................................................................... 43
Contact: Email: [email protected] Press office: 020 7783 8300 Public enquiries: 0370 000 2288
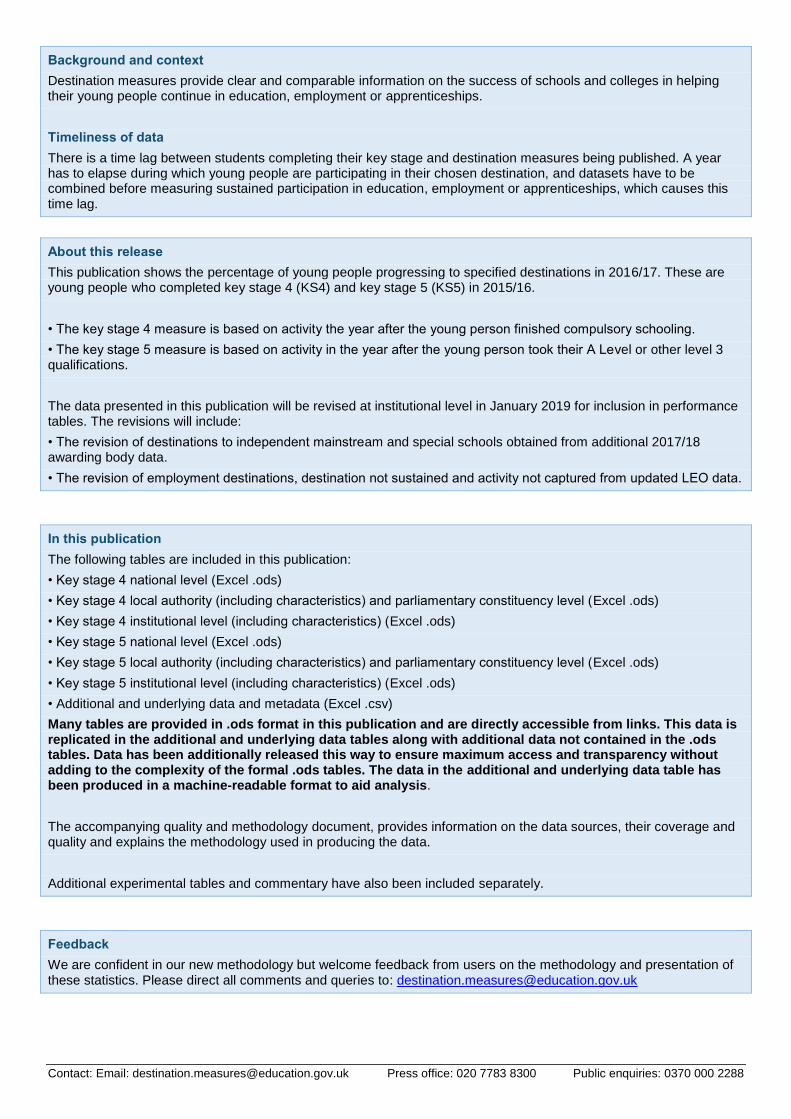
Background and context
Destination measures provide clear and comparable information on the success of schools and colleges in helping their young people continue in education, employment or apprenticeships.
Timeliness of data
There is a time lag between students completing their key stage and destination measures being published. A year has to elapse during which young people are participating in their chosen destination, and datasets have to be combined before measuring sustained participation in education, employment or apprenticeships, which causes this time lag.
About this release
This publication shows the percentage of young people progressing to specified destinations in 2016/17. These are young people who completed key stage 4 (KS4) and key stage 5 (KS5) in 2015/16.
• The key stage 4 measure is based on activity the year after the young person finished compulsory schooling.
• The key stage 5 measure is based on activity in the year after the young person took their A Level or other level 3 qualifications.
The data presented in this publication will be revised at institutional level in January 2019 for inclusion in performance tables. The revisions will include:
• The revision of destinations to independent mainstream and special schools obtained from additional 2017/18 awarding body data.
• The revision of employment destinations, destination not sustained and activity not captured from updated LEO data.
In this publication
The following tables are included in this publication:
• Key stage 4 national level (Excel .ods)
• Key stage 4 local authority (including characteristics) and parliamentary constituency level (Excel .ods)
• Key stage 4 institutional level (including characteristics) (Excel .ods)
• Key stage 5 national level (Excel .ods)
• Key stage 5 local authority (including characteristics) and parliamentary constituency level (Excel .ods)
• Key stage 5 institutional level (including characteristics) (Excel .ods)
• Additional and underlying data and metadata (Excel .csv)
Many tables are provided in .ods format in this publication and are directly accessible from links. This data is replicated in the additional and underlying data tables along with additional data not contained in the .ods tables. Data has been additionally released this way to ensure maximum access and transparency without adding to the complexity of the formal .ods tables. The data in the additional and underlying data table has been produced in a machine-readable format to aid analysis.
The accompanying quality and methodology document, provides information on the data sources, their coverage and quality and explains the methodology used in producing the data.
Additional experimental tables and commentary have also been included separately.
Feedback
We are confident in our new methodology but welcome feedback from users on the methodology and presentation of these statistics. Please direct all comments and queries to: [email protected]
Page 5 of 44
What are destination measures?
Destination measures show the percentage of pupils or students going to or remaining in an education
and/or employment destination in the academic year after completing their key stage 4 or key stage 5
studies. The most recent data reports on students who completed the key stage in the 2015/16 academic
year and identifies their education and/or employment destinations the following year.
After completing key stage 4 (finishing year 11, usually aged 16) 94% of pupils now stay in education,
employment or apprenticeships over the period we measure, with 86% staying in an education setting.
After completing key stage 5 (taking A levels or other level 3 qualifications, usually aged 18) 89% of
students now stay in education, employment and apprenticeships over the period, with 61% staying in
education.
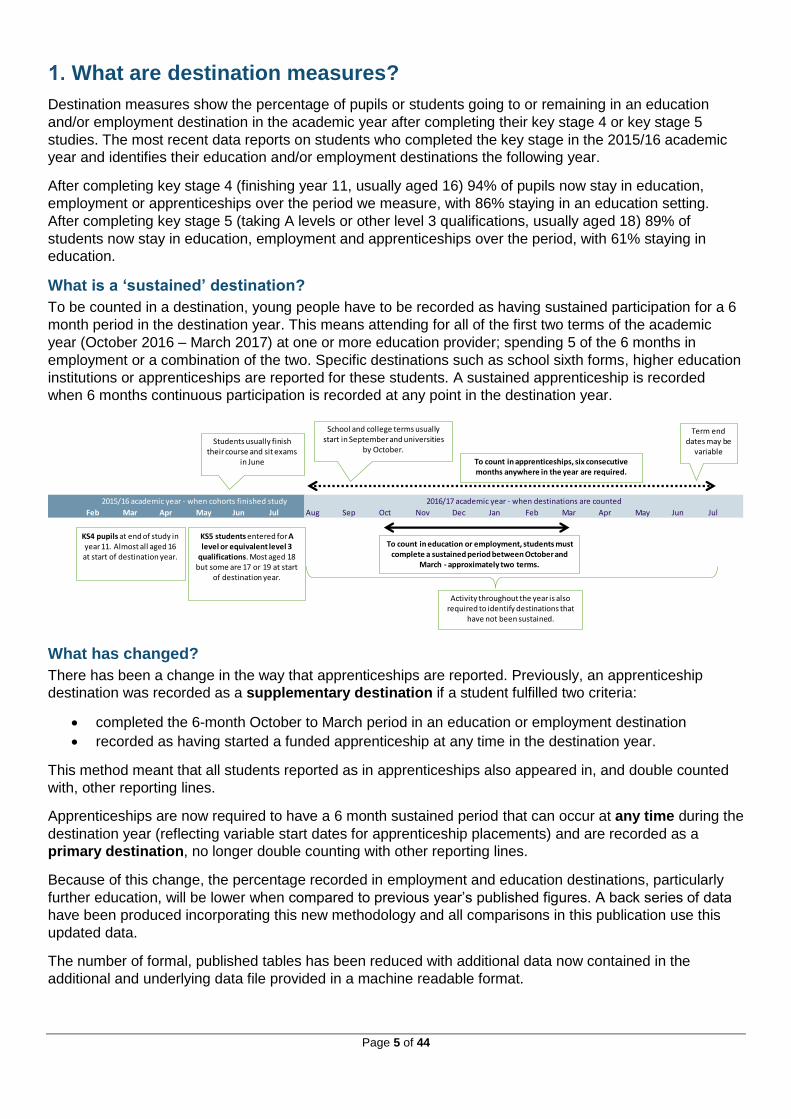
What is a ‘sustained’ destination?
To be counted in a destination, young people have to be recorded as having sustained participation for a 6
month period in the destination year. This means attending for all of the first two terms of the academic
year (October 2016 – March 2017) at one or more education provider; spending 5 of the 6 months in
employment or a combination of the two. Specific destinations such as school sixth forms, higher education
institutions or apprenticeships are reported for these students. A sustained apprenticeship is recorded
when 6 months continuous participation is recorded at any point in the destination year.
What has changed?
There has been a change in the way that apprenticeships are reported. Previously, an apprenticeship
destination was recorded as a supplementary destination if a student fulfilled two criteria:
completed the 6-month October to March period in an education or employment destination
recorded as having started a funded apprenticeship at any time in the destination year.
This method meant that all students reported as in apprenticeships also appeared in, and double counted
with, other reporting lines.
Apprenticeships are now required to have a 6 month sustained period that can occur at any time during the
destination year (reflecting variable start dates for apprenticeship placements) and are recorded as a
primary destination, no longer double counting with other reporting lines.
Because of this change, the percentage recorded in employment and education destinations, particularly
further education, will be lower when compared to previous year’s published figures. A back series of data
have been produced incorporating this new methodology and all comparisons in this publication use this
updated data.
The number of formal, published tables has been reduced with additional data now contained in the
additional and underlying data file provided in a machine readable format.
Feb Mar Apr May Jun Jul Aug Sep Oct Nov Dec Jan Feb Mar Apr May Jun Jul
2015/16 academic year - when cohorts finished study 2016/17 academic year - when destinations are counted
KS5 students entered for A level or equivalent level 3
qualifications. Most aged 18 but some are 17 or 19 at start
of destination year.
Students usually finishtheir course and sit exams
in June To count in apprenticeships, six consecutive months anywhere in the year are required.
School and college terms usually start in September and universities
by October.
Term end dates may be
variable
KS4 pupils at end of study in year 11. Almost all aged 16 at start of destination year.
Activity throughout the year is alsorequired to identify destinations that
have not been sustained.
To count in education or employment, students must complete a sustained period between October and
March - approximately two terms.
Page 6 of 44
Sustained destinations after KS4
Key stage 4 destinations follow pupils who were at the end of key stage 4 study in 2015/16, i.e. they had
finished compulsory schooling in year 11 and had likely taken GCSE and equivalent qualifications.
In the destination year, 2016/17, these students are aged 16 and 17 and entering year 12, their first year of
sixth-form or post-16 education or training. The Raising the Participation Age policy means young people of
this age are supposed to be participating in education or training alongside employment.
Raising the Participation Age
The Department’s Participation in Education, Training and Employment measures are used to monitor progress in raising participation and reducing the number of young people not in education, employment or training (NEET). 2013/14 destinations reported on the first cohort of young people required to remain in education or training until 18.
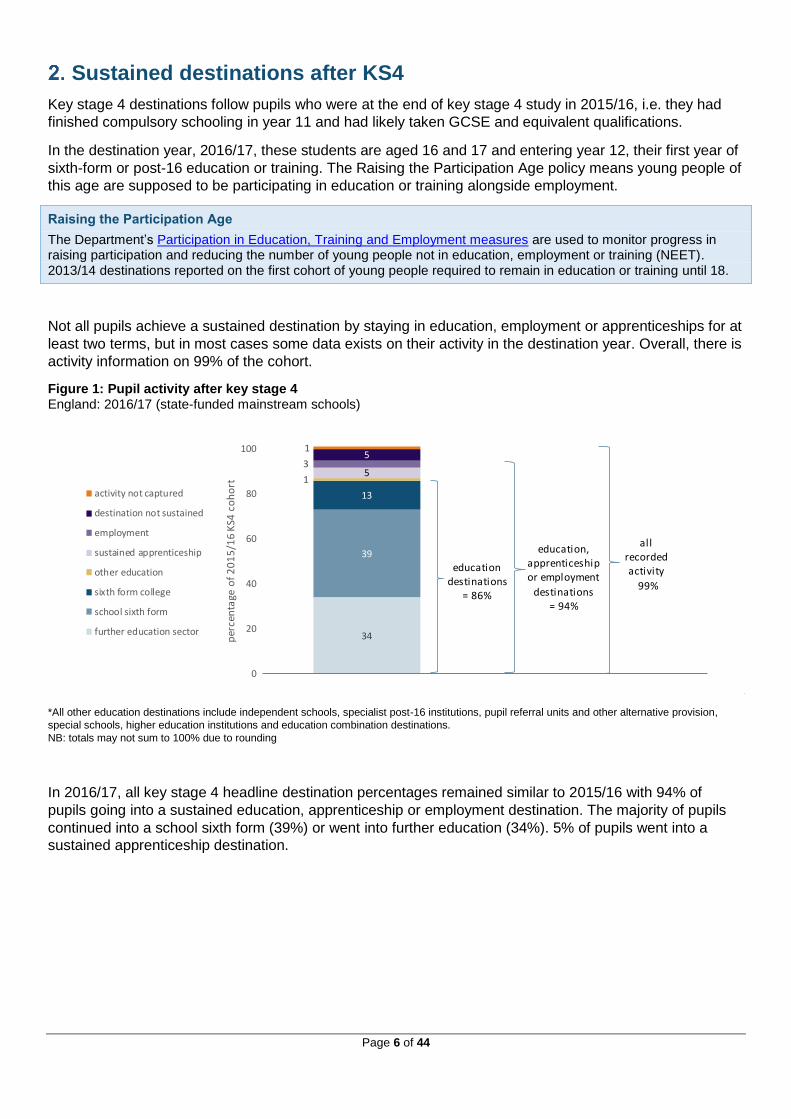
Not all pupils achieve a sustained destination by staying in education, employment or apprenticeships for at
least two terms, but in most cases some data exists on their activity in the destination year. Overall, there is
activity information on 99% of the cohort.
Figure 1: Pupil activity after key stage 4 England: 2016/17 (state-funded mainstream schools)
*All other education destinations include independent schools, specialist post-16 institutions, pupil referral units and other alternative provision,
special schools, higher education institutions and education combination destinations.
NB: totals may not sum to 100% due to rounding
In 2016/17, all key stage 4 headline destination percentages remained similar to 2015/16 with 94% of
pupils going into a sustained education, apprenticeship or employment destination. The majority of pupils
continued into a school sixth form (39%) or went into further education (34%). 5% of pupils went into a
sustained apprenticeship destination.
34
39
13
15
35
1
0
20
40
60
80
100
per
cen
tage
of
20
15
/16
KS4
co
ho
rt
activity not captured
destination not sustained
employment
sustained apprenticeship
other education
sixth form college
school sixth form
further education sector
education destinations
= 86%
education, apprenticeship or employment
destinations= 94%
all recorded activity
99%
Page 7 of 44
Changes over time
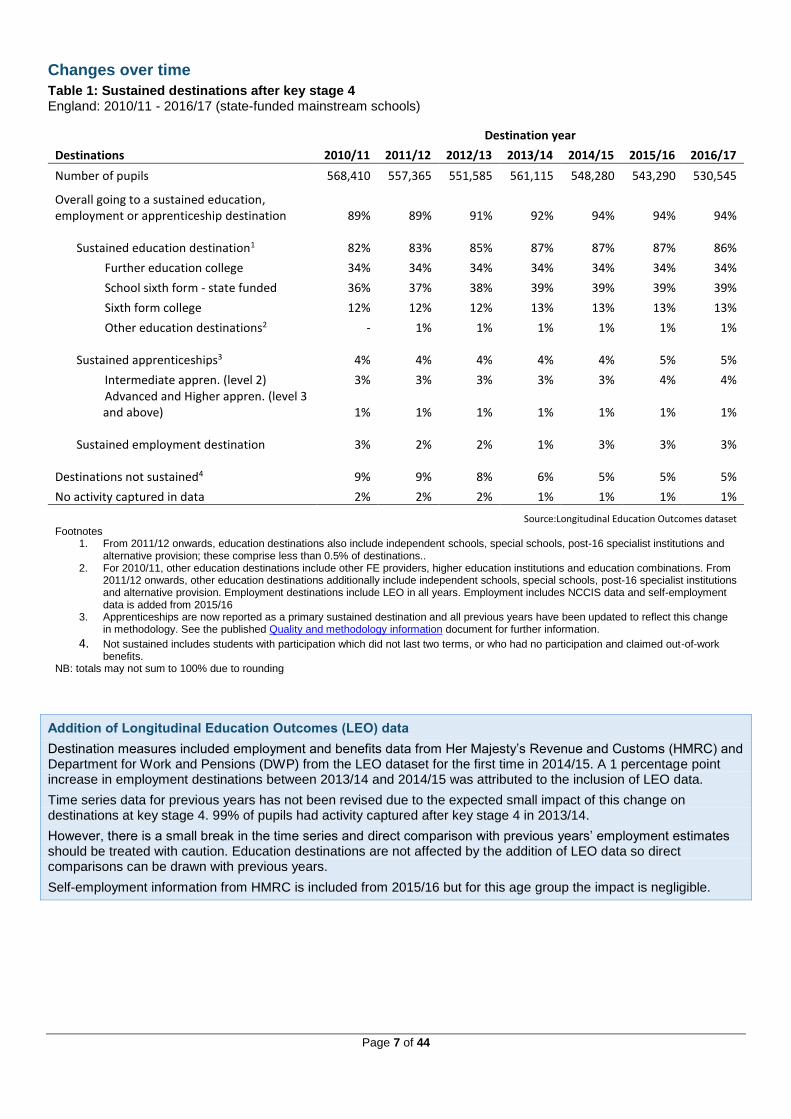
Table 1: Sustained destinations after key stage 4 England: 2010/11 - 2016/17 (state-funded mainstream schools)
Addition of Longitudinal Education Outcomes (LEO) data
Destination measures included employment and benefits data from Her Majesty’s Revenue and Customs (HMRC) and Department for Work and Pensions (DWP) from the LEO dataset for the first time in 2014/15. A 1 percentage point increase in employment destinations between 2013/14 and 2014/15 was attributed to the inclusion of LEO data.
Time series data for previous years has not been revised due to the expected small impact of this change on destinations at key stage 4. 99% of pupils had activity captured after key stage 4 in 2013/14.
However, there is a small break in the time series and direct comparison with previous years’ employment estimates should be treated with caution. Education destinations are not affected by the addition of LEO data so direct comparisons can be drawn with previous years.
Self-employment information from HMRC is included from 2015/16 but for this age group the impact is negligible.
Destination year
Destinations 2010/11 2011/12 2012/13 2013/14 2014/15 2015/16 2016/17
Number of pupils 568,410 557,365 551,585 561,115 548,280 543,290 530,545
Overall going to a sustained education, employment or apprenticeship destination 89% 89% 91% 92% 94% 94% 94%
Sustained education destination1 82% 83% 85% 87% 87% 87% 86%
Further education college 34% 34% 34% 34% 34% 34% 34%
School sixth form - state funded 36% 37% 38% 39% 39% 39% 39%
Sixth form college 12% 12% 12% 13% 13% 13% 13%
Other education destinations2 - 1% 1% 1% 1% 1% 1%
Sustained apprenticeships3 4% 4% 4% 4% 4% 5% 5%
Intermediate appren. (level 2) 3% 3% 3% 3% 3% 4% 4% Advanced and Higher appren. (level 3
and above) 1% 1% 1% 1% 1% 1% 1%
Sustained employment destination 3% 2% 2% 1% 3% 3% 3%
Destinations not sustained4 9% 9% 8% 6% 5% 5% 5%
No activity captured in data 2% 2% 2% 1% 1% 1% 1%
Source:Longitudinal Education Outcomes dataset Footnotes
1. From 2011/12 onwards, education destinations also include independent schools, special schools, post-16 specialist institutions and alternative provision; these comprise less than 0.5% of destinations..
2. For 2010/11, other education destinations include other FE providers, higher education institutions and education combinations. From 2011/12 onwards, other education destinations additionally include independent schools, special schools, post-16 specialist institutions and alternative provision. Employment destinations include LEO in all years. Employment includes NCCIS data and self-employment data is added from 2015/16
3. Apprenticeships are now reported as a primary sustained destination and all previous years have been updated to reflect this change in methodology. See the published Quality and methodology information document for further information.
4. Not sustained includes students with participation which did not last two terms, or who had no participation and claimed out-of-work benefits.
NB: totals may not sum to 100% due to rounding
Page 8 of 44
Sustained education destinations have increased by 4 percentage points since 2010/11 (up from 82% to
86%). The Raising the Participation Age (RPA) policy was introduced in 2013/14 and education
destinations saw a 2 percentage point increase in 2012/13 (up to 85%) as schools prepared for its
introduction and another 2 percentage point increase in 2013/14 (up to 87%) on introduction. The impact of
RPA is likely to be minimal in 2016/17 and this is highlighted by the education destinations percentage
reducing slightly compared to the previous three years (down 1 percentage point from 87% to 86%).
Many of the pupils not counted in this category will have some participation in education in the year after
finishing key stage 4, but which is not sustained throughout the required 6 month period.
Since LEO employment data was added in 2014/15, employment destinations have been constant at 3%.
From 2010/11 to 2014/15, 4% of pupils started and stayed in an apprenticeship for six months in the year
directly after finishing year 11. This increased to 5% in each of the last two years. The majority of young
people entering apprenticeships at this age begin intermediate (level 2) apprenticeships, and the small
increase in the latest two years has been driven by an increase in apprenticeships at this level. In each
year since 2011, around 1% of pupils have undertaken an advanced (level 3) apprenticeship.
Impact of apprenticeship changes on time series
Apprenticeships
In previous years, apprenticeships were counted as a supplementary destination and double counted with other primary destinations, for example, a student would be shown as a FE destination and as an apprenticeship simultaneously.
Apprenticeships are now counted as a sustained primary destination in their own right and no longer double count with other destinations. To allow for the variation in starting points for apprenticeships, the sustainability period is counted as any continuous 6 month period within the destination year.
The introduction of this methodology means that overall education destination proportions will show a small drop compared to previous published data; the individual education destinations are similarly affected especially FE destinations.
The new methodology has been applied to previous years to create a revised back series and all comparisons use this revised data.
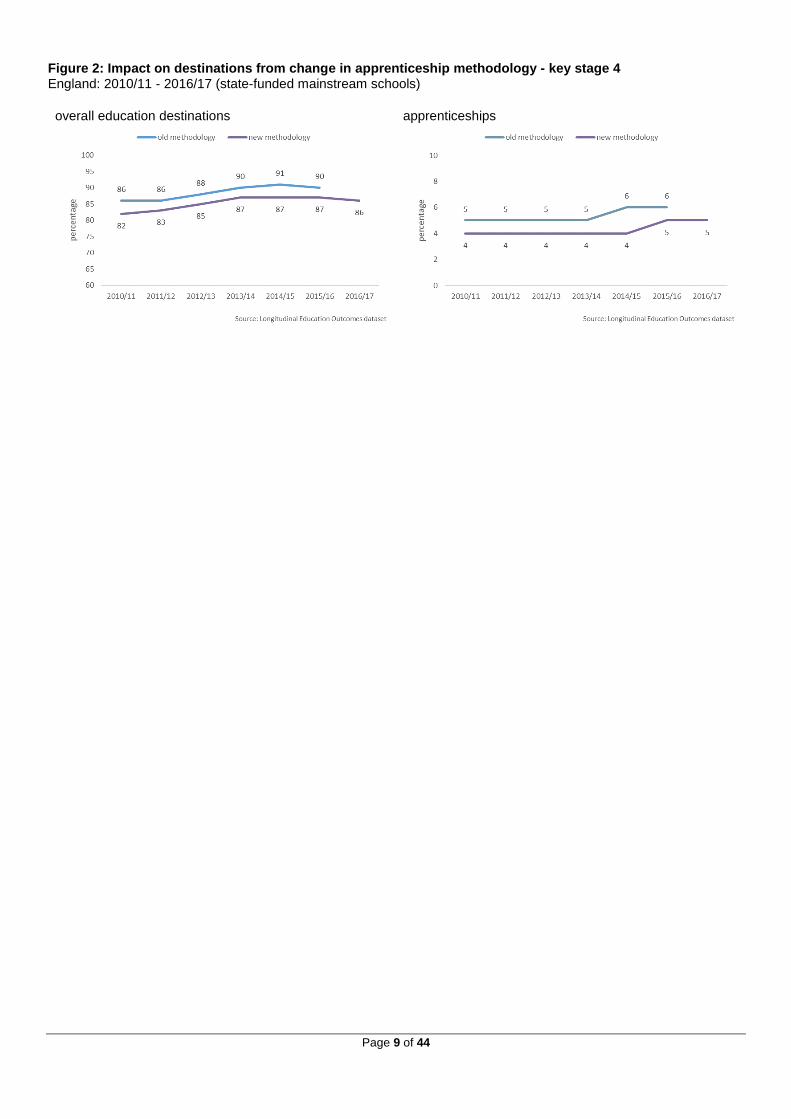
The time series has been revised for all years to count apprenticeships that were sustained for at least six
months in the year after young people finished year 11. The headline sustained destinations are
unchanged but the revision of the time series affects the other destination categories shown compared to
what we previously reported, as double counting between apprenticeships and other destinations has been
removed.
This has had a broadly consistent impact on each year from 2010/11 to 2015/16 with the proportion
reported in education, and further education, being 3 or 4 percentage points lower each now those
undertaking apprenticeships have been excluded. A smaller number of apprentices were previously
reported in sustained employment, and so employment has reduced by 0 or 1 percentage points each year,
now those undertaking apprenticeships have been excluded.
A slightly lower proportion are reported as participating in apprenticeships (generally 1 percentage point
lower) because young people who did not stay in the apprenticeship for 6 months, or who did not start their
apprenticeship until near the end of the year, are no longer included. These cases continue to be reported
in the destination that they sustained during the first two terms. Adding together the separate education and
apprenticeships categories now gives the same (or slightly higher) percentage of pupils as were previously
counted in education.
Page 9 of 44
Figure 2: Impact on destinations from change in apprenticeship methodology - key stage 4 England: 2010/11 - 2016/17 (state-funded mainstream schools)
overall education destinations apprenticeships
Page 10 of 44
Pupil destinations after KS4 by pupil characteristics
Gender
In all state-funded mainstream schools, 94% of females had a sustained education, apprenticeship or
employment destination compared to 93% of males. School sixth forms were the most common
destinations for females (41%), whereas males were equally likely to attend school sixth forms or further
education colleges (36% each).
Females and males were equally likely to go into sustained employment (3%). Males were more likely to
start and sustain an apprenticeship over six months in the year (6%) compared to females (4%).
Special educational needs (SEN)
Inclusion of special schools
The narrative in this section on SEN students covers state-funded mainstream schools and additionally maintained and non-maintained special schools to ensure fuller coverage of SEN pupils.
Pupils with special education needs were less likely to have any sustained destination than those with no
identified SEN. Out of SEN pupils, in all state funded schools, 89% went to education, employment or
apprenticeships compared to 95% of those with no identified SEN.
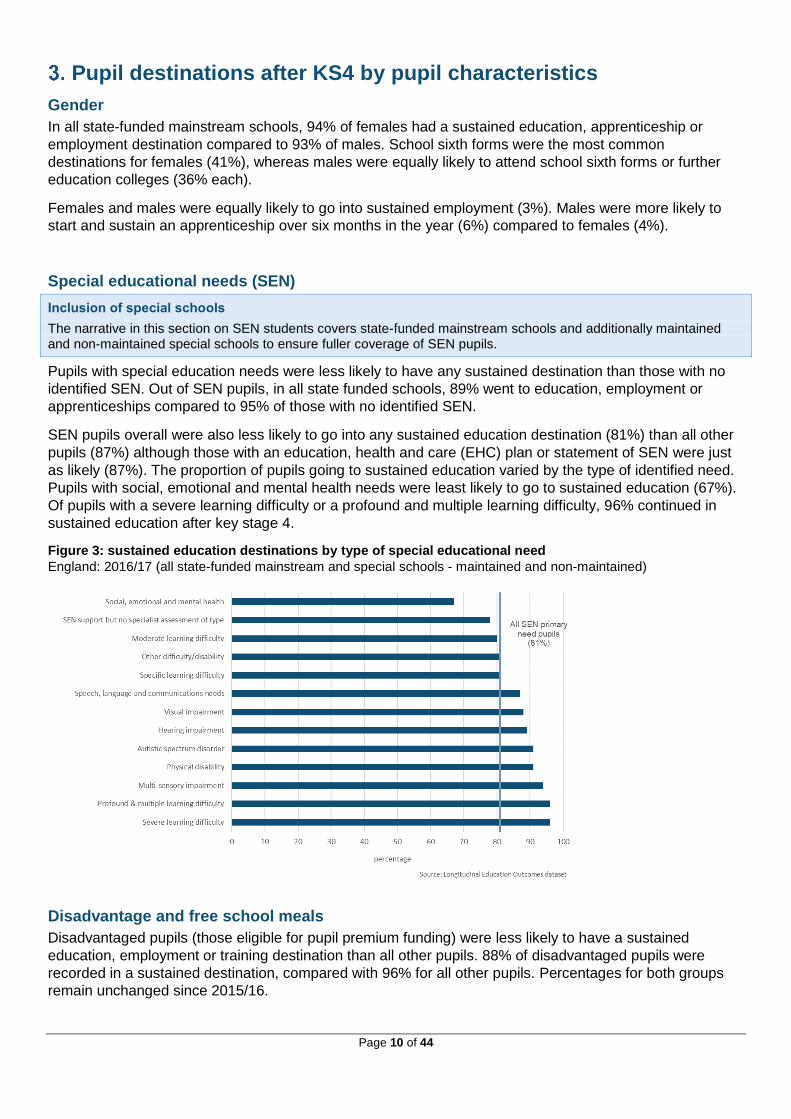
SEN pupils overall were also less likely to go into any sustained education destination (81%) than all other
pupils (87%) although those with an education, health and care (EHC) plan or statement of SEN were just
as likely (87%). The proportion of pupils going to sustained education varied by the type of identified need.
Pupils with social, emotional and mental health needs were least likely to go to sustained education (67%).
Of pupils with a severe learning difficulty or a profound and multiple learning difficulty, 96% continued in
sustained education after key stage 4.
Figure 3: sustained education destinations by type of special educational need
England: 2016/17 (all state-funded mainstream and special schools - maintained and non-maintained)
Disadvantage and free school meals
Disadvantaged pupils (those eligible for pupil premium funding) were less likely to have a sustained
education, employment or training destination than all other pupils. 88% of disadvantaged pupils were
recorded in a sustained destination, compared with 96% for all other pupils. Percentages for both groups
remain unchanged since 2015/16.
Page 11 of 44
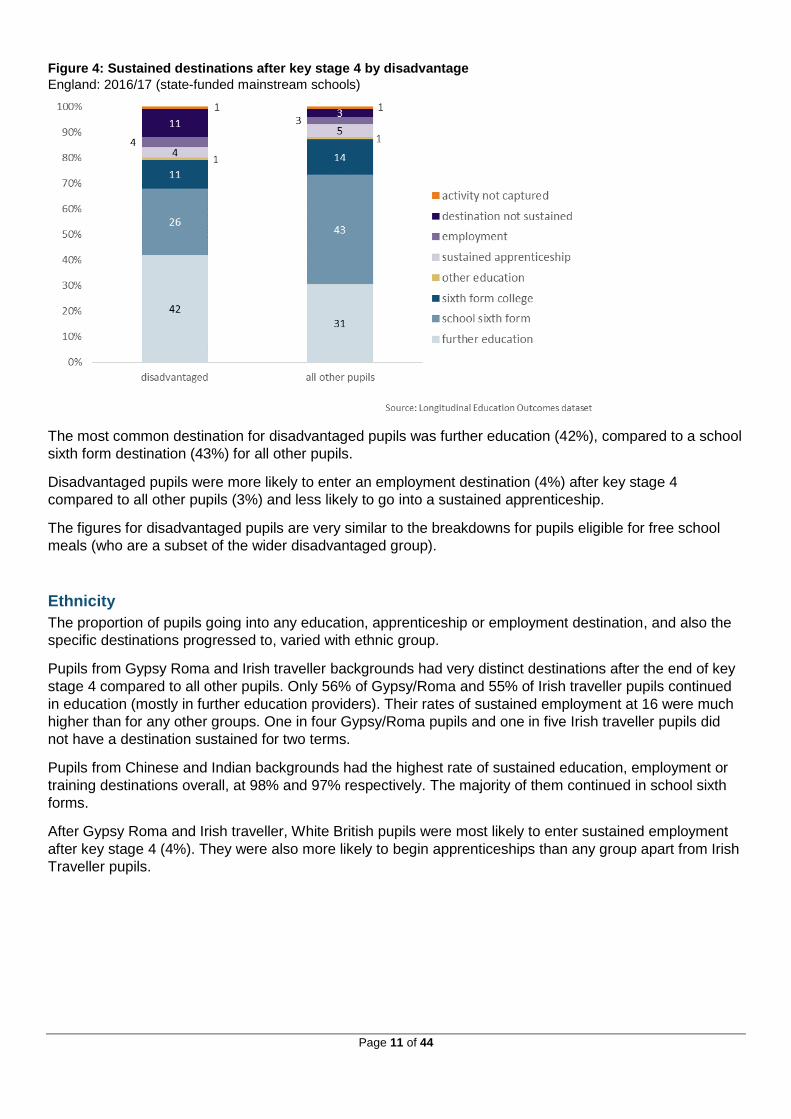
Figure 4: Sustained destinations after key stage 4 by disadvantage
England: 2016/17 (state-funded mainstream schools)
The most common destination for disadvantaged pupils was further education (42%), compared to a school
sixth form destination (43%) for all other pupils.
Disadvantaged pupils were more likely to enter an employment destination (4%) after key stage 4
compared to all other pupils (3%) and less likely to go into a sustained apprenticeship.
The figures for disadvantaged pupils are very similar to the breakdowns for pupils eligible for free school
meals (who are a subset of the wider disadvantaged group).
Ethnicity
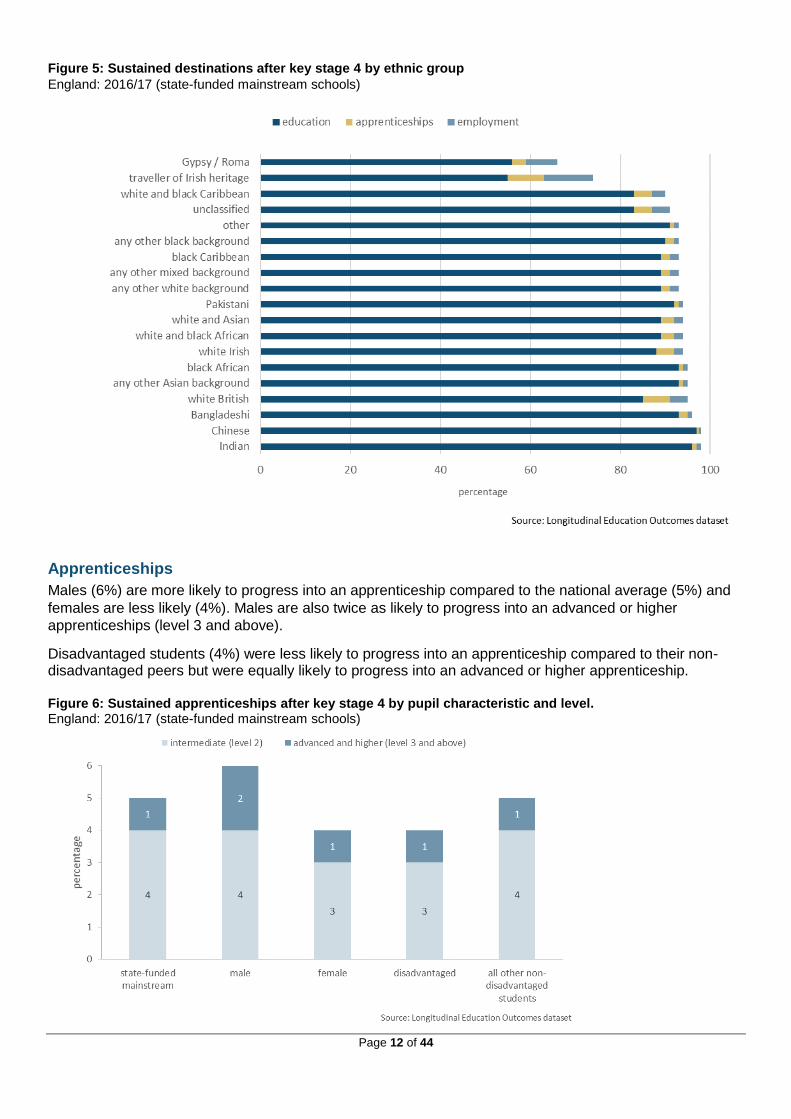
The proportion of pupils going into any education, apprenticeship or employment destination, and also the
specific destinations progressed to, varied with ethnic group.
Pupils from Gypsy Roma and Irish traveller backgrounds had very distinct destinations after the end of key
stage 4 compared to all other pupils. Only 56% of Gypsy/Roma and 55% of Irish traveller pupils continued
in education (mostly in further education providers). Their rates of sustained employment at 16 were much
higher than for any other groups. One in four Gypsy/Roma pupils and one in five Irish traveller pupils did
not have a destination sustained for two terms.
Pupils from Chinese and Indian backgrounds had the highest rate of sustained education, employment or
training destinations overall, at 98% and 97% respectively. The majority of them continued in school sixth
forms.
After Gypsy Roma and Irish traveller, White British pupils were most likely to enter sustained employment
after key stage 4 (4%). They were also more likely to begin apprenticeships than any group apart from Irish
Traveller pupils.
Page 12 of 44
Figure 5: Sustained destinations after key stage 4 by ethnic group
England: 2016/17 (state-funded mainstream schools)
Apprenticeships
Males (6%) are more likely to progress into an apprenticeship compared to the national average (5%) and
females are less likely (4%). Males are also twice as likely to progress into an advanced or higher
apprenticeships (level 3 and above).
Disadvantaged students (4%) were less likely to progress into an apprenticeship compared to their non-disadvantaged peers but were equally likely to progress into an advanced or higher apprenticeship. Figure 6: Sustained apprenticeships after key stage 4 by pupil characteristic and level. England: 2016/17 (state-funded mainstream schools)
Page 13 of 44
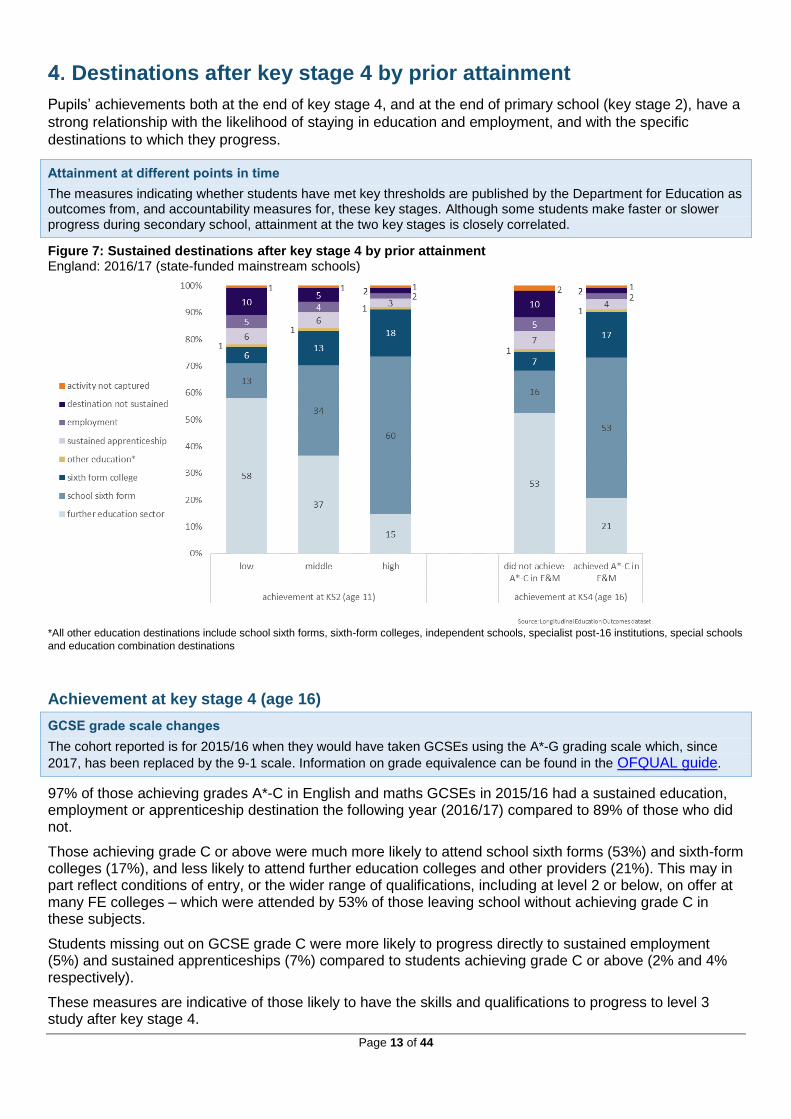
Destinations after key stage 4 by prior attainment
Pupils’ achievements both at the end of key stage 4, and at the end of primary school (key stage 2), have a
strong relationship with the likelihood of staying in education and employment, and with the specific
destinations to which they progress.
Attainment at different points in time
The measures indicating whether students have met key thresholds are published by the Department for Education as outcomes from, and accountability measures for, these key stages. Although some students make faster or slower progress during secondary school, attainment at the two key stages is closely correlated.
Figure 7: Sustained destinations after key stage 4 by prior attainment England: 2016/17 (state-funded mainstream schools)
*All other education destinations include school sixth forms, sixth-form colleges, independent schools, specialist post-16 institutions, special schools
and education combination destinations
Achievement at key stage 4 (age 16)
GCSE grade scale changes
The cohort reported is for 2015/16 when they would have taken GCSEs using the A*-G grading scale which, since
2017, has been replaced by the 9-1 scale. Information on grade equivalence can be found in the OFQUAL guide.
97% of those achieving grades A*-C in English and maths GCSEs in 2015/16 had a sustained education, employment or apprenticeship destination the following year (2016/17) compared to 89% of those who did not.
Those achieving grade C or above were much more likely to attend school sixth forms (53%) and sixth-form colleges (17%), and less likely to attend further education colleges and other providers (21%). This may in part reflect conditions of entry, or the wider range of qualifications, including at level 2 or below, on offer at many FE colleges – which were attended by 53% of those leaving school without achieving grade C in these subjects.
Students missing out on GCSE grade C were more likely to progress directly to sustained employment (5%) and sustained apprenticeships (7%) compared to students achieving grade C or above (2% and 4% respectively).
These measures are indicative of those likely to have the skills and qualifications to progress to level 3 study after key stage 4.
Page 14 of 44
Achievement at key stage 2 (age 11)
Prior attainment at the end of primary school (key stage 2) showed a similar pattern to attainment at key stage 4. 97% of those with high key stage 2 prior attainment in reading, writing and maths at age 11 had a sustained education, employment or apprenticeship destination after key stage 4, compared to 94% of those in the middle prior attainment band, and 89% of those with low key stage 2 prior attainment.
Those with higher prior attainment were much more likely to attend school sixth forms and sixth form
colleges at 16, and less likely to attend further education colleges and other providers. One in ten low
attainers at the end of primary school did not stay in either education, an apprenticeships or employment
for at least two terms post-16, compared to just 2% of high attainers.
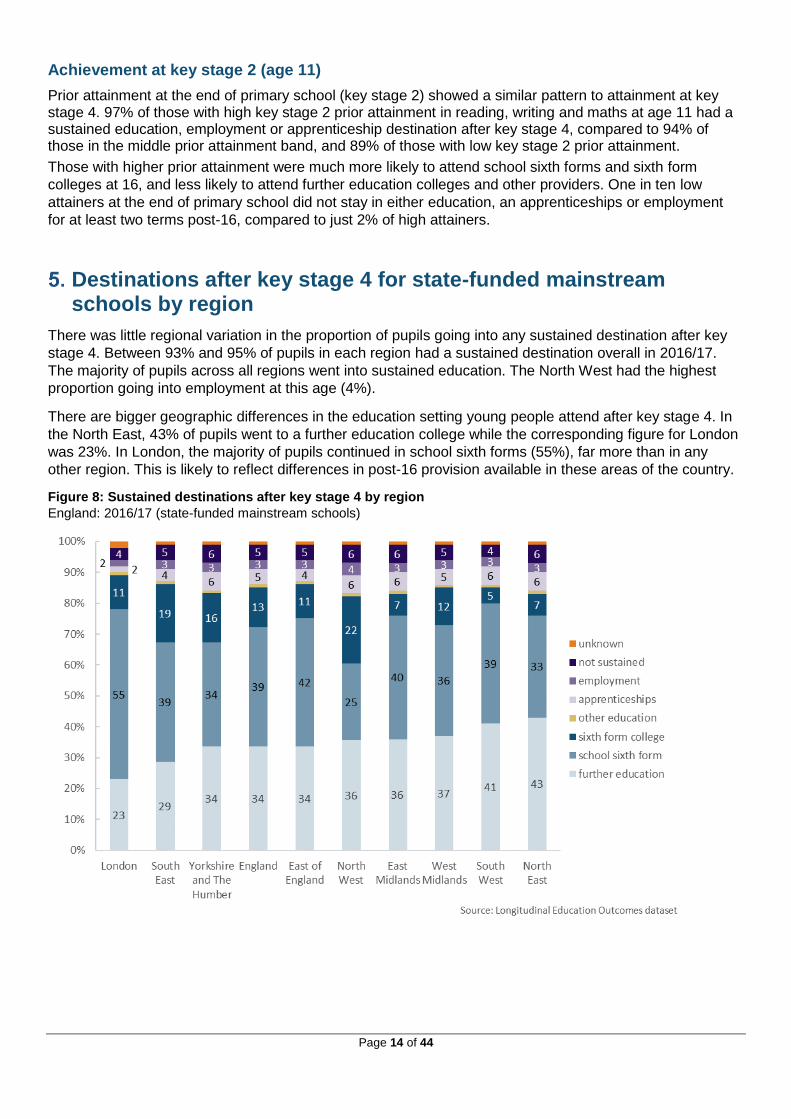
Destinations after key stage 4 for state-funded mainstream schools by region
There was little regional variation in the proportion of pupils going into any sustained destination after key
stage 4. Between 93% and 95% of pupils in each region had a sustained destination overall in 2016/17.
The majority of pupils across all regions went into sustained education. The North West had the highest
proportion going into employment at this age (4%).
There are bigger geographic differences in the education setting young people attend after key stage 4. In
the North East, 43% of pupils went to a further education college while the corresponding figure for London
was 23%. In London, the majority of pupils continued in school sixth forms (55%), far more than in any
other region. This is likely to reflect differences in post-16 provision available in these areas of the country.
Figure 8: Sustained destinations after key stage 4 by region
England: 2016/17 (state-funded mainstream schools)
Page 15 of 44
Destinations after KS4 for state-funded mainstream institutions by type
Destinations for state-funded mainstream institutions by funding type
Included in this publication are further breakdowns by type for state-funded mainstream institutions and
include local authority maintained schools, academies, free schools and further education colleges with 14-
16 provision.
UTCs, Studio schools and FE colleges
School and college types are reported on the basis of schools open at the start of the 2015/16 academic year (when these pupils began their last year of key stage 4 study).
There are small, but increasing, numbers of UTCs and studio schools and small numbers of pupils in FE colleges with 14-16 provision included in this publication so the data may be subject to volatility for these institution types.
The picture of the sector given in these statistics only includes some of the first schools of these types to open and many only had students joining for the last year of key stage 4 study.
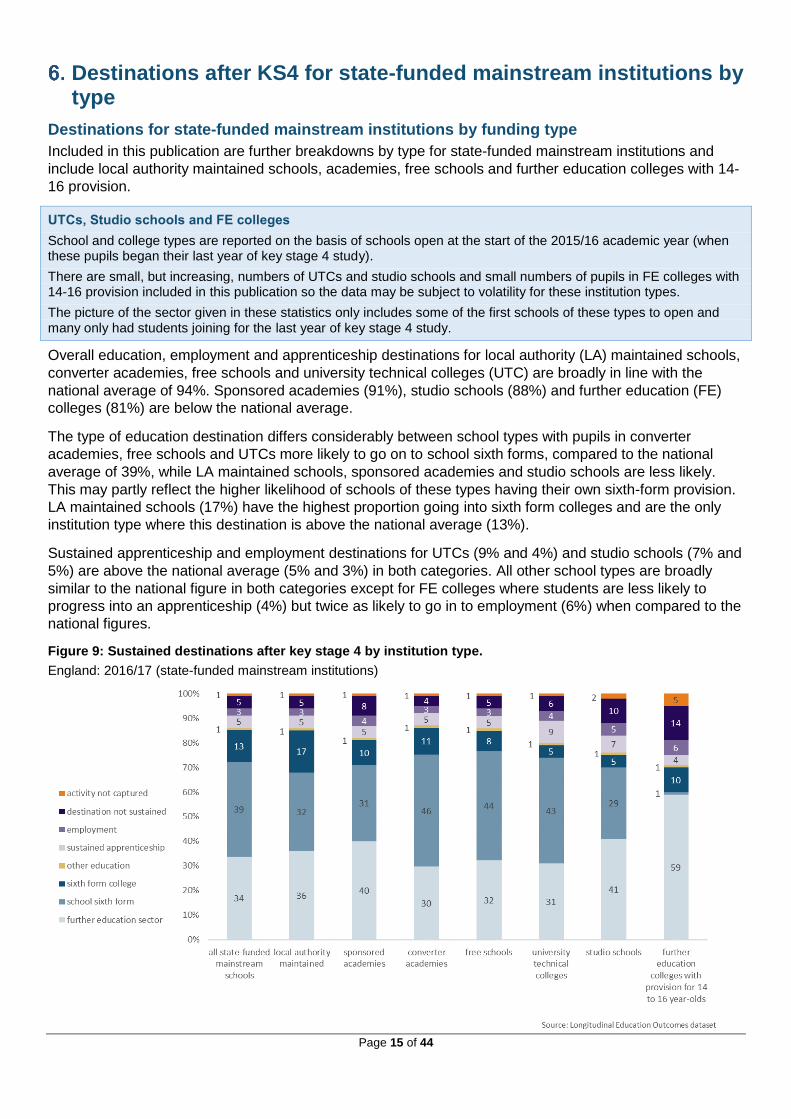
Overall education, employment and apprenticeship destinations for local authority (LA) maintained schools,
converter academies, free schools and university technical colleges (UTC) are broadly in line with the
national average of 94%. Sponsored academies (91%), studio schools (88%) and further education (FE)
colleges (81%) are below the national average.
The type of education destination differs considerably between school types with pupils in converter
academies, free schools and UTCs more likely to go on to school sixth forms, compared to the national
average of 39%, while LA maintained schools, sponsored academies and studio schools are less likely.
This may partly reflect the higher likelihood of schools of these types having their own sixth-form provision.
LA maintained schools (17%) have the highest proportion going into sixth form colleges and are the only
institution type where this destination is above the national average (13%).
Sustained apprenticeship and employment destinations for UTCs (9% and 4%) and studio schools (7% and
5%) are above the national average (5% and 3%) in both categories. All other school types are broadly
similar to the national figure in both categories except for FE colleges where students are less likely to
progress into an apprenticeship (4%) but twice as likely to go in to employment (6%) when compared to the
national figures.
Figure 9: Sustained destinations after key stage 4 by institution type.
England: 2016/17 (state-funded mainstream institutions)
Page 16 of 44
For context, the number of institutions and students for state-funded mainstream school is as follows:-
Table 2: Number of institutions and students at key stage 4 by school type England: 2015/16 (state-funded mainstream institutions)
institution type number of
institutions number of
students
state-funded mainstream schools* 3,113 530,545
LA maintained 1,120 191,695
sponsored academy 562 85,075
converter academy 1,322 247,530
free 32 1,835
UTC 28 1,865
studio 31 1,120
FE college - 14-16 15 885 *includes 3 city technology colleges not shown separately.
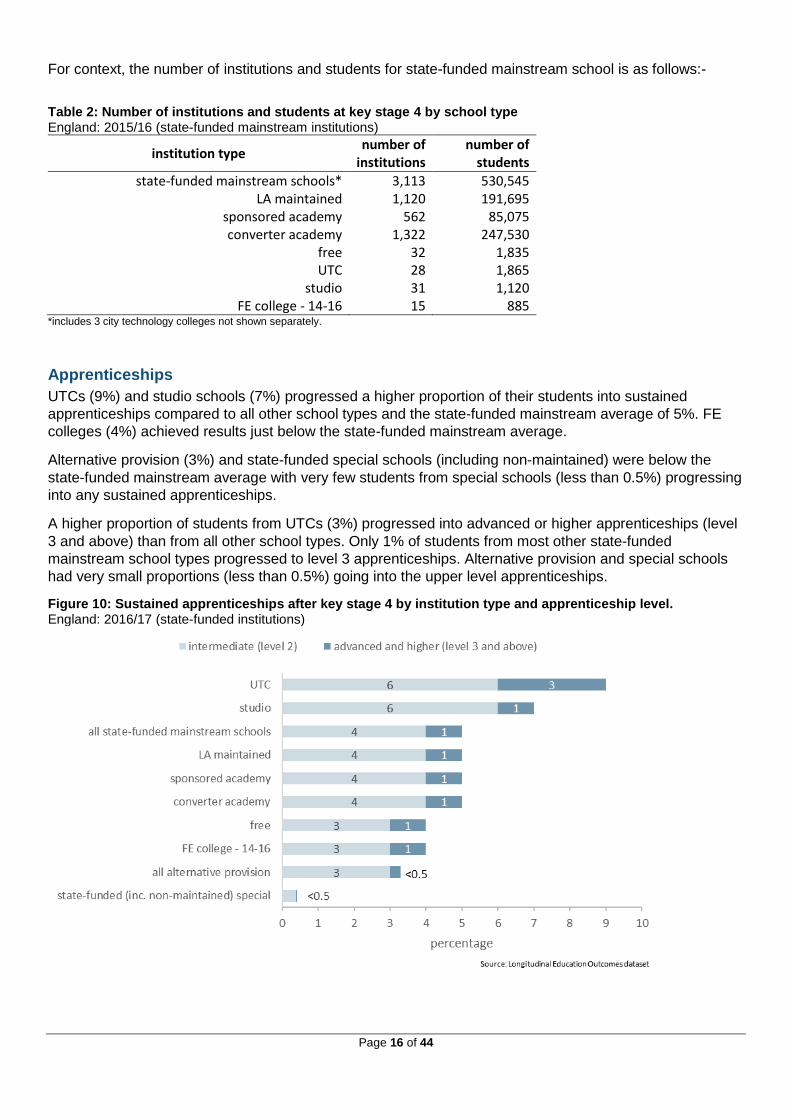
Apprenticeships
UTCs (9%) and studio schools (7%) progressed a higher proportion of their students into sustained
apprenticeships compared to all other school types and the state-funded mainstream average of 5%. FE
colleges (4%) achieved results just below the state-funded mainstream average.
Alternative provision (3%) and state-funded special schools (including non-maintained) were below the
state-funded mainstream average with very few students from special schools (less than 0.5%) progressing
into any sustained apprenticeships.
A higher proportion of students from UTCs (3%) progressed into advanced or higher apprenticeships (level
3 and above) than from all other school types. Only 1% of students from most other state-funded
mainstream school types progressed to level 3 apprenticeships. Alternative provision and special schools
had very small proportions (less than 0.5%) going into the upper level apprenticeships.
Figure 10: Sustained apprenticeships after key stage 4 by institution type and apprenticeship level. England: 2016/17 (state-funded institutions)
Page 17 of 44
Disadvantage and its interactions with other factors
Disadvantage and gender
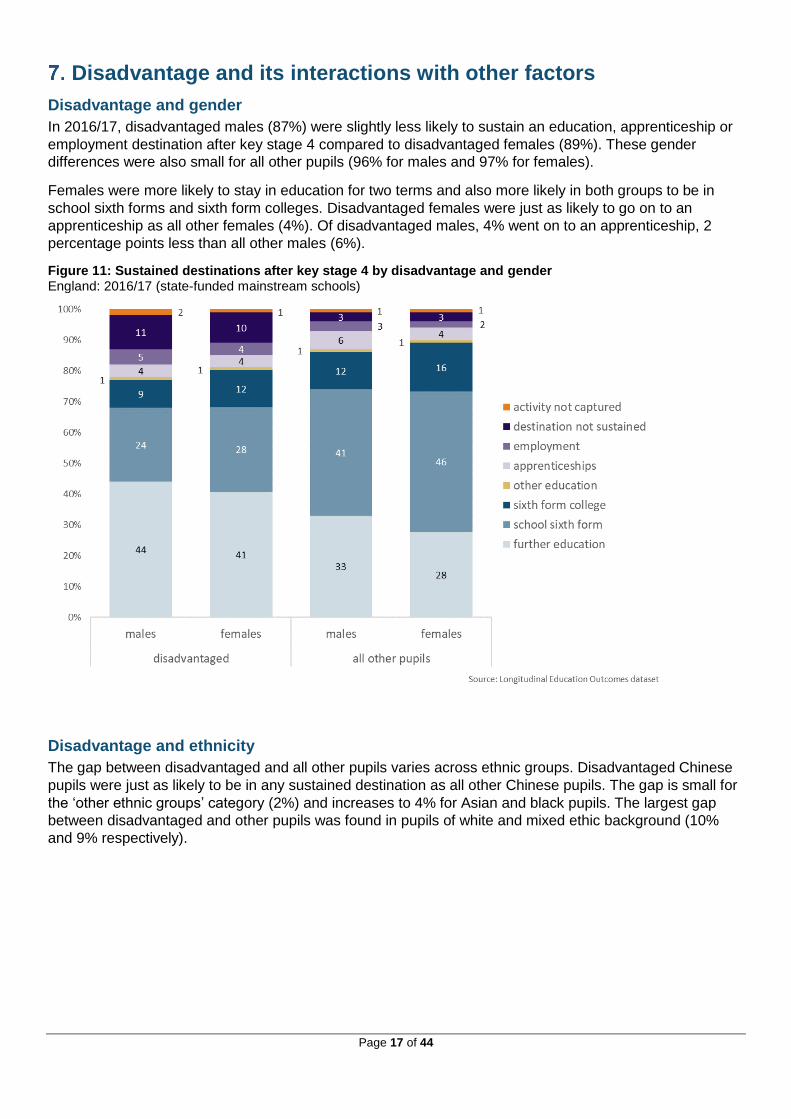
In 2016/17, disadvantaged males (87%) were slightly less likely to sustain an education, apprenticeship or
employment destination after key stage 4 compared to disadvantaged females (89%). These gender
differences were also small for all other pupils (96% for males and 97% for females).
Females were more likely to stay in education for two terms and also more likely in both groups to be in
school sixth forms and sixth form colleges. Disadvantaged females were just as likely to go on to an
apprenticeship as all other females (4%). Of disadvantaged males, 4% went on to an apprenticeship, 2
percentage points less than all other males (6%).
Figure 11: Sustained destinations after key stage 4 by disadvantage and gender England: 2016/17 (state-funded mainstream schools)
Disadvantage and ethnicity
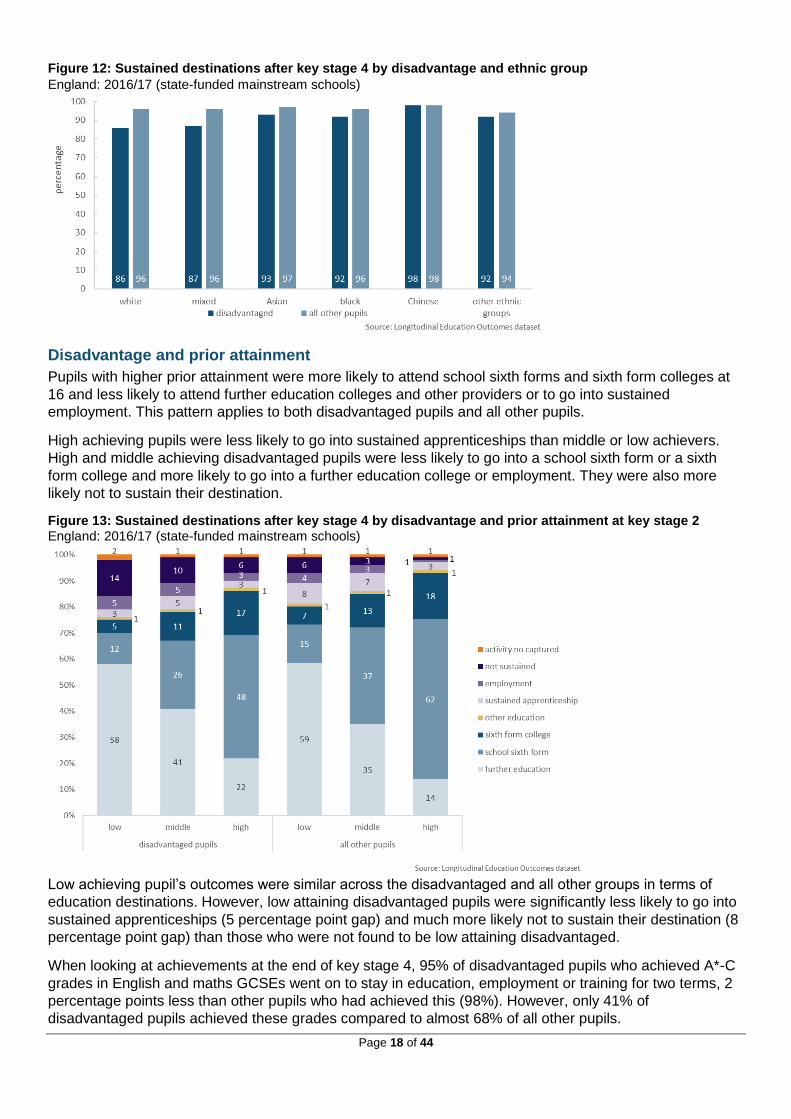
The gap between disadvantaged and all other pupils varies across ethnic groups. Disadvantaged Chinese
pupils were just as likely to be in any sustained destination as all other Chinese pupils. The gap is small for
the ‘other ethnic groups’ category (2%) and increases to 4% for Asian and black pupils. The largest gap
between disadvantaged and other pupils was found in pupils of white and mixed ethic background (10%
and 9% respectively).
Page 18 of 44
Figure 12: Sustained destinations after key stage 4 by disadvantage and ethnic group
England: 2016/17 (state-funded mainstream schools)
Disadvantage and prior attainment
Pupils with higher prior attainment were more likely to attend school sixth forms and sixth form colleges at
16 and less likely to attend further education colleges and other providers or to go into sustained
employment. This pattern applies to both disadvantaged pupils and all other pupils.
High achieving pupils were less likely to go into sustained apprenticeships than middle or low achievers.
High and middle achieving disadvantaged pupils were less likely to go into a school sixth form or a sixth
form college and more likely to go into a further education college or employment. They were also more
likely not to sustain their destination.
Figure 13: Sustained destinations after key stage 4 by disadvantage and prior attainment at key stage 2 England: 2016/17 (state-funded mainstream schools)
Low achieving pupil’s outcomes were similar across the disadvantaged and all other groups in terms of
education destinations. However, low attaining disadvantaged pupils were significantly less likely to go into
sustained apprenticeships (5 percentage point gap) and much more likely not to sustain their destination (8
percentage point gap) than those who were not found to be low attaining disadvantaged.
When looking at achievements at the end of key stage 4, 95% of disadvantaged pupils who achieved A*-C
grades in English and maths GCSEs went on to stay in education, employment or training for two terms, 2
percentage points less than other pupils who had achieved this (98%). However, only 41% of
disadvantaged pupils achieved these grades compared to almost 68% of all other pupils.
Page 19 of 44
Destinations for other school types
Special schools
A number of pupils go to schools specifically for pupils with special educational needs – ‘special schools’.
These pupils may either go to state-funded special schools, or non-maintained special schools where state-
funding follows the learner. The different types of special school are not shown separately.
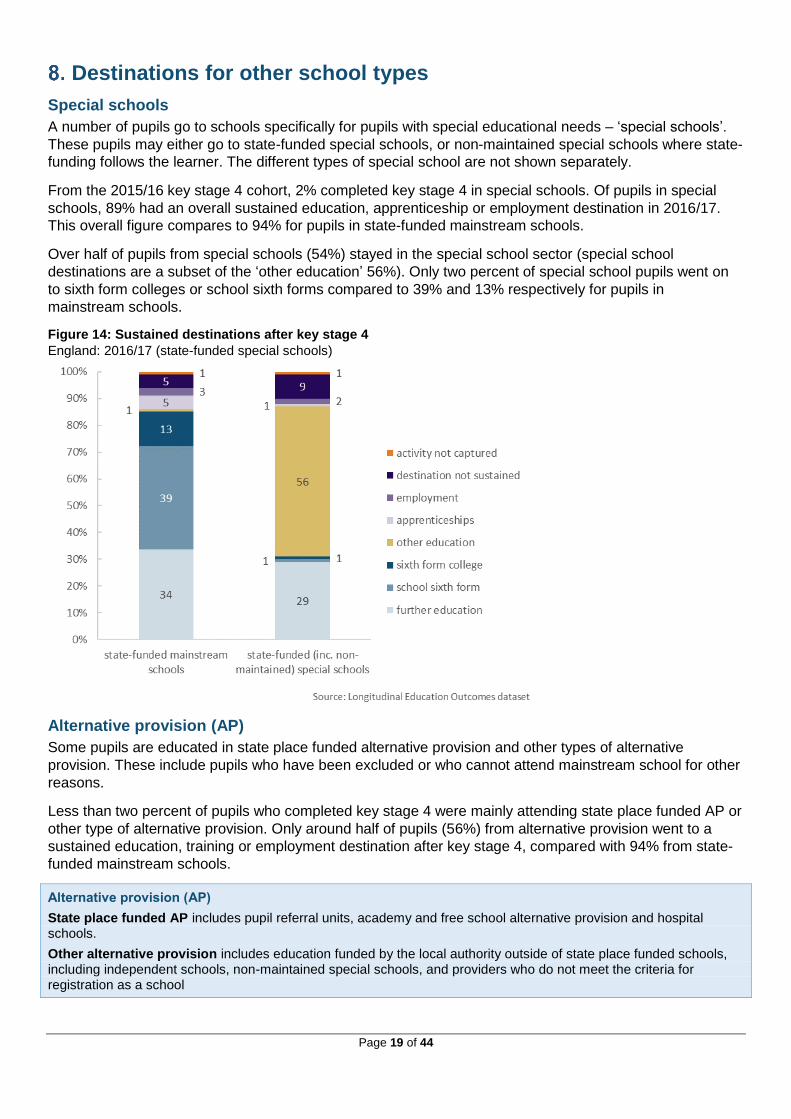
From the 2015/16 key stage 4 cohort, 2% completed key stage 4 in special schools. Of pupils in special
schools, 89% had an overall sustained education, apprenticeship or employment destination in 2016/17.
This overall figure compares to 94% for pupils in state-funded mainstream schools.
Over half of pupils from special schools (54%) stayed in the special school sector (special school
destinations are a subset of the ‘other education’ 56%). Only two percent of special school pupils went on
to sixth form colleges or school sixth forms compared to 39% and 13% respectively for pupils in
mainstream schools.
Figure 14: Sustained destinations after key stage 4
England: 2016/17 (state-funded special schools)
Alternative provision (AP)
Some pupils are educated in state place funded alternative provision and other types of alternative
provision. These include pupils who have been excluded or who cannot attend mainstream school for other
reasons.
Less than two percent of pupils who completed key stage 4 were mainly attending state place funded AP or
other type of alternative provision. Only around half of pupils (56%) from alternative provision went to a
sustained education, training or employment destination after key stage 4, compared with 94% from state-
funded mainstream schools.
Alternative provision (AP)
State place funded AP includes pupil referral units, academy and free school alternative provision and hospital schools.
Other alternative provision includes education funded by the local authority outside of state place funded schools, including independent schools, non-maintained special schools, and providers who do not meet the criteria for registration as a school
Page 20 of 44
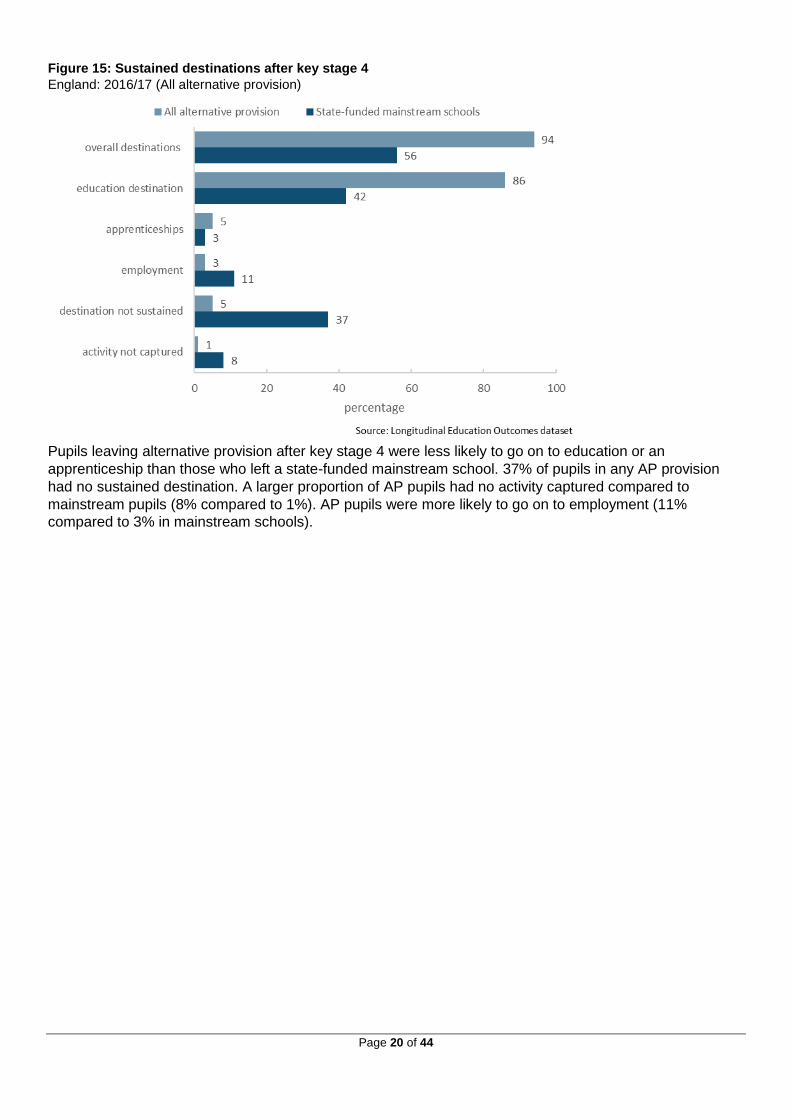
Figure 15: Sustained destinations after key stage 4
England: 2016/17 (All alternative provision)
Pupils leaving alternative provision after key stage 4 were less likely to go on to education or an
apprenticeship than those who left a state-funded mainstream school. 37% of pupils in any AP provision
had no sustained destination. A larger proportion of AP pupils had no activity captured compared to
mainstream pupils (8% compared to 1%). AP pupils were more likely to go on to employment (11%
compared to 3% in mainstream schools).
Page 21 of 44
Sustained destinations after KS5
Key stage 5 destinations follow students who had entered A levels or other level 3 qualifications at the end
of their 16 to 18 study in 2015/16. In the destination year, 2016/17, these students are mostly aged 18 or 19
(although some may be 17) and entering higher or further education as adults, or entering full time
employment.
The KS5 cohort is level 3 only.
Key stage 5 destinations follow students who had entered A levels or other level 3 qualifications at the end of their 16 to 18 study. This doesn’t give the full picture of what all 18 year olds go on to do as only around 60% of young people enter qualifications at this level. Many lower achieving pupils, and many 16 to 18 year olds studying in further education colleges, only study lower level qualifications or do not enter qualifications after key stage 4 and so are not included in these statistics.
Please see the experimental statistics published alongside this release for outcomes of students who entered approved level 2 qualifications, and different types of level 3 qualification.
The key stage 5 cohort has changed this year
From 2015/16, only students who entered approved level 3 qualifications (designated as academic, applied general or tech levels) are included and there are some changes to how students and qualifications are counted.
Altogether around 6000 more students are included than last year, an increase of 1.7%. The impact is expected to be small but the exclusion of some students entering unapproved vocational qualifications and inclusion of some students entering qualifications worth only one AS level in size at level 3 may have affected the change in destinations seen between years.
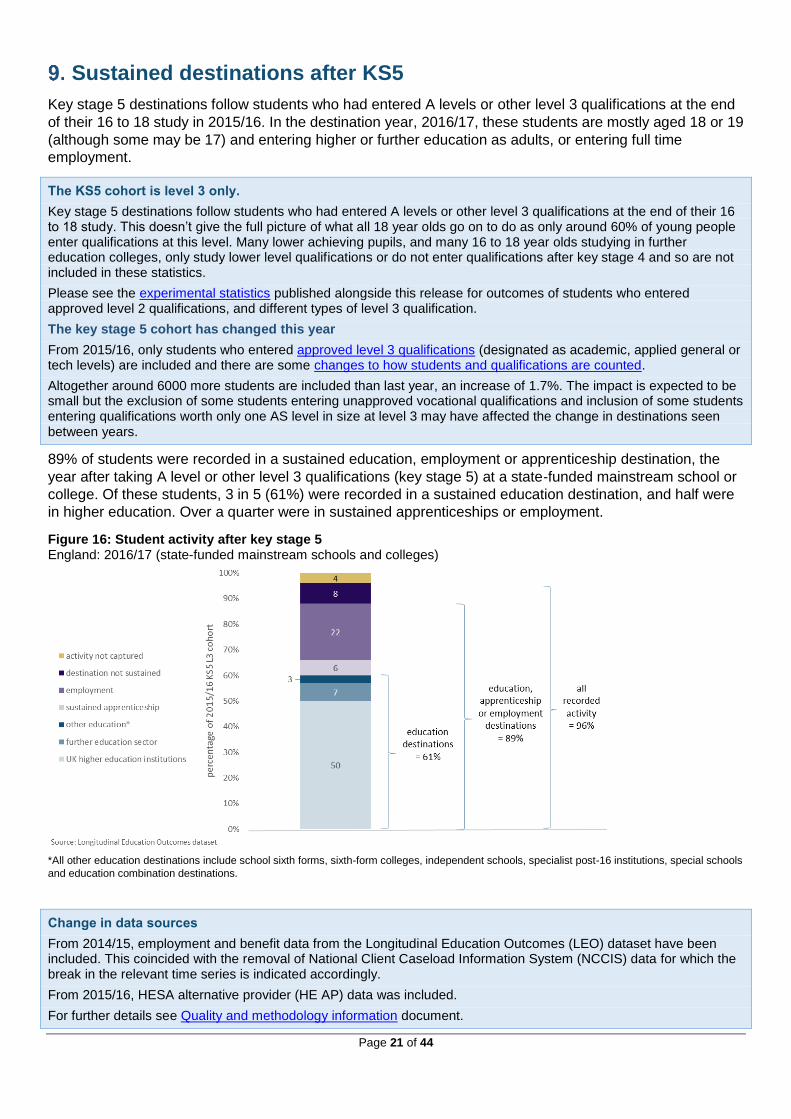
89% of students were recorded in a sustained education, employment or apprenticeship destination, the
year after taking A level or other level 3 qualifications (key stage 5) at a state-funded mainstream school or
college. Of these students, 3 in 5 (61%) were recorded in a sustained education destination, and half were
in higher education. Over a quarter were in sustained apprenticeships or employment.
Figure 16: Student activity after key stage 5 England: 2016/17 (state-funded mainstream schools and colleges)
*All other education destinations include school sixth forms, sixth-form colleges, independent schools, specialist post-16 institutions, special schools
and education combination destinations.
Change in data sources
From 2014/15, employment and benefit data from the Longitudinal Education Outcomes (LEO) dataset have been included. This coincided with the removal of National Client Caseload Information System (NCCIS) data for which the break in the relevant time series is indicated accordingly.
From 2015/16, HESA alternative provider (HE AP) data was included.
For further details see Quality and methodology information document.
Page 22 of 44
Change over time
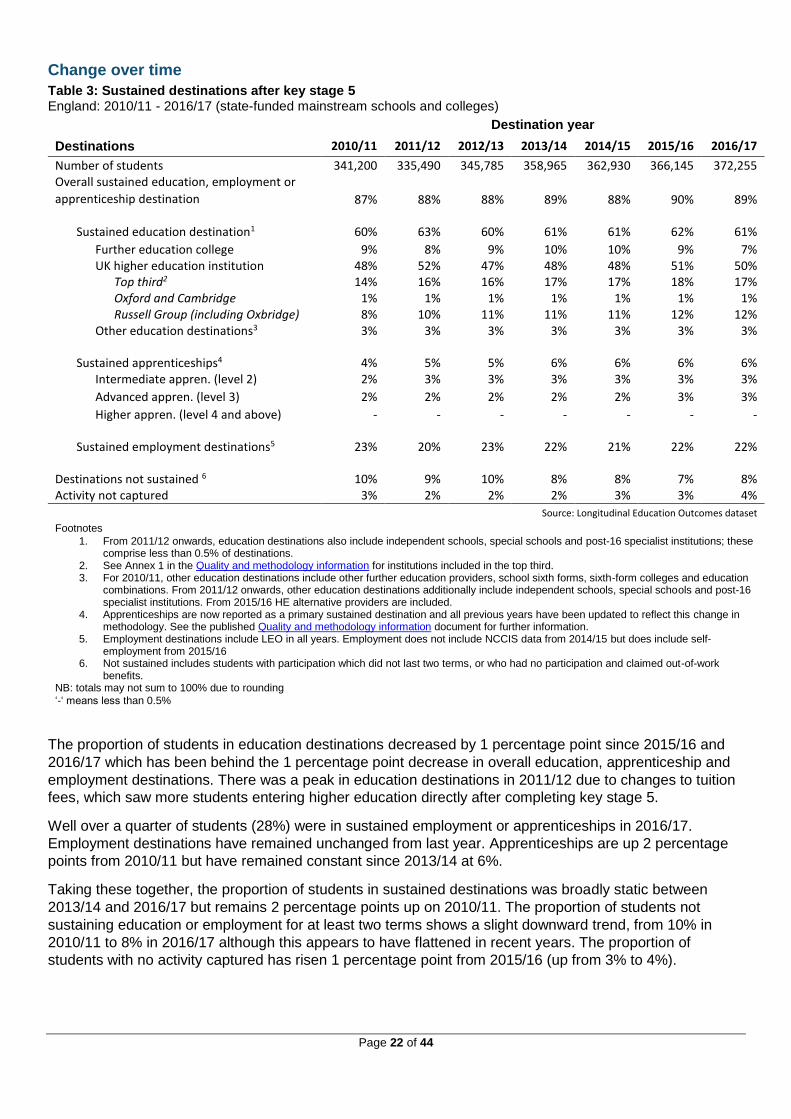
Table 3: Sustained destinations after key stage 5 England: 2010/11 - 2016/17 (state-funded mainstream schools and colleges)
Destination year
Destinations 2010/11 2011/12 2012/13 2013/14 2014/15 2015/16 2016/17
Number of students 341,200 335,490 345,785 358,965 362,930 366,145 372,255 Overall sustained education, employment or
apprenticeship destination 87% 88% 88% 89% 88% 90% 89%
Sustained education destination1 60% 63% 60% 61% 61% 62% 61%
Further education college 9% 8% 9% 10% 10% 9% 7% UK higher education institution 48% 52% 47% 48% 48% 51% 50%
Top third2 14% 16% 16% 17% 17% 18% 17% Oxford and Cambridge 1% 1% 1% 1% 1% 1% 1% Russell Group (including Oxbridge) 8% 10% 11% 11% 11% 12% 12%
Other education destinations3 3% 3% 3% 3% 3% 3% 3%
Sustained apprenticeships4 4% 5% 5% 6% 6% 6% 6% Intermediate appren. (level 2) 2% 3% 3% 3% 3% 3% 3%
Advanced appren. (level 3) 2% 2% 2% 2% 2% 3% 3%
Higher appren. (level 4 and above) - - - - - - -
Sustained employment destinations5 23% 20% 23% 22% 21% 22% 22%
Destinations not sustained 6 10% 9% 10% 8% 8% 7% 8% Activity not captured 3% 2% 2% 2% 3% 3% 4%
Source: Longitudinal Education Outcomes dataset
Footnotes
1. From 2011/12 onwards, education destinations also include independent schools, special schools and post-16 specialist institutions; these comprise less than 0.5% of destinations.
2. See Annex 1 in the Quality and methodology information for institutions included in the top third. 3. For 2010/11, other education destinations include other further education providers, school sixth forms, sixth-form colleges and education
combinations. From 2011/12 onwards, other education destinations additionally include independent schools, special schools and post-16 specialist institutions. From 2015/16 HE alternative providers are included.
4. Apprenticeships are now reported as a primary sustained destination and all previous years have been updated to reflect this change in methodology. See the published Quality and methodology information document for further information.
5. Employment destinations include LEO in all years. Employment does not include NCCIS data from 2014/15 but does include self-employment from 2015/16
6. Not sustained includes students with participation which did not last two terms, or who had no participation and claimed out-of-work benefits.
NB: totals may not sum to 100% due to rounding
‘-‘ means less than 0.5%
The proportion of students in education destinations decreased by 1 percentage point since 2015/16 and
2016/17 which has been behind the 1 percentage point decrease in overall education, apprenticeship and
employment destinations. There was a peak in education destinations in 2011/12 due to changes to tuition
fees, which saw more students entering higher education directly after completing key stage 5.
Well over a quarter of students (28%) were in sustained employment or apprenticeships in 2016/17.
Employment destinations have remained unchanged from last year. Apprenticeships are up 2 percentage
points from 2010/11 but have remained constant since 2013/14 at 6%.
Taking these together, the proportion of students in sustained destinations was broadly static between
2013/14 and 2016/17 but remains 2 percentage points up on 2010/11. The proportion of students not
sustaining education or employment for at least two terms shows a slight downward trend, from 10% in
2010/11 to 8% in 2016/17 although this appears to have flattened in recent years. The proportion of
students with no activity captured has risen 1 percentage point from 2015/16 (up from 3% to 4%).
Page 23 of 44
Education participation over time
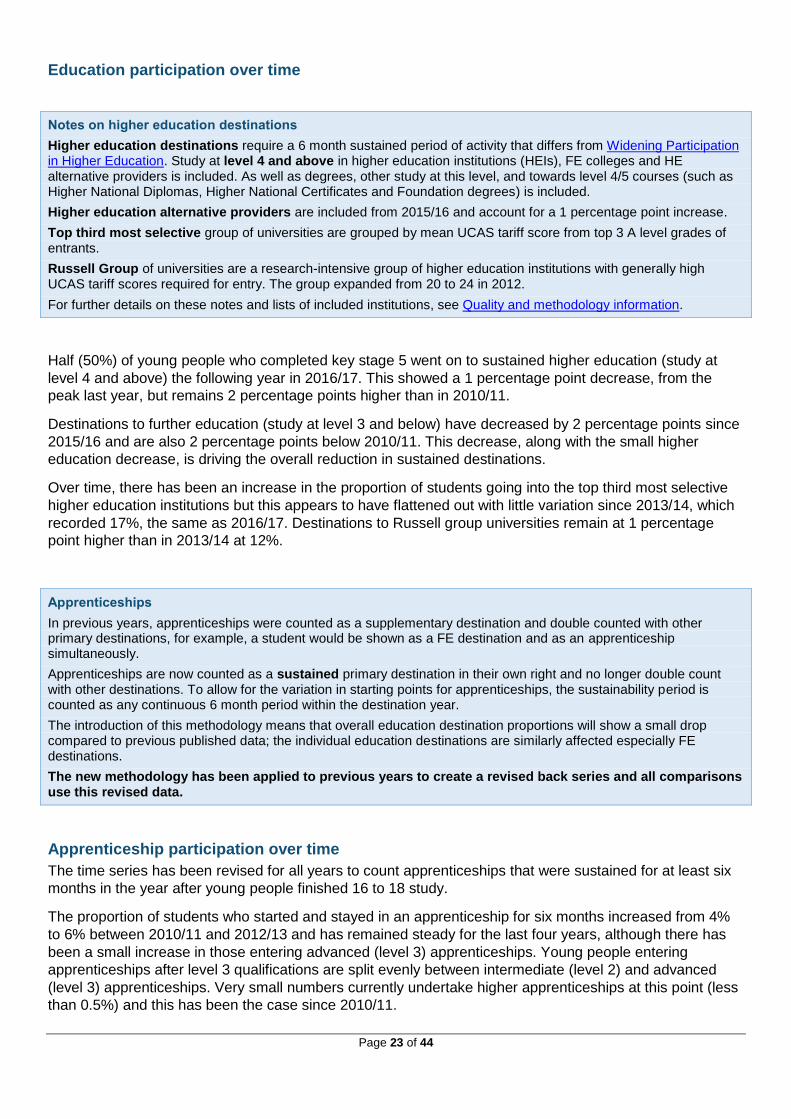
Notes on higher education destinations
Higher education destinations require a 6 month sustained period of activity that differs from Widening Participation in Higher Education. Study at level 4 and above in higher education institutions (HEIs), FE colleges and HE alternative providers is included. As well as degrees, other study at this level, and towards level 4/5 courses (such as Higher National Diplomas, Higher National Certificates and Foundation degrees) is included.
Higher education alternative providers are included from 2015/16 and account for a 1 percentage point increase.
Top third most selective group of universities are grouped by mean UCAS tariff score from top 3 A level grades of entrants.
Russell Group of universities are a research-intensive group of higher education institutions with generally high UCAS tariff scores required for entry. The group expanded from 20 to 24 in 2012.
For further details on these notes and lists of included institutions, see Quality and methodology information.
Half (50%) of young people who completed key stage 5 went on to sustained higher education (study at
level 4 and above) the following year in 2016/17. This showed a 1 percentage point decrease, from the
peak last year, but remains 2 percentage points higher than in 2010/11.
Destinations to further education (study at level 3 and below) have decreased by 2 percentage points since
2015/16 and are also 2 percentage points below 2010/11. This decrease, along with the small higher
education decrease, is driving the overall reduction in sustained destinations.
Over time, there has been an increase in the proportion of students going into the top third most selective
higher education institutions but this appears to have flattened out with little variation since 2013/14, which
recorded 17%, the same as 2016/17. Destinations to Russell group universities remain at 1 percentage
point higher than in 2013/14 at 12%.
Apprenticeships
In previous years, apprenticeships were counted as a supplementary destination and double counted with other primary destinations, for example, a student would be shown as a FE destination and as an apprenticeship simultaneously.
Apprenticeships are now counted as a sustained primary destination in their own right and no longer double count with other destinations. To allow for the variation in starting points for apprenticeships, the sustainability period is counted as any continuous 6 month period within the destination year.
The introduction of this methodology means that overall education destination proportions will show a small drop compared to previous published data; the individual education destinations are similarly affected especially FE destinations.
The new methodology has been applied to previous years to create a revised back series and all comparisons use this revised data.
Apprenticeship participation over time
The time series has been revised for all years to count apprenticeships that were sustained for at least six
months in the year after young people finished 16 to 18 study.
The proportion of students who started and stayed in an apprenticeship for six months increased from 4%
to 6% between 2010/11 and 2012/13 and has remained steady for the last four years, although there has
been a small increase in those entering advanced (level 3) apprenticeships. Young people entering
apprenticeships after level 3 qualifications are split evenly between intermediate (level 2) and advanced
(level 3) apprenticeships. Very small numbers currently undertake higher apprenticeships at this point (less
than 0.5%) and this has been the case since 2010/11.
Page 24 of 44
Impact of apprenticeship changes on time series
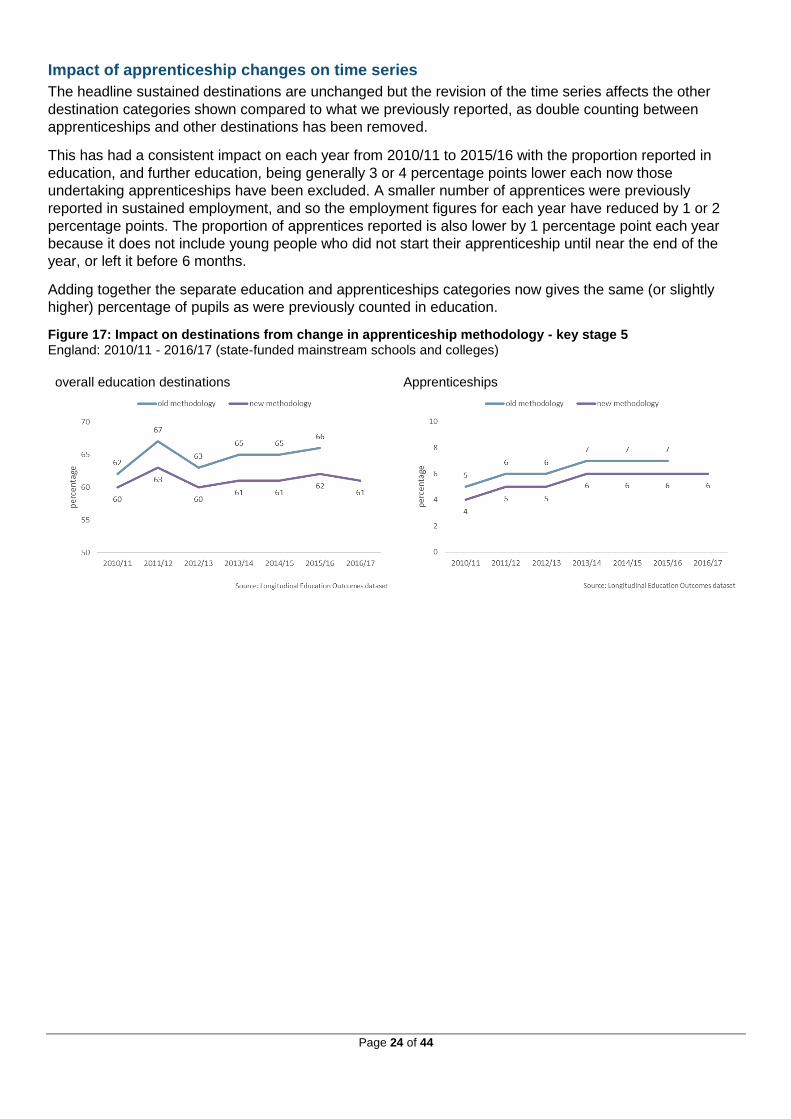
The headline sustained destinations are unchanged but the revision of the time series affects the other
destination categories shown compared to what we previously reported, as double counting between
apprenticeships and other destinations has been removed.
This has had a consistent impact on each year from 2010/11 to 2015/16 with the proportion reported in
education, and further education, being generally 3 or 4 percentage points lower each now those
undertaking apprenticeships have been excluded. A smaller number of apprentices were previously
reported in sustained employment, and so the employment figures for each year have reduced by 1 or 2
percentage points. The proportion of apprentices reported is also lower by 1 percentage point each year
because it does not include young people who did not start their apprenticeship until near the end of the
year, or left it before 6 months.
Adding together the separate education and apprenticeships categories now gives the same (or slightly
higher) percentage of pupils as were previously counted in education.
Figure 17: Impact on destinations from change in apprenticeship methodology - key stage 5 England: 2010/11 - 2016/17 (state-funded mainstream schools and colleges)
overall education destinations Apprenticeships
Page 25 of 44
Student destinations after KS5 by student characteristics
Gender
The gap between female and male sustained destinations overall remains unchanged from last year at
4 percentage points. In 2016/17, 91% of female students stayed in education, apprenticeships or
employment for at least two terms after 16 to 18 study. The corresponding figure for male students is 87%.
Higher education was the most common destination for both female (53%) and male (48%) students. Male
students were slightly less likely to continue in further education and more likely to stay in an
apprenticeship for at least six months (8% for male students compared to 5% for females).
Disadvantage and free school meals
Disadvantage and free school meal status
Both disadvantage and free school meal eligibility are based on information recorded when students were in year 11.
Students were considered disadvantaged in year 11 if they had been eligible for free school meals at any point in the last six years, had been looked after by the local authority, or had been adopted from care. Students eligible for free school meals are a subset of the wider disadvantaged group.
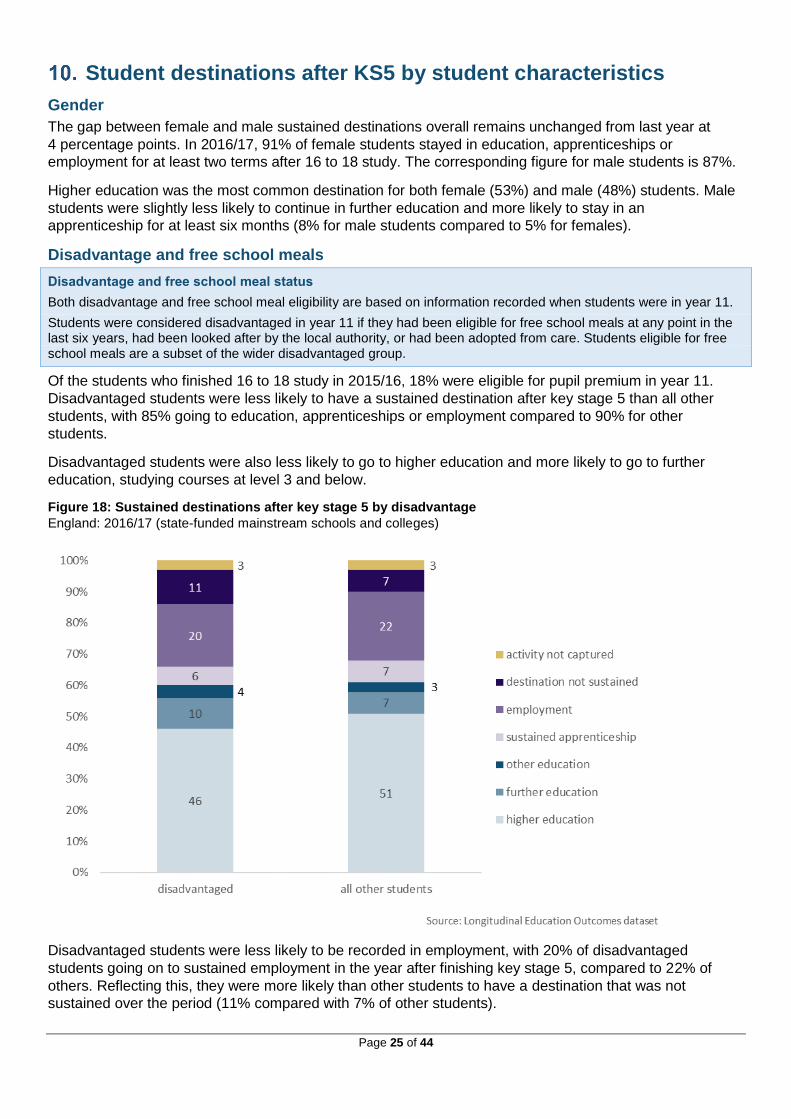
Of the students who finished 16 to 18 study in 2015/16, 18% were eligible for pupil premium in year 11.
Disadvantaged students were less likely to have a sustained destination after key stage 5 than all other
students, with 85% going to education, apprenticeships or employment compared to 90% for other
students.
Disadvantaged students were also less likely to go to higher education and more likely to go to further
education, studying courses at level 3 and below.
Figure 18: Sustained destinations after key stage 5 by disadvantage
England: 2016/17 (state-funded mainstream schools and colleges)
Disadvantaged students were less likely to be recorded in employment, with 20% of disadvantaged
students going on to sustained employment in the year after finishing key stage 5, compared to 22% of
others. Reflecting this, they were more likely than other students to have a destination that was not
sustained over the period (11% compared with 7% of other students).
Page 26 of 44
Ethnicity
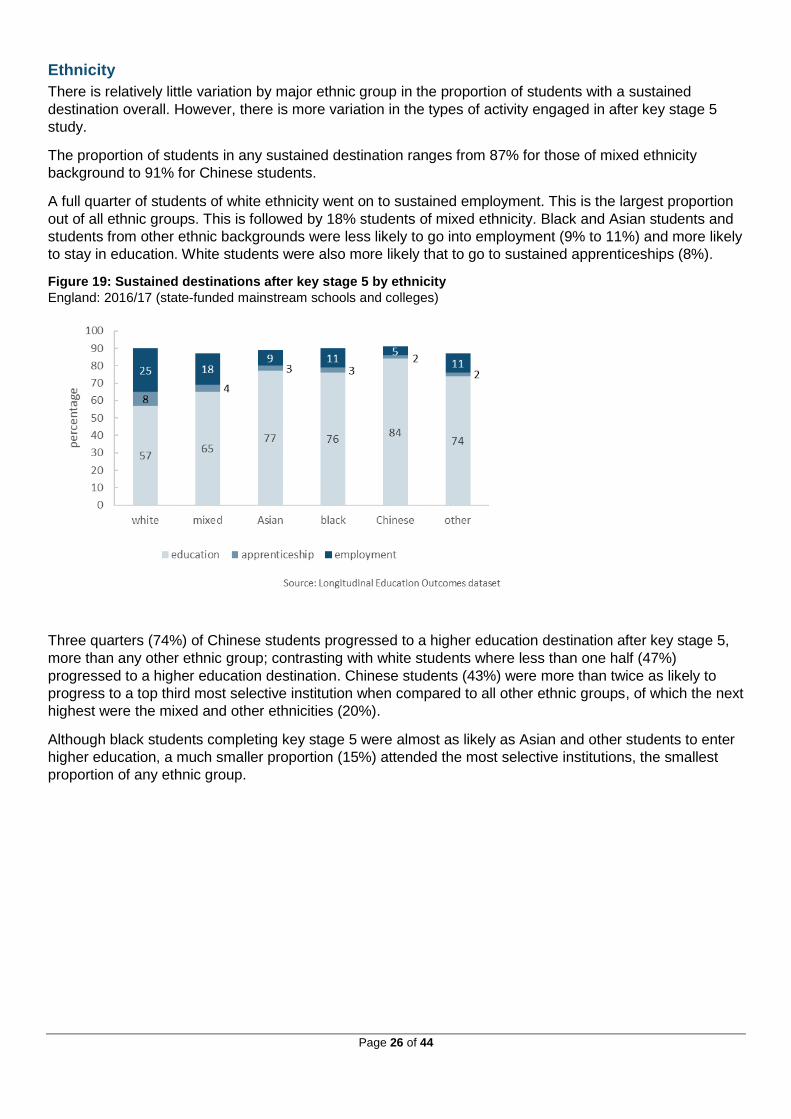
There is relatively little variation by major ethnic group in the proportion of students with a sustained
destination overall. However, there is more variation in the types of activity engaged in after key stage 5
study.
The proportion of students in any sustained destination ranges from 87% for those of mixed ethnicity
background to 91% for Chinese students.
A full quarter of students of white ethnicity went on to sustained employment. This is the largest proportion
out of all ethnic groups. This is followed by 18% students of mixed ethnicity. Black and Asian students and
students from other ethnic backgrounds were less likely to go into employment (9% to 11%) and more likely
to stay in education. White students were also more likely that to go to sustained apprenticeships (8%).
Figure 19: Sustained destinations after key stage 5 by ethnicity
England: 2016/17 (state-funded mainstream schools and colleges)
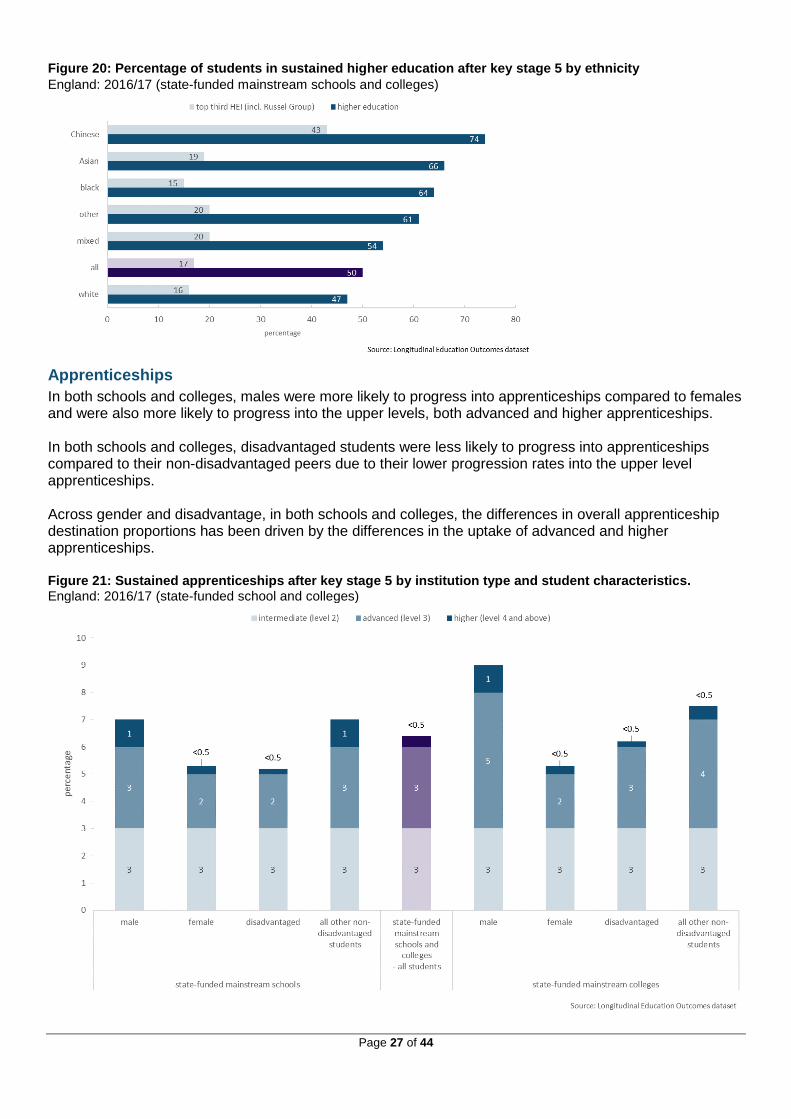
Three quarters (74%) of Chinese students progressed to a higher education destination after key stage 5,
more than any other ethnic group; contrasting with white students where less than one half (47%)
progressed to a higher education destination. Chinese students (43%) were more than twice as likely to
progress to a top third most selective institution when compared to all other ethnic groups, of which the next
highest were the mixed and other ethnicities (20%).
Although black students completing key stage 5 were almost as likely as Asian and other students to enter
higher education, a much smaller proportion (15%) attended the most selective institutions, the smallest
proportion of any ethnic group.
Page 27 of 44
Figure 20: Percentage of students in sustained higher education after key stage 5 by ethnicity
England: 2016/17 (state-funded mainstream schools and colleges)
Apprenticeships
In both schools and colleges, males were more likely to progress into apprenticeships compared to females and were also more likely to progress into the upper levels, both advanced and higher apprenticeships. In both schools and colleges, disadvantaged students were less likely to progress into apprenticeships compared to their non-disadvantaged peers due to their lower progression rates into the upper level apprenticeships. Across gender and disadvantage, in both schools and colleges, the differences in overall apprenticeship destination proportions has been driven by the differences in the uptake of advanced and higher apprenticeships. Figure 21: Sustained apprenticeships after key stage 5 by institution type and student characteristics. England: 2016/17 (state-funded school and colleges)
Page 28 of 44
Student destinations after KS5 by prior attainment
Students’ achievements in qualifications and assessments taken throughout their education have a strong
relationship with the proportion going on to sustained education or employment after key stage 5 study, and
with the specific destinations progressed to in this year. Information at national level is presented to help
users understand a key influence on outcomes.
As key stage 5 destinations only include those who are entering level 3 qualifications (generally more able
students) there are fewer students with low prior attainment included in the measures.
Attainment at different points in time
The measures indicating whether students have met key thresholds at different key stages are published each year by the Department for Education as outcomes from, and accountability measures for, these key stages.
Although some students make faster or slower progress than average from the same starting point, attainment at each point in time is closely correlated. For students in school sixth forms the ‘prior’ attainment before the pupil entered the school is key stage 2, but key stage 4 attainment may be more relevant to course choices or post-16 admissions.
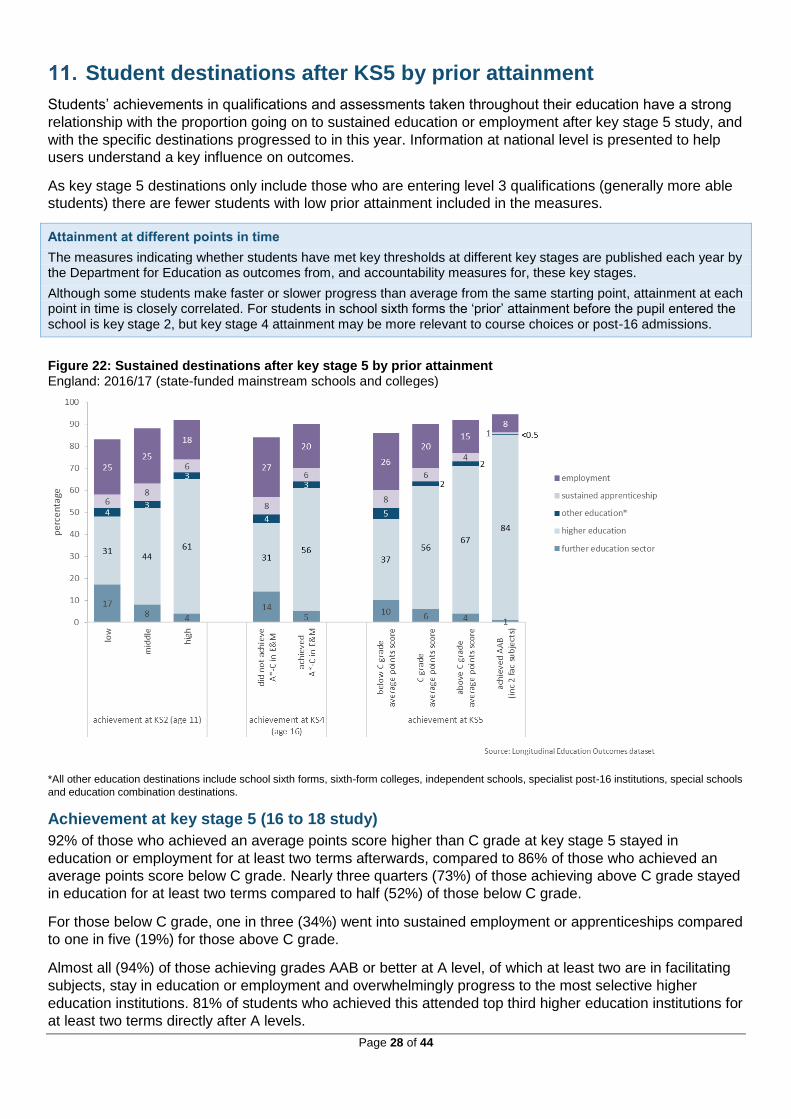
Figure 22: Sustained destinations after key stage 5 by prior attainment England: 2016/17 (state-funded mainstream schools and colleges)
*All other education destinations include school sixth forms, sixth-form colleges, independent schools, specialist post-16 institutions, special schools
and education combination destinations.
Achievement at key stage 5 (16 to 18 study)
92% of those who achieved an average points score higher than C grade at key stage 5 stayed in
education or employment for at least two terms afterwards, compared to 86% of those who achieved an
average points score below C grade. Nearly three quarters (73%) of those achieving above C grade stayed
in education for at least two terms compared to half (52%) of those below C grade.
For those below C grade, one in three (34%) went into sustained employment or apprenticeships compared
to one in five (19%) for those above C grade.
Almost all (94%) of those achieving grades AAB or better at A level, of which at least two are in facilitating
subjects, stay in education or employment and overwhelmingly progress to the most selective higher
education institutions. 81% of students who achieved this attended top third higher education institutions for
at least two terms directly after A levels.
Page 29 of 44
Achievement at key stage 4 (age 16)
Of those who had achieved grade C or above in English and maths GCSEs, 91% stayed in education or
employment for at least two terms after level 3 study, compared to 84% of those not achieving this at key
stage 4.
They were also far more likely to progress to higher education. However, while very few without this grade
C or above in English and maths benchmark at key stage 4 went on to top third universities, nearly one
third (31%) (of those who had entered level 3 qualifications) did progress to higher education after key
stage 5.
Achievement at key stage 2 (age 11)
Key stage 5 destinations only include those who enter A levels or other level 3 qualifications, so few
students with low prior attainment at age 11 are included. Such students who have undertaken level 3
study are not typical, and may have made above average progress during secondary school. Nonetheless,
achievement at 11 remains a clear predictor of a student’s likelihood of progressing successfully to
education or employment destinations after key stage 5.
Of those who had high prior attainment in reading, writing and maths assessments at the end of primary
school, 92% stayed in education or employment for at least two terms after key stage 5, compared to 83%
of those who entered level 3 qualifications but had been low prior attainers at age 11.
Page 30 of 44
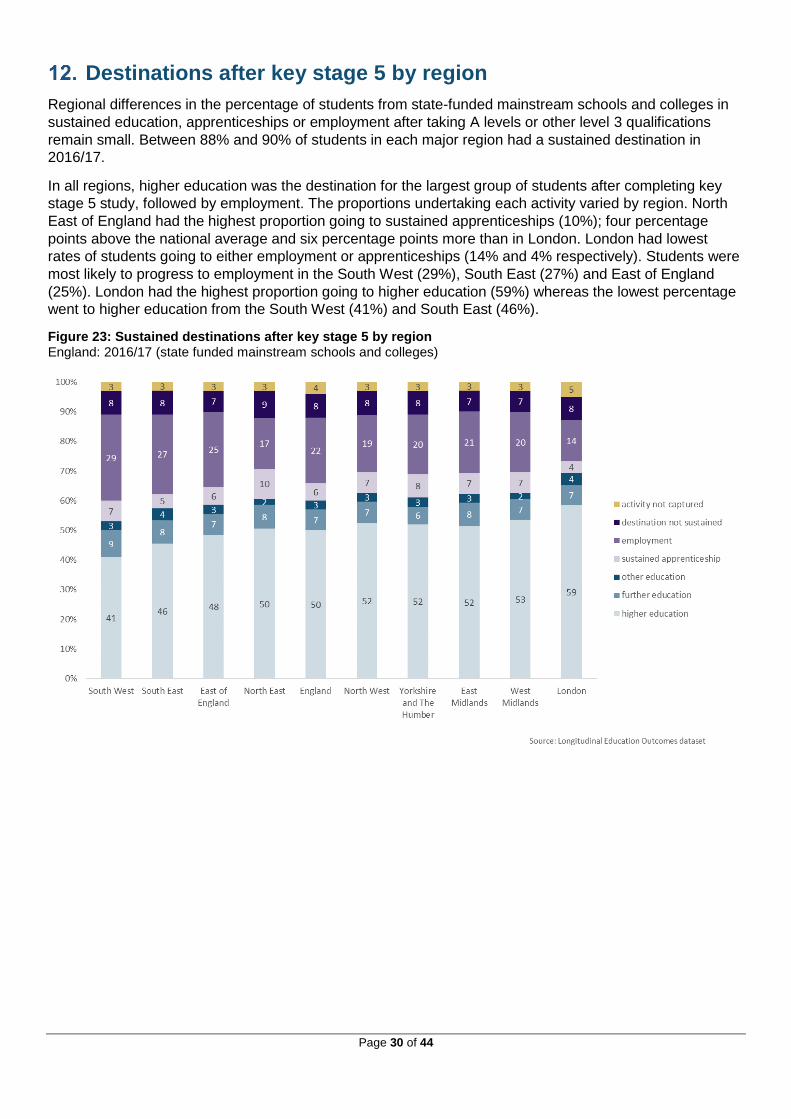
Destinations after key stage 5 by region
Regional differences in the percentage of students from state-funded mainstream schools and colleges in
sustained education, apprenticeships or employment after taking A levels or other level 3 qualifications
remain small. Between 88% and 90% of students in each major region had a sustained destination in
2016/17.
In all regions, higher education was the destination for the largest group of students after completing key
stage 5 study, followed by employment. The proportions undertaking each activity varied by region. North
East of England had the highest proportion going to sustained apprenticeships (10%); four percentage
points above the national average and six percentage points more than in London. London had lowest
rates of students going to either employment or apprenticeships (14% and 4% respectively). Students were
most likely to progress to employment in the South West (29%), South East (27%) and East of England
(25%). London had the highest proportion going to higher education (59%) whereas the lowest percentage
went to higher education from the South West (41%) and South East (46%).
Figure 23: Sustained destinations after key stage 5 by region England: 2016/17 (state funded mainstream schools and colleges)
Page 31 of 44
Student destinations after KS5 by institution type
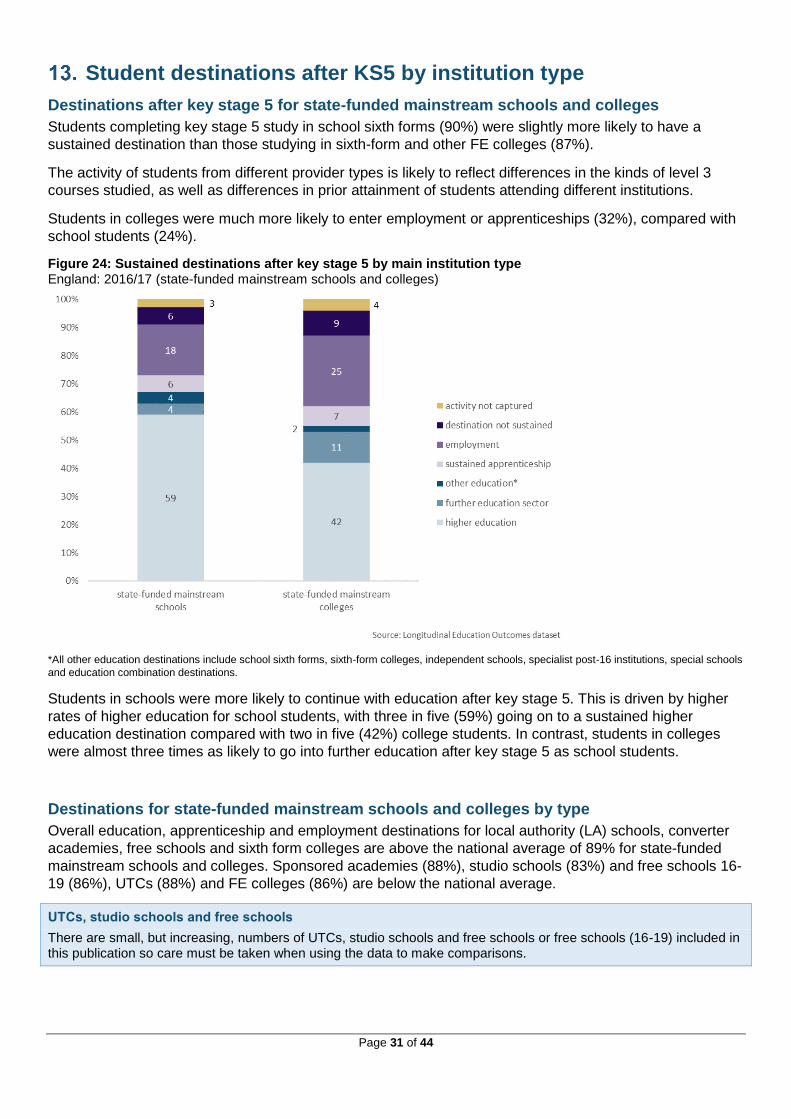
Destinations after key stage 5 for state-funded mainstream schools and colleges
Students completing key stage 5 study in school sixth forms (90%) were slightly more likely to have a
sustained destination than those studying in sixth-form and other FE colleges (87%).
The activity of students from different provider types is likely to reflect differences in the kinds of level 3
courses studied, as well as differences in prior attainment of students attending different institutions.
Students in colleges were much more likely to enter employment or apprenticeships (32%), compared with
school students (24%).
Figure 24: Sustained destinations after key stage 5 by main institution type England: 2016/17 (state-funded mainstream schools and colleges)
*All other education destinations include school sixth forms, sixth-form colleges, independent schools, specialist post-16 institutions, special schools
and education combination destinations.
Students in schools were more likely to continue with education after key stage 5. This is driven by higher
rates of higher education for school students, with three in five (59%) going on to a sustained higher
education destination compared with two in five (42%) college students. In contrast, students in colleges
were almost three times as likely to go into further education after key stage 5 as school students.
Destinations for state-funded mainstream schools and colleges by type
Overall education, apprenticeship and employment destinations for local authority (LA) schools, converter
academies, free schools and sixth form colleges are above the national average of 89% for state-funded
mainstream schools and colleges. Sponsored academies (88%), studio schools (83%) and free schools 16-
19 (86%), UTCs (88%) and FE colleges (86%) are below the national average.
UTCs, studio schools and free schools
There are small, but increasing, numbers of UTCs, studio schools and free schools or free schools (16-19) included in this publication so care must be taken when using the data to make comparisons.
Page 32 of 44
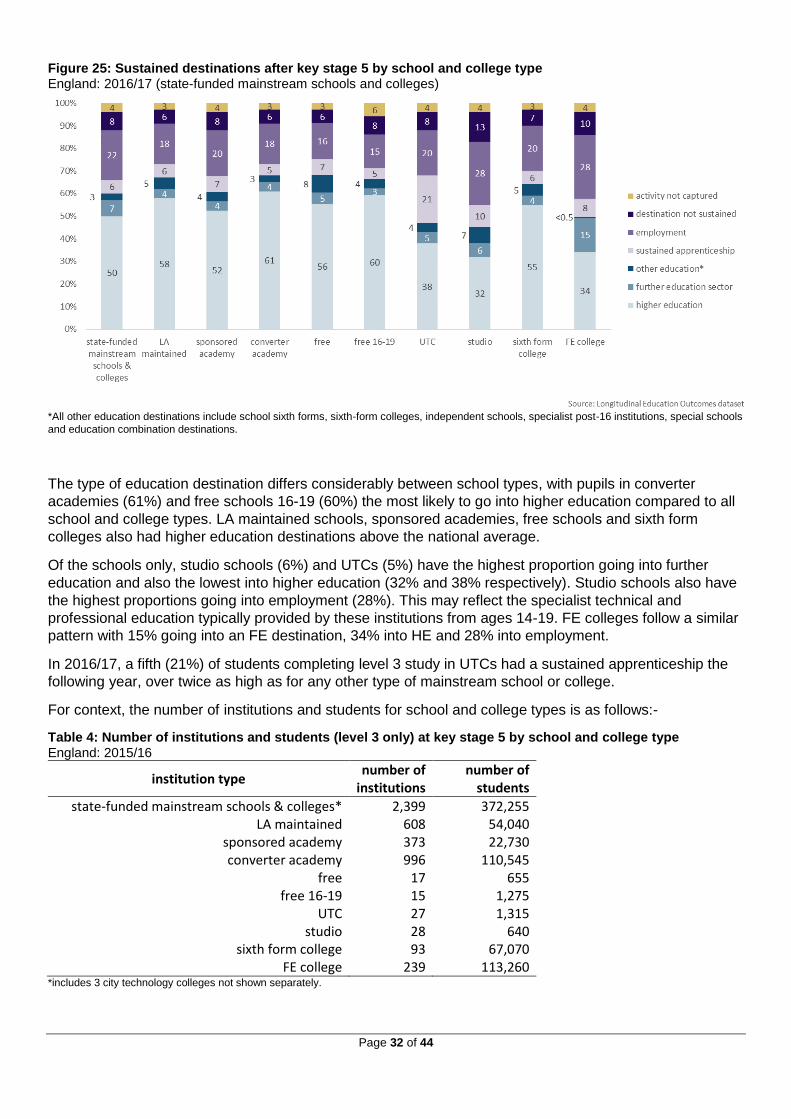
Figure 25: Sustained destinations after key stage 5 by school and college type England: 2016/17 (state-funded mainstream schools and colleges)
*All other education destinations include school sixth forms, sixth-form colleges, independent schools, specialist post-16 institutions, special schools
and education combination destinations.
The type of education destination differs considerably between school types, with pupils in converter
academies (61%) and free schools 16-19 (60%) the most likely to go into higher education compared to all
school and college types. LA maintained schools, sponsored academies, free schools and sixth form
colleges also had higher education destinations above the national average.
Of the schools only, studio schools (6%) and UTCs (5%) have the highest proportion going into further
education and also the lowest into higher education (32% and 38% respectively). Studio schools also have
the highest proportions going into employment (28%). This may reflect the specialist technical and
professional education typically provided by these institutions from ages 14-19. FE colleges follow a similar
pattern with 15% going into an FE destination, 34% into HE and 28% into employment.
In 2016/17, a fifth (21%) of students completing level 3 study in UTCs had a sustained apprenticeship the
following year, over twice as high as for any other type of mainstream school or college.
For context, the number of institutions and students for school and college types is as follows:-
Table 4: Number of institutions and students (level 3 only) at key stage 5 by school and college type England: 2015/16
institution type number of
institutions number of
students
state-funded mainstream schools & colleges* 2,399 372,255
LA maintained 608 54,040
sponsored academy 373 22,730
converter academy 996 110,545
free 17 655
free 16-19 15 1,275
UTC 27 1,315
studio 28 640
sixth form college 93 67,070
FE college 239 113,260 *includes 3 city technology colleges not shown separately.
Page 33 of 44
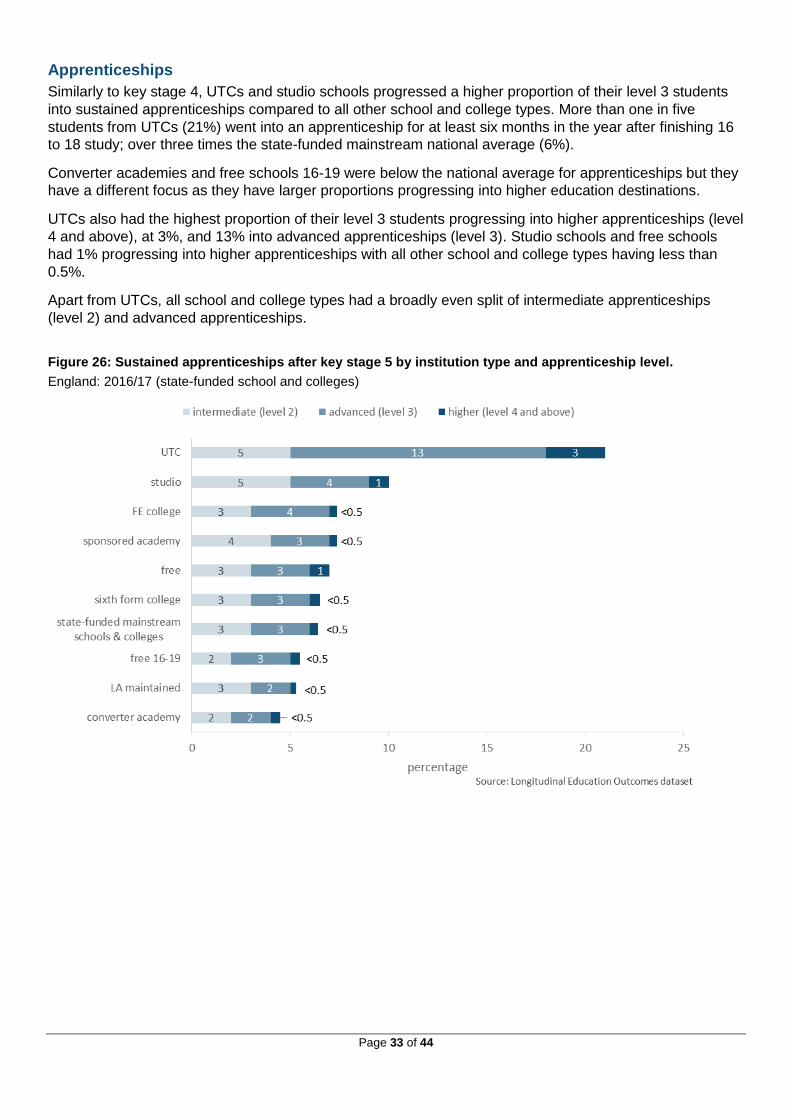
Apprenticeships
Similarly to key stage 4, UTCs and studio schools progressed a higher proportion of their level 3 students
into sustained apprenticeships compared to all other school and college types. More than one in five
students from UTCs (21%) went into an apprenticeship for at least six months in the year after finishing 16
to 18 study; over three times the state-funded mainstream national average (6%).
Converter academies and free schools 16-19 were below the national average for apprenticeships but they
have a different focus as they have larger proportions progressing into higher education destinations.
UTCs also had the highest proportion of their level 3 students progressing into higher apprenticeships (level
4 and above), at 3%, and 13% into advanced apprenticeships (level 3). Studio schools and free schools
had 1% progressing into higher apprenticeships with all other school and college types having less than
0.5%.
Apart from UTCs, all school and college types had a broadly even split of intermediate apprenticeships
(level 2) and advanced apprenticeships.
Figure 26: Sustained apprenticeships after key stage 5 by institution type and apprenticeship level.
England: 2016/17 (state-funded school and colleges)
Page 34 of 44
Disadvantage and interactions with other characteristics
Disadvantage and gender
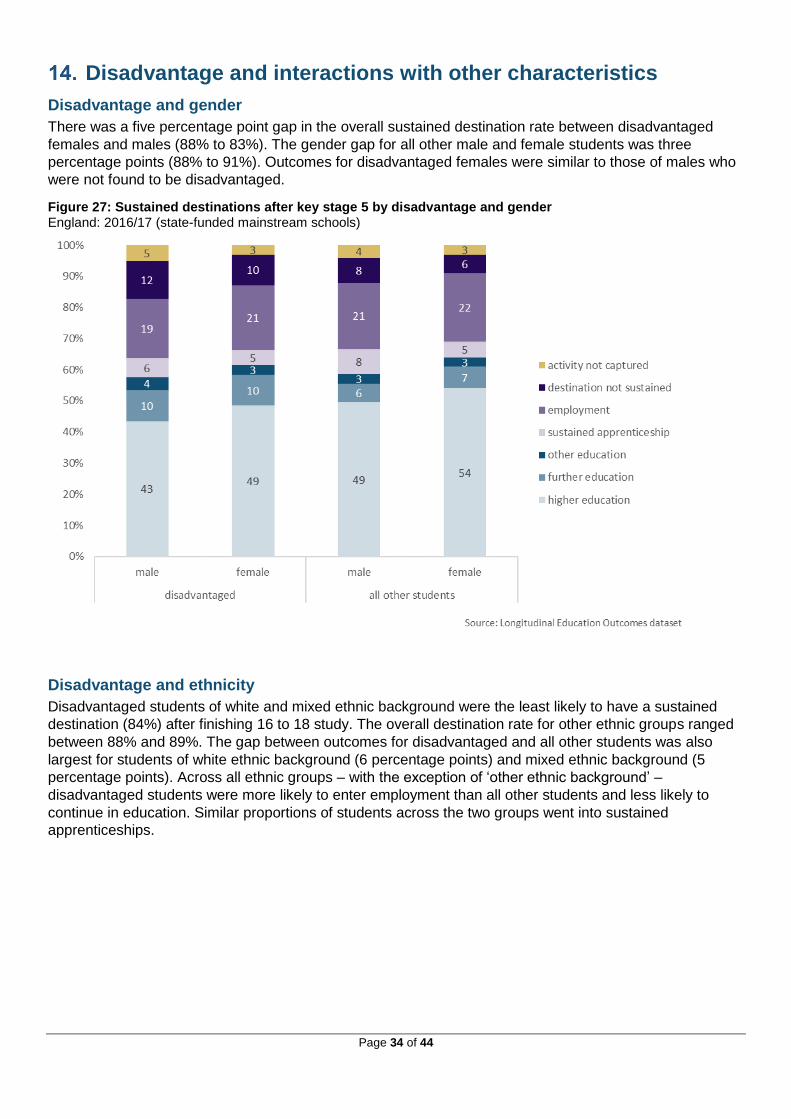
There was a five percentage point gap in the overall sustained destination rate between disadvantaged
females and males (88% to 83%). The gender gap for all other male and female students was three
percentage points (88% to 91%). Outcomes for disadvantaged females were similar to those of males who
were not found to be disadvantaged.
Figure 27: Sustained destinations after key stage 5 by disadvantage and gender England: 2016/17 (state-funded mainstream schools)
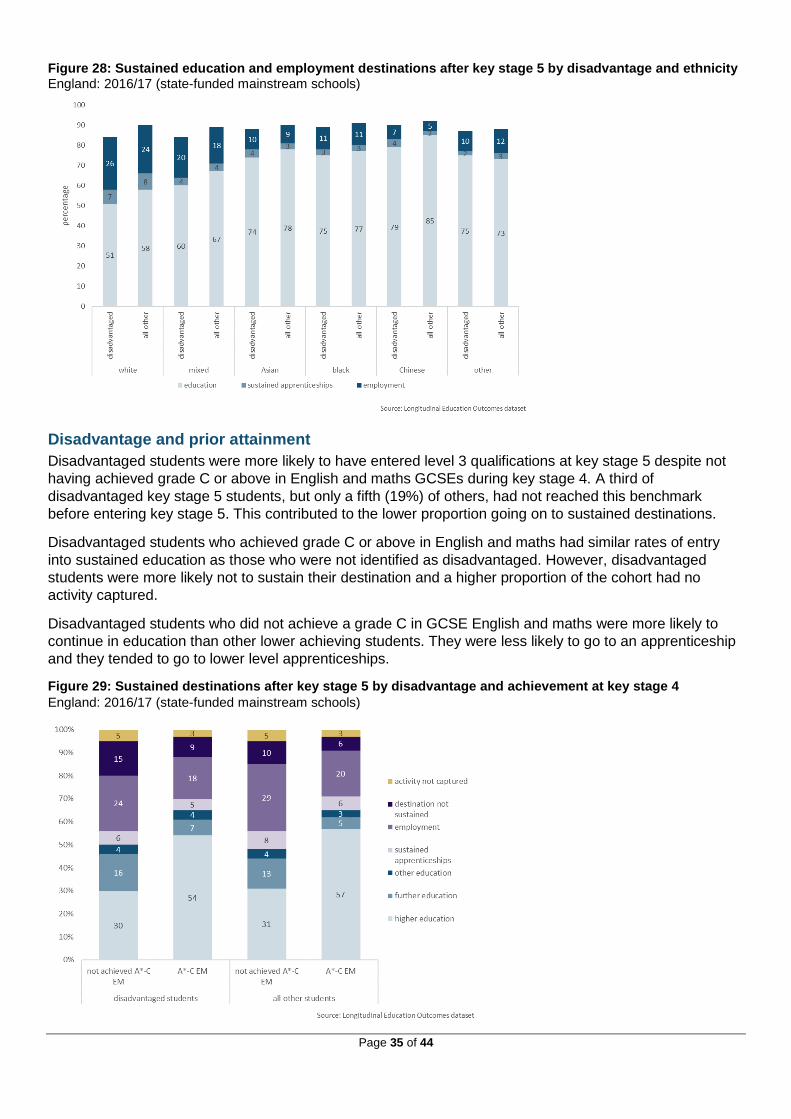
Disadvantage and ethnicity
Disadvantaged students of white and mixed ethnic background were the least likely to have a sustained
destination (84%) after finishing 16 to 18 study. The overall destination rate for other ethnic groups ranged
between 88% and 89%. The gap between outcomes for disadvantaged and all other students was also
largest for students of white ethnic background (6 percentage points) and mixed ethnic background (5
percentage points). Across all ethnic groups – with the exception of ‘other ethnic background’ –
disadvantaged students were more likely to enter employment than all other students and less likely to
continue in education. Similar proportions of students across the two groups went into sustained
apprenticeships.
Page 35 of 44
Figure 28: Sustained education and employment destinations after key stage 5 by disadvantage and ethnicity England: 2016/17 (state-funded mainstream schools)
Disadvantage and prior attainment
Disadvantaged students were more likely to have entered level 3 qualifications at key stage 5 despite not
having achieved grade C or above in English and maths GCSEs during key stage 4. A third of
disadvantaged key stage 5 students, but only a fifth (19%) of others, had not reached this benchmark
before entering key stage 5. This contributed to the lower proportion going on to sustained destinations.
Disadvantaged students who achieved grade C or above in English and maths had similar rates of entry
into sustained education as those who were not identified as disadvantaged. However, disadvantaged
students were more likely not to sustain their destination and a higher proportion of the cohort had no
activity captured.
Disadvantaged students who did not achieve a grade C in GCSE English and maths were more likely to
continue in education than other lower achieving students. They were less likely to go to an apprenticeship
and they tended to go to lower level apprenticeships.
Figure 29: Sustained destinations after key stage 5 by disadvantage and achievement at key stage 4
England: 2016/17 (state-funded mainstream schools)
Page 36 of 44
Destinations after key stage 5 for special schools
Very few students complete level 3 study at special schools, so the 16 to 18 cohort for this sector is small.
Students attending special schools who have entered A levels or other level 3 qualifications are likely not to
be typical of most special school students.
The proportion of students leaving special schools who went on to a sustained education destination was
72%. Most continued studying qualifications at level 3 or below (29%) while 22% continued in higher
education. The same proportion of special school students went to sustained apprenticeships as in
mainstream schools (6%).
Only 7% of special school students had a sustained employment destination, lower than for other providers,
and special school students were more likely to have a destination that was not sustained.
Page 37 of 44
Future developments
The schedule is as follows:
January
2019
Revision of key stage 4 and 5 institutional level data for inclusion on
school and college performance tables.
October
2019
Key stage 4 and 16 to 18 destination measures for 2017/18.
Including 16 to 18 students who studied approved level 2
qualifications (see experimental statistics)
Further information on level 4+ destinations
TBC Experimental statistics on longer term destinations after key stage 4
Accountability measures
From 2019, we will report destinations for students entering approved level 2 vocational qualifications
alongside destinations of level 3 students, starting with the students who completed 16 to 18 studies in
2017.
We are considering how further information on level of study, and level of apprenticeship, after key stage 4
or 16 to 18 study could be incorporated into destination measures.
The government has been clear that we want to see students progressing to both university and higher
level technical and vocational learning, including apprenticeships. We will work with the sector to consider
how we could better present destinations data to reinforce the equal importance of both academic and
vocational learning post 18.
We have published experimental statistics alongside this publication that set out high level information on
these topics.
Longitudinal picture
We published experimental statistics in 2017 showing destinations one and three years after key stage 4.
We intend to expand on this work in future to develop a better long-term picture of post-16 progression for
young people in English schools.
Data sources
We are continuing to work with other government departments and with analysts developing the
Longitudinal Education Outcomes dataset to improve the scope of activity that can be captured.
Strands under development include increasing the range of benefits and the quality of the employment
information, as well as linking to information on Scottish and Welsh schools and colleges. We are hopeful
that this will increase our coverage beyond 97% in future years and more fairly reflect the outcomes of
certain institutions.
Feedback
The department invites users to provide views on the methodology. Please direct all comments and queries
to the following email address: [email protected].
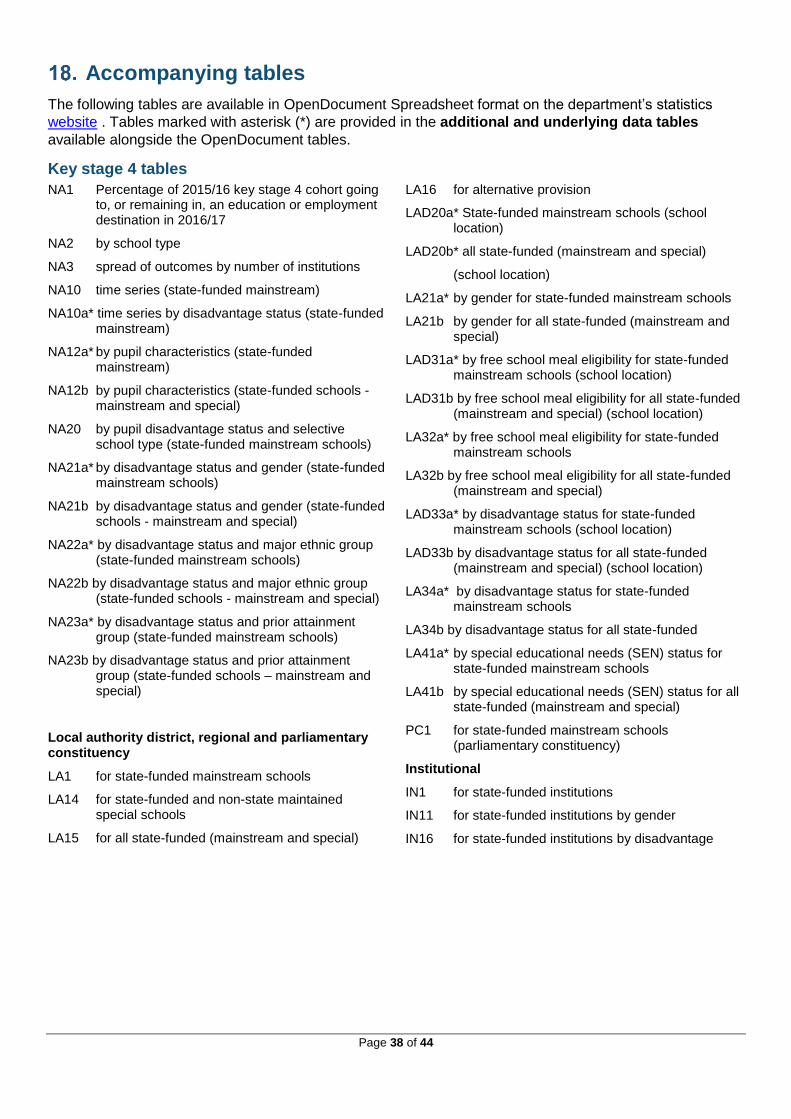
Page 38 of 44
Accompanying tables
The following tables are available in OpenDocument Spreadsheet format on the department’s statistics
website . Tables marked with asterisk (*) are provided in the additional and underlying data tables
available alongside the OpenDocument tables.
Key stage 4 tables
NA1 Percentage of 2015/16 key stage 4 cohort going to, or remaining in, an education or employment destination in 2016/17
NA2 by school type
NA3 spread of outcomes by number of institutions
NA10 time series (state-funded mainstream)
NA10a* time series by disadvantage status (state-funded mainstream)
NA12a* by pupil characteristics (state-funded mainstream)
NA12b by pupil characteristics (state-funded schools - mainstream and special)
NA20 by pupil disadvantage status and selective school type (state-funded mainstream schools)
NA21a* by disadvantage status and gender (state-funded mainstream schools)
NA21b by disadvantage status and gender (state-funded schools - mainstream and special)
NA22a* by disadvantage status and major ethnic group (state-funded mainstream schools)
NA22b by disadvantage status and major ethnic group (state-funded schools - mainstream and special)
NA23a* by disadvantage status and prior attainment group (state-funded mainstream schools)
NA23b by disadvantage status and prior attainment group (state-funded schools – mainstream and special)
Local authority district, regional and parliamentary constituency
LA1 for state-funded mainstream schools
LA14 for state-funded and non-state maintained special schools
LA15 for all state-funded (mainstream and special)
LA16 for alternative provision
LAD20a* State-funded mainstream schools (school location)
LAD20b* all state-funded (mainstream and special)
(school location)
LA21a* by gender for state-funded mainstream schools
LA21b by gender for all state-funded (mainstream and special)
LAD31a* by free school meal eligibility for state-funded mainstream schools (school location)
LAD31b by free school meal eligibility for all state-funded (mainstream and special) (school location)
LA32a* by free school meal eligibility for state-funded mainstream schools
LA32b by free school meal eligibility for all state-funded (mainstream and special)
LAD33a* by disadvantage status for state-funded mainstream schools (school location)
LAD33b by disadvantage status for all state-funded (mainstream and special) (school location)
LA34a* by disadvantage status for state-funded mainstream schools
LA34b by disadvantage status for all state-funded
LA41a* by special educational needs (SEN) status for state-funded mainstream schools
LA41b by special educational needs (SEN) status for all state-funded (mainstream and special)
PC1 for state-funded mainstream schools (parliamentary constituency)
Institutional
IN1 for state-funded institutions
IN11 for state-funded institutions by gender
IN16 for state-funded institutions by disadvantage
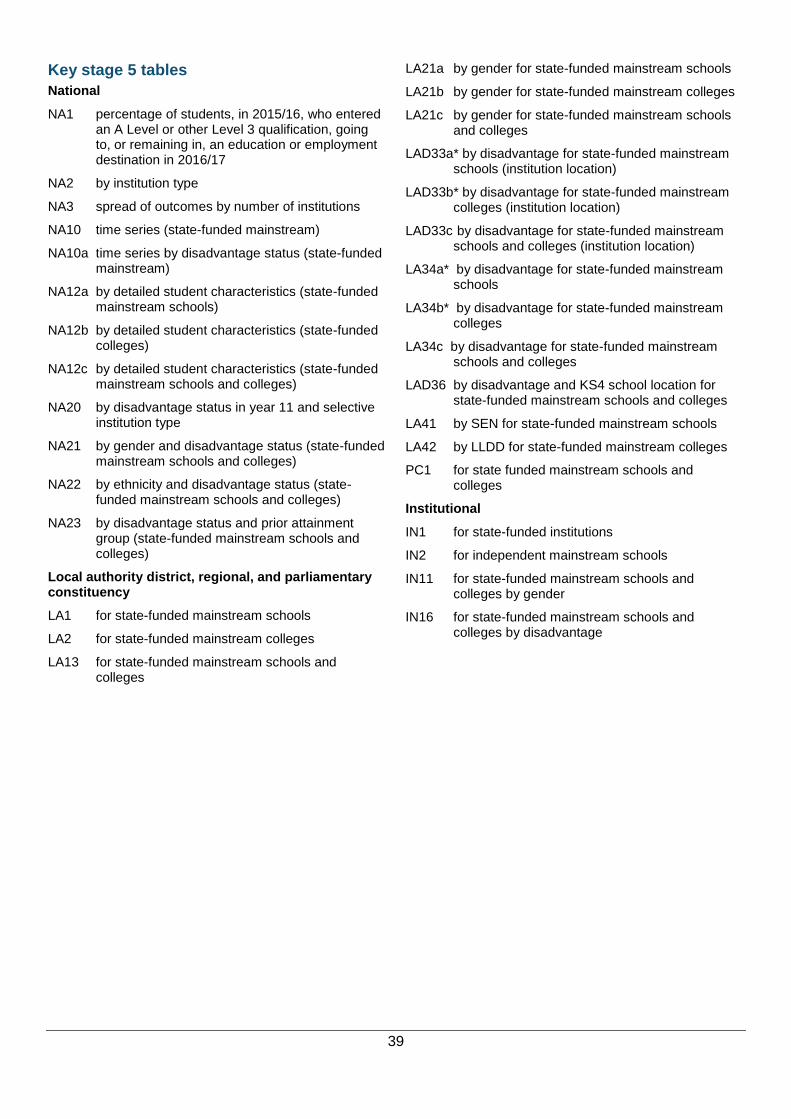
39
Key stage 5 tables
National
NA1 percentage of students, in 2015/16, who entered an A Level or other Level 3 qualification, going to, or remaining in, an education or employment destination in 2016/17
NA2 by institution type
NA3 spread of outcomes by number of institutions
NA10 time series (state-funded mainstream)
NA10a time series by disadvantage status (state-funded mainstream)
NA12a by detailed student characteristics (state-funded mainstream schools)
NA12b by detailed student characteristics (state-funded colleges)
NA12c by detailed student characteristics (state-funded mainstream schools and colleges)
NA20 by disadvantage status in year 11 and selective institution type
NA21 by gender and disadvantage status (state-funded mainstream schools and colleges)
NA22 by ethnicity and disadvantage status (state-funded mainstream schools and colleges)
NA23 by disadvantage status and prior attainment group (state-funded mainstream schools and colleges)
Local authority district, regional, and parliamentary constituency
LA1 for state-funded mainstream schools
LA2 for state-funded mainstream colleges
LA13 for state-funded mainstream schools and colleges
LA21a by gender for state-funded mainstream schools
LA21b by gender for state-funded mainstream colleges
LA21c by gender for state-funded mainstream schools and colleges
LAD33a* by disadvantage for state-funded mainstream schools (institution location)
LAD33b* by disadvantage for state-funded mainstream colleges (institution location)
LAD33c by disadvantage for state-funded mainstream schools and colleges (institution location)
LA34a* by disadvantage for state-funded mainstream schools
LA34b* by disadvantage for state-funded mainstream colleges
LA34c by disadvantage for state-funded mainstream schools and colleges
LAD36 by disadvantage and KS4 school location for state-funded mainstream schools and colleges
LA41 by SEN for state-funded mainstream schools
LA42 by LLDD for state-funded mainstream colleges
PC1 for state funded mainstream schools and colleges
Institutional
IN1 for state-funded institutions
IN2 for independent mainstream schools
IN11 for state-funded mainstream schools and colleges by gender
IN16 for state-funded mainstream schools and colleges by disadvantage
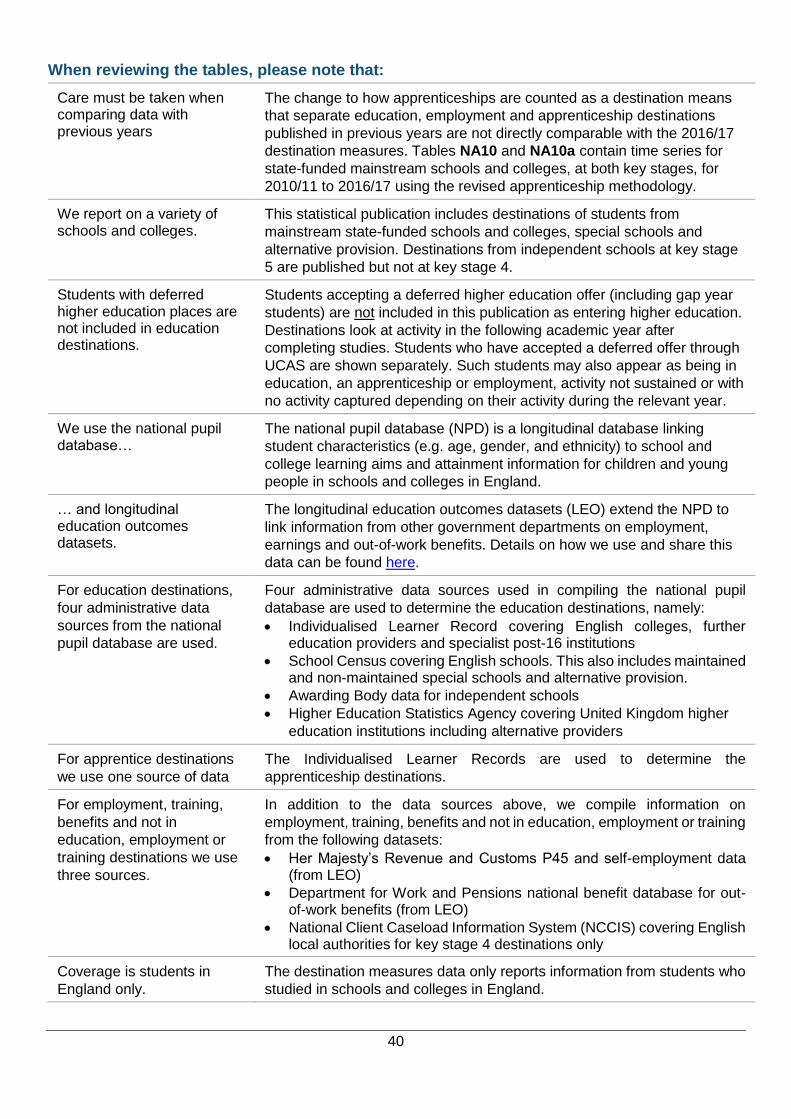
40
When reviewing the tables, please note that:
Care must be taken when comparing data with previous years
The change to how apprenticeships are counted as a destination means
that separate education, employment and apprenticeship destinations
published in previous years are not directly comparable with the 2016/17
destination measures. Tables NA10 and NA10a contain time series for
state-funded mainstream schools and colleges, at both key stages, for
2010/11 to 2016/17 using the revised apprenticeship methodology.
We report on a variety of schools and colleges.
This statistical publication includes destinations of students from
mainstream state-funded schools and colleges, special schools and
alternative provision. Destinations from independent schools at key stage
5 are published but not at key stage 4.
Students with deferred higher education places are not included in education destinations.
Students accepting a deferred higher education offer (including gap year
students) are not included in this publication as entering higher education.
Destinations look at activity in the following academic year after
completing studies. Students who have accepted a deferred offer through
UCAS are shown separately. Such students may also appear as being in
education, an apprenticeship or employment, activity not sustained or with
no activity captured depending on their activity during the relevant year.
We use the national pupil database…
The national pupil database (NPD) is a longitudinal database linking
student characteristics (e.g. age, gender, and ethnicity) to school and
college learning aims and attainment information for children and young
people in schools and colleges in England.
… and longitudinal education outcomes datasets.
The longitudinal education outcomes datasets (LEO) extend the NPD to
link information from other government departments on employment,
earnings and out-of-work benefits. Details on how we use and share this
data can be found here.
For education destinations,
four administrative data
sources from the national
pupil database are used.
Four administrative data sources used in compiling the national pupil
database are used to determine the education destinations, namely:
Individualised Learner Record covering English colleges, further education providers and specialist post-16 institutions
School Census covering English schools. This also includes maintained and non-maintained special schools and alternative provision.
Awarding Body data for independent schools
Higher Education Statistics Agency covering United Kingdom higher
education institutions including alternative providers
For apprentice destinations
we use one source of data
The Individualised Learner Records are used to determine the
apprenticeship destinations.
For employment, training,
benefits and not in
education, employment or
training destinations we use
three sources.
In addition to the data sources above, we compile information on
employment, training, benefits and not in education, employment or training
from the following datasets:
Her Majesty’s Revenue and Customs P45 and self-employment data (from LEO)
Department for Work and Pensions national benefit database for out-of-work benefits (from LEO)
National Client Caseload Information System (NCCIS) covering English local authorities for key stage 4 destinations only
Coverage is students in
England only.
The destination measures data only reports information from students who
studied in schools and colleges in England.
41
We preserve confidentiality. The Code of Practice for Official Statistics requires we take reasonable
steps to ensure that our published or disseminated statistics protect
confidentiality.
We only show outcomes for
groups of 11 or more.
At institution, local and national level, we do not show any outcomes for a
group of 10 or fewer students in total.
We suppress small counts. Both counts and percentages showing any outcome that relates to 1 or 2
individuals, or that reveals that 0 students were counted in employment,
are suppressed.
We make sure these cannot
be easily calculated by
concealing other numbers.
Where a figure relating to a small count could be calculated by
differencing from a total, another value has been suppressed to protect
this figure.
We round some numbers. To preserve anonymity, we show national and local authority pupil
numbers to the nearest 5. As a result of suppression and rounding, totals
in text and in tables may not always equal the sum of their component
parts.
We adopt symbols to help
identify omitted and rounded
numbers.
Symbols are used in the tables as follows: ( 0 ) where any number is shown as 0, the original figure was zero ( x ) suppressed to preserve confidentiality, for example a small number or where a percentage is based on a small number ( . ) not applicable ( - ) positive % less than 0.5 ( * ) 0,1 or 2 suppressed in UCAS data only
Further information
These measures are part of
school and college
performance tables.
Provisional school destination measures are included in the 2018 key
stage 4 and 16-18 performance tables.
Compare school and College Performance
Please see our 2018 statement of intent.
This publication uses data
from 2010/11 to 2013/14 that
was released with two
statistical working papers.
Two statistical working papers showing that data from the Longitudinal
Education Outcomes dataset substantially improves coverage of key
stage 5 destinations measures.
The first paper includes information on improvements to coverage for
different student characteristic groups in 2013/14.
Detailed information about changes to our methodology is available in this
publication.
Improvements to destinations of key stage 5 students: 2014
The second includes information about change over time from 2010/11 to
2013/14.
Improvements to destinations of key stage 5 students: time series
Previously published figures
are still available.
Revised statistics for 2014/15 were published in January 2017.
Destination measures that exclude the Department for Work and
Pensions and Her Majesty’s Revenue and Customs data are available on
42
gov.uk for the years 2009/10 – 2013/14. Detailed quality and methodology
information is published alongside the Destination measures publications.
Statistics: destinations of key stage 4 and key stage 5 pupils
For some related
publications
Experimental statistics on employment and earnings outcomes of higher
education graduates using the LEO dataset:
Employment and Earnings Outcomes of Higher Education Graduates:
Experimental Data from the Longitudinal Education Outcomes (LEO)
Dataset
Adult further education outcome-based success measures statistical first
release is published here:
Adult further education outcome-based success measures
Participation in Education, Training and Employment by 16-18 year olds
statistical first release is published here:
DfE Participation in Education, Training and Employment
Widening Participation Measures are published at:
Widening Participation in Higher Education
On how we use and share
the data
Non-statutory guidance from the Department for Education to describe
how we share and use education, employment and benefit claims
information for research and statistical purposes:
Longitudinal education outcomes study: how we use and share data
Official Statistics
These are Official Statistics and have been produced in line with Code of Practice for Official Statistics.
This can be broadly interpreted to mean that the statistics:
meet identified user needs
are well explained and readily accessible
are produced according to sound methods
are managed impartially and objectively in the public interest
The Department has a set of statistical policies in line with the Code of Practice for Official Statistics.
Technical information
A quality and methodology information document accompanies this publication. This provides further
information on the data sources, their coverage and quality and explains the methodology used in
producing the data, including how it is validated and processed.
Our detailed quality and methodology information is available on gov.uk
43
Get in touch
Media enquiries
Press Office News Desk, Department for Education, Sanctuary Buildings, Great Smith Street, London
SW1P 3BT
Tel: 020 7783 8300
Other enquiries/feedback
Stephen Harris, Education Data Division, Department for Education, Piccadilly Gate, Store Street,
Manchester, M1 2WD
Tel: 0161 600 1595 Email: [email protected]
© Crown copyright 2018
This publication (not including logos) is licensed under the terms of the
Open Government Licence v3.0 except where otherwise stated. Where
we have identified any third party copyright information you will need to
obtain permission from the copyright holders concerned.
To view this licence:
visit www.nationalarchives.gov.uk/doc/open-government-licence/version/3
email [email protected]
write to Information Policy Team, The National Archives, Kew, London, TW9 4DU
About this publication:
Stephen Harris, Education Data Division, Department for Education, Piccadilly Gate, Store Street,
Manchester, M1 2WD.
Telephone: 0161 600 1595 Email: [email protected]
https://www.gov.uk/government/collections/statistics-destinations
Reference: Destinations of KS4 and KS5 pupils: 2017
Follow us on Twitter: @educationgovuk
Like us on Facebook: facebook.com/educationgovuk
Top Related