


Languages
Pages
Legal


Sravanthi et al., IJPSR, 2021; Vol. 12(7): 4011-4024. E-ISSN: 0975-8232; P-ISSN: 2320-5148
International Journal of Pharmaceutical Sciences and Research 4011
IJPSR (2021), Volume 12, Issue 7 (Research Article)
Received on 06 May 2021; received in revised form, 14 June 2021; accepted, 16 June 2021; published 01 July 2021
DESIGN AND EVALUATION OF ZERO-ORDER DRUG-RELEASING RIVASTIGMINE
TRANSDERMAL SYSTEM
Sravanthi Anampally * 1
, Sunitha Reddy M 2 and Jaswanth A
3
Natco Pharma Limited 1, Kothur Ranga Reddy, Hyderabad - 509228, Telangana, India.
Centre for Pharmaceutical Sciences 2, Institute of Science and Technology, JNTU-H2, Kukatpally,
Hyderabad - 500072, Telangana, India.
Surabhi Dayakar Rao College of Pharmacy 3, Gajwel, Siddipet - 502278, Telangana, India.
ABSTRACT: Rivastigmine is used for the treatment of mild to moderate
dementia of the Alzheimer’s type. Transdermal delivery of Rivastigmine is
preferable to improve gastrointestinal tolerability. A novel transdermal
system with zero-order release kinetics was developed following a hybrid
technique in a combination of the micro reservoir and adhesive dispersion
system. The transdermal system was prepared by incorporating rivastigmine
in adhesive matrix layer in which rivastigmine-loaded microspheres were
dispersed. Microspheres were prepared by spray drying using poly-e-
caprolactone and maltodextrin (1:1 ratio) as carriers in various drug: polymer
ratios. Microspheres with1:2 drug: polymer ratio (A1) showed desired
particle size, yield, assay and in-vitro drug release and were found to be
suitable for designing the transdermal system. A1 was dispersed into silicon
adhesive layer during the preparation of the patch with a calculated amount
of rivastigmine. Transdermal patch with 18 mg rivastigmine was optimized
by evaluating ratios of adhesive matrix and microsphere content following
DOE where 13 formulations were evaluated for various physical and
chemical properties. 5 among 13 formulations were found to be satisfactory
and subjected for in-vitro drug release studies. 4 among 5 formulations have
shown satisfactory drug release; hence, they were also subjected for ex-vivo
permeation studies. In-vitro release kinetic data and ex-vivo permeation data
resulted best with the formulation comprising 150 mg of silicon adhesive
containing 11.33 mg of Rivastigmine and 20 mg of microspheres containing
6.67 mg of rivastigmine (F5). F5 was subjected for stability as per ICH
guidelines and was found stable up to six months at accelerated conditions.
INTRODUCTION: Rivastigmine is a parasym-
pathomimetic agent or cholinergic agent used in the
treatment of mild to moderate dementia of the
Alzheimer’s type.
QUICK RESPONSE CODE
DOI: 10.13040/IJPSR.0975-8232.12(7).4011-24
This article can be accessed online on www.ijpsr.com
DOI link: http://dx.doi.org/10.13040/IJPSR.0975-8232.12(7).4011-24
Rivastigmine is a cholinesterase inhibitor that acts
by inhibiting both butyrylcholinesterase and
acetylcholinesterase 1-3
. Alzheimer’s disease a
progressive brain disorder that decreases the
patient’s mental ability and causes loss of mental,
behavioural, functional, and learning abilities 4.
The first cholinesterase inhibitor approved as a
transdermal patch was the rivastigmine transdermal
patch. The pharmacokinetic profile of rivastigmine
transdermal patch from the clinical data suggested
that smooth and continuous drug delivery translates
Keywords:
Rivastigmine, Alzheimer’s disease,
Maltodextrin, Polycaprolactone,
Microspheres, Transdermal System.
Correspondence to Author:
Mrs. Sravanthi Anampally
Officer,
Department of QA Trainings,
Natco Pharma Limited, Kothur, Ranga
Reddy District, Hyderabad - 509228,
Telangana, India.
E-mail: [email protected]

Sravanthi et al., IJPSR, 2021; Vol. 12(7): 4011-4024. E-ISSN: 0975-8232; P-ISSN: 2320-5148
International Journal of Pharmaceutical Sciences and Research 4012
into improved tolerability profile compared with
the oral administration 5, 6
. Additional benefits
include improved adherence, increased
convenience, ease of use, and a reduced impact on
daily activities. Gastrointestinal adverse effects
were observed after oral administration of
rivastigmine owing to rapidly achieved maximum
concentrations in the CNS 7-10
.
A zero-order drug release from rivastigmine patch
provides a stable concentration of the drug in the
CNS, thus improves gastrointestinal tolerability,
and thus, maximum therapeutic dose can be
administered. Trans-dermal drug delivery systems
are extensively recognized ways of drug delivery
and are used in the treatment of various diseases
and disorders. Controlled release transdermal
formulations may offer stable systemic drug level
concentrations avoiding first-pass metabolism and
improved bioavailability. Therapeutic benefits of
trans dermal systems reflected higher marketing
potential. The utilization of transdermal drug
delivery systems improves treatment, especially in
the treatment of Alzheimer’s disorder. Various
transdermal formulations were successfully
developed with the drugs of therapeutic category
like anaesthetics, anti-inflammatory agents and
hormones, etc. In this research, an attempt was
made to develop a controlled release transdermal
system of rivastigmine following a novel method of
designing a transdermal patch.
MATERIALS AND METHODS:
Materials: Rivastigmine USP (free base) was
received as a gift sample from Aarti Chemicals,
Mumbai, India. Poly-e-caprolactone of (Mw
14000) was procured from Sigma Aldrich,
Germany. Vitamin-E TPGS USP-NF grade was
procured from BASF, Germany. Maltodextrin
(Glucidex IT17) of USP-NF grade was procured
form Roquette Pharma, France. Sodium
metabisulfite of Ph. Eur. grade was procured from
Merck India. Aluminum vapor-coated pigmented
polyethylene polyester backing membrane (3M
Scotchpack 1109) and Fluoropolyester coated
release liner (3M Scotchpack 9744) were received
as gifts samples from 3M Corporation, USA.
Silicon adhesive USP-NF grade (7-4302 BIOPSA)
was procured from DOW Corning, USA. Solvents
like methanol, ethyl acetate, heptane, and
dichloromethane of HPLC grade were procured
from Merck, India. Ethanol 99.9% was procured
from fisher scientific, India.
Methods: A novel controlled transdermal release
system was developed with the aim of zero-order
release kinetics, which was a combination of micro
reservoir system and adhesive dispersion system.
The novel transdermal system development was
done in two steps.
Preparation of Rivastigmine Loaded
Microspheres:
Preparation of Transdermal System: by
incorporating rivastigmine drug in adhesive matrix
layer which was dispersed with rivastigmine
microspheres.
Preparation of Rivastigmine Microspheres: The
spray drying technique was used to prepare
rivastigmine microspheres where poly-e-
caprolactone and maltodextrin (in 1:1 ratio) are
used as polymeric drug carriers. Different ratios of
drug to polymer were used to prepare the
microspheres, i.e., 1:2, 1:4, 1:6, 1:8, 1:10 & 1:12.
The preparation was initiated by dissolving poly-e-
caprolactone in methanol, maltodextrin, vitamin-E
TPGS, and sodium metabisulfite in water and
rivastigmine in ethanol. Thus three clear solutions
were homogenized (Kinematica® Polytron PT
3100D) at 3000 rpm where an opaque dispersion
appeared.
Then the homogenized mixture was spray-dried to
form microspheres in a spray drier of 4 inches
internal diameter chamber (JISL, LSD-48) at a flow
rate of 2.5 mL to 3.0 mL per min using 1 mm spray
nozzle maintaining inlet temperature, outlet
temperature, and product temperature at 110 °C to
120 °C, 60 °C to 70 °C and below 55 °C
respectively. The atomization pressure was
maintained at 30 ± 3 PSI and aspiration rate of -140
mmwc (1400 rpm and in the machine). The dried
microspheres were collected sealed in glass
containers and were stored in desiccators until
analysis 11, 12
. The composition of microspheres is
presented in Table 1.
Evaluation of Rivastigmine Loaded
Microspheres: The prepared rivastigmine
microspheres were evaluated for various physical,
chemical and drug release parameters. The methods
used for the evaluation were explained below.
Sravanthi et al., IJPSR, 2021; Vol. 12(7): 4011-4024. E-ISSN: 0975-8232; P-ISSN: 2320-5148
International Journal of Pharmaceutical Sciences and Research 4013
Description and Appearance of Microspheres: Optical microscopy was used to evaluate the
description of rivastigmine microspheres, where the
microspheres were analyzed for their spherical
appearance and existence as separate entities.
Particle Size Distribution Analysis: Optical
microscopy was used to determine the particle size
of rivastigmine microspheres 13
. The average size
and size distribution of rivastigmine microspheres
was determined using an optical microscope
(Olympus CX21i) fitted with an eyepiece
micrometer which was pre-calibrated using a stage
micrometer. The mean diameter was calculated
after evaluating the size of 100 microspheres.
Mean particle size = (Σ (Mean particle size X Weight
fraction) / (Σ(Weight Fraction)
Surface Morphology by Scanning Electron
Microscopy: A scanning electron microscope
(Zeiss Sigma HDVP, Switzerland) was used to
evaluate the surface morphology of rivastigmine
microspheres. Small quantities (5 to 10 mg) of
microsphere samples were dispersed on a standard
half-inch diameter by half-inch tall aluminium
SEM specimen mount stubs aided with double stick
carbon tape and were placed in the sputter coater
chamber. The chamber was ensured a vacuum of
0.08 mbar, and samples were coated with gold for
10 min. The processed samples were placed in an
SEM chamber and examined for surface
morphology by magnifying up to 1KX to 10KX at
EHT 15.0 kV.
Percentage Yield: The percentage yield of the
rivastigmine microspheres was calculated using the
weight of microspheres obtained in relation to the
sum of the weights of starting materials used for
the preparation of microspheres 14
.
% Yield = (The amount of microspheres obtained) / (The
theoretical amount of materials used × 100
Drug Content by Assay: Percentage drug content
in rivastigmine microspheres was determined by
extracting the drug from the microspheres where 10
mg equivalent rivastigmine microspheres were
taken in 25 mL volumetric flask to which 5 mL of
dichloromethane and 5 mL 1% v/v acetic acid was
added, and microspheres were allowed to
disintegrate completely, and then the volume was
adjusted to 25 mL with a solvent mixture of
Methanol: Acetonitrile (1:1 ratio). The solution was
sonicated for 15 min and was then filtered using
0.45-micron nylon filter. The filtered samples were
analyzed for drug content using HPLC.
Encapsulation Efficiency: The filter flush
technique was used to evaluate encapsulation
efficiency. 25 mg of rivastigmine equivalent
microspheres (weight compensated after the
determination of drug content by assay method)
were taken in a sintered glass filter covered with
zirconium beads of 0.5 mm and 1.0 mm diameter in
1:1 ratio by weight. 5 mL of ethanol was flushed
over the surface of the microsphere placed over the
beads, and the solvent was allowed to wash and
flow down. The filtrate was collected from the
bottom and evaluated for the free drug content
eluted in it by the HPLC method. Encapsulation
efficiency was determined by deducting free drug
content from actual drug content in microspheres
and dividing it with the actual drug content, and
multiplied with 100 15
.
% Encapsulation Efficiency = (Actual drug content-Free drug
content in eluent) / (Theoritical drug content) × 100
In-vitro Drug Release Studies: USP type II
dissolution apparatus was used to determine in-
vitro drug release from the rivastigmine
microspheres. 0.9% sodium chloride solution was
used as a medium, and the paddle speed was
maintained at 50 rpm. 25 mg drug equivalent
rivastigmine microspheres were filled in a size 1/
size 2 capsules and were inserted in USP-type
spiral sinker.
The capsule inserted into the sinker was dropped
into the dissolution media (0.9% sodium chloride
750 mL) before starting the agitation. The samples
were collected at three-time points i.e. at 1 h, 2 h
and 3 h. 5 mL of the sample was collected at each
time point and was filtered using 0.45 µ nylon filter
and was then analyzed for drug content using
HPLC.
Preparation of Transdermal Patches: Novel
zero-order release transdermal systems of
rivastigmine were developed by performing design
of experiment studies. Optimization of the
formulation was performed by using central
composite design in the application Statease Design
Expert® USA.

Sravanthi et al., IJPSR, 2021; Vol. 12(7): 4011-4024. E-ISSN: 0975-8232; P-ISSN: 2320-5148
International Journal of Pharmaceutical Sciences and Research 4014
Study Design:
Central Composite Design: Central composite
design was selected for the evaluation where the
selected design model was pre-evaluated for design
acceptability, and the design was executed in 13
runs 16-18
. The experiments were executed as per
the design runs generated by the tool where two
factors having three levels (0, ±1) of formulation
variables were considered i.e. X1: Silicon adhesive
(125 mg, 150 mg and 175 mg), X2: rivastigmine
loaded microsphere base (10 mg, 20 mg, and 30
mg). The influence of the selected variables was
evaluated on four critical responses, i.e., Y1
(Thickness), Y2 (Folding endurance), Y3 (Weight
of the patch content) & Y4 (In-vitro dissolution at
180 min). The selected responses were considered
for optimization and evaluated for design space
establishment. The details of the experiments
generated is mentioned in Table 2.
TABLE 1: THE COMPOSITION OF RIVASTIGMINE MICROSPHERES
Formulation
Code
Drug:
Polymer
Drug
(g)
Polymeric
carrier(g)
Total drug and
polymer mixture
Vitamin E
TPGS * (mg)
Sodium Meta Bisulfite *
(mg)
A1 1:2 0.9 1.8 2.7 6.75 6.75
A2 1:4 0.9 3.6 4.5 11.25 11.25
A3 1:6 0.9 5.4 6.3 15.75 15.75
A4 1:8 0.9 7.2 8.1 20.25 20.25
A5 1:10 0.9 9 9.9 24.75 24.75
A6 1:12 0.9 10.8 11.7 29.25 29.25
Note: *Vitamin E TPGS and Sodium Metabisulfite were incorporated at 0.25% concentration with respect to the weight of drug
and polymeric carrier mixture.
TABLE 2: DETAILS OF RIVASTIGMINE PATCH COMPOSITIONS EVALUATED USING CENTRAL
COMPOSITE DESIGN
Std. Run Factor X1: Silicon Adhesive (mg) Factor X2: Microsphere Base (mg)
1 1 150 20
6 2 175 20
13 3 150 20
4 4 150 10
5 5 150 20
10 6 125 20
3 7 125 10
11 8 125 30
12 9 175 30
9 10 175 10
8 11 150 20
7 12 150 20
2 13 150 30
Preparation of Transdermal Systems of
Rivastigmine: Drug containing adhesive layer was
prepared by mixing silicon adhesive with anti-
oxidant sodium metabisulfate, a part of API,
methanol, silicon oil, and heptane. To the above
clear solution weighed amount of microspheres
were added and mixed. Then above mixture was
cast over a backing membrane and dried for 24 h.
Then release liner was applied on the adhesive side,
and the system was cut into the suitable size 19
.
Evaluation of Microspheres Loaded Adhesive
Dispersion Patches:
General Appearance: The appearance and surface
integrity of the patches were observed with naked
eye.
Thickness: The thickness of the whole patch
including release liner was determined at six
different points using digital micrometer. The
thickness of the backing membrane and release
liner were measured before casting drug-containing
adhesive solution on to it 19
. The actual thickness of
the drug containing adhesive matrix was calculated
with the following formula:
Thickness of the Drug Containing Adhesive Matrix =
Thickness of the whole patch system-(Thickness of the
backing membrane + Thickness of the release liner)
Weight Variation: Six patches were selected
randomly and weighed individually on a semi-
micro balance (Sartorius TE-124, Germany), then

Sravanthi et al., IJPSR, 2021; Vol. 12(7): 4011-4024. E-ISSN: 0975-8232; P-ISSN: 2320-5148
International Journal of Pharmaceutical Sciences and Research 4015
the release liner and backing membrane (by
washing out the drug matrix with solvent) from
each patch system were separated and weighed
individually. The together weight of the release
liner and backing membrane was subtracted from
the whole weight of the patch system for obtaining
the drug matrix layer weight. Accordingly, after 6
determinations, the average weight of the patch was
calculated 19
.
Weight of the drug matrix layer = Weight of the whole patch
system - (weight of the backing membrane + Weight of the
release liner)
Determination of the Drug Content of the Patch:
A circular patch of 3.569 cm diameter or 3.163 cm
L × B having a surface area of 10 cm-2
was
extracted in 100 mL of ethanol. Then the solution
was filtered and analyzed by the RP-HPLC method
(Waters 2695, USA). Three replicate measurements
were performed for each formulation 19
.
Moisture Uptake Studies: The prepared patches
were evaluated for moisture absorbing capacity.
Six patches were selected randomly and weighed
individually, kept in a desiccator containing 100
mL of a saturated solution of aluminium chloride at
room temperature for 24 h which maintains the RH
of 79.5%. The patch was weighed periodically till it
showed a constant weight. % moisture uptake can
be calculated using the following formula 19
.
% Moisture up take = (Final weight of the patch-Initial weight
of the patch) / (Initial weight of the patch × 100
Moisture Content Determination: Six patches
from each formulation were selected and weighed
individually. Then release liners from each patch
were removed and weighed separately. The liner-
separated patches were spread on a mesh and were
kept in a desiccator containing anhydrous calcium
chloride at room temperature, the weight of each
patch was monitored after every 6 h till they
showed a constant weight. % moisture content was
determined using the following equation 19
.
% Moisture content = (Initial weight of the patch-Final
weight of the patch) / (Final weight of the patch × 100
Flatness: The flatness of the patch was determined
to evaluate the constriction behaviour of the patch
after application to the skin. The transdermal
patches were cut into the length of the longitudinal
strip of each strip was measured initially and after
keeping aside. Variation in the length of the patch
was determined using formula for % constriction.
Zero % constriction is equivalent to 100% flatness.
% Constriction = (Initial length of the patch-Final length of
the patch) / (Final length of the patch × 100
Folding Endurance: Folding endurance is a value
indicating the number of times the patch could be
folded at the same place without any crack/break.
Six patches of each formulation (2 cm × 2 cm)
were selected randomly and were folded in a
repeated manner at the same place till it broke. The
number of times the film was folded at the same
place without braking gave the folding endurance
value or folded up to 200 times if the patch does
not show any crack 19
.
Measurement of Mechanical Properties:
Mechanical properties of the patches were
evaluated using a fabricated tensile strength testing
apparatus shown in Fig. 1. A film strip with
dimensions of 60 × 10 mm was held in between
two clamps. Then weights were added to the pan
led to elongation of the patch. The force required
for breaking the patch is noted F 19
.
FIG. 1: FABRICATED INSTRUMENT TO DETERMINE
MECHANICAL PROPERTIES OF THE PATCH
Mechanical properties of the patch were calculated
using the following formulae.
Tensile Strength (kg/ mm^2 = (Force at break (kg)/ (Initial
cross sectional area of the sample (mm^2)
Elongation at break (% mm2) = (Increase in lenght (mm) /
(Original Length (mm) × 100 / (Cross sectional area)
Sravanthi et al., IJPSR, 2021; Vol. 12(7): 4011-4024. E-ISSN: 0975-8232; P-ISSN: 2320-5148
International Journal of Pharmaceutical Sciences and Research 4016
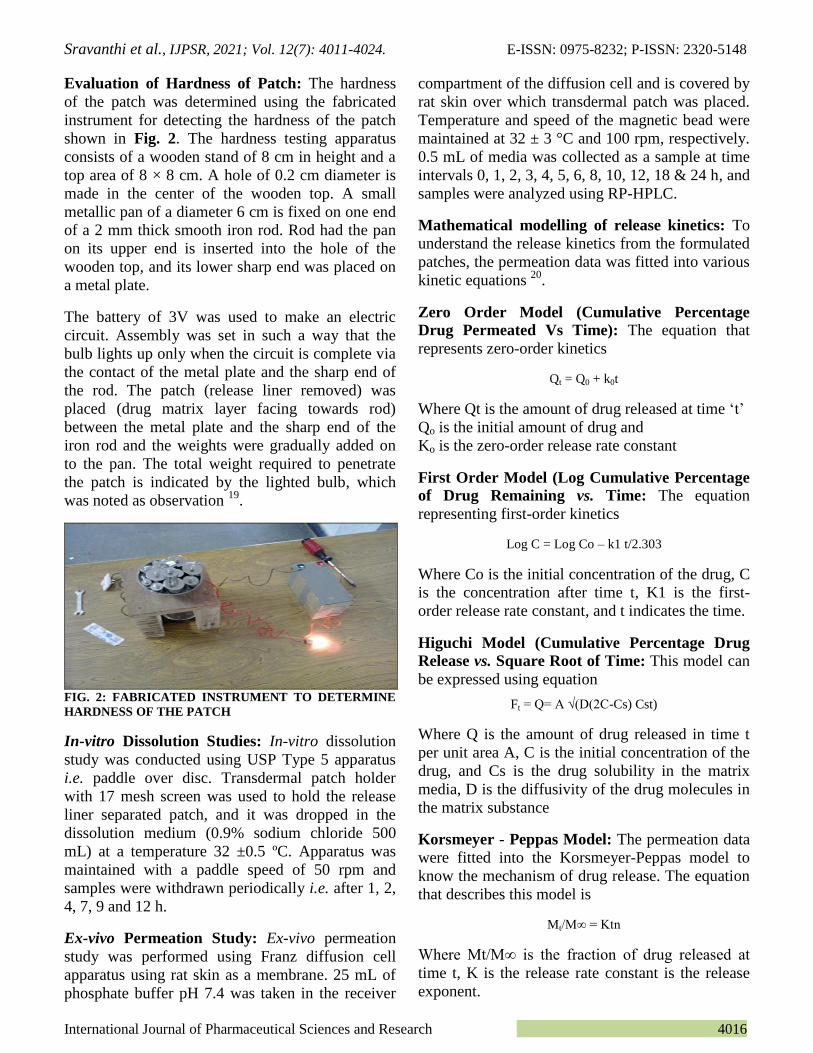
Evaluation of Hardness of Patch: The hardness
of the patch was determined using the fabricated
instrument for detecting the hardness of the patch
shown in Fig. 2. The hardness testing apparatus
consists of a wooden stand of 8 cm in height and a
top area of 8 × 8 cm. A hole of 0.2 cm diameter is
made in the center of the wooden top. A small
metallic pan of a diameter 6 cm is fixed on one end
of a 2 mm thick smooth iron rod. Rod had the pan
on its upper end is inserted into the hole of the
wooden top, and its lower sharp end was placed on
a metal plate.
The battery of 3V was used to make an electric
circuit. Assembly was set in such a way that the
bulb lights up only when the circuit is complete via
the contact of the metal plate and the sharp end of
the rod. The patch (release liner removed) was
placed (drug matrix layer facing towards rod)
between the metal plate and the sharp end of the
iron rod and the weights were gradually added on
to the pan. The total weight required to penetrate
the patch is indicated by the lighted bulb, which
was noted as observation 19
.
FIG. 2: FABRICATED INSTRUMENT TO DETERMINE
HARDNESS OF THE PATCH
In-vitro Dissolution Studies: In-vitro dissolution
study was conducted using USP Type 5 apparatus
i.e. paddle over disc. Transdermal patch holder
with 17 mesh screen was used to hold the release
liner separated patch, and it was dropped in the
dissolution medium (0.9% sodium chloride 500
mL) at a temperature 32 ±0.5 ºC. Apparatus was
maintained with a paddle speed of 50 rpm and
samples were withdrawn periodically i.e. after 1, 2,
4, 7, 9 and 12 h.
Ex-vivo Permeation Study: Ex-vivo permeation
study was performed using Franz diffusion cell
apparatus using rat skin as a membrane. 25 mL of
phosphate buffer pH 7.4 was taken in the receiver
compartment of the diffusion cell and is covered by
rat skin over which transdermal patch was placed.
Temperature and speed of the magnetic bead were
maintained at 32 ± 3 °C and 100 rpm, respectively.
0.5 mL of media was collected as a sample at time
intervals 0, 1, 2, 3, 4, 5, 6, 8, 10, 12, 18 & 24 h, and
samples were analyzed using RP-HPLC.
Mathematical modelling of release kinetics: To
understand the release kinetics from the formulated
patches, the permeation data was fitted into various
kinetic equations 20
.
Zero Order Model (Cumulative Percentage
Drug Permeated Vs Time): The equation that
represents zero-order kinetics
Qt = Q0 + k0t
Where Qt is the amount of drug released at time ‘t’
Qo is the initial amount of drug and
Ko is the zero-order release rate constant
First Order Model (Log Cumulative Percentage
of Drug Remaining vs. Time: The equation
representing first-order kinetics
Log C = Log Co – k1 t/2.303
Where Co is the initial concentration of the drug, C
is the concentration after time t, K1 is the first-
order release rate constant, and t indicates the time.
Higuchi Model (Cumulative Percentage Drug
Release vs. Square Root of Time: This model can
be expressed using equation
Ft = Q= A √(D(2C-Cs) Cst)
Where Q is the amount of drug released in time t
per unit area A, C is the initial concentration of the
drug, and Cs is the drug solubility in the matrix
media, D is the diffusivity of the drug molecules in
the matrix substance
Korsmeyer - Peppas Model: The permeation data
were fitted into the Korsmeyer-Peppas model to
know the mechanism of drug release. The equation
that describes this model is
Mt/M∞ = Ktn
Where Mt/M∞ is the fraction of drug released at
time t, K is the release rate constant is the release
exponent.
Sravanthi et al., IJPSR, 2021; Vol. 12(7): 4011-4024. E-ISSN: 0975-8232; P-ISSN: 2320-5148
International Journal of Pharmaceutical Sciences and Research 4017
TABLE 3: DRUG RELEASE KINETIC PARAMETERS
LIMITATIONS
Release Exponent (n) Drug Transport Mechanism
0.5 Fickian diffusion
0.45-0.89 Non-Fickian transport
0.89 Case II transport
Higher than 0.89 Super case II transport
Stability Study: The stability study was conducted
as per ICH guidelines Q1A (R2). The formulations
F2, F5, F6 & F9, were subjected for stability at the
below-mentioned conditions for six months as
presented in Table 4.
TABLE 4: STABILTY CONDITIONS AS PER ICH GUIDELINES
S. no Study Temperature Condition Room Humidity Condition Time period
1 Long term/ Real time 25ºC ±2ºC 60% ± 5% 6 Months
2 Intermediate 30ºC ±2ºC 65% ± 5% 6 Months
3 Accelerated 40ºC ±2ºC 75% ± 5% 6 Months
After stability period the patches were evaluated for physical appearance, assay, % impurities and % drug release.
RESULTS AND DISCUSSION:
A Rivastigmine Loaded Microspheres:
Description: Rivastigmine microspheres were
prepared with varying drug to carrier ratio (carrier-
polycaprolactone: maltodextrin in 1:1 ratio). The
prepared microspheres were found to be discrete
and spherical in shape. The microsphere was
noticed to be free-flowing and existed as an
individual entity without any agglomerates.
Particle Size Distribution: Average particle size
distribution of the prepared rivastigmine loaded
micro spheres were found to be ranging from 18.65
µm to 41.65 µm. An increase in the polymer ratio
increased the particle size linearly. The results are
presented in Table 5.
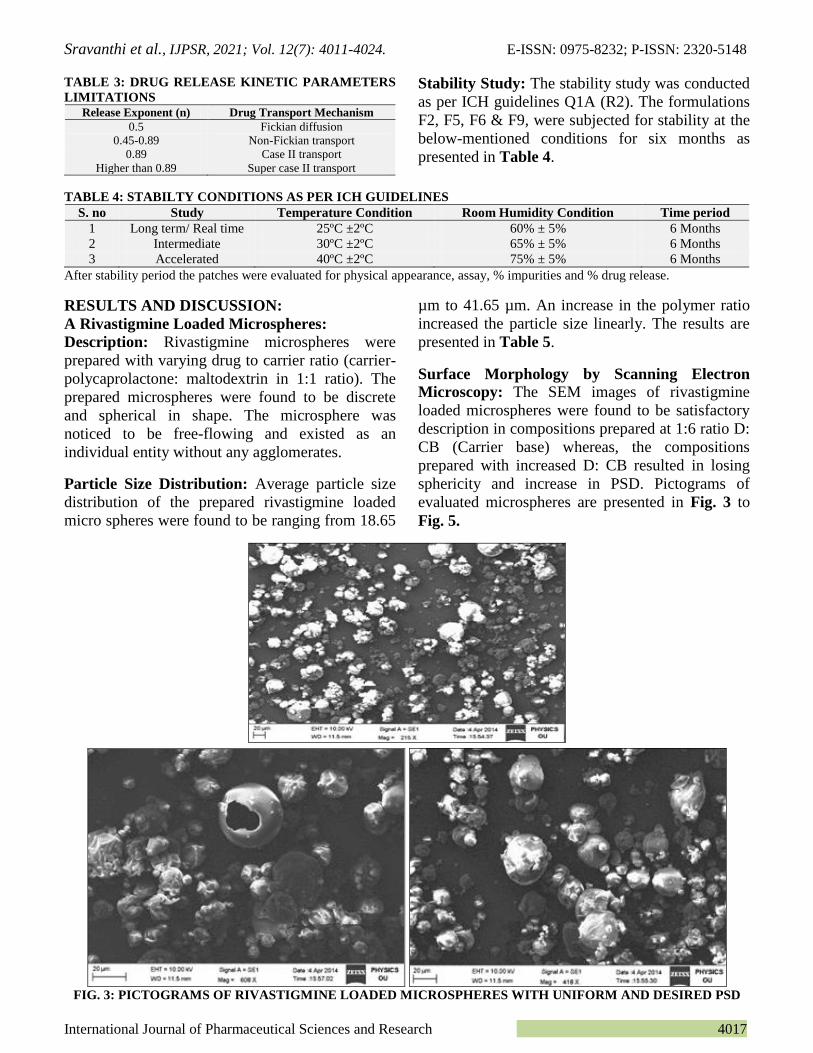
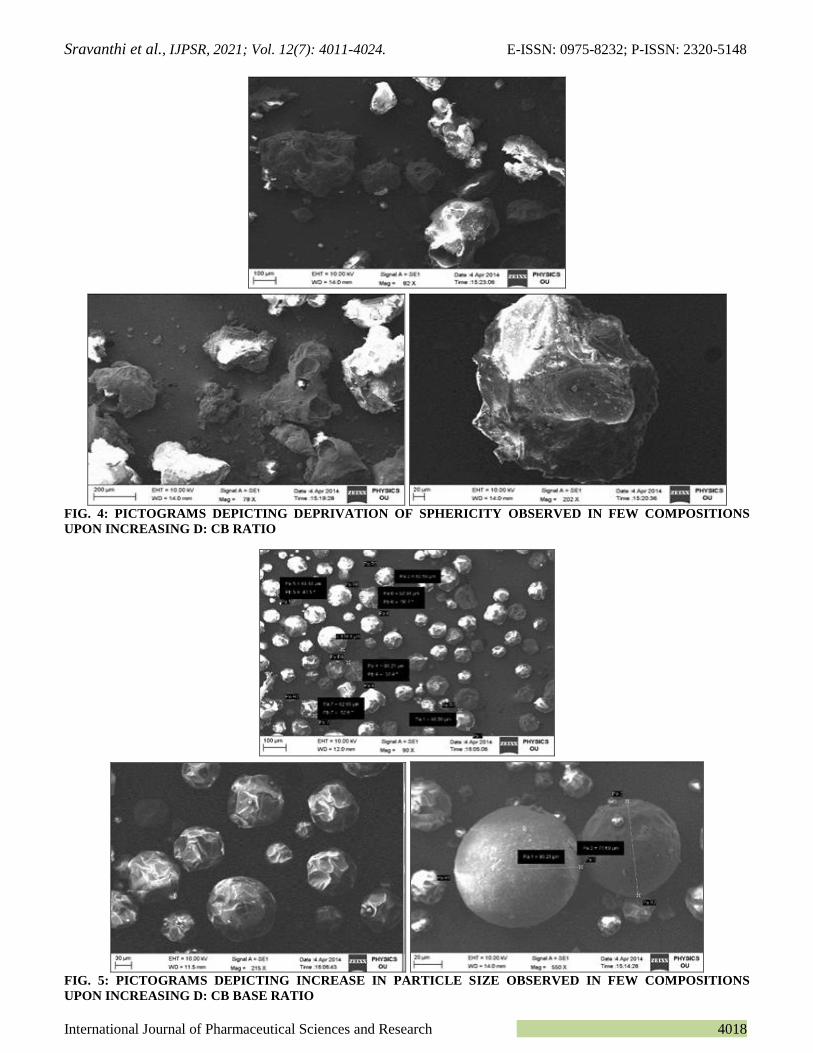
Surface Morphology by Scanning Electron
Microscopy: The SEM images of rivastigmine
loaded microspheres were found to be satisfactory
description in compositions prepared at 1:6 ratio D:
CB (Carrier base) whereas, the compositions
prepared with increased D: CB resulted in losing
sphericity and increase in PSD. Pictograms of
evaluated microspheres are presented in Fig. 3 to
Fig. 5.
FIG. 3: PICTOGRAMS OF RIVASTIGMINE LOADED MICROSPHERES WITH UNIFORM AND DESIRED PSD
Sravanthi et al., IJPSR, 2021; Vol. 12(7): 4011-4024. E-ISSN: 0975-8232; P-ISSN: 2320-5148
International Journal of Pharmaceutical Sciences and Research 4018
FIG. 4: PICTOGRAMS DEPICTING DEPRIVATION OF SPHERICITY OBSERVED IN FEW COMPOSITIONS
UPON INCREASING D: CB RATIO
FIG. 5: PICTOGRAMS DEPICTING INCREASE IN PARTICLE SIZE OBSERVED IN FEW COMPOSITIONS
UPON INCREASING D: CB BASE RATIO

Sravanthi et al., IJPSR, 2021; Vol. 12(7): 4011-4024. E-ISSN: 0975-8232; P-ISSN: 2320-5148
International Journal of Pharmaceutical Sciences and Research 4019
Percentage Yield: Practical yield of various
rivastigmine loaded microsphere formulations were
found to be ranged around 69.71 to 86.12. Among
the prepared microsphere formulations, the
formulation (A5) prepared at drug (rivastigmine):
carrier ratio of 1:12 was found to be with maximum
yield i.e. around 86.12% and the least yield was
obtained in the formulation prepared at drug
(rivastigmine): carrier of 1:2 ratio. The data is
presented in Table 5.
Drug Content by Assay: % drug content in the
rivastigmine loaded microsphere formulations were
evaluated by assay method following HPLC
technique.
The % drug content in various microsphere
formulations was found to ranging from 92.54% to
99.87%. The maximum % drug content was
obtained in the formulation (A3) prepared at 1: 6
Drug (rivastigmine): carrier base ratio. The results
are presented in Table 5.
Encapsulation Efficiency: Encapsulation
efficiency in various microsphere formulations was
found to be ranging from 76.51% to 84.58%. The
formulation prepared at a drug: carrier mixture
ratio of 1:8 and 1:12 was found to be with high
encapsulation efficiency, but compositions were
ruled out considering PSD requirement for the
patch. Results are presented in Table 5.
In-vitro Drug Release Studies: Among the
prepared rivastigmine loaded microspheres,
formulations prepared at Drug: Carrier base
mixture ratio of 1:2, 1:4 & 1:6 (considering desired
PSD and assay) were evaluated for in-vitro drug
release where the maximum release of rivastigmine
within 3 h was found to be in formulations
prepared with Drug: Carrier base mixture ratio of
1:2 (A1) and 1:6 (A6), i.e., around 99.79% &
99.46% respectively. Whereas, the formulation
prepared at Drug: Carrier bae mixture rati of 1:4
(A2) showed less release, 98.36%, after 3 h.
Results were depicted in Table 5.
TABLE 5: CHARACTERIZATION DATA OF RIVASTIGMINE LOADED MICROSPHERES
Code (D:CB) Avg. particle size (µ) Yield (%) Assay (%) %EE In vitro drug release at 3 h (%) @ 32°C
A1 (1:2) 18.65 69.71 99.19 82.31% 99.79
A2 (1: 4) 19.15 71.26 96.32 80.13% 98.36
A3 (1:6) 21.64 70.17 99.87 77.61% 99.46
A4 (1:8) 29.23 73.26 94.32 83.74% Ruled Out
A5 (1:10) 32.35 74.51 93.16 76.51% Ruled Out
A6 (1:12) 41.65 86.12 92.54 84.58% Ruled Out
From the results of the parameters evaluated, the microspheres from the A1 batch were considered to be optimized and used for
incorporation into the adhesive layer of the transdermal patch following the design of experiments.
B. Rivastigmine Micro Reservoirs Loaded
Adhesive Dispersion Patches:
General Appearance/Description: The patch was
found to be thin, translucent, smooth homogeneous,
and flexible in nature when observed with the
naked eye.
Thickness: The thickness of the patch was found to
be uniform. The thickness of the various
transdermal systems was ranged from 0.324 ± 0.03
mm to 0.487 ± 0.035 mm. Results were presented
in Table 6.
Weight variation: The weight of trans dermal
patches was found to be in the range of 0.197 ±
0.0011 g to 0.226 ± 0.0015 g. the standard
deviation values of the patches were low, indicating
weight variation among the prepared transdermal
systems was found to below. Results were
presented in Table 6.
Drug Content Uniformity: The drug content of
the patches was determined using RP-HPLC
technique which was found to be in the range of
93.19 ± 2.449 % to 101.78 ± 3.02%. Less standard
deviation values indicate more uniformity in the
drug content of the patches. Results were presented
in Table 6.
Moisture Absorption: The average moisture
uptake was found to be in the range of 2.005 ±
0.195% and 4.64 ± 0.146 %. Absorption of the
moisture by the patch upon exposure to 84% RH
did not influence much, but the transdermal patch
must be stored in moisture barrier foil since the
mild increase in moisture gain was observed.
Results were presented in Table 6.
Moisture Content: The average % moisture
content of the transdermal patches was found to be
in the range of 0.65 ± 0.116 % to 1.91 ± 0.105 %.
Sravanthi et al., IJPSR, 2021; Vol. 12(7): 4011-4024. E-ISSN: 0975-8232; P-ISSN: 2320-5148
International Journal of Pharmaceutical Sciences and Research 4020
Less moisture content indicates higher stability of
the patches. Results were presented in Table 6.
Flatness: Flatness indicates the patch's level of
immediate constriction. The flatness study proved
that all the formulations had the same strip length
before and after cutting/separation, which indicates
100% flatness of the patch. Thus the patch has no
level of immediate constriction, and the same could
be maintained when the patch has applied to the
skin. Results were presented in Table 6.
Folding Endurance: The study showed that all the
formulations found to be having folding endurance
values above 250 except F4, F7, and F8. It suggests
that the patches were having good strength,
elasticity and can their integrity when applied on to
the skin. Results were presented in Table 6.
TABLE 6: EVALUATION DATA OF RIVASTIGMINEMICROSPHERES LOADED TRANSDERMAL PATCHES:
Cod
e
Weight variati
on (g)
Thickness (m
m)
% Moisture co
ntent
%Moisture u
ptake
Folding endur
ance
Drug content
(%)
% Flatn
ess
F1 0.203 ± 0.0014 0.355 ± 0.024 1.35 ± 0.112 2.882 ± 0.895 > 250 98.06 ± 3.56 100%
F2 0.213 ± 0.0009 0.367 ± 0.032 1.63± 0.031 3.786 ± 0.141 > 250 94.33 ± 2.67 100%
F3 0.202 ± 0.0011 0.341 ± 0.035 1.26 ± 0.127 3.484 ± 0.411 > 250 101.78 ± 3.02 100%
F4 0.226 ± 0.0015 0.402 ± 0.034 1.91 ± 0.105 2.005 ± 0.195 < 250 100.32 ± 3.31 100%
F5 0.208 ± 0.0014 0.337 ± 0.028 0.65 ± 0.116 3.248 ± 0.184 > 250 99.29 ± 4.03 100%
F6 0.198 ± 0.0016 0.324 ± 0.031 1.46 ± 0.287 3.052± 0.246 > 250 99.56 ± 2.82 100%
F7 0.217 ± 0.0017 0.397 ± 0.022 1.79 ± 0.167 4.64 ± 0.146 < 250 93.19 ± 2.449 100%
F8 0.219 ± 0.0019 0.372 ± 0.015 1.59 ± 0.219 3.015± 0.181 < 250 97.65 ± 4.46 100%
F9 0.197 ± 0.0011 0.324 ± 0.031 1.06 ± 0.249 3.019 ± 0.19 > 250 95.59 ± 2.64 100%
F10 0.219 ± 0.0021 0.413 ± 0.023 1.35 ± 0.341 3.235 ± 0.152 > 250 94.29 ± 3.29 100%
F11 0.205 ± 0.0008 0.341 ± 0.034 1.23 ± 0.125 3.204 ± 0.284 > 250 99.56 ± 4.28 100%
F12 0.209 ± 0.001 0.371 ± 0.035 1.59 ± 0.214 3.641 ± 0.154 > 250 97.78 ± 2.08 100%
F13 0.218± 0.0014 0.487 ± 0.035 1.86 ± 0.248 2.458 ± 0.208 > 250 95.48 ± 3.46 100%
Note: ± = SD
Mechanical Properties: Mechanical properties
indicate the strength and elasticity of the
transdermal patches. A suitable transdermal patch
must have high tensile strength and elongation at
break. The results indicate that as the polymer
concentration increased, there was an increase in
tensile strength but a decrease in elongation at
break. The optimized formulation was found to
have high mechanical strength. Results are
presented in Table 7.
TABLE 7: MECHANICAL PROPERTIES OF RIVASTIGMINE TRANSDERMAL FORMULATIONS
Formulation Tensile strength(kg/mm2) Elongation at break(%mm
2)
F2 3.66±0.029 13.81±0.56
F5 4.01±0.037 14.26±0.72
F6 2.89±0.082 11.51±0.63
F9 2.59±0.054 13.69±0.42
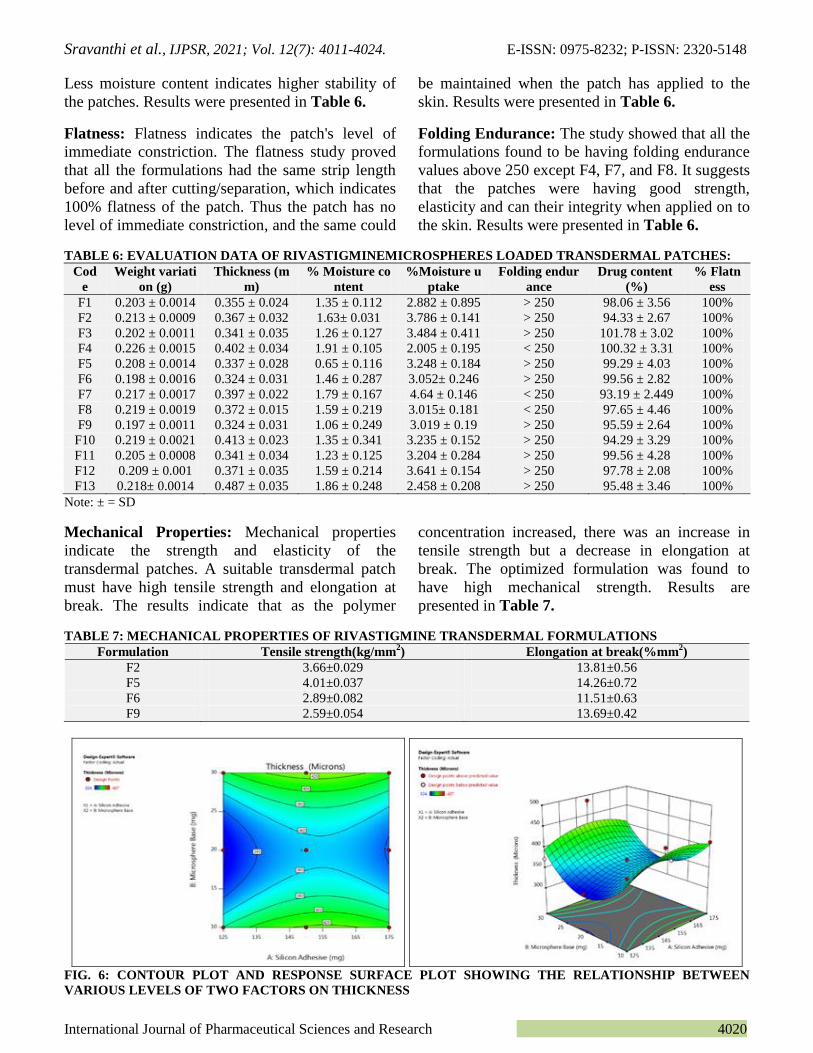
FIG. 6: CONTOUR PLOT AND RESPONSE SURFACE PLOT SHOWING THE RELATIONSHIP BETWEEN
VARIOUS LEVELS OF TWO FACTORS ON THICKNESS

Sravanthi et al., IJPSR, 2021; Vol. 12(7): 4011-4024. E-ISSN: 0975-8232; P-ISSN: 2320-5148
International Journal of Pharmaceutical Sciences and Research 4021
FIG. 7: CONTOUR PLOT AND RESPONSE SURFACE PLOT SHOWING THE RELATIONSHIP BETWEEN
VARIOUS LEVELS OF TWO FACTORS ON FOLDING ENDURANCE
FIG. 8: CONTOUR PLOT AND RESPONSE SURFACE PLOT SHOWING THE RELATIONSHIP BETWEEN
VARIOUS LEVELS OF TWO FACTORS ON WEIGHT OF THE PATCH
FIG. 9: CONTOUR PLOT AND RESPONSE SURFACE PLOT SHOWING THE RELATIONSHIP BETWEEN
VARIOUS LEVELS OF TWO FACTORS ON WEIGHT OF THE PATCH
Experimental Design Analysis: The impact of two
factors, i.e., Silicon adhesive and microsphere base,
on thickness, folding endurance, the weight of the
patch, and assay of the patch is presented in Fig. 6
to Fig. 9.
Assay and folding endurance of the formulation
were found to be high upon taking the two factors
in medium concentration, whereas the thickness
and weight of the patch were found to be
decreased.
Sravanthi et al., IJPSR, 2021; Vol. 12(7): 4011-4024. E-ISSN: 0975-8232; P-ISSN: 2320-5148
International Journal of Pharmaceutical Sciences and Research 4022
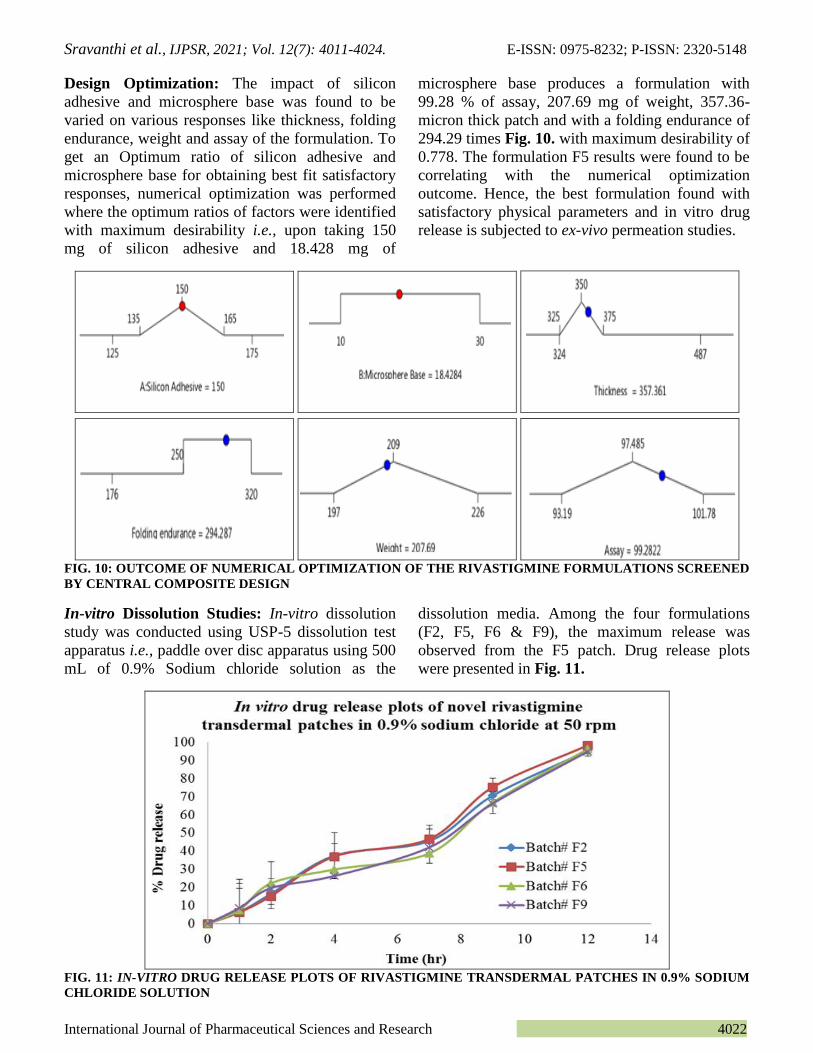
Design Optimization: The impact of silicon
adhesive and microsphere base was found to be
varied on various responses like thickness, folding
endurance, weight and assay of the formulation. To
get an Optimum ratio of silicon adhesive and
microsphere base for obtaining best fit satisfactory
responses, numerical optimization was performed
where the optimum ratios of factors were identified
with maximum desirability i.e., upon taking 150
mg of silicon adhesive and 18.428 mg of
microsphere base produces a formulation with
99.28 % of assay, 207.69 mg of weight, 357.36-
micron thick patch and with a folding endurance of
294.29 times Fig. 10. with maximum desirability of
0.778. The formulation F5 results were found to be
correlating with the numerical optimization
outcome. Hence, the best formulation found with
satisfactory physical parameters and in vitro drug
release is subjected to ex-vivo permeation studies.
FIG. 10: OUTCOME OF NUMERICAL OPTIMIZATION OF THE RIVASTIGMINE FORMULATIONS SCREENED
BY CENTRAL COMPOSITE DESIGN
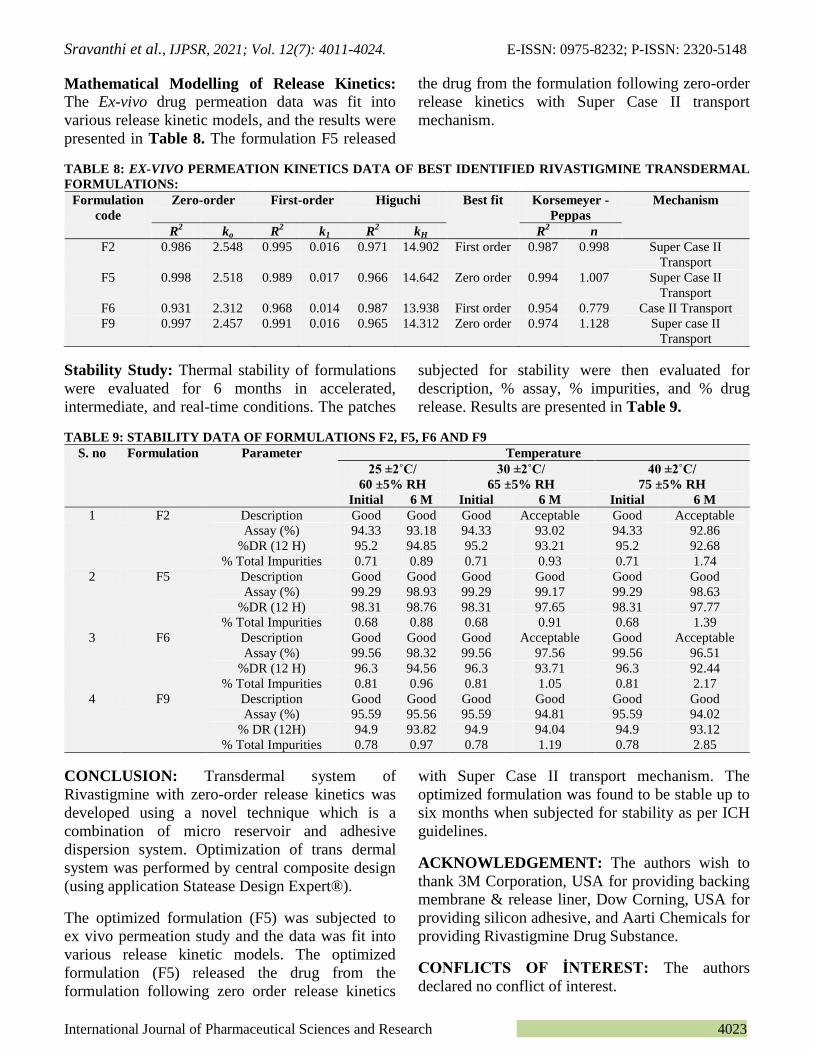
In-vitro Dissolution Studies: In-vitro dissolution
study was conducted using USP-5 dissolution test
apparatus i.e., paddle over disc apparatus using 500
mL of 0.9% Sodium chloride solution as the
dissolution media. Among the four formulations
(F2, F5, F6 & F9), the maximum release was
observed from the F5 patch. Drug release plots
were presented in Fig. 11.
FIG. 11: IN-VITRO DRUG RELEASE PLOTS OF RIVASTIGMINE TRANSDERMAL PATCHES IN 0.9% SODIUM
CHLORIDE SOLUTION
Sravanthi et al., IJPSR, 2021; Vol. 12(7): 4011-4024. E-ISSN: 0975-8232; P-ISSN: 2320-5148
International Journal of Pharmaceutical Sciences and Research 4023
Mathematical Modelling of Release Kinetics:
The Ex-vivo drug permeation data was fit into
various release kinetic models, and the results were
presented in Table 8. The formulation F5 released
the drug from the formulation following zero-order
release kinetics with Super Case II transport
mechanism.
TABLE 8: EX-VIVO PERMEATION KINETICS DATA OF BEST IDENTIFIED RIVASTIGMINE TRANSDERMAL
FORMULATIONS:
Formulation
code
Zero-order First-order Higuchi Best fit
Korsemeyer -
Peppas
Mechanism
R2 ko R
2 k1 R
2 kH R
2 n
F2 0.986 2.548 0.995 0.016 0.971 14.902 First order 0.987 0.998 Super Case II
Transport
F5 0.998 2.518 0.989 0.017 0.966 14.642 Zero order 0.994 1.007 Super Case II
Transport
F6 0.931 2.312 0.968 0.014 0.987 13.938 First order 0.954 0.779 Case II Transport
F9 0.997 2.457 0.991 0.016 0.965 14.312 Zero order 0.974 1.128 Super case II
Transport
Stability Study: Thermal stability of formulations
were evaluated for 6 months in accelerated,
intermediate, and real-time conditions. The patches
subjected for stability were then evaluated for
description, % assay, % impurities, and % drug
release. Results are presented in Table 9.
TABLE 9: STABILITY DATA OF FORMULATIONS F2, F5, F6 AND F9
S. no Formulation Parameter Temperature
25 ±2˚C/
60 ±5% RH
30 ±2˚C/
65 ±5% RH
40 ±2˚C/
75 ±5% RH
Initial 6 M Initial 6 M Initial 6 M
1 F2 Description Good Good Good Acceptable Good Acceptable
Assay (%) 94.33 93.18 94.33 93.02 94.33 92.86
%DR (12 H) 95.2 94.85 95.2 93.21 95.2 92.68
% Total Impurities 0.71 0.89 0.71 0.93 0.71 1.74
2 F5 Description Good Good Good Good Good Good
Assay (%) 99.29 98.93 99.29 99.17 99.29 98.63
%DR (12 H) 98.31 98.76 98.31 97.65 98.31 97.77
% Total Impurities 0.68 0.88 0.68 0.91 0.68 1.39
3 F6 Description Good Good Good Acceptable Good Acceptable
Assay (%) 99.56 98.32 99.56 97.56 99.56 96.51
%DR (12 H) 96.3 94.56 96.3 93.71 96.3 92.44
% Total Impurities 0.81 0.96 0.81 1.05 0.81 2.17
4 F9 Description Good Good Good Good Good Good
Assay (%) 95.59 95.56 95.59 94.81 95.59 94.02
% DR (12H) 94.9 93.82 94.9 94.04 94.9 93.12
% Total Impurities 0.78 0.97 0.78 1.19 0.78 2.85
CONCLUSION: Transdermal system of
Rivastigmine with zero-order release kinetics was
developed using a novel technique which is a
combination of micro reservoir and adhesive
dispersion system. Optimization of trans dermal
system was performed by central composite design
(using application Statease Design Expert®).
The optimized formulation (F5) was subjected to
ex vivo permeation study and the data was fit into
various release kinetic models. The optimized
formulation (F5) released the drug from the
formulation following zero order release kinetics
with Super Case II transport mechanism. The
optimized formulation was found to be stable up to
six months when subjected for stability as per ICH
guidelines.
ACKNOWLEDGEMENT: The authors wish to
thank 3M Corporation, USA for providing backing
membrane & release liner, Dow Corning, USA for
providing silicon adhesive, and Aarti Chemicals for
providing Rivastigmine Drug Substance.
CONFLICTS OF İNTEREST: The authors
declared no conflict of interest.

Sravanthi et al., IJPSR, 2021; Vol. 12(7): 4011-4024. E-ISSN: 0975-8232; P-ISSN: 2320-5148
International Journal of Pharmaceutical Sciences and Research 4024
REFERENCES:
1. Nguyen K, Hoffman H, Chakkamparambil B and
Grossberg TG: Evaluation of Rivastigmine in Alzheimer’s
disease. Neurodegenerative Disease Management 2021;
11(1): 35-48.
2. Dighe SN, De la Mora E, Chan S, Kantham S, McColl G,
Miles AJ, Veliyath KS, Sreenivas YB, Nassar DZ, Silman
I, Sussman LJ, Weik M, McGeary PR, Parat OM,
Brazzolotto X and Ross PB: Rivastigmine and metabolite
analogues with putative Alzheimer’s disease-modifying
properties in a Caenorhabditis elegans model.
Communication Chemistry 2019; 35(2): 1-14.
3. Khoury R, Rajamanickam J and Grossberg TG: An update
on the safety of current therapies for Alzheimer’s disease:
focus on rivastigmine. Therapeutic Advances in Drug
Safety 2018; 9(3): 171-78.
4. Birks SJ, Chong LY and Evan JG: Rivastigmine for
Alzheimer’s disease. Cochrane Database of Systematic
Reviews 2015; 1: 1-182.
5. Kurz A, Farlow M and Lefevre G: Pharmacokinetics of a
novel trans dermal rivastigmine patch for the treatment of
Alzheimer’s disease: A review. International Journal of
Clinical Practice 2009; 63: 799-05.
6. Salimi A, Gobadian H and Makhmalzadeh B: Dermal
pharmacokinetics of rivastigmine-loaded liposomes: an ex-
vivo in-vivo correlation study. Journal of Liposme
Research 2020; 9: 1-9.
7. Jhee SS, Shiovitz T , Hartman DR, Messina J, Anand R,
Sramek J and Cutler RN: Centrally acting antiemetics
mitigate nausea and vomiting in patients with Alzheimer's
disease who receive rivastigmine. Clinical
Neuropharmacology 2002; 25(2): 122-3.
8. Inglis F: The tolerability and safety of cholinesterase
inhibitors in the treatment of dementia. International
Journal of Clinical Practice Supplement 2002; 127: 45-63.
9. Reingold LJ, Morgan CJ and Sethi DK: Rivastigmine for
the treatment of dementia associated with Parkinson’s
disease. Neuropsychiatric Disease and Treatment 2007;
3(6): 775-83.
10. Desai A and Grossberg G: Review of rivastigmine and its
clinical applications in Alzheimer's disease and related
disorders. Expert Opin on Pharmaco 2001; 2(4): 653-66.
11. Kassab R, Moussa D, Saliba C and Yammine P:
Encapsulation of metronidazole in polycaprolactone
microspheres. Journal of Drug Delivery and Therapeutics
2019; 9(1): 190-94.
12. Harikarnpakdee S, Lipipun V, Sutanthavibul N and
Ritthidej GC: Spray dried mucoadhesive microspheres:
Preparation and transport through nasal cell monolayer.
AAPS Pharm Sci Tech 2006; 7(1): E1-E10.
13. Rai SY and Ravi kumar P: Development and evaluation of
microsphere based topical formulation using design of
experiments. Indian Journal of Pharmaceutical Sciences
2016; 78(2): 182-92.
14. Prashanth VV, Chakraborty A, Mathew S, Mathappan R
and Kamalakkannan: Formulation and evaluation of
salbutamol sulphate microspheres by solvent evaporation
method. Journal of Applied Pharmaceutical Sciences 2011;
01(05): 133-37.
15. Venkatesh DP, Karki R, Jha SK, Lakshmi AG, Kumar
GSS and Goli D: Formulation and evaluation of
microspheres containing fluvastatin sodium. International
Journal of Drug Development and Research 2012; 4(2):
306-14.
16. Dhiman S and Verma S: Optimization of melt-in-mouth
tablets of levocetrizine dihydrochloride using response
surface methodology. International Journal of Pharmacy
and Pharmaceutical Sciences 2012; 4(1): 177-84.
17. Bose A, Wong TW and Singh N: Formulation
development and optimization of sustained release matrix
tablet of Itopride HCl by response surface methodology
and its evaluation of release kinetics. Saudi Pharmaceutical
Journal 2013; 21: 201-13.
18. Bushra R, Shoaib MH, Ali H and Zafar F: Formulation
design and optimization of Aceclofenac tablets (100 mg)
using central composite design with response surface
methodology. Latin American Journal of Pharmacy 2014;
33(6): 1009- 18.
19. Sravanthi A, Sunitha RM and Jaswanth A: Development
and In-vitro evaluation of a zero order drug releasing
transdermal system of rotigotine. International Journal of
Pharmaceutical Sciences Review and Research 2021;
66(1): 54-64.
20. Unagolla MJ and Jayasuriya CA: Drug transport
mechanisms and in-vitro release kinetics of vancomycin
encapsulated chitosan-alginate polyelectrolyte micro-
particles as a controlled drug delivery system. European
Journal of Pharmaceutical Sciences 2018; 114: 199-09.
All © 2013 are reserved by International Journal of Pharmaceutical Sciences and Research. This Journal licensed under a Creative Commons Attribution-NonCommercial-ShareAlike 3.0 Unported License.
This article can be downloaded to ANDROID OS based mobile. Scan QR Code using Code/Bar Scanner from your mobile. (Scanners are available on Google Playstore)
How to cite this article:
Anampally S, Reddy SM and Jaswanth A: Design and evaluation of zero order drug releasing rivastigmine transdermal system. Int J
Pharm Sci & Res 2021; 12(7): 4011-24. doi: 10.13040/IJPSR.0975-8232.12(7).4011-24.
Top Related