


Languages
Pages
Legal


Descriptive Statistics

The following data represent marks of three students’ groups and each group with different teacher, find the mean of each group:
A: 59, 61, 62, 58, 60
B: 50, 60, 66, 54, 70
C: 19, 65, 46, 78, 72
60B60A
60C

Definition of Measures of variation
The measure of variation in a set of observations refers to how spread out the observations are from each other.
When the measure of variation is small, this means that the values are close together (but not the same)
Population 1
Population 2

fourth lecture
We will learn in this lecture:
Measures of variation
1 -Range2 -Deviation
3 -Variance and Standard Deviation
4-Coefficient of variance5 -The standard score
6-Coefficient of skewness

The range of a data set is the difference between the maximum and the minimum data entries in the set .
R = maximum data entry – minimum data entry
Definition of range:

Calculate the range of marks of the students:82 ,40 ,62 ,70 ,30 ,80
R 82 30 52
Example (1):
Solution:
R = maximum data entry – minimum data entry

Example (2) :
Find the range of the data set represented by the steam-and-leaf plot:
R = 4 - 0.8 = 3.2
Solution: R = maximum data entry – minimum data entry

Advantages of the range:
•It’s easy to calculate•It gives a quick idea about the nature of data, often used in quality control and describe the weather.
Disadvantages of the range :
• It uses only two entries from the data set.•Affected by extreme values .therefore it’ approximate measurement.

Definition:The deviation of an entry x in a population data set is the difference between the entry and the mean μ of
the data set
Deviation of x = x –μ

Example(3):Find the deviation of each starting salary for corporation A:
Starting salaries for corporation A(1000s of dollars)
42 37 41 44 41 47 45 39 38 41 salary

Solution:
Deviation of x = x –μ
μ= ∑X/n
μ= ∑X/n= 415/10= 41.5
∑X=41
5
42 37 41 44
41 47 45 39 38 41 Salary(x)

DeviationX-μ
Salary(x)
.-5 41-3.2 38-2.5 39
3.5 455.5 47
.-5 412.5 44
.-5 41-4.5 37
0.5 42( ∑X-μ= )0 ∑X=415

Definition:
The population variance of a population data set of N entries is
population variance =
n
ii xx
N 1
22 )(1

Definition:
The population standard deviation of a population data set of N entries is the square root of the population variance
population standard deviation=
n
ii xx
N 1
22 )(1

Example(4):Find the population variance and standard deviation of the starting salary for corporation A:
Starting salaries for corporation A(1000s of dollars)
42 37 41 44 41 47 45 39 38 41 salary

Squares 2(X-μ)
DeviationX-μ
Salary(x)
0.25 -0.5 4112.25 -3.2 386.25 -2.5 39
12.25 3.5 4530.25 5.5 470.25 -0.5 416.25 2.5 440.25 -0.5 41
20.25 -4.5 370.25 0.5 42
SSx =88.5 ( ∑X-μ= )0 ∑X=415
0.385.8
9.810
5.88
10
5.88
2
N
SSx
Solution:

Definition:The sample variance and sample standard deviation of a sample data set of n entries are listed below.
Sample variance=
Sample standard deviation=
n
ii xx
ns
1
22 )(1
1
2ss

Remark
If the sample size (n) is large (greater than 30) then are equal approximately. 22 , s

Solution:
1-Calculating the average:
2 -Calculating the variance :
n
iixn
x1
1
5
35 7
n
ii xx
ns
1
22 )(1
1
Example (5):
Calculate the standard deviation of the following sample: (8,9,7,6,5)?

1 1 8
4 2 9
0 0 7
1 -1 6
4 -2 5
10 0 Total
ix xxi 2)( xxi
n
ii xx
ns
1
22 )(1
15.2
15
10
3 -Calculating the standard deviation:2ss 591.15.2

We can use this formula to calculate the sample variance:
n
xx
ns
2
22
1
1

8
9
7
6
5
x 2x
6481
49
36
25
22535
n
xx
ns
2
22
1
1
5
35255
15
1 22s
)245255(4
1 5.2
4
10
581.15.2 s
The standard deviation is:
The variance is:
Example (6):
Calculate the standard deviation of the following sample: (8,9,7,6,5)?
Solution:

Interpreting Standard Deviation:
when interpreting the standard deviation , remember that it is a measure of the typical amount an entry deviates from the mean. The more the entries are spread out, the greater the standard deviation

Standard Deviation for Grouped Data:
You learned that large data sets are usually best represented by a frequency distribution . The formula for the sample standard deviation for a frequency distribution is:
Where n=∑f is the number of entries in the data set.
n
iii fxx
ns
1
22
1
1

Example (7):the following data represent the number of children in 50 households:
0 1 2 2 1 1 1 1 3 1
6 3 0 5 1 0 0 0 1 1
1 0 6 1 1 1 1 3 0 3
1 1 0 3 2 2 1 6 6 3
4 2 0 3 0 2 2 1 1 4

32.40 3.24 -1.8 0 10 0
12.16 0.64 -0.8 19 19 1
0.28 0.04 0.2 14 7 2
10.08 1.44 1.2 21 7 3
9.68 4.84 2.2 8 2 4
10.24 10.24 3.2 5 1 5
70.56 17.64 4.2 24 4 6
145.40 -------- ------ ∑fx=91 f=50∑ Total
fx fx 2xx fxx 2x x

n
iii fxn
x1
1
8.150
91
n
iii fxx
ns
1
22
1
1
97.249
4.1452 s
2ss 7.149
4.145

Examlpe (8):
Calculate the standard deviation of the scores of students following
class
2 40-49
9 50-59
15 60-69
11 70-79
2 80-89
1 90-99
if ixm.pointt.limit
39.5-49.5 44.554.5
74.584.5
64.549.5-59.559.5-69.569.5-79.579.5-89.589.5-99.5 94.5

class2 40-49
9 50-5915 60-6911 70-792 80-891 90-99
----- ------- 40 Total
ift.limit
39.5-49.5 44.554.5
74.584.5
64.549.5-59.559.5-69.569.5-79.579.5-89.589.5-99.5 94.5
ix ii fx
89490.5
819.5169
960.5
94.52630
n
xffx
ns
2
22
1
1
ii fx2
3960.526732.25
61052.7512280.5
62403.75
8930.25177360

78.113)40
2630177360(
140
1 22
s
2ss 67.1078.113
n
xffx
ns
2
22
1
1

Remark:
The standard deviation is always positive.

x2 x
8
8
8
8
8
x 2x
64
6464
64
64
32040
n
xx
ns
2
22
1
1
5
40320
15
1 22s 0
0s
The standard deviation is:
The variance is:
Example (9):Calculate the standard deviation of the following sample: 8, 8, 8, 8, 8
Remark:
If data are equal then the standard deviation is 0.

Example (10):
Find the date such that:
5n7x 0s
Solution:
7 ,7 ,7 ,7 ,7

Solution:
(a) has a standard deviation of 24 and (b) has a standard deviation of 16, because the data in (a) have more variability.
Example (11):
Both data sets have a mean of 165.One has a standard deviation of 16,and the other has a standard deviation of 24.Which is which ? Explain your reasoning?

Example (12):
Both data sets have represented below have a mean of 50.One has a standard deviation of 2.4,and the other has a standard deviation of 5.Which is which ? Explain your reasoning?
Solution:
(a) has a standard deviation of 2.4 and (b) has a standard deviation of 5, because the data in (a) have less variability.
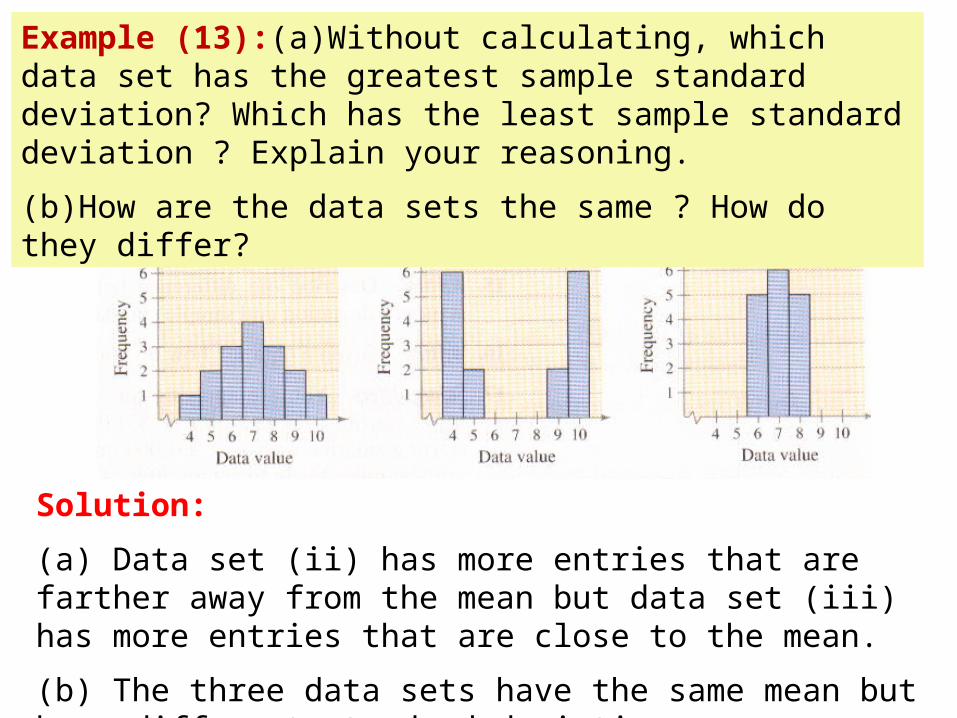
Example (13):(a)Without calculating, which data set has the greatest sample standard deviation? Which has the least sample standard deviation ? Explain your reasoning.
(b)How are the data sets the same ? How do they differ?
Solution:
(a) Data set (ii) has more entries that are farther away from the mean but data set (iii) has more entries that are close to the mean.
(b) The three data sets have the same mean but have different standard deviations.

Example (14):
Let the mean of 4 students’ mark is 5 with standard deviation is 5 and the mean of 6 students’ mark is 5 with standard deviation is 3.5. Find the pooled two-sample variance .
Solution:
3
5
4
1
1
1
s
x
n
5.3
5
6
2
2
2
s
x
n
2 21 1 2 22
1 2
1 1
1p
n s n ss
n n
2 22 4 1 (3) 6 1 (3.5)
4 6 1ps
944.2
2ps

It is as like as the mean.
Advantages and disadvantages of the standard deviation:

Fourth:
Coefficient of variance

• The two variables involved might by measured in different units.
• The means of the two may quit different in size.
Reasons to use Coefficient of variance (the relative variation) rather than the measure of variation:

Definition of Coefficient of variance:
x
sVC ..
The Coefficient of variance C.V. describes the standard deviation as a percent of the mean.

You can use the Coefficient of variance to compare data with different units

67.10s 75.65xSolution:
x
sVC .. 167.0
75.65
67.10
Example (15) :
Calculate the coefficient of variance for student’s marks such that:

The standard score, or z-score, represent the number or standard deviation a given value falls from the mean . To find the z-score for a given value, use the following formula.
x
=value mean x
zstanderd deviation
Definition of The standard score:

Remark:
A z-score is used to compare data values within the same data set or to compare data values from different data set.

Solution:
z-score of statistics test
xz
7.010
75821
z
5.016
81892
z
The student did better on statistics test.
z-score of mathematics test
Example (16):
For the statistics test scores, the mean is 75 and the standard deviation is 10. And for mathematics test scores, the mean is 81 and the standard deviation is 16. If a student gets a 82 on the statistics test and a 89 on the mathematics test, determine on which test the student had a better tests :

Remark:
A z-score can be negative, positive, or zero.
If z is negative x <If z is zero x = If z is positive x >

Sixth:Coefficient of skewness

Definition of The Coefficient of skewness:
It is the measurement to describes the shape of data.
Types of skewness:•Skewd left: a distribution is skewed left (negatively skewed) if its tail extends to the left.
•Skewd right: a distribution is skewed right (positively skewed) if its tail extends to the right.
•Symmetric: a distribution on one side of the mean is a mirror image of the other side.

0
1
2
3
4
5
6
0 1 2 3Median =Mean= Mode
0
1
2
3
4
5
6
7
8
9
10
0 0.5 1 1.5 2
0
1
2
3
4
5
6
7
8
9
10
0 0.5 1 1.5 2
Mean
Median
Mode
MeanM
edianM
ode
symmetric
Skewed -left Skewed-right

Remark:
If a distribution is skewed-leftIf a distribution is symmetricIf a distribution is skewed-right
0 0 0
Top Related