


Languages
Pages
Legal


1
Epidemiology
Fall semester 2007
Descriptive & analytic epidemiology IICase-control studies
Descriptive and analytic studytypes
Randomised/Intervention trialsCross sectional surveys
Cohort studies Correlational studies
Case-control studies Case reports/series
Analytic studiesDescriptive studies
A patient series
Carcinoma of the penis and cervix
“… Case 3. – Presented with 5-year history in November, 1969, aged 47. He had massive penile condylomata with squamous carcinomatous change and invaded ingual nodes. Died in 1977. His wife presented with carcinoma of the cervix in 1971 at the age of 43. She had a squamous cell carcinoma and stage III disease. Died 27 months later.”
Cartwright and Sinson, 1980; Lancet: 1: 97
Correlational studies
Ecological studies
In correlational studies, measures that represent characteristics of entirepopulations are used to describe disease in relation to some factors of interest such as age, calendar time, utilization of health services orconsumption of a food, medication or other product. (H&B p 102)
Correlation (0 < r < 1)
Correlation (-1 < r < 0)
Occurrence
”Exposure”
No correlation (r = 0)
Occurrence of gonorrhoeaEngland and Wales
Beral, Lancet, 25 May 1974
1922 1932 1942 1952 1962 19720
25
50
75
Calendar year
Gon
orrh
oea
inci
denc
epe
r 10
0,00
0 w
omen
2
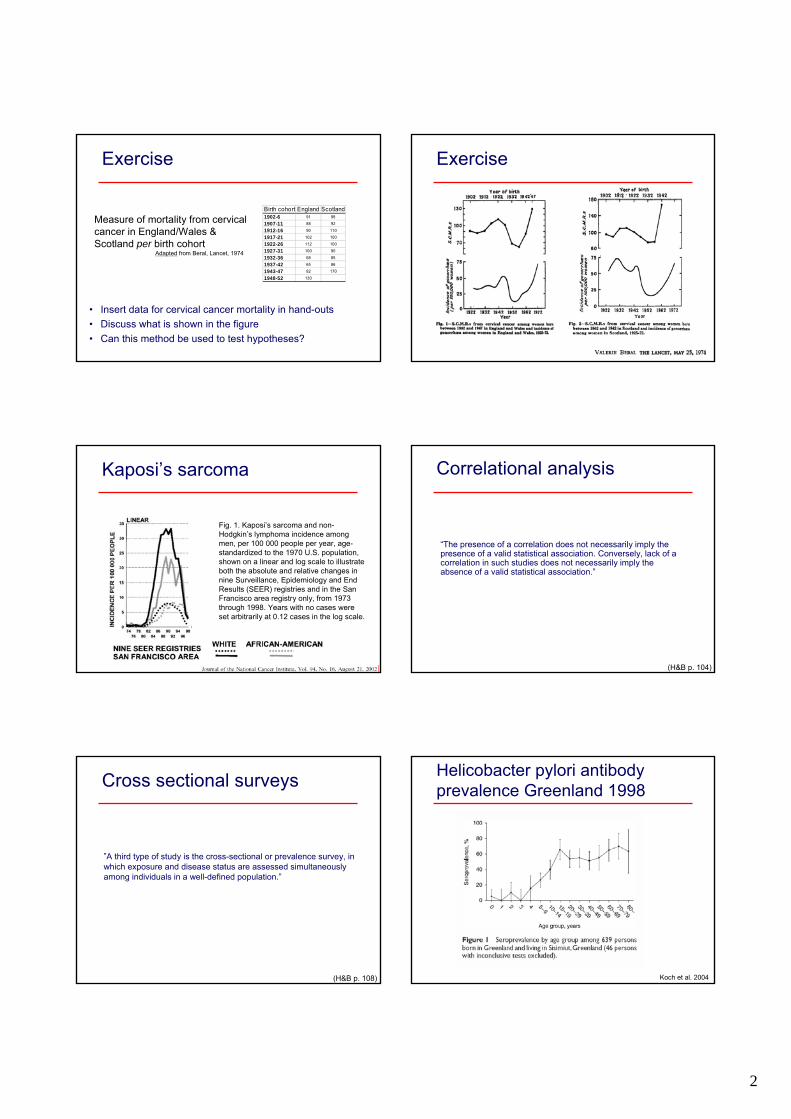
Exercise
• Insert data for cervical cancer mortality in hand-outs• Discuss what is shown in the figure• Can this method be used to test hypotheses?
Birth cohort England Scotland1902-6 91 98
1907-11 88 92
1912-16 90 110
1917-21 102 100
1922-26 112 100
1927-31 100 90
1932-36 68 85
1937-42 65 86
1943-47 82 170
1948-52 130
Measure of mortality from cervicalcancer in England/Wales & Scotland per birth cohort
Adapted from Beral, Lancet, 1974
Exercise
Kaposi’s sarcoma
Fig. 1. Kaposi’s sarcoma and non-Hodgkin’s lymphoma incidence among men, per 100 000 people per year, age-standardized to the 1970 U.S. population, shown on a linear and log scale to illustrate both the absolute and relative changes in nine Surveillance, Epidemiology and End Results (SEER) registries and in the San Francisco area registry only, from 1973 through 1998. Years with no cases were set arbitrarily at 0.12 cases in the log scale.
Correlational analysis
“The presence of a correlation does not necessarily imply the presence of a valid statistical association. Conversely, lack of a correlation in such studies does not necessarily imply the absence of a valid statistical association.”
(H&B p. 104)
Cross sectional surveys
”A third type of study is the cross-sectional or prevalence survey, in which exposure and disease status are assessed simultaneouslyamong individuals in a well-defined population.”
(H&B p. 108)
Helicobacter pylori antibodyprevalence Greenland 1998
Koch et al. 2004

3
HP seroprevalence patternchildhood
0102030405060708090
100
0 1 2 3 4 5 6 7 8 9 10 11 12 13 14 15
Age (years)
Perc
enta
ge p
ositi
ves
Ethiopia*GreenlandSweden*
* Lindkvist et al.1996
• At what age are Greenlanders infected?• At what age are children in other countries infected?• What are possible causes of the differences?
• Differences in infection patterns• Cohort effect
Risk factors for HP seropositivity(adjusted), Greenland
(0.03 – 0.9)0.1734 (21)5+ years
(0.3 – 5.68)1.3131 (42)3-4 years
(0.1 – 3.37)0.5722 (36)2 years
132 (53)0-1 years
0.03Distance to nearest oldersibling
(1.45 – 50.7)8.5822 (64)3+
(0.37 – 5.58)1.4497 (32)1-2
174 (35)0
0.01No. of older siblings
(1.52 – 26.4)6.3340 (55)4+
(0.38 – 6.07)1.5144 (27)3
(0.75 – 11.2)2.948 (38)2
128 (18)1
0.02No. of children in household
P-value(95% CI)ORN (% seropositive)
Risk factor assessment in correlational studies• Measure association at time of study• Information on prior exposures may be biased• Time of outcome (seropositivity) unknown
Cross sectional surveys
A B
Job Job
Healthy 80 95Diseases 20 5Prevalence 20% 5%
(H&B p. 110)
Cross sectional surveys
A B
Job Job
Healthy 80 95Diseased 10 15Prevalence 11% 14%
10 diseased
(H&B p. 110)
Cross sectional studies
• Studies, in which outcome and exposure are determined simultaneously
• The observed outcomes are prevalent
• Data on risk factor associations will accordingly represent both survivaland etiology
• It cannot be ruled out that the exposure under observation has changedafter and maybe because of the outcome
• It cannot always be determined which came first, the exposure or the outcome
• Cannot test causation, but suggest associations to be tested in analyticalstudies

4
Descriptive epidemiologyAdvantages• Cheap & quick• May provide important overviewDisadvantages• No information on the individual• No control for confounding• May involve bias• Results may be ambiguous• Can not test (causal) hypotheses
Descriptive & analytic epidemiology
Analytic epidemiologyDisadvantages• Expensive• Laboreous• May involve biasAdvantages• Information on the individual• Control for confounding• Results less ambiguous• Can test (causal) hypotheses
Analytical studies
Case-control studies
Aims
• Definition of case-control studies
• Know the difference between case-control and cohortstudies
• Describe odds ratio
• Know the principles for selection of cases and controls
• Describe advantages and disadvantages of CC-studies
How are you going to test, if
• Amyl nitrite (’Poppers’) is the cause of Kaposi’ssarcoma?
• Hospitalisation with hip fracture is the cause of lungembolus?
• Smoking is the cause of lung cancer?
• Use of childcare centres is a cause of respiratory tractinfections?
• Viagra acts against erectile dysfunction?
• Amyl nitrite (’Poppers’) is the cause of Kaposi’ssarcoma?– Case-control
• Hospitalisation with hip fracture is the cause of lungembolus?– Case-control
• Smoking is the cause of lung cancer?– Case-control
• Use of childcare centres is a cause of respiratory tractinfections?– Cohort study
• Viagra acts against erectile dysfunction?– Randomised controlled study
The question (hypothesis) determines the method• The method dependes (among others) of
– Type of disease– Frequency of disease– Characteristics of affected persons– Diagnostic methods
Analytical study types
• Determination of causes and effects
• Observational– Cohort studies– Case-control studies
• Interventional studies– Randomised, controlled studies

5
Cohort studies
• Cohort: Cohors (latin): 1/10 of a legion• Prospective (!)• Starting point a population of healthy
PopulationPersons withoutdisease
Exposed
Non-exposed
Sick
Healthy
Sick
Healthy
TIME
Outcome in cohort study: Relative risk
A + B + C + DB + DA + CTotal
C + DDCNon-exposed
A + BBAExposed
TotalHealthySick
DCC
BAA
risk Relative
+
+=
With other words: Cohort studies measure• Risk of disease among the exposed
compared with the risk of disease among the non-exposed
• The absolute risk may be calculated for bothgroups!
Case control studies
TIME
Population
Cases (with disease)
Controls (withoutdisease)
Exposed
Non-exposed
Exposed
Non-exposed
INFORMATION
Why case control studies?
• If exact information of exposure and cases in a completepopulation is not available
• Rare disease
• Long disease latency
• Fewer persons necessary to show effect
Case-control studies
• Became popular with the change from infectiousdisease epidemiology to chronic diseases. Why?– Western life-style diseases (cancer, heart diseases)– Diseases with long latent period– Most applicable when disease is rare– Study many possible risk factors / causes
• Today the most used analytical study type in epidemiology

6
Retrospective – prospective?
• CC-studies are often referred to as synonymous withretrospective studies, and cohort studies as prospective. Correct?
• No, retrospective refers to if all cases are identified at time of study start, which is the most usual in CC-studies
• However, do prospective CC-studies exist?
Prospective CC-study
Study start End of study
All incident cases (why incident?)
Prospective/retrospective refers to time of registration of cases
• Odds: measure of frequency of exposure in group
• Measure of association: if the exposure is a cause of disease, thensick persons (cases) should be exposed more often than controls!
• Odds have no unit
• Odds among cases = Number of cases exposed to risk faktorNumber of cases not exposed
• Odds among controls = Number of controls exposed to risk faktorNumber of controls not eksposed
• Odds ratio: Odds for cases/odds for controls
Outcome in case-controlstudy: Odds ratio
• 2x2 table• OR = a/c / b/d = ad/bc• P = Chi-square test/Fisher’s exact test
a + b + c + db + da + c
c + ddcNo
a + bbaYesExposure
ControlsCases
Disease
Calculation of odds ratio
a + b + c + db + da + c
c + d2040No
a + b8010YesExposure
ControlsCases
Disease
Calculate odds ratio:
• Odds for cases = 10/40 = 0.25• Odds for controls = 80/20 = 4• OR = 0.25/4 = 0.0625• Interpretation in words?
• OR = a/c / b/d = ad/bc = ???
15010050
602040No
908010YesExposure
ControlsCases
Disease
Observation by chance?
• Could an OR of 0.0625 occur by chance (’is it significant’)?• A X2 test tests if the observed numbers differ (significantly)
from the expected numbers• What are the expected numbers in each cell?

7
15010050
6020 4040 20No
9080 6010 30YesExposure
ControlsCases
Disease
Observed/expected numbers
• Does the observed deviate from the expected (’is thissignificant’)?
Χ2 test
2040No8010Yes
Exposure
ControlsCases
DiseaseObserved
Χ2 = ++ +(Oa-Ea)2
(Ea)(Ob-Eb)2
(Eb)(Oc-Ec)2
(Ec)(Od-Ed)2
(Ed)
If Χ2>3.84, then p<0.05!
What is Χ2?
dcba
50 ~ p < 0.0001
Odds ratio in practice. Salmonella in Wales 1989
1400 employees
31 cases officeworkers6 cases canteen staffIn total 37 cases
Hereof 3 attendeddoctor, other identifiedthrough interviews orfaecal tests
58 controls
Salmonella outbreak in Wales 1989
544334Chicken
44142116Sandwiches
5252412Salad
43141918Lunch 23/1
489316Lunch 22/1
Not eatenEatenNot eatenEaten
No gastroenteritisGastroenteritis
Odds ratio• Odds = Number of persons exposed
Number of persons not exposed
• Odds for having eaten in the canteen January 22 for cases= 6/31 = 0.193
• Odds for having eaten in the canteen January 22 for controls= 9/48 = 0.188
• Odds ratio = Odds for cases/odds for controls
• Odds ratio for having eaten in the canteen at January 22= 0.193/0.188 = 1.03
All risk factors in Wales outbreak
1.64Chicken
2.39Sandwiches
5.21Salad
2.91Lunch 23/1
1.03Lunch 22/1
OR

8
Odds ratio vs. relative risk
• Why is relative risk not used in case-control studies?
945737
= 1.02 ???6/15 / 31/79RR
794831No
1596YesLunch Jan. 22
ControlsCases
Gastroenteritis
• Because the calculation is nonsense!
OR <> RR
• 1.400 in building, 37 cases• How many got sick out of those having eaten in the
canteen?
• Number of eating and number of sick unknown• Sample of a population
• Therefore the rate (=risk) cannot be calculated in case-control study
But
• If disease is rare, then OR ~ RR
If disease is rare (a and c small), then OR ~ RR
bcad
= ORcd
ab~c
(c + d)
=
a(a + b)
RR =
110,05654,91225
35,33235,31319Exposure -
19,78719,7816Exposure +
ControlsCases
Disease
OR =~ = 0.5619,781 x 196 x 35,313
= 0.5619
(19 + 35,313)
=
6(6 + 19,781)
RR =
Generalisability –Confidence intervals• As we have only got a random sample and not a whole population,
we must calculate a measure of how certain our estimate (OR) is: the confidence interval
• The values between which the ’true’ population estimate with 95% confidence is found
0.38 – 7.011.64Chicken
0.99 – 5.82.39Sandwiches
1.65 – 16.45.20Salad
1.21 – 7.092.93Lunch Jan. 23
0.33 – 3.181.03Lunch Jan. 22
95% CIOR
With other words: Case-control studies measure• The extent of exposure among the sick compared with
the extent of exposure among the healthy
• Odds ratio expresses this
• Odds ratio is not the same as risk, as the risk in the population is unknown (a sample of the population is drawn),
But
• If the disease is rare (relatively), then OR ~ RR!
Time problem• Temporal associations between exposure and outcome difficult to
evaluate
Population
Cases (with disease)
Controls (withoutdisease)
Exposed
Non-exposed
Exposed
Non-exposed
INFORMATION
• Measurement methods back in time maybe not relevant today (HPV)
9
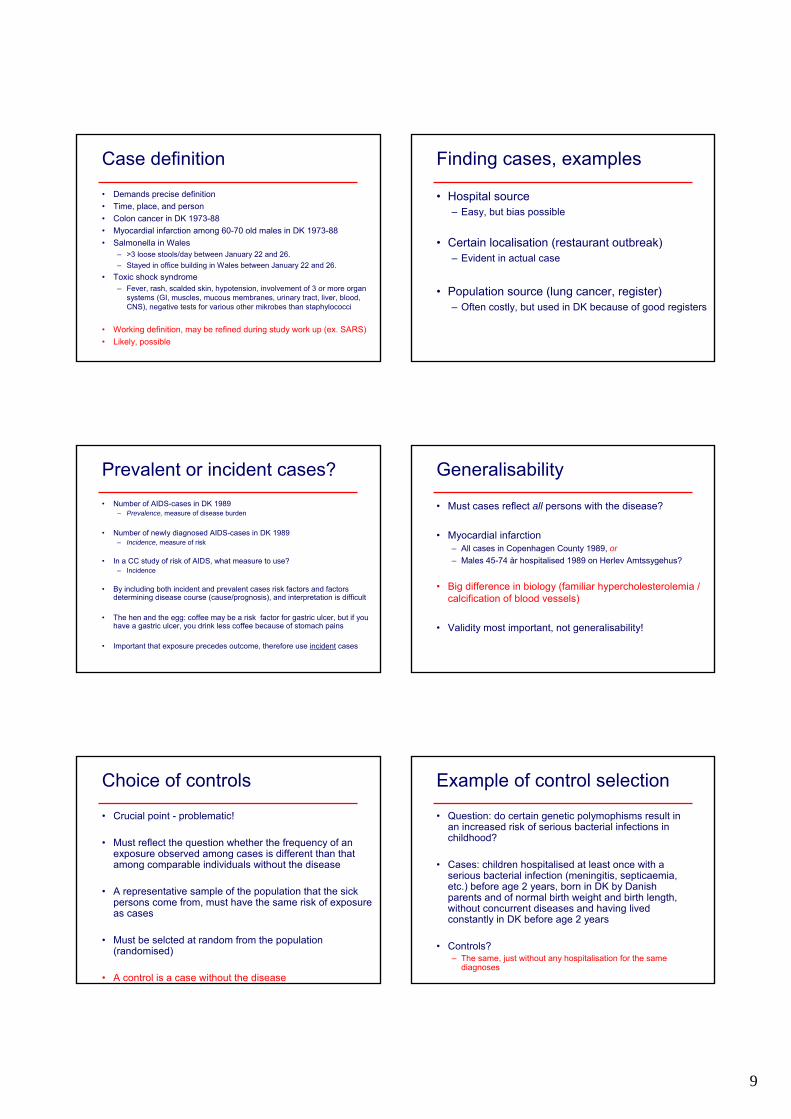
Case definition
• Demands precise definition• Time, place, and person• Colon cancer in DK 1973-88• Myocardial infarction among 60-70 old males in DK 1973-88• Salmonella in Wales
– >3 loose stools/day between January 22 and 26.– Stayed in office building in Wales between January 22 and 26.
• Toxic shock syndrome– Fever, rash, scalded skin, hypotension, involvement of 3 or more organ
systems (GI, muscles, mucous membranes, urinary tract, liver, blood, CNS), negative tests for various other mikrobes than staphylococci
• Working definition, may be refined during study work up (ex. SARS)• Likely, possible
Finding cases, examples
• Hospital source– Easy, but bias possible
• Certain localisation (restaurant outbreak)– Evident in actual case
• Population source (lung cancer, register)– Often costly, but used in DK because of good registers
Prevalent or incident cases?• Number of AIDS-cases in DK 1989
– Prevalence, measure of disease burden
• Number of newly diagnosed AIDS-cases in DK 1989– Incidence, measure of risk
• In a CC study of risk of AIDS, what measure to use?– Incidence
• By including both incident and prevalent cases risk factors and factors determining disease course (cause/prognosis), and interpretation is difficult
• The hen and the egg: coffee may be a risk factor for gastric ulcer, but if youhave a gastric ulcer, you drink less coffee because of stomach pains
• Important that exposure precedes outcome, therefore use incident cases
Generalisability
• Must cases reflect all persons with the disease?
• Myocardial infarction– All cases in Copenhagen County 1989, or– Males 45-74 år hospitalised 1989 on Herlev Amtssygehus?
• Big difference in biology (familiar hypercholesterolemia / calcification of blood vessels)
• Validity most important, not generalisability!
Choice of controls
• Crucial point - problematic!
• Must reflect the question whether the frequency of an exposure observed among cases is different than thatamong comparable individuals without the disease
• A representative sample of the population that the sickpersons come from, must have the same risk of exposureas cases
• Must be selcted at random from the population (randomised)
• A control is a case without the disease
Example of control selection
• Question: do certain genetic polymophisms result in an increased risk of serious bacterial infections in childhood?
• Cases: children hospitalised at least once with a serious bacterial infection (meningitis, septicaemia, etc.) before age 2 years, born in DK by Danish parents and of normal birth weight and birth length, without concurrent diseases and having livedconstantly in DK before age 2 years
• Controls?– The same, just without any hospitalisation for the same
diagnoses

10
Types of controls
• Hospital controls• Population controls• Special groups
– Friends, family members, spouses, neighbours
• Advantages and disadvantages by all types
Hospital controls
• Pro’s– Easy to find– Minimize recall bias (what is that and why??)– Subjected to the same specific and unspecific
factors that made the cases attend this hospital
• Con’s– Sick by definition, do not represent the distribution of exposures in the
background population (e.g. they smoke and drink more)– Yields a biased estimate (in what direction?)– In a study of smoking and bladder cancer many smokers among controls
resulting in ’dilution’ of estimate (weaker or negative effect)– In a study of coffee and bladder cancer less coffee drinkers among
controls, resulting in enhancement of estimate (stronger or positive effect)
– Controls from Frederikssund County Hospital vs. Steno Diabetes Center?
What categories of patients may be used as controls?• Controls to lung cancer patients, patients with
– Bronchitis?– Heart diseases?– Hip fractures?– Stomach ulcers?– Asthma?
• The diseases of the controls may be associatedwith the risk factors under study (positively/negatively), which is not desirable
Population controls
• Typically, when cases come from a particular population
• Examples– Households– Random digit dialing– Registers/voters lists– CPR
• Problems– Larger expenses– Hard to get hold of people (working, not at home – selection
bias)– Recall bias– Less motivation– Problems with random digit dialing in the USA?
Special groups
• Neighbours, friends, family
• Advantages– Cooperative– Confounder control (how?)
• Disadvantages– More alike cases (result?)– Dilution of estimate
More control groups?
• Ideally one per case group, but sometimes desirablewith more groups. When?
• When no ideal control group can be selected (e.g. patient groups)
• Breast cancer patients: Gynaecological cancers, non-cancer gynaecological patients, emergencyoperations

11
Number of controls per case?
• 1:1 best• What is gained by more controls per case?• If cases are hard to find, increased statistical strength
But
• 1:3 (=1 case + 3 controls) less statistical strength than 2 + 2 (2:2)
• Max. 1:4 (can be shown statistically), more controlswaste of time and money
Finding cases and controls
• Avoid bias
• Example: Study of PKU-cards– Controls card before
and after case card in the box in he freezer
– Advantages?– Can all cards be used
as controls?
Information on exposure
• Numerous possibilities– Registers– Hospital files– Telephone interviews– Etc.
• CC-study of Hodgkin’s lympoma and birth weight– Cases interviewed about birth weight in hospital– Controls information on birth weight from the Central Birth
Register– OK?
• No, information must be obtained in the same way and from the same place/source from cases as well as controls, otherwise risk of bias
PARTICULAR STUDY TYPES:NESTED CASE-CONTROL• A case-control study ’nested’ into a cohort
• Eg. A study of genetic factors and myocardialinfarction:
• Cohort: Østerbro-undersøgelsen (thousands of persons)
• Case-control: 200 cases and 200 controls from the cohort having genetic analyses done
• Why? Expensive or difficult to carry out geneticanalyses on all subjects in the cohort or difficultto obtain detailed information for all
DENSITY CASE-CONTROL STUDY• Controls selected to represent proportion of
person-time for exposed an non-exposed controls
• Knowledge of person-time of cases necessary
• The chance of being seleted as control is proportional to person-time experience in the source population
• If sampled properly, the Odds ratio from a densitycase control study design gives an estimate of incidence rate in study population
CASE-CROSSOVER STUDY
• Determines effect of two or more interventions
• Each case receives all interventions and actsas his/hers own control
• Only relevant when exposure varies from time to time within a person
• Evaluates exposures that trigger short-termeffects (mobile phones and traffic accidents, sexual intercourse and myocardial infarction)

12
ALTERNATIVE:CASE-COHORT STUDY• Controls have the same chance of being
selected irrespectively of person-time spent
• Fraction of total number of people in studypopulation rather than person-time
• Gives an estimate of risk ratio instead of incidence rate as in density CC study
• Control may also be a case!
Take home messages• If exact information of exposure and cases in a complete population
is not available, a case-control study may be carried out
• Well suited in case of rare diseases, long latency time and multiple risk factors
• Cheap and effective – the most frequent analytical study design today
• Association measured in Odds ratio (odds among cases divided by odds among controls) with confidence intervals to express the statistical uncertainty
• Selection of control group difficult – controls should ideally be cases who just haven’t developed the disease
• Causes hard to determine, only associations
Next lesson: pitfallsand challenges in
case-control studies…
Top Related