


Languages
Pages
Legal


Department of Medical SciencesUniversity of Milan, Italy
Endocrinology and Diabetology Unit Fondazione Policlinico IRCCS
Milan, Italy
Paolo Beck-Peccoz
TSH-secreting pituitary adenomas

0
50
100
150
200
PureTSH-omas
GH PRL FSH/LH
72.2%
16.0%10.4%
1.4%
Nu
mb
er o
f ca
ses
TSH-omas mixed tumorBeck-Peccoz et al., Endocrine Reviews 1996;17:610–638.
Classification of TSH-secreting pituitary tumors

Euthyroid
Thyroid
Peripheral
tissue
Pituitary
TSH
T3T4
Hypothalamus
TRH
RTH
Peripheral
tissue
Pituitary
TSH
T3T4
TRH
Hypothalamus
Thyroid
Hyperthyroid
Peripheral
tissue
Pituitary
TSH
T3T4
TRH
Hypothalamus
Thyroid
& TSH-oma


Positive MRI in RTH patients
9 out of 22 (40%) patients with RTH showed the presence of a pituitary lesion at MRI/CT scan
Pituitary incidentaloma diagnosed in 8 cases
Possible association between RTH and TSH-omawas suspected, but not yet proved, in only one 62-yr-old woman
Nevertheless, the prevalence of pituitary incidentaloma appears higher in RTH patients (40%) than in the general population (20-30%)

Central Hyperthyroidism: serum levels of TSH and FT4Central Hyperthyroidism: serum levels of TSH and FT4
TSH mU/LTSH mU/L
Ser
um
FT
4 p
mol
/LS
eru
m F
T4
pm
ol/L
0.10.1 11 10101818
2727
3636
4545
5454
6363
RTH (n=59)TSH-omas (n=13)

CIRCULATING FACTORS MAY INTERFERE WITH MEASUREMENT OF TSH OR TOTAL AND FREE THYROID HORMONES
OVERESTIMATION OF SERUM LEVELS
CENTRAL HYPERTHYROIDISM?
Heterophylic Ab directed against mouse -globulins: interference
with monoclonal Ab used in the IRMA Anti-TSH Ab or Ab cross-reacting
with TSH
Anti-T4 and/oranti-T3 Ab
Abnormal forms of albuminor transthyretin (FDH)

DIFFERENTIAL DIAGNOSIS BETWEENTSH-OMAS AND RTH
•Age (years) 11-84 0.1-80 NS•Sex (F/M ratio) 1.28 1.17 NS•TSH mU/L 2.7±0.6 2.2±0.3 NS•FT4 pmol/L 40.0±4.2 29.5±2.5 NS•FT3 pmol/L 14.5±1.4 11.7±1.0 NS•SHBG nmol/L 113.0±17.2 62.0±4.0 <0.0001•Familial cases 0% 81% <0.0001•Lesions at CT scan or MRI 98% 10% <0.0001•High -subunit levels 65% 2% <0.0001•High -subunit/TSH m.r. 81% 2% <0.0001•Abnormal TSH response to TRH test 83% 4% <0.0001•Abnormal TSH response to T3 suppression test 100% 100% NS
PARAMETER TSH-omas RTH P

TSH biological activity in various thyroid disorders
RTHTSHomas
0
1
2
3
4
5
Cir
cula
tin
g T
SH
B/I
Persani et al., J Clin Endocrinol Metab. 1994; 78:1034–1039.

Net increments after TRH injection in RTHNet increments after TRH injection in RTH
FT4FT400
55
1010
1515
2020
pm
ol/L
pm
ol/L
**
FT3FT300
2.52.5
55
7.57.5
1010
pm
ol/L
pm
ol/L
**
TSHTSH00
1010
2020
3030
mU
/Lm
U/L
ControlsControls
RTHRTH* * PP<0.01 <0.01 vsvs controlscontrols
Beck-Peccoz&Persani, Eur J Endocrinol, 1994; 131:331-340

DIFFERENTIAL DIAGNOSIS BETWEENTSH-OMAS AND RTH
•Age (years) 11-84 0.1-80 NS•Sex (F/M ratio) 1.28 1.17 NS•TSH mU/L 2.7±0.6 2.2±0.3 NS•FT4 pmol/L 40.0±4.2 29.5±2.5 NS•FT3 pmol/L 14.5±1.4 11.7±1.0 NS•SHBG nmol/L 113.0±17.2 62.0±4.0 <0.0001•Familial cases 0% 81% <0.0001•Lesions at CT scan or MRI 98% 10% <0.0001•High -subunit levels 65% 2% <0.0001•High -subunit/TSH m.r. 81% 2% <0.0001•Abnormal TSH response to TRH test 83% 4% <0.0001•Abnormal TSH response to T3 suppression test 100% 100% NS
PARAMETER TSH-omas RTH P


Acute somatostatin analog injectionAcute somatostatin analog injection
-50-50
-25-25
Var
iati
ons
(% o
f b
asal
val
ues
)V
aria
tion
s (%
of
bas
al v
alu
es)
+25+25
00
+50+50 TSHTSH FT4FT4 FT3FT3
RTHRTH
TSH-omasTSH-omas
Mannavola et al., Clin Endocrinol 2005; 62: 176-181

2-3 months somatostatin analog administration2-3 months somatostatin analog administration
-50-50
-25-25
Var
iati
ons
(% o
f b
asal
val
ues
)V
aria
tion
s (%
of
bas
al v
alu
es)
+25+25
00
+50+50TSHTSH FT4FT4 FT3FT3
RTHRTH TSH-omasTSH-omas
Mannavola et al., Clin Endocrinol 2005; 62: 176-181

In summary:
normalelevated SHBG and -sub
negativepositive Imaging
NO YESFamily members
YESNO
YESNO
YESNO
TRH test
T3-suppression test
TRH test post T3
TRNO Molecular study
FT3 & FT4 two step
or TSH Ultrasensitive methods
TSH-oma
RTH


0
5
10
15
20
25
30
35
40
45
50
All patients Previousthyroidablation
No thyroidablation
Per
cen
t of
cas
es
IntrasellarExtrasellarInvasive

Different therapeutical approaches
• None• TH analogsTRIAC, DT4,
GC1 (binds wtTR>TR), HY1 (acts on TR mut
R320C)• Cardiac selective blockers• Inhibition of mutant gene
expression
• Neurosurgery
• Radiotherapy
• SRIH analogsOctreotideLanreotideSOM 230
RTH TSH-oma

Reduction of tumor mass
• complete 34% 29% 0%
• partial 34% 40% 51%
• absent 32% 31% 49%
Resolution of clinical symptoms
• yes 57% 62% 95%
• no 43% 38% 5%
Surgery Surgery +Rx SMS analogs (n=125) (n=57) (n=84)
TSH producing adenomas: results ofdifferent therapeutic approaches

0.1
1
10
1 2 3 4 5 6 7 8 9 10 11 12 13 14
T3 suppression test
Baseline
T3 suppression test
Baseline
Patients withintact thyroid
Patients withthyroid ablation
Case #
Before neurosurgery After neurosurgery
Se
rum
TS
H m
U/L

Results of chronic somatostatin analog treatmentof TSH-secreting pituitary adenomas
TSH/-GSU reduction 92% Thyroid hormone normalization 95% Vision improvement 75% Tumor mass shrinkage 52% True resistance 4% Discontinuation due to side effects 10%
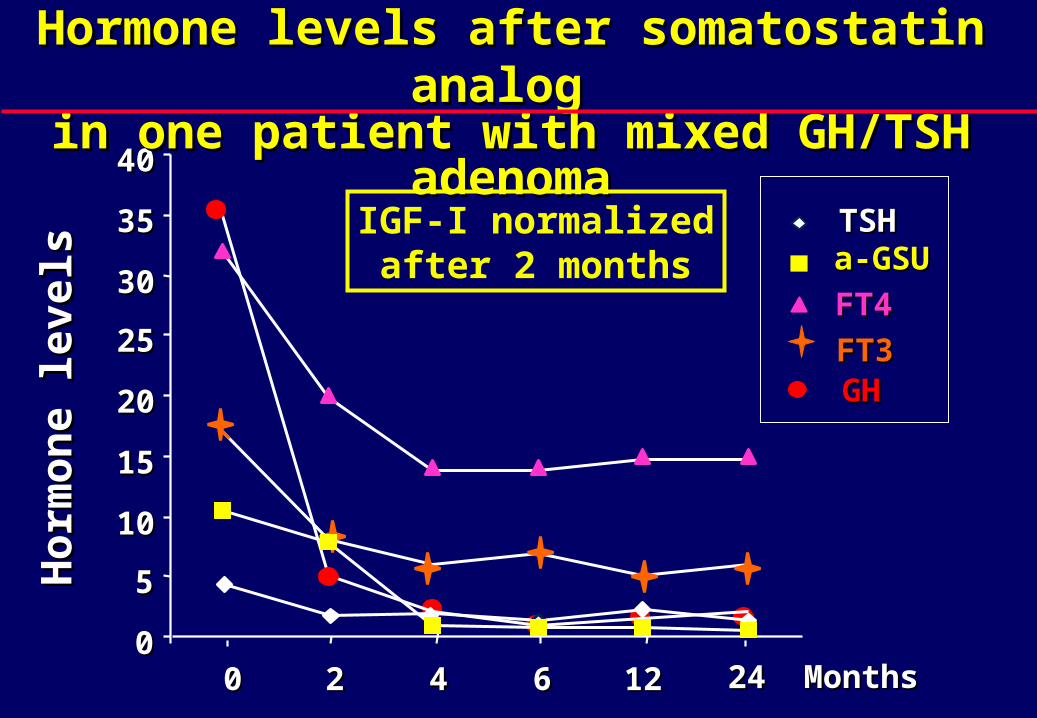
00
55
1010
1515
2020
2525
3030
3535
4040
00 22 44 66 1212 2424
TSHTSHa-GSUa-GSU
FT4FT4
FT3FT3GHGH
MonthsMonths
Hor
mon
e le
vels
Hor
mon
e le
vels
Hormone levels after somatostatin analog Hormone levels after somatostatin analog in one patient with mixed GH/TSH adenomain one patient with mixed GH/TSH adenoma
IGF-I normalizedafter 2 months

ACKNOWLEDGEMENTS
Luca Persani Deborah Mannavola
Irene CampiLaura Fugazzola Guia VannucchiMarco Bonomi Andrea LaniaSabrina CorbettaGiovanna MantovaniCarmela Asteria
Krishna ChatterjeeSamuel RefetoffAnna Spada
Top Related