


Languages
Pages
Legal


Demographic Trends in Kentucky by Race and Age: 2000-2030 Tom Sawyer and Sarah Ehresman Kentucky State Data Center University of Louisville Kentucky Arts Council Frankfort, Kentucky November 15, 2013
Data Sources
Decennial Census 2000
2010
Population Estimates Post-censal estimates
2012
Projections Demographic cohort-component method
2020
2030

Core Based Statistical Areas
CBSA’s are defined by counties
Metropolitan Statistical Areas Based on Urbanized Areas of 50,000 or more
Comprised of the host county plus neighboring counties linked by commuting
Micropolitan Statistical Areas Based on Urban Clusters of 10,000 – 49,999
Comprised of the host county plus neighboring counties linked by commuting
Rural Areas Counties not included within an urban area
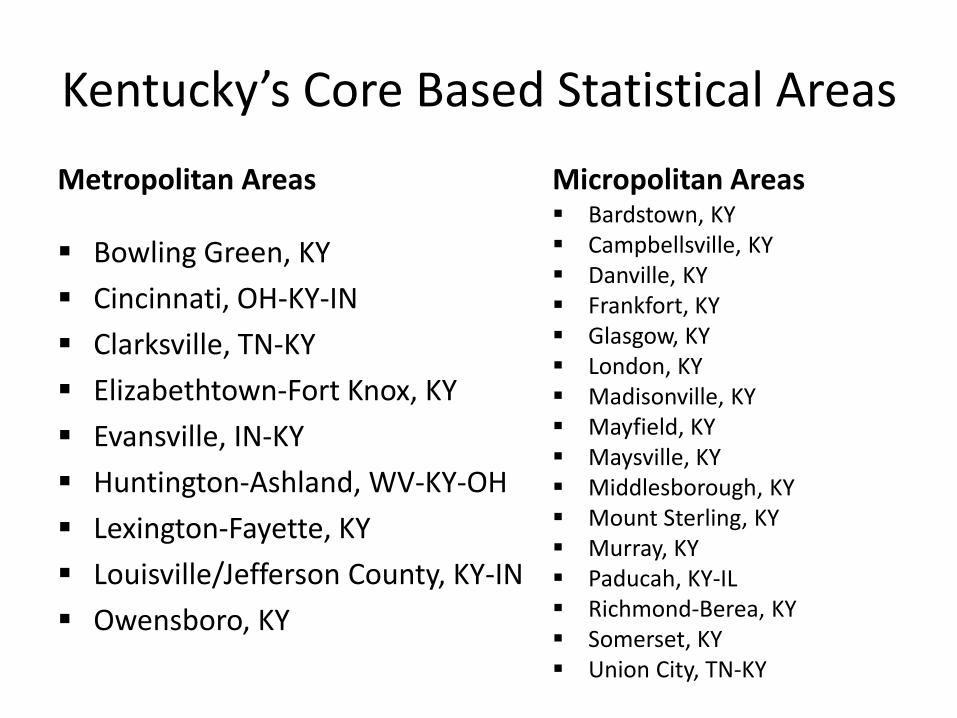
Kentucky’s Core Based Statistical Areas
Metropolitan Areas
Bowling Green, KY
Cincinnati, OH-KY-IN
Clarksville, TN-KY
Elizabethtown-Fort Knox, KY
Evansville, IN-KY
Huntington-Ashland, WV-KY-OH
Lexington-Fayette, KY
Louisville/Jefferson County, KY-IN
Owensboro, KY
Micropolitan Areas Bardstown, KY Campbellsville, KY Danville, KY Frankfort, KY Glasgow, KY London, KY Madisonville, KY Mayfield, KY Maysville, KY Middlesborough, KY Mount Sterling, KY Murray, KY Paducah, KY-IL Richmond-Berea, KY Somerset, KY Union City, TN-KY
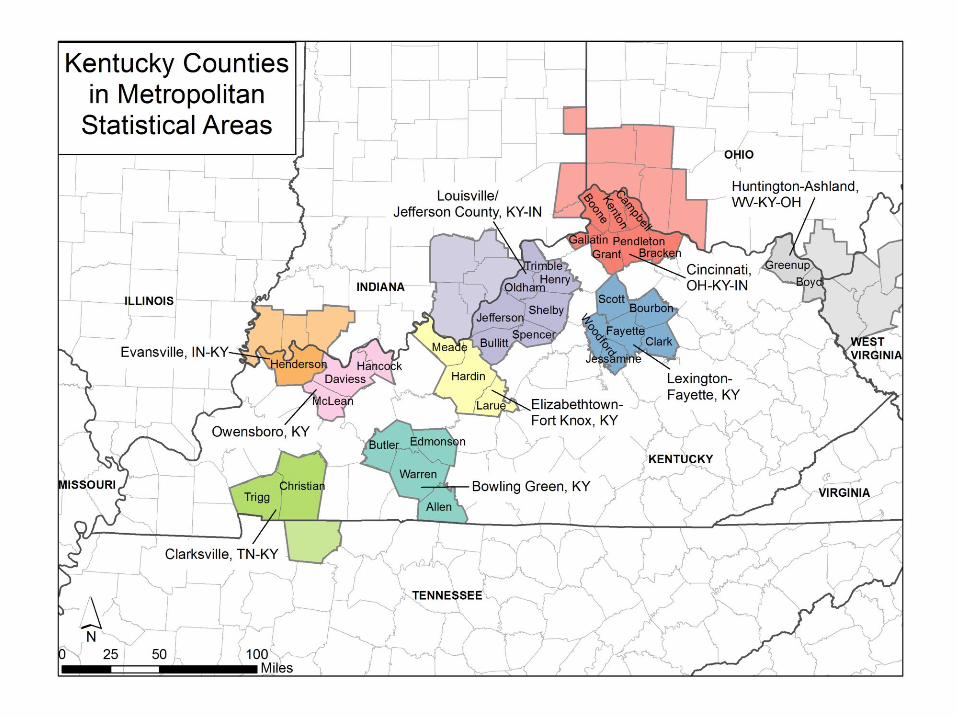
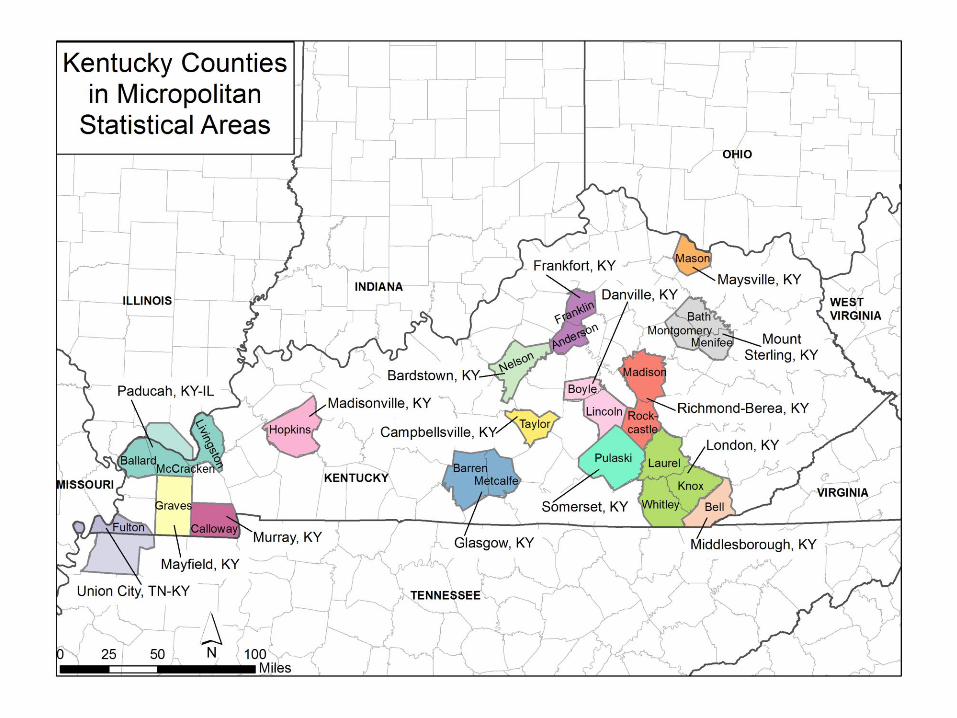


Kentucky Counties by Core Based Statistical Areas
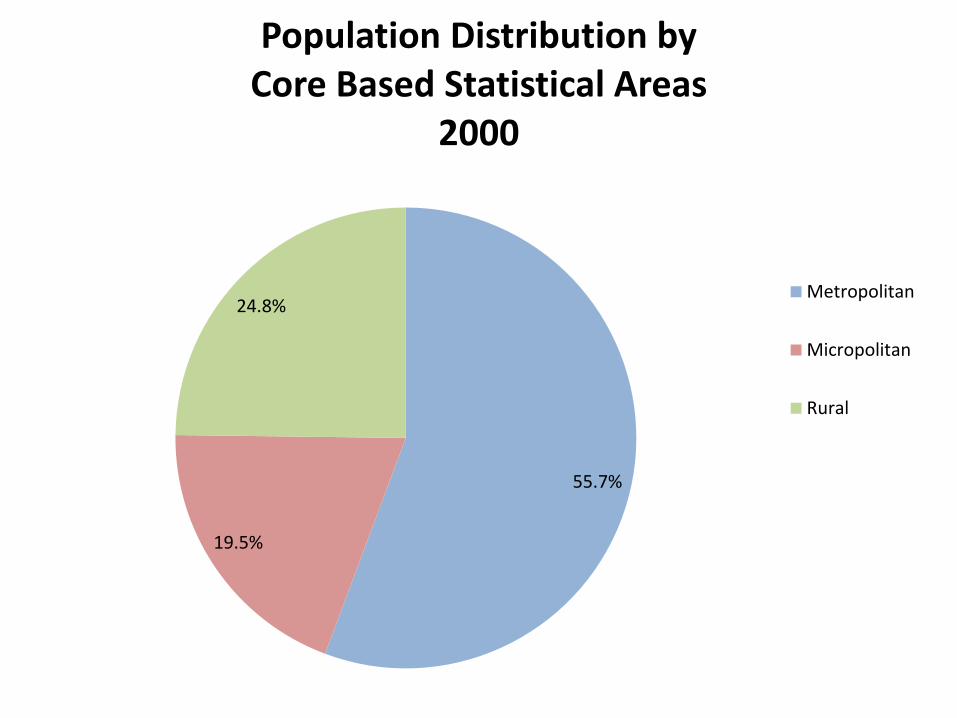
55.7%
19.5%
24.8%
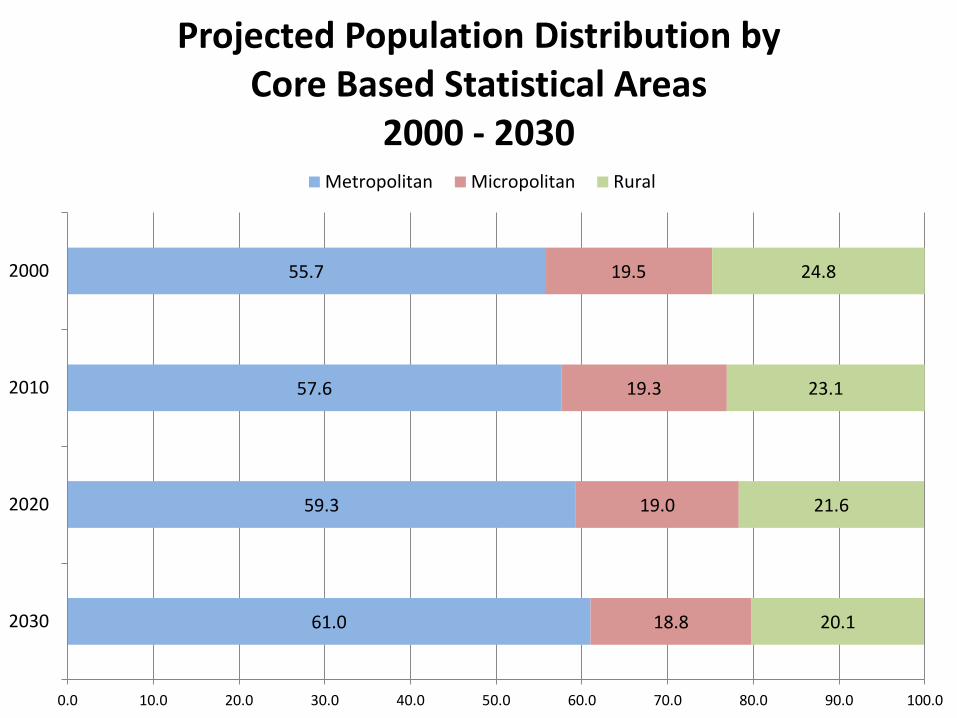
Population Distribution by Core Based Statistical Areas
2000
Metropolitan
Micropolitan
Rural
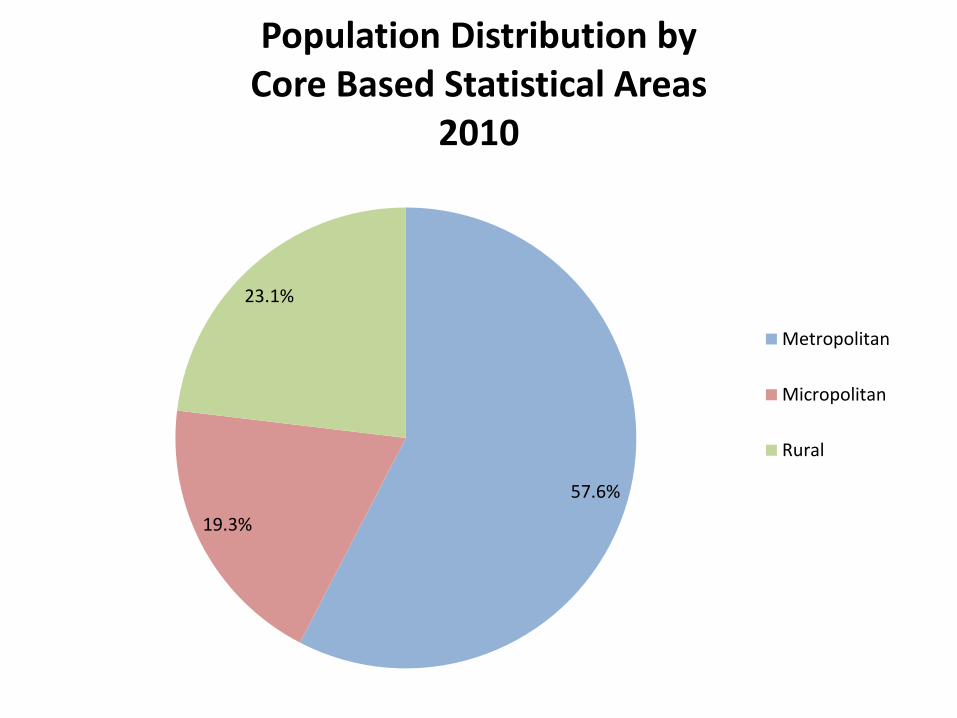
57.6%
19.3%
23.1%
Population Distribution by Core Based Statistical Areas
2010
Metropolitan
Micropolitan
Rural

0.1%
6.2%
11.0%
7.4%
0.0% 2.0% 4.0% 6.0% 8.0% 10.0% 12.0%
Rural
Micropolitan
Metropolitan
Kentucky
Population Growth 2000 - 2010

998
48,949
247,651
0 50,000 100,000 150,000 200,000 250,000 300,000
Rural
Micropolitan
Metropolitan
Population Growth 2000 - 2010
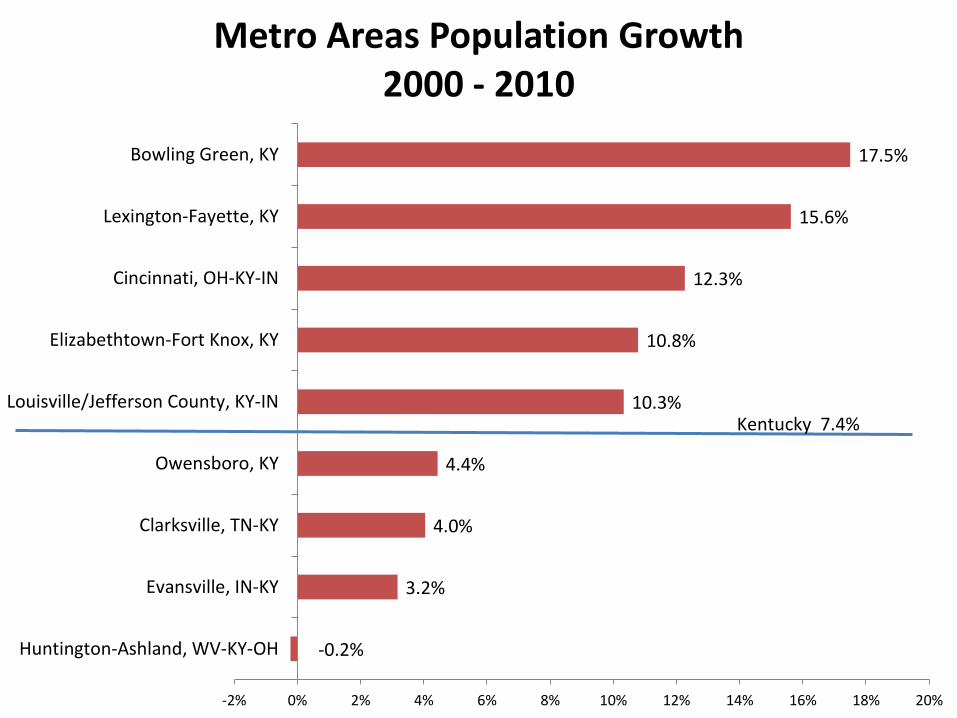
-0.2%
3.2%
4.0%
4.4%
10.3%
10.8%
12.3%
15.6%
17.5%
-2% 0% 2% 4% 6% 8% 10% 12% 14% 16% 18% 20%
Huntington-Ashland, WV-KY-OH
Evansville, IN-KY
Clarksville, TN-KY
Owensboro, KY
Louisville/Jefferson County, KY-IN
Elizabethtown-Fort Knox, KY
Cincinnati, OH-KY-IN
Lexington-Fayette, KY
Bowling Green, KY
Metro Areas Population Growth 2000 - 2010
Kentucky 7.4%

-12.1%
-4.6%
-0.3%
0.3%
0.9%
4.1%
4.1%
5.0%
5.9%
6.9%
8.7%
8.8%
10.5%
12.2%
14.3%
15.9%
-15% -10% -5% 0% 5% 10% 15% 20%
Union City, TN-KY
Middlesborough, KY
Paducah, KY-IL
Mayfield, KY
Madisonville, KY
Maysville, KY
Danville, KY
London, KY
Frankfort, KY
Campbellsville, KY
Glasgow, KY
Murray, KY
Mount Sterling, KY
Somerset, KY
Richmond-Berea, KY
Bardstown, KY
Micro Areas Population Growth 2000 – 2010
Kentucky 7.4%
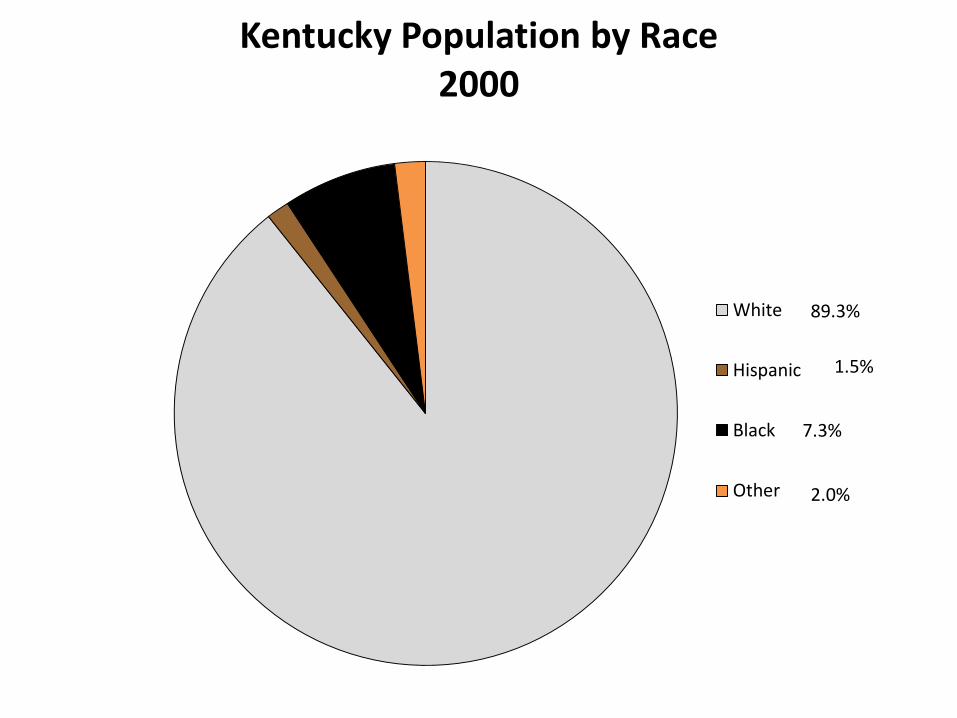
89.3%
1.5%
7.3%
2.0%
Kentucky Population by Race 2000
White
Hispanic
Black
Other

86.3%
3.1%
7.7%
2.9%
Kentucky Population by Race 2010
White
Hispanic
Black
Other

95.7%
93.0%
85.1%
89.3%
0.9%
1.0%
1.9%
1.5%
2.4%
4.5%
10.4%
7.3%
1.0%
1.5%
2.6%
2.0%
0% 10% 20% 30% 40% 50% 60% 70% 80% 90% 100%
Rural
Micropolitan
Metropolitan
Kentucky
Population by Race 2000
White Hispanic Black Other

94.7%
91.4%
81.2%
86.3%
1.5%
2.0%
4.0%
3.1%
2.4%
4.4%
10.9%
7.7%
1.4%
2.3%
3.8%
2.9%
0% 10% 20% 30% 40% 50% 60% 70% 80% 90% 100%
Rural
Micropolitan
Metropolitan
Kentucky
Population by Race 2010
White Hispanic Black Other
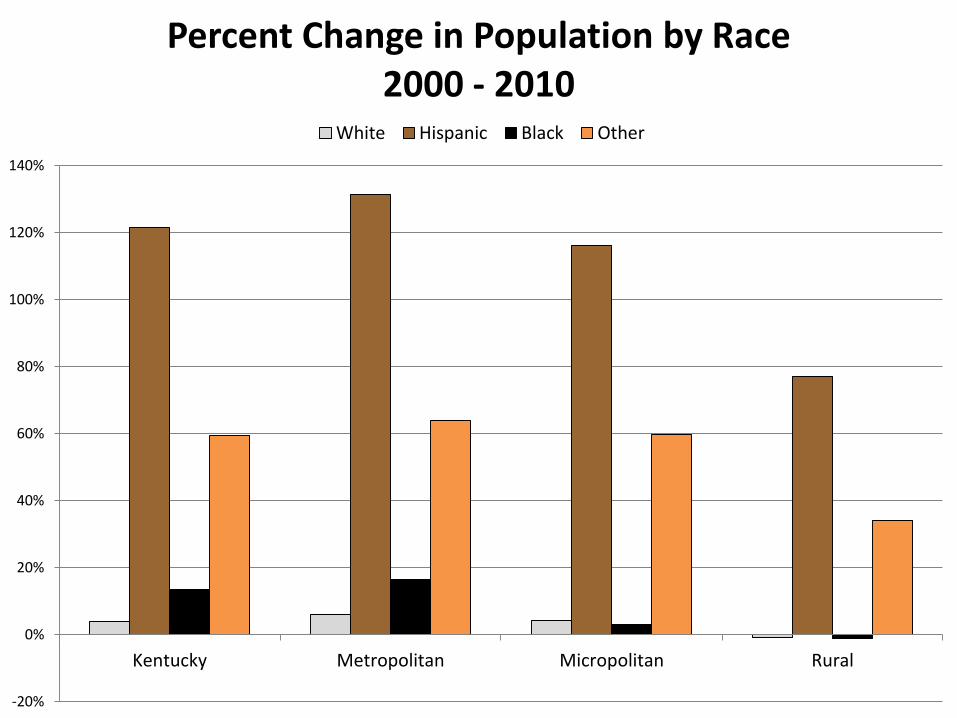
-20%
0%
20%
40%
60%
80%
100%
120%
140%
Kentucky Metropolitan Micropolitan Rural
Percent Change in Population by Race 2000 - 2010
White Hispanic Black Other
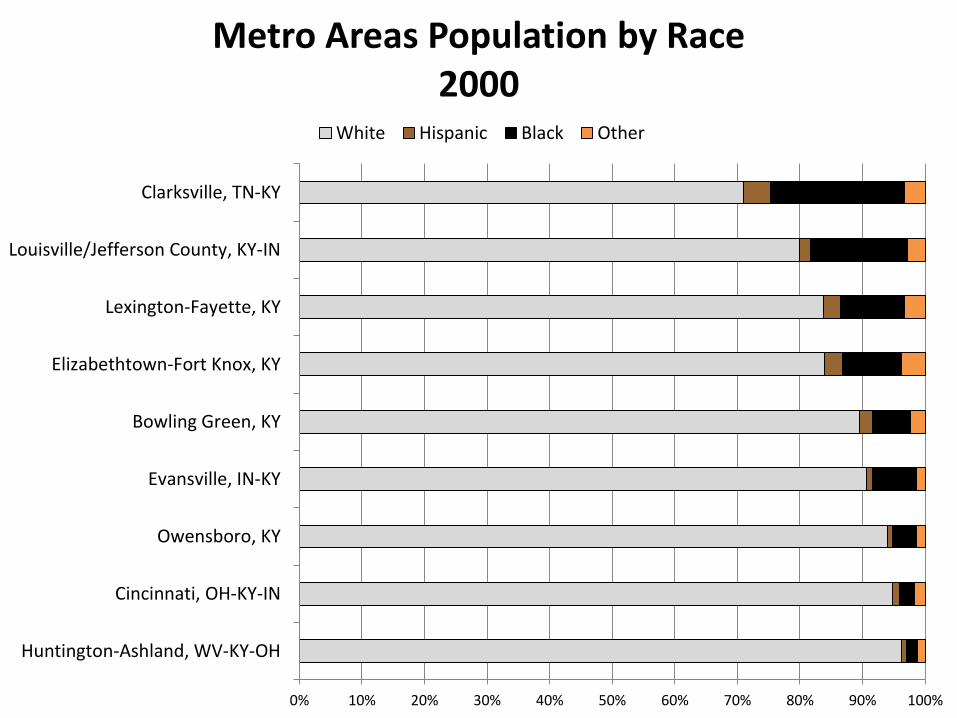
0% 10% 20% 30% 40% 50% 60% 70% 80% 90% 100%
Huntington-Ashland, WV-KY-OH
Cincinnati, OH-KY-IN
Owensboro, KY
Evansville, IN-KY
Bowling Green, KY
Elizabethtown-Fort Knox, KY
Lexington-Fayette, KY
Louisville/Jefferson County, KY-IN
Clarksville, TN-KY
Metro Areas Population by Race 2000
White Hispanic Black Other
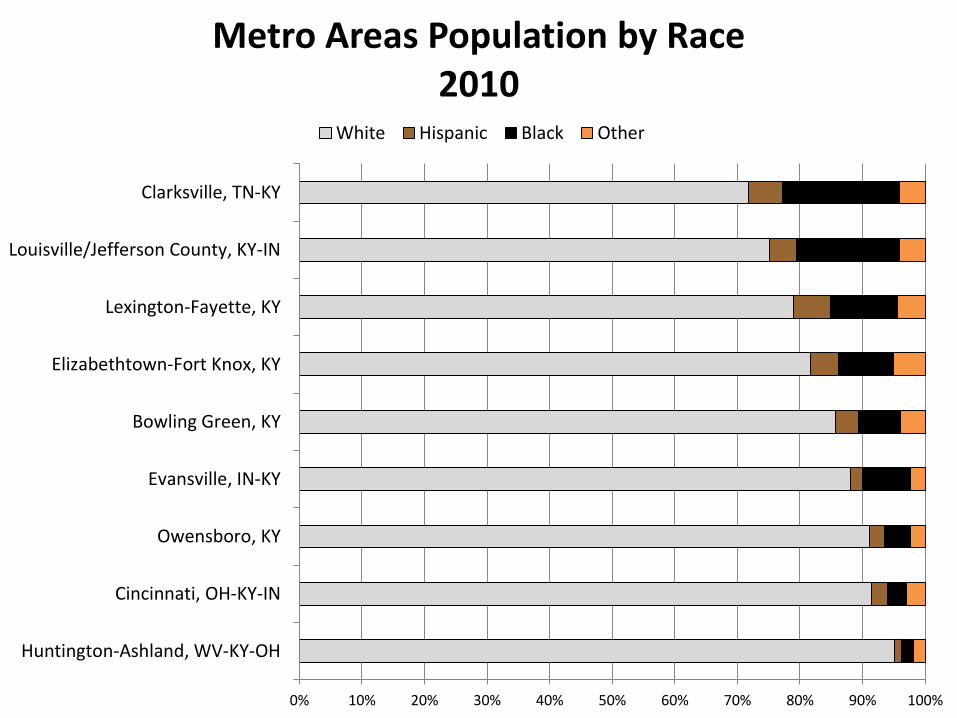
0% 10% 20% 30% 40% 50% 60% 70% 80% 90% 100%
Huntington-Ashland, WV-KY-OH
Cincinnati, OH-KY-IN
Owensboro, KY
Evansville, IN-KY
Bowling Green, KY
Elizabethtown-Fort Knox, KY
Lexington-Fayette, KY
Louisville/Jefferson County, KY-IN
Clarksville, TN-KY
Metro Areas Population by Race 2010
White Hispanic Black Other
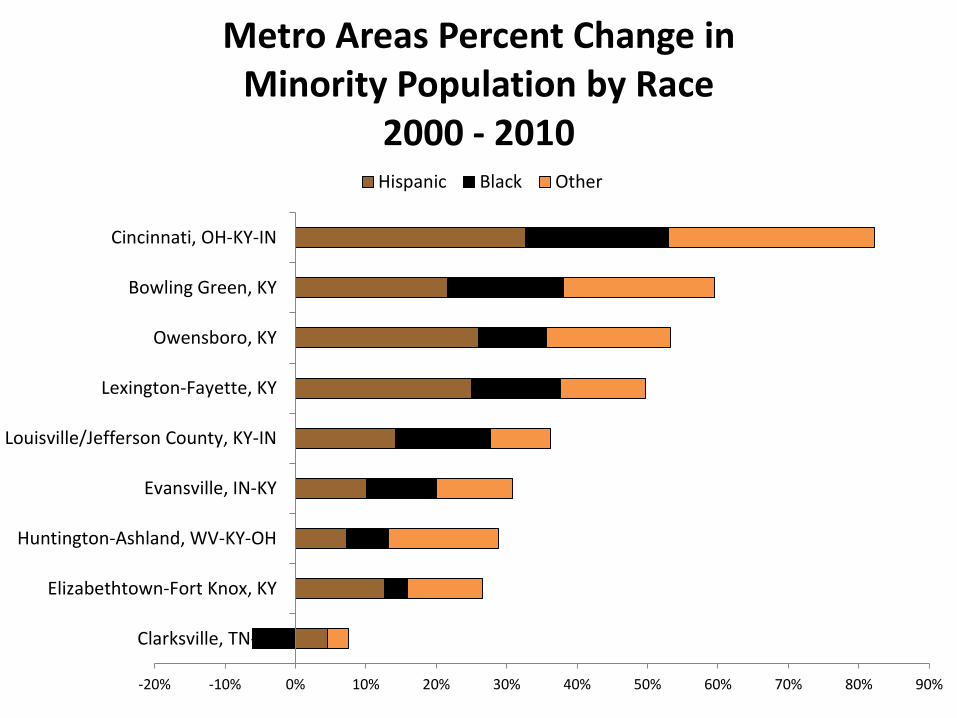
-20% -10% 0% 10% 20% 30% 40% 50% 60% 70% 80% 90%
Clarksville, TN-KY
Elizabethtown-Fort Knox, KY
Huntington-Ashland, WV-KY-OH
Evansville, IN-KY
Louisville/Jefferson County, KY-IN
Lexington-Fayette, KY
Owensboro, KY
Bowling Green, KY
Cincinnati, OH-KY-IN
Metro Areas Percent Change in Minority Population by Race
2000 - 2010 Hispanic Black Other
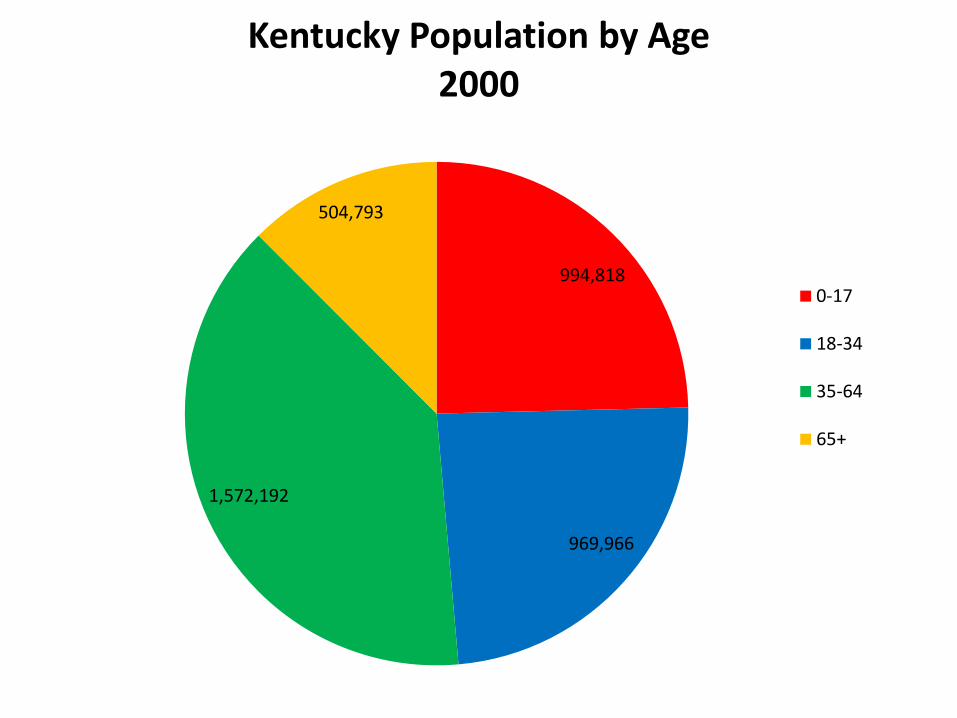
994,818
969,966
1,572,192
504,793
Kentucky Population by Age 2000
0-17
18-34
35-64
65+

1,027,486
974,902 1,758,752
578,227
Kentucky Population by Age 2010
0-17
18-34
35-64
65+
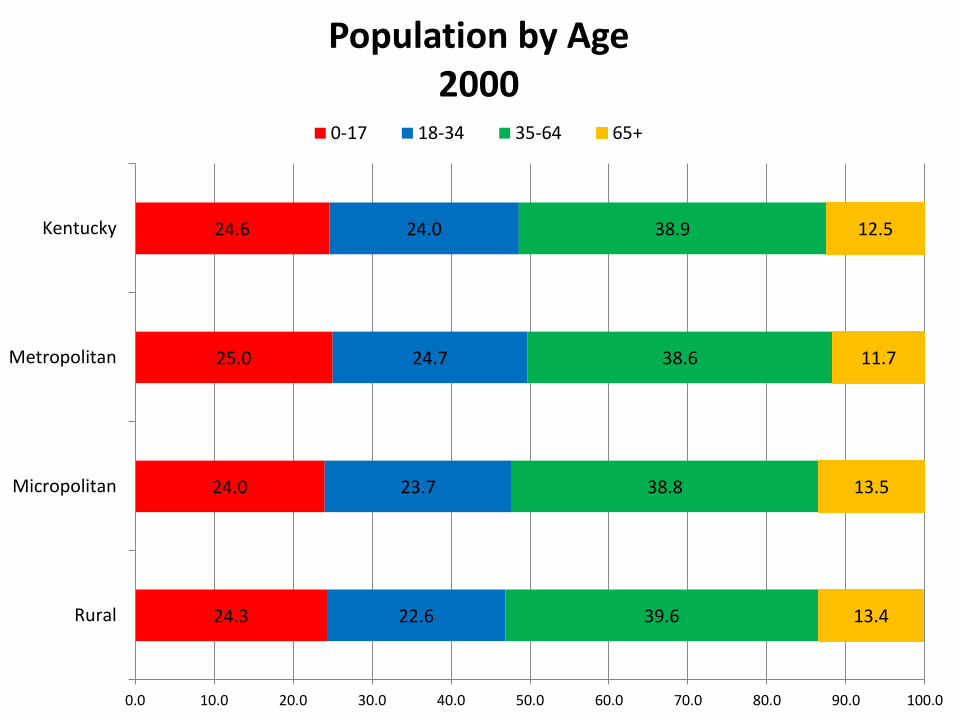
24.3
24.0
25.0
24.6
22.6
23.7
24.7
24.0
39.6
38.8
38.6
38.9
13.4
13.5
11.7
12.5
0.0 10.0 20.0 30.0 40.0 50.0 60.0 70.0 80.0 90.0 100.0
Rural
Micropolitan
Metropolitan
Kentucky
Population by Age 2000
0-17 18-34 35-64 65+
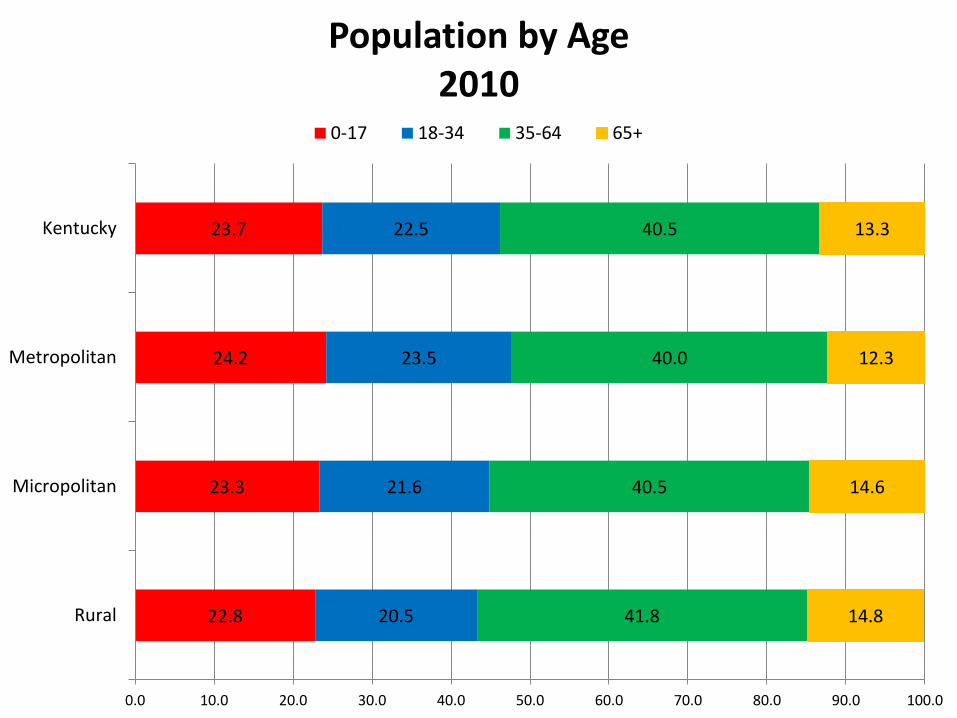
22.8
23.3
24.2
23.7
20.5
21.6
23.5
22.5
41.8
40.5
40.0
40.5
14.8
14.6
12.3
13.3
0.0 10.0 20.0 30.0 40.0 50.0 60.0 70.0 80.0 90.0 100.0
Rural
Micropolitan
Metropolitan
Kentucky
Population by Age 2010
0-17 18-34 35-64 65+

-3.0
-1.0
1.0
3.0
5.0
7.0
9.0
11.0
13.0
Kentucky Metropolitan Micropolitan Rural
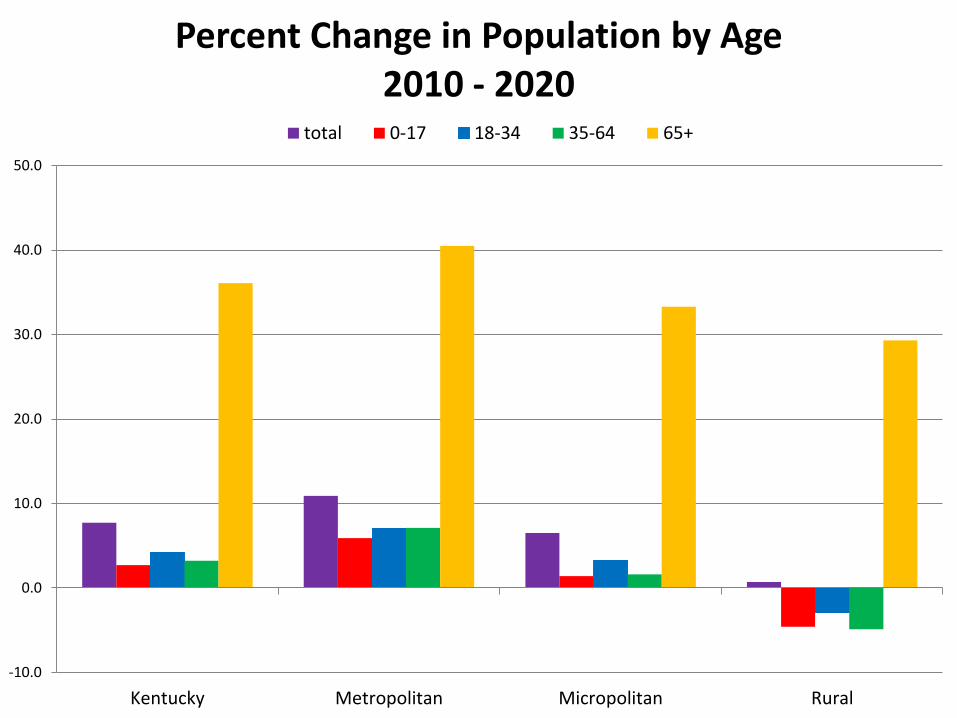
Percent Change in Population by Age 2000-2010
total 0-17 18-34 35-64 65+

25.7
24.7
22.9
22.6
24.6
27.7
27.5
26.9
23.7
21.6
22.9
29
20.9
21.8
24.3
31.3
24.1
27.8
39
39.8
37.8
41.4
40.4
38.1
30.4
38.3
37
13.7
12.6
10.3
15.2
13.1
9.9
10.8
10.7
11.5
Owensboro, KY
Louisville/Jefferson County, KY-IN
Lexington-Fayette, KY
Huntington-Ashland, WV-KY-OH
Evansville, IN-KY
Elizabethtown-Fort Knox, KY
Clarksville, TN-KY
Cincinnati, OH-KY-IN
Bowling Green, KY
Metro Areas by Age 2000
0-17 18-34 35-64 65+
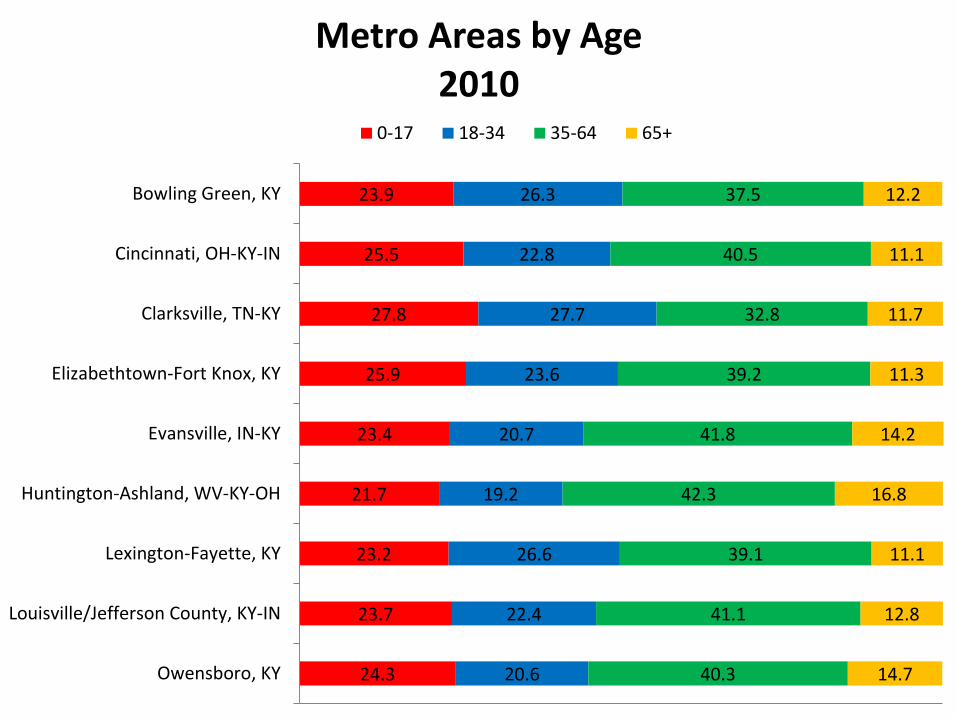
24.3
23.7
23.2
21.7
23.4
25.9
27.8
25.5
23.9
20.6
22.4
26.6
19.2
20.7
23.6
27.7
22.8
26.3
40.3
41.1
39.1
42.3
41.8
39.2
32.8
40.5
37.5
14.7
12.8
11.1
16.8
14.2
11.3
11.7
11.1
12.2
Owensboro, KY
Louisville/Jefferson County, KY-IN
Lexington-Fayette, KY
Huntington-Ashland, WV-KY-OH
Evansville, IN-KY
Elizabethtown-Fort Knox, KY
Clarksville, TN-KY
Cincinnati, OH-KY-IN
Bowling Green, KY
Metro Areas by Age 2010
0-17 18-34 35-64 65+
-20.0 -10.0 0.0 10.0 20.0 30.0 40.0 50.0 60.0 70.0 80.0
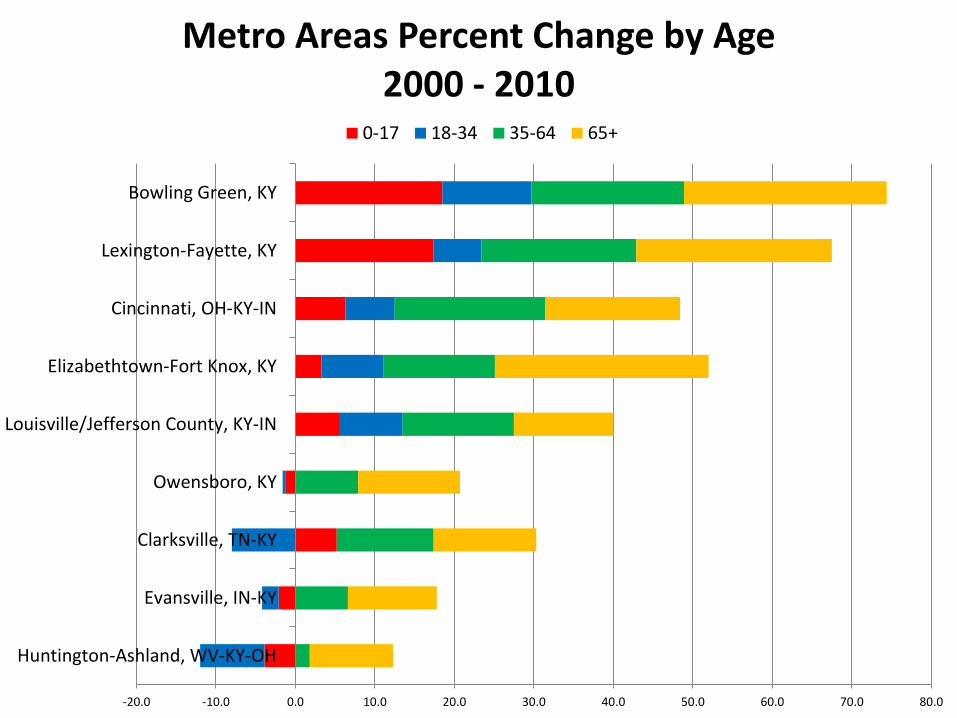
Huntington-Ashland, WV-KY-OH
Evansville, IN-KY
Clarksville, TN-KY
Owensboro, KY
Louisville/Jefferson County, KY-IN
Elizabethtown-Fort Knox, KY
Cincinnati, OH-KY-IN
Lexington-Fayette, KY
Bowling Green, KY
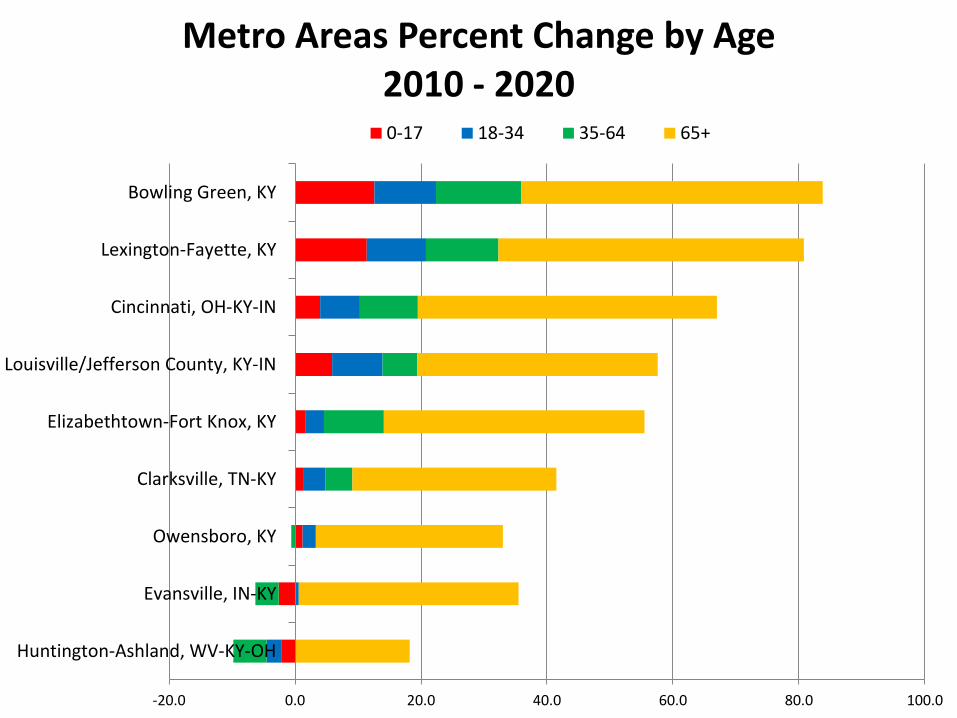
Metro Areas Percent Change by Age 2000 - 2010
0-17 18-34 35-64 65+

58.0%
19.2%
22.8%
Population Distribution by Core Based Statistical Areas
2012
Metropolitan
Micropolitan
Rural

-6,065
5,248
41,865
41,048
Rural
Micropolitan
Metropolitan
Kentucky
Population Growth 2010 - 2012
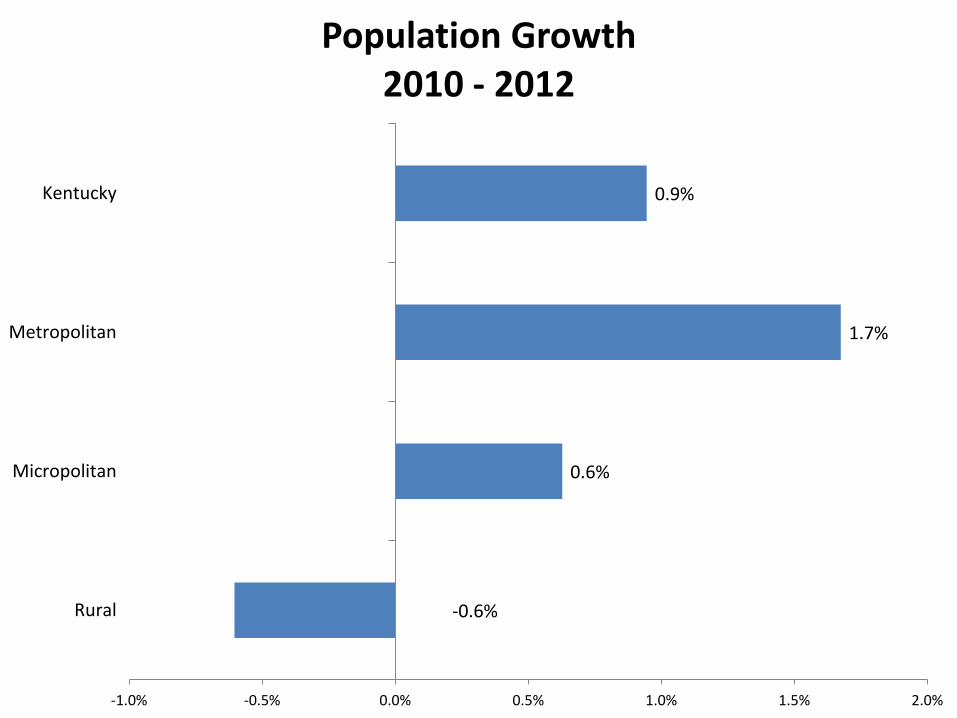
-0.6%
0.6%
1.7%
0.9%
-1.0% -0.5% 0.0% 0.5% 1.0% 1.5% 2.0%
Rural
Micropolitan
Metropolitan
Kentucky
Population Growth 2010 - 2012
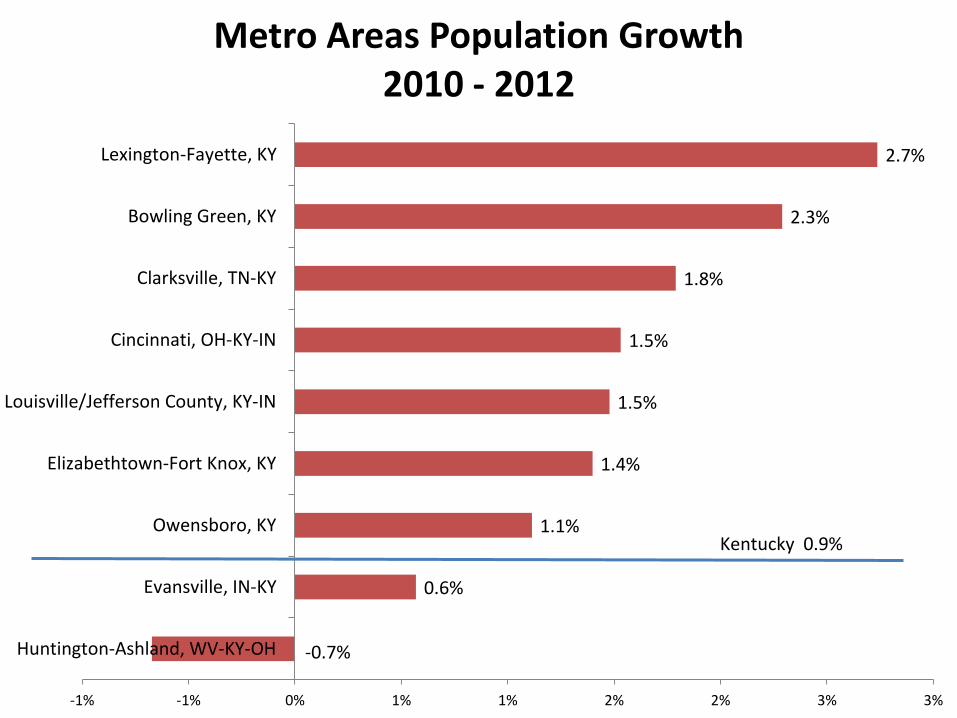
-0.7%
0.6%
1.1%
1.4%
1.5%
1.5%
1.8%
2.3%
2.7%
-1% -1% 0% 1% 1% 2% 2% 3% 3%
Huntington-Ashland, WV-KY-OH
Evansville, IN-KY
Owensboro, KY
Elizabethtown-Fort Knox, KY
Louisville/Jefferson County, KY-IN
Cincinnati, OH-KY-IN
Clarksville, TN-KY
Bowling Green, KY
Lexington-Fayette, KY
Metro Areas Population Growth 2010 - 2012
Kentucky 0.9%
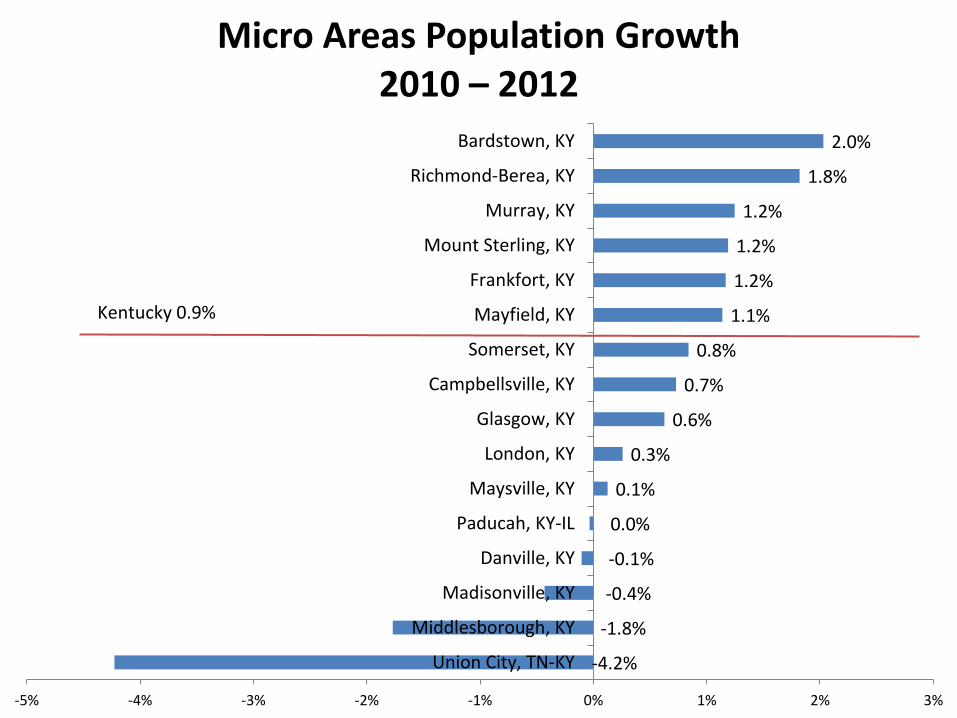
-4.2%
-1.8%
-0.4%
-0.1%
0.0%
0.1%
0.3%
0.6%
0.7%
0.8%
1.1%
1.2%
1.2%
1.2%
1.8%
2.0%
-5% -4% -3% -2% -1% 0% 1% 2% 3%
Union City, TN-KY
Middlesborough, KY
Madisonville, KY
Danville, KY
Paducah, KY-IL
Maysville, KY
London, KY
Glasgow, KY
Campbellsville, KY
Somerset, KY
Mayfield, KY
Frankfort, KY
Mount Sterling, KY
Murray, KY
Richmond-Berea, KY
Bardstown, KY
Micro Areas Population Growth 2010 – 2012
Kentucky 0.9%
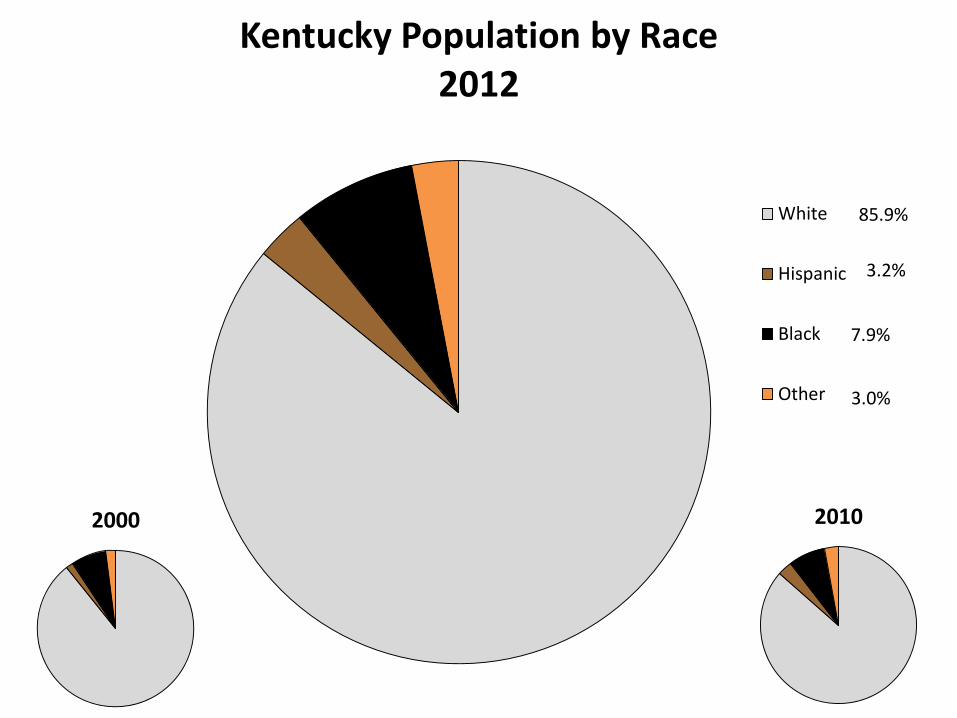
85.9%
3.2%
7.9%
3.0%
Kentucky Population by Race 2012
White
Hispanic
Black
Other
2000 2010

94.4%
91.1%
80.8%
85.9%
1.7%
2.1%
4.2%
3.2%
2.5%
4.5%
11.1%
7.9%
1.4%
2.3%
3.9%
3.0%
0% 10% 20% 30% 40% 50% 60% 70% 80% 90% 100%
Rural
Micropolitan
Metropolitan
Kentucky
Population by Race 2012
White Hispanic Black Other
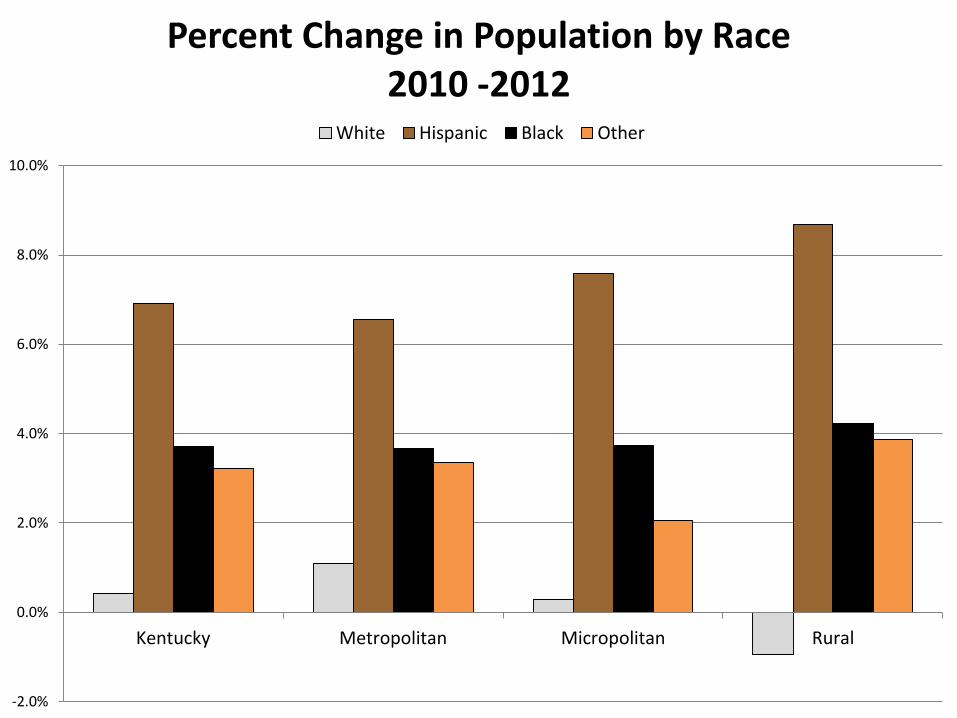
-2.0%
0.0%
2.0%
4.0%
6.0%
8.0%
10.0%
Kentucky Metropolitan Micropolitan Rural
Percent Change in Population by Race 2010 -2012
White Hispanic Black Other

0% 10% 20% 30% 40% 50% 60% 70% 80% 90% 100%
Huntington-Ashland, WV-KY-OH
Cincinnati, OH-KY-IN
Owensboro, KY
Evansville, IN-KY
Bowling Green, KY
Elizabethtown-Fort Knox, KY
Lexington-Fayette, KY
Louisville/Jefferson County, KY-IN
Clarksville, TN-KY
Metro Areas Population by Race 2012
White Hispanic Black Other

-1% 0% 1% 2% 3% 4% 5% 6% 7% 8%
Louisville/Jefferson County, KY-IN
Owensboro, KY
Evansville, IN-KY
Huntington-Ashland, WV-KY-OH
Lexington-Fayette, KY
Clarksville, TN-KY
Bowling Green, KY
Elizabethtown-Fort Knox, KY
Cincinnati, OH-KY-IN
Metro Areas Percent Change in Minority Population by Race
2010 - 2012 Hispanic Black Other
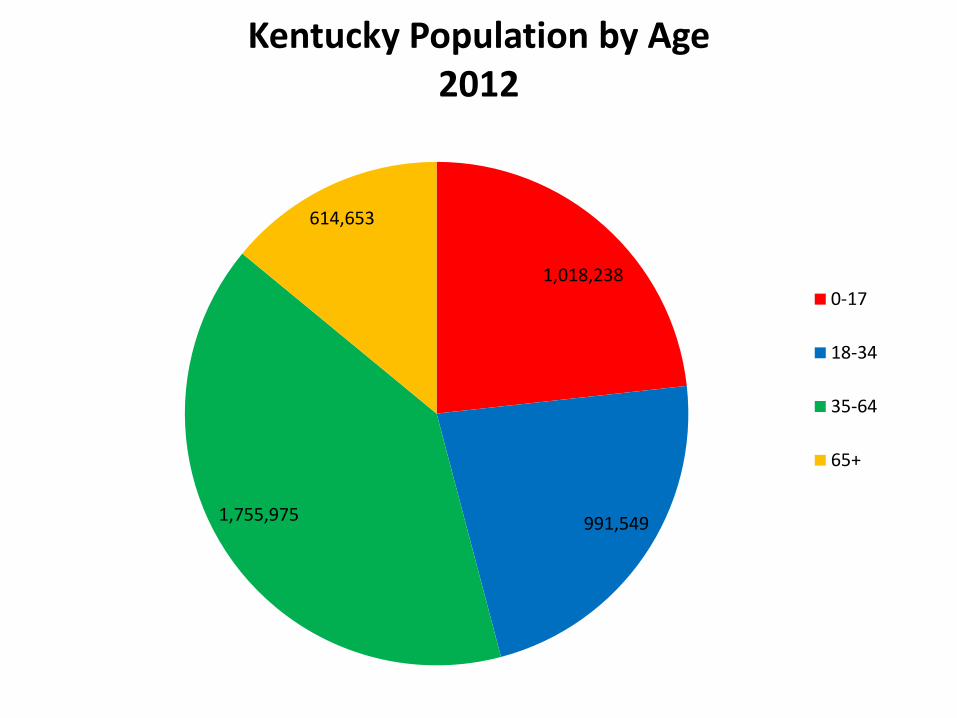
1,018,238
991,549 1,755,975
614,653
Kentucky Population by Age 2012
0-17
18-34
35-64
65+
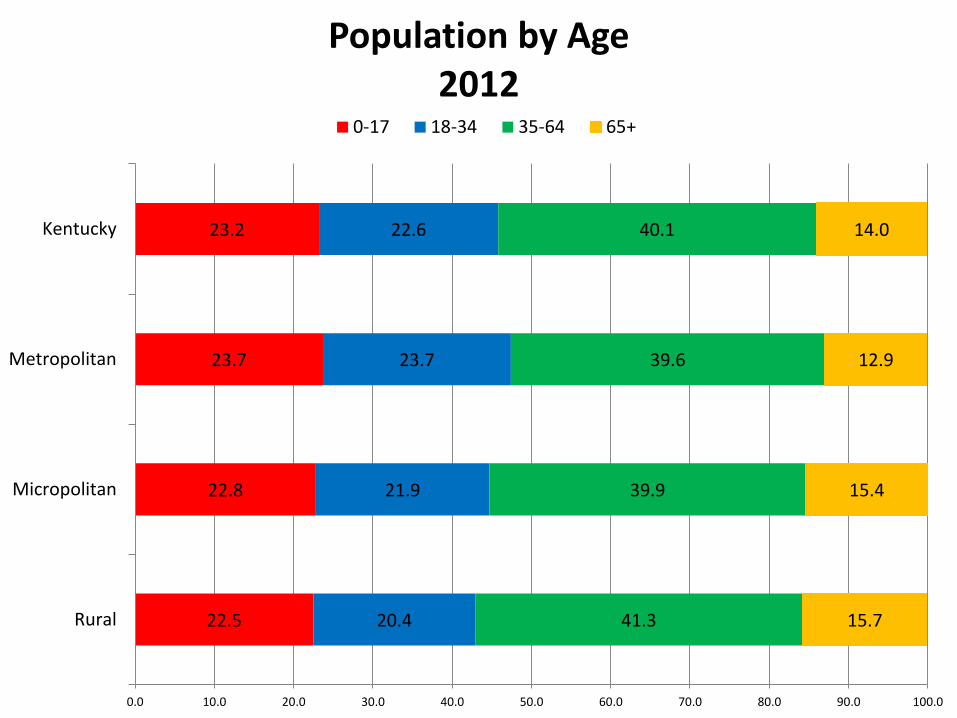
22.5
22.8
23.7
23.2
20.4
21.9
23.7
22.6
41.3
39.9
39.6
40.1
15.7
15.4
12.9
14.0
0.0 10.0 20.0 30.0 40.0 50.0 60.0 70.0 80.0 90.0 100.0
Rural
Micropolitan
Metropolitan
Kentucky
Population by Age 2012
0-17 18-34 35-64 65+
-1.0
-0.5
0.0
0.5
1.0
1.5
2.0
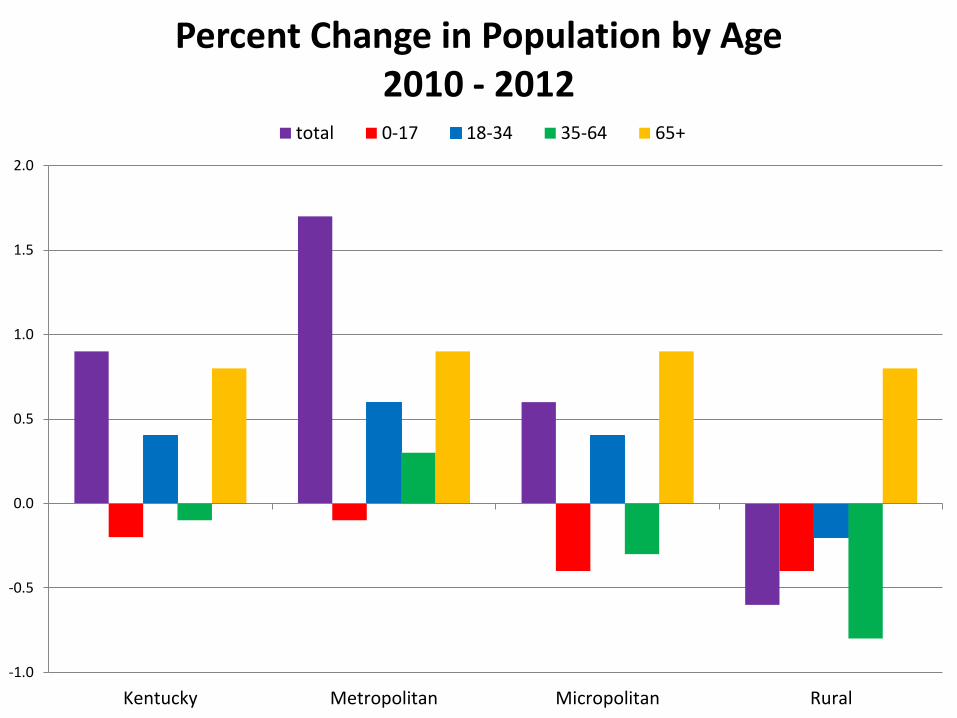
Kentucky Metropolitan Micropolitan Rural
Percent Change in Population by Age 2010 - 2012
total 0-17 18-34 35-64 65+

24.3
23.4
22.4
21.6
23.5
25.3
26.7
25.3
22.6
20.6
22.4
27.1
19.2
20.7
23.3
29.5
22.6
27.5
39.6
40.7
38.8
41.7
41
39.5
31.8
40.3
37
15.5
13.5
11.7
17.5
14.8
11.9
11.9
11.8
12.9
Owensboro, KY
Louisville/Jefferson County, KY-IN
Lexington-Fayette, KY
Huntington-Ashland, WV-KY-OH
Evansville, IN-KY
Elizabethtown-Fort Knox, KY
Clarksville, TN-KY
Cincinnati, OH-KY-IN
Bowling Green, KY
Metro Areas by Age 2012
0-17 18-34 35-64 65+

-10.0 -5.0 0.0 5.0 10.0 15.0 20.0
Huntington-Ashland, WV-KY-OH
Evansville, IN-KY
Owensboro, KY
Elizabethtown-Fort Knox, KY
Louisville/Jefferson County, KY-IN
Cincinnati, OH-KY-IN
Clarksville, TN-KY
Bowling Green, KY
Lexington-Fayette, KY
Metro Areas Percent Change by Age 2010-2012
0-17 18-34 35-64 65+

59.3% 19.0%
21.6%
Projected Population Distribution by Core Based Statistical Areas
2020
Metropolitan
Micropolitan
Rural
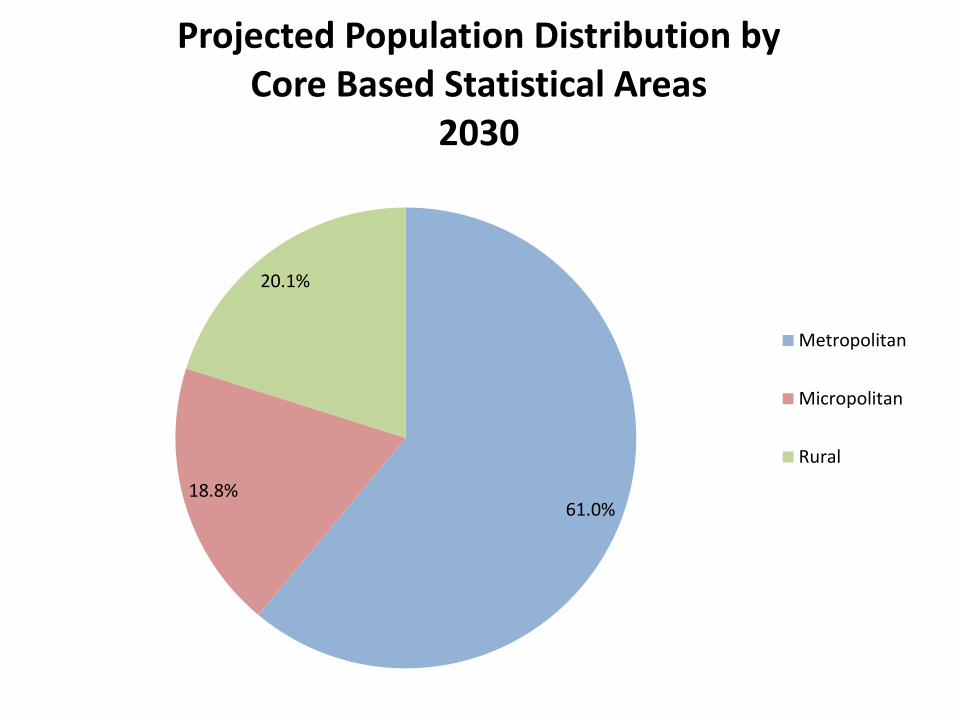
61.0% 18.8%
20.1%
Projected Population Distribution by Core Based Statistical Areas
2030
Metropolitan
Micropolitan
Rural
61.0
59.3
57.6
55.7
18.8
19.0
19.3
19.5
20.1
21.6
23.1
24.8
0.0 10.0 20.0 30.0 40.0 50.0 60.0 70.0 80.0 90.0 100.0
2030
2020
2010
2000
Projected Population Distribution by Core Based Statistical Areas
2000 - 2030 Metropolitan Micropolitan Rural

0.7%
6.5%
10.9%
7.7%
-1.5%
4.7%
9.1%
6.0%
-5% 0% 5% 10% 15% 20% 25%
Rural
Micropolitan
Metropolitan
Kentucky
Projected Population Growth 2010-2030
2010 - 2020 2020 - 2030
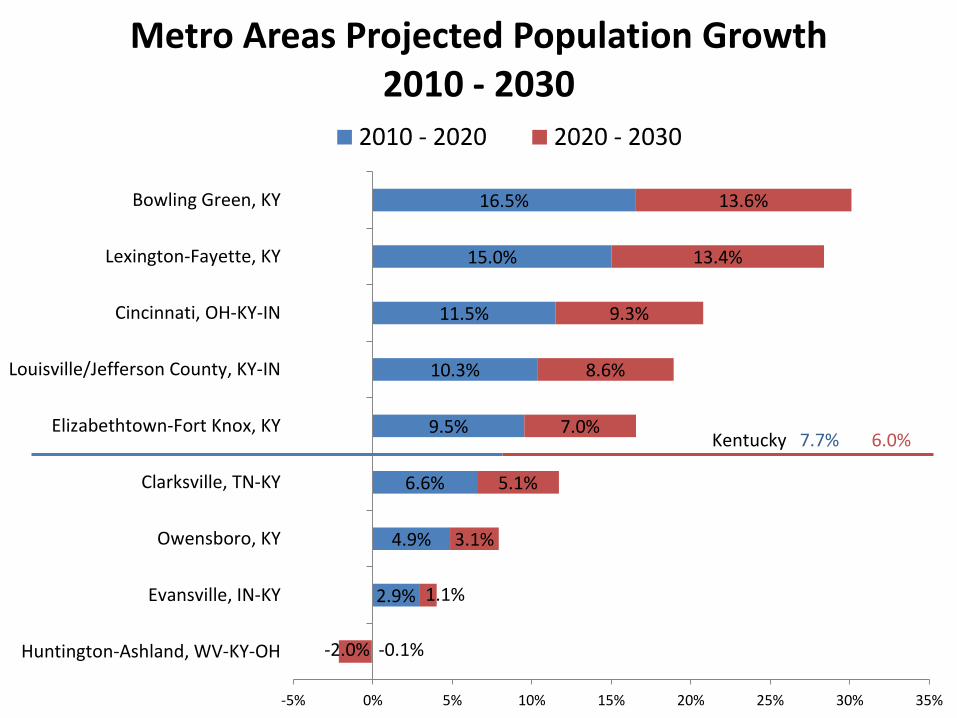
-0.1%
2.9%
4.9%
6.6%
9.5%
10.3%
11.5%
15.0%
16.5%
-2.0%
1.1%
3.1%
5.1%
7.0%
8.6%
9.3%
13.4%
13.6%
-5% 0% 5% 10% 15% 20% 25% 30% 35%
Huntington-Ashland, WV-KY-OH
Evansville, IN-KY
Owensboro, KY
Clarksville, TN-KY
Elizabethtown-Fort Knox, KY
Louisville/Jefferson County, KY-IN
Cincinnati, OH-KY-IN
Lexington-Fayette, KY
Bowling Green, KY
Metro Areas Projected Population Growth 2010 - 2030
2010 - 2020 2020 - 2030
Kentucky 7.7% 6.0%
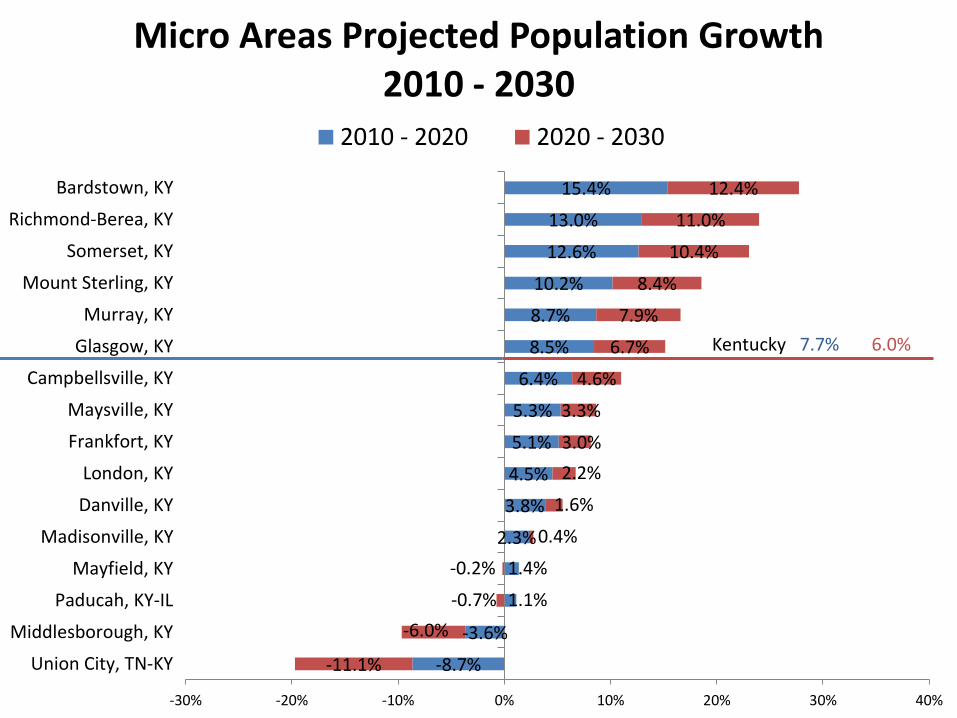
-8.7%
-3.6%
1.1%
1.4%
2.3%
3.8%
4.5%
5.1%
5.3%
6.4%
8.5%
8.7%
10.2%
12.6%
13.0%
15.4%
-11.1%
-6.0%
-0.7%
-0.2%
0.4%
1.6%
2.2%
3.0%
3.3%
4.6%
6.7%
7.9%
8.4%
10.4%
11.0%
12.4%
-30% -20% -10% 0% 10% 20% 30% 40%
Union City, TN-KY
Middlesborough, KY
Paducah, KY-IL
Mayfield, KY
Madisonville, KY
Danville, KY
London, KY
Frankfort, KY
Maysville, KY
Campbellsville, KY
Glasgow, KY
Murray, KY
Mount Sterling, KY
Somerset, KY
Richmond-Berea, KY
Bardstown, KY
Micro Areas Projected Population Growth 2010 - 2030
2010 - 2020 2020 - 2030
Kentucky 7.7% 6.0%
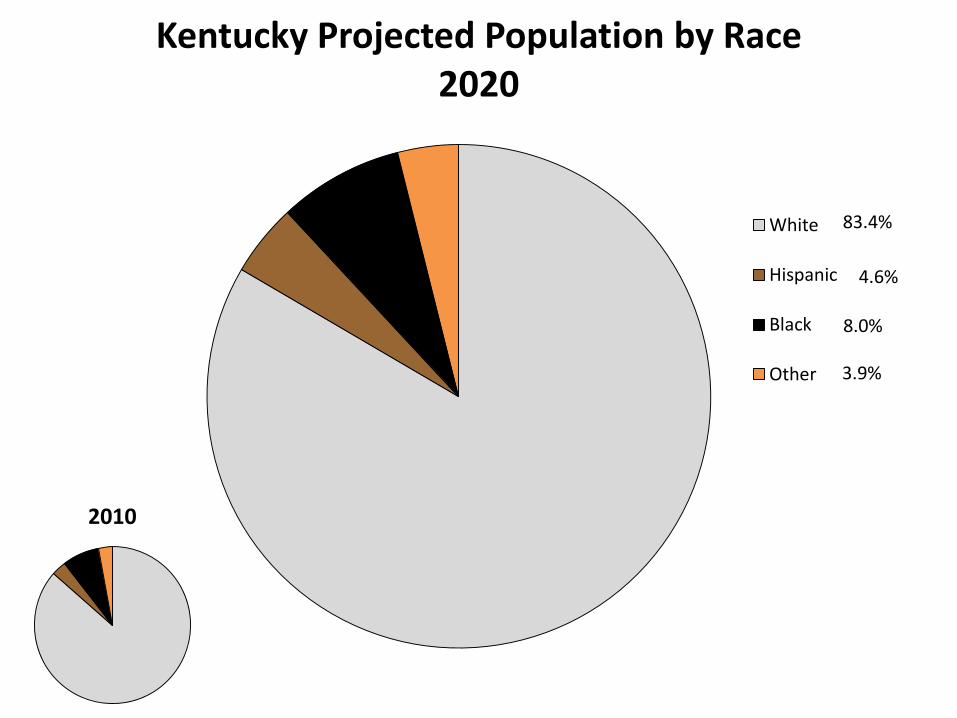
83.4%
4.6%
8.0%
3.9%
Kentucky Projected Population by Race 2020
White
Hispanic
Black
Other
2010

80.5%
6.2%
8.4%
4.9%
Kentucky Projected Population by Race 2030
White
Hispanic
Black
Other
2010 2020
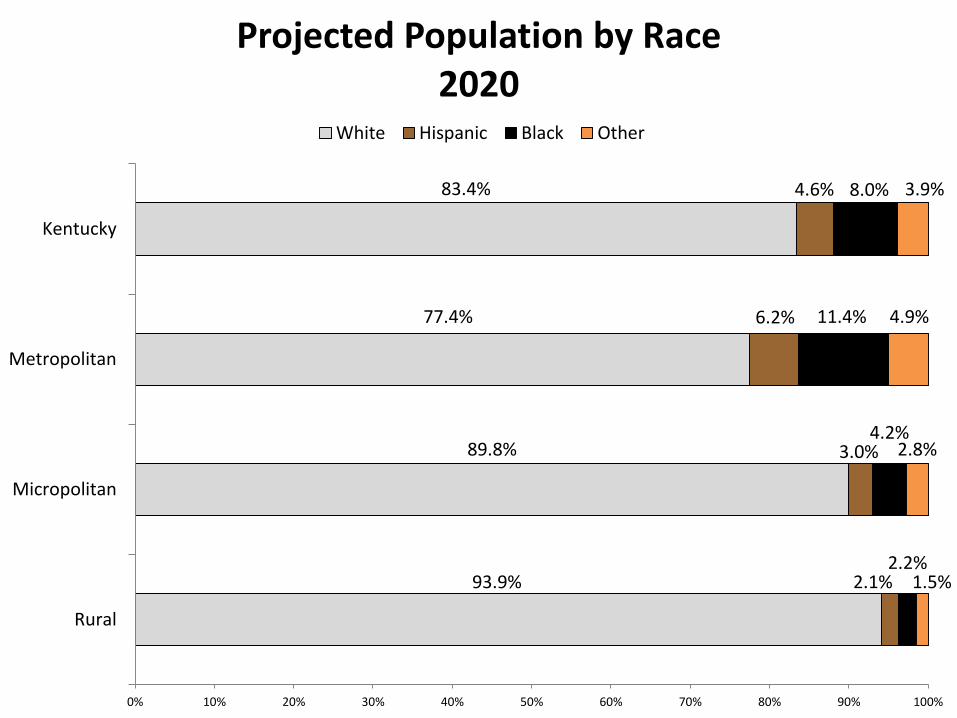
93.9%
89.8%
77.4%
83.4%
2.1%
3.0%
6.2%
4.6%
2.2%
4.2%
11.4%
8.0%
1.5%
2.8%
4.9%
3.9%
0% 10% 20% 30% 40% 50% 60% 70% 80% 90% 100%
Rural
Micropolitan
Metropolitan
Kentucky
Projected Population by Race 2020
White Hispanic Black Other
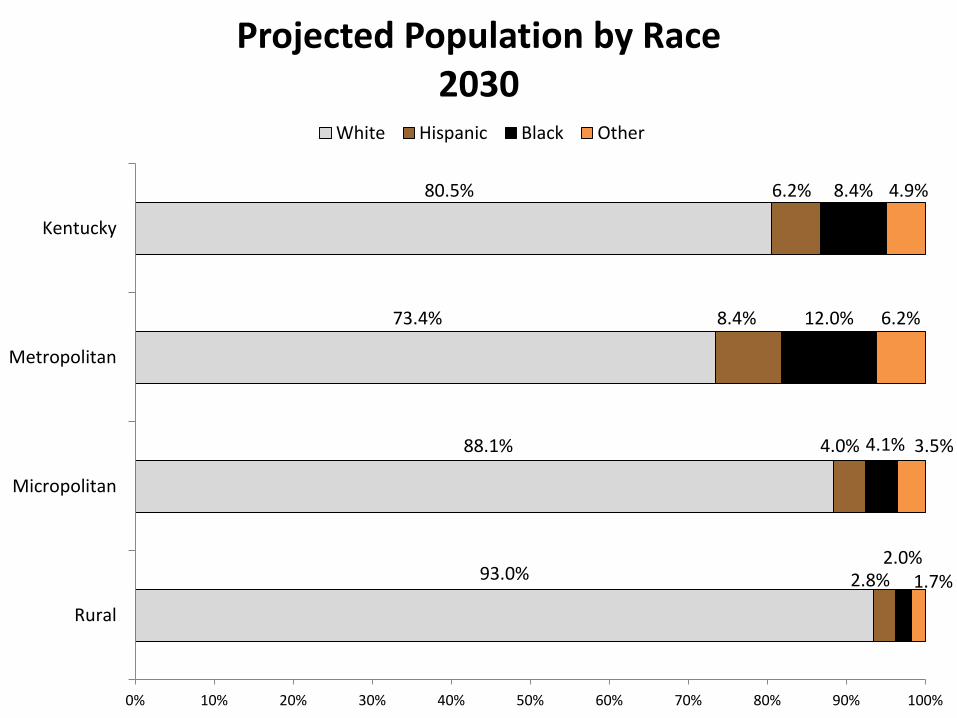
93.0%
88.1%
73.4%
80.5%
2.8%
4.0%
8.4%
6.2%
2.0%
4.1%
12.0%
8.4%
1.7%
3.5%
6.2%
4.9%
0% 10% 20% 30% 40% 50% 60% 70% 80% 90% 100%
Rural
Micropolitan
Metropolitan
Kentucky
Projected Population by Race 2030
White Hispanic Black Other
-20%
-10%
0%
10%
20%
30%
40%
50%
60%
70%
80%
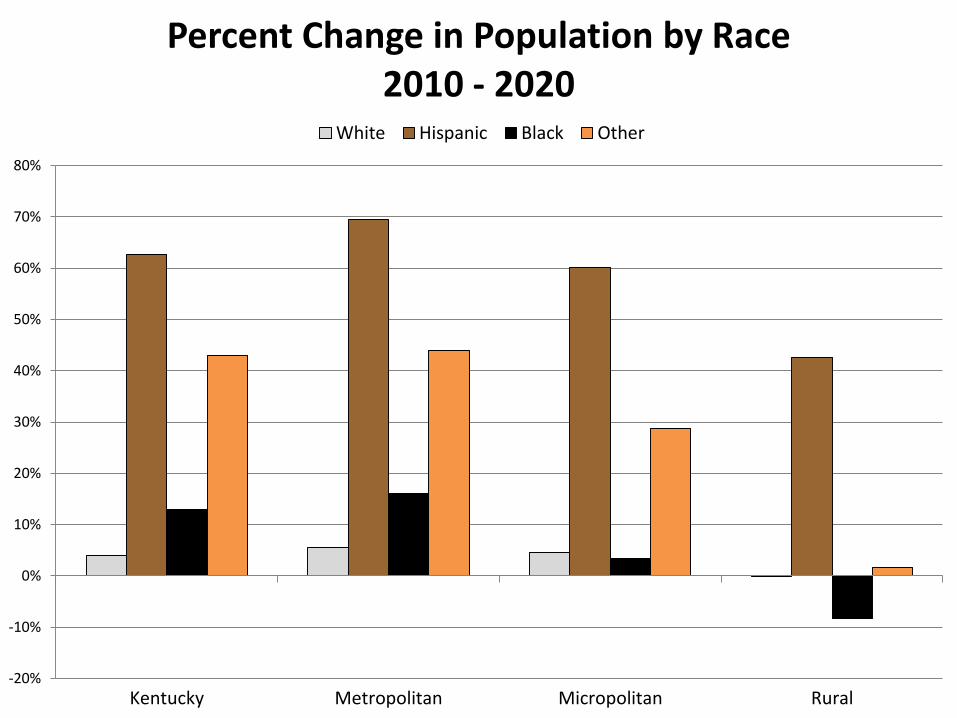
Kentucky Metropolitan Micropolitan Rural
Percent Change in Population by Race 2010 - 2020
White Hispanic Black Other
-20%
-10%
0%
10%
20%
30%
40%
50%
60%
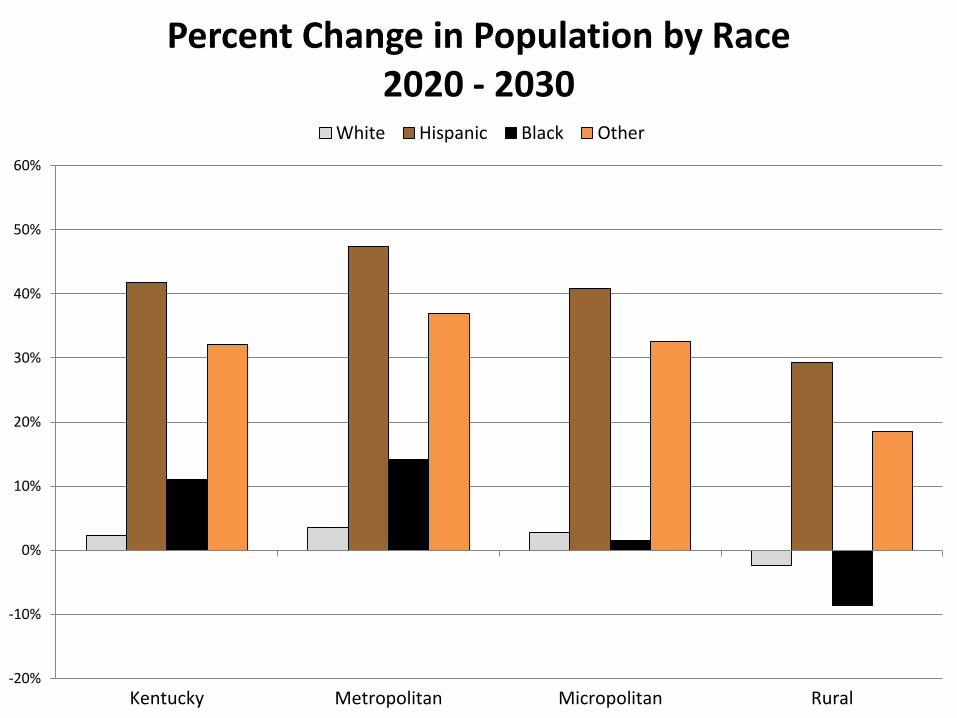
Kentucky Metropolitan Micropolitan Rural
Percent Change in Population by Race 2020 - 2030
White Hispanic Black Other
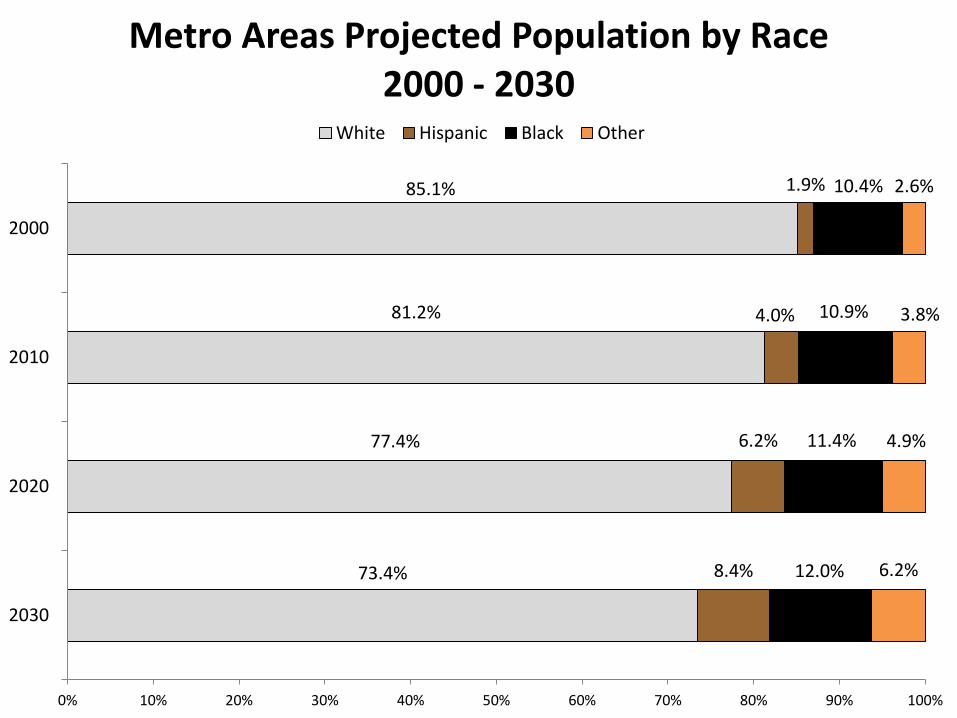
73.4%
77.4%
81.2%
85.1%
8.4%
6.2%
4.0%
1.9%
12.0%
11.4%
10.9%
10.4%
6.2%
4.9%
3.8%
2.6%
0% 10% 20% 30% 40% 50% 60% 70% 80% 90% 100%
2030
2020
2010
2000
Metro Areas Projected Population by Race 2000 - 2030
White Hispanic Black Other
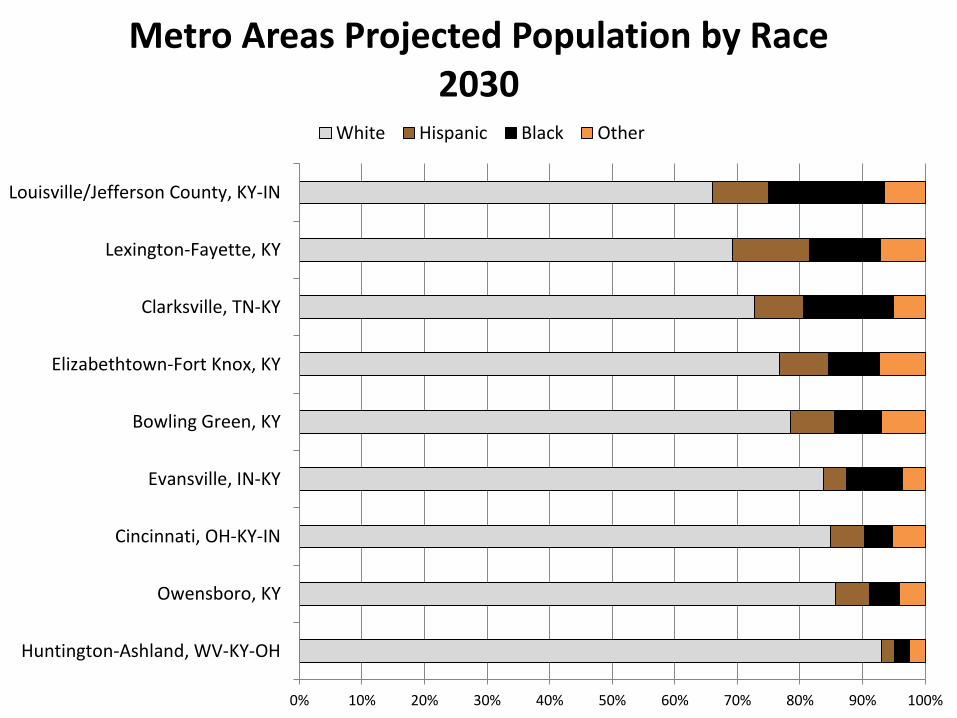
0% 10% 20% 30% 40% 50% 60% 70% 80% 90% 100%
Huntington-Ashland, WV-KY-OH
Owensboro, KY
Cincinnati, OH-KY-IN
Evansville, IN-KY
Bowling Green, KY
Elizabethtown-Fort Knox, KY
Clarksville, TN-KY
Lexington-Fayette, KY
Louisville/Jefferson County, KY-IN
Metro Areas Projected Population by Race 2030
White Hispanic Black Other

-20% 0% 20% 40% 60% 80% 100% 120% 140%
Clarksville, TN-KY
Huntington-Ashland, WV-KY-OH
Evansville, IN-KY
Elizabethtown-Fort Knox, KY
Louisville/Jefferson County, KY-IN
Owensboro, KY
Lexington-Fayette, KY
Bowling Green, KY
Cincinnati, OH-KY-IN
Metro Areas Percent Change in Minority Population by Race
2010 - 2030 Hispanic Black Other

1,055,340
1,015,920
1,814,427
787,067
Kentucky Projected Population by Age 2020
0-17
18-34
35-64
65+

1,091,285
1,051,767
1,810,042
998,084
Kentucky Projected Population by Age 2030
0-17
18-34
35-64
65+
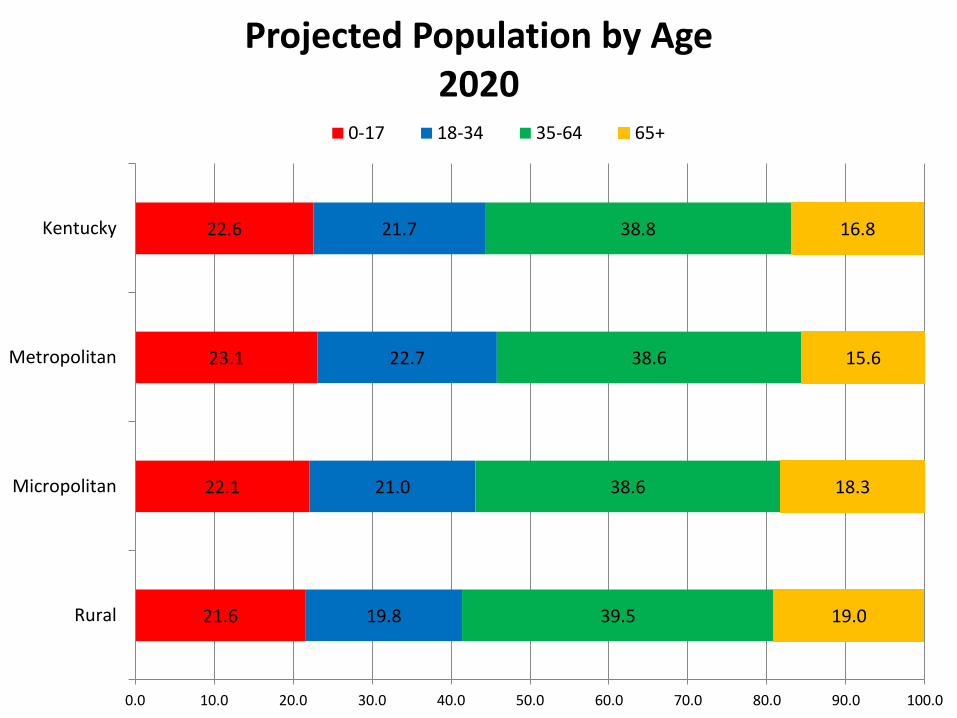
21.6
22.1
23.1
22.6
19.8
21.0
22.7
21.7
39.5
38.6
38.6
38.8
19.0
18.3
15.6
16.8
0.0 10.0 20.0 30.0 40.0 50.0 60.0 70.0 80.0 90.0 100.0
Rural
Micropolitan
Metropolitan
Kentucky
Projected Population by Age 2020
0-17 18-34 35-64 65+
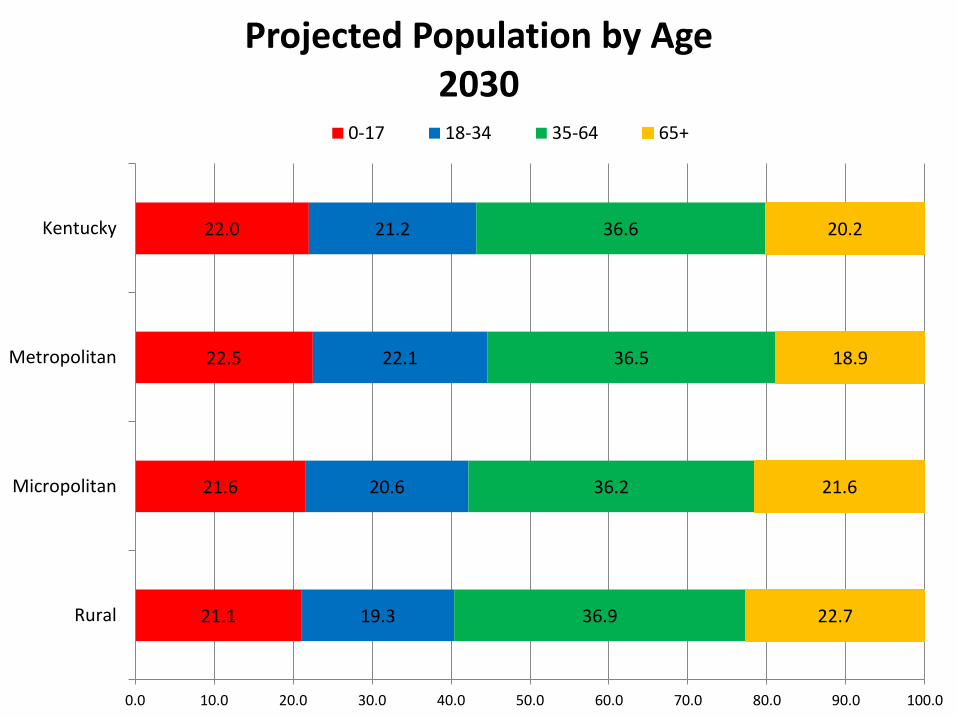
21.1
21.6
22.5
22.0
19.3
20.6
22.1
21.2
36.9
36.2
36.5
36.6
22.7
21.6
18.9
20.2
0.0 10.0 20.0 30.0 40.0 50.0 60.0 70.0 80.0 90.0 100.0
Rural
Micropolitan
Metropolitan
Kentucky
Projected Population by Age 2030
0-17 18-34 35-64 65+
-10.0
0.0
10.0
20.0
30.0
40.0
50.0
Kentucky Metropolitan Micropolitan Rural
Percent Change in Population by Age 2010 - 2020
total 0-17 18-34 35-64 65+

-15.0
-10.0
-5.0
0.0
5.0
10.0
15.0
20.0
25.0
30.0
35.0
Kentucky Metropolitan Micropolitan Rural
Percent Change in Population by Age 2020 - 2030
total 0-17 18-34 35-64 65+

22.5%
23.1%
24.2%
25.0%
22.1%
22.7%
23.5%
24.7%
36.5%
38.6%
40.0%
38.6%
18.9%
15.6%
12.3%
11.7%
0.0% 10.0% 20.0% 30.0% 40.0% 50.0% 60.0% 70.0% 80.0% 90.0% 100.0%
2030
2020
2010
2000
Metro Areas Projected Population by Age 2000 -2030
0-17 18-34 35-64 65+
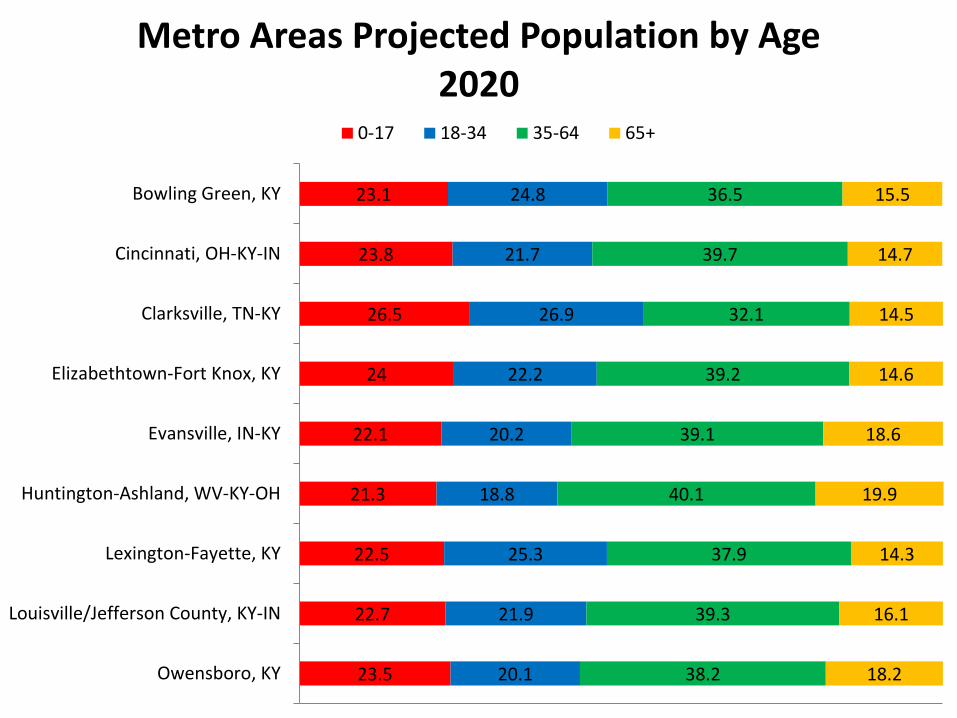
23.5
22.7
22.5
21.3
22.1
24
26.5
23.8
23.1
20.1
21.9
25.3
18.8
20.2
22.2
26.9
21.7
24.8
38.2
39.3
37.9
40.1
39.1
39.2
32.1
39.7
36.5
18.2
16.1
14.3
19.9
18.6
14.6
14.5
14.7
15.5
Owensboro, KY
Louisville/Jefferson County, KY-IN
Lexington-Fayette, KY
Huntington-Ashland, WV-KY-OH
Evansville, IN-KY
Elizabethtown-Fort Knox, KY
Clarksville, TN-KY
Cincinnati, OH-KY-IN
Bowling Green, KY
Metro Areas Projected Population by Age 2020
0-17 18-34 35-64 65+

22.9
22.3
21.9
20.9
21.7
22.9
25.9
23.0
22.4
19.9
21.2
24.9
18.6
20.1
21.3
26.2
20.6
24.6
35.5
37.3
35.9
37.7
35.4
36.8
30.7
37.7
34.1
21.8
19.2
17.2
22.7
22.9
19.0
17.3
18.7
18.9
Owensboro, KY
Louisville/Jefferson County, KY-IN
Lexington-Fayette, KY
Huntington-Ashland, WV-KY-OH
Evansville, IN-KY
Elizabethtown-Fort Knox, KY
Clarksville, TN-KY
Cincinnati, OH-KY-IN
Bowling Green, KY
Metro Areas Projected Population by Age 2030
0-17 18-34 35-64 65+
-20.0 0.0 20.0 40.0 60.0 80.0 100.0
Huntington-Ashland, WV-KY-OH
Evansville, IN-KY
Owensboro, KY
Clarksville, TN-KY
Elizabethtown-Fort Knox, KY
Louisville/Jefferson County, KY-IN
Cincinnati, OH-KY-IN
Lexington-Fayette, KY
Bowling Green, KY
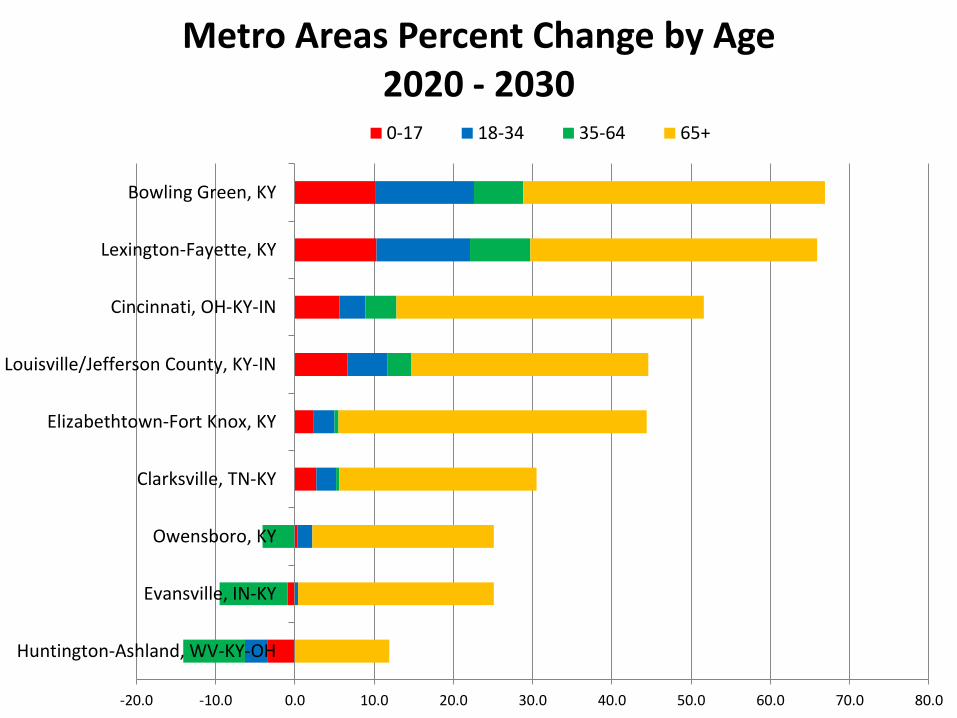
Metro Areas Percent Change by Age 2010 - 2020 0-17 18-34 35-64 65+
-20.0 -10.0 0.0 10.0 20.0 30.0 40.0 50.0 60.0 70.0 80.0
Huntington-Ashland, WV-KY-OH
Evansville, IN-KY
Owensboro, KY
Clarksville, TN-KY
Elizabethtown-Fort Knox, KY
Louisville/Jefferson County, KY-IN
Cincinnati, OH-KY-IN
Lexington-Fayette, KY
Bowling Green, KY
Metro Areas Percent Change by Age 2020 - 2030 0-17 18-34 35-64 65+
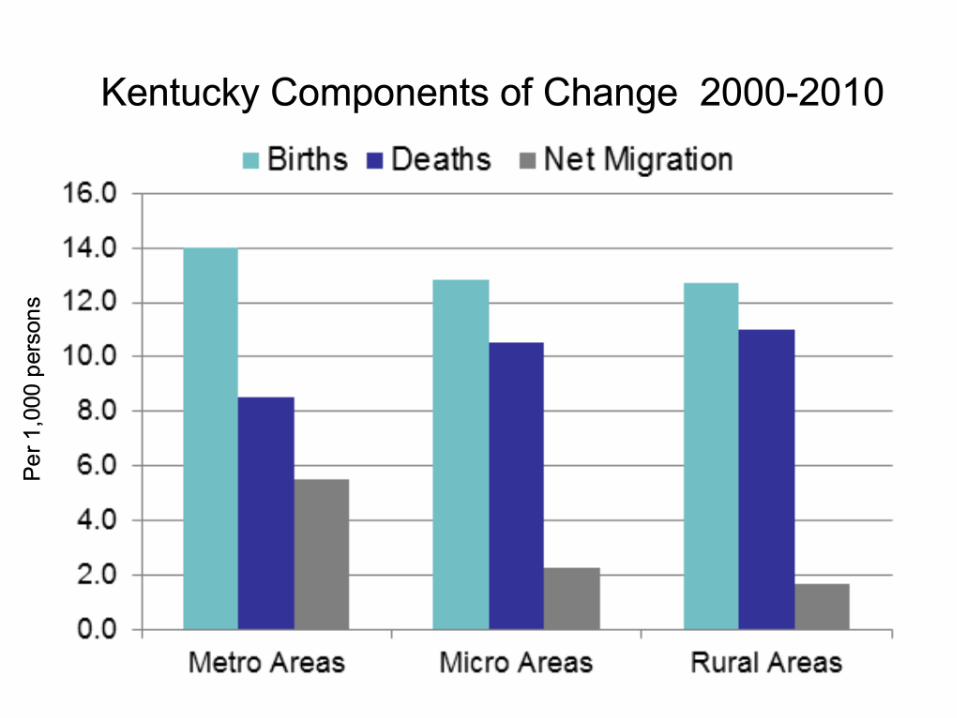
Kentucky’s population growth has occurred predominantly in Metropolitan areas and in Micropolitan areas to a lesser extent
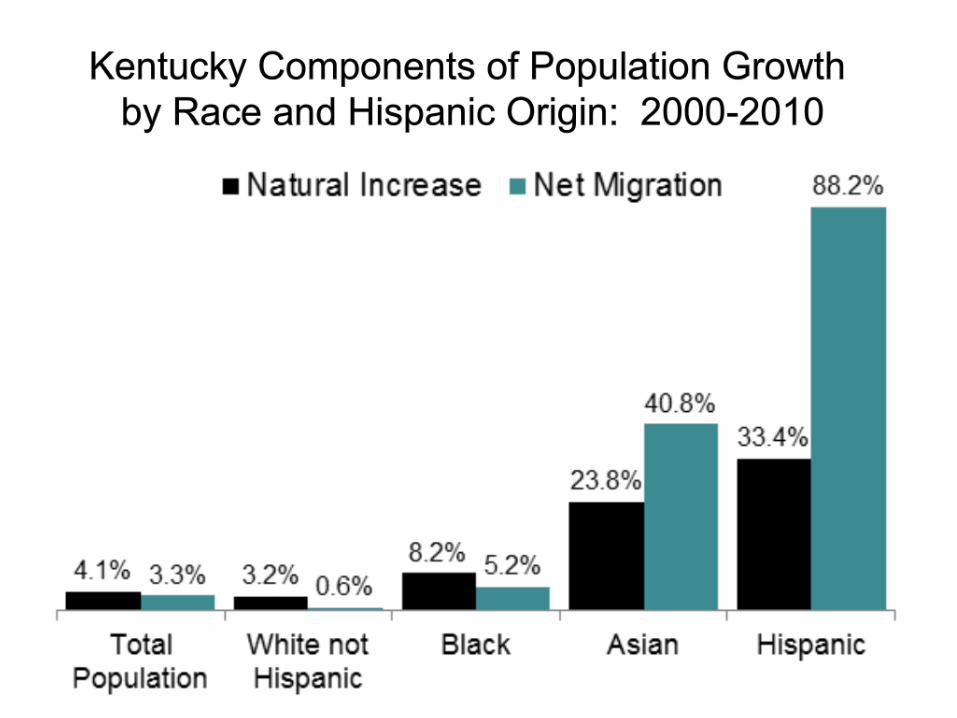
Most of the population growth has been in minority populations
The population 35-64 and 65+ have grown as the baby-boomers age.
These trends are likely to continue into the future

Top Related