


Languages
Pages
Legal

Demographic projections of disability
Luc Bonneux, Nicole Van der Gaag, Govert Bijwaard, Joop de Beer
Projections, migration and HealthNetherlands Interdisciplinary Demographic
InstituteThe Hague
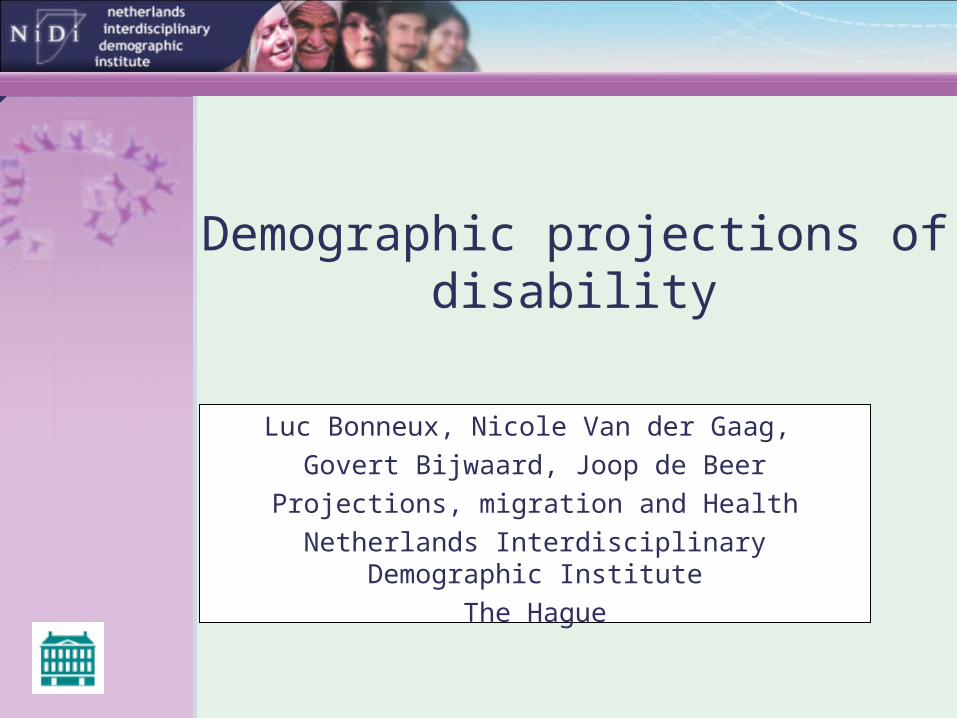
Life tables
Alive
Death
By age
Transitions
Dwelling time in the state “alive”
= life expectancy
By age
Transitions
Free of disability
Death
With disability
Disability free life expectancy
Duration of disability
Conditioned by risk
Risk factor dependent
Prognosis
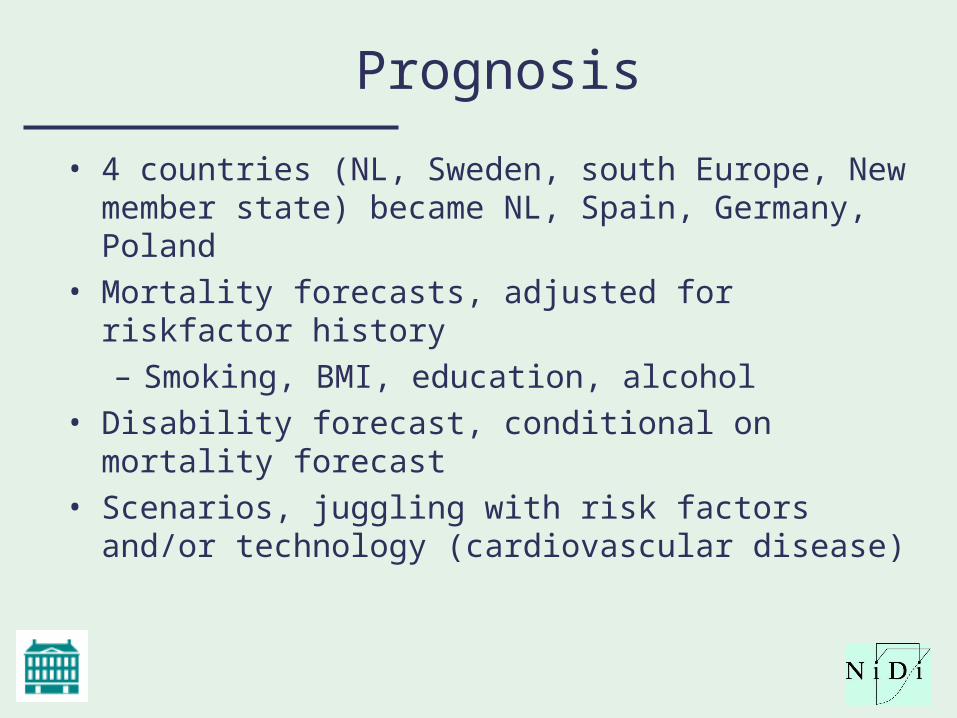
• 4 countries (NL, Sweden, south Europe, New member state) became NL, Spain, Germany, Poland
• Mortality forecasts, adjusted for riskfactor history– Smoking, BMI, education, alcohol
• Disability forecast, conditional on mortality forecast• Scenarios, juggling with risk factors and/or
technology (cardiovascular disease)
Katz ADL Disability
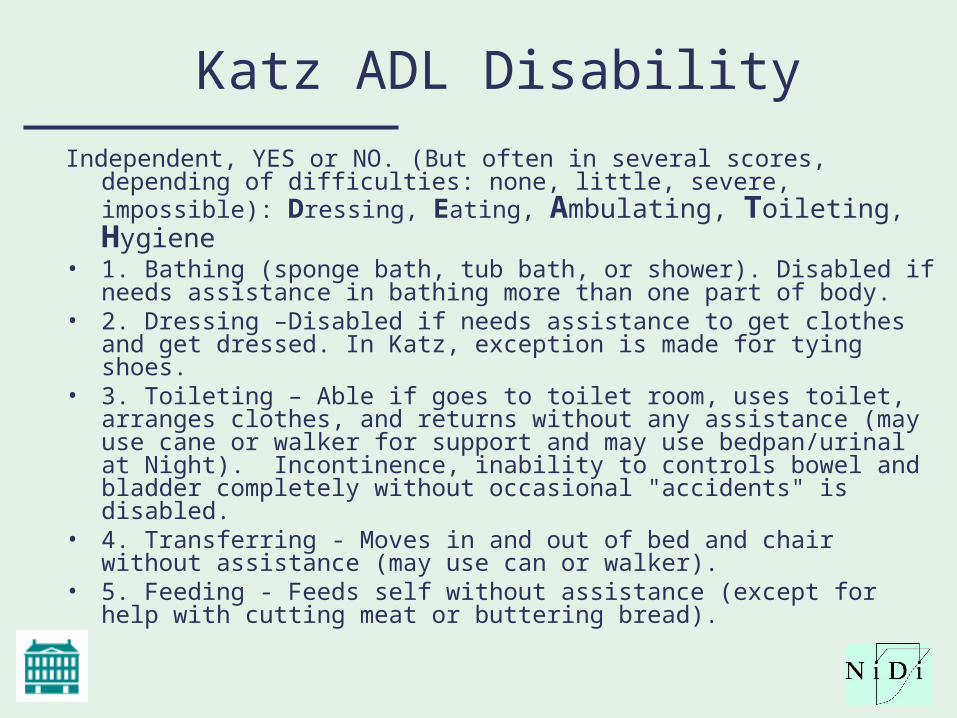
Independent, YES or NO. (But often in several scores, depending of difficulties: none, little, severe, impossible): Dressing, Eating, Ambulating, Toileting, Hygiene
• 1. Bathing (sponge bath, tub bath, or shower). Disabled if needs assistance in bathing more than one part of body.
• 2. Dressing –Disabled if needs assistance to get clothes and get dressed. In Katz, exception is made for tying shoes.
• 3. Toileting – Able if goes to toilet room, uses toilet, arranges clothes, and returns without any assistance (may use cane or walker for support and may use bedpan/urinal at Night). Incontinence, inability to controls bowel and bladder completely without occasional "accidents" is disabled.
• 4. Transferring - Moves in and out of bed and chair without assistance (may use can or walker).
• 5. Feeding - Feeds self without assistance (except for help with cutting meat or buttering bread).
Model
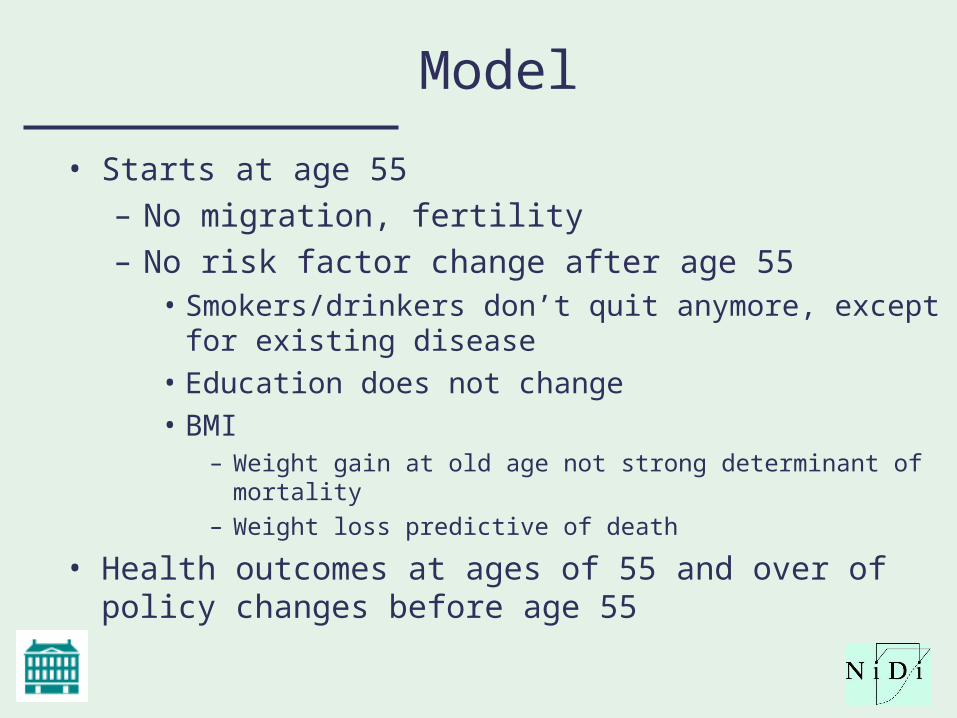
• Starts at age 55– No migration, fertility– No risk factor change after age 55
• Smokers/drinkers don’t quit anymore, except for existing disease
• Education does not change• BMI
– Weight gain at old age not strong determinant of mortality– Weight loss predictive of death
• Health outcomes at ages of 55 and over of policy changes before age 55
Added assumptions
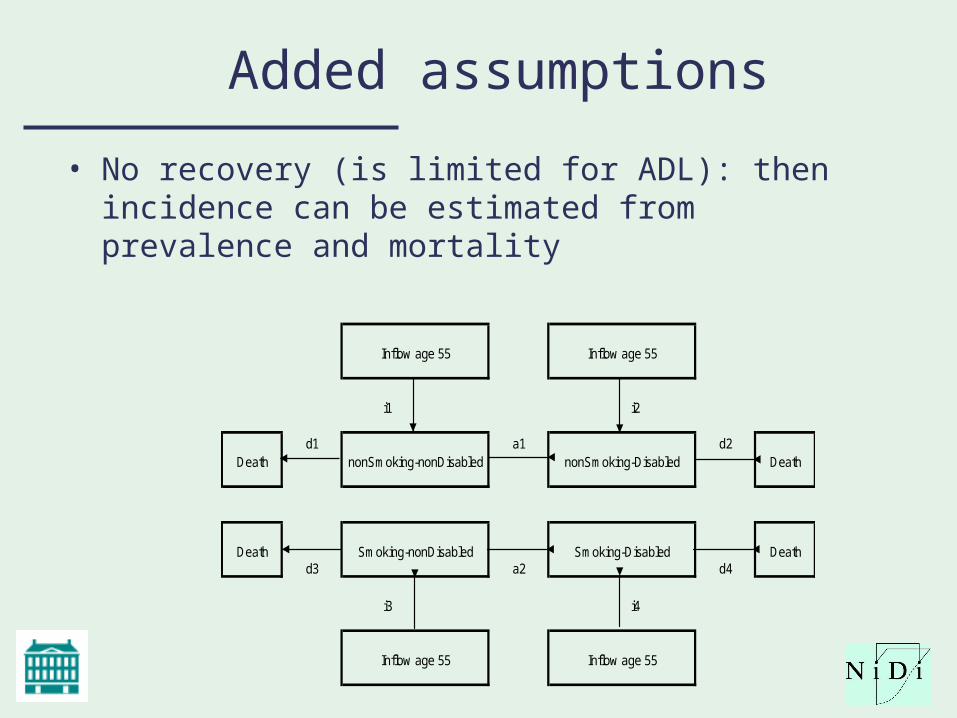
• No recovery (is limited for ADL): then incidence can be estimated from prevalence and mortality
Inflow age 55 Inflow age 55
i1 i2
Deathd1
nonSmoking-nonDisableda1
nonSmoking-Disabledd2
Death
Deathd3
Smoking-nonDisableda2
Smoking-Disabledd4
Death
i3 i4
Inflow age 55 Inflow age 55
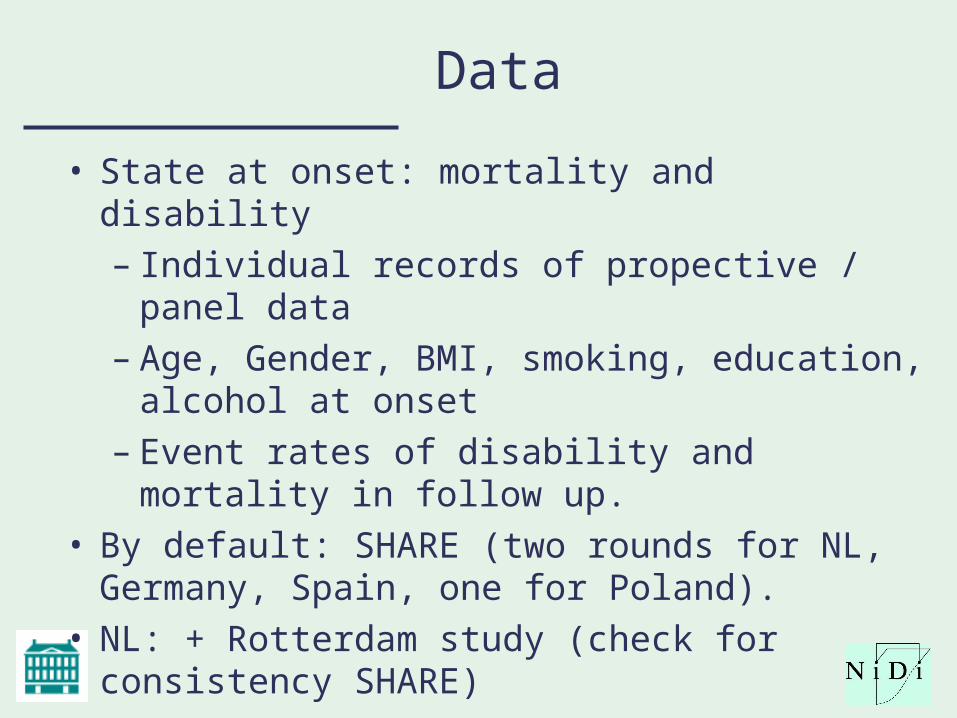
Data
• State at onset: mortality and disability– Individual records of propective / panel
data– Age, Gender, BMI, smoking, education,
alcohol at onset– Event rates of disability and mortality in
follow up.• By default: SHARE (two rounds for NL,
Germany, Spain, one for Poland). • NL: + Rotterdam study (check for
consistency SHARE)
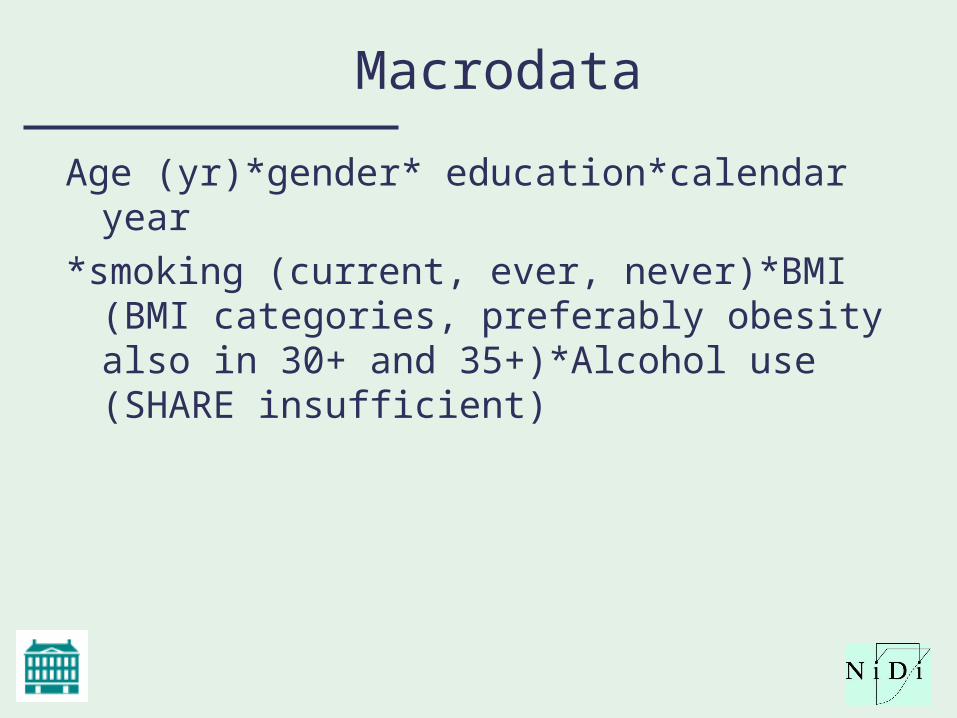
Macrodata
Age (yr)*gender* education*calendar year*smoking (current, ever, never)*BMI (BMI
categories, preferably obesity also in 30+ and 35+)*Alcohol use (SHARE insufficient)
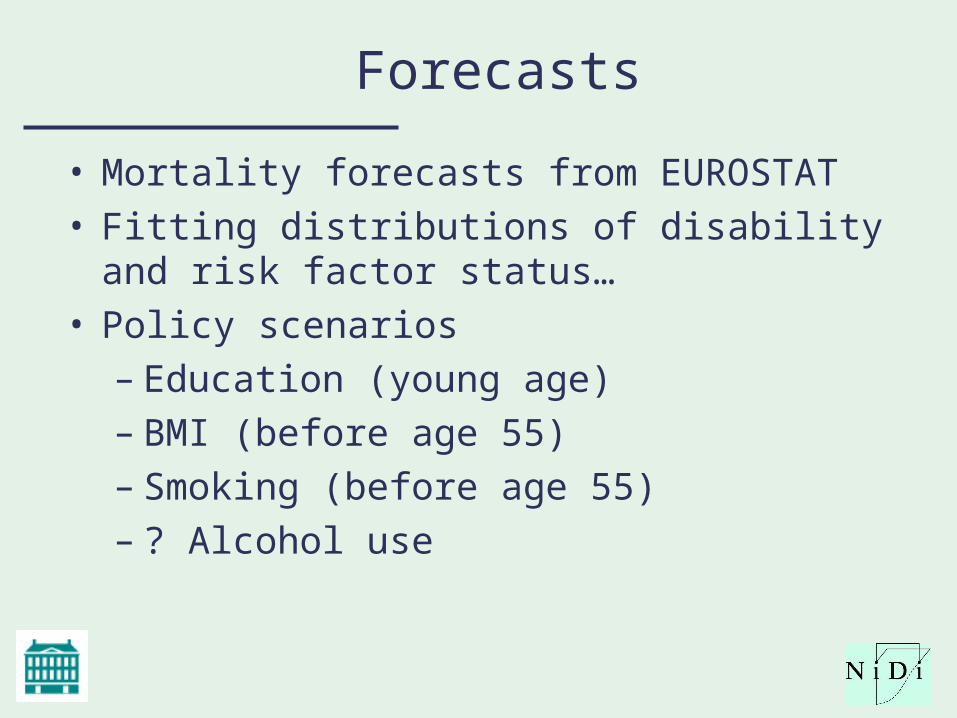
Forecasts
• Mortality forecasts from EUROSTAT• Fitting distributions of disability and risk
factor status…• Policy scenarios
– Education (young age)– BMI (before age 55)– Smoking (before age 55)– ? Alcohol use
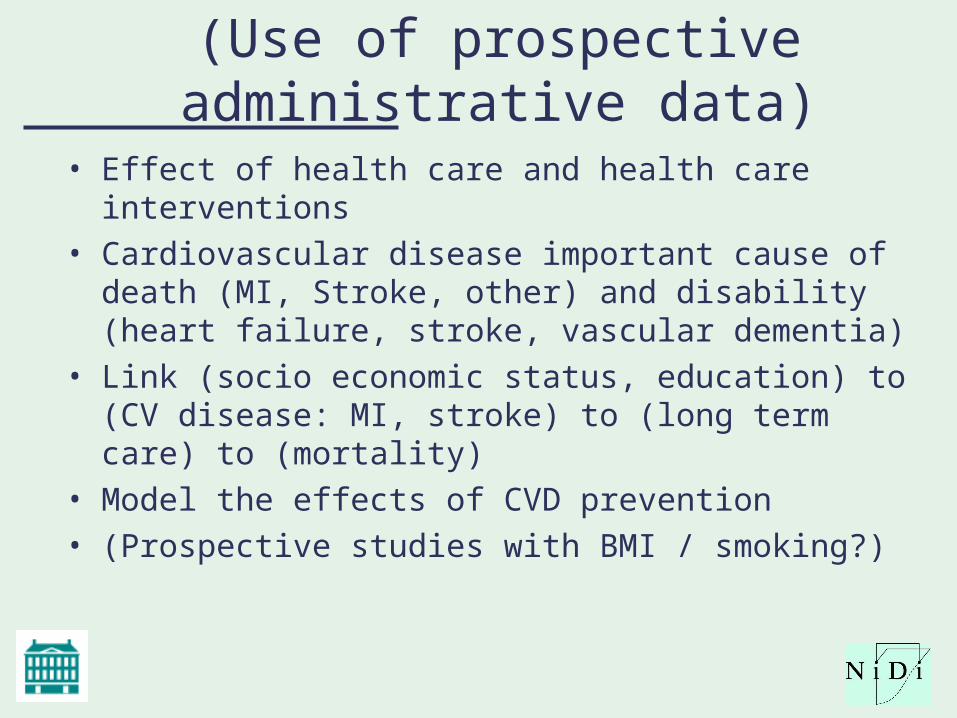
(Use of prospective administrative data)
• Effect of health care and health care interventions• Cardiovascular disease important cause of death
(MI, Stroke, other) and disability (heart failure, stroke, vascular dementia)
• Link (socio economic status, education) to (CV disease: MI, stroke) to (long term care) to (mortality)
• Model the effects of CVD prevention• (Prospective studies with BMI / smoking?)
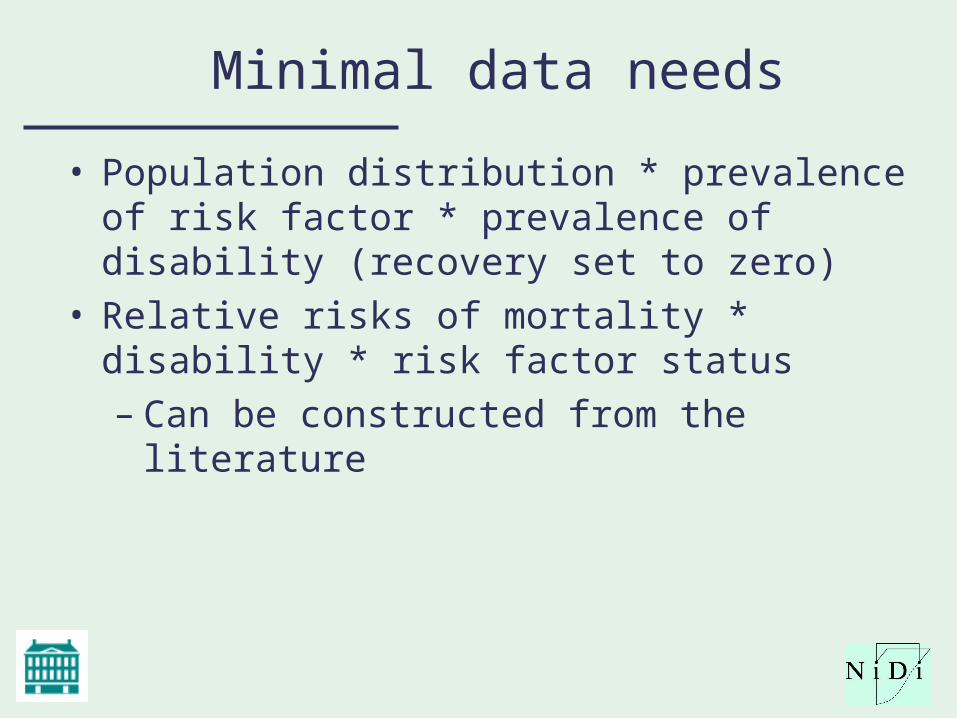
Minimal data needs
• Population distribution * prevalence of risk factor * prevalence of disability (recovery set to zero)
• Relative risks of mortality * disability * risk factor status– Can be constructed from the literature
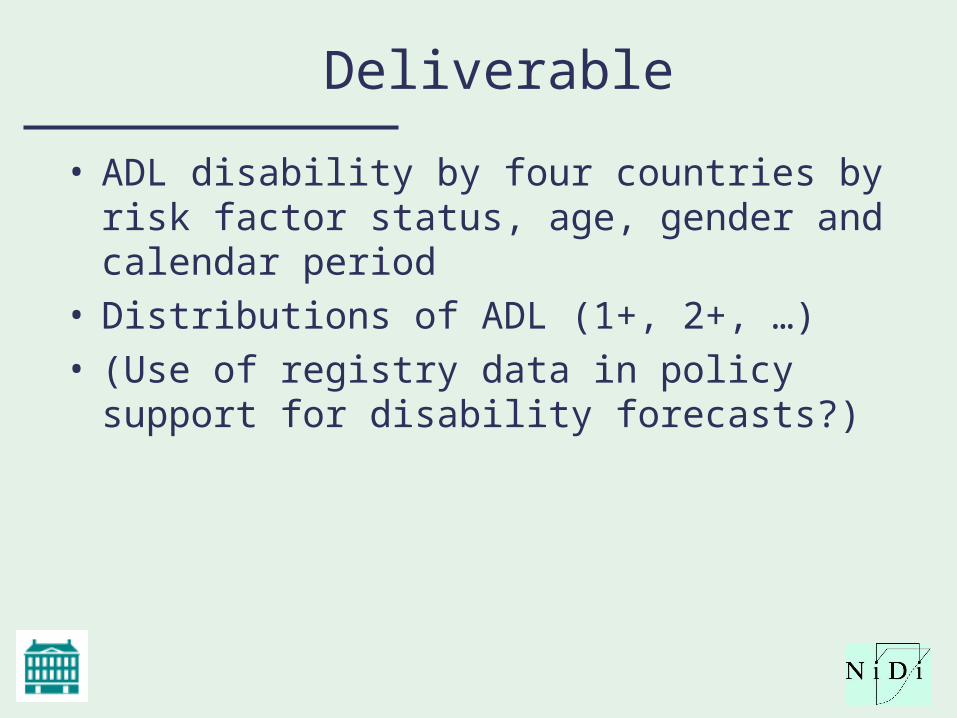
Deliverable
• ADL disability by four countries by risk factor status, age, gender and calendar period
• Distributions of ADL (1+, 2+, …)• (Use of registry data in policy support for
disability forecasts?)
Timeline
• End Mai: – Model up and running for the Netherlands– Preparation of publications– Preparation of data from Spain, Germany,
Poland• End September
– Model up and running for four countries
Copyright ©2009 BMJ Publishing Group Ltd.
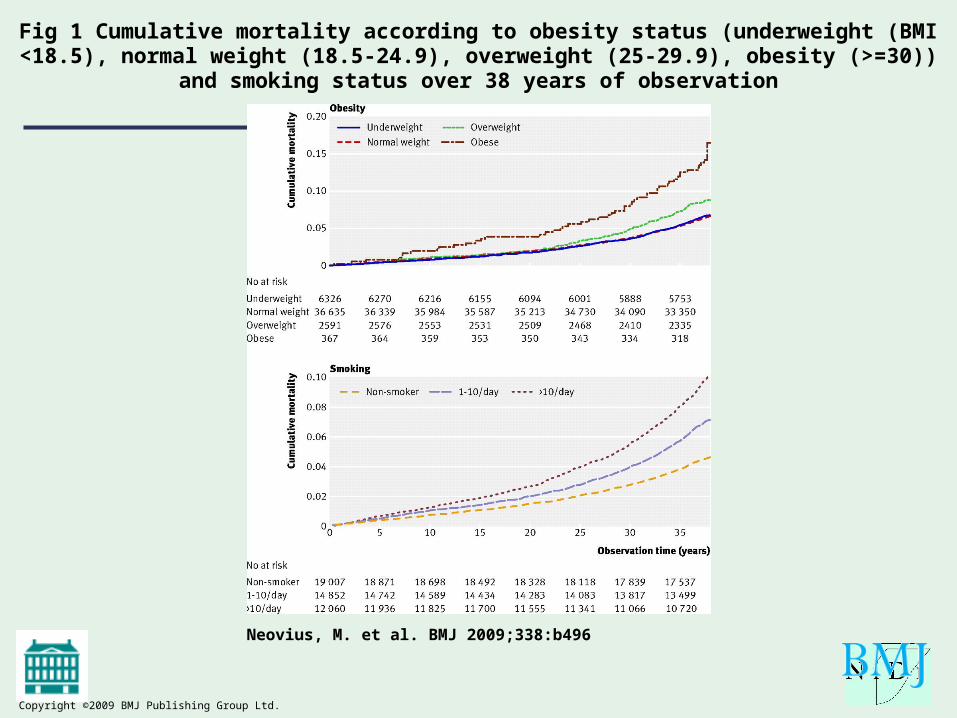
Neovius, M. et al. BMJ 2009;338:b496
Fig 1 Cumulative mortality according to obesity status (underweight (BMI <18.5), normal weight (18.5-24.9), overweight (25-29.9), obesity (>=30)) and smoking status over 38 years
of observation
Copyright ©2009 BMJ Publishing Group Ltd.
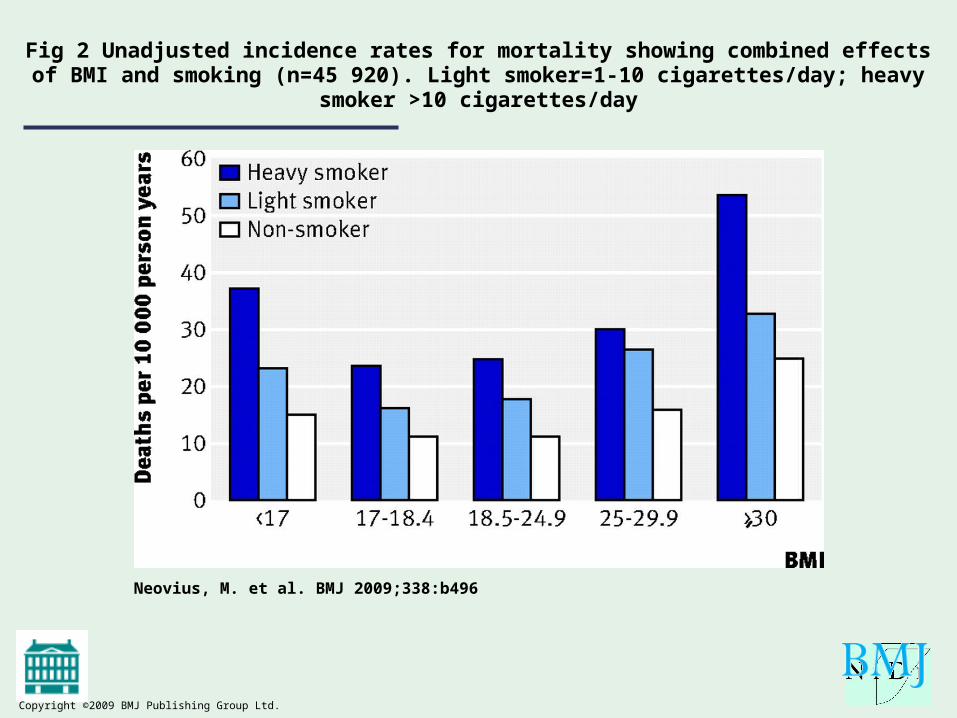
Neovius, M. et al. BMJ 2009;338:b496
Fig 2 Unadjusted incidence rates for mortality showing combined effects of BMI and smoking (n=45 920). Light smoker=1-10 cigarettes/day; heavy smoker >10 cigarettes/day
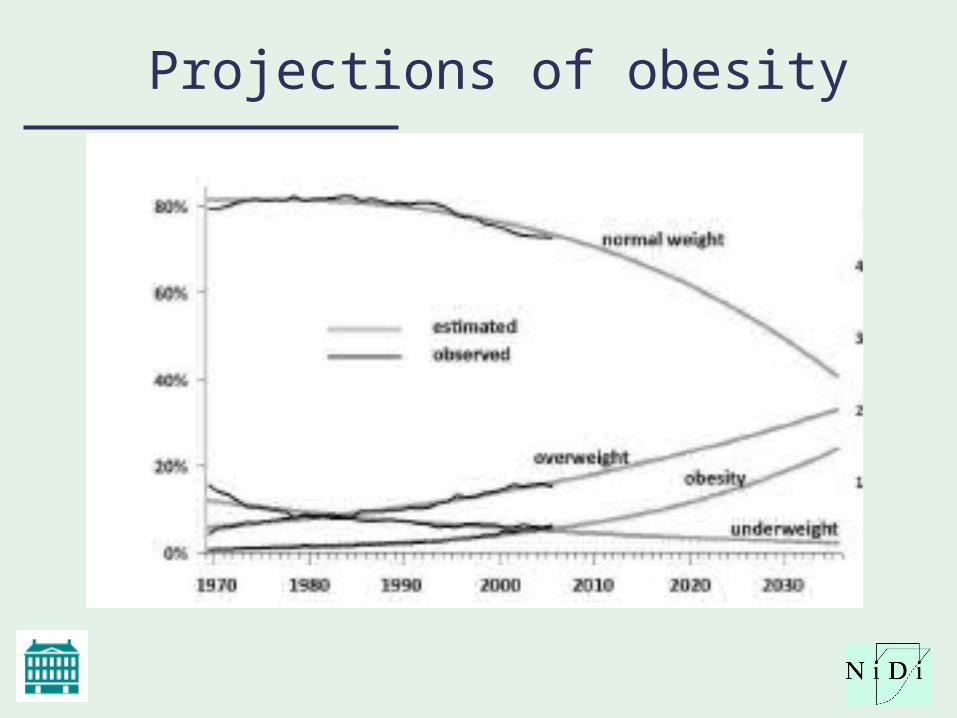
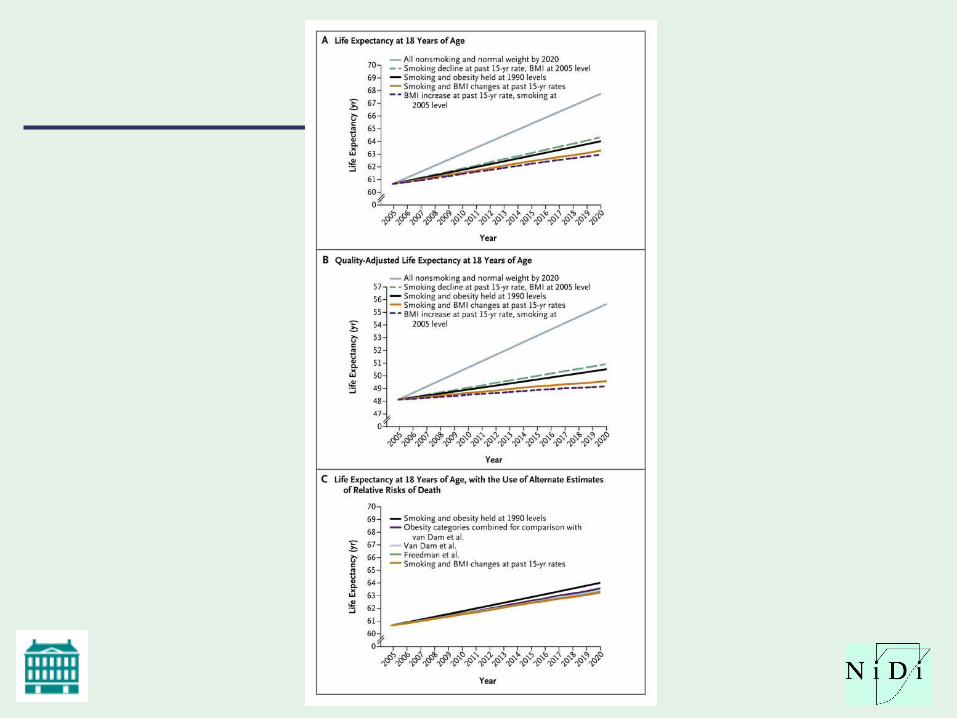
Projections of obesity
Top Related