


Languages
Pages
Legal


Demographic Differences in the Demographic Differences in the Relationship between Assistive Relationship between Assistive
Device Use and Cognition among Device Use and Cognition among Home Based ElderlyHome Based Elderly
Vidyalakshmi SundarVidyalakshmi SundarGraduate StudentGraduate Student
Machiko R. Tomita, Ph.D. Machiko R. Tomita, Ph.D. William C. Mann, Ph.D. William C. Mann, Ph.D.
Kathy Stanton, MS, MNS.Kathy Stanton, MS, MNS.
University at Buffalo-The International Conference on Aging, Disability and Independence
4-7 Dec 03, Washington D.C.
IntroductionIntroduction
Most older adults have at least one type of Most older adults have at least one type of disability or chronic conditiondisability or chronic condition
The proportion of older adults The proportion of older adults experiencing activity limitations increases experiencing activity limitations increases with age with age (Hartke, Prohaska and Furher, 1998)(Hartke, Prohaska and Furher, 1998)
Assistive devices can help to compensate Assistive devices can help to compensate for limitations – physical and cognitivefor limitations – physical and cognitive

Assistive TechnologyAssistive Technology
Assistive device (AD) use varies with Assistive device (AD) use varies with age, gender, race, etc. age, gender, race, etc. (Edwards and Jones, (Edwards and Jones, 1998)1998)
Persons with cognitive impairments Persons with cognitive impairments use fewer devices than persons with use fewer devices than persons with physical impairments physical impairments (Mann, Karuza, Hurren (Mann, Karuza, Hurren and Tomita, 1992)and Tomita, 1992)
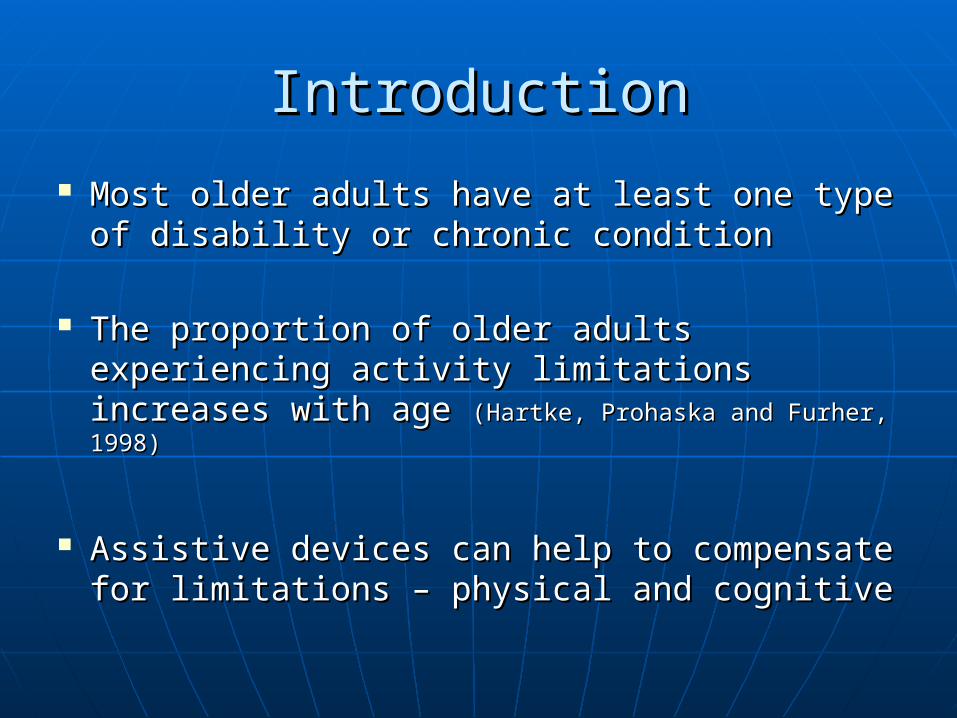
PurposePurpose To understand the differences in demographic To understand the differences in demographic
factors in the use of assistive devices by older factors in the use of assistive devices by older adults with and without cognitive impairment. adults with and without cognitive impairment. Specifically, to examine differences in Specifically, to examine differences in
• GenderGender• Age (less than or greater than 75)Age (less than or greater than 75)• Race (white/minority)Race (white/minority)• Education (less than or more than high school)Education (less than or more than high school)• Housing status (own/renting)Housing status (own/renting)• Living arrangement (living alone/with someone)Living arrangement (living alone/with someone)• Income (less than or greater than $10,000)Income (less than or greater than $10,000)• Marital status (married/not married) and Marital status (married/not married) and • Geographic region (Buffalo vs. Florida)Geographic region (Buffalo vs. Florida)

Purpose Purpose
1.1. To identify the pattern of device use To identify the pattern of device use among older adults with and among older adults with and without cognitive impairments without cognitive impairments
2.2. To determine demographic factors To determine demographic factors predicting assistive device use predicting assistive device use among elders with and without among elders with and without cognitive impairment cognitive impairment

MethodMethod
Retrospective cross-sectional studyRetrospective cross-sectional study SampleSample
• Home based adults aged 60 or above Home based adults aged 60 or above (N=1027)(N=1027)
• With some limitation in ADL With some limitation in ADL • Living in 2 geographical locations – Living in 2 geographical locations –
Buffalo & FloridaBuffalo & Florida
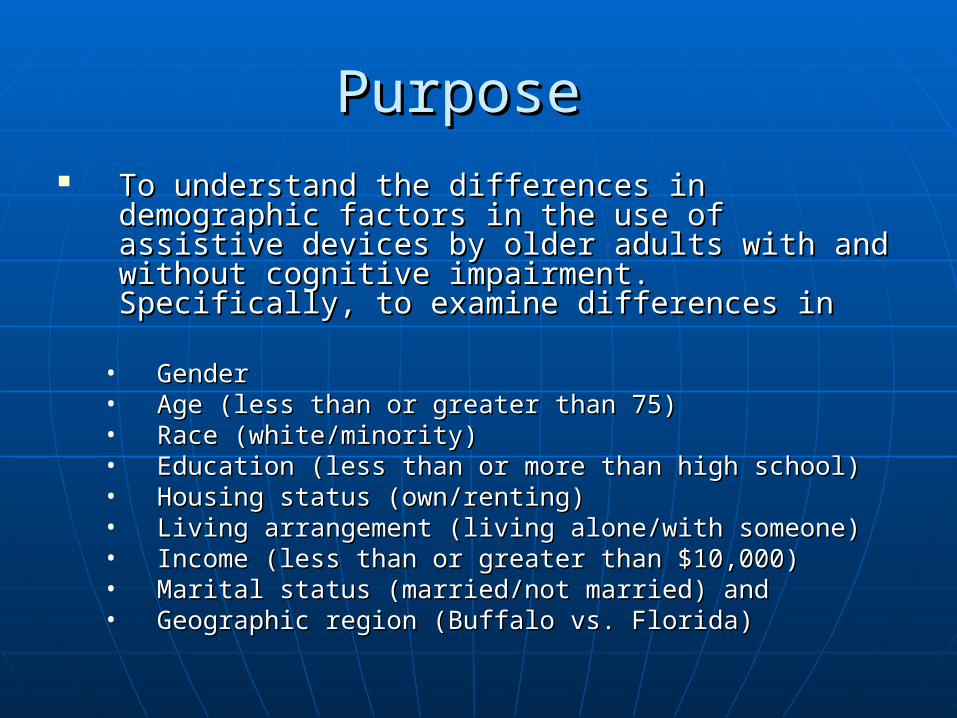
Method – Data CollectionMethod – Data Collection
Interviews - conducted by trained Interviews - conducted by trained occupational therapists and nursesoccupational therapists and nurses
Instruments usedInstruments used• Cognition – MMSECognition – MMSE• Physical disability – Sickness Impact ProfilePhysical disability – Sickness Impact Profile• Demographic factors – Duke’s Older Americans Demographic factors – Duke’s Older Americans
Resources and Services Procedure. Resources and Services Procedure. • Assistive devices – Identified by trained Assistive devices – Identified by trained
OT/nurseOT/nurse
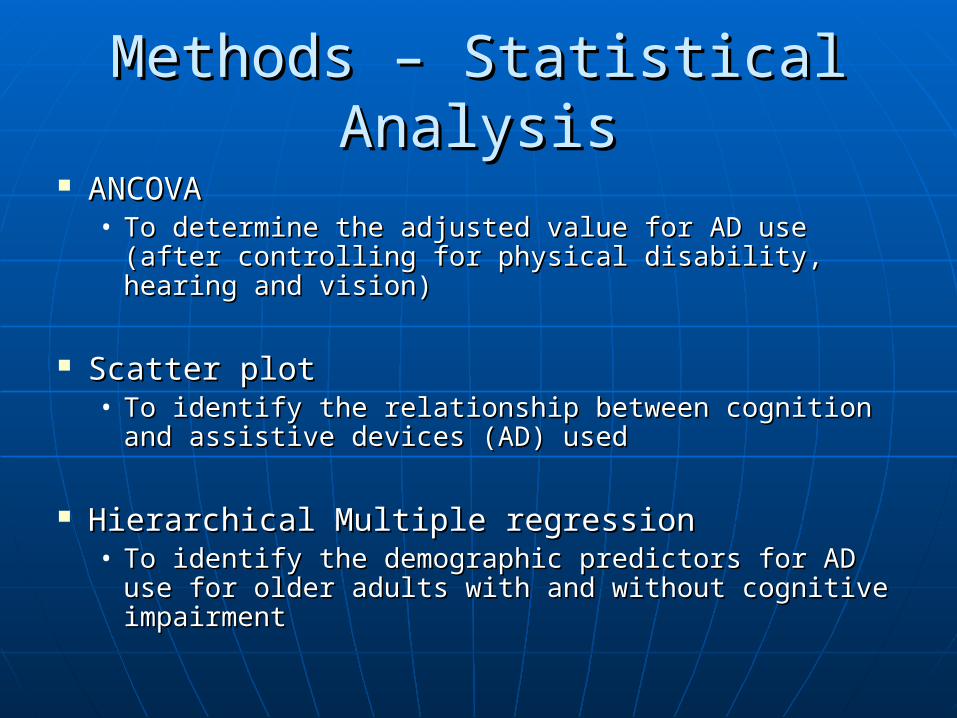
Methods – Statistical AnalysisMethods – Statistical Analysis ANCOVAANCOVA
• To determine the adjusted value for AD use (after To determine the adjusted value for AD use (after controlling for physical disability, hearing and controlling for physical disability, hearing and vision)vision)
Scatter plot Scatter plot • To identify the relationship between cognition and To identify the relationship between cognition and
assistive devices (AD) usedassistive devices (AD) used
Hierarchical Multiple regression Hierarchical Multiple regression • To identify the demographic predictors for AD use To identify the demographic predictors for AD use
for older adults with and without cognitive for older adults with and without cognitive impairmentimpairment
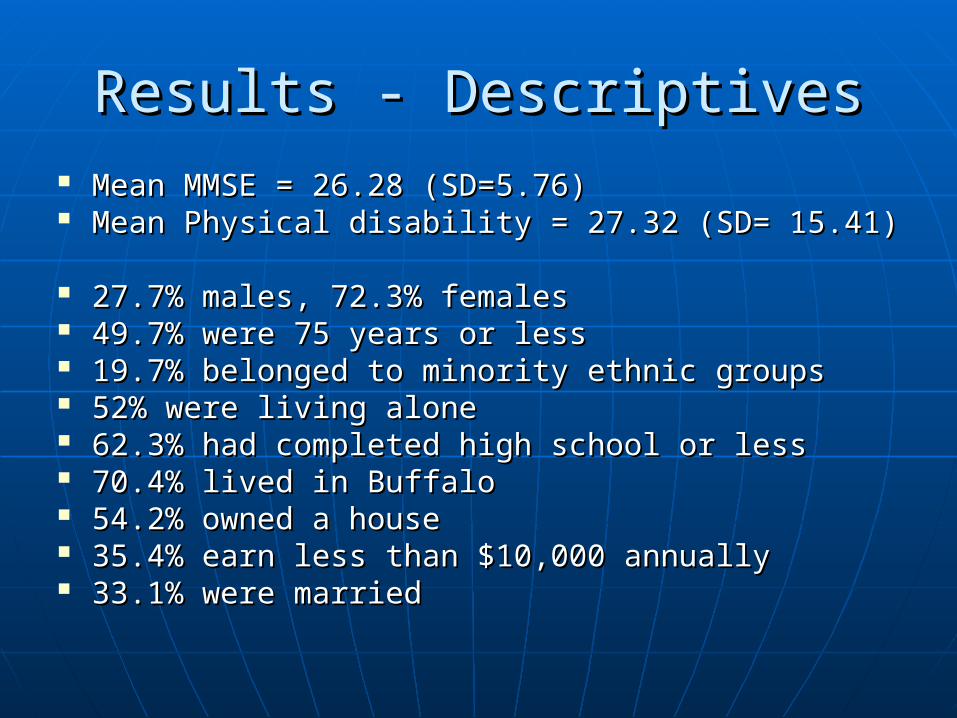
Results - DescriptivesResults - Descriptives Mean MMSE = 26.28 (SD=5.76)Mean MMSE = 26.28 (SD=5.76) Mean Physical disability = 27.32 (SD= 15.41)Mean Physical disability = 27.32 (SD= 15.41)
27.7% males, 72.3% females27.7% males, 72.3% females 49.7% were 75 years or less49.7% were 75 years or less 19.7% belonged to minority ethnic groups 19.7% belonged to minority ethnic groups 52% were living alone52% were living alone 62.3% had completed high school or less 62.3% had completed high school or less 70.4% lived in Buffalo70.4% lived in Buffalo 54.2% owned a house54.2% owned a house 35.4% earn less than $10,000 annually 35.4% earn less than $10,000 annually 33.1% were married33.1% were married
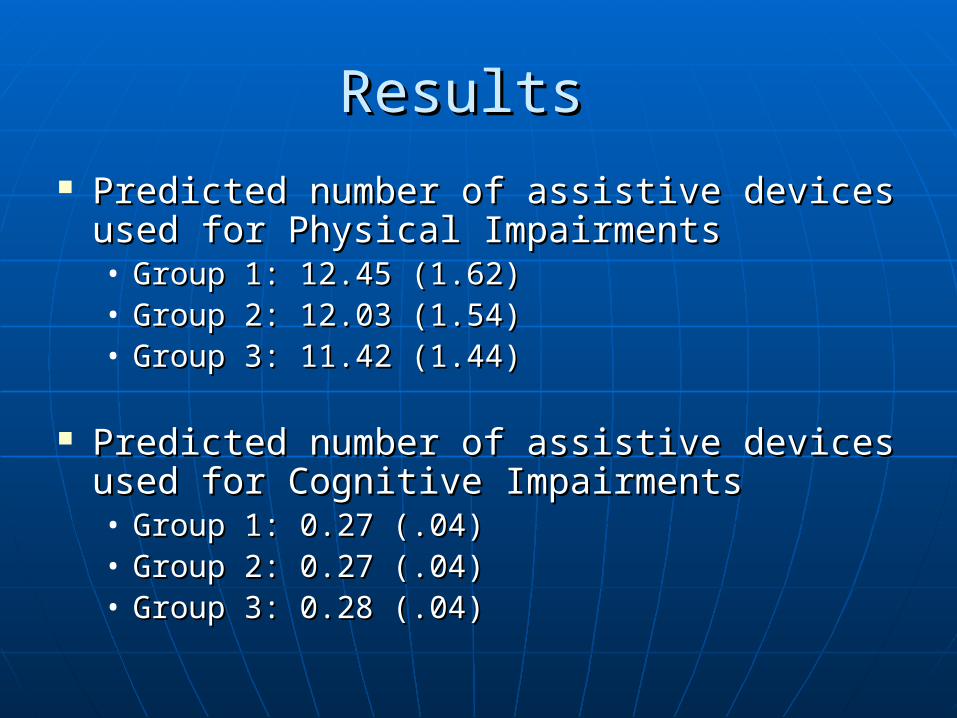
Results Results
Predicted number of assistive devices Predicted number of assistive devices used for Physical Impairments used for Physical Impairments • Group 1: 12.45 (1.62)Group 1: 12.45 (1.62)• Group 2: 12.03 (1.54)Group 2: 12.03 (1.54)• Group 3: 11.42 (1.44)Group 3: 11.42 (1.44)
Predicted number of assistive devices Predicted number of assistive devices used for Cognitive Impairments used for Cognitive Impairments • Group 1: 0.27 (.04)Group 1: 0.27 (.04)• Group 2: 0.27 (.04)Group 2: 0.27 (.04)• Group 3: 0.28 (.04)Group 3: 0.28 (.04)
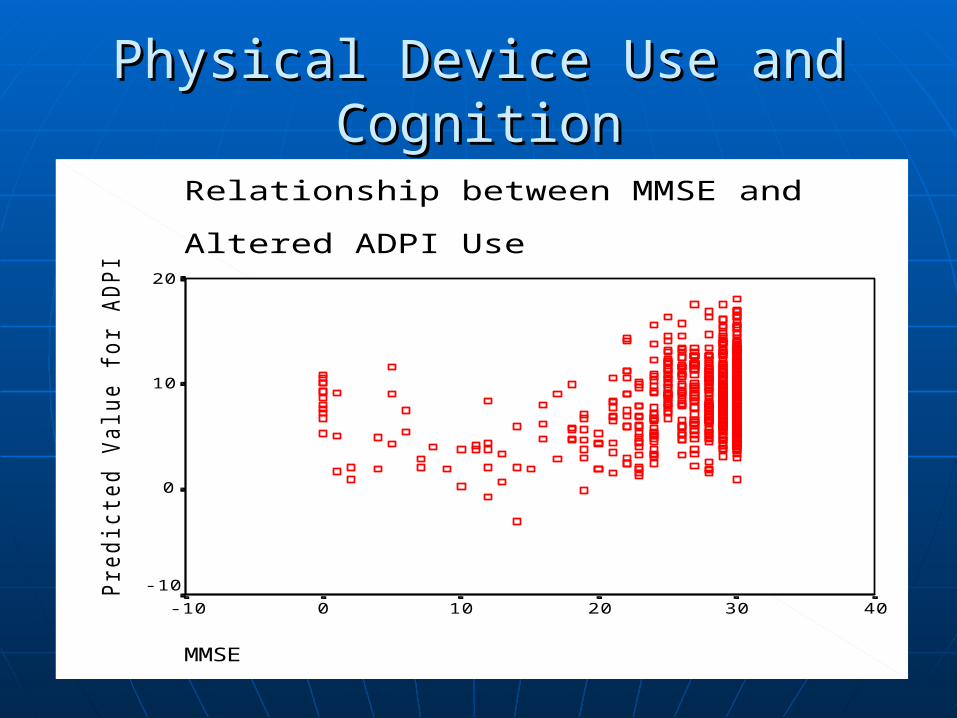
Physical Device Use and CognitionPhysical Device Use and Cognition
Relationship between MMSE and
Altered ADPI Use
MMSE
403020100-10
Pre
dic
ted
Va
lue
fo
r A
DP
I
20
10
0
-10

Relationship between AD and Relationship between AD and CognitionCognition
A curvilinear relationship was found between A curvilinear relationship was found between cognition and AD usecognition and AD use(Tomita, Mann, Stanton and Fraas, 2001)(Tomita, Mann, Stanton and Fraas, 2001)
Cut-off points for MMSE were established Cut-off points for MMSE were established • Group 1 : 0-15 (severe cognitive Group 1 : 0-15 (severe cognitive
impairment)impairment)• Group 2: 16-23 (mild cognitive impairment)Group 2: 16-23 (mild cognitive impairment)• Group 3: 24-30 (no cognitive impairment)Group 3: 24-30 (no cognitive impairment)(Tombaugh and Mclntyre, 1992)(Tombaugh and Mclntyre, 1992)

Demographic Differences - RaceDemographic Differences - RacePhysical Device Use - Race and MMSE
0
5
10
15
20
25
0 5 10 15 20 25 30 35
MMSE
Ph
ysic
al d
evi
ce u
se
White Minority
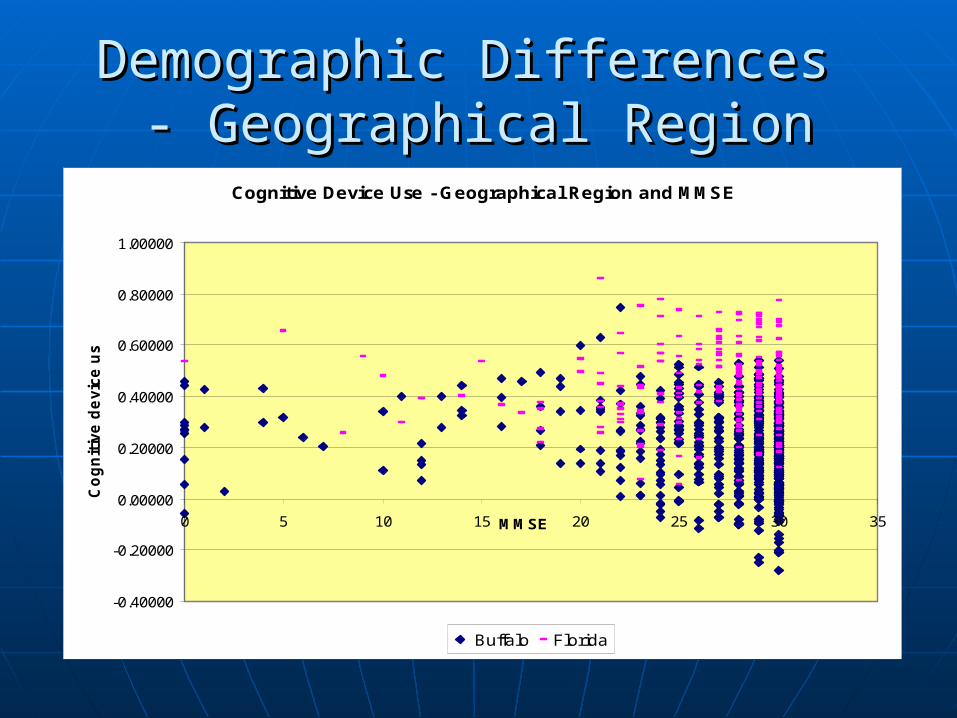
Demographic Differences Demographic Differences - Geographical Region- Geographical Region
Cognitive Device Use - Geographical Region and MMSE
-0.40000
-0.20000
0.00000
0.20000
0.40000
0.60000
0.80000
1.00000
0 5 10 15 20 25 30 35MMSE
Co
gn
itiv
e d
evic
e u
se
Buffalo Florida

Demographic Predictors Demographic Predictors
Group 1 (MMSE 0-15)Group 1 (MMSE 0-15) Assistive devices for physical Assistive devices for physical
impairmentsimpairments• MMSE MMSE ((ββ = -.283, p <.05) = -.283, p <.05)
Assistive devices for cognitive Assistive devices for cognitive impairmentsimpairments• None None

Demographic PredictorsDemographic Predictors
Group 2 (MMSE 16-23) Assistive devices for physical
impairments• Geographic region (β = .228, p <.05)• Education (β = .215, p <.05)
Assistive devices for cognitive impairments• Race (β = -.263, p <.01)• Housing status (β = .183, p <.05)

Demographic PredictorsDemographic Predictors
Group 3 (MMSE 24-30)Group 3 (MMSE 24-30) Assistive devices for physical Assistive devices for physical
impairmentsimpairments• RaceRace ( (ββ = -.235, p <.01) = -.235, p <.01)• EducationEducation ( (ββ = .071, p <.05) = .071, p <.05)
Assistive devices for cognitive Assistive devices for cognitive impairmentsimpairments• Geographic region Geographic region ((ββ = .182, p <.01) = .182, p <.01)• MMSEMMSE ( (ββ = -.094, p <.01) = -.094, p <.01)• Living ArrangementLiving Arrangement ( (ββ = -.080, p <.05) = -.080, p <.05)

ConclusionConclusion This study hypothesized that based on the demographic This study hypothesized that based on the demographic
factors there are differences in the pattern of AD use among factors there are differences in the pattern of AD use among elders with and without cognitive impairmentelders with and without cognitive impairment
However, no differences were observed for adults However, no differences were observed for adults with low levels of cognitionwith low levels of cognition• Caregiver involvementCaregiver involvement
For elders with mild cognitive impairmentFor elders with mild cognitive impairment• Living alone, higher education, owning a house and living Living alone, higher education, owning a house and living
in the south were factors associated with increased use of in the south were factors associated with increased use of ADAD
For elders with no cognitive impairmentFor elders with no cognitive impairment• In addition to the above factors, minority elders were less In addition to the above factors, minority elders were less
likely to use ADs likely to use ADs
DiscussionDiscussion
Assistive devices can help promote Assistive devices can help promote independence and autonomy in older adultsindependence and autonomy in older adults
Knowledge of who uses assistive devices and Knowledge of who uses assistive devices and under what circumstances is essentialunder what circumstances is essential
Occupational therapists should work towards Occupational therapists should work towards increasing the awareness of ADs and focus increasing the awareness of ADs and focus their intervention on the predisposed groupstheir intervention on the predisposed groups
Top Related