


Languages
Pages
Legal

Demnitz, N; Zsoldos, E; Mahmood, A; Mackay, CE; Kivimki, M;Singh-Manoux, A; Dawes, H; Johansen-Berg, H; Ebmeier, KP; Sex-ton, CE (2017) Associations between Mobility, Cognition, and BrainStructure in Healthy Older Adults. Frontiers in aging neuroscience, 9.p. 155. ISSN 1663-4365 DOI: https://doi.org/10.3389/fnagi.2017.00155
Downloaded from: http://researchonline.lshtm.ac.uk/4570749/
DOI: 10.3389/fnagi.2017.00155
Usage Guidelines
Please refer to usage guidelines at http://researchonline.lshtm.ac.uk/policies.html or alterna-tively contact [email protected].
Available under license: http://creativecommons.org/licenses/by/2.5/
fnagi-09-00155 May 20, 2017 Time: 17:33 # 1
ORIGINAL RESEARCHpublished: 23 May 2017
doi: 10.3389/fnagi.2017.00155
Edited by:Aurel Popa-Wagner,
University of Rostock, Germany
Reviewed by:Henryk Urbanski,
Oregon National Primate ResearchCenter, United States
Raluca Sandu Vintilescu,University of Medicine and Pharmacy
of Craiova, Romania
*Correspondence:Claire E Sexton
Received: 24 February 2017Accepted: 05 May 2017Published: 23 May 2017
Citation:Demnitz N, Zsoldos E, Mahmood A,
Mackay CE, Kivimäki M,Singh-Manoux A, Dawes H,
Johansen-Berg H, Ebmeier KP andSexton CE (2017) Associations
between Mobility, Cognition,and Brain Structure in Healthy Older
Adults. Front. Aging Neurosci. 9:155.doi: 10.3389/fnagi.2017.00155
Associations between Mobility,Cognition, and Brain Structure inHealthy Older AdultsNaiara Demnitz1,2, Eniko Zsoldos1, Abda Mahmood1, Clare E. Mackay3, Mika Kivimäki3,Archana Singh-Manoux3, Helen Dawes4, Heidi Johansen-Berg2, Klaus P. Ebmeier1 andClaire E. Sexton2*
1 Department of Psychiatry, University of Oxford, Warneford Hospital, Oxford, United Kingdom, 2 Oxford Centre for FunctionalMRI of the Brain, Nuffield Department of Clinical Neurosciences, University of Oxford, John Radcliffe Hospital, Oxford,United Kingdom, 3 Department of Epidemiology and Public Health, University College London, London, United Kingdom,4 Oxford Institute of Nursing, Midwifery and Allied Health Research, Oxford Brookes University, Oxford, United Kingdom
Mobility limitations lead to a cascade of adverse events in old age, yet the neural andcognitive correlates of mobility performance in older adults remain poorly understood.In a sample of 387 adults (mean age 69.0 ± 5.1 years), we tested the relationshipbetween mobility measures, cognitive assessments, and MRI markers of brain structure.Mobility was assessed in 2007–2009, using gait, balance and chair-stands tests. In2012–2015, cognitive testing assessed executive function, memory and processing-speed; gray matter volumes (GMV) were examined using voxel-based morphometry,and white matter microstructure was assessed using tract-based spatial statistics offractional anisotropy, axial diffusivity (AD), and radial diffusivity (RD). All mobility measureswere positively associated with processing-speed. Faster walking speed was alsocorrelated with higher executive function, while memory was not associated with anymobility measure. Increased GMV within the cerebellum, basal ganglia, post-centralgyrus, and superior parietal lobe was associated with better mobility. In addition, betterperformance on the chair-stands test was correlated with decreased RD and AD.Overall, our results indicate that, even in non-clinical populations, mobility measurescan be sensitive to sub-clinical variance in cognition and brain structures.
Keywords: mobility, gait, balance, aging, cognition, MRI, gray matter
INTRODUCTION
The capacity to move is essential for functional independence and quality of life in late adulthood.Unfortunately, mobility deteriorates with age and mobility impairments are becoming increasinglyprevalent in aging populations, affecting 20–60% of adults aged 65 and older (Centers for DiseaseControl and Prevention, 2014; Office for National Statistics, 2015). In addition to being associatedwith an increased risk of falls, hospitalizations (Cesari et al., 2009), and poor quality of life (Oh et al.,2014), mounting evidence has highlighted the close relationship between aspects of mobility andcognitive processes, including executive function, memory and processing speed (Demnitz et al.,2016; Morris et al., 2016). Such findings have sparked interest in examining the neural correlates ofmobility performance in older adults.
Frontiers in Aging Neuroscience | www.frontiersin.org 1 May 2017 | Volume 9 | Article 155
fnagi-09-00155 May 20, 2017 Time: 17:33 # 2
Demnitz et al. Mobility, Cognition, and Brain Structure
Magnetic resonance imaging (MRI) techniques allow for theexamination of brain structure in vivo and have provided keyinsights into how mobility performance in aging correlates tothe brain’s gray and white matter structures, both in health anddisease (Holtzer et al., 2014). With regard to healthy older adults,studies examining region-specific abnormalities associated withmeasures of gait have implicated volume reductions within thehippocampus (Callisaya et al., 2013; Beauchet et al., 2015),the basal ganglia (Dumurgier et al., 2012), and the cerebellum(Nadkarni et al., 2014). Findings have not, however, always beenconsistent, as some studies have found no association betweenmobility measures and brain volumes in healthy older adults, orfailed to replicate the previously reported association betweengait measures and the cerebellum (Rosano et al., 2008; Manoret al., 2012). Although fewer studies have examined white matterstructures in relation to mobility, a study using diffusion tensorimaging (DTI) to investigate white matter microstructure foundthat lower fractional anisotropy (FA), interpreted as decreasedwhite matter integrity, in the genu of the corpus callosum wasassociated with more abnormal gait (Bhadelia et al., 2009).
Further, much of the research to date in this field hasbeen limited to gait, a single aspect of mobility. Mobility isa multi-faceted domain that involves not only walking, butalso maintaining balance and being able to rise from beds andchairs. Such additional measures (e.g., balance and chair rises)are valuable risk markers of falls (de Rekeneire et al., 2003),functional impairment (Guralnik et al., 2000), institutionalizationand mortality (Cesari et al., 2009).
In a prospective cohort study, we first aim to examinethe association between three objective measures of mobility(chair stands, walking time and balance) and cognitive function(memory, executive function and processing speed). Comparedwith gait, the relationship between balance, chair standsand cognition has been understudied, and few studies haveconcurrently examined multiple mobility outcomes (Demnitzet al., 2016). We aim to address these outstanding questions byanalyzing these associations in a single, large, well-characterizedsample of older adults. Second, we aim to explore how mobilityrelates to global and localized gray matter volume (GMV) andwhite matter integrity and test the hypothesis that poor mobilityis associated with decreased GMVs and white matter integrity ina sample of older adults free from neurological illnesses.
MATERIALS AND METHODS
Study SampleThe Whitehall II Study is a prospective cohort of British civilservants established in 1985 (Marmot and Brunner, 2005).Starting in 2012, the Whitehall II Imaging Sub-Study randomlyselected participants from the Whitehall II Study for an additionalassessment phase (Filippini et al., 2014). The present studysample was drawn from participants in the Whitehall IIImaging Sub-Study between May 2012 and January 2015. Allincluded participants completed mobility assessments in 2007–2009 (Phase 9 of Whitehall II, henceforth time-point 1) and, ona subsequent phase of data collection (2012–2015, henceforth
time-point 2), completed a 3T MRI brain scan and a battery ofcognitive tests and health assessments. Participants were eligibleif they reported no history of neurological illness, did not displaysignificant abnormalities on structural MRI scans (e.g., evidenceof infarction) and had complete data relating to mobility,cognitive, and MRI measures. Ethical approval for the WhitehallII Study was obtained from the University College LondonMedical School Committee on the Ethics of Human Research.The subsequent Whitehall II Imaging Sub-Study received ethicalapproval from the Oxford Central University Research EthicsCommittee and informed written consent was obtained from allparticipants at all stages.
Mobility MeasuresAll mobility measures were conducted at time-point 1 by atrained nurse. Walking time (in seconds) was measured witha stopwatch over a clearly marked 8-foot (2.44 m) course.Participants either wore closed, low-heeled, footwear or walkedbarefoot. Participants were instructed to walk at their own paceand to complete the course three times. In the present analysis,the quickest time was used. Balance was measured as time (inseconds) a balance position (one-legged stand, with eyes open)was held, with an upper cut-off of 30 s. In the chair stands tests,participants were asked to sit on an armless chair, rest their feeton the floor and to fold their arms across their chest. Participantswere instructed to stand up and sit down without using theirarms five times, and to do so as quickly as possible. The time (inseconds) taken to complete five chair rises was recorded.
Cognitive MeasuresParticipants completed a battery of cognitive tests at thetime of the MRI scan (time-point 2), as outlined previously(Filippini et al., 2014). The cognitive tests were classified intothree domains: executive function, memory and processingspeed. The executive function domain included digit span:forward, backward and sequence (Wechsler, 2008), fluency:letter and category, and the trail-making task, part B (TMT:B)(Reitan, 1955). The memory domain included the HopkinsVerbal Learning Test Revised (HVLT-R): total recall, delayedrecall and recognition (Brandt, 1991), and the Rey-Osterriethcomplex figure (RCF) test: immediate recall, delayed recall andrecognition (Osterrieth, 1944). Finally, the processing speeddomain consisted of the trail-making tasks, part A (TMT:A;Reitan, 1955), digit coding (Wechsler, 2008), and CANTABreaction time: simple reaction time, choice reaction time, simplemovement time and choice movement time (Sahakian andOwen, 1992). To ensure that higher scores always reflectedbetter performance, signs were reversed in the trail-making andCANTAB reaction time tests.
MRI Acquisition and AnalysisMagnetic resonance imaging data were acquired on a 3 TeslaSiemens Magnetrom Verio scanner with a 32-channel head coilat time-point 2. T1-weighted structural images were acquiredusing a three-dimensional rapid gradient echo sequence (2530msrepetition time, 7.37 ms echo time, 7◦ flip angle, 256 mmfield of view and 1.0 mm isotropic voxels). Diffusion-weighted
Frontiers in Aging Neuroscience | www.frontiersin.org 2 May 2017 | Volume 9 | Article 155
fnagi-09-00155 May 20, 2017 Time: 17:33 # 3
Demnitz et al. Mobility, Cognition, and Brain Structure
images were collected using an echoplanar imaging sequence(60 diffusion-weighted directions, b-value 1500 s/mm2; five non-diffusion weighted images, b-value 0s/mm2, with one b0 volumein the reversed phase encoded direction). Further parameterswere set at: 8900 ms repetition time, 91.2 ms echo time, 192 mmfield of view and 2.0 mm isotropic voxels.
Analysis of MRI data was carried out with tools fromthe FMRIB Software Library (FSL) (Smith et al., 2004). T1-weighted images were processed using fsl_anat1. Voxel-basedmorphometry was carried out using FSL-VBM (Douaud et al.,2007), an optimized VBM protocol (Good et al., 2001). First,brain-extracted images were gray matter-segmented using non-linear registration (Andersson et al., 2010). Resulting imageswere subsequently averaged to create a study-specific gray mattertemplate. All native gray matter images were then registeredto the template and modulated to correct for local expansionor contraction. The modulated gray matter images were thensmoothed with an isotropic Gaussian kernel with sigma of 3 mm.
In the DTI analysis, head motion and susceptibility and eddy-current induced distortions were corrected for using the tool eddy(Andersson and Sotiropoulos, 2016). Voxelwise analysis of DTIdata was performed using Tract-Based Spatial Statistics (TBSS)(Smith et al., 2006). First, FA images were created by fitting adiffusion tensor model to the raw diffusion data using DTIFIT.Non-brain tissue was removed using FSL’s brain extractiontool (Smith, 2002). Next, the FA data from all participantswere aligned into a common space using FMRIB’s NonlinearRegistration Tool (Andersson et al., 2010). The mean FA imagewas then calculated and thinned to create a mean FA skeleton,which represents the centers of all tracts common to the group,yielding a mask with 128,455 voxels. Each participant’s aligned FAimage was then projected onto the mean FA skeleton. Nonlinearwarps and skeleton projection stages were repeated for radialdiffusivity (RD) and axial diffusivity (AD) values.
Sample Characteristics and CovariatesAge, sex, and education level were recorded for all participants attime-point 2. Education was scored on a five-point scale: (1) noqualifications, (2) GCE O-levels or equivalent, (3) GCE A-levels,college certificate or professional qualification, (4) degree, (5)higher degree.
At the time of the MRI scan, depressive symptoms, physicalactivity, sleep quality, BMI, blood pressure and history ofarthritis were assessed as previously outlined (Filippini et al.,2014). Briefly, depressive symptoms were assessed using theCentre for Epidemiological Studies Depression Scale (CES-D),a clinically validated self-report questionnaire (Radloff, 1991).Physical activity was measured using the Community HealthyActivities Model Program for Seniors (CHAMPS) questionnaire(Stewart et al., 2001). The CHAMPS is a self-report questionnairedesigned for older adults, wherein participants report the weeklyfrequency and duration of various activities. Each activity isassigned a Metabolic Equivalent of Task (MET) value, and theMET.Minutes used here was calculated from 20 items thatrepresented moderate to vigorous physical activity (MET ≥ 3.0).
1http://t2fsl.fmrib.ox.ac.uk/fsl/fslwiki/fsl_anat
The Pittsburgh Sleep Quality Inventory (PSQI) was used tomeasure sleep quality (Buysse et al., 1989) and BMI was calculatedfrom participants’ height and weight. Finally, blood pressurewas measured twice while seated (OMRON HEM-907; OMRONHealthcare UL Ltd., Milton Keynes). The average systolic anddiastolic values were used to calculate mean arterial pressure(MAP; (systolic blood pressure+ 2 ∗ diastolic blood pressure)/3).History of arthritis, defined as M00-M25 in the ICD-10, wascollected through self-report.
Statistical AnalysisTo examine the association between cognition and mobilitymeasures, statistical analysis was performed using PermutationAnalysis of Linear Models (PALM) (Winkler et al., 2014).Non-parametric combination (NPC) using Fisher’s combiningfunction was used to assess overall p-value for each cognitivedomain, therefore reducing the number of comparisons (Winkleret al., 2016). Uncorrected values for individual tests were reportedfor descriptive purposes.
For statistical whole brain analyses of GM volumes and DTImetrics (FA, AD and RD), voxel-wise general linear models wereapplied using permutation-based non-parametric testing usingrandomize (5,000 permutations). Thresholding was carried outusing TFCE (threshold-free cluster enhancement) (Smith andNichols, 2009), and clusters were assessed for significance atp < 0.05, corrected for multiple comparisons across space.
In the MRI analyses of walking speed and chair standmeasures, we used linear models. For balance, 278 (72%) ofparticipants performed at ceiling – meaning they held the balanceposition for the whole 30 s. We therefore divided participantsinto two groups: good (held position for 30 s) and poor (heldposition for less than 30 s, average 13.8 ± 8 s) balance andconducted group comparisons in our cognitive, VBM and TBSSanalyses. For our linear analyses of walking speed and chair standmeasures, the VBM study template included all participants. Forthe group comparison analysis, a matched sub-sample of goodand poor balance performers was used to create the template inaccordance with FSL guidelines2.
All statistical analyses included age, sex, and education level ascovariates. All statistical analyses were then repeated with BMI,sleep quality and history of arthritis as additional covariates.
RESULTS
Of the 496 Whitehall II Imaging study participants, 387 wereincluded in our analyses (mean age 69, SD 5.11; 19% women;Table 1). Participants excluded due to missing data were olderand less educated, but did not significantly differ to the includedsample in sex distribution (Supplementary Image 1 and Table 1).
Mobility and CognitionThe p-values for the associations between each mobility measureand cognitive domain are presented in Table 2.
2http://fsl.fmrib.ox.ac.uk/fsl/fslwiki/FSLVBM/
Frontiers in Aging Neuroscience | www.frontiersin.org 3 May 2017 | Volume 9 | Article 155
fnagi-09-00155 May 20, 2017 Time: 17:33 # 4
Demnitz et al. Mobility, Cognition, and Brain Structure
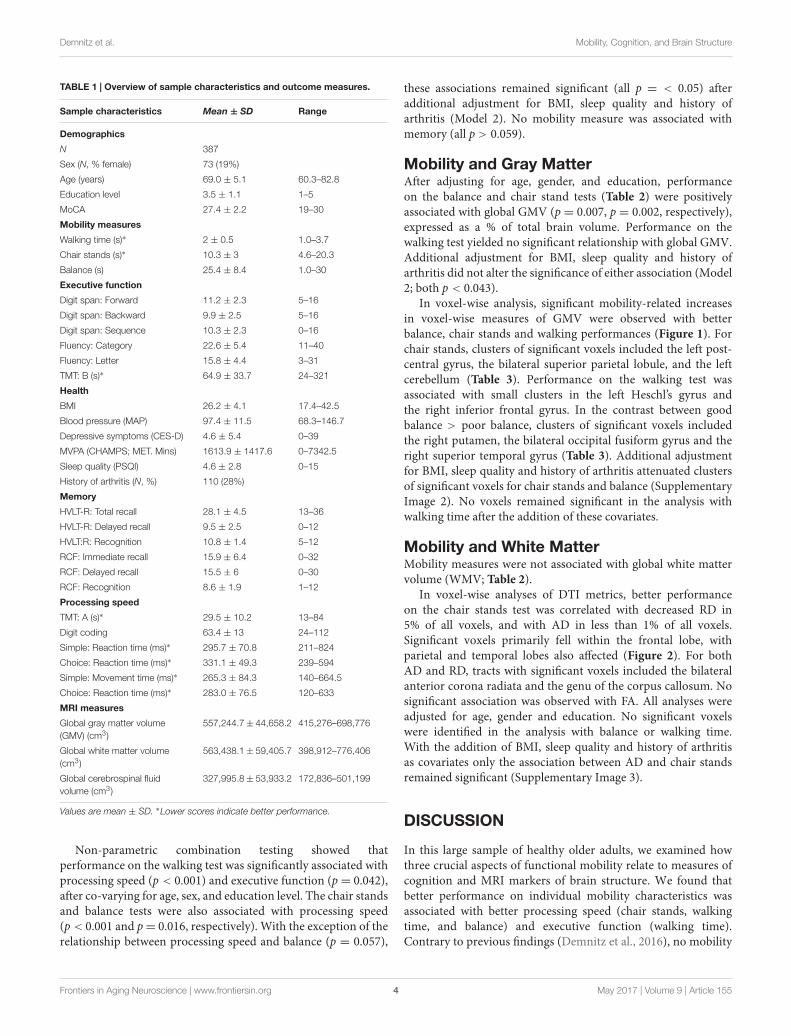
TABLE 1 | Overview of sample characteristics and outcome measures.
Sample characteristics Mean ± SD Range
Demographics
N 387
Sex (N, % female) 73 (19%)
Age (years) 69.0 ± 5.1 60.3–82.8
Education level 3.5 ± 1.1 1–5
MoCA 27.4 ± 2.2 19–30
Mobility measures
Walking time (s)∗ 2 ± 0.5 1.0–3.7
Chair stands (s)∗ 10.3 ± 3 4.6–20.3
Balance (s) 25.4 ± 8.4 1.0–30
Executive function
Digit span: Forward 11.2 ± 2.3 5–16
Digit span: Backward 9.9 ± 2.5 5–16
Digit span: Sequence 10.3 ± 2.3 0–16
Fluency: Category 22.6 ± 5.4 11–40
Fluency: Letter 15.8 ± 4.4 3–31
TMT: B (s)∗ 64.9 ± 33.7 24–321
Health
BMI 26.2 ± 4.1 17.4–42.5
Blood pressure (MAP) 97.4 ± 11.5 68.3–146.7
Depressive symptoms (CES-D) 4.6 ± 5.4 0–39
MVPA (CHAMPS; MET. Mins) 1613.9 ± 1417.6 0–7342.5
Sleep quality (PSQI) 4.6 ± 2.8 0–15
History of arthritis (N, %) 110 (28%)
Memory
HVLT-R: Total recall 28.1 ± 4.5 13–36
HVLT-R: Delayed recall 9.5 ± 2.5 0–12
HVLT:R: Recognition 10.8 ± 1.4 5–12
RCF: Immediate recall 15.9 ± 6.4 0–32
RCF: Delayed recall 15.5 ± 6 0–30
RCF: Recognition 8.6 ± 1.9 1–12
Processing speed
TMT: A (s)∗ 29.5 ± 10.2 13–84
Digit coding 63.4 ± 13 24–112
Simple: Reaction time (ms)∗ 295.7 ± 70.8 211–824
Choice: Reaction time (ms)∗ 331.1 ± 49.3 239–594
Simple: Movement time (ms)∗ 265.3 ± 84.3 140–664.5
Choice: Reaction time (ms)∗ 283.0 ± 76.5 120–633
MRI measures
Global gray matter volume(GMV) (cm3)
557,244.7± 44,658.2 415,276–698,776
Global white matter volume(cm3)
563,438.1± 59,405.7 398,912–776,406
Global cerebrospinal fluidvolume (cm3)
327,995.8± 53,933.2 172,836–501,199
Values are mean ± SD. ∗Lower scores indicate better performance.
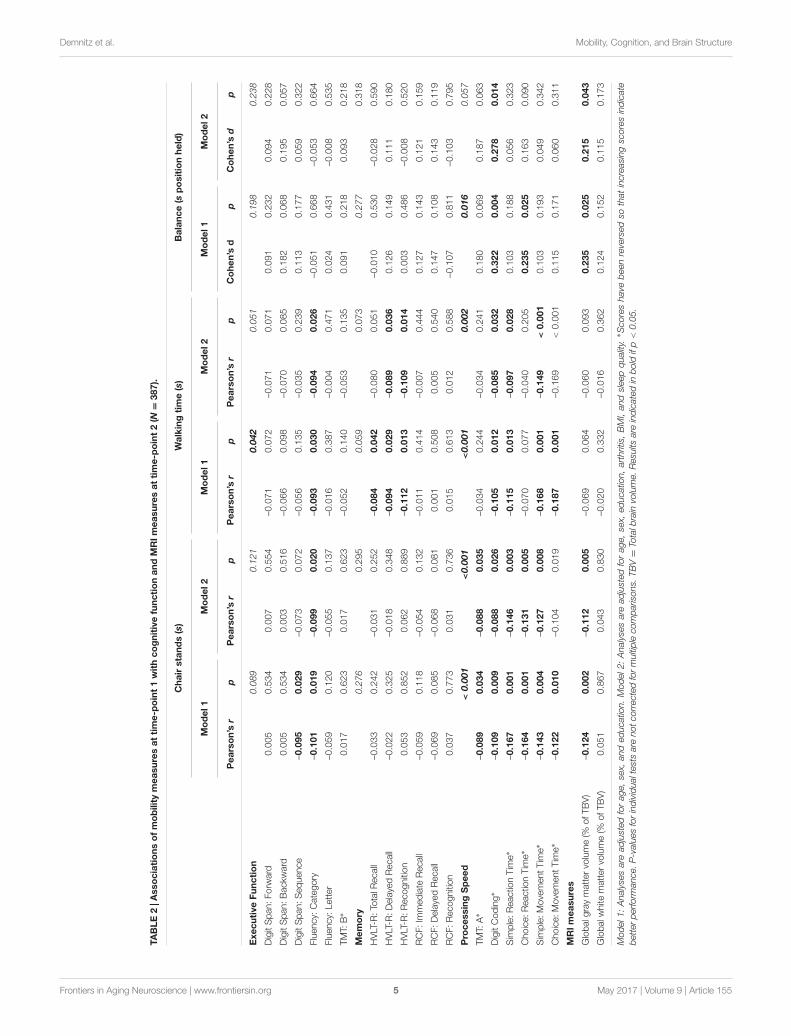
Non-parametric combination testing showed thatperformance on the walking test was significantly associated withprocessing speed (p < 0.001) and executive function (p= 0.042),after co-varying for age, sex, and education level. The chair standsand balance tests were also associated with processing speed(p< 0.001 and p= 0.016, respectively). With the exception of therelationship between processing speed and balance (p = 0.057),
these associations remained significant (all p = < 0.05) afteradditional adjustment for BMI, sleep quality and history ofarthritis (Model 2). No mobility measure was associated withmemory (all p > 0.059).
Mobility and Gray MatterAfter adjusting for age, gender, and education, performanceon the balance and chair stand tests (Table 2) were positivelyassociated with global GMV (p = 0.007, p = 0.002, respectively),expressed as a % of total brain volume. Performance on thewalking test yielded no significant relationship with global GMV.Additional adjustment for BMI, sleep quality and history ofarthritis did not alter the significance of either association (Model2; both p < 0.043).
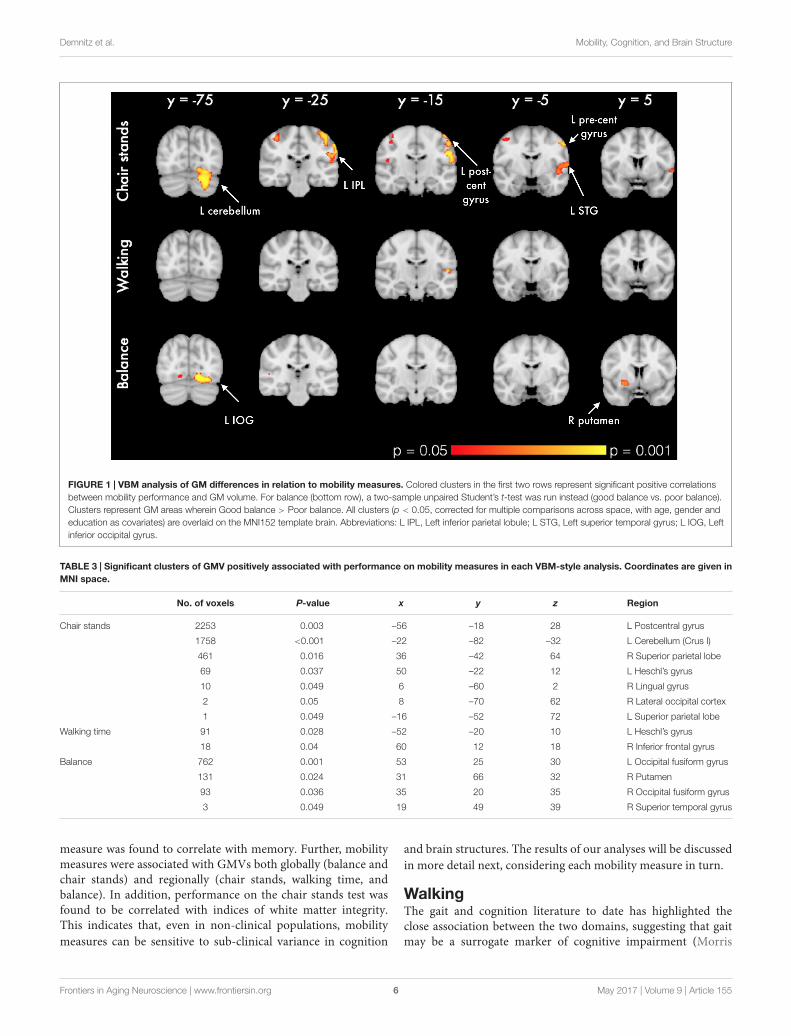
In voxel-wise analysis, significant mobility-related increasesin voxel-wise measures of GMV were observed with betterbalance, chair stands and walking performances (Figure 1). Forchair stands, clusters of significant voxels included the left post-central gyrus, the bilateral superior parietal lobule, and the leftcerebellum (Table 3). Performance on the walking test wasassociated with small clusters in the left Heschl’s gyrus andthe right inferior frontal gyrus. In the contrast between goodbalance > poor balance, clusters of significant voxels includedthe right putamen, the bilateral occipital fusiform gyrus and theright superior temporal gyrus (Table 3). Additional adjustmentfor BMI, sleep quality and history of arthritis attenuated clustersof significant voxels for chair stands and balance (SupplementaryImage 2). No voxels remained significant in the analysis withwalking time after the addition of these covariates.
Mobility and White MatterMobility measures were not associated with global white mattervolume (WMV; Table 2).
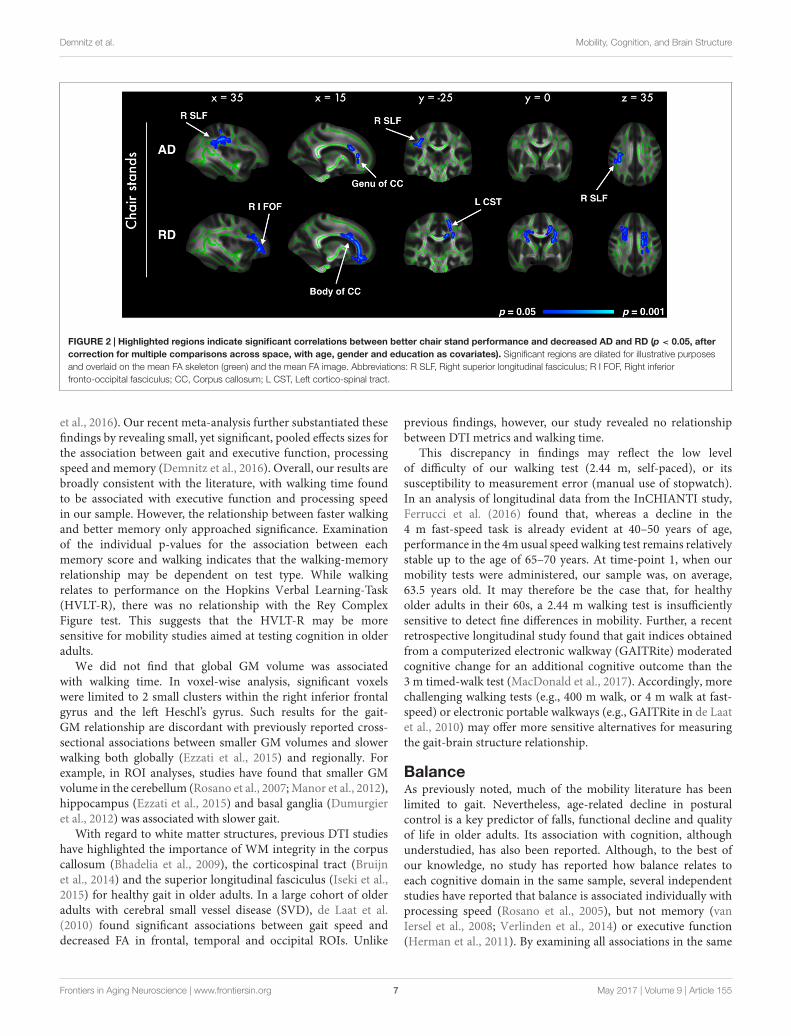
In voxel-wise analyses of DTI metrics, better performanceon the chair stands test was correlated with decreased RD in5% of all voxels, and with AD in less than 1% of all voxels.Significant voxels primarily fell within the frontal lobe, withparietal and temporal lobes also affected (Figure 2). For bothAD and RD, tracts with significant voxels included the bilateralanterior corona radiata and the genu of the corpus callosum. Nosignificant association was observed with FA. All analyses wereadjusted for age, gender and education. No significant voxelswere identified in the analysis with balance or walking time.With the addition of BMI, sleep quality and history of arthritisas covariates only the association between AD and chair standsremained significant (Supplementary Image 3).
DISCUSSION
In this large sample of healthy older adults, we examined howthree crucial aspects of functional mobility relate to measures ofcognition and MRI markers of brain structure. We found thatbetter performance on individual mobility characteristics wasassociated with better processing speed (chair stands, walkingtime, and balance) and executive function (walking time).Contrary to previous findings (Demnitz et al., 2016), no mobility
Frontiers in Aging Neuroscience | www.frontiersin.org 4 May 2017 | Volume 9 | Article 155
fnagi-09-00155 May 20, 2017 Time: 17:33 # 5
Demnitz et al. Mobility, Cognition, and Brain Structure
TAB
LE2
|Ass
oci
atio
nso
fm
ob
ility
mea
sure
sat
tim
e-p
oin
t1
wit
hco
gni
tive
func
tio
nan
dM
RIm
easu
res
atti
me-
po
int
2(N=
387)
.
Cha
irst
and
s(s
)W
alki
ngti
me
(s)
Bal
ance
(sp
osi
tio
nhe
ld)
Mo
del
1M
od
el2
Mo
del
1M
od
el2
Mo
del
1M
od
el2
Pea
rso
n’s
rp
Pea
rso
n’s
rp
Pea
rso
n’s
rp
Pea
rso
n’s
rp
Co
hen’
sd
pC
ohe
n’s
dp
Exe
cuti
veFu
ncti
on
0.08
90.
121
0.04
20.
051
0.19
80.
238
Dig
itS
pan:
Forw
ard
0.00
50.
534
0.00
70.
554
–0.0
710.
072
–0.0
710.
071
0.09
10.
232
0.09
40.
228
Dig
itS
pan:
Bac
kwar
d0.
005
0.53
40.
003
0.51
6–0
.066
0.09
8–0
.070
0.08
50.
182
0.06
80.
195
0.05
7
Dig
itS
pan:
Seq
uenc
e–0
.095
0.02
9–0
.073
0.07
2–0
.056
0.13
5–0
.035
0.23
90.
113
0.17
70.
059
0.32
2
Flue
ncy:
Cat
egor
y–0
.101
0.01
9–0
.099
0.02
0–0
.093
0.03
0–0
.094
0.02
6–0
.051
0.66
8–0
.053
0.66
4
Flue
ncy:
Lett
er–0
.059
0.12
0–0
.055
0.13
7–0
.016
0.38
7–0
.004
0.47
10.
024
0.43
1–0
.008
0.53
5
TMT:
B∗
0.01
70.
623
0.01
70.
623
–0.0
520.
140
–0.0
530.
135
0.09
10.
218
0.09
30.
218
Mem
ory
0.27
60.
295
0.05
90.
073
0.27
70.
318
HV
LT-R
:Tot
alR
ecal
l–0
.033
0.24
2–0
.031
0.25
2–0
.084
0.04
2–0
.080
0.05
1–0
.010
0.53
0–0
.028
0.59
0
HV
LT-R
:Del
ayed
Rec
all
–0.0
220.
325
–0.0
180.
348
–0.0
940.
029
–0.0
890.
036
0.12
60.
149
0.11
10.
180
HV
LT-R
:Rec
ogni
tion
0.05
30.
852
0.06
20.
889
–0.1
120.
013
–0.1
090.
014
0.00
30.
486
–0.0
080.
520
RC
F:Im
med
iate
Rec
all
–0.0
590.
118
–0.0
540.
132
–0.0
110.
414
–0.0
070.
444
0.12
70.
143
0.12
10.
159
RC
F:D
elay
edR
ecal
l–0
.069
0.08
5–0
.068
0.08
10.
001
0.50
80.
005
0.54
00.
147
0.10
80.
143
0.11
9
RC
F:R
ecog
nitio
n0.
037
0.77
30.
031
0.73
60.
015
0.61
30.
012
0.58
8–0
.107
0.81
1–0
.103
0.79
5
Pro
cess
ing
Sp
eed
<0.
001
<0.
001
<0.
001
0.00
20.
016
0.05
7
TMT:
A∗
–0.0
890.
034
–0.0
880.
035
–0.0
340.
244
–0.0
340.
241
0.18
00.
069
0.18
70.
063
Dig
itC
odin
g∗–0
.109
0.00
9–0
.088
0.02
6–0
.105
0.01
2–0
.085
0.03
20.
322
0.00
40.
278
0.01
4
Sim
ple:
Rea
ctio
nTi
me∗
–0.1
670.
001
–0.1
460.
003
–0.1
150.
013
–0.0
970.
028
0.10
30.
188
0.05
60.
323
Cho
ice:
Rea
ctio
nTi
me∗
–0.1
640.
001
–0.1
310.
005
–0.0
700.
077
–0.0
400.
205
0.23
50.
025
0.16
30.
090
Sim
ple:
Mov
emen
tTim
e∗–0
.143
0.00
4–0
.127
0.00
8–0
.168
0.00
1–0
.149
<0.
001
0.10
30.
193
0.04
90.
342
Cho
ice:
Mov
emen
tTim
e∗–0
.122
0.01
0–0
.104
0.01
9–0
.187
0.00
1–0
.169
<0.
001
0.11
50.
171
0.06
00.
311
MR
Imea
sure
s
Glo
balg
ray
mat
ter
volu
me
(%of
TBV
)–0
.124
0.00
2–0
.112
0.00
5–0
.069
0.06
4–0
.060
0.09
30.
235
0.02
50.
215
0.04
3
Glo
balw
hite
mat
ter
volu
me
(%of
TBV
)0.
051
0.86
70.
043
0.83
0–0
.020
0.33
2–0
.016
0.36
20.
124
0.15
20.
115
0.17
3
Mod
el1:
Ana
lyse
sar
ead
just
edfo
rag
e,se
x,an
ded
ucat
ion.
Mod
el2:
Ana
lyse
sar
ead
just
edfo
rag
e,se
x,ed
ucat
ion,
arth
ritis
,B
MI,
and
slee
pqu
ality
.∗S
core
sha
vebe
enre
vers
edso
that
incr
easi
ngsc
ores
indi
cate
bett
erpe
rform
ance
.P-v
alue
sfo
rin
divi
dual
test
sar
eno
tcor
rect
edfo
rm
ultip
leco
mpa
rison
s.TB
V=
Tota
lbra
invo
lum
e.R
esul
tsar
ein
dica
ted
inbo
ldif
p<
0.05
.
Frontiers in Aging Neuroscience | www.frontiersin.org 5 May 2017 | Volume 9 | Article 155
fnagi-09-00155 May 20, 2017 Time: 17:33 # 6
Demnitz et al. Mobility, Cognition, and Brain Structure
FIGURE 1 | VBM analysis of GM differences in relation to mobility measures. Colored clusters in the first two rows represent significant positive correlationsbetween mobility performance and GM volume. For balance (bottom row), a two-sample unpaired Student’s t-test was run instead (good balance vs. poor balance).Clusters represent GM areas wherein Good balance > Poor balance. All clusters (p < 0.05, corrected for multiple comparisons across space, with age, gender andeducation as covariates) are overlaid on the MNI152 template brain. Abbreviations: L IPL, Left inferior parietal lobule; L STG, Left superior temporal gyrus; L IOG, Leftinferior occipital gyrus.
TABLE 3 | Significant clusters of GMV positively associated with performance on mobility measures in each VBM-style analysis. Coordinates are given inMNI space.
No. of voxels P-value x y z Region
Chair stands 2253 0.003 –56 –18 28 L Postcentral gyrus
1758 <0.001 –22 –82 –32 L Cerebellum (Crus I)
461 0.016 36 –42 64 R Superior parietal lobe
69 0.037 50 –22 12 L Heschl’s gyrus
10 0.049 6 –60 2 R Lingual gyrus
2 0.05 8 –70 62 R Lateral occipital cortex
1 0.049 –16 –52 72 L Superior parietal lobe
Walking time 91 0.028 –52 –20 10 L Heschl’s gyrus
18 0.04 60 12 18 R Inferior frontal gyrus
Balance 762 0.001 53 25 30 L Occipital fusiform gyrus
131 0.024 31 66 32 R Putamen
93 0.036 35 20 35 R Occipital fusiform gyrus
3 0.049 19 49 39 R Superior temporal gyrus
measure was found to correlate with memory. Further, mobilitymeasures were associated with GMVs both globally (balance andchair stands) and regionally (chair stands, walking time, andbalance). In addition, performance on the chair stands test wasfound to be correlated with indices of white matter integrity.This indicates that, even in non-clinical populations, mobilitymeasures can be sensitive to sub-clinical variance in cognition
and brain structures. The results of our analyses will be discussedin more detail next, considering each mobility measure in turn.
WalkingThe gait and cognition literature to date has highlighted theclose association between the two domains, suggesting that gaitmay be a surrogate marker of cognitive impairment (Morris
Frontiers in Aging Neuroscience | www.frontiersin.org 6 May 2017 | Volume 9 | Article 155
fnagi-09-00155 May 20, 2017 Time: 17:33 # 7
Demnitz et al. Mobility, Cognition, and Brain Structure
FIGURE 2 | Highlighted regions indicate significant correlations between better chair stand performance and decreased AD and RD (p < 0.05, aftercorrection for multiple comparisons across space, with age, gender and education as covariates). Significant regions are dilated for illustrative purposesand overlaid on the mean FA skeleton (green) and the mean FA image. Abbreviations: R SLF, Right superior longitudinal fasciculus; R I FOF, Right inferiorfronto-occipital fasciculus; CC, Corpus callosum; L CST, Left cortico-spinal tract.
et al., 2016). Our recent meta-analysis further substantiated thesefindings by revealing small, yet significant, pooled effects sizes forthe association between gait and executive function, processingspeed and memory (Demnitz et al., 2016). Overall, our results arebroadly consistent with the literature, with walking time foundto be associated with executive function and processing speedin our sample. However, the relationship between faster walkingand better memory only approached significance. Examinationof the individual p-values for the association between eachmemory score and walking indicates that the walking-memoryrelationship may be dependent on test type. While walkingrelates to performance on the Hopkins Verbal Learning-Task(HVLT-R), there was no relationship with the Rey ComplexFigure test. This suggests that the HVLT-R may be moresensitive for mobility studies aimed at testing cognition in olderadults.
We did not find that global GM volume was associatedwith walking time. In voxel-wise analysis, significant voxelswere limited to 2 small clusters within the right inferior frontalgyrus and the left Heschl’s gyrus. Such results for the gait-GM relationship are discordant with previously reported cross-sectional associations between smaller GM volumes and slowerwalking both globally (Ezzati et al., 2015) and regionally. Forexample, in ROI analyses, studies have found that smaller GMvolume in the cerebellum (Rosano et al., 2007; Manor et al., 2012),hippocampus (Ezzati et al., 2015) and basal ganglia (Dumurgieret al., 2012) was associated with slower gait.
With regard to white matter structures, previous DTI studieshave highlighted the importance of WM integrity in the corpuscallosum (Bhadelia et al., 2009), the corticospinal tract (Bruijnet al., 2014) and the superior longitudinal fasciculus (Iseki et al.,2015) for healthy gait in older adults. In a large cohort of olderadults with cerebral small vessel disease (SVD), de Laat et al.(2010) found significant associations between gait speed anddecreased FA in frontal, temporal and occipital ROIs. Unlike
previous findings, however, our study revealed no relationshipbetween DTI metrics and walking time.
This discrepancy in findings may reflect the low levelof difficulty of our walking test (2.44 m, self-paced), or itssusceptibility to measurement error (manual use of stopwatch).In an analysis of longitudinal data from the InCHIANTI study,Ferrucci et al. (2016) found that, whereas a decline in the4 m fast-speed task is already evident at 40–50 years of age,performance in the 4m usual speed walking test remains relativelystable up to the age of 65–70 years. At time-point 1, when ourmobility tests were administered, our sample was, on average,63.5 years old. It may therefore be the case that, for healthyolder adults in their 60s, a 2.44 m walking test is insufficientlysensitive to detect fine differences in mobility. Further, a recentretrospective longitudinal study found that gait indices obtainedfrom a computerized electronic walkway (GAITRite) moderatedcognitive change for an additional cognitive outcome than the3 m timed-walk test (MacDonald et al., 2017). Accordingly, morechallenging walking tests (e.g., 400 m walk, or 4 m walk at fast-speed) or electronic portable walkways (e.g., GAITRite in de Laatet al., 2010) may offer more sensitive alternatives for measuringthe gait-brain structure relationship.
BalanceAs previously noted, much of the mobility literature has beenlimited to gait. Nevertheless, age-related decline in posturalcontrol is a key predictor of falls, functional decline and qualityof life in older adults. Its association with cognition, althoughunderstudied, has also been reported. Although, to the best ofour knowledge, no study has reported how balance relates toeach cognitive domain in the same sample, several independentstudies have reported that balance is associated individually withprocessing speed (Rosano et al., 2005), but not memory (vanIersel et al., 2008; Verlinden et al., 2014) or executive function(Herman et al., 2011). By examining all associations in the same
Frontiers in Aging Neuroscience | www.frontiersin.org 7 May 2017 | Volume 9 | Article 155

fnagi-09-00155 May 20, 2017 Time: 17:33 # 8
Demnitz et al. Mobility, Cognition, and Brain Structure
sample, our findings expand the existing literature and allow for acomparison across cognitive domains, providing support for theselective association with processing speed, but not memory orexecutive function.
In our sample, older adults with better balance had, onaverage, larger global GMV. In voxel-wise analysis, significantclusters included the occipital fusiform gyrus, the right putamenand the right superior temporal gyrus. Although the observedresults appear to be lateralized, this should be interpretedwith caution as a more bilateral pattern emerges with a slightreduction in the significance threshold (p < 0.1). It has beenpostulated that balance control declines in older adults as aresult of reduced neural integration of visual, vestibular andproprioceptive feedback (Horak, 2006). The pattern of GMclusters observed in our analyses with balance appears to supportthis hypothesis as it indicates that good balance is associated withGMV across motor, visual, and sensorimotor regions.
Although sparse, existing findings have also linked balanceperformance with GM in motor and sensorimotor regions. Incommunity-dwelling adults, it has been shown that smaller GMin the putamen, cerebellum and the right superior posteriorparietal was associated with balance difficulty (Rosano et al.,2007). While our analysis did not reveal any clusters in thecerebellum or superior parietal lobe, we corroborate previousfindings of smaller GM volume in the putamen in older adultswith poor balance. Unlike the ROI approach adopted by Rosanoet al. (2007), our use of voxel-based morphometry, a whole brainanalysis technique unbiased by a priori hypotheses, may accountfor some of our differing results. Further, our corroboratingfindings with regard to the putamen are in line with the well-established role of the basal ganglia in postural control, as can beexemplified by the balance impairments observed in Parkinson’spatients with basal ganglia lesions (see Visser and Bloem, 2005 forreview).
No significant voxels were identified in our TBSS analysis. Ina sample of 36 healthy older adults, Van Impe et al. (2012) foundthat higher FA values in frontal and fronto-occipital tracts wereassociated with better balance performance. Although based ona small sample, these findings are particularly interesting as VanImpe et al. (2012) tested postural control using a balance platformwith a movable visual surround that systematically altered levelsof visual and proprioceptive feedback. Correlations between DTImetrics and postural control were only found for conditionswhere proprioceptive or visual feedback were compromised. Thissuggests that the association between balance and white mattermicrostructure may only be evident under more challengingconditions, and our one-legged balance test, wherein 72% of ourparticipants performed at ceiling, did not present a challenge tomost of our participants.
Chair StandsPerformance on the chair stands test was not found to beassociated with measures of executive function or memory.Processing speed, on the other hand, was significantly correlatedwith chair stand performance. These findings resonate with thosefrom a large cohort study (N = 2,893), wherein older adults withhigher scores on the Digit Symbol Substitution Test, a measure
of processing speed, performed faster on the chair stand test(Rosano et al., 2005).
Few structural studies have investigated the relation betweengray or white matter volumes and the ability to rise from seated.A study of community-dwelling adults (aged 35–70) found thatsmaller pre-frontal cortex and global GM volume were associatedwith slower performance on the timed-up-and go task, a measurethat combines chair rising with gait (Smith et al., 2015). Althoughwe also observed an association with global GM volume, no pre-frontal clusters emerged in our findings. However, the differentnature of the mobility assessments and MRI analysis techniquesused (ROI vs. VBM) limit the comparison between these results.In our VBM analysis, clusters of smaller GM associated withpoorer chair stand performance included the left postcentralgyrus, the superior parietal lobe, and the cerebellum. Associationswith the postcentral gyrus and the cerebellum might reflect thewell-established motor function of these regions (Middleton andStrick, 2000). To navigate one’s environment, the integration ofsensory and visual input is essential. Accordingly, the greater GMvolume in the superior parietal lobe observed with better chairstand might reflect its role in spatial processing.
With regard to white matter, we did not find a relationshipbetween global WM volume and chair stands. Similar results wereobtained by Allali et al. (2016) in a sample of older adults referredto a memory clinic. No study has, to our knowledge, previouslyexamined the association between DTI metrics and chair standperformance. Our voxel-wise analysis revealed increased ADand RD in frontal, parietal and temporal WM. Overall, theseresults suggest that indices of microstructural integrity may beimportant in the earlier stages of age-related decline in functionalmobility measures, before volume changes are evident.
Limitations and ConclusionsThere are limitations to our study. First, included andexcluded participants were significantly different in terms ofage and education level. Accordingly, our sample may not berepresentative of the Whitehall II cohort. Second, given that theWhitehall II cohort consists of United Kingdom civil-servantsfrom the 1980s, a working-force which was then predominantlymale, our sample was not representative of both sexes (19%female). Of note, though, in our meta-analysis of the associationbetween cognition and mobility in older adults, meta-regressionsrevealed no effect of sex on the cognition-mobility relationship(Demnitz et al., 2016). Nonetheless, it would be of interest forfuture MRI studies with a more equal sex distribution to examinethe role of sex on the brain-structure-mobility relationship. Dueto our large sample size it was not feasible to test all participantsat the same time-of-day. Time-of-day has been shown to impactMRI measures of tissue volume (Trefler et al., 2016) and mobilityperformance (Bessot et al., 2015) and may therefore have beena confounder in our analyses. Further, as previously noted, ourwalking test may have lacked sensitivity. Although highly relevantin clinical populations, a 2.44m walking test at usual speed maybe less optimal to capture brain structure-mobility relations inhealthy elderly, and more precise (quantitative gait measures byelectronic walkways) or more challenging (e.g., 4 m at fast pace)measures may be more appropriate in research-settings.
Frontiers in Aging Neuroscience | www.frontiersin.org 8 May 2017 | Volume 9 | Article 155

fnagi-09-00155 May 20, 2017 Time: 17:33 # 9
Demnitz et al. Mobility, Cognition, and Brain Structure
It should also be noted that our sample included a widerange of ages (60–83 years), and mobility performance is veryvariable between 60 and 80 year-olds. To explore how thereported associations may differ between age sub-groups, weconducted a post hoc analysis with our sample stratified by age(60–69 years and 70+ years, see Supplementary Table 2 andImages 4, 5). Interestingly, the association observed betweenincreased global gray matter volume and better balance and chairstands performance appears to be driven by the younger sample(60–69 years). Nonetheless, these results must be interpreted withcaution as the younger strata had a much larger sample size (251vs. 136 participants).
As previously mentioned, the mobility assessments wereconducted at an earlier time-point than the MRI and cognitivemeasurements, and this difference in time-points is a limitationof our study. The obtained associations may, therefore, havebeen confounded by cognitive or MRI changes occurring inthe time elapsed between the two time-points. In addition, asthis was an observational study, we cannot determine causality.Finally, although we obtained measures at different time-points, with mobility measures preceding MRI and cognitivetesting, the nature of this study does not lend itself forconclusions of one variable predicting the presence of the other.Accordingly, our findings show that mobility measures correlatewith later measures of cognition and brain structure, but donot directly test the hypothesis that poor mobility predictspoor cognition or increased brain atrophy at a later time-point. Randomized-controlled trials are required to determinethe directionality of the relationships presented here. Giventhat physical activity has been shown to reliably improvemobility (Pahor et al., 2006), it would be of great interestto determine whether improving mobility (through physicalactivity) is an effective approach for interventions aimed atimproving brain structure and function in aging populations.Promisingly, in a small sub-sample (N = 24) from the LIFEintervention (Fielding et al., 2011), it has been shown that,following a 24-month physical activity intervention, sedentaryolder adults in the physical activity group had a largerhippocampal volume than those in the control group (Rosanoet al., 2016).
Given the close ties between physical activity and mobility,our findings may also tie in with the concept of “brain reserve”.It has been hypothesized that brain reserve may account forinter-individual differences in the brain’s resilience to acceleratedaging, cognitive decline and late life depression (Mercado, 2008;Freret et al., 2015). Physical exercise may increase brain reserve,which may in turn have a neuroprotective effect against cognitivedecline (Chirles et al., 2017). Accordingly, in a recent cross-sectional study of 2,315 older adults, lifestyle factors, includingphysical activity, were shown to account for 20% of the variancein cognitive test scores (Clare et al., 2017). This line of researchhighlights the potential impact of modifiable lifestyle factorson cognition and brain health in later life, therefore stressing
the importance of developing interventions to target thesefactors.
CONCLUSION
Our findings indicate that objective measures of poor mobilityare sensitive to indices of poorer cognitive function, particularlyprocessing speed, and markers of decreased GMV and whitematter microstructure. Across mobility measures, gray matterregions involved in motor, visuospatial and cognitive controlwere implicated. In terms of white matter integrity, significantvoxels in the corpus callosum and frontal regions were observedin the chair stands results. Altogether, these findings highlight themultiple brain regions involved in maintaining mobility in olderadults, and how widespread integration between these areas iswarranted. To our knowledge, this is the first study to combinereports of global and regional associations of both gray andwhite matter with three functional aspects of mobility measures(walking, balance and chair stands) in healthy older adults. Itis our hope that the better understanding of the underpinningsof mobility in the aging brain will drive future investigations ofthe causality behind these relationships and guide communityinterventions aimed at improving mobility and cognition in olderadults.
AUTHOR CONTRIBUTIONS
ND and CS developed the research focus. ND analyzed thedata and wrote the manuscript. EZ, AM, CM, MK, AS-M, HD,HJ-B, KE, and CS contributed to theoretical and methodologicalrefinements and provided detailed suggestions for manuscriptrevisions.
FUNDING
This work was also supported by the NIHR Oxford BiomedicalResearch Centre based at the Oxford University HospitalsNHS Trust and the University of Oxford (HJB, CES, CEM),the Elizabeth Casson Trust Chair (HD), the British ResearchCouncil (HD), the UK Medical Research Council and NordForsk(MK). Whitehall II was supported by the UK Medical ResearchCouncil (K01), the British Heart Foundation, and the USNational Institute of Health (R01AG013196; R01AG034454;R01HL036310).
SUPPLEMENTARY MATERIAL
The Supplementary Material for this article can be foundonline at: http://journal.frontiersin.org/article/10.3389/fnagi.2017.00155/full#supplementary-material
Frontiers in Aging Neuroscience | www.frontiersin.org 9 May 2017 | Volume 9 | Article 155
fnagi-09-00155 May 20, 2017 Time: 17:33 # 10
Demnitz et al. Mobility, Cognition, and Brain Structure
REFERENCESAllali, G., Annweiler, C., Predovan, D., Bherer, L., and Beauchet, O. (2016). Brain
volume changes in gait control in patients with mild cognitive impairmentcompared to cognitively healthy individuals. GAIT study results. Exp. Gerontol.76, 72–79. doi: 10.1016/j.exger.2015.12.007
Andersson, J. L., and Sotiropoulos, S. N. (2016). An integrated approach tocorrection for off-resonance effects and subject movement in diffusion MRimaging. Neuroimage 125, 1063–1078. doi: 10.1016/j.neuroimage.2015.10.019
Andersson, J. L. R., Jenkinson, M., and Smith, S. (2010). Non-linear Registration,Aka Spatial Normalisation. FMRIB Technical Report TR07JA2. Available at:https://www.fmrib.ox.ac.uk/datasets/techrep/
Beauchet, O., Launay, C. P., Annweiler, C., and Allali, G. (2015). Hippocampalvolume, early cognitive decline and gait variability: which association? Exp.Gerontol. 61, 98–104. doi: 10.1016/j.exger.2014.11.002
Bessot, N., Lericollais, R., Gauthier, A., Sesboue, B., Bulla, J., and Moussay, S.(2015). Diurnal variation in gait characteristics and transition speed.Chronobiol. Int. 32, 136–142. doi: 10.3109/07420528.2014.959128
Bhadelia, R. A., Price, L. L., Tedesco, K. L., Scott, T., Qiu, W. Q., Patz, S., et al.(2009). Diffusion tensor imaging, white matter lesions, the corpus callosum,and gait in the elderly. Stroke 40, 3816–3820. doi: 10.1161/STROKEAHA.109.564765
Brandt, J. (1991). The Hopkins verbal learning test: development of a new memorytest with six equivalent forms. Clin. Neuropsychol. 5, 125–142. doi: 10.1080/13854049108403297
Bruijn, S. M., Van Impe, A., Duysens, J., and Swinnen, S. P. (2014). White mattermicrostructural organization and gait stability in older adults. Front. AgingNeurosci. 6:104. doi: 10.3389/fnagi.2014.00104
Buysse, D. J., Reynolds, C. F. III., Monk, T. H., Berman, S. R., and Kupfer, D. J.(1989). The Pittsburgh Sleep Quality Index: a new instrument for psychiatricpractice and research. Psychiatry Res. 28, 193–213. doi: 10.1016/0165-1781(89)90047-4
Callisaya, M. L., Beare, R., Phan, T. G., Blizzard, L., Thrift, A. G., Chen, J., et al.(2013). Brain structural change and gait decline: a longitudinal population-based study. J. Am. Geriatr. Soc. 61, 1074–1079. doi: 10.1111/jgs.12331
Centers for Disease Control and Prevention (2014). Summary Health Statistics:National Health Interview Survey. Atlanta, GA: Centers for Disease Control andPrevention.
Cesari, M., Kritchevsky, S. B., Newman, A. B., Simonsick, E. M., Harris, T. B.,Penninx, B. W., et al. (2009). Added value of physical performance measuresin predicting adverse health-related events: results from the health, aging andbody composition study. J. Am. Geriatr. Soc. 57, 251–259. doi: 10.1111/j.1532-5415.2008.02126.x
Chirles, T. J., Reiter, K., Weiss, L. R., Alfini, A. J., Nielson, K. A., and Smith,J. C. (2017). Exercise training and functional connectivity changes in mildcognitive impairment and healthy elders. J. Alzheimers Dis. 57, 845–856.doi: 10.3233/JAD-161151
Clare, L., Wu, Y. T., Teale, J. C., MacLeod, C., Matthews, F., Brayne, C.,et al. (2017). Potentially modifiable lifestyle factors, cognitive reserve, andcognitive function in later life: a cross-sectional study. PLoS Med. 14:e1002259.doi: 10.1371/journal.pmed.1002259
de Laat, K. F., van Norden, A. G., Gons, R. A., van Oudheusden, L. J., van Uden,I. W., Bloem, B. R., et al. (2010). Gait in elderly with cerebral small vessel disease.Stroke 41, 1652–1658. doi: 10.1161/STROKEAHA.110.583229
de Rekeneire, N., Visser, M., Peila, R., Nevitt, M. C., Cauley, J. A., Tylavsky, F. A.,et al. (2003). Is a fall just a fall: correlates of falling in healthy older persons.The health, aging and body composition study. J. Am. Geriatr. Soc. 51, 841–846.doi: 10.1046/J.1365-2389.2003.51267.X
Demnitz, N., Esser, P., Dawes, H., Valkanova, V., Johansen-Berg, H., Ebmeier, K. P.,et al. (2016). A systematic review and meta-analysis of cross-sectional studiesexamining the relationship between mobility and cognition in healthy olderadults. Gait Posture 50, 164–174. doi: 10.1016/j.gaitpost.2016.08.028
Douaud, G., Smith, S., Jenkinson, M., Behrens, T., Johansen-Berg, H., Vickers, J.,et al. (2007). Anatomically related grey and white matter abnormalities inadolescent-onset schizophrenia. Brain 130(Pt 9), 2375–2386. doi: 10.1093/brain/awm184
Dumurgier, J., Crivello, F., Mazoyer, B., Ahmed, I., Tavernier, B., Grabli, D.,et al. (2012). MRI atrophy of the caudate nucleus and slower walking
speed in the elderly. Neuroimage 60, 871–878. doi: 10.1016/j.neuroimage.2012.01.102
Ezzati, A., Katz, M. J., Lipton, M. L., Lipton, R. B., and Verghese, J. (2015). Theassociation of brain structure with gait velocity in older adults: a quantitativevolumetric analysis of brain MRI. Neuroradiology 57, 851–861. doi: 10.1007/s00234-015-1536-2
Ferrucci, L., Cooper, R., Shardell, M., Simonsick, E. M., Schrack, J. A., andKuh, D. (2016). Age-related change in mobility: perspectives from life courseepidemiology and geroscience. J. Gerontol. A Biol. Sci. Med. Sci. 71, 1184–1194.doi: 10.1093/gerona/glw043
Fielding, R. A., Rejeski, W. J., Blair, S., Church, T., Espeland, M. A., Gill,T. M., et al. (2011). The lifestyle interventions and independence for eldersstudy: design and methods. J. Gerontol. A Biol. Sci. Med. Sci. 66, 1226–1237.doi: 10.1093/gerona/glr123
Filippini, N., Zsoldos, E., Haapakoski, R., Sexton, C. E., Mahmood, A., Allan,C. L., et al. (2014). Study protocol: the Whitehall II imaging sub-study. BMCPsychiatry 14:159. doi: 10.1186/1471-244x-14-159
Freret, T., Gaudreau, P., Schumann-Bard, P., Billard, J. M., and Popa-Wagner, A.(2015). Mechanisms underlying the neuroprotective effect of brain reserveagainst late life depression. J. Neural Transm. 122, 55–61. doi: 10.1007/s00702-013-1154-2
Good, C. D., Johnsrude, I. S., Ashburner, J., Henson, R. N. A., Friston, K. J., andFrackowiak, R. S. J. (2001). A voxel-based morphometric study of ageing in 465normal adult human brains. Neuroimage 14, 21–36. doi: 10.1006/nimg.2001.0786
Guralnik, J. M., Ferrucci, L., Pieper, C. F., Leveille, S. G., Markides, K. S., Ostir,G. V., et al. (2000). Lower extremity function and subsequent disability:consistency across studies, predictive models, and value of gait speed alonecompared with the short physical performance battery. J. Gerontol. A Biol. Sci.Med. Sci. 55, M221–M231. doi: 10.1093/gerona/55.4.m221
Herman, T., Giladi, N., and Hausdorff, J. M. (2011). Properties of the ’timed upand go’ test: more than meets the eye. Gerontology 57, 203–210. doi: 10.1159/000314963
Holtzer, R., Epstein, N., Mahoney, J. R., Izzetoglu, M., and Blumen, H. M. (2014).Neuroimaging of mobility in aging: a targeted review. J. Gerontol. A Biol. Sci.Med. Sci. 69, 1375–1388. doi: 10.1093/gerona/glu052
Horak, F. B. (2006). Postural orientation and equilibrium: what do we need toknow about neural control of balance to prevent falls? Age Ageing 35(Suppl. 2),ii7–ii11. doi: 10.1093/ageing/afl077
Iseki, K., Fukuyama, H., Oishi, N., Tomimoto, H., Otsuka, Y., Nankaku, M., et al.(2015). Freezing of gait and white matter changes: a tract-based spatial statisticsstudy. J. Clin. Mov. Disord. 2, 1. doi: 10.1186/s40734-014-0011-2
MacDonald, S. W., Hundza, S., Love, J. A., DeCarlo, C. A., Halliday, D. W.,Brewster, P., et al. (2017). Concurrent indicators of gait velocity andvariability are associated with 25-year cognitive change: a retrospectivelongitudinal investigation. Front. Aging Neurosci. 9:17. doi: 10.3389/fnagi.2017.00017
Manor, B., Newton, E., Abduljalil, A., and Novak, V. (2012). The relationshipbetween brain volume and walking outcomes in older adults with and withoutdiabetic peripheral neuropathy. Diabetes Care 35, 1907–1912. doi: 10.2337/dc11-2463
Marmot, M., and Brunner, E. (2005). Cohort profile: the Whitehall II study. Int. J.Epidemiol. 34, 251–256. doi: 10.1093/ije/dyh372
Mercado, E. (2008). Neural and cognitive plasticity: from maps to minds. Psychol.Bull. 134, 109–137. doi: 10.1037/0033-2909.134.1.109
Middleton, F. A., and Strick, P. L. (2000). Basal ganglia and cerebellar loops: motorand cognitive circuits. Brain Res. Brain Res. Rev. 31, 236–250. doi: 10.1016/S0165-0173(99)00040-5
Morris, R., Lord, S., Bunce, J., Burn, D., and Rochester, L. (2016). Gait andcognition: mapping the global and discrete relationships in ageing andneurodegenerative disease. Neurosci. Biobehav. Rev. 64, 326–345. doi: 10.1016/j.neubiorev.2016.02.012
Nadkarni, N. K., Nunley, K. A., Aizenstein, H., Harris, T. B., Yaffe, K., Satterfield, S.,et al. (2014). Association between cerebellar gray matter volumes, gait speed,and information-processing ability in older adults enrolled in the Health ABCstudy. J. Gerontol. A Biol. Sci. Med. Sci. 69, 996–1003. doi: 10.1093/gerona/glt151
Office for National Statistics (2015). Life Opportunities Survey: Wave 3. London:Office for National Statistics.
Frontiers in Aging Neuroscience | www.frontiersin.org 10 May 2017 | Volume 9 | Article 155
fnagi-09-00155 May 20, 2017 Time: 17:33 # 11
Demnitz et al. Mobility, Cognition, and Brain Structure
Oh, B., Cho, B., Choi, H. C., Son, K. Y., Park, S. M., Chun, S., et al. (2014).The influence of lower-extremity function in elderly individuals’ quality of life(QOL): an analysis of the correlation between SPPB and EQ-5D. Arch. Gerontol.Geriatr. 58, 278–282. doi: 10.1016/j.archger.2013.10.008
Osterrieth, P. (1944). Le test de copie d’une figure complexe; contribution àl’étude de la perception et de la mémoire. / Test of copying a complexfigure; contribution to the study of perception and memory. Arch. Psychol. 30,206–356.
Pahor, M., Blair, S. N., Espeland, M., Fielding, R., Gill, T. M., Guralnik, J. M.,et al. (2006). Effects of a physical activity intervention on measures ofphysical performance: results of the lifestyle interventions and independencefor Elders Pilot (LIFE-P) study. J. Gerontol. A Biol. Sci. Med. Sci. 61, 1157–1165.doi: 10.1093/gerona/61.11.1157
Radloff, L. S. (1991). The use of the Center for Epidemiologic Studies DepressionScale in adolescents and young adults. J. Youth Adolesc. 20, 149–166.doi: 10.1007/BF01537606
Reitan, R. M. (1955). The relation of the trail making test to organic brain damage.J. Consult. Psychol. 19, 393–394. doi: 10.1037/h0044509
Rosano, C., Aizenstein, H., Brach, J., Longenberger, A., Studenski, S., and Newman,A. B. (2008). Special article: gait measures indicate underlying focal gray matteratrophy in the brain of older adults. J. Gerontol. A Biol. Sci. Med. Sci. 63,1380–1388. doi: 10.1093/gerona/63.12.1380
Rosano, C., Aizenstein, H. J., Studenski, S., and Newman, A. B. (2007). A regions-of-interest volumetric analysis of mobility limitations in community-dwellingolder adults. J. Gerontol. A Biol. Sci. Med. Sci. 62, 1048–1055. doi: 10.1093/gerona/62.9.1048
Rosano, C., Guralnik, J., Pahor, M., Glynn, N. W., Newman, A. B., Ibrahim,T. S., et al. (2016). Hippocampal response to a 24-month physical activityintervention in sedentary older adults. Am. J. Geriatr. Psychiatry 25, 209–217.doi: 10.1016/j.jagp.2016.11.007
Rosano, C., Simonsick, E. M., Harris, T. B., Kritchevsky, S. B., Brach, J., Visser, M.,et al. (2005). Association between physical and cognitive function in healthyelderly: the health, aging and body composition study. Neuroepidemiology 24,8–14. doi: 10.1159/000081043
Sahakian, B. J., and Owen, A. M. (1992). Computerized assessment inneuropsychiatry using CANTAB: discussion paper. J. R. Soc. Med. 85, 399–402.
Smith, E. E., O’Donnell, M., Dagenais, G., Lear, S. A., Wielgosz, A., Sharma, M.,et al. (2015). Early cerebral small vessel disease and brain volume, cognition,and gait. Ann. Neurol. 77, 251–261. doi: 10.1002/ana.24320
Smith, S. M. (2002). Fast robust automated brain extraction. Hum. Brain Mapp. 17,143–155. doi: 10.1002/hbm.10062
Smith, S. M., Jenkinson, M., Johansen-Berg, H., Rueckert, D., Nichols, T. E.,Mackay, C. E., et al. (2006). Tract-based spatial statistics: voxelwise analysisof multi-subject diffusion data. Neuroimage 31, 1487–1505. doi: 10.1016/j.neuroimage.2006.02.024
Smith, S. M., Jenkinson, M., Woolrich, M. W., Beckmann, C. F., Behrens,T. E., Johansen-Berg, H., et al. (2004). Advances in functional and structural
MR image analysis and implementation as FSL. Neuroimage 23(Suppl. 1),S208–S219. doi: 10.1016/j.neuroimage.2004.07.051
Smith, S. M., and Nichols, T. E. (2009). Threshold-free cluster enhancement:addressing problems of smoothing, threshold dependence and localisationin cluster inference. Neuroimage 44, 83–98. doi: 10.1016/j.neuroimage.2008.03.061
Stewart, M., Craig, D., MacPherson, K., and Alexander, S. (2001). Promotingpositive affect and diminishing loneliness of widowed seniors through a supportintervention. Public Health Nurs. 18, 54–63. doi: 10.1046/j.1525-1446.2001.00054.x
Trefler, A., Sadeghi, N., Thomas, A. G., Pierpaoli, C., Baker, C. I., and Thomas, C.(2016). Impact of time-of-day on brain morphometric measures derivedfrom T1-weighted magnetic resonance imaging. Neuroimage 133, 41–52.doi: 10.1016/j.neuroimage.2016.02.034
van Iersel, M. B., Kessels, R. P., Bloem, B. R., Verbeek, A. L., and Olde Rikkert, M. G.(2008). Executive functions are associated with gait and balance in community-living elderly people. J. Gerontol. A Biol. Sci. Med. Sci. 63, 1344–1349.doi: 10.1093/gerona/63.12.1344
Van Impe, A., Coxon, J. P., Goble, D. J., Doumas, M., and Swinnen, S. P. (2012).White matter fractional anisotropy predicts balance performance in olderadults. Neurobiol. Aging 33, 1900–1912. doi: 10.1016/j.neurobiolaging.2011.06.013
Verlinden, V. J., van der Geest, J. N., Hofman, A., and Ikram, M. A. (2014).Cognition and gait show a distinct pattern of association in the generalpopulation. Alzheimers Dement. 10, 328–335. doi: 10.1016/j.jalz.2013.03.009
Visser, J. E., and Bloem, B. R. (2005). Role of the basal ganglia in balance control.Neural. Plast. 12, 161–174; discussion 263–272. doi: 10.1155/NP.2005.161
Wechsler, D. (2008). WAIS-IV: Wechsler Adult Intelligence Scale. San Antonio, TX:Pearson.
Winkler, A. M., Ridgway, G. R., Webster, M. A., Smith, S. M., and Nichols, T. E.(2014). Permutation inference for the general linear model. Neuroimage 92,381–397. doi: 10.1016/j.neuroimage.2014.01.060
Winkler, A. M., Webster, M. A., Brooks, J. C., Tracey, I., Smith, S. M., and Nichols,T. E. (2016). Non-parametric combination and related permutation tests forneuroimaging. Hum. Brain Mapp. 37, 1486–1511. doi: 10.1002/hbm.23115
Conflict of Interest Statement: The authors declare that the research wasconducted in the absence of any commercial or financial relationships that couldbe construed as a potential conflict of interest.
Copyright © 2017 Demnitz, Zsoldos, Mahmood, Mackay, Kivimäki, Singh-Manoux,Dawes, Johansen-Berg, Ebmeier and Sexton. This is an open-access article distributedunder the terms of the Creative Commons Attribution License (CC BY). The use,distribution or reproduction in other forums is permitted, provided the originalauthor(s) or licensor are credited and that the original publication in this journalis cited, in accordance with accepted academic practice. No use, distribution orreproduction is permitted which does not comply with these terms.
Frontiers in Aging Neuroscience | www.frontiersin.org 11 May 2017 | Volume 9 | Article 155