


Languages
Pages
Legal

Defining and Measuring Competencies in
Medical Education + MCAT Update
Henry Sondheimer, M.D. Senior Director
Medical Education Projects
TAAHP - Dallas February 8, 2013
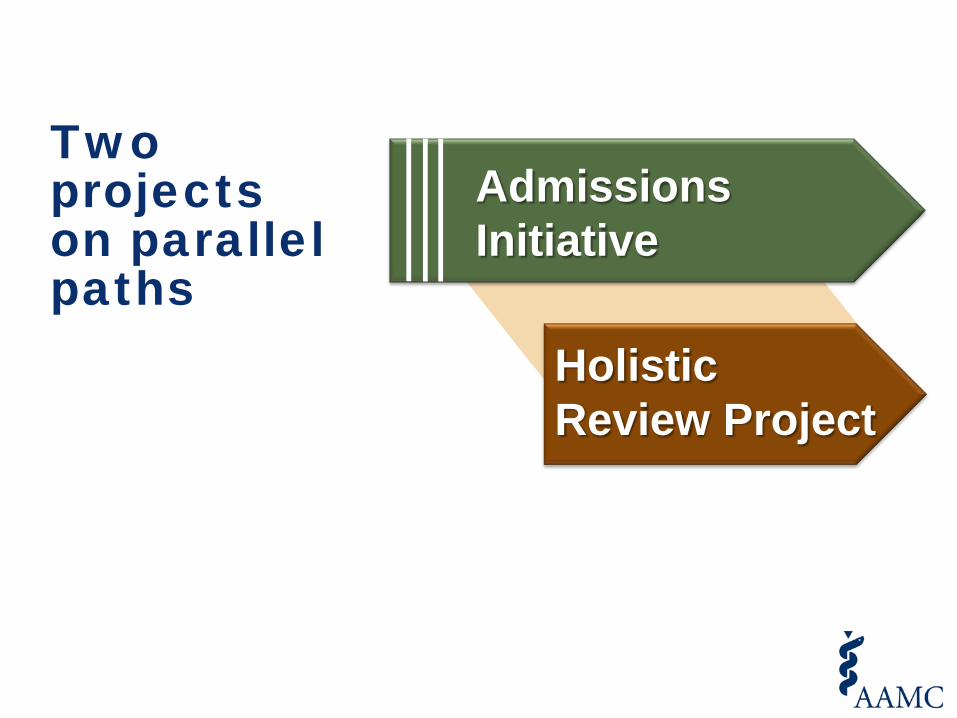
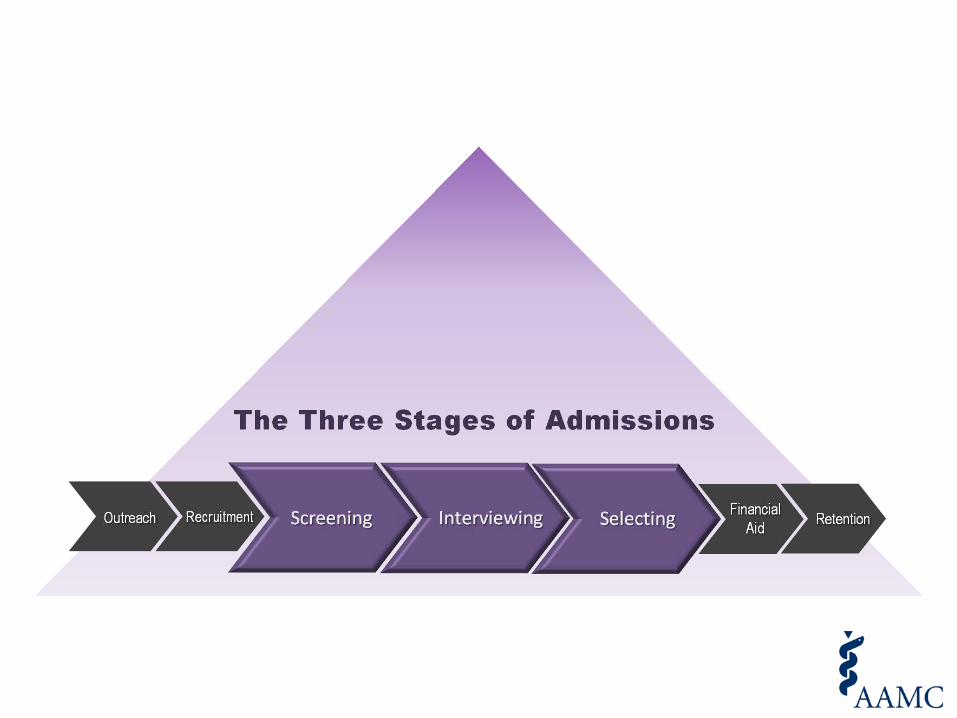
Holistic Review Project
Two projects on parallel paths
Admissions Initiative
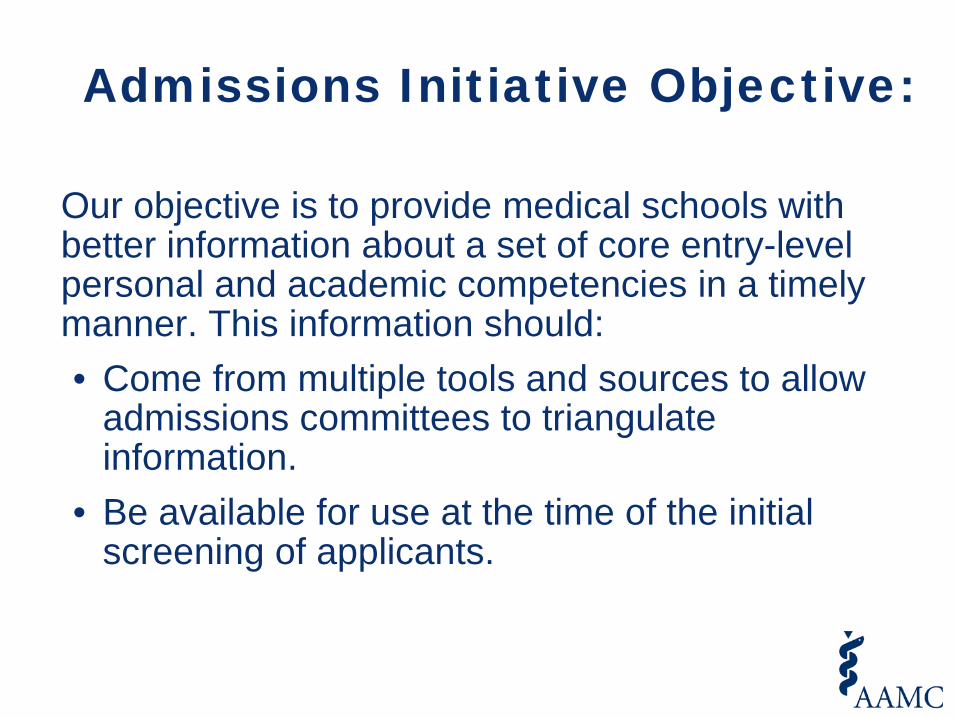
Admissions Initiative Objective:
Our objective is to provide medical schools with better information about a set of core entry-level personal and academic competencies in a timely manner. This information should: • Come from multiple tools and sources to allow
admissions committees to triangulate information.
• Be available for use at the time of the initial screening of applicants.

Competencies: The AAMC remains dedicated to creating a pathway towards Competency-Based Medical Education, and our project will continue to work towards a pathway to Competency-Based Admissions (CBA). MCAT2015 reflects the competencies outlined in the 2009 SFFP report and the 2011 BSSFFP report, and these will be evidenced in our work towards CBA. In addition to this work with entering competencies, the AAMC is currently working with an expert panel of medical school and GME faculty on graduation competencies to define what new physicians should be able to do by themselves (“entrustable activities”) on day 1 of residency.
Competency-Based Medical Education
CBME is an outcomes-based approach to the design, implementation, assessment, and evaluation of medical education programs that uses an organizing framework of competencies. In CBME, competencies – observable abilities related to a specific activity that integrates knowledge, skills, values, and attitudes – are prioritized over the measurement of knowledge alone.

Competency-Based Admissions
CBA is an approach to admissions that employs processes intended to determine each applicant’s ability to demonstrate a core set of entry-level competencies needed to succeed in medical school, residency and in medical practice.

Blue-ribbon Panel Reports Scientific Foundations for Future Physicians Report (2009)
Behavioral and Social Science Foundations for Future Physicians (2011)
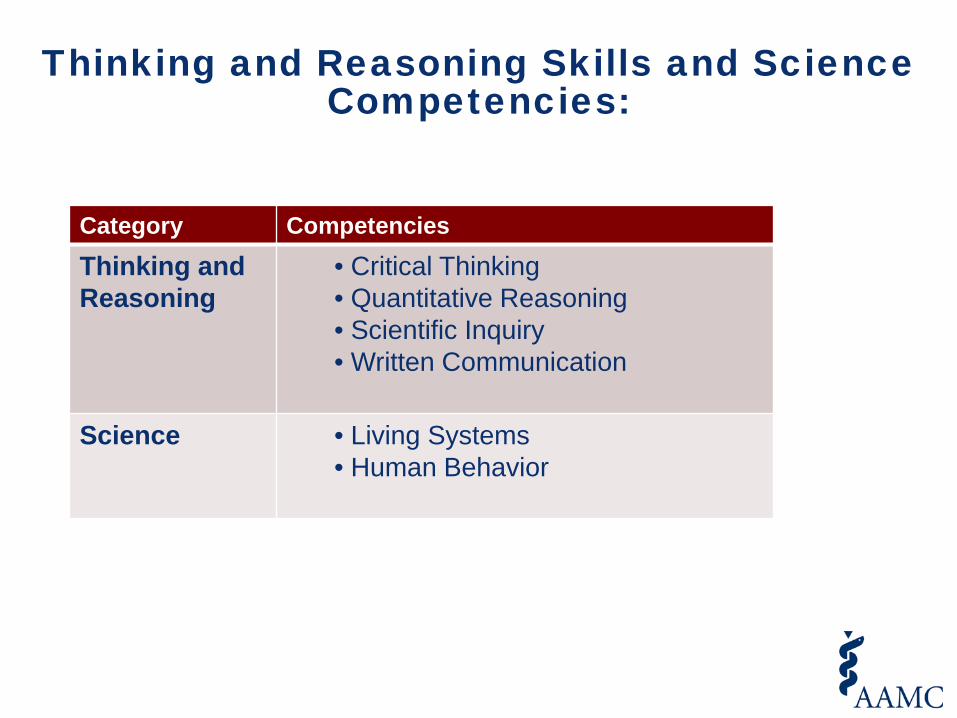
Thinking and Reasoning Skills and Science Competencies:
Category Competencies Thinking and Reasoning
• Critical Thinking • Quantitative Reasoning • Scientific Inquiry • Written Communication
Science • Living Systems
• Human Behavior

Interpersonal and Intrapersonal Competencies:
Category Competencies Interpersonal • Service orientation
• Social skills • Cultural competence • Team work • Oral communication
Intrapersonal • Ethical Responsibility to Others
• Reliability and dependability • Resilience and adaptability • Capacity for improvement

Tied to the ACGME competencies
• Patient Care • Medical knowledge • Professionalism • Interpersonal and communication skills • Practice-based learning and assessment • Systems-based practice • Personal and Professional Development* • Inter-professional collaboration*

Where students display the Thinking and Reasoning Skills and Science competencies
• GPA • MCAT • coursework • research work • job experiences • standardized letters of evaluation
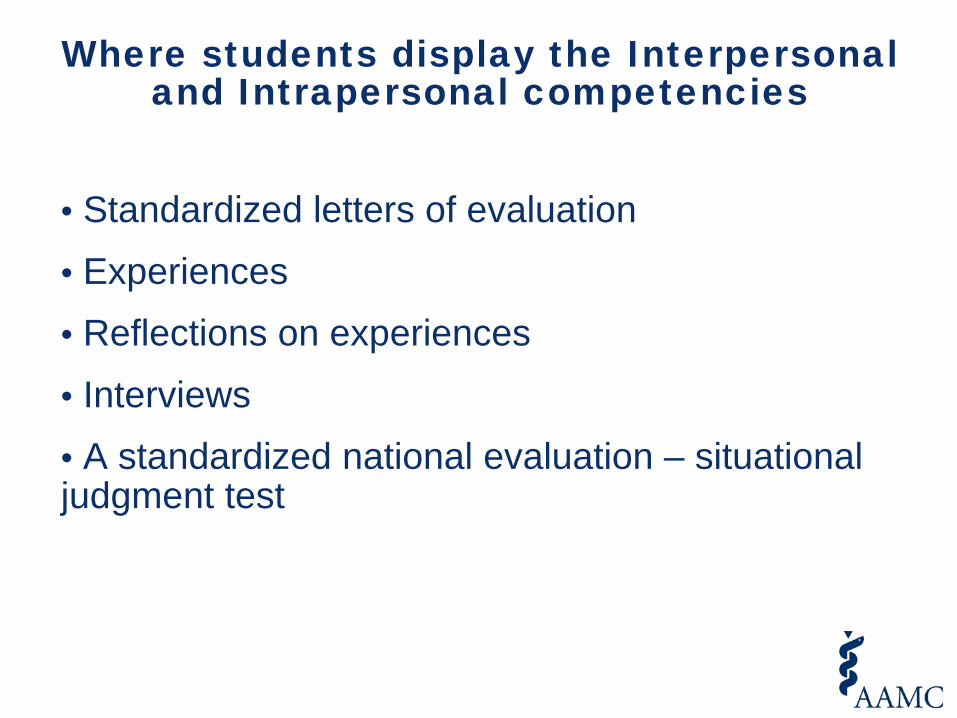
Where students display the Interpersonal and Intrapersonal competencies
• Standardized letters of evaluation • Experiences • Reflections on experiences • Interviews • A standardized national evaluation – situational judgment test

Are All Competencies Equal?
• Chesapeake LAN January 2013: • Howard • University of Maryland • Johns Hopkins • Uniformed Services University

Admissions Initiative Status – February 2013
• National COA has approved IP/IP competencies and the Thinking and Reasoning Skills/Science competencies at this time • Working with the medical schools to update their pre-requisites, especially chemistry track to biochemistry • Establishing new guidelines for letters of evaluation coordinated with the NAAHP letters committee • Researching situational judgment test options
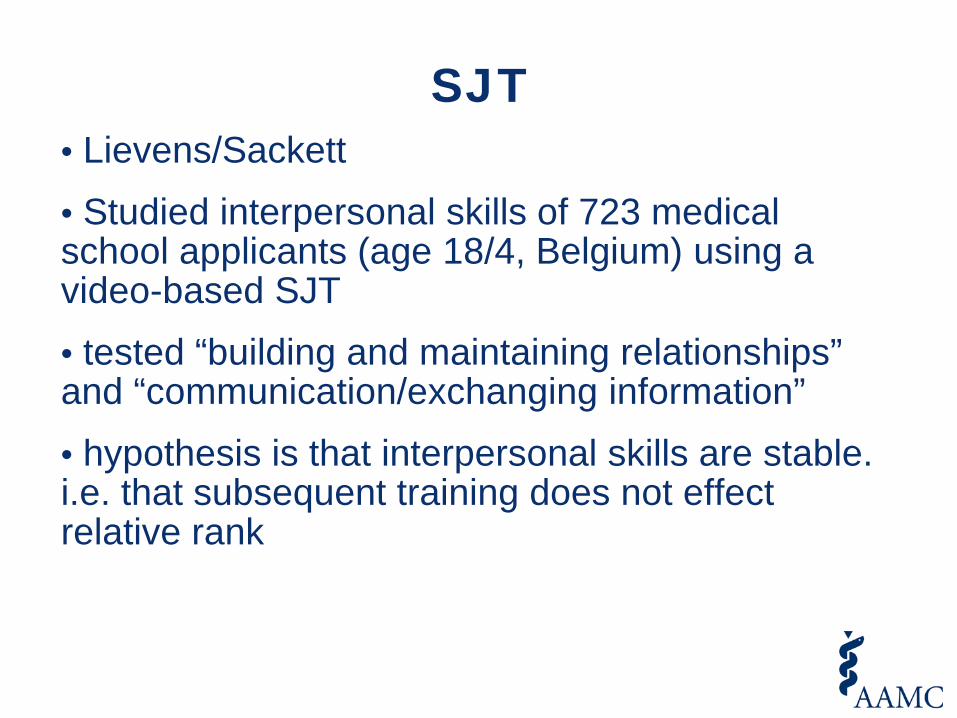
SJT • Lievens/Sackett • Studied interpersonal skills of 723 medical school applicants (age 18/4, Belgium) using a video-based SJT • tested “building and maintaining relationships” and “communication/exchanging information” • hypothesis is that interpersonal skills are stable. i.e. that subsequent training does not effect relative rank

SJT (2) • no medical knowledge required but vignettes were based on medical scenarios • 30 questions, tape stopped, 25 seconds to choose ¼ responses • SJT scores compared with internship or post-internship job performance ratings of same students/physicians • SJT had higher correlation with performance than the national cognitive or written test • Journal of Applied Psychology, February 2012
MCAT2015
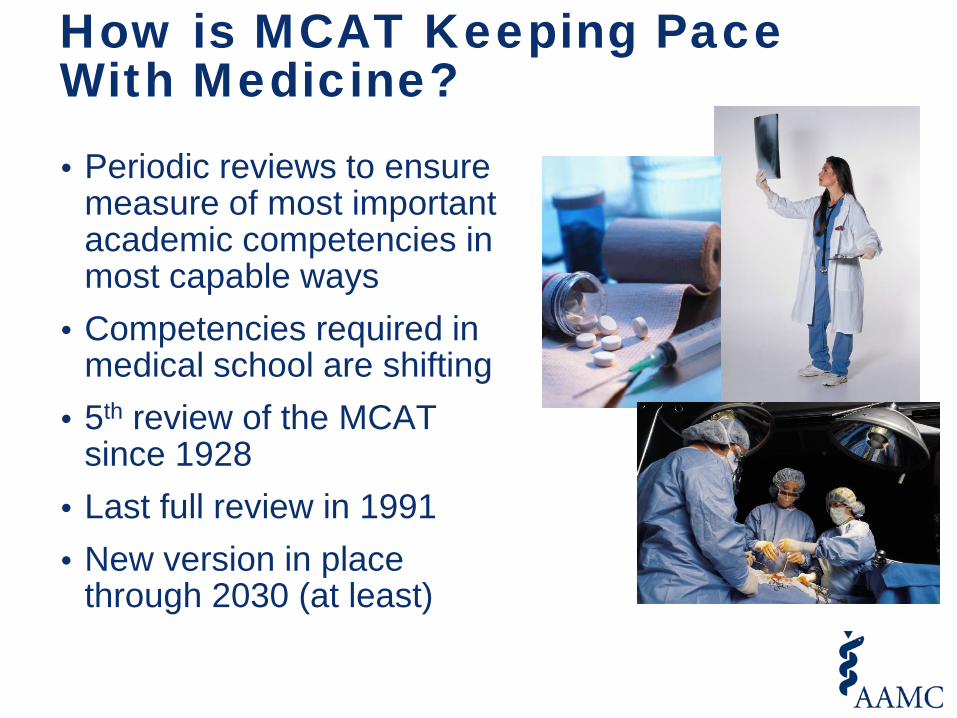
How is MCAT Keeping Pace With Medicine? • Periodic reviews to ensure
measure of most important academic competencies in most capable ways
• Competencies required in medical school are shifting
• 5th review of the MCAT since 1928
• Last full review in 1991 • New version in place
through 2030 (at least)
MCAT2015 Final recommendations:
Approved by AAMC Board of Directors February 2012
Administer new exam: Spring 2015
www.aamc.org/mcat2015
MCAT2015
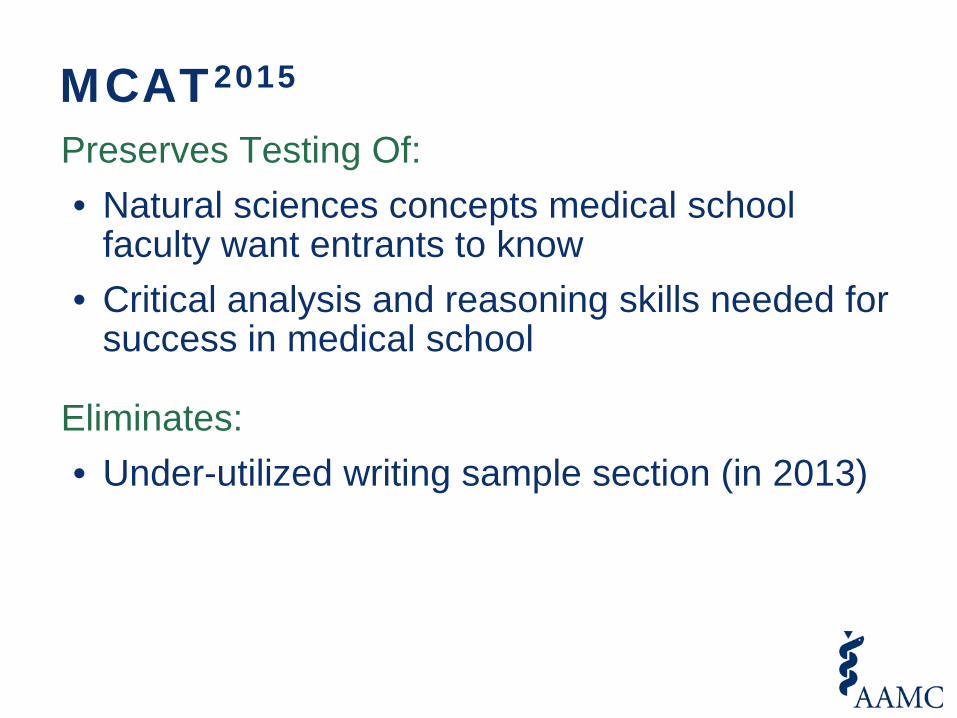
Preserves Testing Of: • Natural sciences concepts medical school
faculty want entrants to know • Critical analysis and reasoning skills needed for
success in medical school
Eliminates: • Under-utilized writing sample section (in 2013)

MCAT2015 – 4 Sections, 4 Scores Biological & Biochemical
Foundations of Living Systems
Chemical & Physical Foundations of
Biological Systems
Psychological, Social, & Biological
Foundations of Behavior
Critical Analysis & Reasoning Skills

current MCAT
# of Test Items
Testing Time
(minutes) MCAT2015 # of Test
Items Testing
Time (minutes)
Biological Sciences 52 70
Biological & Biochemical Foundations of Living Systems
65 95
Physical Sciences
52 70
Chemical & Physical Foundations of Biological Systems
65 95
Lunch Break
Verbal Reasoning 40 60 Critical Analysis &
Reasoning Skills 60 90
Writing Sample 2 Essays 60
Psychological, Social, & Biological Foundations of Behavior
65 95
Total Content Time
4 hours, 20 min
Total Content Time
6 hours, 15 min

Scientific Inquiry & Reasoning Skills (SIRS)
Knowledge of Scientific Concepts & Principles
Scientific Reasoning Problem Solving
Reasoning About the Design and Execution of Research
Data-based and Statistical Reasoning

Biological & Biochemical
Foundations of Living Systems
What it tests? Combine knowledge of foundational concepts in the biological and biochemical sciences with your scientific inquiry, reasoning, and research and statistics skills to solve problems that demonstrate readiness for medical school.

Biological & Biochemical
Foundations of Living Systems
Exam content in this section typically taught in: • Introductory biology • Introductory general chemistry • Introductory organic chemistry • First semester biochemistry
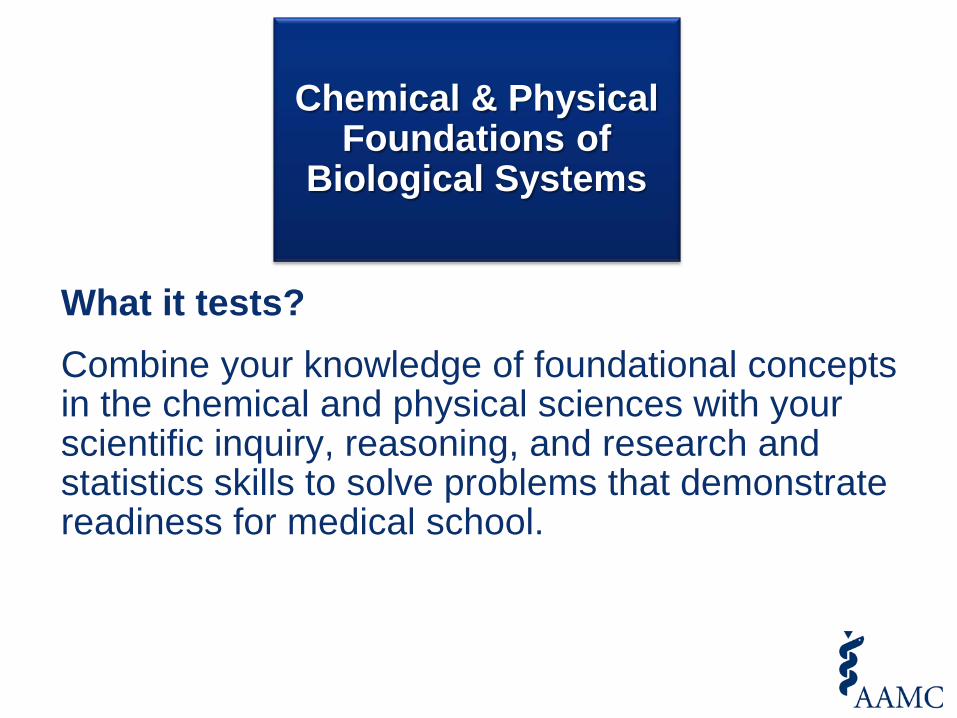
Chemical & Physical Foundations of
Biological Systems
What it tests? Combine your knowledge of foundational concepts in the chemical and physical sciences with your scientific inquiry, reasoning, and research and statistics skills to solve problems that demonstrate readiness for medical school.
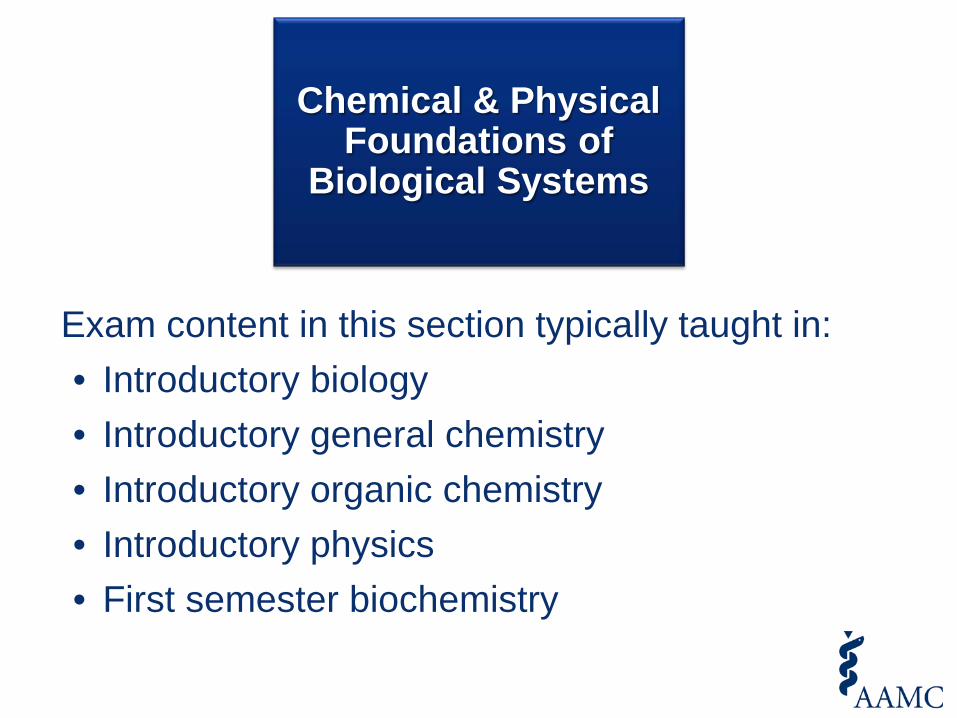
Chemical & Physical Foundations of
Biological Systems
Exam content in this section typically taught in: • Introductory biology • Introductory general chemistry • Introductory organic chemistry • Introductory physics • First semester biochemistry
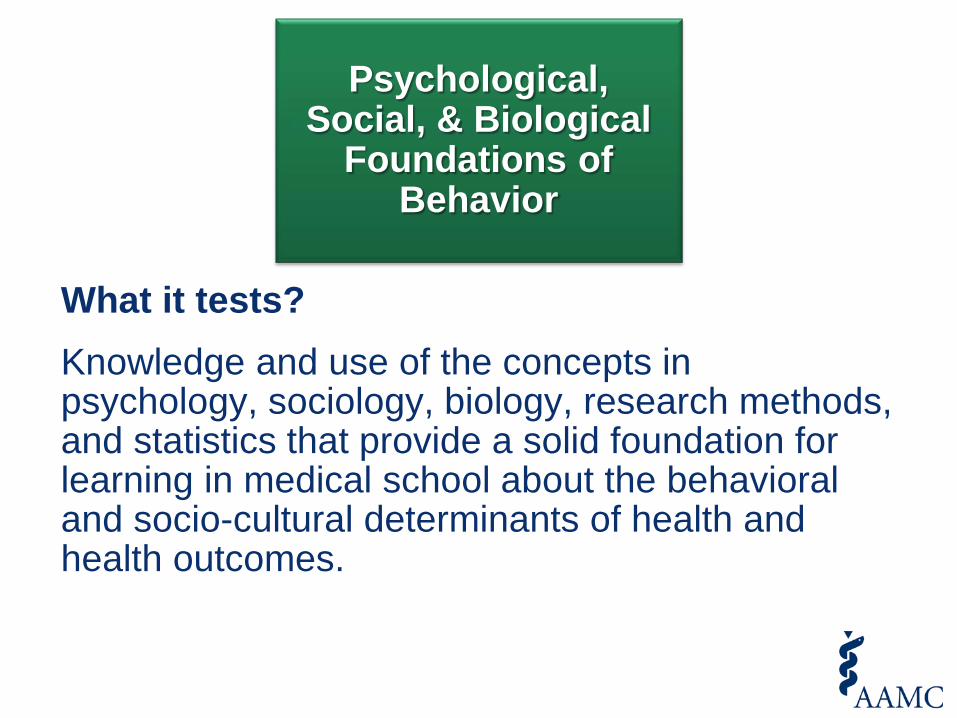
Psychological, Social, & Biological
Foundations of Behavior
What it tests? Knowledge and use of the concepts in psychology, sociology, biology, research methods, and statistics that provide a solid foundation for learning in medical school about the behavioral and socio-cultural determinants of health and health outcomes.

Psychological, Social, & Biological
Foundations of Behavior
Exam content in this section typically taught in: • Introductory psychology • Introductory sociology • Introductory biology

Critical Analysis & Reasoning Skills
What it tests? This section asks you to critically analyze, evaluate, and apply information presented in a passage. No specific course content material

Critical Analysis & Reasoning Skills
Reasoning Within the Text
Foundations of Comprehension
Skills tested:
Reasoning Beyond the Text
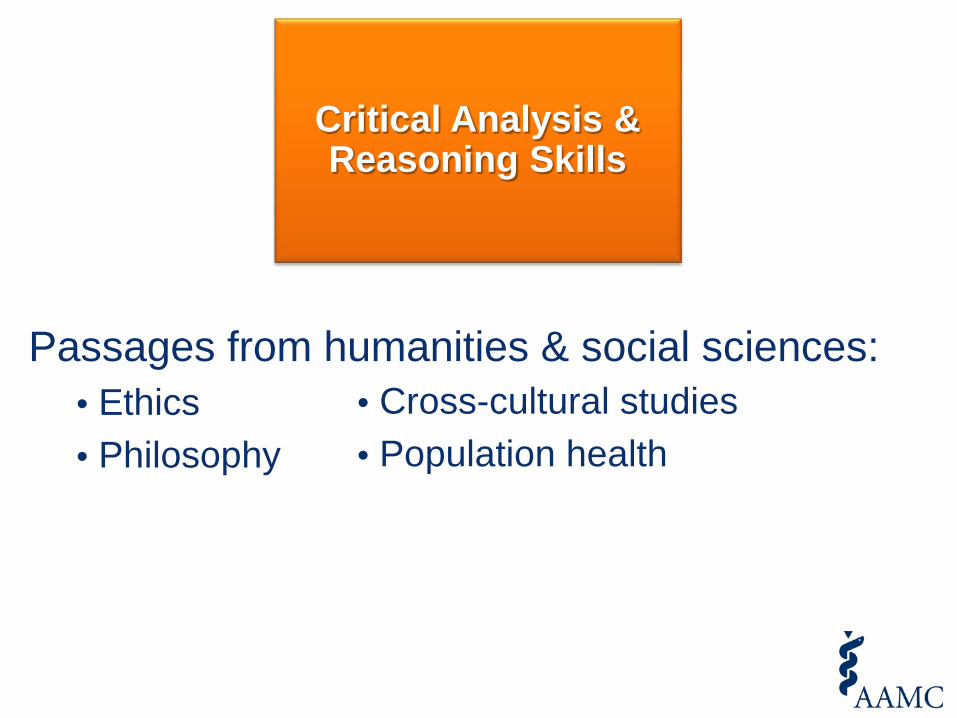
Critical Analysis & Reasoning Skills
Passages from humanities & social sciences: • Ethics • Philosophy
• Cross-cultural studies • Population health

Table 2. Percentage of 2009-2011 Applicants Accepted into at Least One Medical School, by MCAT Total Score and Undergraduate GPA Range
MCAT Total
GPA Total 5-14 15-17 18-20 21-23 24-26 27-29 30-32 33-35 36-38 39-45 All 3.80-4.00 1% 4% 17% 26% 42% 67% 82% 86% 90% 91% 72% 1/70 8/180 80/480 355/1,368 1,373/3,290 4,028/6,048 6,197/7,550 5,159/5,986 2,956/3,290 1,171/1,280 21,328/29,542 3.60-3.79 1% 3% 10% 18% 28% 51% 72% 80% 85% 85% 55% 1/174 13/380 105/1,001 414/2,245 1,284/4,588 3,777/7,458 5,654/7,889 3,878/4,853 1,602/1,895 363/429 17,091/30,912 3.40-3.59 1% 3% 10% 17% 23% 36% 54% 67% 73% 78% 40% 4/296 15/508 114/1,186 428/2,559 1,053/4,584 2,456/6,734 3,523/6,558 2,225/3,329 832/1,139 161/206 10,811/27,099 3.20-3.39 1% 1% 8% 13% 18% 26% 39% 52% 62% 63% 27% 2/360 5/518 88/1,130 267/2,102 596/3,327 1,099/4,238 1,496/3,843 917/1,767 302/490 60/96 4,832/17,871 3.00-3.19 0% 3% 6% 11% 16% 24% 30% 42% 44% 50% 20% 2/441 15/516 59/950 168/1,481 328/2,013 554/2,281 517/1,725 331/784 100/225 16/32 2,090/10,448 2.80-2.99 0% 1% 4% 11% 16% 16% 25% 32% 33% 50% 14% 0/364 4/393 27/645 89/831 156/989 152/976 184/741 86/265 30/90 10/20 738/5,314 2.60-2.79 0% 2% 4% 7% 11% 15% 22% 25% 21% 23% 10% 0/299 4/239 16/375 32/461 56/522 64/436 64/290 33/132 8/38 3/13 280/2,805 2.40-2.59 0% 0% 2% 4% 6% 10% 19% 23% 13% -- 6% 0/197 0/145 4/184 8/211 13/214 17/168 19/100 13/57 2/15 76/1,292 2.20-2.39 0% 0% 2% 4% 11% 11% 3% 16% -- -- 4% 0/142 0/71 2/88 3/74 9/79 6/56 1/30 3/19 25/564 2.00-2.19 0% 2% 0% 4% 5% 0% 8% -- -- 2% 0/70 1/43 0/32 1/26 1/19 0/19 1/13 5/225 1.47-1.99 0% 0% -- -- -- -- -- -- 1% 0/36 0/12 1/88 All 0% 2% 8% 16% 25% 43% 61% 74% 81% 86% 45% 10/2,449 65/3,005 495/6,078 1,765/11,367 4,870/19,633 12,153/28,423 17,656/28,745 12,646/17,195 5,833/7,186 1,784/2,079 57,277/126,160 Notes: 1. Dark Green shading = acceptance rates ≥ 75%; Light Green shading = acceptance rates of 50-74%; Grey shading = acceptance rates of 25-49%. 2. Dashes = cells with fewer than ten observations; blank cells = cells with zero observations. 3. For students who took the MCAT exam multiple times, the most recent MCAT total score in each application year was used in this analysis.
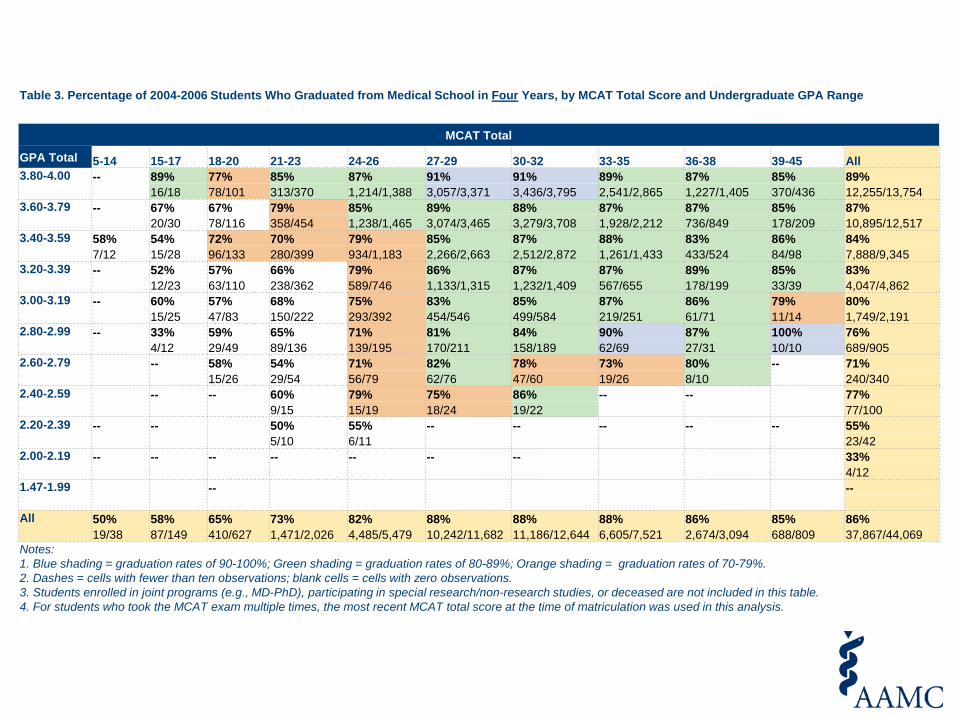
Table 3. Percentage of 2004-2006 Students Who Graduated from Medical School in Four Years, by MCAT Total Score and Undergraduate GPA Range
MCAT Total
GPA Total 5-14 15-17 18-20 21-23 24-26 27-29 30-32 33-35 36-38 39-45 All 3.80-4.00 -- 89% 77% 85% 87% 91% 91% 89% 87% 85% 89% 16/18 78/101 313/370 1,214/1,388 3,057/3,371 3,436/3,795 2,541/2,865 1,227/1,405 370/436 12,255/13,754 3.60-3.79 -- 67% 67% 79% 85% 89% 88% 87% 87% 85% 87% 20/30 78/116 358/454 1,238/1,465 3,074/3,465 3,279/3,708 1,928/2,212 736/849 178/209 10,895/12,517 3.40-3.59 58% 54% 72% 70% 79% 85% 87% 88% 83% 86% 84% 7/12 15/28 96/133 280/399 934/1,183 2,266/2,663 2,512/2,872 1,261/1,433 433/524 84/98 7,888/9,345 3.20-3.39 -- 52% 57% 66% 79% 86% 87% 87% 89% 85% 83% 12/23 63/110 238/362 589/746 1,133/1,315 1,232/1,409 567/655 178/199 33/39 4,047/4,862 3.00-3.19 -- 60% 57% 68% 75% 83% 85% 87% 86% 79% 80% 15/25 47/83 150/222 293/392 454/546 499/584 219/251 61/71 11/14 1,749/2,191 2.80-2.99 -- 33% 59% 65% 71% 81% 84% 90% 87% 100% 76% 4/12 29/49 89/136 139/195 170/211 158/189 62/69 27/31 10/10 689/905 2.60-2.79 -- 58% 54% 71% 82% 78% 73% 80% -- 71% 15/26 29/54 56/79 62/76 47/60 19/26 8/10 240/340 2.40-2.59 -- -- 60% 79% 75% 86% -- -- 77% 9/15 15/19 18/24 19/22 77/100 2.20-2.39 -- -- 50% 55% -- -- -- -- -- 55% 5/10 6/11 23/42 2.00-2.19 -- -- -- -- -- -- -- 33% 4/12 1.47-1.99 -- -- All 50% 58% 65% 73% 82% 88% 88% 88% 86% 85% 86% 19/38 87/149 410/627 1,471/2,026 4,485/5,479 10,242/11,682 11,186/12,644 6,605/7,521 2,674/3,094 688/809 37,867/44,069 Notes: 1. Blue shading = graduation rates of 90-100%; Green shading = graduation rates of 80-89%; Orange shading = graduation rates of 70-79%. 2. Dashes = cells with fewer than ten observations; blank cells = cells with zero observations. 3. Students enrolled in joint programs (e.g., MD-PhD), participating in special research/non-research studies, or deceased are not included in this table. 4. For students who took the MCAT exam multiple times, the most recent MCAT total score at the time of matriculation was used in this analysis.

Table 4. Percentage of 2004-2006 Students Who Graduated from Medical School in Five Years, by MCAT Total Score and Undergraduate GPA Range
MCAT Total
GPA Total 5-14 15-17 18-20 21-23 24-26 27-29 30-32 33-35 36-38 39-45 All 3.80-4.00 -- 94% 85% 92% 94% 96% 97% 97% 96% 94% 96% 17/18 86/101 340/370 1,308/1,388 3,228/3,371 3,677/3,795 2,770/2,865 1,348/1,405 412/436 13,190/13,754 3.60-3.79 -- 83% 82% 90% 93% 96% 96% 96% 95% 94% 95% 25/30 95/116 408/454 1,358/1,465 3,311/3,465 3,569/3,708 2,119/2,212 810/849 196/209 11,897/12,517 3.40-3.59 75% 71% 85% 83% 91% 94% 96% 96% 94% 91% 94% 9/12 20/28 113/133 331/399 1,074/1,183 2,500/2,663 2,751/2,872 1,373/1,433 493/524 89/98 8,753/9,345 3.20-3.39 -- 65% 83% 80% 91% 95% 94% 96% 94% 90% 93% 15/23 91/110 291/362 676/746 1,244/1,315 1,331/1,409 626/655 188/199 35/39 4,500/4,862 3.00-3.19 -- 80% 72% 84% 88% 93% 94% 96% 97% 86% 91% 20/25 60/83 187/222 346/392 506/546 548/584 241/251 69/71 12/14 1,989/2,191 2.80-2.99 -- 75% 78% 81% 86% 89% 90% 93% 94% 100% 87% 9/12 38/49 110/136 168/195 187/211 170/189 64/69 29/31 10/10 787/905 2.60-2.79 -- 73% 80% 85% 91% 90% 92% 80% -- 85% 19/26 43/54 67/79 69/76 54/60 24/26 8/10 289/340 2.40-2.59 -- -- 80% 84% 83% 95% -- -- 86% 12/15 16/19 20/24 21/22 86/100 2.20-2.39 -- -- 50% 82% -- -- -- -- -- 67% 5/10 9/11 28/42 2.00-2.19 -- -- -- -- -- -- -- 58% 7/12 1.47-1.99 -- -- All 63% 76% 81% 85% 92% 95% 96% 96% 95% 93% 94% 24/38 113/149 507/627 1,729/2,026 5,023/5,479 11,074/11,682 12,125/12,644 7,226/7,521 2,949/3,094 756/809 41,526/44,069 Notes: 1. Blue shading = graduation rates of 90-100%; Green shading = graduation rates of 80-89%; Orange shading = graduation rates of 70-79%. 2. Dashes = cells with fewer than ten observations; blank cells = cells with zero observations. 3. Students enrolled in joint programs (e.g., MD-PhD), participating in special research/non-research studies, or deceased are not included in this table. 4. For students who took the MCAT exam multiple times, the most recent MCAT total score at the time of matriculation was used in this analysis.
AAMC Mission
The AAMC serves and leads the academic medicine community to improve the health of all.
Our Goal
We are not selecting medical students, but rather the future physicians who will lead the country in an rapidly evolving 21st Century healthcare system.

Q & A
©

Table 5. Percentage of 2004-2006 Students Who Withdrew or Were Dismissed from Medical School for Academic Reasons, by MCAT Total Score and Undergraduate GPA Range
MCAT Total
GPA Total 5-14 15-17 18-20 21-23 24-26 27-29 30-32 33-35 36-38 39-45 All 3.80-4.00 -- 0% 2.9% 2.1% 1.3% 0.8% 0.4% 0.4% 0.3% 0% 0.6% 0/18 3/105 8/382 19/1,433 29/3,534 16/4,209 13/3,381 5/1,789 0/604 94/15,460 3.60-3.79 -- 3.2% 1.7% 3.4% 2.3% 1.2% 0.9% 0.5% 0.2% 0% 1.1% 1/31 2/118 16/472 35/1,517 45/3,611 35/4,047 12/2,550 2/1,057 0/286 149/13,698 3.40-3.59 0% 10.7% 3.7% 5.8% 3.4% 1.6% 0.9% 0.8% 1.5% 1.7% 1.7% 0/13 3/28 5/136 24/414 42/1,230 46/2,824 28/3,109 13/1,647 9/616 2/120 172/10,137 3.20-3.39 -- 13.0% 6.1% 8.8% 3.0% 1.8% 1.3% 1.1% 0.4% 0% 2.3% 3/23 7/114 34/385 23/774 25/1,373 20/1,512 8/741 1/223 0/46 121/5,195 3.00-3.19 -- 4.0% 12.0% 5.7% 4.6% 2.2% 1.8% 0.4% 0% 0% 3.0% 1/25 10/83 13/228 19/411 13/580 11/623 1/279 0/84 0/17 69/2,333 2.80-2.99 -- 25.0% 7.8% 7.9% 8.5% 3.2% 2.0% 1.3% 0% 0% 4.9% 3/12 4/51 11/140 17/201 7/220 4/205 1/79 0/32 0/10 47/953 2.60-2.79 -- 7.1% 12.3% 6.1% 2.5% 1.5% 3.6% 9.1% -- 5.8% 2/28 7/57 5/82 2/79 1/66 1/28 1/11 21/360 2.40-2.59 -- -- 13.3% 10.0% 12.0% 0.0% -- -- 8.7% 2/15 2/20 3/25 0/23 9/104 2.20-2.39 -- -- 30.0% 9.1% -- -- -- -- -- 16.3% 3/10 1/11 7/43 2.00-2.19 -- -- -- -- -- -- -- -- 23.1% 3/13 1.47-1.99 -- -- All 7.7% 9.3% 5.7% 5.6% 2.9% 1.4% 0.8% 0.6% 0.5% 0.3% 1.4% 3/39 14/150 37/644 119/2,107 163/5,680 172/12,257 115/13,799 49/8,717 18/3,818 3/1,086 693/48,297 Notes: 1. Blue shading = graduation rates of 0-10%; Green shading = graduation rates of 10.1-20%; Orange shading = graduation rates of 20.1-30%. 2. Dashes = cells with fewer than ten observations; blank cells = cells with zero observations. 3. For students who took the MCAT exam multiple times, the most recent MCAT total score at the time of matriculation was used in this analysis.

A balance of experiences, attributes, and academic metrics (EAM) is • used to assess applicants with the
intent of creating a richly diverse interview and selection pool, and student body;
• applied equitably across the entire candidate pool; and
• grounded in data that provide evidence supporting the use of selection criteria beyond grades and test scores.
2
Core principles of a holistic review process In a holistic admission process, selection criteria are broad-based, clearly linked to school mission and goals, and promote diversity as an essential element to achieving institutional excellence
1 Admission staff and committee members give individualized consideration to how each applicant may contribute to the medical school learning environment and practice of medicine, weighing and balancing the range of criteria needed in a class to achieve the outcomes desired by the school.
3
Race and ethnicity may be considered as factors when making admission-related decisions only when aligned with mission-related educational interests and goals associated with student diversity; and when considered as part of a broader mix of factors, which may include personal attributes, experiential factors, demographics, or other considerations.*
* Under federal law (and where permitted by state law)
4
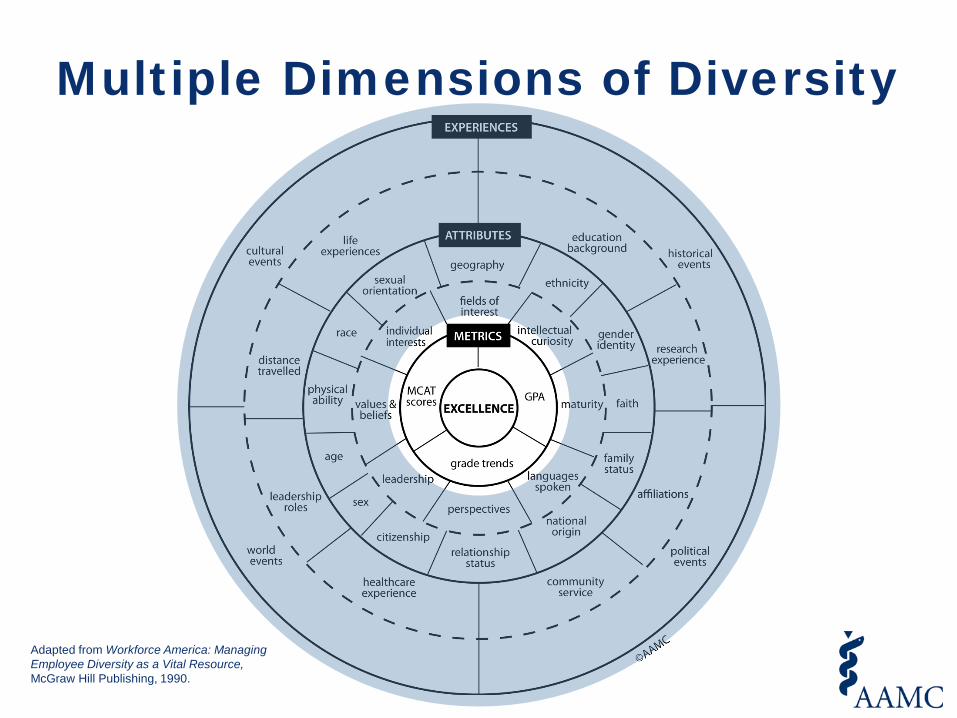
Multiple Dimensions of Diversity
Adapted from Workforce America: Managing Employee Diversity as a Vital Resource, McGraw Hill Publishing, 1990.

Multiple Dimensions of Diversity
Adapted from Workforce America: Managing Employee Diversity as a Vital Resource, McGraw Hill Publishing, 1990.

Multiple Dimensions of Diversity
Adapted from Workforce America: Managing Employee Diversity as a Vital Resource, McGraw Hill Publishing, 1990.
Top Related