


Languages
Pages
Legal

Deficient Low-Contrast Visual Sensitivity Occurs in Patients with Multiple Sclerosis: May Degrade Gait Performance, Possible Modification Utilizing High Contrast Visual Aids.
Rachel TripoliKelly SchwirianDr. C.G. Maitland

Background & Hypothesis
Balcer in 2000 (Balcer et al 2000) observed deficient low-contrast sensitivity in M.S. patients with and without optic neuropathy.
The impact of deficient low contrast sensitivity has not yet been explained in patients with M.S. to any degree.– Since optic neuropathy is found in over 80% of patients
with M.S., it seems prudent to investigate any mechanism that might improve the function of affected individuals.
The application of high-contrast, blue-blocking yellow lenses was investigated in hopes of improving vision in low-contrast environments, and thus possibly allowing for better obstacle discrimination.

Methodology Four parameters were used to stage
the degree of pathology of patients with multiple sclerosis and age matched controls
– Estimated Disability Severity Scale Ten-point scoring system that evaluates
visual, motor, brainstem, sensory, and cognitive dimensions of patients with M.S.
– Low Contrast Sloan Letter Chart– Optical Coherence Tomography– Gait Pad Measurement

Methodology
Patients tested with both eyes first, then right and left eye individually first at 100% efficiency, then at 2.5%, and then at 1.25% efficiency.
The Snellen visual acuity equivalent will be determined by the lowest line read on the 100% chart.
Low Contrast Sloan Chart
Methodology
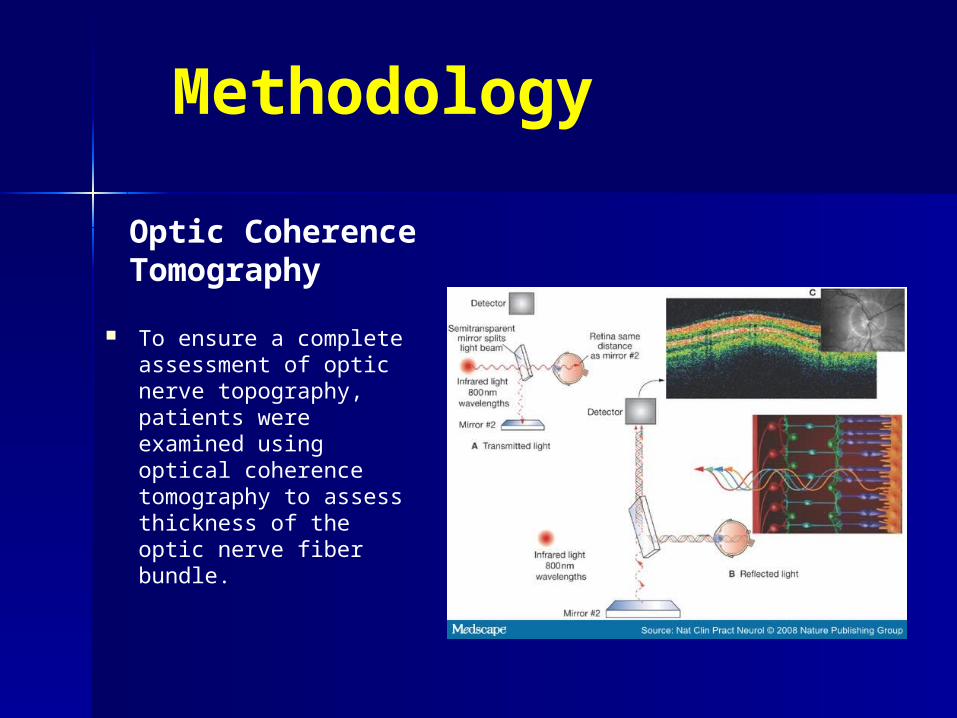
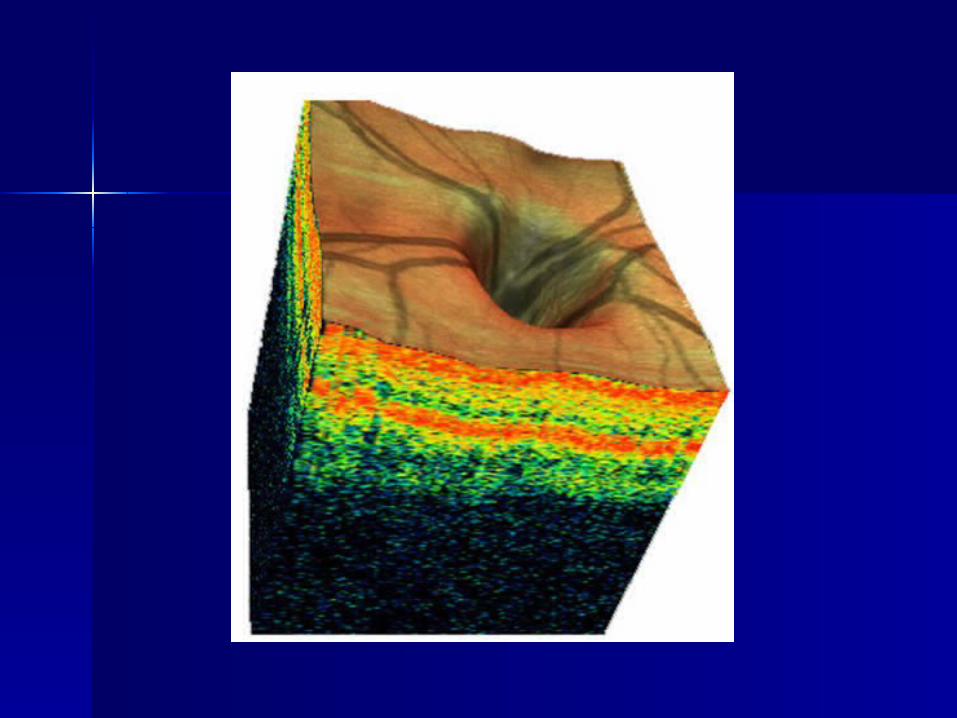
To ensure a complete assessment of optic nerve topography, patients were examined using optical coherence tomography to assess thickness of the optic nerve fiber bundle.
Optic Coherence Tomography
Methodology
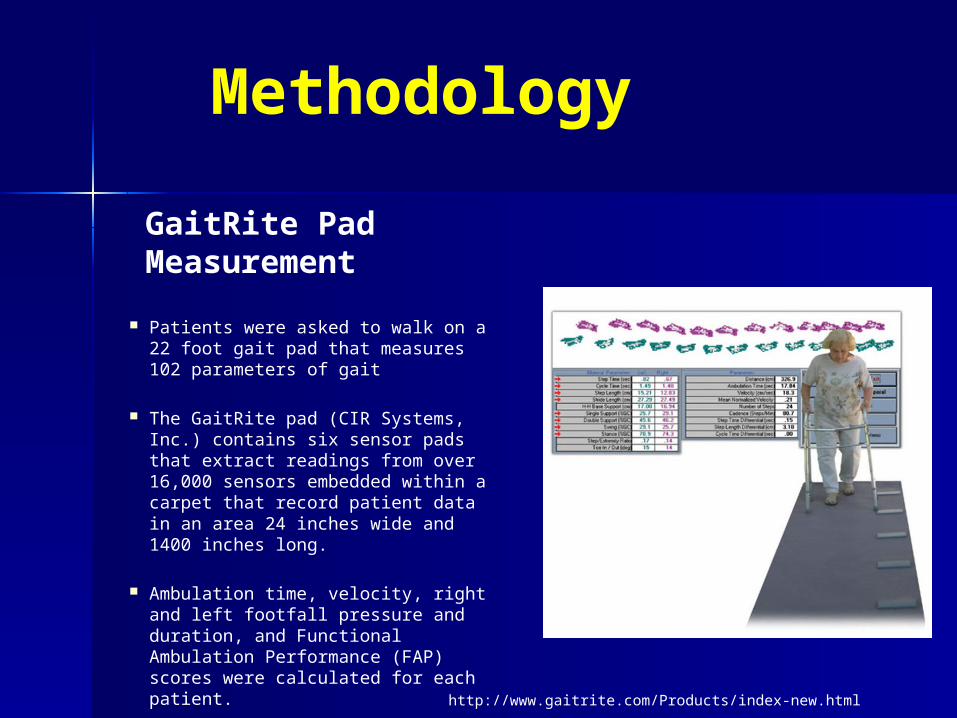
Patients were asked to walk on a 22 foot gait pad that measures 102 parameters of gait
The GaitRite pad (CIR Systems, Inc.) contains six sensor pads that extract readings from over 16,000 sensors embedded within a carpet that record patient data in an area 24 inches wide and 1400 inches long.
Ambulation time, velocity, right and left footfall pressure and duration, and Functional Ambulation Performance (FAP) scores were calculated for each patient.
GaitRite Pad Measurement
http://www.gaitrite.com/Products/index-new.html
Methodology
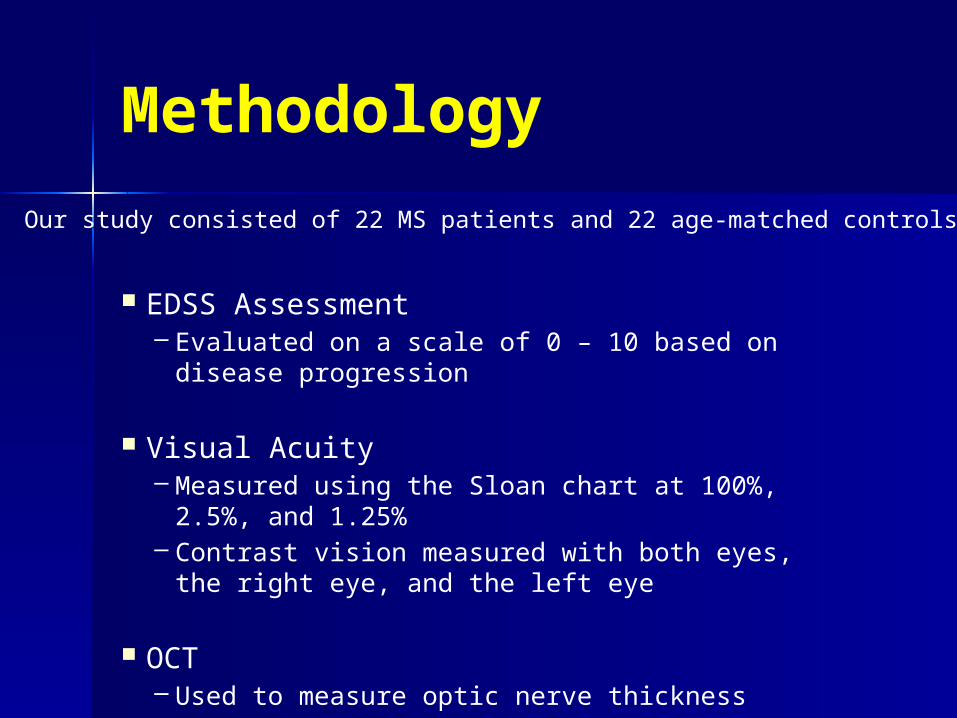
EDSS Assessment– Evaluated on a scale of 0 – 10 based on
disease progression
Visual Acuity– Measured using the Sloan chart at 100%,
2.5%, and 1.25%– Contrast vision measured with both eyes, the
right eye, and the left eye
OCT– Used to measure optic nerve thickness
Our study consisted of 22 MS patients and 22 age-matched controls

Methodology GaitRite Pad 8 randomized walking trials per patient
– 4 in high illumination (> 80 candela) 2 with obstacles
– 1 with lenses and 1 without 2 without obstacles
– 1 with lenses and 1 without
– 4 in dim illumination (< 4 candela) 2 with obstacles
– 1 with lenses and 1 without 2 without obstacles
– 1 with lenses and 1 without
– MEASUREMENTS Functional ambulation profile (FAP) Step number, normalized velocity, step length, step
length differential, stride length, and cadence

Significant Findings
*Evaluated using paired T-testing
Poorer contrast visual acuity in MS patients– Measured using the Sloan chart– Significant difference at 100%, 2.5%, and 1.25%
MS patients had thinner optic nerves– Measured using OCT
Thinner optic nerves correlated negatively with visual acuity– Patients with thinner optic nerves (measured using OCT)
had poorer performance on the Sloan chart

Significant Findings
Visual deficiency significantly degraded motor performance in dim illumination– Especially seen with complicated walking (obstacles)– Significant differences seen in FAP, velocity, normalized velocity,
cadence, step length, and stride length– No deficiency seen in high illumination
Negative correlation between FAP and EDSS scores– MS patients with an EDSS score of 4 or less had significantly worse
FAP scores than those with a score of 4 or greater
Yellow lenses improved FAP scores of MS patients in dim illumination – Especially significant with complicated walking (obstacles)– No significant differences seen between MS patients and controls in
dim illumination with lenses
Conclusion
Contrast sensitivity deficits degrade motor performance in MS patients in dim illumination– These deficits are presumably the result of
optic neuropathy– MS patients have decreased FAP scores
Low FAP scores correlate highly with increased fall risk
High-contrast yellow lenses improve low-contrast vision in MS patients– These lenses increase obstacle discrimination,
and could potentially result in a reduction in risk of injury from falls

References Balcer LJ , Baier ML , Pelak VS , et al. (2000). New low-
contrast vision charts (reliability and test characteristics in patients with multiple sclerosis). Mult Scler. 6,163–171
Frohman, E. M., Fujimoto, J. G., Frohman, T. C., Calabresi, P. A., Cutter, G., & Balcer, L. J. (2008). Optical coherence tomography: a window into the mechanisms of multiple sclerosis. [10.1038/ncpneuro0950]. Nat Clin Pract Neuro, 4(12), 664-675.
FUNDING FOR THIS RESEARCH PROVIDED BY: FSU College of Medicine TMH Foundation
Contrast sensitivity
Definition: Spacial contrast.
A physical dimension referring to the light dark transition at a border or an edge of an image that delineates the existence of a pattern or object.
Spacial Contrast
Contrast is expressed as a percentage from 0 to 100%. When contrast is 0% there is no edge between the two adjacent areas ie no pattern is physically present.

Spacial Contrast
For any value greater than 0%, an edge exists even though it may or may not be visible, depending on the image processing capabilities of the detector.
Contrast Sensitivity The amount of contrast a person
needs to see a target is called contrast threshold . In clinical research, it is expressed as contrast senstivity which is simply the reciprocal of threshold.

Visual Testing by SLOAN charts
Measure of visual acuity through standardized charts descending in contrast sensitivity – Begins with 100%
contrast to measure directive visual acuity
– 2.5% and 1.25% contrast used as a measure of low contrast sensitivity


Why Bother ?
CS may uncover a hidden dysfunction not apparent by other visual evaluations.
Optic neuritis Cerebral lesions Age related cataract

Why Bother?
Provides another visual parameter to monitor the impact of treatment
interventions. MS platform and novel therapies. Rasagaline

Why Bother?
Provides insights into the extent of functional performance problems.
Difficulties: mobility driving reading using tools
Parkinson’s and contrast sensitivity
What are the clinical implications of deficit in contrast sensitivity visual acuity in Parkinson’s disease?
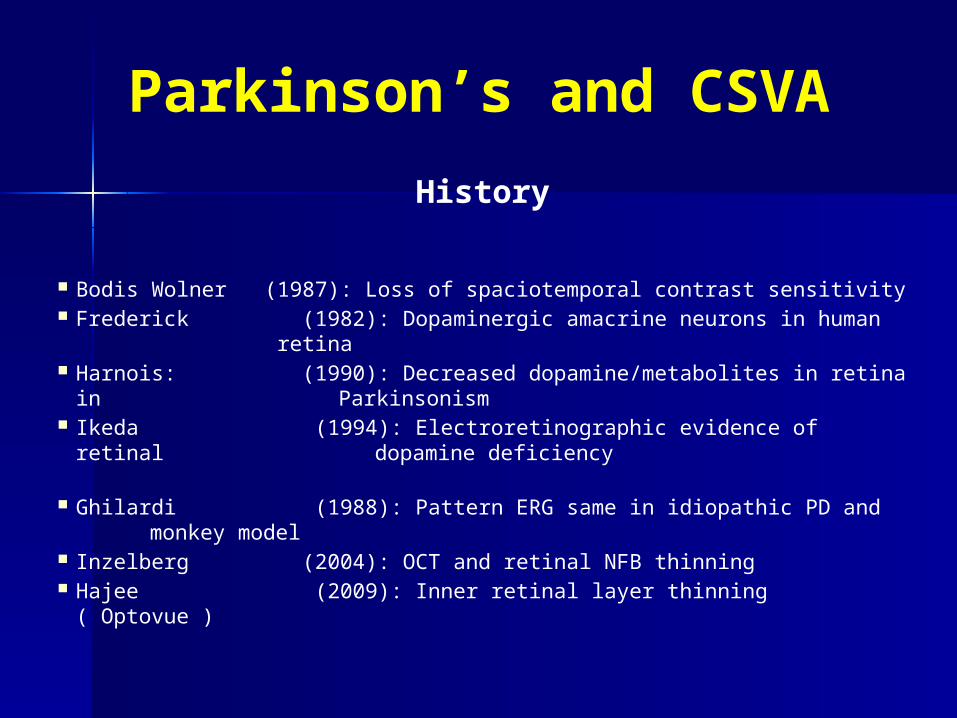
Parkinson’s and CSVA
History
Bodis Wolner (1987): Loss of spaciotemporal contrast sensitivity Frederick (1982): Dopaminergic amacrine neurons in human
retina Harnois: (1990): Decreased dopamine/metabolites in retina
in Parkinsonism Ikeda (1994): Electroretinographic evidence of retinal
dopamine deficiency Ghilardi (1988): Pattern ERG same in idiopathic PD and
monkey model Inzelberg (2004): OCT and retinal NFB thinning Hajee (2009): Inner retinal layer thinning ( Optovue )

History of PD Contrast Sensitivity
Contrast sensitivity is deficient in Parkinson’s Can be identified with CS wall charts
(Sheriff et al –NANOS 2009) Limited functional studies of effects on motor
performance:– Rizzo (2009):Driving under low-contrast
visibility conditions – Owsley (1987):The perception of “real world”
targets– Moes (2009):Contrast sensitivity, gait and
reading speed

Hypotheses
1. Compared with controls, patients will exhibit a deficiency in contrast sensitivity as measured with simple wall charts (SLOAN)
2. Patients walking performance will degrade significantly in low contrast conditions compared to controls
3. There will be a correlation between poorer performance on the SLOAN and walking performance in dim illumination.
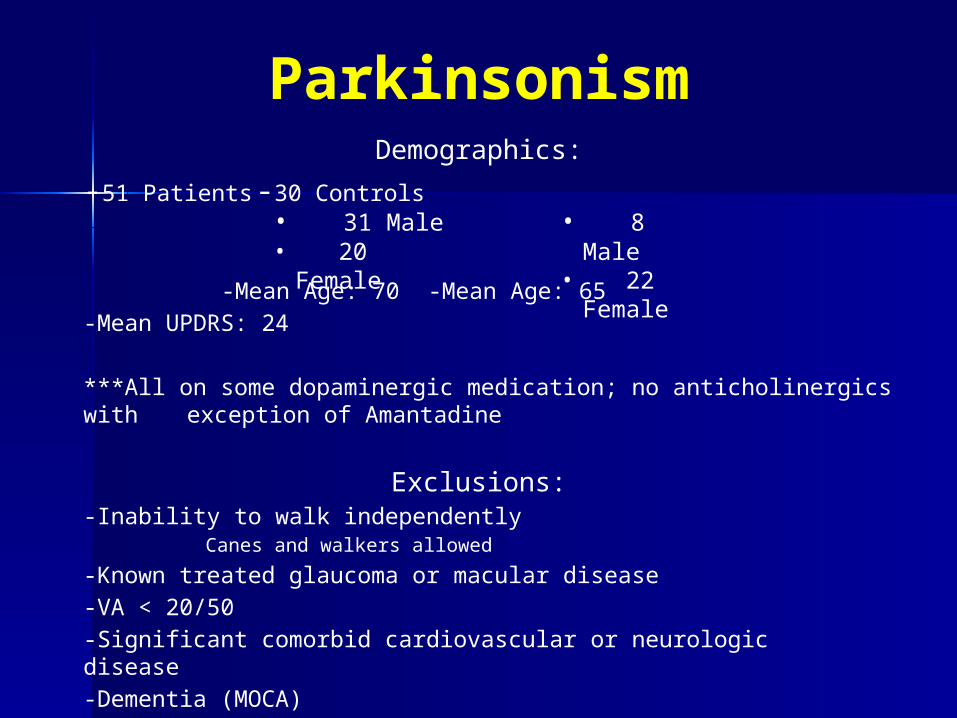
ParkinsonismDemographics:
-51 Patients -30 Controls
-Mean Age: 70 -Mean Age: 65-Mean UPDRS: 24
***All on some dopaminergic medication; no anticholinergics with exception of Amantadine
Exclusions:-Inability to walk independently
Canes and walkers allowed
-Known treated glaucoma or macular disease-VA < 20/50-Significant comorbid cardiovascular or neurologic
disease-Dementia (MOCA)
• 8 Male• 22 Female
• 31 Male• 20 Female

Methodology
A general neurologic examination including standardized scoring for Parkinson’s severity (UPDRS)
Directive and contrast visual acuity tests utilizing SLOAN wall charts at 80 candela at 100%, 2.5%, 1.25% efficiency
Participants walked 18 feet on a gait pad measuring 102 parameters of gait (GAITRite) in randomized conditions of high and dim illumination.
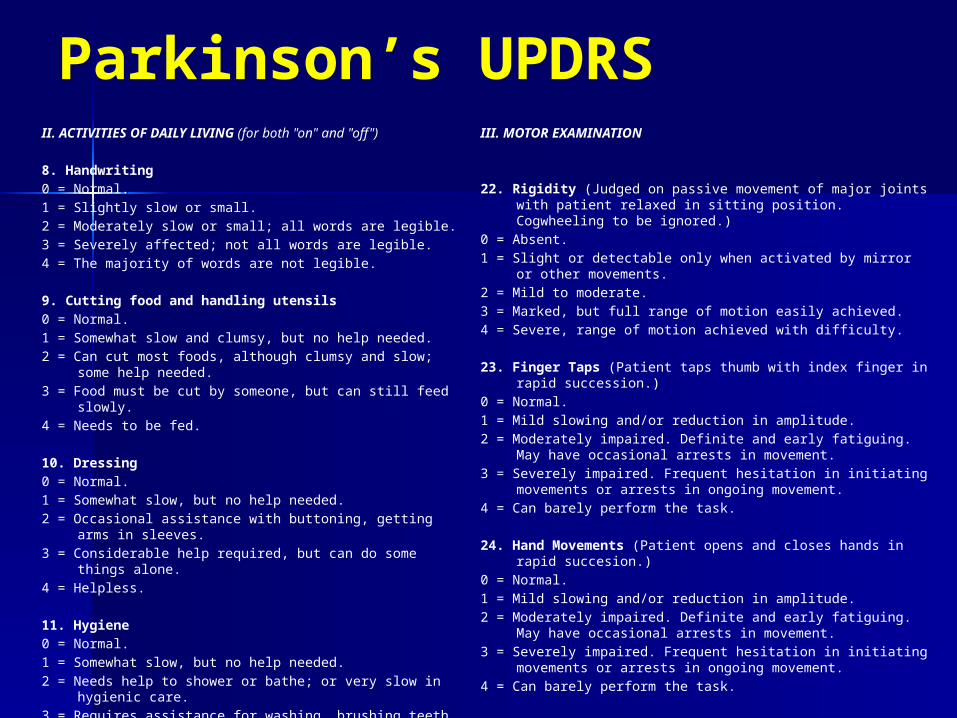
Parkinson’s UPDRSII. ACTIVITIES OF DAILY LIVING (for both "on" and "off") 8. Handwriting0 = Normal.1 = Slightly slow or small.2 = Moderately slow or small; all words are legible.3 = Severely affected; not all words are legible.4 = The majority of words are not legible. 9. Cutting food and handling utensils0 = Normal.1 = Somewhat slow and clumsy, but no help needed.2 = Can cut most foods, although clumsy and slow; some help
needed.3 = Food must be cut by someone, but can still feed slowly.4 = Needs to be fed. 10. Dressing0 = Normal.1 = Somewhat slow, but no help needed.2 = Occasional assistance with buttoning, getting arms in
sleeves.3 = Considerable help required, but can do some things alone.4 = Helpless. 11. Hygiene0 = Normal.1 = Somewhat slow, but no help needed.2 = Needs help to shower or bathe; or very slow in hygienic
care.3 = Requires assistance for washing, brushing teeth, combing
hair, going to bathroom.4 = Foley catheter or other mechanical aids.
III. MOTOR EXAMINATION
22. Rigidity (Judged on passive movement of major joints with patient relaxed in sitting position. Cogwheeling to be ignored.)
0 = Absent.1 = Slight or detectable only when activated by mirror or other
movements.2 = Mild to moderate.3 = Marked, but full range of motion easily achieved.4 = Severe, range of motion achieved with difficulty. 23. Finger Taps (Patient taps thumb with index finger in rapid
succession.)0 = Normal.1 = Mild slowing and/or reduction in amplitude.2 = Moderately impaired. Definite and early fatiguing. May have
occasional arrests in movement.3 = Severely impaired. Frequent hesitation in initiating movements
or arrests in ongoing movement.4 = Can barely perform the task. 24. Hand Movements (Patient opens and closes hands in rapid
succesion.)0 = Normal.1 = Mild slowing and/or reduction in amplitude.2 = Moderately impaired. Definite and early fatiguing. May have
occasional arrests in movement.3 = Severely impaired. Frequent hesitation in initiating movements
or arrests in ongoing movement.4 = Can barely perform the task.
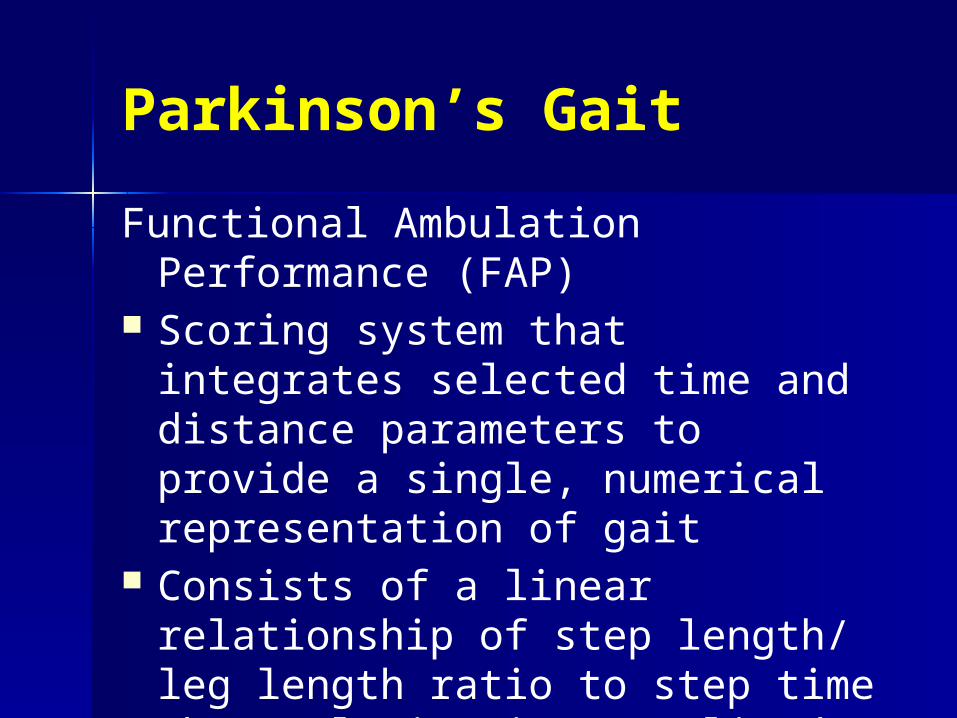
Parkinson’s Gait
Functional Ambulation Performance (FAP)
Scoring system that integrates selected time and distance parameters to provide a single, numerical representation of gait
Consists of a linear relationship of step length/ leg length ratio to step time when velocity is normalized to leg length

GAITRITE SYSTEM
Measure the overall Functional Ambulatory Score (FAP) and its main parameters – Cadence– Velocity– Step Length– Step Time

SLOAN Contrast Sensitivity Comparison
100.00%
2.50%
1.25%
0 10 20 30 40 50 60 70
Pt vs Control OU Contrast Sensitivity
PatientControl
Number of Correct Letters
Contr
ast
%
P= 4.33E-05
P= 8.44E-06
P= 5.04E-05
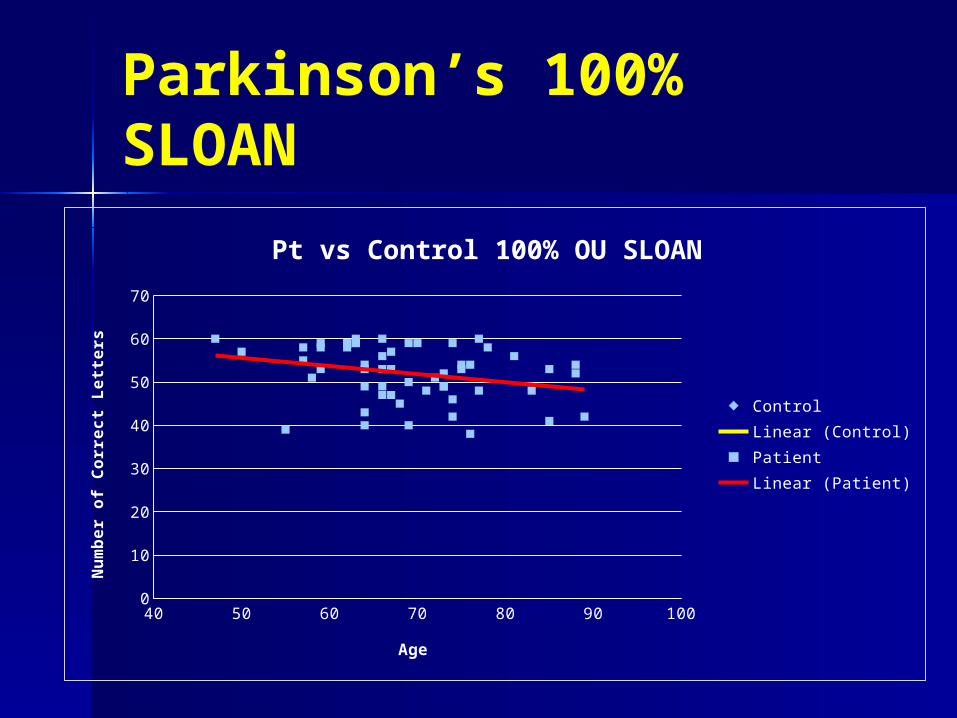
Parkinson’s 100% SLOAN
40 50 60 70 80 90 1000
10
20
30
40
50
60
70
Pt vs Control 100% OU SLOAN
ControlLinear (Control)PatientLinear (Patient)
Age
Num
ber
of
Corr
ect
Lett
ers
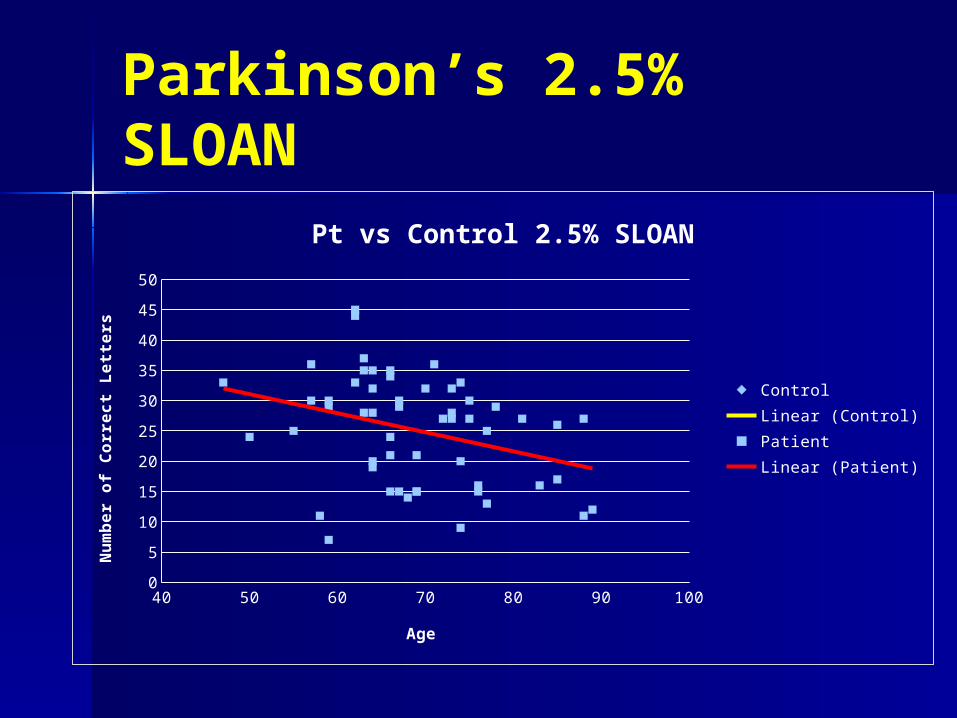
Parkinson’s 2.5% SLOAN
40 50 60 70 80 90 1000
5
10
15
20
25
30
35
40
45
50
Pt vs Control 2.5% SLOAN
ControlLinear (Control)PatientLinear (Patient)
Age
Num
ber
of
Corr
ect
Lett
ers
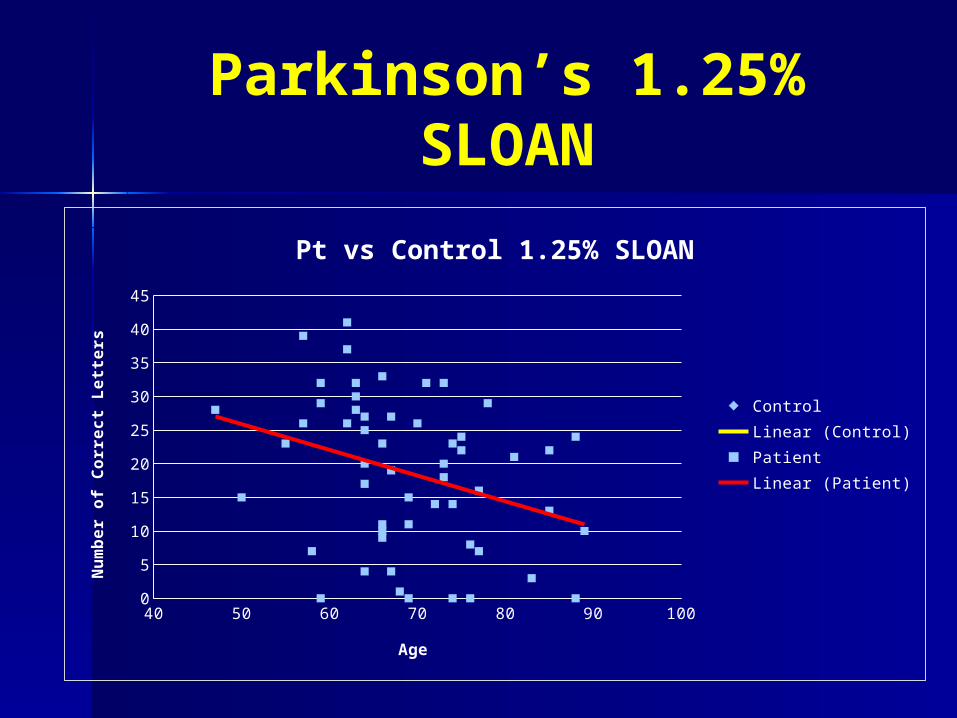
Parkinson’s 1.25% SLOAN
40 50 60 70 80 90 1000
5
10
15
20
25
30
35
40
45
Pt vs Control 1.25% SLOAN
ControlLinear (Control)PatientLinear (Patient)
Age
Num
ber
of
Corr
ect
Lett
ers
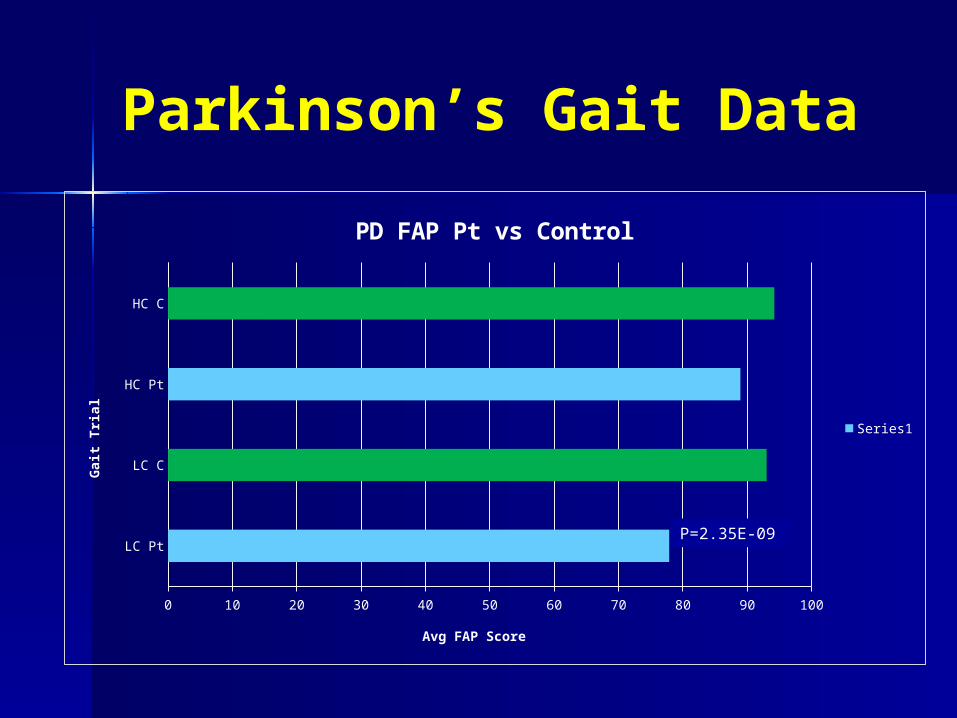
Parkinson’s Gait Data
LC Pt
LC C
HC Pt
HC C
0 10 20 30 40 50 60 70 80 90 100
PD FAP Pt vs Control
Series1
Avg FAP Score
Gait
Tri
al
P=2.35E-09
Parkinson’s Gait
Results
– Confirms contrast sensitivity defects– Motor performance degrades in dim
illumination even in early stages of Parkinsonism
– Deficient contrast sensitivity heightens fall risk likely due to retinal dopamine deficiency

Parkinson’s and CS
The clinical significance of a degraded FAP score rests in well documented correlations between FAP and fall risk.
Parkinson’s patients fall at start and when cadence is interrupted.
Contrast sensitivity disrupts cadence.
Parkinson’s Gait
Results
Plausible correlation between CS and FAP No correlation between CS and age No correlation between UPDRS and CS
– Might reflect discrepancy between part II and III of UPDRS
– Might reflect drug affect (peak/trough)
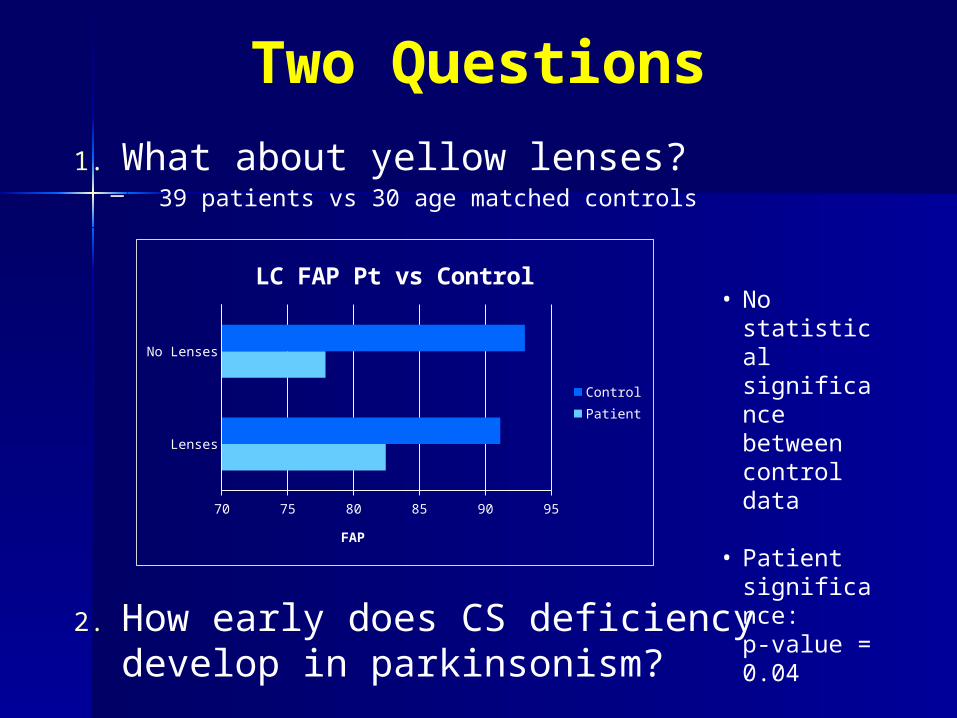
Two Questions
1. What about yellow lenses?– 39 patients vs 30 age matched controls
2. How early does CS deficiency develop in parkinsonism?
Lenses
No Lenses
70 75 80 85 90 95
LC FAP Pt vs Control
ControlPatient
FAP
• No statistical significance between control data
• Patient significance: p-value = 0.04

Top Related