


Languages
Pages
Legal


http://www.hci.mil/
Defense Acquisition WorkforceKey Information
BusinessAs of FY17Q2 (31 March 2017)
Business Key Information
Overview
2
• AT&L HCI is committed to providing the Functional Leader and FIPT Executive Secretary up-to-date key workforce information on a quarterly basis – we welcome questions and recommendations for improved information and analysis support
• HCI provides defense acquisition workforce-wide updates online also at http://www.hci.mil
• Key HCI support contacts– HCI Data/Analysis
• Mrs. Adrienne Evertson ([email protected])(703-805-2338)
Business Key Information
Slide Index
3
Slide Title #
Slide Index 3
Fact Sheet 4
Highlights 5
Total Workforce 6-7
AWF Size by Component and Career Field
9-10
Historical Size by Component
11-12
Historical DAWIA Certification
13-16
DAWIA Certification by Career Field
17
DAWIA Certification by Component
18-19
DAWIA Certification Matrix + Bench Strength
20-21
Demographics
22-25
RAND NDRI Forces and Resources Policy Center Gain/Loss and Retirement Information
26-37
End 38
Business Key Information
Fact Sheet
4
BUSCivilian (Civ)
BUSMilitary (Mil)
Total BUS(Civ+Mil)
Defense Acquisition Workforce
BUSCivilian (Civ)
BUSMilitary (Mil)
Total BUS(Civ+Mil)
Defense Acquisition Workforce
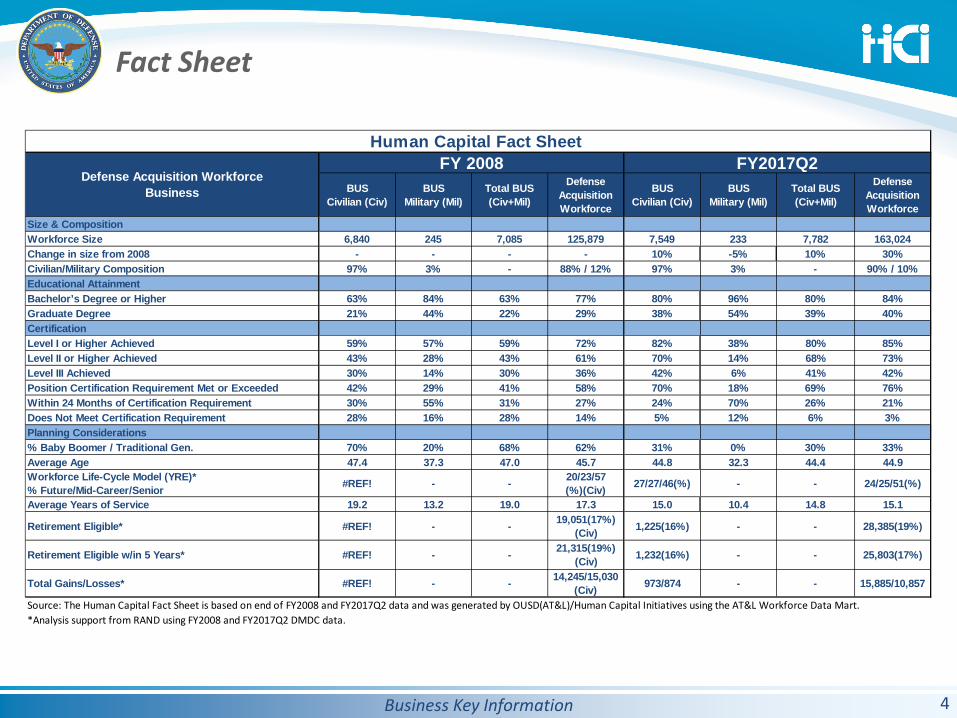
Size & CompositionWorkforce Size 6,840 245 7,085 125,879 7,549 233 7,782 163,024Change in size from 2008 - - - - 10% -5% 10% 30%Civilian/Military Composition 97% 3% - 88% / 12% 97% 3% - 90% / 10%Educational AttainmentBachelor’s Degree or Higher 63% 84% 63% 77% 80% 96% 80% 84%Graduate Degree 21% 44% 22% 29% 38% 54% 39% 40%CertificationLevel I or Higher Achieved 59% 57% 59% 72% 82% 38% 80% 85%Level II or Higher Achieved 43% 28% 43% 61% 70% 14% 68% 73%Level III Achieved 30% 14% 30% 36% 42% 6% 41% 42%Position Certification Requirement Met or Exceeded 42% 29% 41% 58% 70% 18% 69% 76%Within 24 Months of Certification Requirement 30% 55% 31% 27% 24% 70% 26% 21%Does Not Meet Certification Requirement 28% 16% 28% 14% 5% 12% 6% 3%Planning Considerations% Baby Boomer / Traditional Gen. 70% 20% 68% 62% 31% 0% 30% 33%Average Age 47.4 37.3 47.0 45.7 44.8 32.3 44.4 44.9Workforce Life-Cycle Model (YRE)*% Future/Mid-Career/Senior #REF! - - 20/23/57
(%)(Civ) 27/27/46(%) - - 24/25/51(%)
Average Years of Service 19.2 13.2 19.0 17.3 15.0 10.4 14.8 15.1
Retirement Eligible* #REF! - - 19,051(17%)(Civ) 1,225(16%) - - 28,385(19%)
Retirement Eligible w/in 5 Years* #REF! - - 21,315(19%)(Civ) 1,232(16%) - - 25,803(17%)
Total Gains/Losses* #REF! - - 14,245/15,030(Civ) 973/874 - - 15,885/10,857
Source: The Human Capital Fact Sheet is based on end of FY2008 and FY2017Q2 data and was generated by OUSD(AT&L)/Human Capital Initiatives using the AT&L Workforce Data Mart.*Analysis support from RAND using FY2008 and FY2017Q2 DMDC data.
Human Capital Fact Sheet
Defense Acquisition Workforce Business
FY2017Q2FY 2008
Business Key Information
Highlights FY17Q2
5
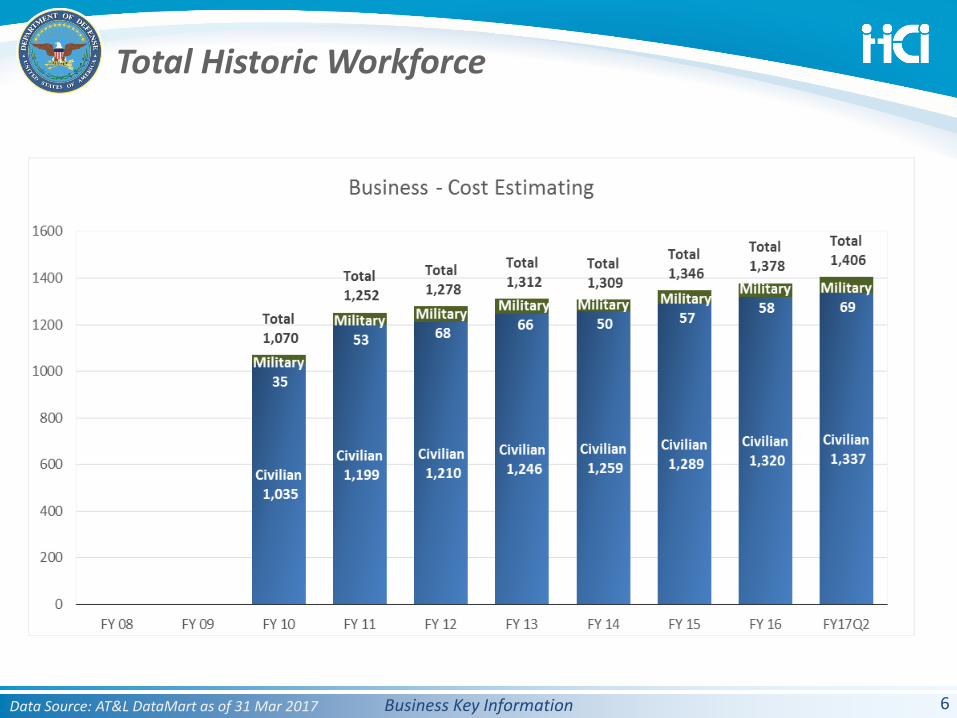
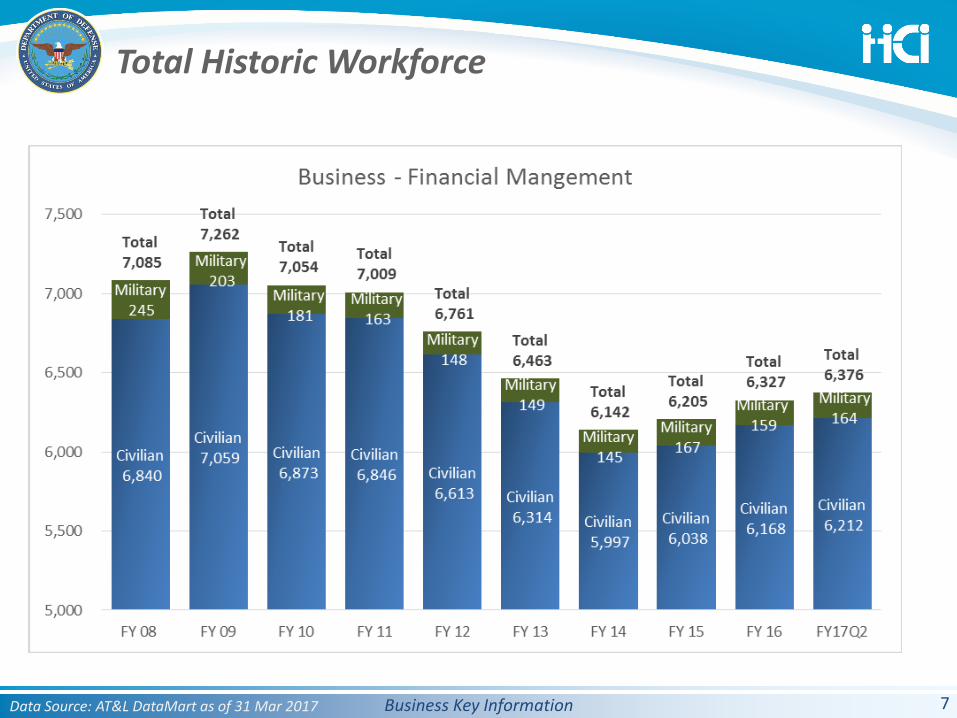
Defense Acquisition Workforce Size Highlights• The current Business (Cost Est & Fin Mgt) Defense Acquisition Workforce
count has increased steadily since FY14 from 7,541 to 7,782 in FY17Q2. Both BUS-FM and BUS-CE have seen growth during this time period.
• Attrition this quarter was up slightly compared to the end of FY16, but only by .02%.
• FM increased KLPs by 8 since last quarter
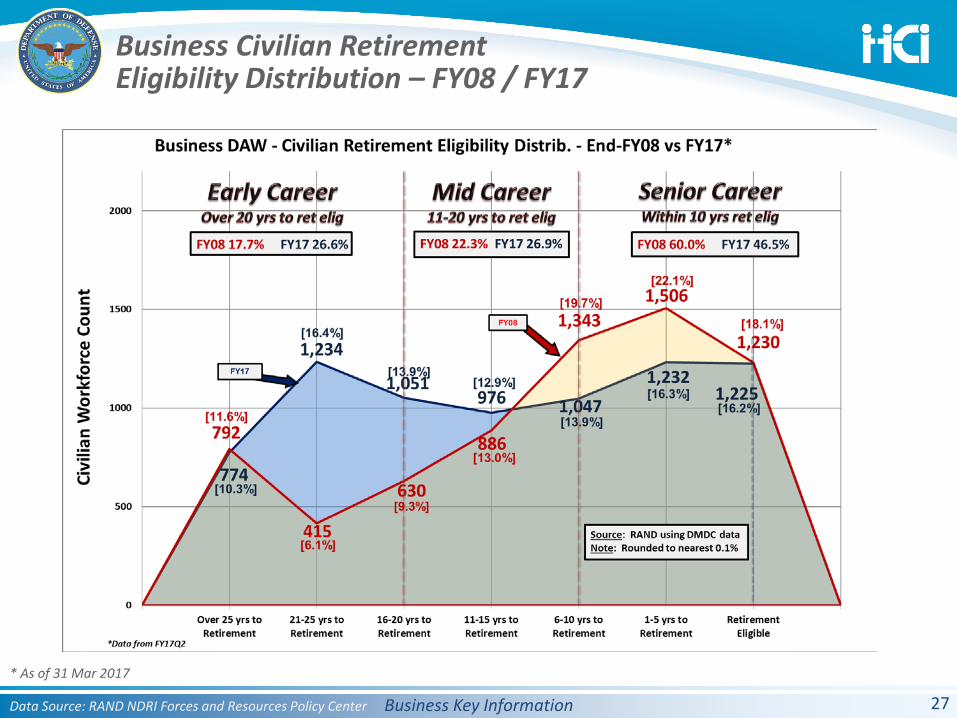
Defense Acquisition Workforce Retirement Eligibility Highlights• From FY16Q2 to FY17Q2, the Business Career Field saw a decrease in the
number of personnel in the Senior Career group and an increase in both the Mid and Early Career Groups.
Business Key Information
Total Historic Workforce
6Data Source: AT&L DataMart as of 31 Mar 2017
Business Key Information
Total Historic Workforce
7Data Source: AT&L DataMart as of 31 Mar 2017
Business Key Information
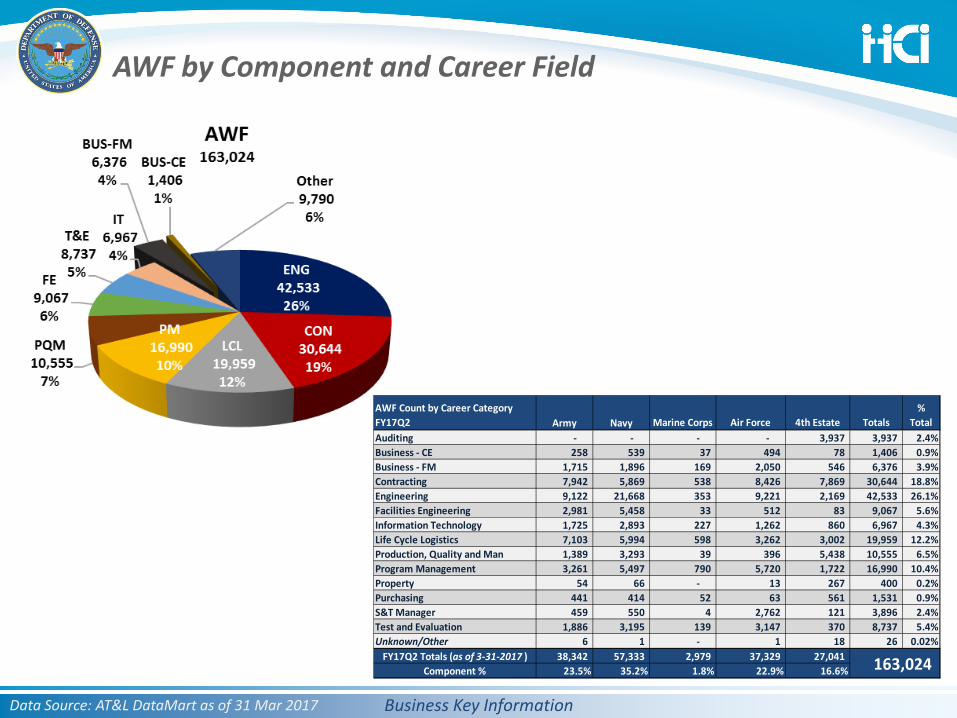
AWF by Component and Career Field
Data Source: AT&L DataMart as of 31 Mar 2017
AWF Count by Career CategoryFY17Q2 Army Navy Marine Corps Air Force 4th Estate Totals
%Total
Auditing - - - - 3,937 3,937 2.4%Business - CE 258 539 37 494 78 1,406 0.9%Business - FM 1,715 1,896 169 2,050 546 6,376 3.9%Contracting 7,942 5,869 538 8,426 7,869 30,644 18.8%Engineering 9,122 21,668 353 9,221 2,169 42,533 26.1%Facilities Engineering 2,981 5,458 33 512 83 9,067 5.6%Information Technology 1,725 2,893 227 1,262 860 6,967 4.3%Life Cycle Logistics 7,103 5,994 598 3,262 3,002 19,959 12.2%Production, Quality and Man 1,389 3,293 39 396 5,438 10,555 6.5%Program Management 3,261 5,497 790 5,720 1,722 16,990 10.4%Property 54 66 - 13 267 400 0.2%Purchasing 441 414 52 63 561 1,531 0.9%S&T Manager 459 550 4 2,762 121 3,896 2.4%Test and Evaluation 1,886 3,195 139 3,147 370 8,737 5.4%Unknown/Other 6 1 - 1 18 26 0.02%
FY17Q2 Totals (as of 3-31-2017 ) 38,342 57,333 2,979 37,329 27,041 Component % 23.5% 35.2% 1.8% 22.9% 16.6% 163,024
Business Key Information
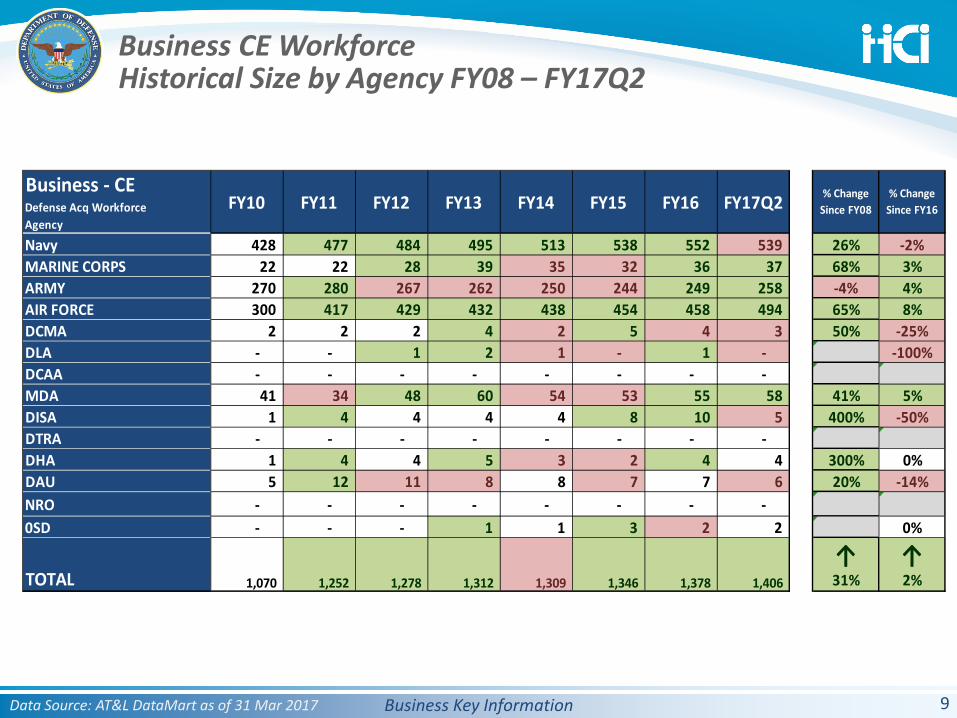
Business CE WorkforceHistorical Size by Agency FY08 – FY17Q2
9Data Source: AT&L DataMart as of 31 Mar 2017
Navy 428 477 484 495 513 538 552 539 26% -2%MARINE CORPS 22 22 28 39 35 32 36 37 68% 3%ARMY 270 280 267 262 250 244 249 258 -4% 4%AIR FORCE 300 417 429 432 438 454 458 494 65% 8%DCMA 2 2 2 4 2 5 4 3 50% -25%DLA - - 1 2 1 - 1 - #DIV/0! -100%DCAA - - - - - - - - #DIV/0! #DIV/0!MDA 41 34 48 60 54 53 55 58 41% 5%DISA 1 4 4 4 4 8 10 5 400% -50%DTRA - - - - - - - - #DIV/0! #DIV/0!DHA 1 4 4 5 3 2 4 4 300% 0%DAU 5 12 11 8 8 7 7 6 20% -14%NRO - - - - - - - - #DIV/0! #DIV/0!0SD - - - 1 1 3 2 2 #DIV/0! 0%
↑ ↑TOTAL 31% 2%
% Change Since FY08
% Change Since FY16
1,378 1,406
Defense Acq WorkforceAgency
Business - CEFY17Q2FY13 FY14FY10 FY11 FY12 FY15
1,252 1,278
FY16
1,346 1,070 1,312 1,309
Business Key Information
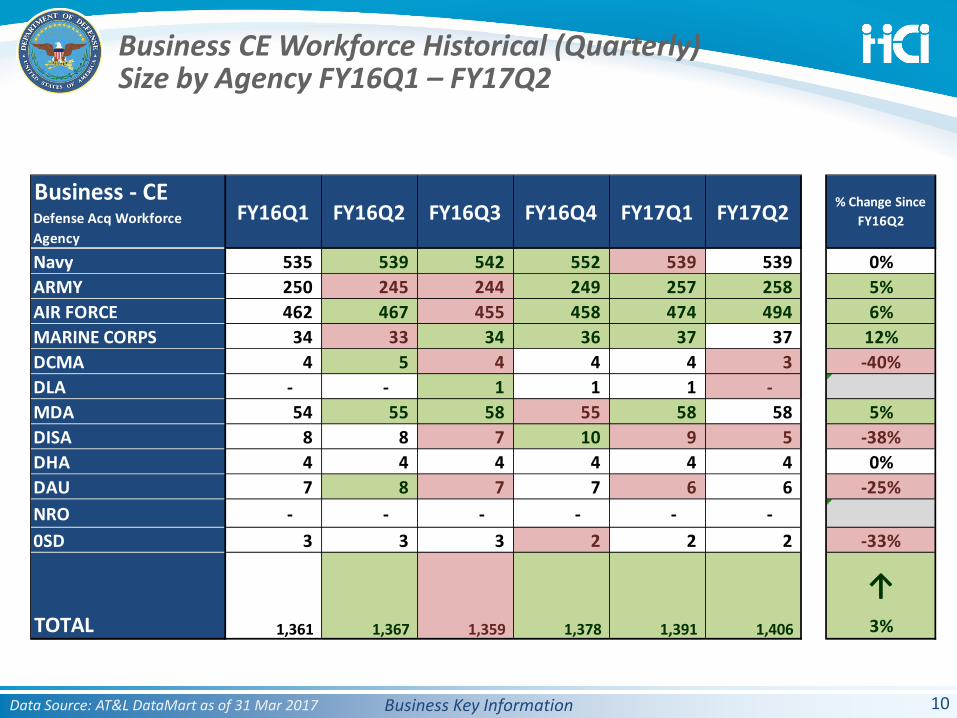
Business CE Workforce Historical (Quarterly) Size by Agency FY16Q1 – FY17Q2
10Data Source: AT&L DataMart as of 31 Mar 2017
Navy 535 539 542 552 539 539 0%ARMY 250 245 244 249 257 258 5%AIR FORCE 462 467 455 458 474 494 6%MARINE CORPS 34 33 34 36 37 37 12%DCMA 4 5 4 4 4 3 -40%DLA - - 1 1 1 - #DIV/0!MDA 54 55 58 55 58 58 5%DISA 8 8 7 10 9 5 -38%DHA 4 4 4 4 4 4 0%DAU 7 8 7 7 6 6 -25%NRO - - - - - - #DIV/0!0SD 3 3 3 2 2 2 -33%
↑TOTAL 3%
% Change Since FY16Q2
1,361 1,367 1,359 1,378 1,391 1,406
FY16Q3 FY16Q4 FY17Q1Defense Acq WorkforceAgency
Business - CEFY16Q1 FY16Q2 FY17Q2
Business Key Information
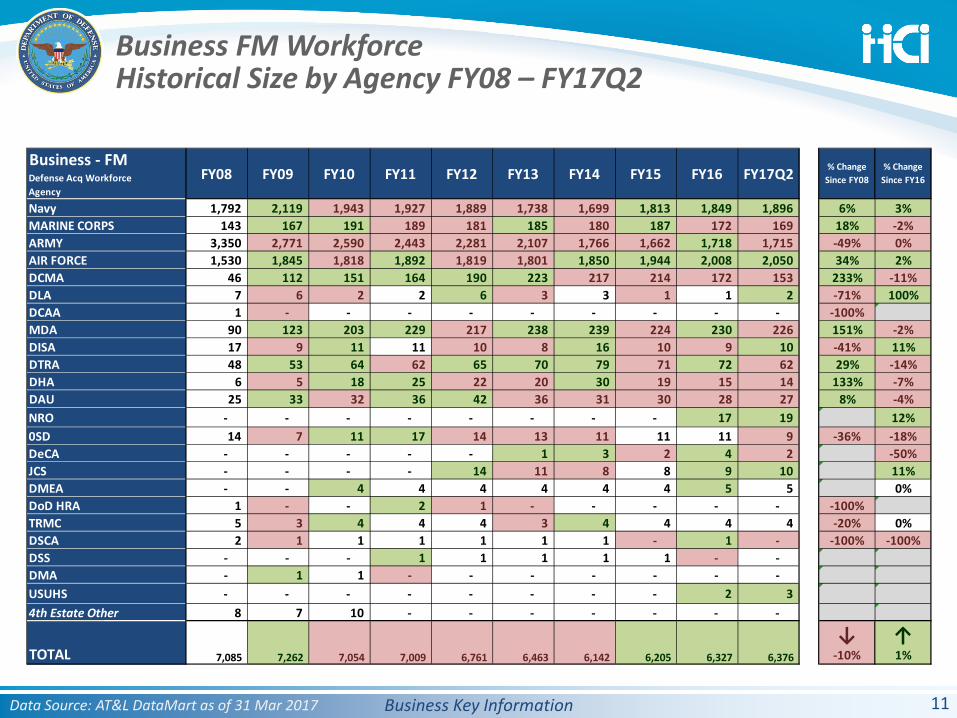
Business FM WorkforceHistorical Size by Agency FY08 – FY17Q2
11Data Source: AT&L DataMart as of 31 Mar 2017
Navy 1,792 2,119 1,943 1,927 1,889 1,738 1,699 1,813 1,849 1,896 6% 3%MARINE CORPS 143 167 191 189 181 185 180 187 172 169 18% -2%ARMY 3,350 2,771 2,590 2,443 2,281 2,107 1,766 1,662 1,718 1,715 -49% 0%AIR FORCE 1,530 1,845 1,818 1,892 1,819 1,801 1,850 1,944 2,008 2,050 34% 2%DCMA 46 112 151 164 190 223 217 214 172 153 233% -11%DLA 7 6 2 2 6 3 3 1 1 2 -71% 100%DCAA 1 - - - - - - - - - -100% #DIV/0!MDA 90 123 203 229 217 238 239 224 230 226 151% -2%DISA 17 9 11 11 10 8 16 10 9 10 -41% 11%DTRA 48 53 64 62 65 70 79 71 72 62 29% -14%DHA 6 5 18 25 22 20 30 19 15 14 133% -7%DAU 25 33 32 36 42 36 31 30 28 27 8% -4%NRO - - - - - - - - 17 19 #DIV/0! 12%0SD 14 7 11 17 14 13 11 11 11 9 -36% -18%DeCA - - - - - 1 3 2 4 2 #DIV/0! -50%JCS - - - - 14 11 8 8 9 10 #DIV/0! 11%DMEA - - 4 4 4 4 4 4 5 5 #DIV/0! 0%DoD HRA 1 - - 2 1 - - - - - -100% #DIV/0!TRMC 5 3 4 4 4 3 4 4 4 4 -20% 0%DSCA 2 1 1 1 1 1 1 - 1 - -100% -100%DSS - - - 1 1 1 1 1 - - #DIV/0! #DIV/0!DMA - 1 1 - - - - - - - #DIV/0! #DIV/0!USUHS - - - - - - - - 2 3 #DIV/0! #DIV/0!4th Estate Other 8 7 10 - - - - - - - #DIV/0! #DIV/0!
↓ ↑TOTAL -10% 1%6,205 6,327 6,376
Defense Acq WorkforceAgency
Business - FM
6,463 6,142 7,085 7,262 7,054 7,009 6,761
% Change Since FY08
% Change Since FY16FY08 FY15 FY16 FY17Q2FY09 FY12 FY13 FY14FY11FY10
Business Key Information
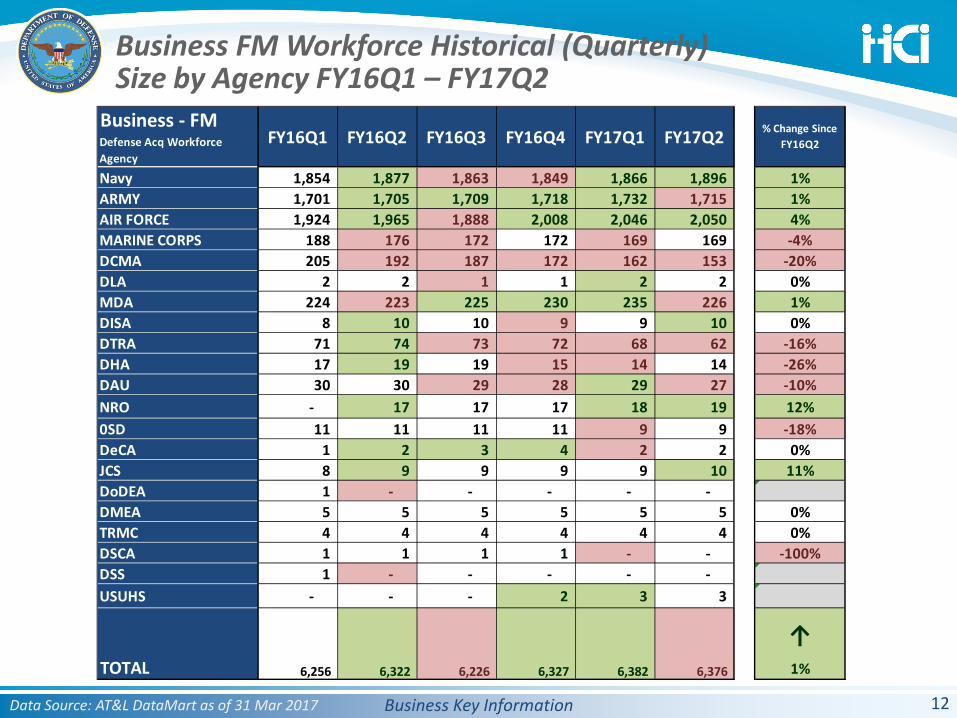
Business FM Workforce Historical (Quarterly) Size by Agency FY16Q1 – FY17Q2
12Data Source: AT&L DataMart as of 31 Mar 2017
Navy 1,854 1,877 1,863 1,849 1,866 1,896 1%ARMY 1,701 1,705 1,709 1,718 1,732 1,715 1%AIR FORCE 1,924 1,965 1,888 2,008 2,046 2,050 4%MARINE CORPS 188 176 172 172 169 169 -4%DCMA 205 192 187 172 162 153 -20%DLA 2 2 1 1 2 2 0%MDA 224 223 225 230 235 226 1%DISA 8 10 10 9 9 10 0%DTRA 71 74 73 72 68 62 -16%DHA 17 19 19 15 14 14 -26%DAU 30 30 29 28 29 27 -10%NRO - 17 17 17 18 19 12%0SD 11 11 11 11 9 9 -18%DeCA 1 2 3 4 2 2 0%JCS 8 9 9 9 9 10 11%DoDEA 1 - - - - - #DIV/0!DMEA 5 5 5 5 5 5 0%TRMC 4 4 4 4 4 4 0%DSCA 1 1 1 1 - - -100%DSS 1 - - - - - #DIV/0!USUHS - - - 2 3 3 #DIV/0!
↑TOTAL 1%
% Change Since FY16Q2
6,256 6,322 6,226 6,327 6,382 6,376
FY16Q3 FY16Q4 FY17Q1Defense Acq WorkforceAgency
Business - FMFY16Q1 FY16Q2 FY17Q2
Business Key Information
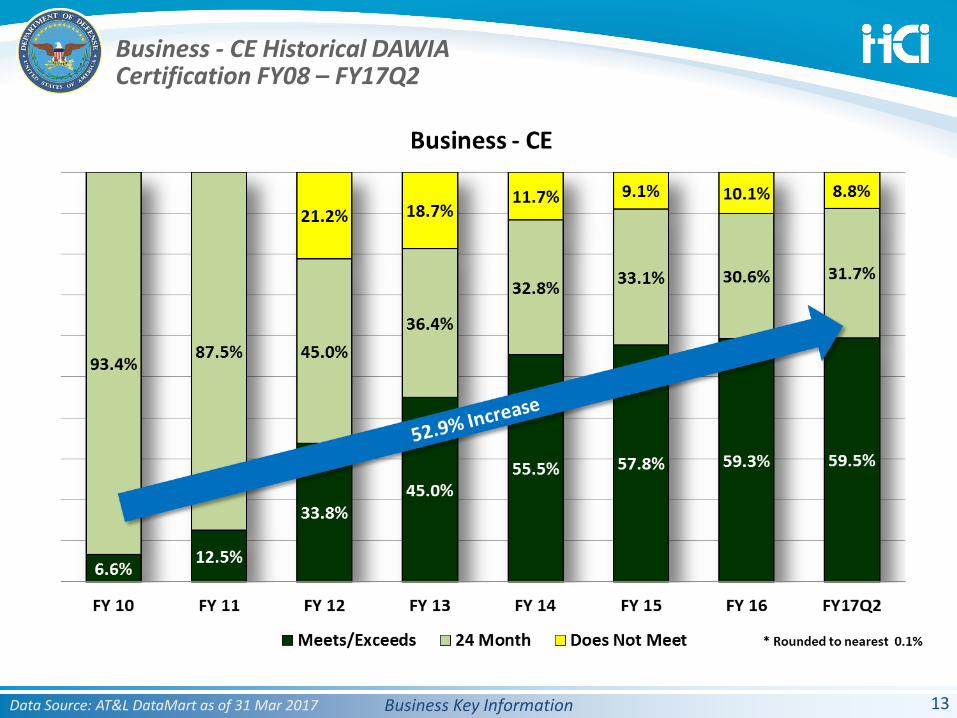
Business - CE Historical DAWIACertification FY08 – FY17Q2
13Data Source: AT&L DataMart as of 31 Mar 2017
Business Key Information
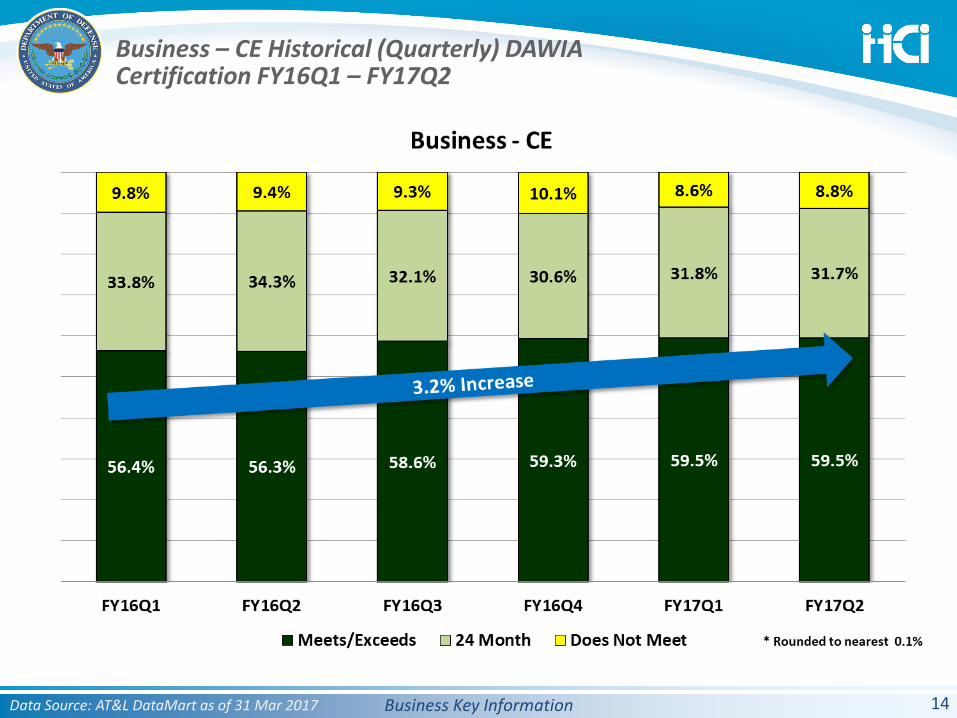
Business – CE Historical (Quarterly) DAWIACertification FY16Q1 – FY17Q2
14Data Source: AT&L DataMart as of 31 Mar 2017
Business Key Information
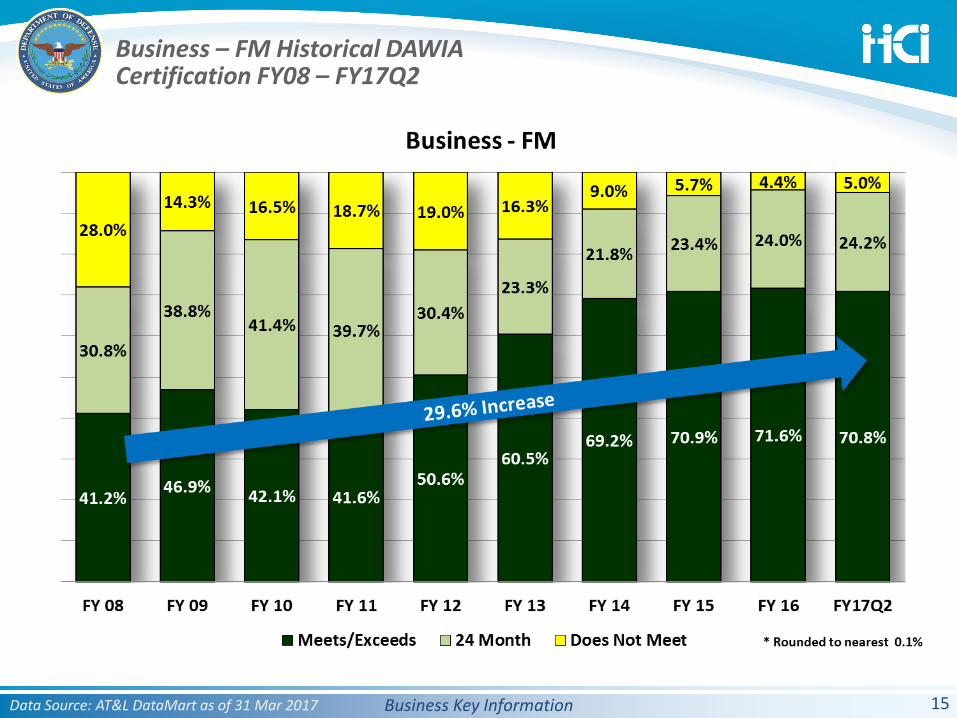
Business – FM Historical DAWIACertification FY08 – FY17Q2
15Data Source: AT&L DataMart as of 31 Mar 2017
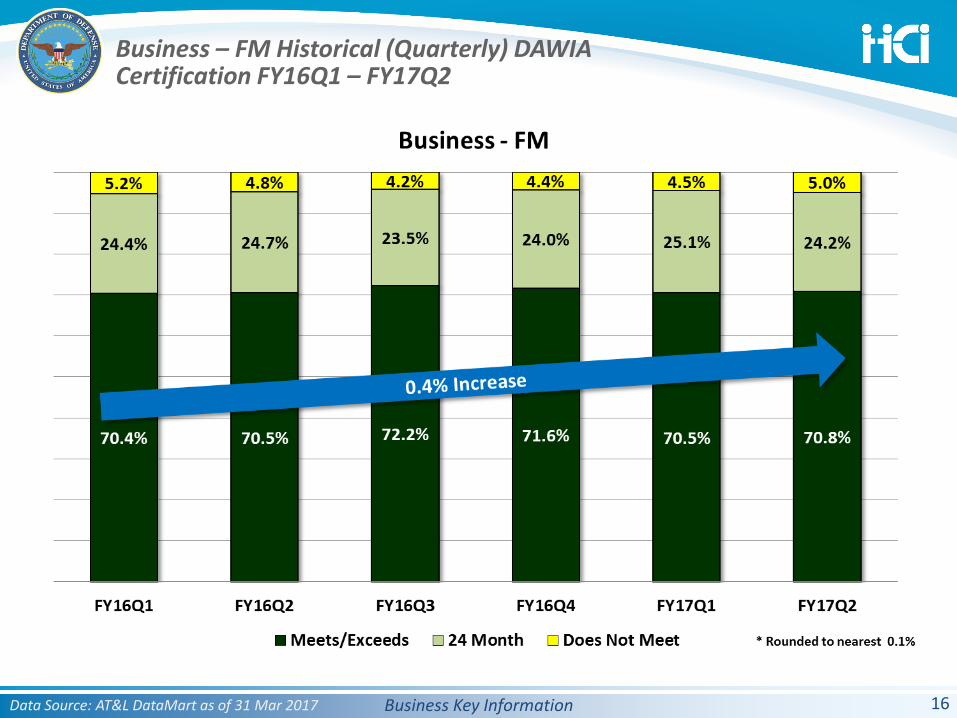
Business Key Information 16Data Source: AT&L DataMart as of 31 Mar 2017
Business – FM Historical (Quarterly) DAWIACertification FY16Q1 – FY17Q2
Business Key Information
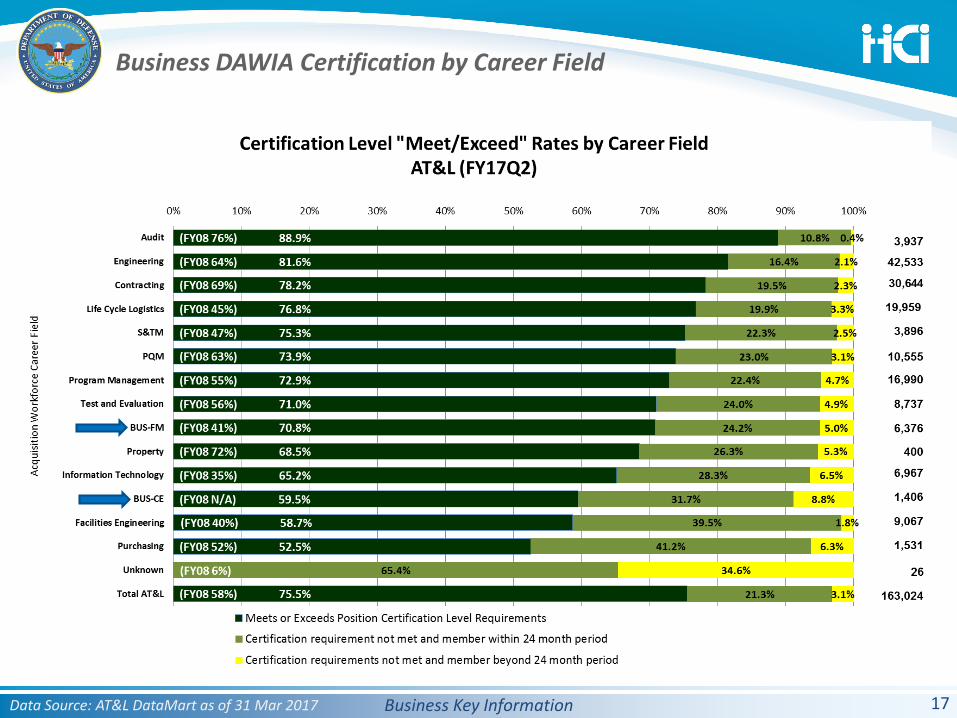
Business DAWIA Certification by Career Field
17Data Source: AT&L DataMart as of 31 Mar 2017
Business Key Information
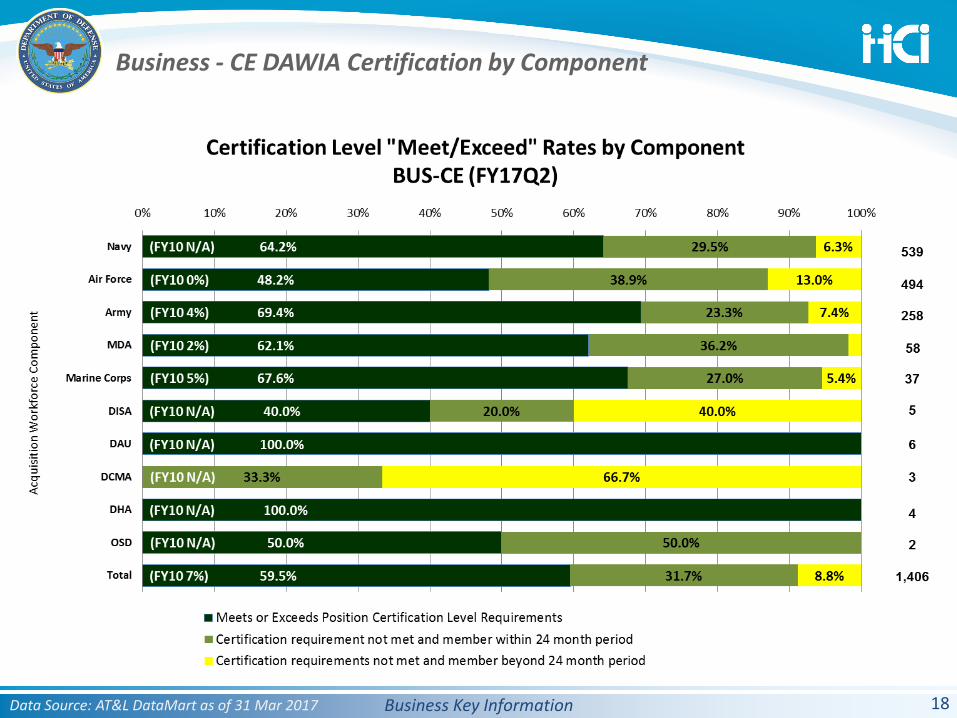
Business - CE DAWIA Certification by Component
18Data Source: AT&L DataMart as of 31 Mar 2017
Business Key Information
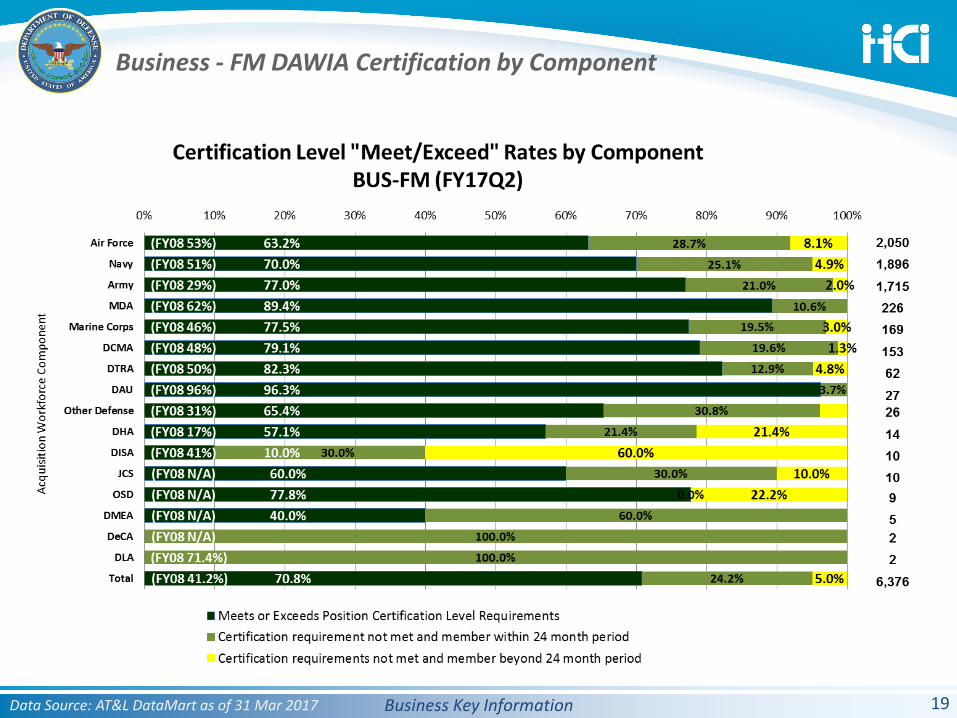
Business - FM DAWIA Certification by Component
19Data Source: AT&L DataMart as of 31 Mar 2017
Business Key Information
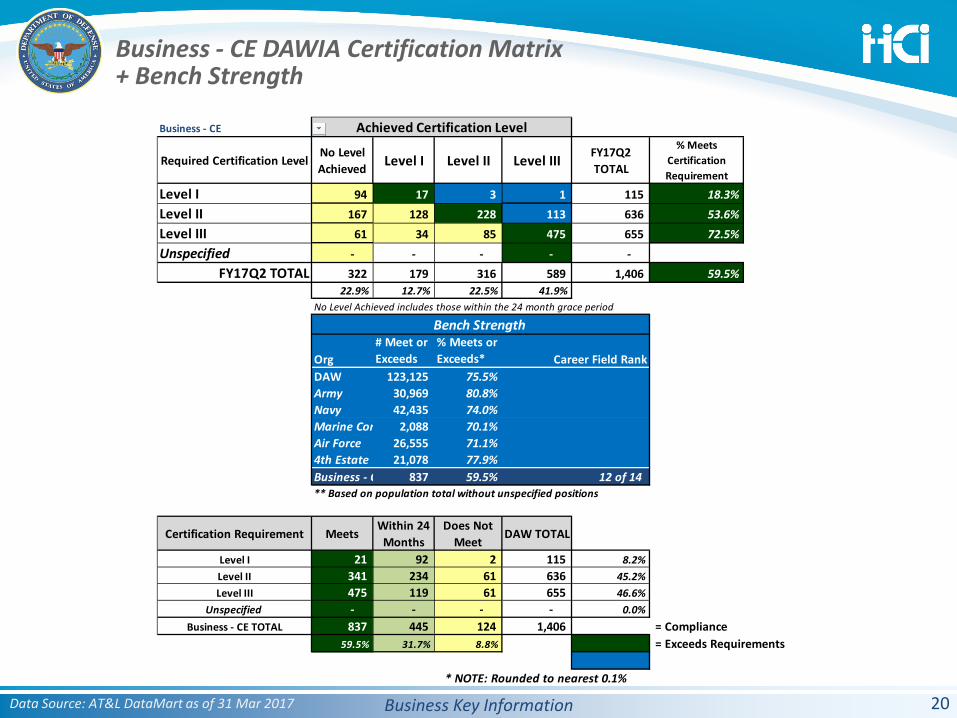
Business - CE DAWIA Certification Matrix + Bench Strength
Data Source: AT&L DataMart as of 31 Mar 2017 20
Business - CE
Required Certification LevelNo Level Achieved Level I Level II Level III FY17Q2
TOTAL
% Meets Certification Requirement
Level I 94 17 3 1 115 18.3%Level II 167 128 228 113 636 53.6%Level III 61 34 85 475 655 72.5%Unspecified - - - - -
FY17Q2 TOTAL 322 179 316 589 1,406 59.5%22.9% 12.7% 22.5% 41.9%
No Level Achieved includes those within the 24 month grace period
Org# Meet or Exceeds
% Meets or Exceeds* Career Field Rank
DAW 123,125 75.5%Army 30,969 80.8%Navy 42,435 74.0%Marine Cor 2,088 70.1%Air Force 26,555 71.1%4th Estate 21,078 77.9%Business - C 837 59.5% 12 of 14** Based on population total without unspecified positions
Certification Requirement MeetsWithin 24 Months
Does Not Meet
DAW TOTAL
Level I 21 92 2 115 8.2%Level II 341 234 61 636 45.2%Level III 475 119 61 655 46.6%
Unspecified - - - - 0.0%Business - CE TOTAL 837 445 124 1,406 = Compliance
59.5% 31.7% 8.8% = Exceeds Requirements
* NOTE: Rounded to nearest 0.1%
Achieved Certification Level
Bench Strength
Business Key Information
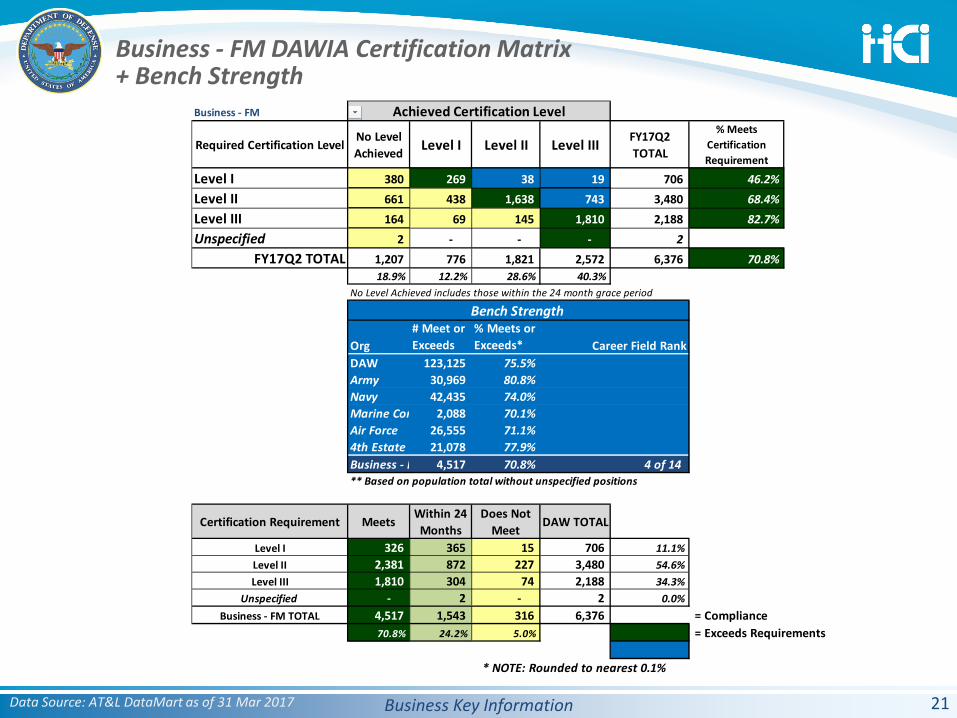
Business - FM DAWIA Certification Matrix + Bench Strength
Data Source: AT&L DataMart as of 31 Mar 2017 21
Business - FM
Required Certification LevelNo Level Achieved Level I Level II Level III FY17Q2
TOTAL
% Meets Certification Requirement
Level I 380 269 38 19 706 46.2%Level II 661 438 1,638 743 3,480 68.4%Level III 164 69 145 1,810 2,188 82.7%Unspecified 2 - - - 2
FY17Q2 TOTAL 1,207 776 1,821 2,572 6,376 70.8%18.9% 12.2% 28.6% 40.3%
No Level Achieved includes those within the 24 month grace period
Org# Meet or Exceeds
% Meets or Exceeds* Career Field Rank
DAW 123,125 75.5%Army 30,969 80.8%Navy 42,435 74.0%Marine Cor 2,088 70.1%Air Force 26,555 71.1%4th Estate 21,078 77.9%Business - F 4,517 70.8% 4 of 14** Based on population total without unspecified positions
Certification Requirement MeetsWithin 24 Months
Does Not Meet
DAW TOTAL
Level I 326 365 15 706 11.1%Level II 2,381 872 227 3,480 54.6%Level III 1,810 304 74 2,188 34.3%
Unspecified - 2 - 2 0.0%Business - FM TOTAL 4,517 1,543 316 6,376 = Compliance
70.8% 24.2% 5.0% = Exceeds Requirements
* NOTE: Rounded to nearest 0.1%
Achieved Certification Level
Bench Strength
Business Key Information
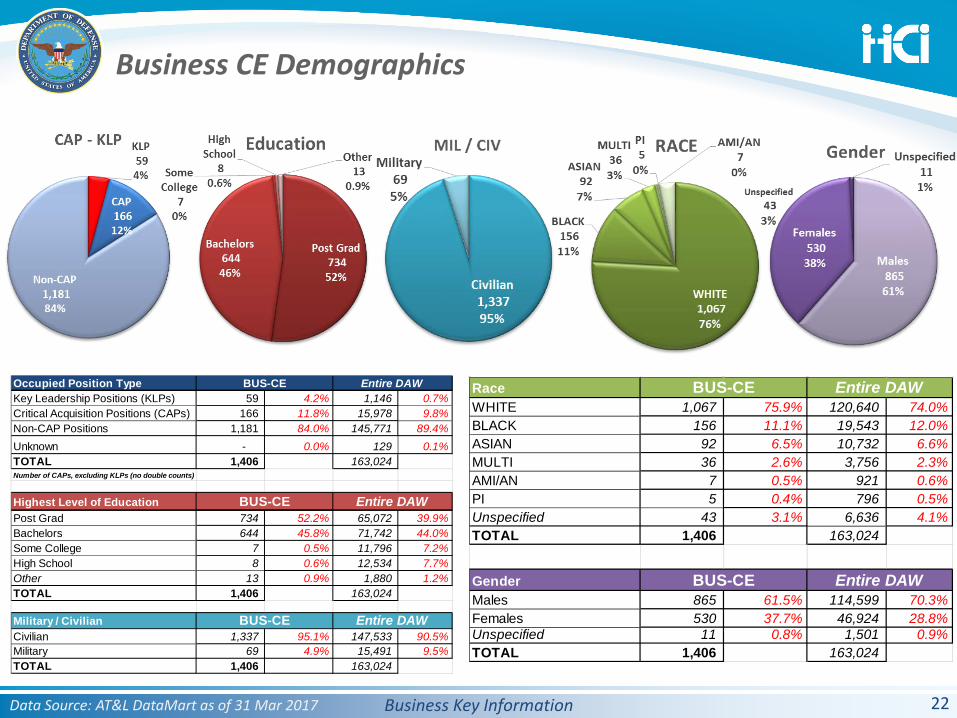
Business CE Demographics
22Data Source: AT&L DataMart as of 31 Mar 2017
Occupied Position TypeKey Leadership Positions (KLPs) 59 4.2% 1,146 0.7%Critical Acquisition Positions (CAPs) * 166 11.8% 15,978 9.8%Non-CAP Positions 1,181 84.0% 145,771 89.4%Unknown - 0.0% 129 0.1%TOTAL 1,406 163,024
Number of CAPs, excluding KLPs (no double counts)
Highest Level of EducationPost Grad 734 52.2% 65,072 39.9%Bachelors 644 45.8% 71,742 44.0%Some College 7 0.5% 11,796 7.2%High School 8 0.6% 12,534 7.7%Other 13 0.9% 1,880 1.2%TOTAL 1,406 163,024
Military / CivilianCivilian 1,337 95.1% 147,533 90.5%Military 69 4.9% 15,491 9.5%TOTAL 1,406 163,024
BUS-CE Entire DAW
BUS-CE Entire DAW
BUS-CE Entire DAW
RaceWHITE 1,067 75.9% 120,640 74.0%BLACK 156 11.1% 19,543 12.0%ASIAN 92 6.5% 10,732 6.6%MULTI 36 2.6% 3,756 2.3%AMI/AN 7 0.5% 921 0.6%PI 5 0.4% 796 0.5%Unspecified 43 3.1% 6,636 4.1%TOTAL 1,406 163,024
GenderMales 865 61.5% 114,599 70.3%Females 530 37.7% 46,924 28.8%Unspecified 11 0.8% 1,501 0.9%TOTAL 1,406 163,024
BUS-CE Entire DAW
BUS-CE Entire DAW
Business Key Information
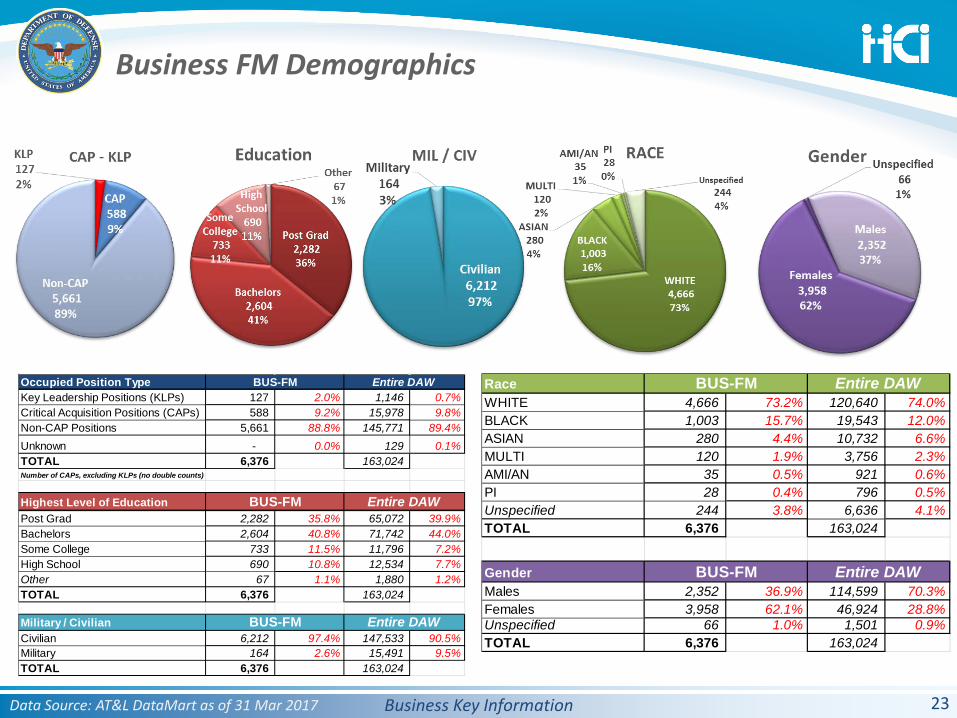
Business FM Demographics
23Data Source: AT&L DataMart as of 31 Mar 2017
Occupied Position TypeKey Leadership Positions (KLPs) 127 2.0% 1,146 0.7%Critical Acquisition Positions (CAPs) 588 9.2% 15,978 9.8%Non-CAP Positions 5,661 88.8% 145,771 89.4%Unknown - 0.0% 129 0.1%TOTAL 6,376 163,024
Number of CAPs, excluding KLPs (no double counts)
Highest Level of EducationPost Grad 2,282 35.8% 65,072 39.9%Bachelors 2,604 40.8% 71,742 44.0%Some College 733 11.5% 11,796 7.2%High School 690 10.8% 12,534 7.7%Other 67 1.1% 1,880 1.2%TOTAL 6,376 163,024
Military / CivilianCivilian 6,212 97.4% 147,533 90.5%Military 164 2.6% 15,491 9.5%TOTAL 6,376 163,024
BUS-FM Entire DAW
BUS-FM Entire DAW
BUS-FM Entire DAW
RaceWHITE 4,666 73.2% 120,640 74.0%BLACK 1,003 15.7% 19,543 12.0%ASIAN 280 4.4% 10,732 6.6%MULTI 120 1.9% 3,756 2.3%AMI/AN 35 0.5% 921 0.6%PI 28 0.4% 796 0.5%Unspecified 244 3.8% 6,636 4.1%TOTAL 6,376 163,024
GenderMales 2,352 36.9% 114,599 70.3%Females 3,958 62.1% 46,924 28.8%Unspecified 66 1.0% 1,501 0.9%TOTAL 6,376 163,024
BUS-FM Entire DAW
BUS-FM Entire DAW
Business Key Information
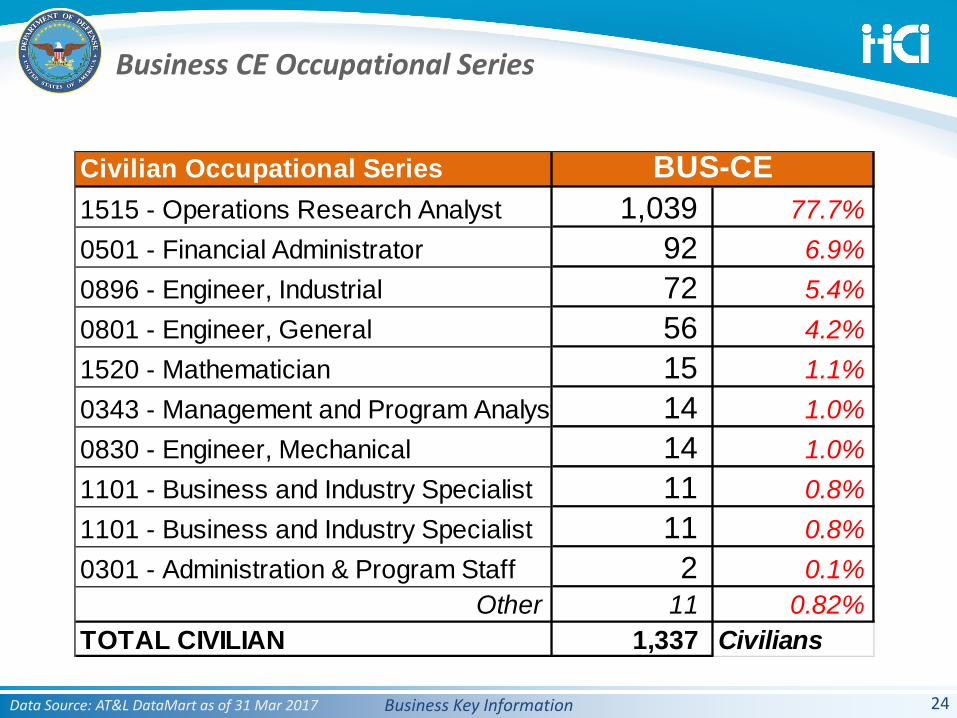
Business CE Occupational Series
24Data Source: AT&L DataMart as of 31 Mar 2017
Civilian Occupational Series1515 - Operations Research Analyst 1,039 77.7%0501 - Financial Administrator 92 6.9%0896 - Engineer, Industrial 72 5.4%0801 - Engineer, General 56 4.2%1520 - Mathematician 15 1.1%0343 - Management and Program Analyst 14 1.0%0830 - Engineer, Mechanical 14 1.0%1101 - Business and Industry Specialist 11 0.8%1101 - Business and Industry Specialist 11 0.8%0301 - Administration & Program Staff 2 0.1%
Other 11 0.82%TOTAL CIVILIAN 1,337 Civilians
BUS-CE
Business Key Information
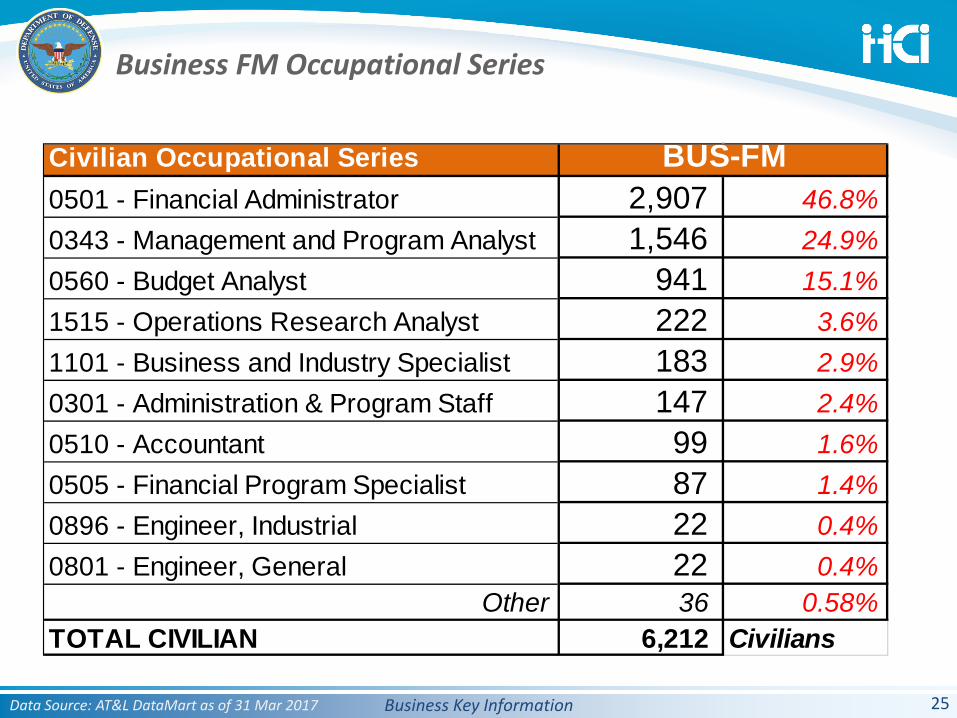
Business FM Occupational Series
25Data Source: AT&L DataMart as of 31 Mar 2017
Civilian Occupational Series0501 - Financial Administrator 2,907 46.8%0343 - Management and Program Analyst 1,546 24.9%0560 - Budget Analyst 941 15.1%1515 - Operations Research Analyst 222 3.6%1101 - Business and Industry Specialist 183 2.9%0301 - Administration & Program Staff 147 2.4%0510 - Accountant 99 1.6%0505 - Financial Program Specialist 87 1.4%0896 - Engineer, Industrial 22 0.4%0801 - Engineer, General 22 0.4%
Other 36 0.58%TOTAL CIVILIAN 6,212 Civilians
BUS-FM
http://www.hci.mil/
RAND NDRI Forces and Resources Policy Center Data
Retirement / Loss Slides
26
Business Key Information
Business Civilian RetirementEligibility Distribution – FY08 / FY17
Data Source: RAND NDRI Forces and Resources Policy Center 27
* As of 31 Mar 2017
Business Key Information
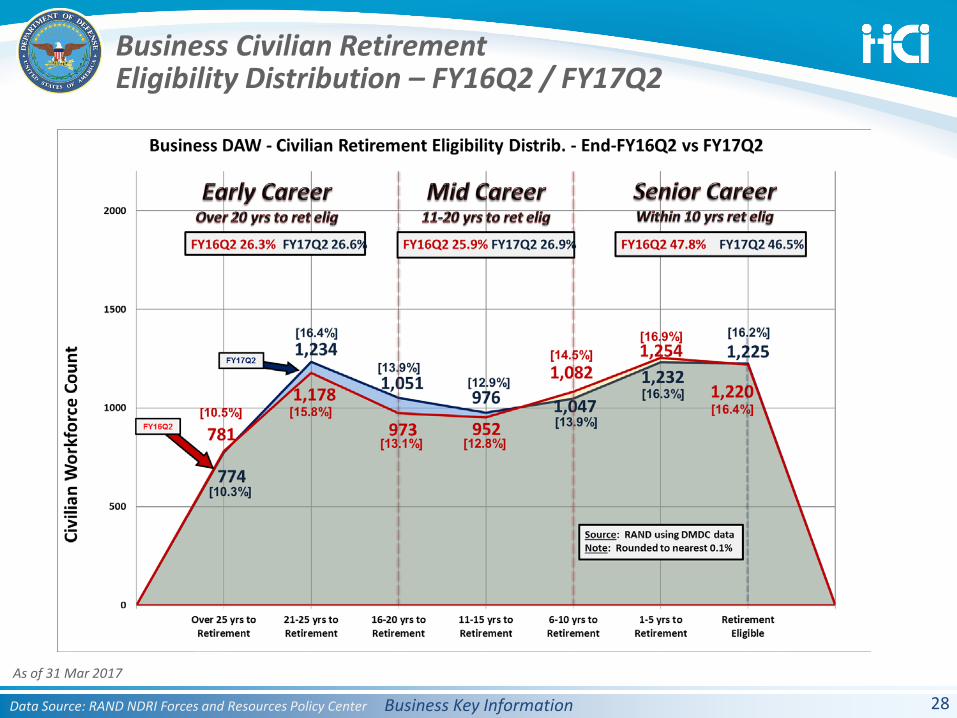
Business Civilian RetirementEligibility Distribution – FY16Q2 / FY17Q2
Data Source: RAND NDRI Forces and Resources Policy Center 28
As of 31 Mar 2017
Business Key Information
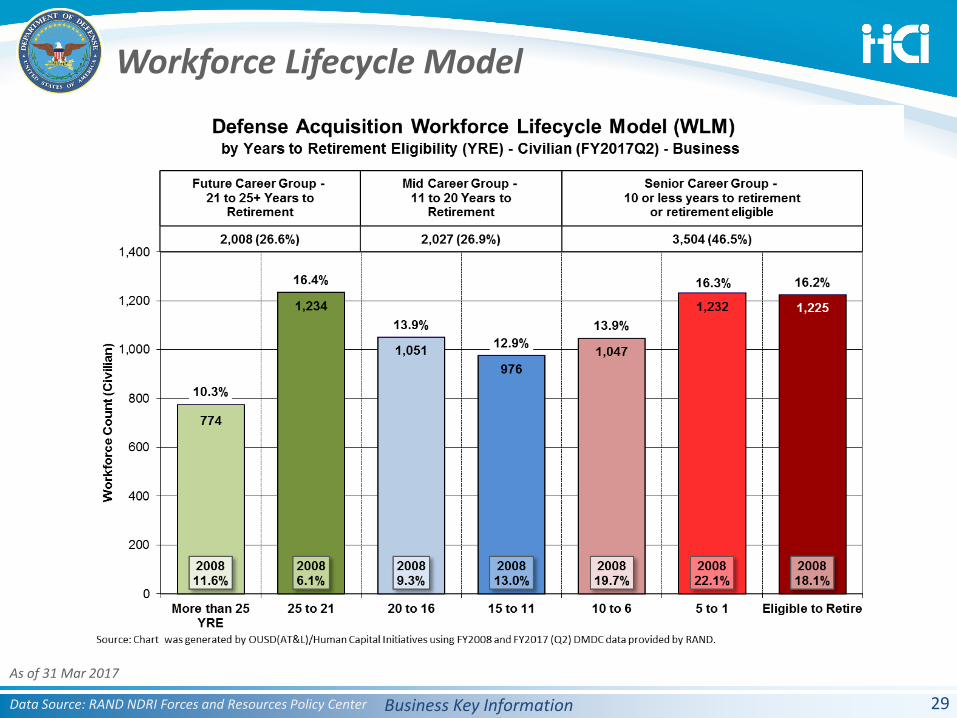
Workforce Lifecycle Model
29
As of 31 Mar 2017
Data Source: RAND NDRI Forces and Resources Policy Center
Business Key Information
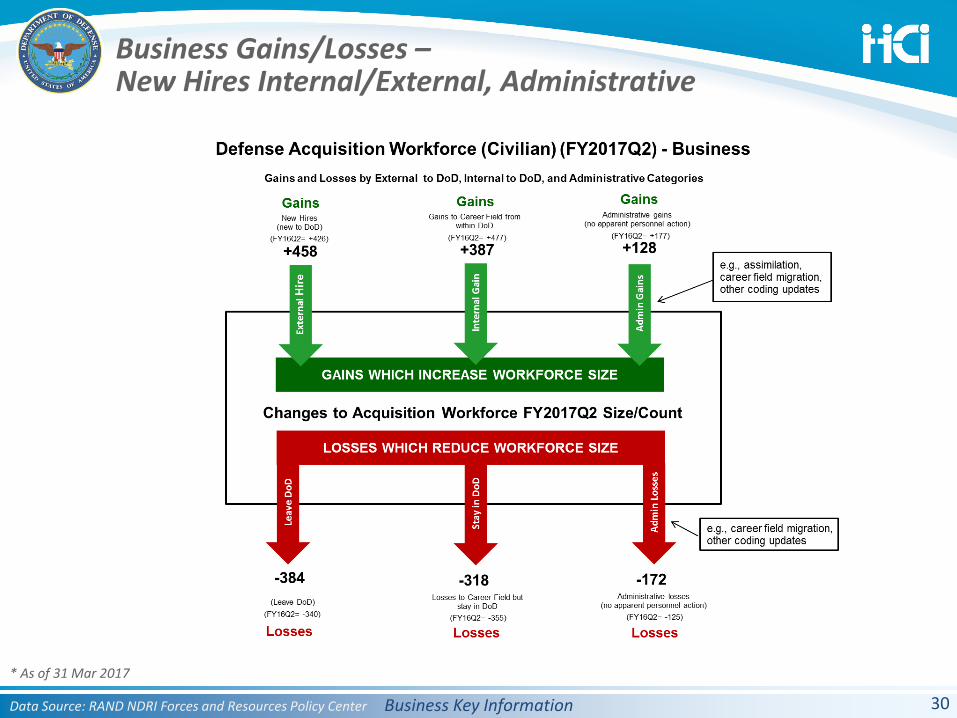
Business Gains/Losses –New Hires Internal/External, Administrative
30Data Source: RAND NDRI Forces and Resources Policy Center
* As of 31 Mar 2017
Business Key Information
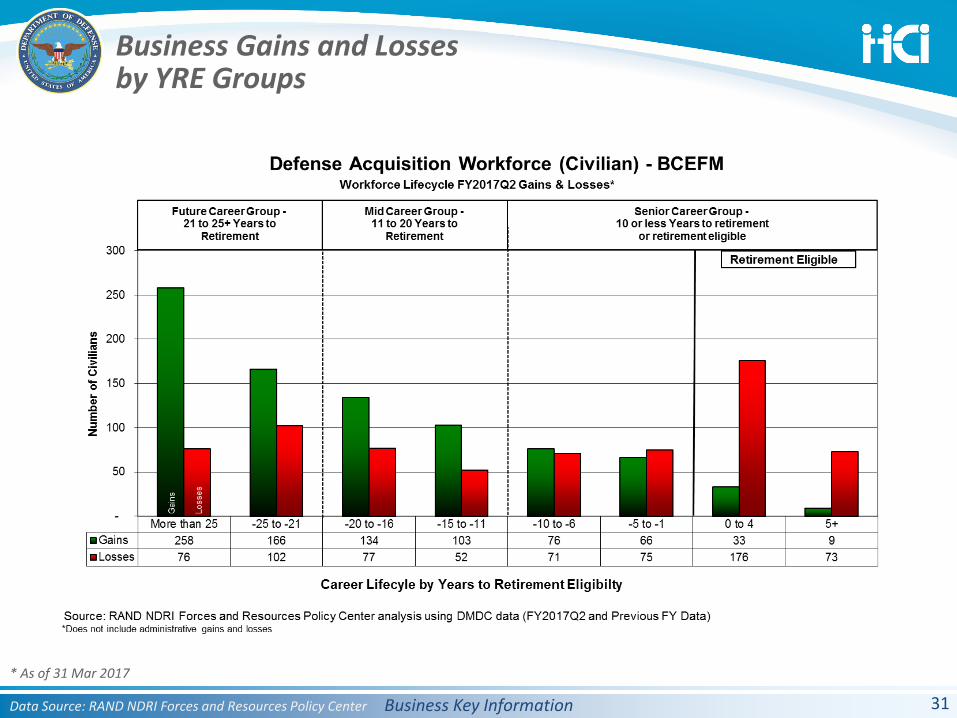
Business Gains and Lossesby YRE Groups
31Data Source: RAND NDRI Forces and Resources Policy Center
* As of 31 Mar 2017
Business Key Information
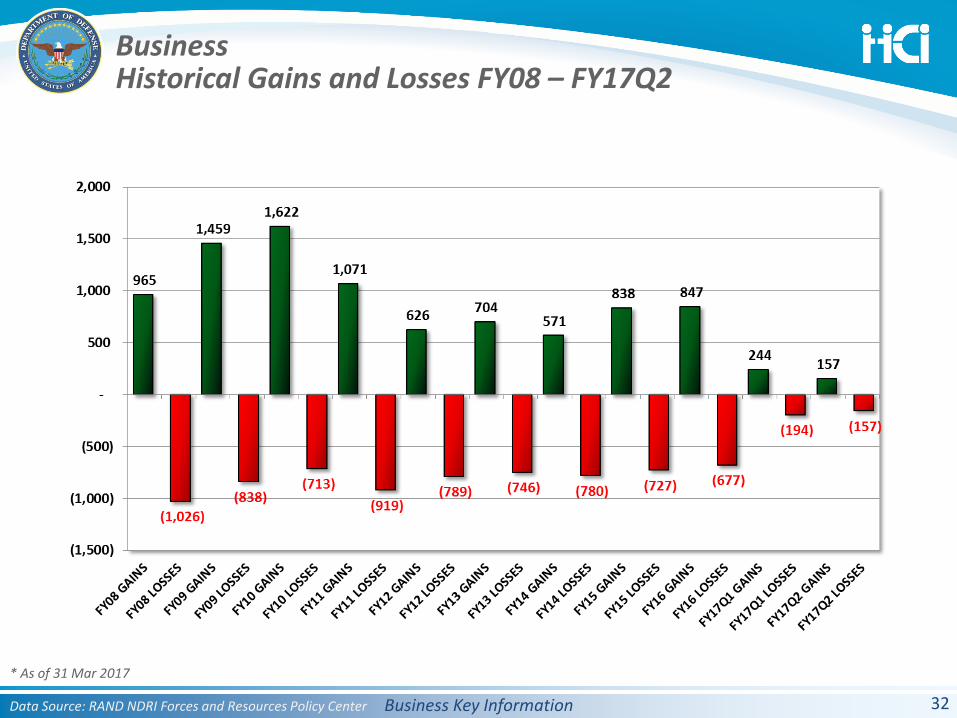
BusinessHistorical Gains and Losses FY08 – FY17Q2
32Data Source: RAND NDRI Forces and Resources Policy Center
* As of 31 Mar 2017

Business Key Information
Business Internal/ExternalGains % by Career Group
33Data Source: RAND NDRI Forces and Resources Policy Center
* As of 31 Mar 2017
Business Key Information
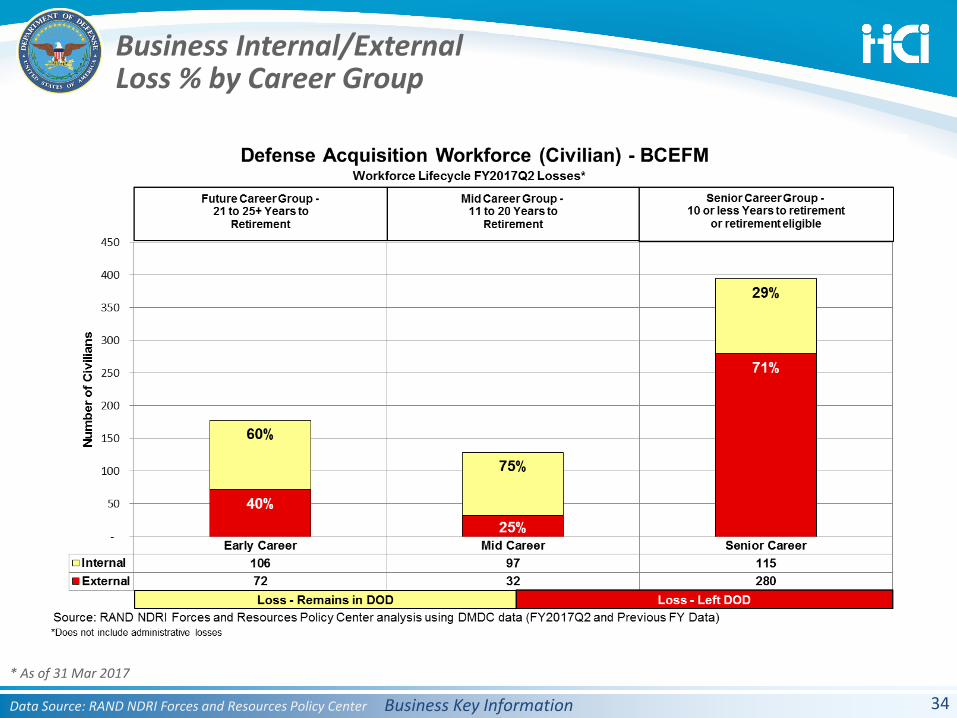
Business Internal/ExternalLoss % by Career Group
34Data Source: RAND NDRI Forces and Resources Policy Center
* As of 31 Mar 2017
Business Key Information
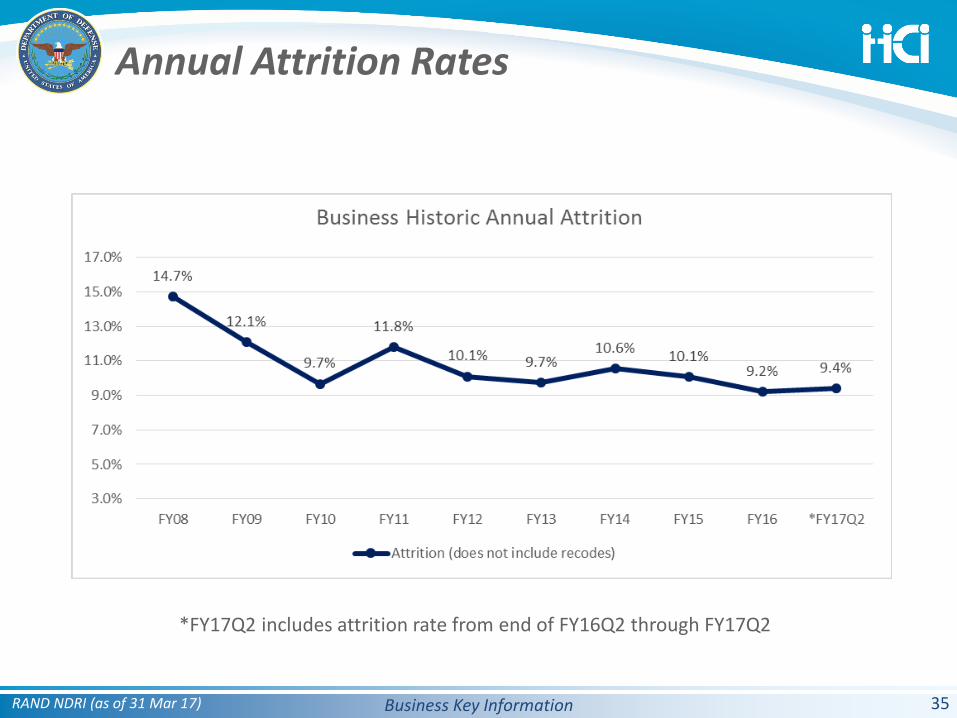
Annual Attrition Rates
35RAND NDRI (as of 31 Mar 17)
*FY17Q2 includes attrition rate from end of FY16Q2 through FY17Q2

Business Key Information
Business Attrition Rates by Career Group
36Data Source: RAND NDRI Forces and Resources Policy Center
* As of 31 Mar 2017
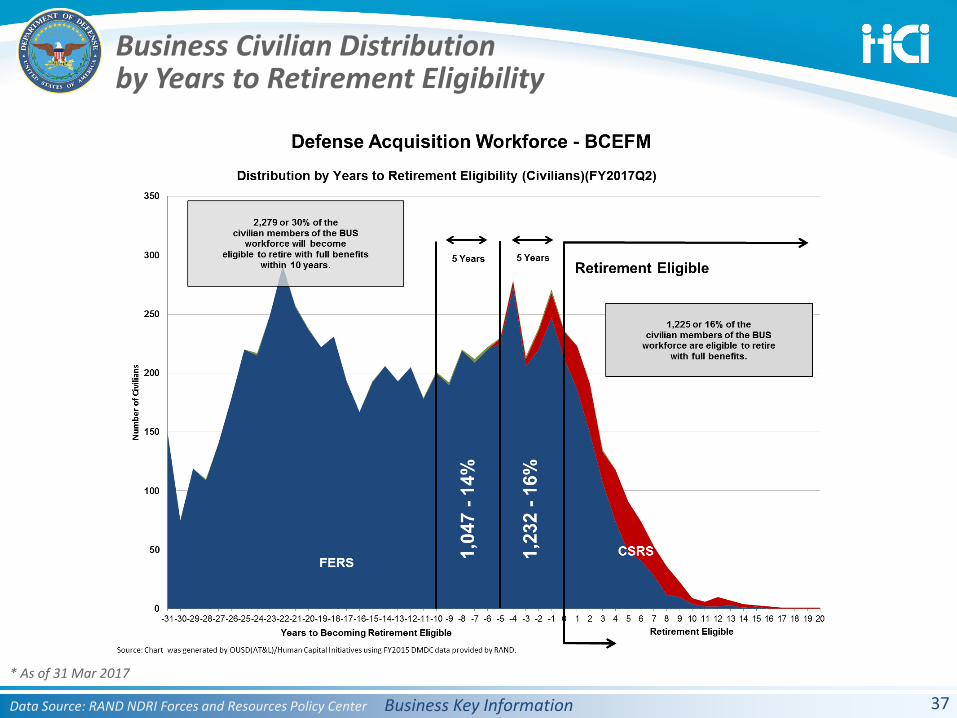
Business Key Information
Business Civilian Distributionby Years to Retirement Eligibility
37Data Source: RAND NDRI Forces and Resources Policy Center
* As of 31 Mar 2017
http://www.hci.mil/
END
38
Top Related