


Languages
Pages
Legal


Decoding task states from distributed local field potential recordings
By
Nicole Renee Provenza
Sc.B., Brown University, 2015
Thesis
Submitted in partial fulfillment of the requirements for the Degree of Master of Science in the
Center of Biomedical Engineering at Brown University
PROVIDENCE, RHODE ISLAND
MAY 2017

ii
This thesis by Nicole Renee Provenza is accepted in its present form by the Center of
Biomedical Engineering as satisfying the thesis requirements for the degree of Master of
Science.
Date: __________ Signature: ______________________________
Dr. David Borton, Advisor
Date: __________ Signature: ______________________________
Dr. Leigh Hochberg, Reader
Date: __________ Signature: ______________________________
Dr. Wilson Truccolo, Reader
Date: __________ Signature: ______________________________
Dr. Alik Widge, Reader
Approved by the Graduate Council
Date: __________ Signature: ______________________________
Dr. Andrew G. Campbell, Dean of the Graduate School

iii
VITA Nicole Renee Provenza was born on August 21st, 1993 to Sherri and Clint Provenza in Columbia,
MD. She attended Brown University for her undergraduate studies where she was a four-year
athlete and captain of the varsity swimming and diving team. She graduated in 2015 with a
Bachelor of Science in biomedical engineering with honors. Her honors undergraduate thesis
work is titled, ‘Mapping Parkinson’s disease progression as observed by the motor cortex’, and
was written under the advisement of Dr. David Borton. Nicole received the Draper Fellowship
for her master’s research in the Borton Laboratory at Brown University. During her master’s
program, she conducted research as part of the Defense Advanced Research Projects Agency
(DARPA) program, Systems-Based Neurotechnology for Emerging Therapies (SUBNETS), in
collaboration with Massachusetts General Hospital (MGH), Draper, and Brown University. After
graduation, she will enter the doctoral program in biomedical engineering at Brown University to
continue her research on distinguishing brain states relevant to the closed-loop treatment of
neuropsychiatric illness.

iv
PREFACE This work was conducted at Brown University in collaboration with Massachusetts General
Hospital (MGH - Boston, MA) and Draper (Cambridge, MA), as part of the Defense Advanced
Research Projects Agency (DARPA) program, Systems-Based Neurotechnology for Emerging
Therapies (SUBNETS) led by Principal Investigators Dr. Alik Widge, Dr. Emad Eskandar, Dr.
Sydney Cash, and Dr. Darin Dougherty. The MGH team conducted all clinical recordings and
performed data preprocessing steps including filtering, referencing, channel selection, and
electrode localization. The corresponding methods sections were generously provided by the
MGH team. Individual contributions are outlined below.
Human physiology was conducted by Dr. Sydney Cash, Britni Crocker, Kara Farnes, Dr. Todd
Herrington, Erica Johnson, Dr. Shaun Patel, and Nicole Rivilis. Animal lab work was conducted
by Dr. Angelique Paulk, Helen Deng,Madeleine Robertson. Neuro-Imaging was conducted by
Afsana Afzal, Dr. Thilo Deckersbach, Dr. Kristen Ellard, Anna Gilmour, Dr. Matti Hamalainen,
Dr. Roan LaPlante, Dr. Noam Peled, Dr. Steve Stufflebeam, and Sam Zorowitz. Analysis and
modeling was conducted by Dr. Ishita Basu, Dr. Emery Brown, Dr. Uri Eden, Dr. Mark Kramer,
Dr. Angelique Paulk, Nicole Provenza, Dr. Patrick Stokes, and Dr. Ali Yousefi. The program
was managed by Dr. Karl Helmer, Mark Helfant, Matthew Thombs, and Graham Warner.
Hardware was developed by Dr. Chris Salthouse, Jesse Wheeler, and Caroline Bjune.
Patents related to this work are currently under review at Massachusetts General Hospital and
Brown University.
This research was funded by DARPA under Cooperative Agreement Number W911NF-14-2-
0045 issued by the Army Research Office contracting office in support of DARPA’s SUBNETS
program. The views, opinions, and/or findings expressed are those of the authorand should not
be interpreted as representing the official views or policies of the Department of Defense or the
U.S. Government.
This work was sponsored by DARPA Biological Technologies Office under the auspices of Dr.
Doug Weber through the DARPA Contracts Management Office Grant/Contract No.
D15AP00112.

v
ACKNOWLEDGEMENTS Foremost, I wish to thank my advisor, Dr. David Borton, for his outstanding mentorship,
patience, enthusiasm, and encouragement. It has been a privilege and a joy to be a member of his
lab over the past three years. Next, I wish to thank my advisor-away-from-Brown, Dr. Alik
Widge, who generously welcomed me onto the MGH team, and whose expertise and enthusiasm
continues to guide my research. I would like to express thanks to Dr. Angelique Paulk for single-
handedly organizing all the data that made my thesis possible, and answering my endless
questions on all things data related and beyond. I owe a special thanks to Draper for their
encouragement and support of my continued academic pursuits, and believing in my research
enough to fund me twice. I’d like to thank my Draper supervisor, Dr. Marc McConley, who
continues to make sure I have everything I need to be successful. I would be remiss if I did not
mention my lab-mates at Brown University, who are a perpetual source of inspiration, humor,
and fun. Lastly, I am incredibly thankful for my parents, Sherri and Clint, sister, Christina, and
boyfriend, Robert, for celebrating my successes and lamenting my frustrations, and for their
invaluable love and support.

vi
TABLE OF CONTENTS
VITA .......................................................................................................................................................................... III
PREFACE ................................................................................................................................................................. IV
ACKNOWLEDGEMENTS ....................................................................................................................................... V
TABLE OF CONTENTS ......................................................................................................................................... VI
LIST OF FIGURES ................................................................................................................................................. VII
LIST OF TABLES ................................................................................................................................................. VIII
ABSTRACT .............................................................................................................................................................. IX
INTRODUCTION ....................................................................................................................................................... 1
Closed-loop deep brain stimulation for neuropsychiatric illness .............................................................................. 2 Observing functional connectivity via fMRI ............................................................................................................. 5 Observing functional connectivity via local field potential recordings ..................................................................... 9 Considerations for closed-loop algorithm development for implantable systems ................................................... 12 Specific Aims of the Study ...................................................................................................................................... 14
METHODS ................................................................................................................................................................. 16
Behavioral tasks ...................................................................................................................................................... 16 Patients .................................................................................................................................................................... 17 Electrode localization .............................................................................................................................................. 18 Invasive electroencephalography recordings .......................................................................................................... 20 Data preprocessing .................................................................................................................................................. 20 Feature extraction .................................................................................................................................................... 23 Classification ........................................................................................................................................................... 24 Feature selection ...................................................................................................................................................... 27 Evaluation of decoder stability ................................................................................................................................ 28
RESULTS ................................................................................................................................................................... 29
Functional inference distinguishes task engagement ............................................................................................... 29 Classification accuracy depends on a subset of optimal features per patient .......................................................... 32 Optimal feature sets shift over time ........................................................................................................................ 35 Training on temporally separated data shows potential for decoding stability ....................................................... 37
DISCUSSION ............................................................................................................................................................. 39
Classification performance ...................................................................................................................................... 39 Feature selection ...................................................................................................................................................... 42 Decoder stability ..................................................................................................................................................... 43 Applicability ............................................................................................................................................................ 45
CONCLUSIONS ........................................................................................................................................................ 47
REFERENCES .......................................................................................................................................................... 49
APPENDIX I: SUPPLEMENTAL METHODS ...................................................................................................... 54
APPENDIX II: INVENTION DISCLOSURE ........................................................................................................ 56
Essence of the invention .......................................................................................................................................... 56 Novelty and major advantages ................................................................................................................................ 56

vii
LIST OF FIGURES Figure 1: Disability-adjusted life years (DALYs) for mental illness .............................................. 1
Figure 2: Illustration of closed-loop DBS for PTSD. ..................................................................... 3
Figure 3: Illustrations of a transdiagnostic framework ................................................................... 4
Figure 4: Single subject fMRI response during MSIT.................................................................... 7
Figure 5: Functional connectivity illustration ................................................................................. 9
Figure 6: Canonical correlation is a robust metric for functional connectivity ............................ 11
Figure 7: Bipolar referencing. ....................................................................................................... 12
Figure 8: Schematics of the MSIT and ECR tasks ....................................................................... 17
Figure 9: Example electrode localization ..................................................................................... 20
Figure 10: High-pass filter removes frequency components less than 2 Hz................................. 22
Figure 11: Task and non-task dataset sizes. .................................................................................. 25
Figure 12: Classification pipeline for the identification of task-like brain states ......................... 26
Figure 13: Feature selection using SVM-Based criteria ............................................................... 27
Figure 14: Classification performance for MSIT vs. non-task classification ............................... 30
Figure 15: Classification performance for ECR tsak vs. nono-task classification ....................... 31
Figure 16: Window size effects on classification of CCA features .............................................. 32
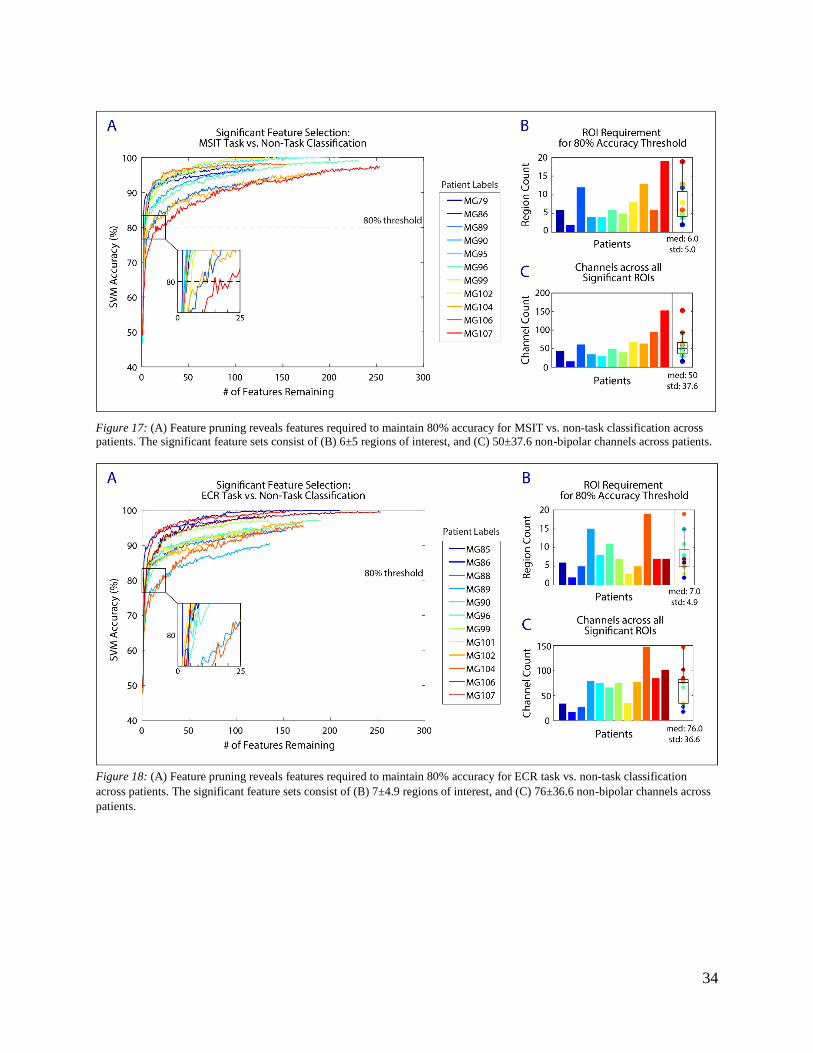
Figure 17: Feature pruning reveals significant features for MSIT ............................................... 34
Figure 18: Feature pruning reveals significant features for ECR task .......................................... 34
Figure 19: Example feature sets required to reach 80% accuracy for MSIT ................................ 35
Figure 20: Example feature sets required to reach 80% accuracy for ECR task .......................... 35
Figure 21: Feature pruning reveals significant features across multiple recording sessions ........ 36
Figure 22: Overlap in significant feature sets over multiple recording sessions .......................... 37
Figure 23: Classification performance across multiple recording sessions .................................. 38

viii
LIST OF TABLES Table 1: iEEG recording summary ............................................................................................... 21
Table 2: Bipolar electrode localization summary for the MSIT. .................................................. 54
Table 3: Bipolar electrode localization summary for the ECR task ............................................. 55
ix
ABSTRACT
The brain is a distributed network that operates at small and large spatial and temporal scales to
meet the needs of the task at hand. Certain tasks generate conflict by requiring attention to
relevant stimuli among distractions. Engagement in conflict-based tasks elicits network activity
that differentiates these tasks from other behaviors. Brain states associated with conflict in
experimental behavioral contexts may be an important marker of dysfunction related to
neuropsychiatric illness, yet there are no documented decoders that predict engagement in
conflict-based tasks. In addition, there is evidence that precisely timed deep brain stimulation
(DBS) could restore normal task behavior in neuropsychiatric patients; however, these findings
are constrained to features elicited during experimental behavioral tasks, and do not yet
generalize to real world situations. In the present study, the investigators have developed a
decoding strategy to accurately predict task engagement by harnessing canonical correlation
analysis (CCA), a measure of functional connectivity between regions, in tandem with a support
vector machine (SVM) classifier. Cortical and sub-cortical invasive local field potential
recordings were collected from patients engaged in one of two Stroop-like tasks: the Multi-
Source Interference Task (MSIT) or the Emotional Conflict Resolution task (ECR). Canonical
correlation coefficients were extracted by performing singular value decompositions on windows
of data across all channels within each region and transforming the resulting singular vectors in a
way that maximally correlates activity between each region pair. These CCA features were used
as inputs to an SVM classifier to differentiate functional connectivity between task engagement
and free behavior. A mean classification accuracy of 95.3% (MSIT med: 96.7 ± 2.3%, ECR med:
95.0 ± 3.2%) was achieved for both tasks across 14 patients and a subset of features per patient
required to maintain high accuracy were isolated (MSIT: med 3 ± 3.4 region pairs, ECR: med 4
± 6.6 region pairs). The reduced feature set can be used to reduce the computational complexities
of the algorithm moving forward, which points to potential tractability for driving a simple
algorithm to detect task engagement on existing systems. While decoder stability was not
achieved over two recordings, classification accuracy improved when trained on both recordings.
This increase in accuracy suggests that training the classifier on many temporally separated
datasets could improve its stability. Detection of task-associated brain states could ultimately be
a closed-loop strategy for delivering real-time therapy to patients with neuropsychiatric illness.

1
INTRODUCTION
Mental illness is the leading cause of disability worldwide (Figure 1).1 Despite its prevalence,
mental illness has historically not been a global health priority. Only in recent generations have
clinicians and researchers begun to approach mental illnesses as brain circuit disorders.2,3
Despite the efforts of researchers and clinicians over the past several decades, current treatment
options still do not meet patient needs. For example, antidepressant medications commonly
prescribed for depressive disorders are only 30%-40% efficacious at best.4,5 Psychotherapy is
more effective in some cases, however, well-trained therapists are expensive and often
inaccessible for most patients.6
Figure 1: Adapted from Whiteford et al. (2013). Disability-adjusted life years (DALYs) for mental and substance use disorders in
2010, shown by age.
Deep brain stimulation (DBS) has recently emerged as a candidate for improving treatment
outcomes for patients suffering with neuropsychiatric illness. We have known for decades that
targeted stereotactic lesions can be effective for refractory obsessive compulsive disorder (OCD),
and depression.7–11 DBS has long been known as a means for the rapid and reversible modulation

2
of neural function, and may reproduce the lesioning effects in a reversible manner. While DBS
showed early promise for treatment of refractory MDD and OCD12–14, results were not replicable
during randomized controlled clinical trials.15,16 DBS is available for OCD patients under a
humanitarian device exemption17, but is currently not clinically approved for any other
neuropsychiatric disorders. The disappointments of past clinical trials could perhaps be explained
by the open loop nature of traditional DBS that fails to address the dynamic nature of
neuropsychiatric illness.6 In the following section, we will discuss potential avenues for
addressing this limitations.
Closed-loop deep brain stimulation for neuropsychiatric illness
Truly harnessing the full potential of DBS will require the development of systems that are
capable of adjusting stimulation parameters based on detected neural signatures or mental states
related to patient symptoms.18 An adaptive treatment strategy is ideal for neuropsychiatric
illness, as symptoms of neuropsychiatric illness are not static. Instead, symptoms flare and
resolve over a wide range of temporal scales depending on the illness, ranging from minutes to
days. Traditional open loop DBS delivers constant stimulation without regard to patient
symptoms, and adjustments in stimulation parameters are only possible during infrequent clinical
visits. A ‘closed-loop’ DBS system would deliver stimulation to modulate patient brain activity
in real-time only when needed, and allow for remote adjustments of parameters.
As an example, we will discuss how closed-loop DBS could be used to treat patients suffering
with post-traumatic stress disorder (PTSD). Our choice of PTSD is motivated by its prevalence
among soldiers and veterans after returning from combat in Iraq and Afghanistan (approximately
20% of soldiers exposed to combat meet the criteria for PTSD19,20). During closed-loop DBS for
PTSD, implanted electrodes would continuously monitor brain activity. Collected neural activity

3
would then be sent to an implanted device to decode brain states via feature estimation and
classification. When a brain state related to psychological distress is detected, specific
stimulation commands would be sent back to electrodes (Figure 2). Stimulation would ideally
nudge the network out of the distressed state to relieve symptoms.
Figure 2: Illustration of closed-loop DBS for PTSD.
One essential component to enable a closed-loop DBS system is the identification of the neural
signatures of neuropsychiatric illness. Despite progress in recent years, investigators have not yet
identified definitive, stable biomarkers for neuropsychiatric illness. A major challenge for
identifying disease-specific biomarkers is that phenotypes overlap between multiple diagnoses,
and phenotypes are not homogenous for single diagnoses. One proposition toward overcoming
this hurdle is identifying biomarkers that pertain to phenotype, rather than diagnosis. For
example, Figure 3A illustrates how three patients with different diagnoses (TBI: traumatic brain
injury, GAD: generalized anxiety disorder, and MDD: major depressive disorder) share an

4
overlapping phenotype, in that they all demonstrate cognitive rigidity and are unable to adapt in
changing environments. Conversely, Figure 3B illustrates how three patients with the same
diagnosis, MDD, do not share overlapping phenotypes. One patient exhibits emotional lability,
while another patient is emotionally flat.6
Figure 3: Adapted from Widge et al 2017. Illustrations of a transdiagnostic framework dependent on phenotypic symptoms
relating to cognitive flexibility, emotional lability, and approach and avoidance to stimuli.
Before the realization of closed-loop DBS as a clinically relevant therapy for patients, it will be
essential to identify biomarkers of specific phenotypes exhibited by patients suffering with
neuropsychiatric illness. Much of what we know about potential biomarkers of neuropsychiatric
illness has been derived from fMRI paradigms designed to expose specific differences in
behavior and regional connectivity between healthy participants and neuropsychiatric patients.
However, current closed-loop platforms rely on local field potential (LFP) activity rather than
fMRI activity. fMRI is not conducive to delivering closed-loop therapy for many reasons; most
obviously, it is not portable and has poor temporal resolution. In addition, robust LFP activity
can be recorded from electrodes long after they are implanted, and LFPs can be recorded from
electrodes during ongoing DBS.21 While identifying biomarkers rooted in LFP recordings is the
goal, the wealth of knowledge derived from fMRI study findings offer a starting point that
should guide future invasive analysis.

5
Observing functional connectivity via fMRI
The brain consists of a network of regions that perform distinct, separable functions. The flow of
information within the network is coordinated by modulating the strength, pattern, and frequency
of neural activity. Specific patterns of synchrony between individual neurons, populations of
neurons, or entire brain regions are associated with complex behaviors, such as attention and
conflict resolution. In other words, brain regions are functionally connected. Observing and
quantifying functional connectivity between regions of interest (ROIs) during different tasks is a
classic strategy for gaining insight on the link between neural activity and behavior.
Observing functional connectivity during task-based imaging studies has greatly contributed to
relating brain states to abnormal behavior observed during neuropsychiatric illness. In particular,
abnormalities in the anterior cingulate cortex (ACC) have been observed in the pathophysiology
of neuropsychiatric illness, including attention deficit disorder (ADD)22,23, anxiety disorders24,25,
OCD26, and PTSD8. Based on many single unit recording studies in nonhuman primate literature,
we know that the dorsal anterior cingulate cortex (dACC) is not a homogenous region and
instead is composed of distinct cognitive, emotional, and motor subdivisions.27–31 Hinging on
implications of ACC activity for neuropsychiatric illness, tasks have been developed to reliably
activate each distinct subdivision to better relate neural activity to behavior. To focus the scope
of the discussion, we will discuss two tasks related to conflict interference and resolution, and
associated findings. We will later present data from these tasks in our results.
The Multi-Source Interference Task

6
The Multi-Source Interference Task (MSIT) is designed to maximize cognitive interference and
dACC activation to study attention, response selection, and cognition. Elements of the Stroopa,
Eriksenb, and Simonc interference effects32–35, which are all known to activate the dACC during
group analysis, were combined in MSIT to maximally activate the dACC. During MSIT,
participants are given a keypad and instructed that the buttons represent the numbers one, two,
and three from left to right. Sets of three numbers are presented as stimuli, where one number is
different than the other two. Participants are asked to report the value of the unique number,
regardless of its position and the value of the distractors. During congruent trials, the target
number is placed in the position that corresponds to its value. During incongruent trials, the
target number is placed in a position that does not correspond to its value, and reaction time
increases.35,36
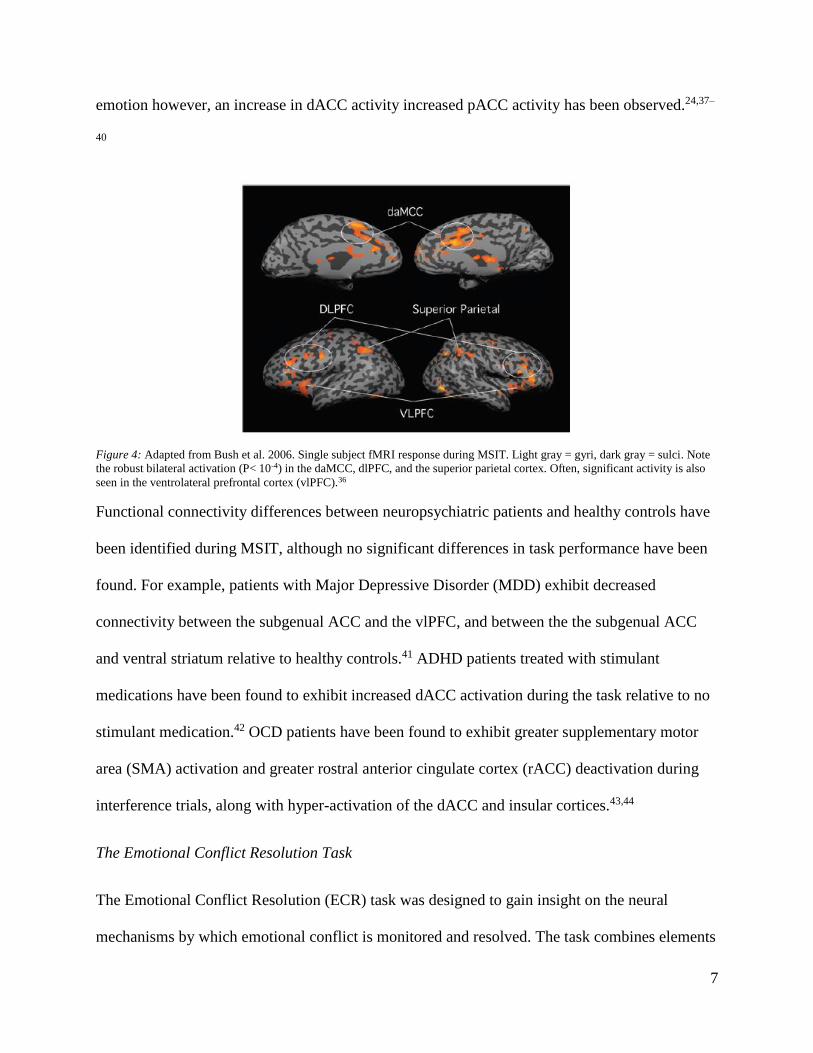
MSIT improves upon previous interference based tasks by reliably and robustly activating the
cingulo-frontal-parietal (CFP) cognitive/attention network during interference trials at the single
subject level (Figure 4).35,36 The CFP is composed of the dACC, dorsolateral prefrontal cortex
(dlPFC), and superior parietal cortex. In addition, consistent with the results of other complex
cognitive tasks, the perigenual anterior cingulate cortex (pACC) has been found to respond
reciprocally to dACC activation. During studies of complex cognitive tasks, an increase in dACC
activity is associated with a decrease in pACC activity, and vice versa. During tasks involving
a During the Color Stroop task, participants are asked to report the color ink a word is written in, ignoring the color
word, and have slower reactions when the color ink the word is written in different than the color word (e.g. blue ink
color, when the color word is ‘red’). b During the Eriksen Flanker tasks, participants are asked to report a centrally located target letter, ignoring letters
that flank the target letter. Reaction times are slower when flanker letters are different than the target letter (e.g.
‘DDTDD’, rather than ‘TTTTT’). c During the Simon task, participants are asked to press a button on the right when they see a red stimulus, and a
button on the left when the see a green stimulus. Reaction times are slower when the relative spatial location of the
stimulus is farther from the target button (e.g. red stimulus on the left of the screen).
7
emotion however, an increase in dACC activity increased pACC activity has been observed.24,37–
40
Figure 4: Adapted from Bush et al. 2006. Single subject fMRI response during MSIT. Light gray = gyri, dark gray = sulci. Note
the robust bilateral activation (P< 10-4) in the daMCC, dlPFC, and the superior parietal cortex. Often, significant activity is also
seen in the ventrolateral prefrontal cortex (vlPFC).36
Functional connectivity differences between neuropsychiatric patients and healthy controls have
been identified during MSIT, although no significant differences in task performance have been
found. For example, patients with Major Depressive Disorder (MDD) exhibit decreased
connectivity between the subgenual ACC and the vlPFC, and between the the subgenual ACC
and ventral striatum relative to healthy controls.41 ADHD patients treated with stimulant
medications have been found to exhibit increased dACC activation during the task relative to no
stimulant medication.42 OCD patients have been found to exhibit greater supplementary motor
area (SMA) activation and greater rostral anterior cingulate cortex (rACC) deactivation during
interference trials, along with hyper-activation of the dACC and insular cortices.43,44
The Emotional Conflict Resolution Task
The Emotional Conflict Resolution (ECR) task was designed to gain insight on the neural
mechanisms by which emotional conflict is monitored and resolved. The task combines elements

8
from the Stroop task1, and the emotional Stroop taskd.32,45,46 Unlike the classic Stroop task, there
is no element of interference in the emotional Stroop task, as the meaning of the word is
irrelevant to the task (i.e. distracting information does not lead to responses that compete with
the correct response option). During the ECR task, participants are presented with photos of
faces with fearful or happy expressions, with the words ‘happy’ or ‘fear’ overlaid across them.
Subjects are asked to identify the emotion of the facial expression while ignoring the text. During
congruent trials, the facial expression and word match. During incongruent trials, the facial
expression and word do not match, and reaction times increase. As compared to the emotional
Stroop task, there is an emotional interference effect elicited by the ECR task.47
The ECR task generates robust neural activity related to the amount and resolution of emotional
conflict on a trial-to-trial basis. Activity in the amygdala, dorsomedial prefrontal cortex
(dmPFC), and the dlPFC reflect the amount of behavioral conflict, while activity in the rostral
cingulate cortex is related to reduction in conflict. Activation of the rostral cingulate is
accompanied by a simultaneous decrease in amygdala activation. This inhibitory relationship
suggests that the rostral cingulate cortex may resolve conflict through top-down inhibition of the
amygdala, whereas the dmPFC and the dlPFC monitor conflict.47
Functional connectivity differences between neuropsychiatric patients and healthy controls
during the ECR task have implications for mood and anxiety disorders. Patients with generalized
anxiety disorder have been found to be completely unable to regulate emotional conflict during
the ECR task as compared to both healthy controls and patients with depression.48,49 Separate
from the ECR task, findings from many studies support the notion that rostral cingulate
d During the emotional Stroop task, participants are asked to report the color ink a word is written in, ignoring the
content of the word. Words are either emotionally salient (e.g. ‘death’) or emotionally neutral (e.g. ‘chair’). Reaction
times are either not affected at all, or habituate rapidly.

9
inhibition of the amygdala is important for resolving emotional conflict. PTSD patients show a
hypoactive rostral cingulate during the recollection of trauma50 and the severity of symptoms
correlates with the degree of rostral cingulate hypoactivation.8 The hypoactivity of the rostral
cingulate cortex is also related to refractory depression51 and predicts a poor response to
antidepressant medications.52
Observing functional connectivity via local field potential recordings
While functional connectivity in humans has traditionally been explored during task-based fMRI
studies, functional connectivity can be estimated from data types that vary widely in temporal
and spatial scales, including EEG and ECoG (Figure 5). Accordingly, it is necessary to develop
methods to assess functional connectivity during high-density multi-sensor Local Field Potential
(LFP) recordings. In particular, we are motivated to measure functional connectivity via LFP
recordings to identify the neural signatures of neuropsychiatric illness.
Figure 5: Brain regions communicate by changing the strength, pattern, and frequency of neural activity in space and time. The
signal can be broken down into frequency components. If two signals are oscillating at the same frequency with a phase lag, we
can say they are oscillating in synchrony and draw conclusions about functional connectivity.
Quantifying functional connectivity poses challenges for researchers, who are tasked with
choosing a meaningful metric and interpreting results. Many metrics have been developed, each
with its own advantages and limitations. To focus the scope of this discussion, we will discuss
the advantages and limitations of one method, canonical correlation analysis, in terms of closed-
loop feature identification for neuropsychiatric illness.
10
Canonical correlation analysis
Canonical correlation analysis (CCA) is a robust tool for detecting connectivity between pre-
defined ROIs. During CCA, individual sensors are grouped into pre-defined anatomical ROIs.
Variability within individual regions is assessed through singular value decompositions on all the
sensors grouped to each region. Then, the resulting singular vectors are transformed in a way that
maximally correlates activity between each region pair. The technique both reduces the
dimensionality of the network from individual sensors to ROIs and successfully estimates spatial
correlation between ROIs.53
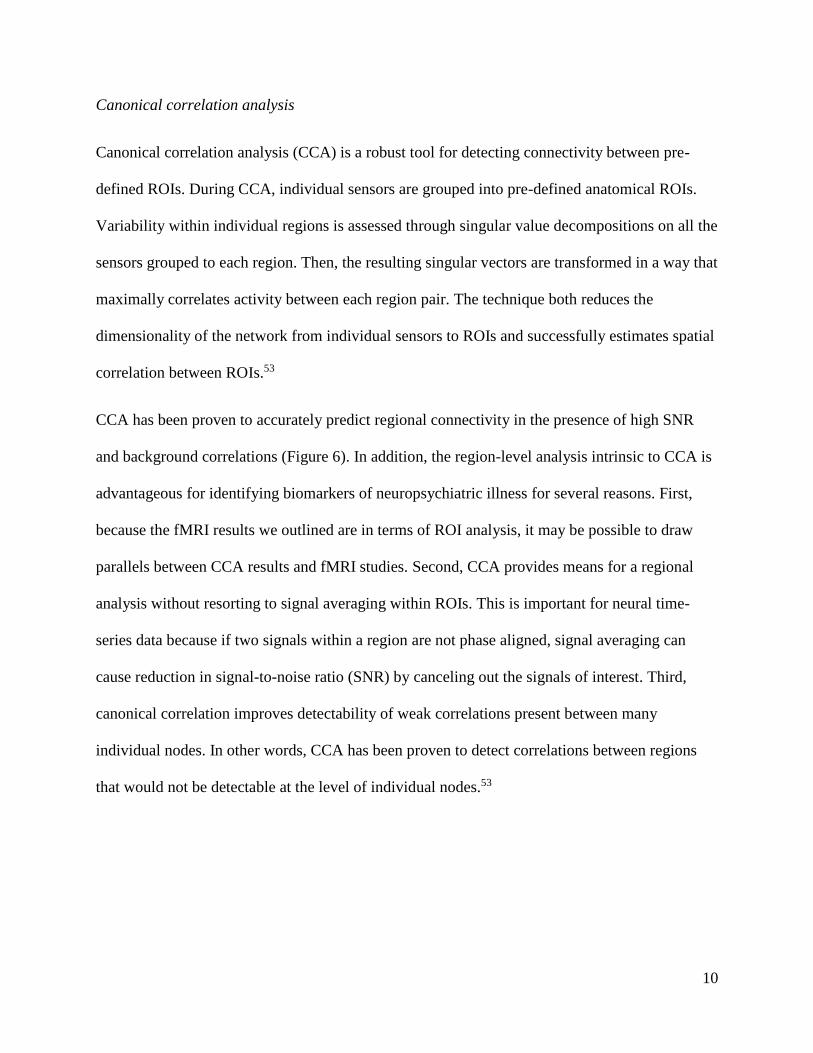
CCA has been proven to accurately predict regional connectivity in the presence of high SNR
and background correlations (Figure 6). In addition, the region-level analysis intrinsic to CCA is
advantageous for identifying biomarkers of neuropsychiatric illness for several reasons. First,
because the fMRI results we outlined are in terms of ROI analysis, it may be possible to draw
parallels between CCA results and fMRI studies. Second, CCA provides means for a regional
analysis without resorting to signal averaging within ROIs. This is important for neural time-
series data because if two signals within a region are not phase aligned, signal averaging can
cause reduction in signal-to-noise ratio (SNR) by canceling out the signals of interest. Third,
canonical correlation improves detectability of weak correlations present between many
individual nodes. In other words, CCA has been proven to detect correlations between regions
that would not be detectable at the level of individual nodes.53
11
Figure 6: Adapted from Stephen et al., (2014). Network diagrams show that CCA detects correlation between regions in the
presence of varying signal to noise ratios (A), and background correlations (B).53
Mitigating spurious functional connectivity estimates
Measured signals contain both the signal of interest, signals of no interest, and noise, which
means that nonzero connectivity estimates do not always imply direct interaction between
regions, regardless of the chosen metric.54 For example, local field potential recordings are often
referenced with one distant scalp electrode. Fluctuations in electric potential that occur at the
reference location may be reflected in neighboring electrodes. Therefore, the reference signal
common across different channels gives rise to spurious connectivity estimates.
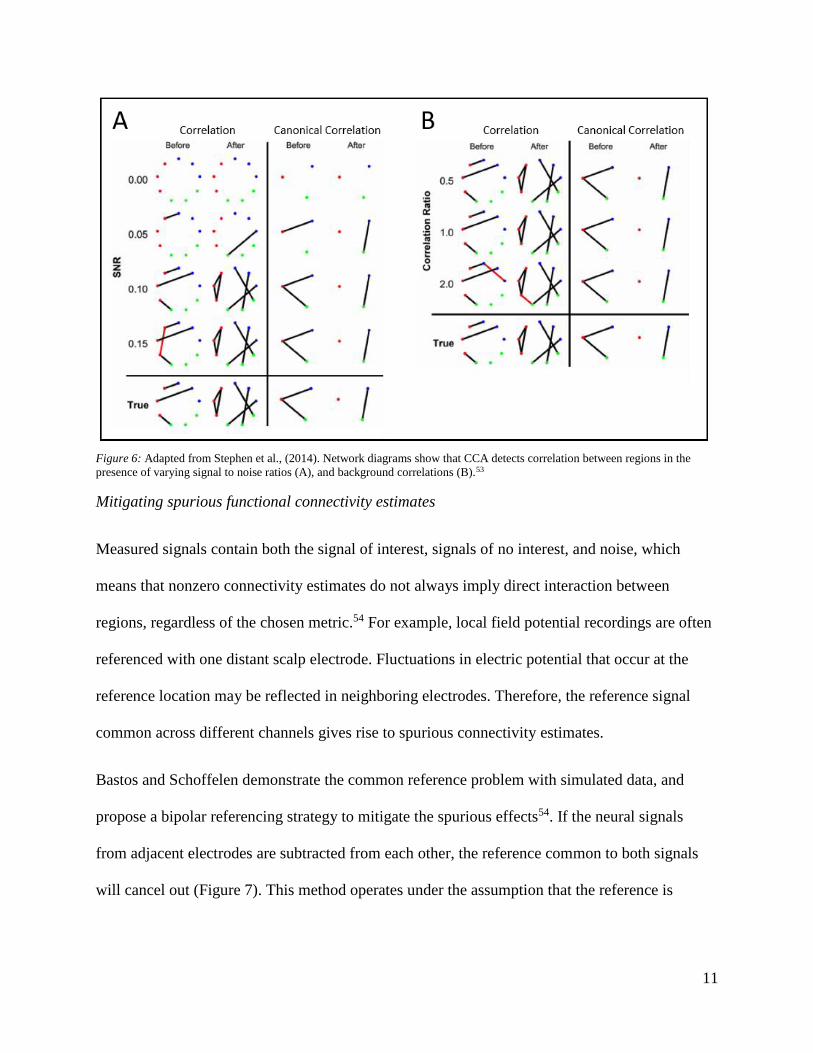
Bastos and Schoffelen demonstrate the common reference problem with simulated data, and
propose a bipolar referencing strategy to mitigate the spurious effects54. If the neural signals
from adjacent electrodes are subtracted from each other, the reference common to both signals
will cancel out (Figure 7). This method operates under the assumption that the reference is

12
equally present in each channel, and that each channel reflects a different mixture of underlying
neural signals.
Figure 7: Adapted from Bastos and Schoffelen (2015)54. (A) Data 1 and Data 2 reflect both the signal of interest and the common
reference signals. When the sources are not coupled through the simulation, a spurious coherence estimate appears. If the sources
are coupled, the coherence estimate reflects both coupling and the spurious estimate. (B) Signals from adjacent electrodes are
subtracted from each other during a bipolar referencing scheme. When the sources are not coupled via the simulation, there is no
spurious coherence estimate.
Considerations for closed-loop algorithm development for implantable systems
Evaluation of performance
Requirements for acceptable levels of sensitivity and specificity for brain machine interfaces
(BMIs) are not standard and should depend on clinical application. Performance standards for
assistive communication devices might be different than performance standards for seizure
detection. For example, in one recent study, a 70% accuracy was claimed to be good enough for
severely-disabled amyotrophic lateral sclerosis (ALS) patients using a BCI for
communication.55,56 However, if seizure detection was only 70% accurate, patients would still
13
not be able to risk participating in activities of daily life (e.g. driving).57 Many BMI studies
report classification performance only in terms of specific utility, and define the threshold of
success based on patient surveys. For example, for assistive communication BMIs, success rates
are often reported in characters typed per minute.58
Latency between state onset and delivery of therapy is another important consideration for
closed-loop algorithm performance, and is likewise dependent on application. For example, brain
states associated with cursor control are transient and require immediate action timescales less
than one second. However, brain states associated with neuropsychiatric illness might wax and
wane over minutes (e.g. anxiety, PTSD) to days (e.g. bipolar disorder, depression).6 Computation
of neural features must be computed in time to detect and treat neuropsychiatric illness as brain
states evolve and symptoms arise.
In addition to achieving high performance, closed-loop decoding algorithms must be reliable.
Because the neural features of neuropsychiatric illness are still unknown, we do not know if the
features will be constant over time. Motor BMI studies indicate that any closed-loop algorithm
based on neural signals will likely require both frequent recalibrations and online updating to
reduce non-stationarities.59–61
Successful demonstrations of closed loop DBS
Research for more than a decade has focused on developing ‘closed-loop’ or ‘adaptive’ DBS
systems to improve upon traditional open-loop DBS therapy. A closed-loop system could reduce
latencies for therapy adjustments, and allow for therapies to be tailored based on patient needs.
Recent demonstrations of closed loop DBS for Parkinson’s disease and epilepsy are promising
for the future of closed-loop DBS.62–64 However, these demonstrations were not fully

14
implantable. Instead, they relied on data streaming to an external computer that detected state
and streamed commands back to the stimulator accordingly.
Computational and power limitations
There has been progress on developing platforms for fully implantable closed-loop systems that
give insight on computational and power limitations of future implantable closed-loop devices.
For example, Afshar et al. (2013) developed an investigational platform for an implantable
device that delivers stimulation. They tested the system using a classifier based on a simple
thresholding algorithm, and estimated that their device would draw 10% less power than current
open-loop devices used for Parkinson’s disease.65
More recently, Khanna et al. (2015) deployed a fully implantable, externally programmable
closed-loop system by providing a firmware update to the investigational Medronic Activa PC +
S system. Because the firmware update is noninvasive, the system acts as a platform for testing
closed-loop strategies in clinical trial patients already implanted with PC+S. Through offline
analysis, they estimated that a closed loop paradigm based on a simple thresholding algorithm
would draw less current than open-loop stimulation. Assuming that stimulation would be on for
90% of waking hours (based on testing), they estimate that closed-loop stimulation would still
draw 26% less current than open-loop mode.66
Specific Aims of the Study
Engaging in effortful mental action, such as trying to decide between conflicting choices or
suppress an unwanted emotion, activates specific brain networks. This activity might
differentiate one behavior from another. Detecting these specific brain states might help us
understand how the brain becomes dysfunctional in neuropsychiatric illness, including but not

15
limited to anxiety, depression, bipolar disorder, substance abuse, attention deficit disorder, post-
traumatic stress disorder, and traumatic brain injury. It would be possible to identify when a
patient is trying to do a critical mental task, but failing. An intervention, like deep brain
stimulation (DBS), could be applied to augment the brain's function during that specific effort.
To our knowledge, there are no documented algorithms for classifying engagement in effortful
mental action based on electrical activity in the brain. In the present study, we aim to predict
human task engagement by exploiting patterns of functional connectivity in cortical and sub-
cortical local field potential recordings. Our specific aims are outlined below:
Aim 1: Design a classification algorithm that distinguishes task engagement from free behavior.
(1.1) We will select neural features that distinguish periods of task engagement from periods of
free behavior. (1.2) Using the neural features as input, we will design a classifier that will
accurately predict task vs. non-task engagement.
Aim 2: Identify a subset of neural features critical for high classification performance. (2.1) We
will identify a subset of the features critical to classification performance. (2.2) We will compare
the identified feature sets across patients.
Aim 3: Evaluate decoder stability over time. (3.1) We will evaluate classification performance
over multiple recording sessions during which the patient was engaged in the same task.

16
METHODS
Behavioral tasks
Participants engaged in either one or two conflict based tasks: the Multi-Source Interference
Task (MSIT) and the Emotional Conflict Resolution (ECR) task. During both tasks, stimuli were
presented with software (either Presentation® by Neurobehavioral Systems or Psychophysics
Toolbox 67–69).
MSIT in the epilepsy monitoring unit was composed of at least one and up to five 64-trial blocks.
During each trial, images were presented for two seconds with a fixation cross-presented for
between two and four seconds between images. Images were three numbers between zero and
three. One of the numbers, the ‘distractor,’ was different than the other two. Participants were
given a keypad and instructed that keypad numbers one, two, and three represented the numbers
that appeared on the screen from left to right. Participants were then instructed to identify the
distractor by pressing the button corresponding to its value, ignoring its position. The value of
the distractor either matched the button corresponding to its position (congruent) or did not
match (incongruent) for each trial (Figure 8A).35,36 Congruence changes from trial to trial were
evenly balanced in number and frequency within each block.
The ECR task in the epilepsy monitoring unit was composed of at least one and up to six 64-trial
blocks of images presented for one second with a fixation cross presented for between two and
four seconds between images. Images were emotive faces cropped to show either happy or
fearful expressions, drawn from a set of expressions with five identifiable male faces and six
identifiable female faces.47 The words “FEAR” and “HAPPY” were overlaid on the faces such
that the word and expression either matched (congruent) or did not match (incongruent) for each

17
trial (Figure 8B). The images were presented in a pseudorandom order such that the identity,
gender, and valence (fear or happy) were shown randomly, though the congruence changes were
balanced within each block.
Figure 8: Schematics of the MSIT (left) and ECR (right) conflict-based tasks. During MSIT, the participant is asked to report the
value of the distractor, ignoring its position. During the ECR task, the participant is asked to report the emotion of the facial
expression, ignoring the text.
Patients
Fourteen participants, each with a history of long-standing pharmaco-resistant complex partial
seizures, underwent clinically-indicated invasive monitoring as part of the process of confirming
hypothesized seizure focus. Our research on neural activity during the MSIT and ECR tasks was
completed while the patients were in the hospital awaiting seizures for clinical mapping of foci.
The decision to implant electrodes and the number, types, and location of implantations were all
determined on clinical grounds by a team of caregivers independent of this study. Participants
were informed that participation in the experiment would not alter their treatment in any way and
that they could withdraw at any time without jeopardizing their clinical care. Each patient gave
fully informed consent according to NIH guidelines, and all procedures were approved by the
local institutional review board at Partners Healthcare (Massachusetts General Hospital).

18
Depth electrodes were stereotactically implanted to monitor and identify seizure foci. The
implantation procedure involved placing the patient under general anesthesia, followed by
implantation of multi-lead depth electrodes in stereotactically identified regions (Ad-tech,
Wisconsin, USA). Depth electrodes (Ad-tech Medical, Racine WI, USA, or PMT, Chanhassen,
MN, USA) consisted of 8-16 platinum/iridium-contact leads 2.4 mm long. Angled electrode
trajectories were achieved through a ROSA® robotic stereotactic system (Med-Tech,
Montpellier, France). The patients received bilateral electrodes ranging from five to nine
electrodes in the right hemisphere, and five to eight electrodes in the left hemisphere.
Electrode localization
Electrodes were localized by using a volumetric image co-registration procedure (Figure 9).
Using Freesurfer scripts (http://surfer.nmr.mgh.harvard.edu), the preoperative T1-weighted MRI
(showing brain anatomy) was aligned with a postoperative CT (showing electrode locations).
Electrode coordinates were manually determined from the CT and placed into the native space.70
Mapping to brain regions was performed using the electrode labeling algorithm (ELA) below.
Signal source for local field potentials are typically related to dipole source localization. The
main purpose of the ELA is to estimate the probability that a particular brain region contributes
to the dipoles that constitute the source of the signal. The ELA uses a purely anatomical
approach. Electrodes implanted in the brain receive signals from multiple sources, including
white matter and gray matter. Current thought proposes that signals are generated from grey
matter (whether cortical or subcortical), while white matter simply provides fibers for the signal
to pass through. We developed a simple and approachable ELA to identify the signal source by
identifying the probability that a given electrode is in a labeled region of the brain (gray matter).

19
Using the Freesurfer software and DKT (Desikan-Killiany-Tourville) brain atlas, we mapped the
brain electrodes to regions.71,72
The ELA operates with the assumption that the probability for each label to be a source of a
given electrode is estimated based on the Euclidean distance between the electrode and the brain
label that can be defined as brain label voxels and electrode voxels. Brain label voxels are all
voxels where at least one of the label vertices is positioned inside the voxel volume as mapped in
the structural MRI. Electrode voxels where the distance from the center of the electrode is
smaller than a given threshold, Dc, circumscribe a 3D cloud around the electrode. We chose Dc
to be 3mm. Each electrode is modeled as a three-dimensional thin cylinder oriented in a specific
direction. To estimate the probability, the ELA counts the number of intersection voxels between
the electrode voxel cloud and the label voxels and divides that count by the number of electrode
voxels. The output of the algorithm is an E x L matrix, X, where E is the electrodes number and L
is the number of the label. Xij is the probability that electrode i is getting a signal from label j.
In the case where no label voxels intersect with the electrode voxels for a given electrode, Dc is
expanded by ΔDc and the length is increased by Δl. We chose ΔDc to be 0.5mm and Δl to be
1mm. This expansion continued until we found a detectable intersection between the label voxel
and the electrode voxels, then decreased the probability the electrode is in each label. Therefore,
an electrode in white matter will have a low probability of existing within a label, while an
electrode entirely encased in grey matter will have a high probability of being within a label. The
number of bipolar electrodes assigned to each label is included in Table 2 and Table 3 of
Appendix I.

20
Figure 9: Example electrode localization using the ELA algorithm. The right panel shows electrode locations determined by
manual alignment of the pre-operative T1 weighted MRI and post-operative CT scan. The right panel shows the output of the
ELA algorithm – each electrode is assigned to a particular region of interest, including the dorsolateral prefrontal cortex (dlPFC),
dorsomedial prefrontal cortex (dlPFC), orbitofrontal cortex (OFC), ventrolateral prefrontal cortex (vlPFC), cingulate cortex,
temporal lobe, insula, hippocampus, caudate, and amygdala (for this particular patient dataset).
Invasive electroencephalography recordings
Intracranial local field potential (LFP) recordings were acquired using one or two Neural Signal
Processor (NSP) recording systems (Blackrock Microsystems Inc., Salt Lake City, UT) at a
sampling rate of 2 kHz. Table 1 includes a summary of the invasive electroencephalography
(iEEG) LFP recordings collected per patient. At the time of acquisition, depth recordings were
referenced to one scalp EEG.
Data preprocessing
Data analysis was performed using custom analysis code in Matlab (MathWorks) and Fieldtrip,
an open source software implemented in Matlabe.73 All data were down-sampled to 1000 Hz and
demeaned relative to the entire recording. Line noise and its harmonics up to 200 Hz were
removed by subtracting the band passed filtered signal from the raw signal on each channel.
e http://www.ru.nl/neuroimaging/fieldtrip

21
Table 1: iEEG recording summary in each of the 14 patients, including number of task sessions completed, number of NSPs used
during signal acquisition, and number of electrodes implanted in each hemisphere.
# Patient Label MSIT sessions ECR sessions # of NSPs # of Electrodes
(8-16 contacts ea.)
1 2 1 2 Left Right
1 79 x 1 6 6
2 85 x 1 5 7
3 86 x x 1 9 5
4 88 x 1 6 6
5 89 x x 1 5 6
6 90 x x 1 7 7
7 95 x 2 7 7
8 96 x x 2 8 5
9 99 x x x x 2 8 6
10 101 x 2 9 4
11 102 x x 2 9 7
12 104 x x x 2 9 5
13 106 x x 2 9 7
14 107 x x x x 2 9 8
Channel selection
Channels that exhibited excessive line noise or no discernible signal were removed from the
analysis. Based on clinical reports and on visual inspection, electrodes surrounding the epileptic
focus and/or exhibiting abnormal activities were also excluded.
Bipolar referencing
Neighboring channels were bipolar referenced relative to one another to account for volume
conduction. The signal recorded from each channel represents the reference potential, R,
subtracted from the electric potentials gathered at the site of two electrodes, source1 and
source2. To eliminate the reference component of the signal that is common across nearby
electrodes, adjacent signals are subtracted from one another [Eqn 1]. The result is the bipolar
referenced signal [Eqn 2].

22
𝑏𝑖𝑝𝑜𝑙𝑎𝑟 𝑠𝑖𝑔𝑛𝑎𝑙 = (𝑠𝑜𝑢𝑟𝑐𝑒1 − 𝑅) − (𝑠𝑜𝑢𝑟𝑐𝑒2 − 𝑅) [Eqn 1]
𝑏𝑖𝑝𝑜𝑙𝑎𝑟 𝑠𝑖𝑔𝑛𝑎𝑙 = 𝑠𝑜𝑢𝑟𝑐𝑒1 − 𝑠𝑜𝑢𝑟𝑐𝑒2 [Eqn 2]
Evoked response potential mitigation
Low frequency components of the signal are thought to be related to evoked-response potentials
(ERPs) that occur during task image onset or reaction. A high-pass filter (HPF) was applied to
eliminate frequency components of the signal below a cutoff frequency of 2 Hz. Figure 10A and
B shows the neural signal across all trials was averaged relative to the image onset or to the time
the patient reacted to the picture. The resulting ERPs were averaged across all bipolar electrodes
in each region, the attenuation of the average ERP per region after filtering was visually
inspected to determine adequate ERP removal.
Figure 10: High-pass filter removes frequency components less than 2 Hz. Voltage traces on each channel in the left dorsal
anterior cingulate cortex and right vlPFC was averaged across all trials relative to the image onset, and an HPF was applied to
eliminate frequency components of the signal less than 2 Hz. (A) Bipolar signal average in the left daCC is shown in blue, and
the HPF bipolar signal average is shown in red. (B) Bipolar signal average in the right vlPFC is shown in green, and the HPF
bipolar signal average is shown in orange. ERP Attenuation value is the peak-to-peak amplitudes of the bipolar and filtered
signals, normalized by the amplitude of the bipolar signal.

23
Drift elimination across multiple recording systems
Each NSP samples data according to its own clock cycle, controlled by crystal oscillators. Each
clock oscillates at a slightly different frequency. At a sampling rate of 2000 Hz, the difference in
oscillation rates generates drift between recordings between approximately one and two samples
every 20 minutes. In order to synchronize recordings, event time stamps saved along with neural
data from both NSPs were used as synchronization points. If the number of samples between
event time stamps did not match across both recordings, the shorter interval of data was adjusted
via linear interpolation so that its length matched the size of the longer interval of data.
Feature extraction
Canonical correlation analysis (CCA) was used to compute features that contain information
about the functional connectivity of the network. Here, we exploit canonical correlation by first
organizing channels into corresponding regions of interest using the electrode localization
algorithm. For example, regions X and Y contain two groups of nx and ny signals that vary with
time, t.
𝑋 = [
𝑋1,1 ⋯ 𝑋1,𝑡
⋮ ⋱ ⋮𝑋𝑛,1 ⋯ 𝑋𝑛,𝑡
] [Eqn 3]
𝑌 = [
𝑌1,1 ⋯ 𝑌1,𝑡
⋮ ⋱ ⋮𝑌𝑛,1 ⋯ 𝑌𝑛,𝑡
] [Eqn 4]
Two singular value decompositions are performed on the groups of signals, X and Y. The
resulting change in bases maximally correlates the signals within each set.53
𝑋 = 𝑈𝑥Ʃ𝑥𝑉𝑥† Y = 𝑈𝑦Ʃ𝑦𝑉𝑦
† [Eqn 5 & Eqn 6]

24
A matrix multiplication is performed to find the maximum correlation between each set of
signals. The first singular value of the product matrix, Qxy, is the canonical correlation
coefficient, which represents spatial correlation between the two sets of signals.
𝑄𝑥𝑦 = 𝑈𝑥𝑉𝑥†𝑉𝑦𝑈𝑦
† [Eqn 7]
One feature is calculated via canonical correlation between each region pair. Canonical
correlation values are in the range of zero to one.
Window size of analysis
Canonical correlation carries an innate bias. Coefficients increase as the window size of analysis
decreases. At small window sizes, coefficients approach their maximum value of one. Thus, task
and non-task distributions are less distinguishable at smaller window sizes. However, large
window sizes induce greater computational requirements, and are not ideal for eventual real-time
implementation. In addition, longer window sizes make it more uncertain when detectable brain
states begin and end. We sought to optimize the tradeoff between accuracy and efficiency by
computing canonical correlation features using window sizes ranging from 200 ms to 20 s with
an overlap of 200 ms. The corresponding classification accuracies were computed (procedure
described below). Based on the results, a window size of five seconds was selected and used for
all following analysis. Every five second window of data on each channel was normalized by
subtracting the mean and dividing by the standard deviation.
Classification
Class label assignment
Each five second window of data was labeled as ‘task’ or ‘non-task’ depending on whether the
patient was actively engaged in the MSIT and ECR behavioral tasks. Both image presentation
25
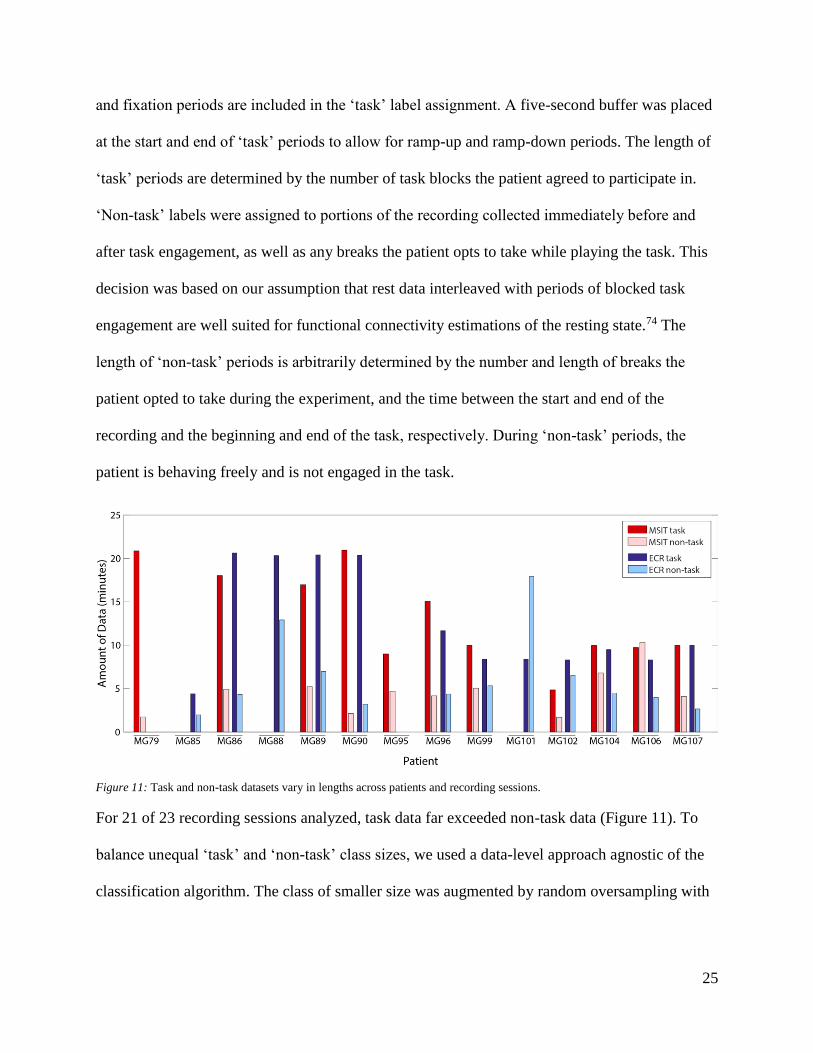
and fixation periods are included in the ‘task’ label assignment. A five-second buffer was placed
at the start and end of ‘task’ periods to allow for ramp-up and ramp-down periods. The length of
‘task’ periods are determined by the number of task blocks the patient agreed to participate in.
‘Non-task’ labels were assigned to portions of the recording collected immediately before and
after task engagement, as well as any breaks the patient opts to take while playing the task. This
decision was based on our assumption that rest data interleaved with periods of blocked task
engagement are well suited for functional connectivity estimations of the resting state.74 The
length of ‘non-task’ periods is arbitrarily determined by the number and length of breaks the
patient opted to take during the experiment, and the time between the start and end of the
recording and the beginning and end of the task, respectively. During ‘non-task’ periods, the
patient is behaving freely and is not engaged in the task.
Figure 11: Task and non-task datasets vary in lengths across patients and recording sessions.
For 21 of 23 recording sessions analyzed, task data far exceeded non-task data (Figure 11). To
balance unequal ‘task’ and ‘non-task’ class sizes, we used a data-level approach agnostic of the
classification algorithm. The class of smaller size was augmented by random oversampling with

26
replacement to make up the difference between class sizes.75 The supplemental feature set was
then concatenated to the original feature set.
Classification model and prediction
A Support Vector Machine (SVM) classifier with a linear kernel was designed using the
LIBSVM Matlab implementationf. A start to finish pipeline of preprocessing, feature extraction,
and classification is included in Figure 12. Canonical correlation features and corresponding
‘task’ vs. ‘non-task’ class labels were used as classifier input. A five-fold cross validation
strategy was used to determine training data and testing data for the model in a way that ensured
classifier performance was not overly influenced on any one portion of the dataset. The data was
separated into five folds. Four folds were used for training and the remaining fold was used for
testing. This process was repeated until every fold was used for testing. Accuracy, true positive
rate (sensitivity), true negative rate (specificity), false positive rate, and false negative rate were
calculated on each iteration of the five-fold cross validation strategy to gauge classifier
performance.
Figure 12: Classification pipeline for the identification of task-like brain states. Data is preprocessed via a low-pass filter to 1000
Hz, bipolar referenced, and normalized by subtracting the mean and dividing by the standard deviation. Canonical correlation
features are extracted from the preprocessed data, and fed to a Support Vector Machine that predicts ‘task’ vs. ‘non-task’ labels.
f (https://www.csie.ntu.edu.tw/~cjlin/libsvm/

27
Chance classification performance
Classification performance due to chance was calculated by shuffling class labels before class
sizes were balanced. Labels were randomly assigned in a way that preserved original class sizes.
Feature selection
Important features were selected through a ranking process based on SVM criteria (Figure 13).
For example, consider a feature set, Var, of size N. During the feature selection process,
classification accuracy is re-calculated for the feature set (of size N-1) after each feature is
removed and subsequently replaced. The feature removal that least impacts classification
accuracy is removed from the feature set, Var. This process is repeated until the feature set is
empty and all the features have been ranked. The last feature removed is ranked as most
important and conversely, the first feature removed is ranked as least important.
Figure 13: Feature selection using SVM-Based criteria, based on Rakotomamonjy et al. 2003.76.

28
Evaluation of decoder stability
Two patients, MG99 and MG104, completed two sessions of both the MSIT and ECR tasks, and
one patient, MG107, completed two sessions of the ECR task. These five datasets were the basis
for decoder stability analysis. Classification performance and feature selection were compared
within patients over both sessions of each task. To make fair comparisons, only bipolar
electrodes present in both recordings after preprocessing were included in the analysis. For
example, if an electrode was included in the first recording session and eliminated during the
second recording session (e.g. due to excessive line noise), the electrode would be excluded in
both test datasets.

29
RESULTS
Functional inference distinguishes task engagement
Spatial correlation via canonical correlation features successfully distinguished periods of task
engagement from free behavior for both the MSIT and ECR tasks. Mean sensitivity and
specificity for MSIT vs. non-task classification was 97.51 ± 2.20%, and 95.30 ± 2.94% (n = 11),
respectively (Figure 14). There was no significant difference between MSIT vs. non-task and
ECR vs. non-task classification performance. Mean sensitivity and specificity for ECR task vs.
non-task classification was 96.08 ± 3.05% and 94.33 ± 3.57% (n = 12), respectively (Figure 15).
We found that the canonical correlation algorithm was not dependent on the ERPs inherent to the
task-related data. Image presentation and movement associated with reaction are reliably
associated with a wave of slow frequency activity across most channels. While ERPs also appear
throughout the non-task data, free behavior does not require focused attention to an image that
appears on a screen approximately every five seconds. If classification performance was
dependent on low frequency activity, the real-world implications of the classifier would be
limited as the algorithm would be tied to contexts related to experimental behavioral tasks. To
test whether classification performance is dependent on task-related cyclic ERPs, low frequency
activity (<2 Hz) was removed from the signal by applying a high-pass filter. Canonical
correlation features were recalculated using signals from the filtered data. No significant
differences were found between classification performance before and after filtering.
While there was a positive bias in chance classification performance, true performance
significantly outperformed chance performance (MSIT vs. non-task: p <0.01; ECR task vs. non-
task: p < 0.01). The classification accuracy we expected after shuffling labels was approximately

30
50%. We found the mean classification accuracy to be 55.2 ± 2.62% and 54.3 ± 2.18% for the
MSIT and ECR tasks, respectively. A positive bias was likely introduced by the resampling
procedure used to balance class sizes. If one sample is overrepresented in the balanced dataset
due to resampling, the same sample is likely to be included in both testing and training datasets.
Testing the classifier on a portion of training data introduces a positive bias, evident from the
inflated chance classification performance.
Figure 14: (A) Boxplots show classification performance metrics for MSIT vs. non-task classification (accuracy, true positive
rate, and true negative rate). SVM classifier performance with canonical correlation features are highlighted in gray (mean acc:
96.4 ± 2.32%). Classifier performance after high-pass filtering for ERP removal (mean acc: 95.7 ± 2.37%), and due to chance
after shuffling labels (mean acc: 55.2 ± 2.62%) are included for comparison. (B) Receiver operating characteristic (ROC) curves
show sensitivity (true positive rate) vs. specificity (true negative rate). (C) A diagnostic table shows the mean true and false
positive rates, and the true and false negative rates across all patients.
31
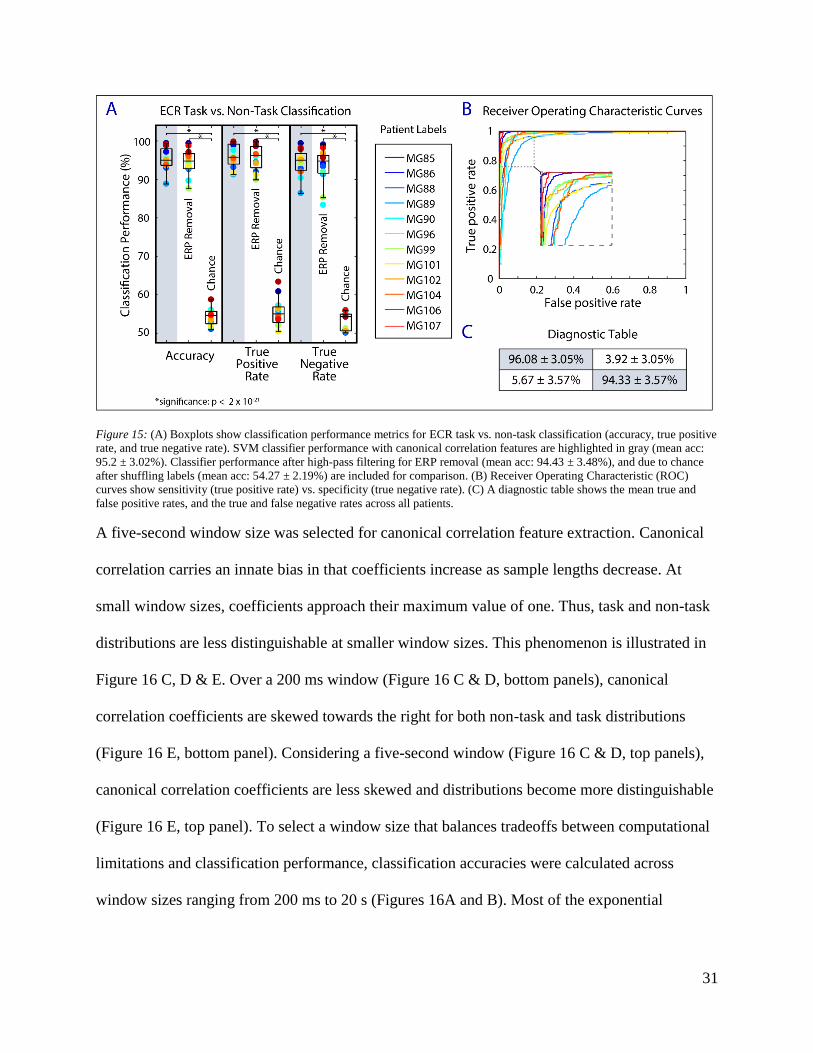
Figure 15: (A) Boxplots show classification performance metrics for ECR task vs. non-task classification (accuracy, true positive
rate, and true negative rate). SVM classifier performance with canonical correlation features are highlighted in gray (mean acc:
95.2 ± 3.02%). Classifier performance after high-pass filtering for ERP removal (mean acc: 94.43 ± 3.48%), and due to chance
after shuffling labels (mean acc: 54.27 ± 2.19%) are included for comparison. (B) Receiver Operating Characteristic (ROC)
curves show sensitivity (true positive rate) vs. specificity (true negative rate). (C) A diagnostic table shows the mean true and
false positive rates, and the true and false negative rates across all patients.
A five-second window size was selected for canonical correlation feature extraction. Canonical
correlation carries an innate bias in that coefficients increase as sample lengths decrease. At
small window sizes, coefficients approach their maximum value of one. Thus, task and non-task
distributions are less distinguishable at smaller window sizes. This phenomenon is illustrated in
Figure 16 C, D & E. Over a 200 ms window (Figure 16 C & D, bottom panels), canonical
correlation coefficients are skewed towards the right for both non-task and task distributions
(Figure 16 E, bottom panel). Considering a five-second window (Figure 16 C & D, top panels),
canonical correlation coefficients are less skewed and distributions become more distinguishable
(Figure 16 E, top panel). To select a window size that balances tradeoffs between computational
limitations and classification performance, classification accuracies were calculated across
window sizes ranging from 200 ms to 20 s (Figures 16A and B). Most of the exponential
32
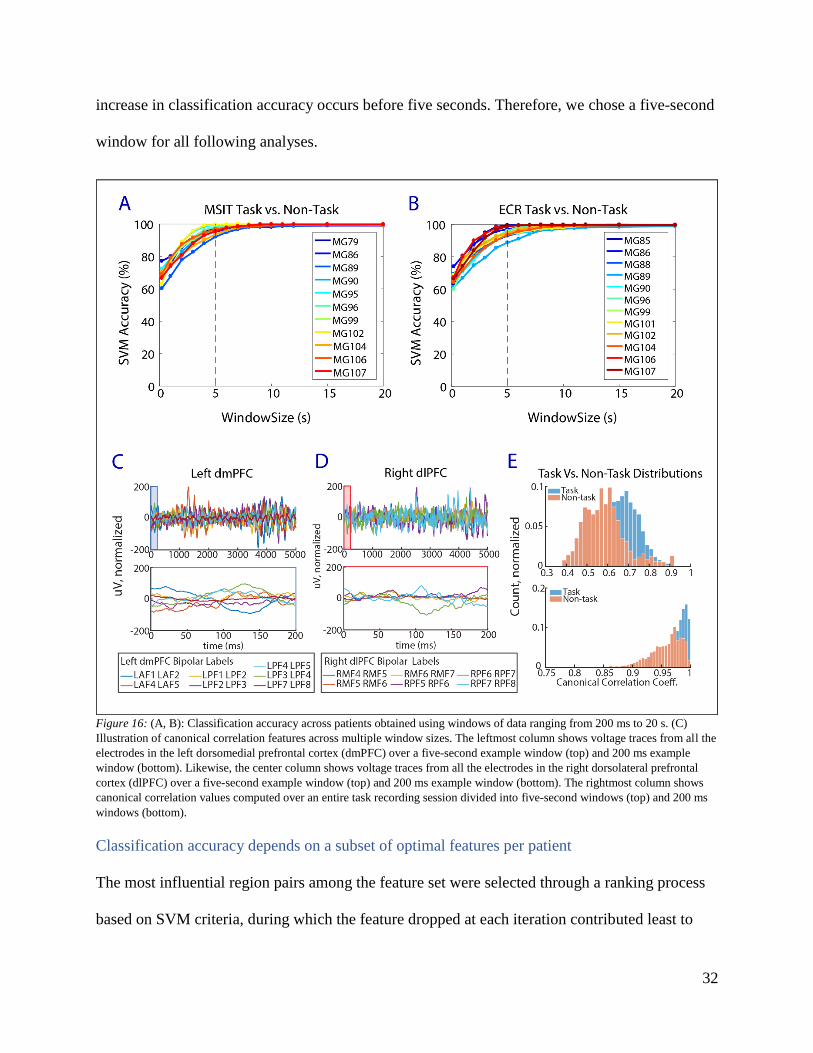
increase in classification accuracy occurs before five seconds. Therefore, we chose a five-second
window for all following analyses.
Figure 16: (A, B): Classification accuracy across patients obtained using windows of data ranging from 200 ms to 20 s. (C)
Illustration of canonical correlation features across multiple window sizes. The leftmost column shows voltage traces from all the
electrodes in the left dorsomedial prefrontal cortex (dmPFC) over a five-second example window (top) and 200 ms example
window (bottom). Likewise, the center column shows voltage traces from all the electrodes in the right dorsolateral prefrontal
cortex (dlPFC) over a five-second example window (top) and 200 ms example window (bottom). The rightmost column shows
canonical correlation values computed over an entire task recording session divided into five-second windows (top) and 200 ms
windows (bottom).
Classification accuracy depends on a subset of optimal features per patient
The most influential region pairs among the feature set were selected through a ranking process
based on SVM criteria, during which the feature dropped at each iteration contributed least to

33
upholding SVM accuracy. The threshold for clinical success was defined as 80% accuracy based
on current motor brain machine interface decoding standards.55,56,61 The ranking process is
displayed in Figure 17 A and Figure 18 A, which show SVM accuracy decreasing as region pairs
are iteratively dropped from the feature set. When accuracy reached the 80% threshold marked
by the dotted lines, we deemed the remaining features significant.
Significant features required to maintain 80% accuracy vary across patients in quantity, as shown
in the inset of Figure 17 A and Figure 18 A (MSIT: med 3 ± 3.4 region pairs, ECR: med 4 ± 6.6
region pairs). Quantifying the number of significant features allows for assessment of recording
requirements necessary to reach the threshold for clinical success. The number of regions (rather
than region pairs) required to meet 80% accuracy ranges from two to 19 for both the MSIT (med
6.0; std 5.0) and ECR (med 7.0; std 4.9) tasks (Figure 17 B and Figure 18 B). The total number
of channels (before bipolar referencing) implanted across the set of significant regions ranges
from 16 to 153 for the MSIT (med 50; std 37.6), and 17 to 148 for the ECR task (med 76.0; std
36.6).
In addition to varying in quantity, significant features are unique to each patient with limited
overlap between patients engaged in the same task. For example, the unique feature sets required
to reach the 80% accuracy for two patients, MG86 and MG96, during the MSIT and ECR tasks
are shown as network diagrams on the left panels of Figure 19 and Figure 20. The number of raw
channels implanted in each significant region is shown on the right panels of Figure 19 and
Figure 20.
34
Figure 17: (A) Feature pruning reveals features required to maintain 80% accuracy for MSIT vs. non-task classification across
patients. The significant feature sets consist of (B) 6±5 regions of interest, and (C) 50±37.6 non-bipolar channels across patients.
Figure 18: (A) Feature pruning reveals features required to maintain 80% accuracy for ECR task vs. non-task classification
across patients. The significant feature sets consist of (B) 7±4.9 regions of interest, and (C) 76±36.6 non-bipolar channels across
patients.

35
Figure 19: Network diagrams illustrate two examples (patients MG86 and MG96) of feature sets required to reach 80% accuracy
for MSIT vs. non-task classification. (A, B) These diagrams demonstrate significant network connectivity for MG86 and MG96,
along with the corresponding number of channels in each ROI.
Figure 20: Network diagrams illustrate two examples (patients MG86 and MG96) of feature sets required to reach 80% accuracy
for ECR task vs. non-task classification. (A, B) These diagrams demonstrate significant network connectivity for MG86 and
MG96, along with the corresponding number of channels in each ROI.
Optimal feature sets shift over time
Feature sets required to meet 80% classification accuracy varied across multiple sessions of the
same task within each patient. The most influential region pairs among feature sets across
multiple recording sessions were again selected through a ranking process based on SVM
criteria. The ranking process is displayed in Figure 21 A, where the callout displays the number
of features required to meet 80% accuracy (med 5.0; std 5.65). The number of regions required
to meet 80% accuracy ranges from two to 17 (med 7; std 4.79) (Figure 21B). The total number of
channels (before bipolar referencing) implanted across the sets of significant regions ranges from
14 to 143 (med 64.5; std 28.22). It is interesting to note that the second ECR session completed
by MG107 yielded the only classification performance above 80% accuracy based on only one

36
feature, the canonical correlation between the right dorsal anterior cingulate cortex and the left
caudate.
Figure 21: (A) Feature pruning reveals features required to maintain 80% accuracy for task vs. non-task classification across
patients that performed multiple sessions of the same task. Unbroken lines and filled circles correspond to the first recording
session, and dotted lines and unfilled circles correspond to the second recording session. The significant feature sets vary across
recording sessions and consist of (B) 7±4.79 regions of interest and (C) 64.5±32.9 non-bipolar channels across patients.
Significant features vary from session to session, with fluctuating degrees of overlap among
significant regions between sessions. The unique feature sets required to reach 80% accuracy for
one example pair of recording sessions, MG99 engaged in the ECR task, are shown as network
diagrams in Figure 22 A and B. No features deemed significant during the first recording session
were declared significant during the second recording session. However, there is some overlap in
individual regions of interest (rather than in terms of the features, which are region pairs). The
left hippocampus, left dorsolateral pre-frontal cortex (dlPFC), and right lateral orbitofrontal
cortex (lOFC) are shared as significant ROIs between sessions one and two. There was overlap
between required regions in three of four session pairs analyzed. The mean percentages of
significant regions from session one that exist in session two and vice versa are ~55% and ~62%,

37
respectively. The distribution of overlap varies widely across recording sessions, ranging from
0% for MG99 during MSIT to ~92% for MG104 during the second session of the ECR task.
Figure 22: (A, B) Network diagrams illustrate one example of the feature sets required to reach 80% accuracy for ECR task vs.
non-task classification. Significant network connectivity for MG99 during session one and session two is shown in the left and
right network diagrams, respectively. (C) The number of channels in each region represented in the significant feature set is
shown for session 1 (white bars), overlapping between session 1 and session 2 (gray bars), or session 2 (black bars). (D) The
degree to which the regions in significant ROI pairs overlap between session 1 and session 2 is shown by the boxplots.
Training on temporally separated data shows potential for decoding stability
When training and testing on the same session, the classifier yields accuracies greater than 90%
for each of the session pairs. To test classification performance across multiple sessions of data,
the classifier was trained on features from one session and tested on the other session in its pair.
Training and testing the classifier on different sessions caused accuracy to degrade significantly,

38
although performance was still above chance levels (Figure 23A). We observed a general trend
where accuracy degraded as the amount of time between sessions increased (Figure 23B).
When training and testing the classifier on data from both sessions, mean classifier performance
accuracy across patients was approximately 89%. The classification performance improvement
that we observe indicates that training on temporally separated data may improve classification
performance over longer periods of time.
Figure 23: (A) Boxplots show accuracy of classifiers (1) trained on session 1 and tested on session 1, (2) trained on session 2 and
tested on session 2, (3) trained on session 1 and tested on session 2, and (4) trained on session 2 and tested on session 1. Accuracy
reported is an average testing accuracy after five-fold cross validation. (B) Scatterplot shows results for classifiers trained and
tested on different sessions for the same patient. Classifier accuracy drops as time between sessions increases. (C) Boxplot shows
accuracy of classifier trained and tested on both sessions of data. Accuracy reported is an average testing accuracy after five-fold
cross validation.

39
DISCUSSION
Detecting brain states associated with effortful mental action is important for the translation of
closed-loop DBS for neuropsychiatric illness. Beyond accurately detecting relevant brain states,
a clinically viable decoder must consistently enable levels of relief desired by the patient and
ultimately operate within the constraints of device firmware. Working towards clinical
translation, we have demonstrated successful detection of conflict related brain states and have
begun to address these challenges in terms of our proof of concept algorithm.
Classification performance
We have taken a known technique, CCA, and applied it to neural data collected during
experimental behavioral tasks to extract neural features related to effortful mental activity. These
neural features were used as input to an SVM classifier to predict task-related brain states. Using
these methods, we developed an algorithm that successfully distinguishes task from non-task
related mental effort.
When selecting window size for CCA feature extraction, we considered requirements imposed
by the ultimate application and platform for the algorithm. To be useful as a therapeutic tool, the
algorithm must accurately and quickly identify brain states shifting in time and run on an
independent platform limited in memory and power. Therefore, we selected a five second
window size based on our aims to maximize accuracy while minimizing the computational
requirements that stem from holding substantial amounts of data in memory.
The threshold for clinical viability in this study was set to 80% accuracy based on performance
standards in clinically used BMIs based on LFP decoding.55,56,61 However, requirements for
acceptable sensitivity and specificity ranges are not standard and instead should depend on

40
clinical application and needs of the patient population.57,58 The ROC curves (Figures 14 & 15)
highlight a tradeoff between relieving symptoms and avoiding side effects. The chosen
sensitivity and specificity point on the curve will depend on side effects. For example, perfect
specificity may be desirable for a person that experiences undesirable side effects when
stimulation is triggered after a false detection. While we claim success on our classification rates
with mean sensitivity and specificity rates greater than 94%, there is little precedent for
acceptable rates of performance for decoding brain states associated with neuropsychiatric
illness. This gap in knowledge indicates a need for systematically gauging the needs of the
patient population (e.g. surveys).
One important performance measure for decoders independent of application is the ability to
predict above chance levels.57 Chance prediction in the present study was approximately 55%,
which is slightly greater than the chance level expected for a two-class classification problem
(1/2 or 50%). We suspect that chance prediction for our classifier was slightly inflated by the
method chosen for balancing class sizes. Random labels were assigned to data samples in a way
that preserved original class sizes before the smaller class size was augmented via resampling.
Choosing to assign random labels before resampling likely introduced a bias in classification
performance due to the overrepresentation of a subset of samples in the dataset. Additionally, the
inflated chance performance indicates that the overall classification performance is inflated as
well. For 15 of 23 recordings analyzed, the non-task class size was less than half the task class
size. During future experimental recordings, it will be important to better control class sizes by
prioritizing non-task data collection.
In addition to the traditional performance measures discussed, the timeframe between brain state
onset and application of therapy will affect both efficacy and patient satisfaction with treatment.

41
The algorithm we developed extracted canonical correlation features from five-second windows
of data. While the five-second window size satisfies our assumptions about performance and
computational needs, it automatically sets a baseline for how quickly closed-loop intervention
can occur. For example, if the algorithm is operating in real-time and the onset of a pathological
brain state begins toward the start of the five second window, at least five seconds will pass
before the brain state is detected while the algorithm gathers additional data to fill the rest of the
window. The five-second estimate does not include the additional time required for feature
extraction, classification, and control. This timeframe would not be acceptable in the realm of
motor brain machine interfaces (BMIs), where naturalistic control of effectors (e.g. cursors,
prosthetic limbs) requires immediate action, and ‘thought-to-action’ brain states are transient.
However, a delay on the order of approximately 10 seconds could be acceptable for treating
neuropsychiatric illness if brain states are slowly evolving in a way that mirrors behavioral
symptoms. Moving forward, it is important that the algorithm is tested on an existing real-time
system to gauge computation time, requirements, and online performance, as prediction power of
decoders trained offline often does not translate to prediction power during closed-loop
performance.60
The canonical correlation feature is limited in that it does not address correlations in the
frequency domain. Canonical correlation coefficients are likely dominated by large amplitude
low frequency components. A spectral decomposition approach could be combined with CCA in
the future. Following, examining higher frequency bands might allow for shorter time windows
of analysis, because optimal window length is likely to depend on frequency band. If analyzing
high frequency activity allows for a decrease in window size without sacrificing classification

42
performance, this would strengthen the decoder by decreasing the latency between state onset
and detection.
Feature selection
To gain insight on functional connectivity important for distinguishing task-related brain states,
we identified a subset of features for each patient that are likely important for maintaining 80%
classification performance based on SVM criteria. We found that significant features differed
across tasks and patients and offer several possible explanations for these discrepancies. First,
electrode placement was determined purely by clinical criteria, which means that the regions
implanted and the number of electrodes in each region were different for each patient. Feature
sets across patients could be more consistent if the electrode implantation scheme was the
uniform across patients. Second, the sheer number of electrodes implanted in each region may
impose a bias on which regions are deemed significant. It is interesting to note, however, that
classification performance was not dependent on any one implant scheme. Successful
classification performance across many configurations of electrodes suggests extensive regional
network involvement in generating task-related brain states.
Selecting a subset of important features could be useful for guiding implant locations and
reducing computational requirements as the work matures. There is potential for further
reduction in channel count beyond the region and electrode count we have reported for
maintaining 80% accuracy. All electrodes with a nonzero probability of falling within a region
label via the ELA were included in analysis. Electrodes localized to a particular region may
actually be recording from passing fibers in white matter, which may carry signals coming from
another region. Thresholding electrodes by setting a minimum gray matter probability or
imposing a cap on the number of electrodes in each region would increase probability that

43
signals are generated by the target regions and reduce channel count per region. For example,
over 20 channels are implanted in the left temporal lobe of MG96, while only two channels are
implanted in the right dorsal anterior cingulate cortex (dACC). Both regions were significant;
however, the left temporal lobe requires 10 times the channel count than the right dACC, which
increases computational requirements. We have not explored whether computational complexity
could be reduced by selecting important channels without sacrificing classification performance.
The median number of features required to reach 80% classification accuracy was 6 and 7 region
pairs for the MSIT and ECR tasks, respectively. Only one recording, the second session of ECR
for MG107, yielded accuracy above 80% for just one feature. We were surprised to find that
classification task engagement is dependent on the functional connectivity between such a vast
array of structures. This is something that should be studied further, but is beyond the scope of
current analysis.
Decoder stability
Decoder stability is critical for clinical translation of the classifier. The instability may be due to
non-stationarities in the data related to physical movement of electrodes, dropped signals,
changes in neural activity due to inflammation after surgery. While stability was not achieved
over pairs of recording sessions spaced between a range of four hours and one week, we are
hopeful to achieve stability in the future with access to more temporally separated data. Repeated
recording sessions collected over tens to hundreds of days may be necessary to achieve stability.
Evidence from the motor BMI field is encouraging. For example, Vansteensel et al. describes a
ECoG based BCI that allows for control of a typing program. After 67 two-hour sessions over
157 days, they achieved control signal stability.61 Considering these findings and others from
LFP-based motor BCI literature, we are neither surprised nor alarmed by the lack in stability and

44
the lack of overlap in significant feature sets across sessions. In the final use case, we expect that
closed loop decoder adaptation algorithms along with remote calibration will be necessary for
long-term stabilization.55,56,59,60
The lack of reliability across sessions is likely due to the canonical correlation coefficient being
very susceptible to ongoing spurious events, given that a new linear combination is found that
maximizes correlation for every new time window. It is necessary to mitigate this effect in the
future by fixing the canonical basis for task and non-task data. By fixing the bases, only the
projections and canonical correlation coefficients would be calculated for each new time
window. In addition to potentially stabilizing the feature set over time, this method is also more
computationally efficient because singular value decompositions are not recomputed for each
time window. Further, including a statistical test could further increase the robustness of
canonical correlation over time.
Expanding the breadth of non-task related brain states used to train the classifier could strengthen
classification performance over a wide range of activities and potentially improve stability.
Currently, our data labeled as the ‘non-task’ state is composed of free behavior immediately
surrounding task engagement. During this time, the patient could be engaged in any number of
activities. Additionally, non-task activities during the first recording session may be completely
different than that of the second recording session. The lack of a robust non-task dataset might
contribute to the lack in overlap of significant features between pairs of recording sessions. A
potential challenge in including a wide array of non-task data is that task-related networks may
spontaneously reactivate during rest. Capturing a wide variety of activities during non-task state
recordings will be important for training and stabilizing the classifier.
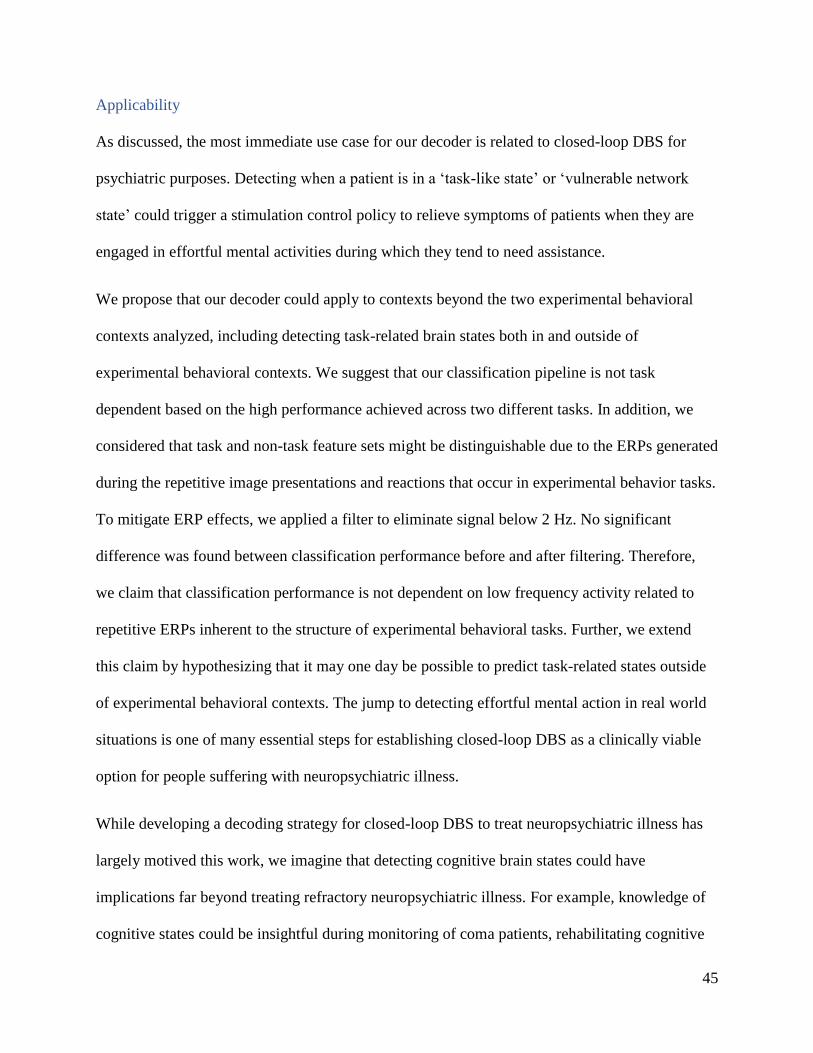
45
Applicability
As discussed, the most immediate use case for our decoder is related to closed-loop DBS for
psychiatric purposes. Detecting when a patient is in a ‘task-like state’ or ‘vulnerable network
state’ could trigger a stimulation control policy to relieve symptoms of patients when they are
engaged in effortful mental activities during which they tend to need assistance.
We propose that our decoder could apply to contexts beyond the two experimental behavioral
contexts analyzed, including detecting task-related brain states both in and outside of
experimental behavioral contexts. We suggest that our classification pipeline is not task
dependent based on the high performance achieved across two different tasks. In addition, we
considered that task and non-task feature sets might be distinguishable due to the ERPs generated
during the repetitive image presentations and reactions that occur in experimental behavior tasks.
To mitigate ERP effects, we applied a filter to eliminate signal below 2 Hz. No significant
difference was found between classification performance before and after filtering. Therefore,
we claim that classification performance is not dependent on low frequency activity related to
repetitive ERPs inherent to the structure of experimental behavioral tasks. Further, we extend
this claim by hypothesizing that it may one day be possible to predict task-related states outside
of experimental behavioral contexts. The jump to detecting effortful mental action in real world
situations is one of many essential steps for establishing closed-loop DBS as a clinically viable
option for people suffering with neuropsychiatric illness.
While developing a decoding strategy for closed-loop DBS to treat neuropsychiatric illness has
largely motived this work, we imagine that detecting cognitive brain states could have
implications far beyond treating refractory neuropsychiatric illness. For example, knowledge of
cognitive states could be insightful during monitoring of coma patients, rehabilitating cognitive

46
function after strokes, gauging awareness and emotional state of soldiers in combat, or
identifying vulnerable periods for addicts. While there is much to accomplish before our proof of
concept algorithm becomes clinically viable, we believe the outlook is positive.

47
CONCLUSIONS
We have demonstrated the ability to accurately identify task-related brain states via invasive,
large-scale local field potential recordings during human engagement in conflict-based tasks.
Canonical correlation features were extracted and used as inputs to a classifier that predicted task
vs. non-task engagement for the MSIT and ECR tasks. Classification performance was not
dependent on the ERPs inherent to experimental behavioral tasks and was significantly greater
than chance performance. A subset of features related to regional connectivity were identified
that are likely important for maintaining the threshold for clinical accuracy, which we defined as
80%. The important feature sets were unique across patients engaged in the same task, as well as
across multiple task recording sessions. While significant feature sets were not maintained across
multiple sessions, there were varying degrees in overlap of significant regions across multiple
sessions. Successful classification was not achieved after training and testing the classifier on
different sessions. However, classification performance improved after training and testing the
classifier on data from multiple recording sessions. This improvement in classification
performance indicates the importance of training on temporally separated data.
While we have developed a proof of concept for detecting task-related brain states, further
investigation is required to establish the classification algorithm as a clinically viable element of
treatment. The amount of data required by the algorithm must be reduced beyond the identified
significant feature sets without sacrificing classification performance. The algorithm should be
tested in real-time to gauge both computational requirements and the minimum amount of time
required between state detection and application of therapy. The non-task state should
incorporate as many different types of non-task activities as possible to limit false detection of
conflict-related brain states in real world situations. Establishing decoder stability is essential. If

48
these limitations are addressed, task state detection could have potential for guiding closed-loop
treatment for neuropsychiatric illness.

49
REFERENCES 1. Whiteford, H. A. et al. Global burden of disease attributable to mental and substance use
disorders: Findings from the Global Burden of Disease Study 2010. Lancet 382, 1575–
1586 (2013).
2. Insel, T. R. Faulty circuits. Sci. Am. 302, 44–51 (2010).
3. Insel, T. R. & Wang, P. S. Rethinking mental illness. Jama 303, 1970–1971 (2010).
4. Gaynes, B. N. et al. What did STAR*D teach us? Results from a large-scale, practical,
clinical trial for patients with depression. Psychiatr. Serv. 60, 1439–45 (2009).
5. Warden, D., Rush, A. J., Trivedi, M. H., Fava, M. & Wisniewski, S. R. The STAR*D
project results: A comprehensive review of findings. Curr. Psychiatry Rep. 9, 449–459
(2007).
6. Widge, A. S. et al. Treating refractory mental illness with closed-loop brain stimulation:
Progress towards a patient-specific transdiagnostic approach. Exp. Neurol. (2017).
doi:10.1016/j.expneurol.2017.07.021
7. Ballantine, H. T., Bouckoms, A. J., Thomas, E. K. & Giriunas, I. E. Treatment of
psychiatric illness by stereotactic cingulotomy. Biol. Psychiatry 22, 807–819 (1987).
8. Shin, L. M. et al. An fMRI study of anterior cingulate function in posttraumatic stress
disorder. Biol. Psychiatry 50, 932–42 (2001).
9. Dougherty, D. D. et al. Prospective long-term follow-up of 44 patients who received
cingulotomy for treatment-refractory obsessive-compulsive disorder. Am. J. Psychiatry
159, 269–275 (2002).
10. Greenberg, B. D., Rauch, S. L. & Haber, S. N. Invasive circuitry-based neurotherapeutics:
stereotactic ablation and deep brain stimulation for OCD. Neuropsychopharmacology 35,
317–336 (2010).
11. Yang, J. C., Ginat, D. T., Dougherty, D. D., Makris, N. & Eskandar, E. N. Lesion analysis
for cingulotomy and limbic leucotomy: comparison and correlation with clinical
outcomes. J. Neurosurg. 120, 152–63 (2014).
12. Mayberg, H. S. Targeted electode-based modulation of neural circuits for depression. J.
Clin. Invest. 119, 717–725 (2009).
13. Malone, D. A. et al. Deep Brain Stimulation of the Ventral Capsule/Ventral Striatum for
Treatment-Resistant Depression. Biol. Psychiatry 65, 267–275 (2009).
14. Greenberg, B. D. et al. Deep brain stimulation of the ventral internal capsule/ventral
striatum for obsessive-compulsive disorder: worldwide experience. Mol. Psychiatry 15,
64–79 (2010).
15. Dougherty, D. D. et al. A Randomized Sham-Controlled Trial of Deep Brain Stimulation
of the Ventral Capsule/Ventral Striatum for Chronic Treatment-Resistant Depression.
Biol. Psychiatry 78, 240–248 (2015).
16. Morishita, T., Fayad, S. M., Higuchi, M.-A., Nestor, K. a & Foote, K. D. Deep Brain

50
Stimulation for Treatment-resistant Depression: Systematic Review of Clinical Outcomes.
Neurotherapeutics 11, 475–84 (2014).
17. Garnaat, S. L. et al. Who qualifies for deep brain stimulation for OCD? Data from a
naturalistic clinical sample. J. Neuropsychiatry Clin. Neurosci. 26, 81–6 (2014).
18. Ward, M. P. & Irazoqui, P. P. Evolving refractory major depressive disorder diagnostic
and treatment paradigms: toward closed-loop therapeutics. Front. Neuroeng. 3, 7 (2010).
19. Thomas, J. L., Wilk, J. E., Riviere, L. A., McGurk, D., Castro, C. A., & Hoge, C. W.
Prevalence of mental health problems and functional impairment among active component
and National Guard Soldiers 3 and 12 months following combat in Iraq. Arch. Gen.
Psychiatry 67, 614–623 (2010).
20. Hoge, C. W., Riviere, L. A., Wilk, J. E., Herrell, R. K. & Weathers, F. W. The prevalence
of post-traumatic stress disorder (PTSD) in US combat soldiers: A head-to-head
comparison of DSM-5 versus DSM-IV-TR symptom criteria with the PTSD checklist. The
Lancet Psychiatry 1, 269–277 (2014).
21. Priori, A., Foffani, G., Rossi, L. & Marceglia, S. Adaptive deep brain stimulation (aDBS)
controlled by local field potential oscillations. Exp. Neurol. 245, 77–86 (2013).
22. Bush, G. et al. Anterior cingulate cortex dysfunction in attention-deficit/hyperactivity
disorder revealed by fMRI and the Counting Stroop. Biol. Psychiatry 45, 1542–1552
(1999).
23. Swanson, J., Castellanos, F. X., Murias, M., LaHoste, G. & Kennedy, J. Cognitive
neuroscience of attention deficit hyperactivity disorder and hyperkinetic disorder. Curr.
Opin. Neurobiol. 8, 263–271 (1998).
24. Simpson, J. R., Snyder, A. Z., Gusnard, D. a. & Raichle, M. E. Emotion-induced changes
in human medial prefrontal cortex: I. During cognitive task performance. Proc. Natl.
Acad. Sci. U. S. A. 98, 683–687 (2001).
25. Whalen, P. J. et al. The emotional counting stroop paradigm: A functional magnetic
resonance imaging probe of the anterior cingulate affective division. Biol. Psychiatry 44,
1219–1228 (1998).
26. Gehring, W. J., Himle, J. & Nisenson, L. G. Action-Monitoring Dysfunction in Obsessive-
Compulsive Disorder Author ( s ): William J . Gehring , Joseph Himle and Laura G .
Nisenson Published by : Sage Publications , Inc . on behalf of the Association for
Psychological Science Stable URL : http://www. 11, 1–6 (2016).
27. Koyama, T., Kato, K., Tanaka, Y. Z. & Mikami, A. Anterior cingulate activity during
pain-avoidance and reward tasks in monkeys. Neurosci. Res. 39, 421–430 (2001).
28. Niki, H. & Watanabe, M. Prefrontal and cingulate unit activity during timing behavior in
the monkey. Brain Res. 171, 213–224 (1979).
29. Nishijo, H. et al. Single neuron responses in the monkey anterior cingulate cortex during
visual discrimination. Neurosci. Lett. 227, 79–82 (1997).

51
30. Procyk, E., Tanaka, Y. L. & Joseph, J. P. Anterior cingulate activity during routine and
non-routine sequential behaviors in macaques. Nat. Neurosci. 3, 502–508 (2000).
31. Shima, K. Role for Cingulate Motor Area Cells in Voluntary Movement Selection Based
on Reward. Science (80-. ). 282, 1335–1338 (1998).
32. Stroop, J. R. APA CENTENNIAL FEATURE Studies of Interference in Serial Verbal
Reactions. 121, 15–23 (1992).
33. Eriksen, B. A. & Eriksen, C. W. Effects of noise letters upon the identification of a target
letter in a nonsearch task. Percept. Psychophys. 16, 143–149 (1974).
34. Simon, J. R. & Berbaum, K. Effect of conflicting cues on information processing: The
‘Stroop effect’ vs. the ‘Simon effect’. Acta Psychol. (Amst). 73, 159–170 (1990).
35. Bush, G., Shin, L. M., Holmes, J., Rosen, B. R. & Vogt, B. a. The Multi-Source
Interference Task: validation study with fMRI in individual subjects. Mol. Psychiatry 8,
60–70 (2003).
36. Bush, G. & Shin, L. M. The Multi-source interference task: An fMRI task that reliably
activates the cingulo-frontal-parietal cognitive/attention network. Nat. Protoc. 1, 308–313
(2006).
37. Mayberg, H. S. et al. Reciprocal limbic-cortical function and negative mood: Converging
PET findings in depression and normal sadness. Am. J. Psychiatry 156, 675–682 (1999).
38. Gusnard, D. A., Akbudak, E., Shulman, G. L. & Raichle, M. E. Medial prefrontal cortex
and self-referential mental activity: relation to a default mode of brain function. Proc.
Natl. Acad. Sci. U. S. A. 98, 4259–64 (2001).
39. Bush, G., Luu, P. & Posner, M. I. Cognitive and emotional influences in anterior cingulate
cortex. 4, 215–222 (2000).
40. Drevets, W. C. & Raichle, M. E. Reciprocal suppresion of regional cerebral blood flow
during emotional versus higher cognitive processes: Impliation for interaction between
emotion and cognition. Cogn. Emot. 12, 353–385 (1998).
41. Davey, C. G., Yücel, M., Allen, N. B. & Harrison, B. J. Task-related deactivation and
functional connectivity of the subgenual cingulate cortex in major depressive disorder.
Front. Psychiatry 3, 1–8 (2012).
42. Bush, G. et al. Functional magnetic resonance imaging of methylphenidate and placebo in
attention-deficit/hyperactivity disorder during the multi-source interference task. Arch.
Gen. Psychiatry 65, 102–114 (2008).
43. Cocchi, L. et al. Functional alterations of large-scale brain networks related to cognitive
control in obsessive-compulsive disorder. Hum. Brain Mapp. 33, 1089–1106 (2012).
44. Yücel, M. et al. Functional and Biochemical Alterations of the Medial Frontal Cortex in
Obsessive-Compulsive Disorder TL - 64. Arch. Gen. Psychiatry 64 VN-r, 946–955
(2007).
45. McKenna, F. P. Effects of unattended emotional stimuli on color-naming performance.

52
Curr. Psychol. 5, 3–9 (1986).
46. Mathews, A. & Macleod, C. Selective Cues Processing in Anxiety of Threat. Behav. Res.
Ther 23, 563–569 (1985).
47. Etkin, A., Egner, T., Peraza, D. M., Kandel, E. R. & Hirsch, J. Resolving Emotional
Conflict: A Role for the Rostral Anterior Cingulate Cortex in Modulating Activity in the
Amygdala. Neuron 51, 871–882 (2006).
48. Etkin, A., Prater, K. E., Hoeft, F., Menon, V. & Schatzberg, A. F. Failure of anterior
cingulate activation and connectivity with the amygdala during implicit regulation of
emotional processing in generalized anxiety disorder. Am. J. Psychiatry 167, 545–554
(2010).
49. Etkin, A. & Schatzberg, A. F. Common abnormalities and disorder-specific compensation
during implicit regulation of emotional processing in generalized anxiety and major
depressive disorders. Am. J. Psychiatry 168, 968–978 (2011).
50. Hull, A. M. Neuroimaging findings in post-traumatic stress disorder. Systematic review.
Br. J. Psychiatry 181:102-10, 102–110 (2002).
51. Kumari, V. et al. Neural abnormalities during cognitive generation of affect in treatment-
resistant depression. Biol. Psychiatry 54, 777–791 (2003).
52. Etkin, A. et al. Toward a neurobiology of psychotherapy: basic science and clinical
applications. J. Neuropsychiatry Clin. Neurosci. 17, 145–58 (2005).
53. Stephen, E. P. et al. Assessing dynamics, spatial scale, and uncertainty in task-related
brain network analyses. Front. Comput. Neurosci. 8, 31 (2014).
54. Bastos, A. M. & Schoffelen, J.-M. A Tutorial Review of Functional Connectivity Analysis
Methods and Their Interpretational Pitfalls. Front. Syst. Neurosci. 9, 175 (2016).
55. Sellers, E. W., Vaughan, T. M. & Wolpaw, J. R. A brain-computer interface for long-term
independent home use. Amyotroph. Lateral Scler. 11, 449–455 (2010).
56. Zeitlin, D., Wolpaw, J. R. & Vaughan, T. M. Amyotrophic Lateral Sclerosis. (2015).
doi:10.3109/21678421.2013.865750.Brain-computer
57. Gadhoumi, K., Lina, J. M., Mormann, F. & Gotman, J. Seizure prediction for therapeutic
devices: A review. J. Neurosci. Methods 260, 270–282 (2016).
58. Pandarinath, C. et al. High Performance communication by people with paralysis using an
intracortical brain-computer interface. 1–27 (2016). doi:10.7554/eLife.18554
59. Jarosiewicz, B. et al. Virtual typing by people with tetraplegia using a stabilized, self-
calibrating intracortical brain-computer interface. IEEE BRAIN Gd. Challenges Conf.
Washington, DC 7, 1–11 (2014).
60. Dangi, S., Orsborn, A. L., Moorman, H. G. & Carmena, J. M. Design and Analysis of
Closed-Loop Decoder Adaptation Algorithms for Brain-Machine Interfaces. Neural
Comput. 25, 1693–1731 (2013).
53
61. Vansteensel, M. J. et al. Fully Implanted Brain–Computer Interface in a Locked-In Patient
with ALS. N. Engl. J. Med. NEJMoa1608085 (2016). doi:10.1056/NEJMoa1608085
62. Little, S. et al. Adaptive deep brain stimulation in advanced Parkinson disease. Ann.
Neurol. 449–457 (2013). doi:10.1002/ana.23951
63. Rosin, B. et al. Closed-loop deep brain stimulation is superior in ameliorating
parkinsonism. Neuron 72, 370–384 (2011).
64. Sun, F. T., Morrell, M. J. & Wharen, R. E. Responsive cortical stimulation for the
treatment of epilepsy. Neurotherapeutics 5, 68–74 (2008).
65. Afshar, P. et al. A translational platform for prototyping closed-loop neuromodulation
systems. Front. Neural Circuits 6, 117 (2012).
66. Khanna, P. et al. with Downloadable Firmware Upgrades. (2015).
67. Kleiner, Mario; Brainard, David; Pelli, Denis; Ingling, Allen; Murray, Richard; Broussard,
C. What’s new in Psychtoolbox-3. Perception 36, 1 (2007).
68. Pelli, D. G. The VideoToolbox software for visual psychophysics: transforming numbers
into movies. Spatial Vision 10, 437–442 (1997).
69. Brainard, D. The Psychophysics Toolbox. Spat. Vis. 10, 433–436 (1997).
70. Dykstra, A. R. et al. Individualized localization and cortical surface-based registration of
intracranial electrodes. Neuroimage 59, 3563–3570 (2012).
71. Desikan, R. S. et al. An automated labeling system for subdividing the human cerebral
cortex on MRI scans into gyral based regions of interest. Neuroimage 31, 968–980 (2006).
72. Fischl, B. FreeSurfer. Neuroimage 62, 774–781 (2012).
73. Oostenveld, R., Fries, P., Maris, E. & Schoffelen, J. M. FieldTrip: Open source software
for advanced analysis of MEG, EEG, and invasive electrophysiological data. Comput.
Intell. Neurosci. 2011, (2011).
74. Fair, D. A. et al. A method for using blocked and event-related fMRI data to study ‘resting
state’ functional connectivity. Neuroimage 35, 396–405 (2007).
75. Galar, M., Fernandez, A., Barrenechea, E., Bustince, H. & Herrera, F. A review on
ensembles for the class imbalance problem: Bagging-, boosting-, and hybrid-based
approaches. IEEE Trans. Syst. Man Cybern. Part C Appl. Rev. 42, 463–484 (2012).
76. Rakotomamonjy, A. Variable Selection Using SVM-based Criteria. J. ofMachine Learn.
Res. 3, 1357–1370 (2003).

54
APPENDIX I: SUPPLEMENTAL METHODS Table 2: Bipolar electrode localization summary for MSIT. Numbers indicate the number of bipolar electrodes included within
each region label.
MG Label 79 86 89 90 95 96 99 102 104 106 107
Left
Accumb. 2 1 1
Amyg. 2 4 4 4 5 2 5 5 2 4
Caudate 7 3 2 7 7
Hipp 1 5 2 5 7 4 10 6 11
dACC 4 1 1 5 3 5 4 2 6
dlPFC 12 8 10 9 15 15 31 16 43 33 35
dmPFC 7 1 3 3 2 19 1 4 6
Insula 1 2 3
lOFC 3 4 2 7 8 7 8 8 4 8
mOFC 2 2 2 1 2 1 3 1 1 3 1
paraHipp 3
post. CC 1
raCC 3 2 3 1 3
Temporal 4 6 6 7 10 19 22 17 13 19 22
vlPFC 1 1 6 9 12 4 12 1 4 4
Right
Accumb. 3 2
Amyg. 4 1 5 5 2 5 5
Caudate 1 8 6 6
Hipp 2 5 6 3 7 3 1 6 11 7
dACC 2 1 1 6 2 2 7
dlPFC 6 6 14 10 23 12 7 1 10 24 20
dmPFC 3 7 3 6 12 3 1 1 8
Insula 2
lOFC 3 5 3 4 8 8 2 13 3 10 7
mOFC 3 1 2 1 2 2
paraHipp 3
post. CC 1
raCC 3 2 1 1 1 3
Temporal 6 4 5 10 12 16 16 23 10 18 8
vlPFC 7 3 3 4 12 3 12 15 2 5 14
Total 61 69 64 83 150 141 139 147 120 162 189

55
Table 3: Bipolar electrode localization summary for the ECR task. Numbers indicate the number of bipolar electrodes included
within each region label.
MG 85 86 88 89 90 96 99 101 102 104 106 107
Left
Accumb.
1
Amyg. 3 4 4 4 4 2 5 3 5
2 4
Caudate
7 3 10 2 7
5
Hipp 2 5 3 3 5 4 10 4
6 11
dACC 3 2 1 1 5
5
4 3 6
dlPFC 9 12 11 10 9 15 31 17 16 43 34 35
dmPFC 2 6 3 1
3 2 10 19 1 4 6
Insula
2 3
lOFC 1 4 4
2 8 7 10 8 8 4 8
mOFC
2 1 1 1 1 3 4 1 1 3 1
paraHipp
3
post. CC
2 1
raCC 1
1
2 3
3
Temporal 5 7 5 6 8 17 22 17 13 13 21 22
vlPFC 2 1
6 12 4 6 11 1 4 4
Right
Accumb.
2
Amyg. 2 2 3 1
5
2 5 5
Caudate 1
1
6
6
Hipp 3 3 2 5 6 7 3
1 6 11 7
dACC 2
2
1 6 1
2 2 7
dlPFC 6 6 9 14 10 12 7 2 1 10 22 20
dmPFC 3 7 5 3 6 4 1 10
1 8
Insula
2
lOFC 2 4 6 3 4 8 2 15 13 3 10 7
mOFC 1
1
1
4 2 1 1 2
paraHipp
3
post. CC 2
3
raCC 2
2
1 1 1
3
Temporal 8 4 7 5 10 14 16
21 10 17 8
vlPFC 5 2
3 4 3 12 8 15 2 5 13
Total 65 71 71 64 84 133 139 122 139 119 162 186

56
APPENDIX II: INVENTION DISCLOSURE Title of the invention: A method for classifying a subject's mental state from electrical brain
activity
Inventors: Nicole Provenza1,2,3, Emad Eskandar3, Darin Dougherty4, Alik Widge4**, David
Borton1,5,6*
Affiliations: 1Brown University School of Engineering, 2Draper, 3Massachusetts General
Hospital Neurosurgery Research, 4Massachusetts General Hospital Psychiatry, 5Brown Institute
for Brain Science, 6Department of Veterans Affairs Center for Neurorestoration and Neurology
Date of Invention Disclosure submission: April, 14th, 2017
Essence of the invention
Engaging in effortful mental action, such as trying to decide between conflicting choices or
suppress an unwanted emotion, activates specific brain networks. This activity differentiates one
behavior from another. Detecting these specific brain states might help us understand how the
brain becomes dysfunctional in neuropsychiatric illness, including but not limited to anxiety,
depression, bipolar disorder, substance abuse, attention deficit disorder, post-traumatic stress
disorder, and traumatic brain injury. It would be possible to identify when a patient is trying to
do a critical mental task, but failing. An intervention, like deep brain stimulation (DBS) could
then be applied to augment the brain's function during that specific effort. The problem is that
there are no documented algorithms for monitoring the brain's electrical activity at a network
level and classifying what the patient is trying to do.
We here propose a novel approach to accurately predict task engagement by harnessing
functional connectivity between brain regions, in tandem with a classifier. Our results show that
we are able to accurately distinguish task engagement from free behavior in humans.
Attached please find a manuscript that discusses the proposed algorithm that has been used to
distinguish task engagement from free behavior using invasive local field potential recordings.
The specific instantiation is conflict tasks and invasive brain recordings, but we believe this
could be extended to almost any mental process and likely to non-invasive recording methods
such as EEG.
A disclosure form has also been submitted to Massachusetts General Hospital, where David
Glass will be leading the patent prosecution.
Novelty and major advantages
We are taking a known technique, canonical correlation analysis, applying it to neural data to
extract neural features, and using these neural features to detect task-related brain states. Based
on classification performance criteria, we identify the specific regional connectivity that
distinguishes task-related brain states. That is, we can now read the brain's network activity,
expressed as the degree to which each pair of regions activates/de-activates in a correlated way.
From that network map, we can tell not what someone is thinking, but what he/she is trying to
do. To our knowledge, this has not been done before.
57
The most immediate use case is closed-loop DBS for psychiatric purposes. We have algorithms
that can change behavior using DBS during standard cognitive tasks. This new invention adds a
missing piece -- telling when a patient is in a "task-like state" or "vulnerable network state".
When we detect that, we would then apply our existing brain stimulation algorithms. Basically,
this new algorithm would detect when a patient is trying to do something with which he/she
tends to need help, then would apply that help.
Each of these network decoders turns out to rely on a small subset of brain regions to guide
accurate classification. The subset of important features we have identified per patient could be
useful for guiding personalized implant locations. If we know that network activity in only these
regions is sufficient to understand someone's mental state, then we should target stimulating and
recording implants to those regions.
We imagine that detecting cognitive brain states could have implications beyond treating
refractory neuropsychiatric illness. For example, knowledge of cognitive state could be insightful
during monitoring of coma patients, rehabilitating cognitive function after strokes, gauging
awareness and emotional state of soldiers, or identifying vulnerable periods for addicts.
Top Related