


Languages
Pages
Legal

UNLV Theses, Dissertations, Professional Papers, and Capstones
5-1-2012
Deciphering the Evolution of Ore Fluids at The Batu Hijau Copper-Deciphering the Evolution of Ore Fluids at The Batu Hijau Copper-
~Gold Porphyry Deposit, Sumbawa, Indonesia ~Gold Porphyry Deposit, Sumbawa, Indonesia
Jordan Thomas Armstrong University of Nevada, Las Vegas
Follow this and additional works at: https://digitalscholarship.unlv.edu/thesesdissertations
Part of the Geochemistry Commons, and the Geology Commons
Repository Citation Repository Citation Armstrong, Jordan Thomas, "Deciphering the Evolution of Ore Fluids at The Batu Hijau Copper-~Gold Porphyry Deposit, Sumbawa, Indonesia" (2012). UNLV Theses, Dissertations, Professional Papers, and Capstones. 1532. http://dx.doi.org/10.34917/4332512
This Thesis is protected by copyright and/or related rights. It has been brought to you by Digital Scholarship@UNLV with permission from the rights-holder(s). You are free to use this Thesis in any way that is permitted by the copyright and related rights legislation that applies to your use. For other uses you need to obtain permission from the rights-holder(s) directly, unless additional rights are indicated by a Creative Commons license in the record and/or on the work itself. This Thesis has been accepted for inclusion in UNLV Theses, Dissertations, Professional Papers, and Capstones by an authorized administrator of Digital Scholarship@UNLV. For more information, please contact [email protected].

DECIPHERINGTHEEVOLUTIONOFOREFLUIDSATTHEBATUHIJAUCOPPER‐
GOLDPORPHYRYDEPOSIT,SUMBAWA,INDONESIA
by
JordanThomasArmstrong
BachelorofScienceAuburnUniversity
2008
Adissertationsubmittedinpartialfulfillmentoftherequirementsforthe
MasterofScienceinGeoscience
DepartmentofGeoscienceCollegeofSciencesTheGraduateCollege
UniversityofNevada,LasVegas
May2012

CopyrightbyJordanArmstrong2012AllRightsReserved
ii
THE GRADUATE COLLEGE We recommend the thesis prepared under our supervision by Jordan Thomas Armstrong entitled Deciphering the Evolution of Ore Fluids at the Batu Hijau Copper-Gold Porphyry Deposit, Sumbawa, Indonesia be accepted in partial fulfillment of the requirements for the degree of Master of Science in Geoscience Department of Geoscience Jean Cline, Committee Chair Adam Simon, Committee Member Rodney V. Metcalf, Committee Member Barbara Luke, Graduate College Representative Ronald Smith, Ph. D., Vice President for Research and Graduate Studies and Dean of the Graduate College May 2012
iii
ABSTRACT
DecipheringtheEvolutionofOreFluidsattheBatuHijauCopper‐GoldPorphyryDeposit,Sumbawa,Indonesia
by
JordanArmstrong
Dr.JeanS.Cline,ExaminationCommitteeChairProfessorofGeology
UniversityofNevada,LasVegas
Fluid inclusions contained within quartz veins from the Batu Hijau Cu‐Au
porphyry deposit in Indonesia were analyzed to track the evolution of fluid
temperature, pressure, and composition during the formation of the deposit to
betterunderstandtheformationofthisandotherCu‐Auporphyrydepositsinorder
aid future exploration. A combination of petrography, microthermometry,
synchrotronx‐rayfluorescence,andlaserablation‐inductivelycoupledplasma‐mass
spectrometrywereusedtodeterminethetemperature,pressure,andcompositional
aspectsofthedeposit.
Four types of fluid inclusionswere recognized at Batu Hijau based on the
volume percent of the vapor bubble; inclusions were classified as VB35, VB20H,
VB60,andVB85typeinclusions.Ahightemperature,non‐reactivefluidtrappedin
VB60inclusionswasintroducedtothesystemfirst,wasassociatedwithonlyminor
oremineralprecipitation,andwas likely linked tohigh temperaturealteration. A
second, lower temperature, highly reactive fluid trapped in VB35 inclusions was
then introduced to the system andwas likely responsible for themajority of ore
mineral precipitation as well as lower temperature alteration assemblages. This

iv
second fluid became immiscible during its ascent to the surface, forming a highly
reactive brine and a non‐reactive vapor, trapped in VB20H and VB85 inclusions,
respectively.
Whilethesetwofluidsseemtemporallydistinct,futurestudiesinvestigating
theexacttimingoforefluidintroduction,andtheassociationoforefluidspulsesto
magmatic intrusions is required to full understand the temporal relationships of
fluids at Batu Hijau. If fluid inclusions can be petrographically linked to distinct
intrusion events, a complete four‐dimensional model for fluid evolution can be
completed, providing a valuable new tool to aid in the exploration of Cu‐Au
porphyrydeposits.

v
ACKNOWLEDGMENTS
Thisstudywouldnothavebeenpossiblewithoutthefinancialassistanceof
the Newmont Mining Corporation and Antonio Arribas, the Society of Economic
GeologistsincooperationwithNewmontMiningCorporation,theUNLVDepartment
ofGeosciences,andtheUNLVGraduateStudentAssociation. Iwouldliketothank
Dr.KarenAppelatDESYinHamburg,Germanywhoprovidedcost‐freesynchrotron
x‐ray fluorescence analyses and assistance in data interpretation. Iwould like to
thank Johan Arif and the entire staff of mining geologists at Batu Hijau for their
expertise,patience,andhospitalityduringmytimeinIndonesia.Iwouldalsoliketo
thankDr.BobBodnarandDr.LucaFederlefromtheFluidResearchLabatVirginia
TechUniversity for their assistance associatedwith LA‐ICP‐MS analyses and data
interpretation.
Mostofall, Iwould like to thankmyadvisor,Dr. JeanCline, forher insight,
patience,andunendingknowledgeandexpertiserelatingtothisstudyandgraduate
school in general. Her input was invaluable, and the completion of this project
wouldnothavebeenpossiblewithouther.
Finally Iwould liketo thankallofmyfriends,andespeciallymyfamily, for
theirunwaveringsupportduring thisproject,andbeyond. Without theirsupport,
understandingandencouragement,thisprojectwouldnothavebeenpossible.

vi
TABLEOFCONTENTS
ABSTRACT....................................................................................................................................................iii
ACKNOWLEDGMENTS.............................................................................................................................v
LISTOFTABLES.....................................................................................................................................viii
LISTOFFIGURES.......................................................................................................................................ix
CHAPTER1:INTRODUCTION...............................................................................................................1
CHAPTER2:GEOLOGICBACKGROUND...........................................................................................3
CHAPTER3:METHODS...........................................................................................................................7 SampleSelection.................................................................................................................................................7 Macroscopic&MicroscopicPetrography.................................................................................................8 FluidInclusionPetrography..........................................................................................................................9 Microthermometry..........................................................................................................................................12 SynchrotronX‐RayFlourescence(SXRF)...............................................................................................12 LaserAblation–InductivelyCoupledPlasma–MassSpectrometry(LA‐ICP‐MS)...................14
CHAPTER4:PETROGRAPHICSTUDY............................................................................................15 FluidInclusionOrigins...................................................................................................................................15 FluidInclusionTypes......................................................................................................................................16 FluidInclusionsAbundances.......................................................................................................................17
CHAPTER5:MICROTHERMOMETRY.............................................................................................20 MicrothermometricData...............................................................................................................................20 MicrothermometricDiscussion..................................................................................................................22 ConstantDensityIsochors............................................................................................................................22 InclusionsDepths&Pressures...................................................................................................................24 TrappingTemperatures................................................................................................................................24
CHAPTER6:SYNCHROTRONX‐RAYFLOURESCENCE..........................................................27 SXRFData.............................................................................................................................................................27 SXRFDiscussion................................................................................................................................................30
CHAPTER7:LASERABLATION‐INDUCTIVELYCOUPLEDPLASMA‐MASSSPECTROMETRY.....................................................................................................................................34 LA‐ICP‐MSData.................................................................................................................................................34 X‐YPlots...............................................................................................................................................................36 X/NaPlots............................................................................................................................................................38 DiscussionofX‐YandX/NaPlots..............................................................................................................46 SpatialdistributionofCuConcentrationsinFluidInclusions.......................................................48 CopperconcentrationsandtheirrelationtoknownCugrades....................................................51AbsenseofAuinLA‐ICP‐MSresults.........................................................................................................53
CHAPTER8:MODELFORDEPOSITFORMATION....................................................................53 Fluid1:VB60Inclusions................................................................................................................................56 Fluid2:VB35,VB20H,andVB85sInclusions.......................................................................................57
CHAPTER9:CONCLUSIONS...............................................................................................................62
TABLES........................................................................................................................................................63

vii
FIGURES......................................................................................................................................................69
APPENDICES...........................................................................................................................................118 Appendix1MicrothermometricData...................................................................................................118 Appendix2LA‐ICP‐MSData......................................................................................................................129 Appendix2.1VB35LA‐ICP‐MSData................................................................................................129 Appendix2.2VB20HLA‐ICP‐MSData.............................................................................................141 Appendix2.3VB60LA‐ICP‐MSData................................................................................................149 Appendix2.4VB85LA‐ICP‐MSData................................................................................................157
REFERENCES..........................................................................................................................................161
CV.................................................................................................................................................................166

viii
LISTOFTABLES
Table1.LA‐ICP‐MSinstrumentanddataparameters............................................................63 Table2.CalculatedtrappingtemperaturesforVB35inclusions.......................................64
Table3.CalculatedtrappingtemperaturesforVB20Hinclusions....................................65
Table4.SummaryofLA‐ICP‐MSData............................................................................................66
Table5.SummaryofR2valuesforX‐Yplots..............................................................................67Table6.RangesofratiosforX/Naplots.......................................................................................68
ix
LISTOFFIGURES
Figure1Locationmap..........................................................................................................................69
Figure2Regionalgeologicmap........................................................................................................70
Figure3SimplifiedEast‐Westcrosssection...............................................................................71
Figure4VeintypesattheBatuHijau.............................................................................................72
Figure5LA‐ICP‐MSschematicdiagram........................................................................................73
Figure6FluidinclusiontypesatBatuHijau...............................................................................74
Figure7Fluidinclusionabundances..............................................................................................75
Figure8Histogramsforsalinityandhomogenizationtempteratures............................76
Figure9ConstantdensityisochorsforVB35inclusions.......................................................77
Figure10ConstantdensityisochorsforVB20Hinclusions.................................................78
Figure11ConstantdensityisochorsforVB60inclusions....................................................79
Figure12TrappingtemperaturesforVB35andVB20Hinclusions................................80
Figure13SXRFelementaldistributionmapsforinclusion#BH044...............................81
Figure14SXRFelementaldistributionmapsforinclusion#BH039...............................82
Figure15SXRFelementaldistributionmapsforinclusion#BH061...............................83
Figure16SXRFelementaldistributionmapsforinclusion#BH023...............................84
Figure17SXRFelementaldistributionmapsforinclusion#BH036...............................85
Figure18SXRFelementaldistributionmapsforinclusion#BH033...............................86
Figure19SXRFelementaldistributionmapsforinclusion#BH026...............................87
Figure20SXRFelementaldistributionmapsforinclusion#BH021...............................88
Figure21SXRFelementaldistributionmapsforinclusion#BH057...............................89
Figure22Navs.Kplot..........................................................................................................................90
x
Figure23Mnvs.Kplot.........................................................................................................................91
Figure24Mnvs.Znplot......................................................................................................................92
Figure25Cuvs.Kplot..........................................................................................................................93
Figure26Cuvs.Mnplot......................................................................................................................94
Figure27Cuvs.Znplot........................................................................................................................95
Figure28Cuvs.Feplot........................................................................................................................96
Figure29Cuvs.Pbplot........................................................................................................................97
Figure30Cavs.Naplot........................................................................................................................98
Figure31Cavs.Kplot..........................................................................................................................99
Figure32Cuvs.Naplot.....................................................................................................................100
Figure33Cuvs.Caplot......................................................................................................................101
Figure34Cuvs.Baplot......................................................................................................................102
Figure35Mnvs.Feplot.....................................................................................................................103
Figure36Mnvs.Pbplot....................................................................................................................104
Figure37Znvs.Feplot......................................................................................................................105
Figure38LA‐ICP‐MSdataforgroup1elementsratioedtoNa........................................106
Figure39LA‐ICP‐MSdataforgroup2elementsratioedtoNa........................................107
Figure40LA‐ICP‐MSdataforgroup3elementsratioedtoNa........................................108
Figure41AverageCuconcentrationsforVB35inclusionsandFIAs.............................109
Figure42AverageCuconcentrationsforVB20HinclusionsandFIAs.........................110
Figure43AverageCuconcentrationsforVB60inclusionsandFIAs.............................111
Figure44AverageCuconcentrationsforVB85FIAs............................................................112
Figure45CuconcentrationversusgradeforVB35inclusionsandFIAs.....................113

xi
Figure46CuconcentrationversusgradeforVB20HinclusionsandFIAs..................114
Figure47CuconcentrationversusgradeforVB60inclusionsandFIAs.....................115
Figure48CuconcentrationversusgradeforVB85FIAs....................................................116
Figure49H2O‐NaClphasediagram..............................................................................................117

1
CHAPTER1
INTRODUCTION
The Batu Hijau porphyry Cu‐Au deposit is a world‐class island arc type
porphyry deposit, located on the southwestern portion of Sumbawa Island, Nusa
Tenggara Barat Province, Indonesia. This 12 km by 6 km district contains an
estimated914milliontonnesoforeatanaveragegradeof0.53%Cuand0.40g/tAu
(Garwin,2002;ArifandBaker,2004),andisoneofthelargestandrichestporphyry
Cu‐AudepositsinAsia.
Orefluidsproduceddistinctquartz±sulfideveinsandveinletsthatcrosscut
the tonalite intrusions and their surroundinghost rocks.Within these veins, fluid
inclusions trapped in quartz contain ore fluids, which represent fluids moving
through the deposit during the time of its formation. The ore fluids in the fluid
inclusionsarekeytodefiningthetemperatureandpressureconditionsunderwhich
the deposit formed, and defining the geochemistry of the hydrothermal system,
whichwasresponsibleforthedistributionCuandAuwithinthedeposit.
Preliminary fluid inclusion studies have suggested that deposit formation
temperatures ranged from 280 to over 700 °C. Based on the coexistence of
magnetite‐bornite chalcocite,Garwin (2000) suggested that theearliest veins at
BatuHijaulikelyformedat>500–700°C(cf.Simonetal.,2000).Apreliminaryfluid
inclusionstudybyGarwin(2000)oninclusionsinhalite‐bearingtransitionalveins
produced homogenization temperatures that ranged from about 450 to 500 °C.
These temperatures are consistent with phase equilibria temperature estimates
based on a chalcopyrite bornite vein mineralogy (Simon et al., 2000).

2
Homogenizationtemperaturesof<400°CwereobtainedbyGarwin(2000)forlate
pyrite‐bearing veins. A fluid inclusion study conductedby Imai andOhno (2005)
documentedhomogenizationtemperaturesrangingfrom280to454°C,significantly
lowerthantemperaturesobtainedbyGarwin(2000).Thistemperatureissimilarto
Ausaturationtemperaturesforbornite(~300°C)andchalcopyrite(250°C)(Kesler
etal.,2002;Arif&Baker,2004).
A detailed fluid inclusionmicrothermometry study to clarify processes of
ore formation is warranted. Microthermometric data on well‐characterized fluid
inclusionswithappropriatepressurecorrectionscanprovidethetemperaturesand
pressuresatwhichthedepositformed.Additionalqualitativeandquantitativedata
fromsynchrotronx‐rayfluorescence(SXRF)andlaserablationinductivelycoupled
plasmamass spectrometry (LA‐ICP‐MS), respectively, can document and quantify
major and trace element concentrations. Such data will contribute to a model
describingthetransportofmetalsbyhydrothermal fluids,andtheprecipitationof
Cu‐andAu‐bearingminerals.
3
CHAPTER2
GEOLOGICBACKGROUND
The island of Sumbawa, situated adjacent to the margin of the Sunda
continental shelf and lying within the Sunda‐Banda magmatic arc (Figure 1), is
comprised of an Early Miocene to Holocene volcanic arc complex overlying
approximately14to23kmofoceaniccrust(Hamilton,1979;Barberietal.,1987).
ThesouthwesternportionofSumbawaIsland,whereBatuHijau is located(Figure
2), iscomprisedofEarlyTertiary, low‐K,calc‐alkaline toweaklyalkalineandesitic
volcanic and volcaniclastic rocks (Clode etal., 1999). These include andesitic tuff,
breccia, fine‐grained volcaniclastic sandstones and mudstones, and porphyritic
andesite thatmakeupthepre‐mineralizationrocksof theBatuHijaudistrict.This
andesitic volcaniclastic rock succession was intruded by at least three distinct
hypabyssal andesites, at least four equigranular quartz diorite plutons, and three
successivetonaliteintrusions,whichformedthedikeandstockcomplexthatforms
thecoreoftheBatuHijauCu‐Audeposit(Clodeetal.,1999;Garwin,2002).Figure3
showsacross‐sectionthroughthecoreoftheBatuHijaudeposit;rockunitsinthis
figure, and all subsequent figures, are simplified, and the various andesitic and
dioritic units are not differentiated. Clode et al. (1999) identified three tonalite
intrusions: the Old Tonalite, Intermediate Tonalite, and Young Tonalite based on
their relativeages tooneanother fromcross‐cuttingrelationships. These tonalite
porphyry stocks were emplaced at the contact between the quartz diorite and
andesitic volcaniclastic succession (Clode et al., 1999). The emplacement of
Intermediate and Young Tonalite destroyed and over‐printed most of what may

4
havebeenOldTonalite.Only small remnants ofOldTonalite, situated around the
edgesof the IntermediateTonalite intrusion, remain, and arenot large enough to
appearinFigure3andallsubsequentfigures.Emplacementofthetonaliteporphyry
complexwasrapid,withthethreetonalitepulsesoccurringbetween3.76±0.12Ma
to3.67±0.10Ma, asdatedon zirconsusingU‐PbSHRIMPdating (Fletcheretal.,
2000;Garwin,2000).
Clode et al. (1999) and Garwin (2000; 2002) hypothesized that most
mineralizationisgeneticallyrelatedtotheOldandIntermediateTonalites,withthe
majorityofmineralizationassociatedwithorefluidsderivedfromtheOldTonalite.
Higher Cu and Au grades, commonly > 1% Cu and > 1.0 g/t Au, are spatially
associated with the Old Tonalite and its adjacent host rocks (Clode et al., 1999).
Copper and Au grades decrease in the bulk of the Intermediate Tonalite and its
surroundinghostrock(<1%Cuand<1.0g/tAu),andverylowgradesarepresentin
the Young Tonalite (<0.3% Cu and <0.5 g/t Au) (Clode et al., 1999). A strong
positivecorrelationexistsbetweenquartzveindensityandCuandAugrades,with
thehighestveindensitybeingassociatedwiththeOldTonalite(Clodeetal.,1999).
Hydrothermal alteration and mineralization of the tonalite porphyry
complex and surrounding host rocks formed during five distinct stages termed
Early, Transitional, Late, Very Late, and Zeolite (Mitchell et al., 1998). Early
alterationandmineralizationarerelatedtotheintrusionofalltonalites(Clodeetal.,
1999),whiletransitionalandlaterstagesofalterationandmineralizationpostdate
thetonaliteintrusionsandoverprintearlieralterationandmineralization(Clodeet
al.,1999).

5
Hydrothermal alteration assemblages at Batu Hijau are characteristic of
porphyryCu‐Audepositsinislandarcs(Sillitoe,1990).Acentralpotassicalteration
zone formed by prograde hydrothermal activity grades outward into a zone of
extensive propylitic alteration (Meldrum et al., 1994). Widespread fracture‐
controlledintermediateargillicalterationcontainingchlorite,andphyllicalteration
withoutchlorite,variablyoverprintedthisprogradealterationenvelope.Retrograde
alterationischaracterizedbysericite(Meldrumetal.,1994).Alatesodicalteration
assemblage has been identified overprinting earlier potassic, propylitic,
intermediateargillic, andphyllic alteration indrill core (Meldrumetal., 1994).At
the surface, argillic and advanced argillic alteration are present (Meldrum et al.,
1994).
Fourmaincategoriesofquartzveins,A,B,C,andDveins,arepresentatBatu
Hijau (Clode et al., 1999). Formed during the early alteration stage, A veins are
typically thin (less than1cmthick),have irregularedgesrather thanstraight,are
composed of fine‐grained granular quartz, are typically not banded, and lack a
center‐line (Figure4a). Includedwithinwith the “A” familyofveinsareABveins
thatareslightlythicker,upto2cm.ABveinsrepresentatransitiontoBveinsthat
contain a bornite chalcopyrite‐filled centerline (Clode et al., 1999) (Figure 4b).
Formed throughout the transitional alteration stage, B veins are associated with
lowerCu‐AugradesthantheAveins(Clodeetal.,1999).Bveinsaretypicallynear2
cm in thickness and have vuggy centerlines occupied by chalcopyrite and bornite
(Clodeetal.,1999) (Figure4c).Bveinscommonlyhaveabanded textureandare
characterizedbytheinwardgrowthofcoarsequartzcrystalswitheuhedralcrystal
6
faces toward the centerline of the vein (Clode et al., 1999). C veins also formed
during transitional alteration stages, and are typically thin and completely
composedof chalcopyritebornite (Clodeetal.,1999).Dveinscontainabundant
coarse pyrite and lesser quartz (Arif & Baker, 2004), are related to late stage
alteration,andaregenerally0.5–2cmthick(Clodeetal.,1999)(Figure4d).Dveins
arereadily identifiedby their largesizeandextensiveorangeandyellowoxidized
feldsparalterationhalos.

7
CHAPTER3
METHODS
SampleSelection
DuringtwofieldseasonsattheBatuHijaumine,186sampleswerecollected
fromdrillcorespanning14drillholes.Amajorityofsamples(157)werecollected
from drill core referenced to an East‐West oriented cross section (090). An
additional 13 and 16 sampleswere collected from drill core referenced to radial
crosssectionsorientatedat040and080,respectively.
SamplingwasaidedbyNewmontdrilllogs,andaimedatprovidingsamples
of the Old, Intermediate, and Young Tonalites, along with their surrounding host
rocks from across the deposit. Lithologic contacts between tonalite units were a
priorityduringsampling,asweresamplesofvariousveintypesincludingA,AB,B,C,
andDveins.Attentionfocusedonlocalitiesthatdisplayedhighquartzveindensity,
increasingthe likelihoodofcrosscuttingveinrelationships. Samplingalso focused
onareaswithhighCuandAuassayvalues,andareasthatdisplayeddiversityinCu‐
Fesulfideminerals.
Specificareas targeted forsampling, identifiedbyminegeologists, included
the ‘barrencore’, the ‘westernflank’,andthe ‘centralporphyryzone’. The ‘barren
core’isthedeep,centralportionoftheintrusivecomplex,mostlycomprisedofthe
Intermediate Tonalite. It has been hypothesized that this location could provide
fluid inclusions that sampled “parental” ore fluids based on the proximity to the
underlyingmagma chamber that sits below thedeposit. The ‘barren core’ atBatu
Hijau generally contains lowCu andAu, and ore fluids that traveled through this
8
regionarethoughtohavetransportedmetals. Ifcorrect,fluidinclusionsfromthis
region would provide data on the deepest available ore fluids and a baseline to
evaluatefluidevolutionacrossthesystem.
The ‘western flank’was of interest due to its unusually high Au/Cu ratios.
Au/Curatiosofthree‐to‐one(ppmAu/weightpercentCu)arecommonplaceinthis
region, whereas one‐to‐one Au/Cu ratios are present in the remainder of the
deposit. The ‘western flank’ was primarily sampled above and surrounding the
‘barrencore’,whereAuandCugradesbegintoincrease.
The ‘central porphyry zone’ is the part of the deposit that comprises the
majorityoftheeconomicdeposit inthemidandshallowlevelsof thedeposit,and
refers to the remainder of the deposit not occupied by the two previously
mentioned sampling areas. It was sampled vertically and horizontally to obtain
samplesthatcouldprovideathreedimensionalviewoforefluidsacrossthesystem.
Sample locations ranged fromdeep in the system, just above the ‘barren core’, to
shallowsampleswithin100metersofthepaleosurface.
Samplesselected fromdrill corewerehalved,described,andphotographed
attheminesite.Sampleswerelabeledwithdrillholenumber,footage,andAuand
Cugradesobtainedfromdrilllogs.
Macroscopic&MicroscopicPetrography
Core samples were examined to identify samples that could provide fluid
inclusionsand fluid inclusionassemblages todetermineore fluidevolutionwithin
the system. To accurately identify ore minerals, fluid inclusion assemblages, and
9
veintypes,doublypolishedthicksectionswerepreparedfrom53samples.Samples
that showed vein truncations at lithologic contacts or cross cutting vein
relationships or that showed any other relevant textural featureswere preferred.
TransmittedandreflectedlightmicroscopywereconductedonNikonOptiphotand
OlympusBX60polarizedlightmicroscopes.
Vein relationships were further examined with the aid of microscopy,
allowing vein types to be described in detail, and the nature of cross cutting
relationships to be determined. Cathodoluminescence (CL) was not used in this
study as previous attempts to identify different generations of quartz using this
technique identified only a single CL signal (J. Cline, Personal Communication,
2009).Previouslydescribedmineralassemblagesandveincharacteristics(Proffett,
1998;Clodeetal.,1999)wereusedtoaccuratelyidentifypreviouslydescribedvein
types and sub‐types. Quartz structures and textures, such as the orientation of
quartzcrystalgrowth invein,alongwiththe lawofsuperpositionandveinoffsets
were used to determine vein paragenesis and the nature of crosscutting
relationships.
FluidInclusionPetrography
Fluid inclusions contain small samples of an ancient hydrothermal system.
Byanalyzingfluidinclusionsacrossahydrothermalsystem,changesintemperature,
pressure,andcompositionthroughtimeandspacecanbetracked.
Most inclusionsselectedforanalysescomprisefluid inclusionsassemblages
(FIAs),whichtrappedahydrothermalfluidatthesametime,andapproximatelythe

10
same pressure and temperature conditions. Inclusions that comprise FIAs have
consistentphaserelationships,shouldhomogenizeataboutthesametemperature,
and should provide consistent compositional and salinity data (Goldstein &
Reynolds, 1994). Assemblageswere identifiedasprimary (P), secondary (S), and
pseudo‐secondary(PS)basedontheclassificationofRoedder(1984),Bodnaretal.
(1985), and Goldstein & Reynolds (1994), or unknown (U) (J. Cline, Personal
Communication, 2011). PrimaryFIAs formedduring theprecipitationof thehost
mineral contain fluids thatprecipitated thehostmineral, andcanbe identifiedby
theirpresencewithinmineralgrowthzones(Goldstein&Reynolds,1994).FIAsthat
trappedfluidswithinhealedmicrofracturesordeformationstructuresarereferred
toassecondary(Goldstein&Reynolds,1994).SecondaryFIAscrosscutsomeorall
mineral growth zones and are characterized by a curvi‐planar morphology
(Goldstein&Reynolds,1994).Pseudo‐secondaryFIAsarethosethatshareasimilar
morphologywith secondary FIAs, but are truncated at a growth zone in the host
mineralcrystal(Goldstein&Reynolds,1994). UnknownFIAsarethoseforwhich
an origin cannot be determined (J. Cline, Personal Communication, 2011). In
additiontoFIAs,alimitednumberofisolated,non‐FIAinclusionswereselectedfor
SXRFanalyses.
Individualfluidinclusionsandfluidinclusionassemblageswerecategorized
and labeled based on their relative liquid to vapor ratios, and labels indicate the
approximatevolumepercentoccupiedbythevaporbubbleonascaleof0to100%.
Other inclusion characteristicsnotedduringpetrography include: thepresenceor
absenceofhaliteorothertranslucentdaughtercrystals,thepresenceorabsenceof

11
opaque daughter crystals and their abundance, the size of inclusions measured
paralleltotheirlongestdimension,andtheveintypecontainingtheinclusion.Fluid
inclusionandFIAlocationswerephotographedanddescribed.
Fluid inclusions analyzed by LA‐ICP‐MS or SXRF had to meet additional
analyticalrequirements.Inclusionswererequiredtobe10morlargeralongtheir
longestdimension. ShallowinclusionswerealsonecessaryforbothSXRFandLA‐
ICP‐MSanalyses.ForSXRFanalyses,inclusionschosenweregenerallywithin5–12
mof the thick section surface, and rarelyexceededadepthof15m. Inclusions
selected forLA‐ICP‐MSanalysesweregenerally5–15mdeep,andfluid inclusion
depthneverexceededthelongestmeasureddimensionoftheinclusion.Inclusions
large enough for SXRF analyses tended to be single isolated inclusions, usually of
unknown origin, and rarely of secondary origin. The host mineral crystal
surrounding the inclusion was required to be free of other fluid or mineral
inclusions that would obstruct data collection. Inclusions that appeared to be
necked or show any other indications of post‐entrapment deformation or
disturbancewereavoided. Fluid inclusions selected forLA‐ICP‐MSanalyseswere
alwayspartofafluidinclusionassemblage.
Also important to the interpretation of fluid inclusionsdata are the spatial
relationships of analyzed inclusions to the hydrothermal system. Targeted fluid
inclusions represent amulti‐dimensional volumewithin the deposit ranging from
deeptoshallow,andlaterallyacrossthesystem.

12
Microthermometry
Microthermometrywasemployedona totalof324 inclusionstodetermine
homogenization temperaturesandsalinities, andminimumtrapping temperatures
were calculated for individual fluid inclusions and fluid inclusion assemblages.
Heating and freezing measurements were preformed on a Linkam THMSG 600
heating and freezing stage on an Olympus BX60 petrographic microscope,
controlled via Linksys32 software. Freezing analyses were performed first, and
observationsweremadeonmultiplefluidinclusionssimultaneously,notingfinalice
melting temperature, clathrate melting temperature, and hydro halite melting
temperature.Icemeltingtemperatures(Tm)to0.1Cwerecollectedbycyclingin
order to assure complete ice melting. Samples were then heated in 10 C
incremental steps to determine homogenization temperatures. Halite melting
temperatures(TmH)werealsocollected.
To preserve fluid inclusion integrity for later LA‐ICP‐MS analysis, inclusions
weregenerallynotheatedabove500C,asinclusionstendedtodecrepitateabove
475C.Vapor‐richinclusionswereheatedincrementallyuntilaliquidphasewasno
longer visible within the inclusion; these temperatures represent a minimum
homogenizationtemperatureforallvapor‐richinclusionsasexacttemperaturesof
homogenizationtovaporcannotbeaccuratedetermined(Sterner,1992).
SynchrotronX‐RayDiffraction(SXRF)
SXRF analyses were conducted at Beamline L at the Hamburger
Synchrotronstrahlungslabor (HASYLAB) at Deutsches Elektronen‐Synchrotron

13
(DESY), Hamburg, Germany by Dr. Karen Appel. A 4.5 GeV positron beam was
deflectedbyamagnetwitha12.12mbendingmagnetandprovidesa continuous
spectrumwithacriticalenergyof16.6KeV.For themeasurements,30.5KeVwas
selected with a double multilayer monochromator for the first measurements;
detection was accomplished by the use of a Si (Li) detector. With this set‐up,
elementswithatomicnumberupto51canbedetectedviaK‐shellexcitation,while
lighter elements are detected by L‐shell excitation. As notmuch informationwas
gained from elements with atomic number between 51 and 39, energies were
changedto17KeVinthenextstepthusallowingdetectionofelementswithZupto
38 via K‐shell excitation. This set up employed a silicon drift detector,which can
process higher count rates and is optimized for energies below 20 KeV, thus
enablingfastermeasurements.
The spot sizediameter of the incidentphotonbeamwas either5m2or15
m2.Stepsizesoftheelementalmappingswereadjustedtothespotsizeandwere5
m2 and 10m2, respectively (Appel, personal communication, 2011). Pixel size
was10squaremicrometersforallinclusions. Analyticaltimesbetween15and60
secondsperpointwereused,andthenumberofpointswasdeterminedbythefluid
inclusion size and the resolution of the beam (Rickers, 2006). To ensure that the
entirefluidinclusionwasincludedineachmeasurement,anexaggerationfactorof
at least 3‐4 timeshorizontally and at least 2‐2.5 times vertically beyond the fluid
inclusionwasused(Rickers,2006).Elementaldistributionmapswerealignedwith
aphotomicrographofeachanalyzedfluidinclusiontobetterdisplaythedistribution
ofanelementwithinasinglefluidinclusion.
14
LaserAblation–InductivelyCoupledPlasma–MassSpectrometry(LA‐ICP‐MS)
The primary tool used to quantify the composition of fluid inclusionswas
laserablation‐inductivelycoupledplasma‐massspectrometry. LA‐ICP‐MSanalyses
were conducted at the Fluids Research Lab at Virginia Tech University using an
Agilent7500cequadrupoleICP‐MScoupledwithaGeolasArF193nmEximerlaser
ablation system; see Table 1 for complete LA‐ICP‐MS instrument and data
parameters.Transportofablatedmaterialwasaccomplishedwithaheliumcarrier
gas.Atotalof225fluidinclusionsfrom46fluidinclusionassemblageswereablated
andanalyzed.Includedwere16individualinclusionspreviouslyanalyzedbySXRF.
The analytical setup and procedures used are summarized in Figure 5
(Heinrichetal., 2003). Two to five sample chips andNIST610glasswere loaded
into a fast purge ablation cell and the system was pumped down. The helium
background signal was measured for approximately 60 seconds prior to 40‐60
secondsofablationofNISTstandardglass;thisprocesswascompletedtwiceprior
tothefirstfluidinclusionablation.Drillingofthesamplebeganwithasmallbeam
size (typically 10 m), and the beam size was stepped up to themaximum fluid
inclusiondimension.Thesignalwasmonitoredinrealtimeandablationcontinued
untiltheentirecontentsoftheinclusionwereablatedandanalysisoftheinclusion
wascompleted.Uponablationofthelastfluidinclusion,analysisofNIST610glass
wasrepeatedtocorrectforinstrumentdrift.
Data reductionwas completedusingAMS software. Element signalswere
integrated from the first elementpeaksuntil the signal forNadroppedbelow the
signalforKorthenextmostabundantelement.
15
CHAPTER4
PETROGRAPHICSTUDY
FluidInclusionOrigins
The selection of fluid inclusions formicrothermometric, SXRF, and LA‐ICP‐
MS analyses relied on the accurate classification of the origin of fluid inclusion
assemblages (FIAs). All four FIA types, primary inclusions in growth zones,
secondary inclusions in healed fractures, pseudo‐secondary inclusions in healed
fractures terminating at a grown zone, and unknown inclusions with no clear
texturalfeatures,wereidentifiedinquartzveins.
Primary FIAs were surprisingly abundant throughout the deposit and are
foundinnearlyallsamples.However,allprimaryassemblagescontainedinclusions
<3minsize,whichweretoosmallforaccurateidentificationofinclusionphases,
and observation of phase changes duringmicrothermometric measurements was
notpossible. Due to their small size,noprimaryFIAswereanalyzedduring this
study.
ThemajorityofFIAsidentifiedwithinthedepositweresecondaryinorigin.
Duetoabundantfracturingduringtheformationofporphyrytypedeposits,healed
fractures containing secondary FIAs are common. Secondary FIAs are present
throughoutthedeposit,andshownobiaswithrespecttolocation.
Pseudo‐secondaryFIAsatBatuHijauwere rarely identified, and theywere
not observed at depths below850meters. The lack of definitive growth zones in
quartz made identifying pseudo‐secondary FIAs difficult. No observed pseudo‐
secondaryFIAcontainedinclusionslargeenoughforanalyses.

16
Due to the complex three‐dimensional distribution of fluid inclusions, the
vastmajorityoffluidinclusionsatBatuHijauareofunknownorigin.Single,isolated
inclusionsarecommoninadditiontoinclusionpairsandsmallgroupsofinclusions;
the complex three‐dimensional distribution of abundant fluid inclusions added to
theambiguityoftheoriginofmanyinclusions.
FluidInclusionTypes
Fluid inclusions and FIA types were classified by the apparent volume
percent of their contained vapor bubbles at standard temperature and pressure.
Inclusionsweredividedintooneoffourcategories:VB35,VB20H,VB60,andVB85,
where ‘VB’stands for ‘vaporbubble’, thenumericvalue indicates theapproximate
volumepercentoftheinclusionoccupiedbythevaporbubble,and‘H’indicatesthe
presenceofahalitedaughtercrystal.
VB35inclusionscontainapproximately30to45volumepercentvapor;most
do not contain daughter crystals (Figure 6a and 6b). Some inclusions contain a
small, triangular, opaque daughter crystal, but don’t contain translucent daughter
crystals. VB35 inclusions commonly form large, planar arrays of small (1‐3m)
secondaryinclusions, lineararraysof larger(5‐30m)secondaryFIAs,or isolated
inclusionsofunknownoriginthatvarygreatlyinsize(1‐55+m).
VB20Hinclusionsarebrineinclusionsthatcontainapproximately20volume
percent vapor and 80 volume percent liquid (Figure 6c and 6d), plus a halite
daughtercrystal.Somebrine inclusionscontainupto7additional translucentand
opaquedaughtercrystals.Thesecondmostcommontranslucentdaughtercrystalin
17
porphyry systems is KCl (sylvite), and a red translucent daughter, probably
hematiteispresentinsomeinclusions.Additionaltranslucentdaughtersarepresent
butmineralogyisunknown.VB20Hinclusionscommonlyoccurinplanarsecondary
assemblagesofbetween4and20inclusions,orasindividualinclusionsofunknown
origin.VB20Hssmallerthan5mareuncommonandtheyrangeinsizeuptoabout
60m.Inseveralsamples,VB20Hinclusionswereobservedtoco‐existinthesame
assemblagewithVB85inclusions.
VB60 inclusions contain approximately 60 volume percent vapor and 40
volumepercent liquid,butcanrange from55to75volumepercentvapor(Figure
6e, 6f and 6g). These inclusions rarely contain halite or other daughter crystals.
VB60 inclusionsare typicallyofunknownorigin, and less commonlyof secondary
origin;inclusionsrangeinsizefrom3to20m.
VB85 inclusions contain approximately 85 volume percent vapor and 15
volumepercent liquid, thoughthevaporcanrange from75toalmost100volume
percentvapor(Figure6hand6i).Theseinclusionswereneverobservedtocontain
daughter crystals, and they typically have an unknown origin. They occasionally
occur in secondary FIAs, and are also found coexisting in an FIA with VB20H
inclusions.VB85inclusionstypicallyrangefrom5to40m,butinclusionsaslarge
as80mwererarelyobserved.
FluidInclusionsAbundances
Relativeabundancesofeachfluidinclusiontypeforagivensamplelocation
wereapproximatedinAandABveinspresentinathicksectionandnormalizedto

18
100% (Figure 7). VB35 Inclusions are most common deep in the hydrothermal
system and become less common at shallow depth; however, they are present
throughouttheentiresystem.VB35inclusionsrepresent60‐70%ofallinclusionsin
A and AB veins in the deepest parts of the system, from 850 m to the deepest
samplesat1300mdepth.VB35sshownolateralvariationinabundance,thougha
dramaticchangeindistributionoccursabove850mdepth.Abovethisdepth,VB35s
nolongerdominateandgenerallyrepresentbetween10and25%ofall inclusions
observedinAandABveins.Twoexceptionsoccurat800and660mdepth,where
VB35 inclusions comprise 45% and 90% of inclusions found in A and AB veins,
respectively.
VB20Hinclusionsarerareinthedeepestpartofthesystem,from1300mto
1000mdepth,wheretheygenerallycompriselessthan10%ofinclusionsobserved
inAandABveins(Figure7).Above850m,VB20Hsaregenerally,butnotalwaysthe
mostabundantinclusiontype,comprising35to70%ofallinclusionsobservedinA
andABveinsatanyonelocation.VB20Hinclusionsdominatetheupperhalfofthe
hydrothermalsystemalongwithVB85inclusions.
VB60 Inclusions are the least abundant inclusions observed in A and AB
veins, but they are present throughout the system and in relatively consistent
abundances;inonlyonelocation,at180mdepth,doVB60scomprisemorethana
thirdoftheobservedinclusions(Figure7).VB60inclusionsgenerallymakeupless
than18%ofobservedinclusionsatanygivenlocation.
VB85inclusionsareabundant inAandABveinsabove850mdepthwhere
they account for 25‐50% of observed inclusions (Figure 7). Above 300m, VB85

19
inclusionsarethemostabundantinclusiontypeinAandABveins.Inthedeeppart
of thesystem,theytypicallycomprise lessthan5%ofall inclusionsobserved inA
and AB veins. VB85 inclusions typically mirror the distribution and abundances
observedforVB20Hinclusions.
ItshouldbenotedthatVB20HandVB85 inclusionsnotonlyhaveasimilar
patternofdistributionandabundanceatBatuHijau,butthesetwoinclusiontypes
occur within the same FIAs, suggesting these two inclusion types form an
immiscible pair. The observation of coexisting brine and vapor‐rich inclusions in
multiple secondary FIAs from throughout the deposit stands as evidence for fluid
immiscibilityatBatuHijau.Immisciblepairsareobservedthroughoutthedeposit;
however,theyaremostabundantabove800mdepth,coincidingwiththedecrease
inabundanceofVB35inclusionsandtheincreaseinabundanceofVB20HandVB85
inclusionsnotespreviously.Theabundanceanddistributionoffluidinclusiontypes
and immiscible fluidpairsgreatly suggests that a fluidbecame immisciblearound
800mbelowthesurfaceofthedeposit.

20
CHAPTER5
MICROTHERMOMETRY
MicrothermometricData
Microthermometricdatawerecollectedfrom324fluidinclusionscontained
in 60 secondary and unknown fluid inclusions assemblages, along with eight
isolated inclusions selected for SXRF analyses. Icemelting temperatures in VB35
inclusionsrangedfrom‐6.3to0°C,withmostfinalicemeltingoccurringbetween‐
3.0and0°C.SalinitiesinVB35inclusionsrangedfrom0to10weightpercentNaCl
equivalent,withmostsalinitiesunder5weightpercentNaClequivalent(Figure8a)
(Bodnar&Vityk, 1994).Uponheating, all VB35 inclusionshomogenized to liquid.
VB35inclusionsshowtwomodesbasedonhomogenizationtemperature‐a lower
temperature population between 260 and 330 °C, and a higher temperature
populationbetween360and400°C(Figure8b).
Upon heating of VB20H inclusions, halite dissolution (TmH) occurred
between280and370°C,withanaverageTmHof311°C.Salinitiesrangedfrom36
to 48 weight percent NaCl equivalent, with an average salinity of 39.5 weight
percent NaCl equivalent (Figure 8c) (Bodnar & Vityk, 1994). VB20H inclusions
displayed two types of final homogenization: to the liquid phase, in which
homogenizationtoliquidoccursattemperaturesabovehalitemelting,andbyhalite
melting (TmH), in which homogenization to liquid occurs at temperatures below
halitemelting.VB20Hinclusionshomogenizedtoliquid(ThL)between310and490
°C (Figure 8d); inclusions showing final homogenization to liquid (ThL > TmH)
generallyhomogenizedbetween310and430°C,whereasinclusionsshowingfinal
21
homogenizationbyhalitemelting(ThL<TmH)generallyhomogenizedbetween340
and490 °C.Average final temperaturesof homogenization to liquid andbyhalite
meltingare365°Cand395°C,respectively.
Icemelting temperatures for VB60 inclusions ranged from ‐7 to 0°C, with
most final ice melting occurring between ‐5.0 and 0 °C. Salinities for VB60
inclusionsrangedfrom0to11weightpercentNaClequivalent(Figure8e)(Bodnar
&Vityk,1994). Duringheating,allVB60 inclusionvaporbubblesexpanded to fill
theinclusion.Accuratevaporbubblehomogenizationcannotbedeterminedasthe
exacttemperatureoffillingoftheinclusionbyvaporcannotbeobservedaccurately
(Sterner, 1992). Minimum temperatures based on the apparent disappearance of
the last visible liquid were recorded and represent minimum homogenization
temperatures. These temperatures ranged from330 to 490 °C (Figure 8f). Most
VB60s appeared to homogenize between 370 and 430 °C; the average minimum
homogenizationtemperatureinVB60inclusionswas400°C.
Observationof final icemelting temperatures inVB85 inclusions isdifficult
owingtothesmallamountof liquidpresentintheinclusions. Uponfreezing,final
icemeltingwasobservedin4inclusionsbetween‐1.4and‐1.1°C,correspondingto
salinitiesbetween1.9and2.4weightpercentNaClequivalent(Figure8g)(Bodnar&
Vityk, 1994). Upon heating, VB85 inclusion vapor bubbles expanded to fill the
inclusion. Apparenthomogenizationgenerallyoccurredbetween340and400 °C,
withmostVB85sappearingtohomogenizeabove360°C(Figure8h).AswithVB60
inclusionstemperaturesareminimumtemperatures.
Hydrohalitewasobservedin15VB35inclusions,withmeltingtemperatures

22
rangingfrom‐23.3to‐16.0°C.Clathratewasneverobservedinanyfluidinclusion
type,andtherewasnoevidencetosupportthetrappingofCO2orCH4withinfluid
inclusionsfoundatBatuHijau.
MicrothermometryDiscussion
In order to determine the temperature atwhich hydrothermal fluidswere
trappedwithintheBatuHijausystem,pressurecorrectionsmustbeappliedtothe
homogenizationtemperatures,whichareminimumtrappingtemperaturesforeach
inclusion. Inclusions may have been trapped anywhere along a constant density
isochore that extends to higher temperatures and pressures from the recorded
homogenization temperature and pressure. Trapping temperatures can be
determined for individual inclusions if the pressure at which the hydrothermal
fluidsweretrappedisknownorcanbeapproximated.Thetrappingtemperatureis
thetemperatureatwhichtheconstantdensityisochoreforeachinclusionintersects
thepressureofinclusiontrapping,onapressure‐temperaturediagram.Becausethe
thicknessofrockabovetheBatuHijaudepositisknown,andbecauseBatuHijauisa
geologically young deposit that has experienced little post‐formation erosion,
pressures can be approximated from sample depths. Using a reconstructed cross
section of the deposit (Figure 3), and assuming lithostatic pressure, inclusion
trappingpressureswereapproximatedfromsampledepthforeachinclusion.
ConstantDensityIsochors
Inclusion densities and isochors for each fluid inclusion were determined
23
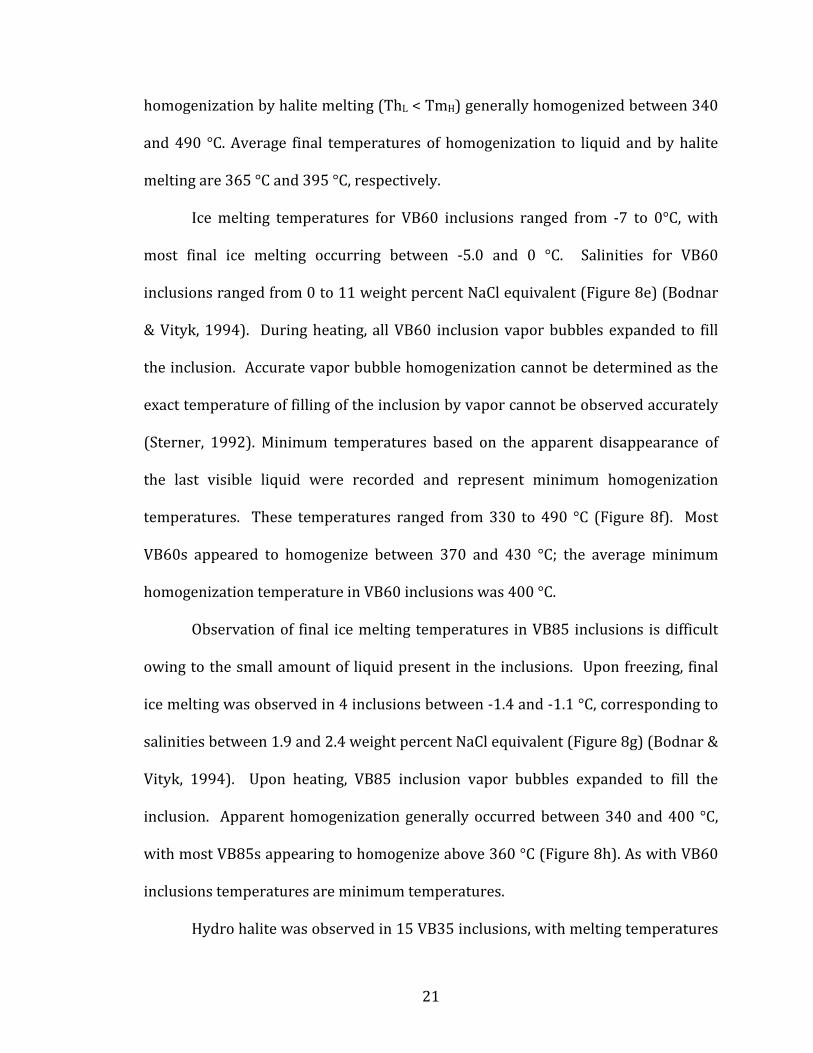
using the SoWat mathematical model (Driesner and Heinrich, 2006; Driesner,
2008). By inputting homogenization temperature, salinity, and volumetric
constraints based on phase relationships, isochors can be regressed based on the
equationVSolution(T,P, XNaCl) =VH2O(n1 + n2T,P) (Driesner, 2007); where volume,
temperature,pressure,andmolarvolumearedefinedbyV,T,P,andX,respectively
(Driesner,2007). Theparametersn1andn2are simple functionsofpressureand
composition(Driesner,2007).Constantdensity isochors forVB35 inclusionswere
generatedandplottedrelativetoaliquid‐vaporcurveforafluidof5weightpercent
NaClequivalentbasedondeterminedsalinitiesformostVB35inclusions.Figure9
showstwodistributionsofisochors,correspondingtohomogenizationtemperature.
Lower salinity (<1.0 weight percent NaCl equivalent) inclusions that have
homogenization temperatures that range fromabout240 to350°Ccorrespond to
higherdensities (0.7 to0.8g/cm3),whereashighersalinity inclusions (2‐3weight
percentNaClequivalent)havehomogenizationtemperaturesthatrangefromabout
370to415°Candcorrespondtoloweroveralldensities(0.5to0.65g/cm3).
Constant density isochors for VB20H inclusions were plotted relative to a
liquid‐vapor curve for a fluid of 45 weight percent NaCl equivalent based on
determined salinities for most VB20H inclusions (Figure 10). Constant density
isochors representing VB20H inclusions with homogenization temperatures from
305 to 490 °C range in density from 0.899 to 1.2 g/cm3. VB20H inclusions are
further distinguished based on mode of homogenization; inclusions that
homogenizedtoliquidhaddensitiesbetween0.89and1.10g/cm3,whileinclusions
homogenizingbyhalitemeltinghaddensitiesbetween1.12–2.0g/cm3.
24
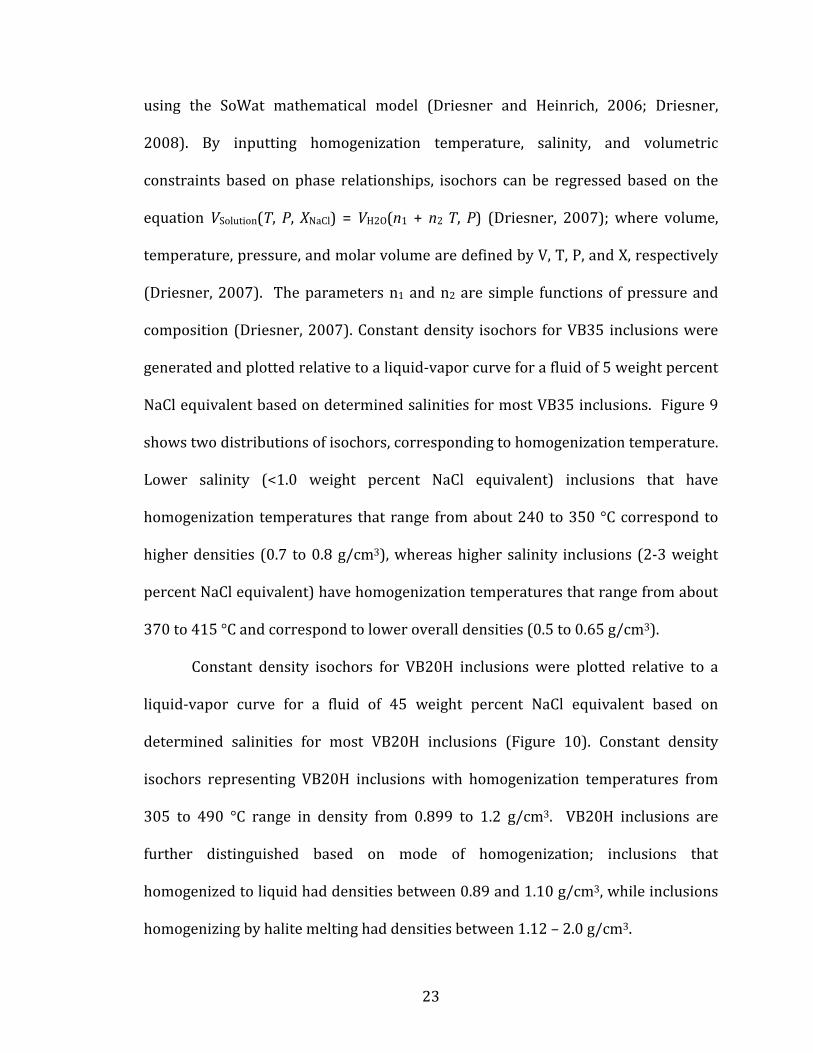
Constant density isochors for VB60 inclusions with homogenization
temperaturesfrom390to500°Crangefrom0.3–0.52g/cm3areshowninFigure
11. Isochorscouldnotbedetermined forVB85 inclusionsusingtheSoWatmodel,
indicating that the minimum homogenization temperatures estimated for these
inclusionswerenotaccurate.
InclusionsDepths&Pressures
Samples were collected from 1300m to about 150m in depth below the
current surface. Assuming lithostatic pressure, these depths correspond to
pressures between 75 and 325 bars (Burnham, 1984) (Figure 3). Trapping
pressuresforVB35inclusionsbasedoninclusiondepth(Figure7)rangedfrom325
barsinthedeepestpartofthesystem(1300m),tolessthan115barsabout425m
belowthesurface.TrappingpressuresformostVB20Hinclusionsrangedfrom225
to115bars.TrappingpressuresformostVB60inclusionsrangedfrom325to115
bars.TrappingpressuresformostVB85inclusionswere160barsorless.
TrappingTemperatures
Basedontheintersectionofeachconstantdensityisochorewiththetrapping
pressuredeterminedfromsampledepths,trappingtemperaturesweredetermined
for individual fluid inclusions. Trapping temperatures for 99 VB35 inclusions
rangedbetween248and396°C(Table2).VB35inclusionsshowtwopopulations
basedontrappingtemperature:alowertemperaturepopulationbetween248and
324°C(58inclusions),andahighertemperaturepopulationbetween375and396

25
°C(31inclusions).
In the deepest part of the deposit at 1300 m depth (Figure 12c), VB35
trapping temperatures ranged from about 287 to 396 °C. Most inclusions were
trappedbetween330and396°C.
Between600and1000mdepth(Figure12b),trappingtemperaturesranged
from248 to387 °C;Trapping temperaturesare slightly coolerwhencompared to
VB35inclusionsfromdeeperinthedeposit.Trappingtemperaturesinthecenterof
the intrusive complex at these depths ranged from 248 to 386 °C; trapping
temperaturesintheflanksofthedepositshowedasimilarrange.
In the shallow part of the system, above 600 m (Figure 12a), trapping
temperatures ranged from 276 to 324 °C, indicating that somewhat cooler fluids
weretrappedat thishigherelevation. Trappingtemperatures in thecenterof the
complex ranged from284 to321 °C,withmost inclusionsbeing trappedbetween
296 and 321 °C. These temperatures were generally higher than trapping
temperatures on the flanks that ranged from276 to324 °C,withmost inclusions
beingtrappedbetween276and303°C.Temperaturesarerelativelyconsistentfrom
600mdepthtotheshallowestVB35samplelocationat400mdepth.
Trapping temperatures for 23 VB20H inclusions were calculated, and
temperatures ranged from 315 to 397 °C (Table 3). Most calculated trapping
temperaturesforVB20Hinclusionsweredeterminedforinclusionsthatexhibitfinal
homogenization to liquid;onlya single trapping temperaturewascalculated fora
VB20Hinclusionthathomogenizedbyhalitemelting.
ThedeepestVB20Hinclusionswerecollectedfrombetween900and1000m

26
depth,andweretrappedbetween335and370°C.Themajorityofinclusionsfrom
this part of the depositwere trappedbetween335 and355 °C. In general, these
trapping temperaturesaresimilar to trapping temperatures fromVB35 inclusions
from the same location. Between 625 and 800 m depth, trapping temperatures
rangedfrom315to397°C,howevermostweretrappedbetween315and335°C.
In the shallow part of the system only two trapping temperatures were
calculated (Figure12a). These twoVB20H inclusionswere trappedbetween500
and 600 m depth, and recorded trapping temperatures of 340 and 355 °C. The
hotterofthetwoVB20Hinclusionswaslocatedat580mdepthandinthecenterof
theintrusivecomplex,whilethecoolerinclusionwaslocateda530mdepthandon
thedeposit flank. ThesingleVB20Hinclusionthathomogenizedbyhalitemelting
waslocatedinthisarea,andrecordedacoolertrappingtemperatureof327°C.
Calculations to determine trapping temperatures for several VB20H
inclusionsthathomogenizedbyhalitemeltingwerenotpossiblebecauseindicated
homogenizationtemperaturesweretheoreticallytoohighfortheindicatedtrapping
pressure.Theseresultssuggesttwopossibilities:1)theseinclusionsweretrapped
athigherpressures,mostlikelyduetolocaloverpressuring,andtrappingpressures
cannot be calculated, and 2) after trapping, fluid leaked out of the inclusions,
resulting in apparent inclusion salinities thatdonot reflect the actual salinitiesof
the fluid trapped in the inclusions. As a result, trapping temperatures were
determinedforonlyasingleinclusionthathomogenizedbyhalitemelting.

27
CHAPTER6
SYNCHROTRONX‐RAYFLUORESCENCE
SXRFData
Twenty‐fivefluid inclusionsfromninedifferentsamplesandfivedrillholes
were analyzed and low‐resolution gray‐scale elemental distribution maps were
produced.Gray‐scalemapswereproducedforeachofthe25inclusionsandeleven
analyses providedmapswith sufficient detail for interpretation. Data from these
eleven analyseswere re‐reduced to provide the final color elemental distribution
maps.
It should be noted that quantitative elemental concentrations couldn’t be
obtained with SXRF analyses, and elemental distribution maps display relative
concentrationsofelements,basedontherangeofconcentrationsforeachelement
ineach inclusion. Becauseof this, elements in inclusionswith low totaldissolved
componentscanappeartobehighlyconcentrated.
Itshouldalsobenotedthatorientationofanalyses,andthustheorientation
of the elemental distributionmaps differ from the fluid inclusion photographs by
45. This difference in orientation can make interpreting the location and
association of elemental concentrations difficult. In addition to the difference in
orientation, thesmallsizeof theanalyzedinclusions,combinedwiththerelatively
large scanning resolution of the SXRF technique, results in ambiguity when
interpreting the location of elemental concentrations within an inclusion.
Deciphering elemental distribution between the liquid and vapor phases and
correlating elements to solid daughter crystal phases is not possible in all
28
inclusions;however,usingtheknowledgethatsomeelements,suchasCu,Cl,K,and
Ti can commonly be contained within solid phases, daughter crystals can be
identified with this technique in some inclusions. In the following sections, no
attempt will be made to resolve elemental distributions between the liquid and
vaporphases,andelementalconcentrationsassociatedwitheitherofthesephases
willbereferredtoasbeingassociatedwithliquid/vapor.Anyfurtherinterpretation
relatingtothelocationanddistributionofelementscannotbemadewithcertainty.
It is suggested that for future studies, only inclusions exceeding75mshouldbe
analyzedwith this technique; this technique is thusnotpreferred for thestudyof
inclusionswithinmostporphyrysystems.
Whileelementsup toatomicweightsof82wereevaluated in theanalyses,
only16totalelementswereidentified:Ag,Br,Ca,Cl,Cr,Cu,Fe,Ge,K,Mn,Pb,Sr,Ti,
Zn, and Zr. The absence of light elements is due to the absorption of the
fluorescence radiation in the topquartz layerand in theairpathbetweensample
and detector (Appel, Personal Communication, 2011). Of the 11 evaluated
inclusions, 10 were VB20H inclusions and one was a VB60 inclusion; no viable
elementaldistributionmapswereproducedforVB35orVB85inclusions.
Owing to their ample liquid phases and abundant daughter crystals, the
majority of successful SXRF analyses evaluated VB20H fluid inclusions. These
inclusions typicallyhaveelevatedBr,Cu,Fe,Mn,andZn,and lesscommonlyhave
elevatedK,Mo,andTi. Iron,Mn,andZn typicallyoccur togetherand their signals
coincide. Within these inclusions, Cu exhibits two types of associations: 1) Cu is
coincidentwith ironinproximitytoavisibleopaquedaughtercrystal(Figure13);

29
or 2) Cu ismore diffuse, generally coincidingwith the liquid/vapor phase of the
inclusion (Figure 14) and is not specifically associated with an opaque daughter
crystal.
Bromine,Ca,Cr,Ag,Pb,K,andSrallareelevatedcoincidentwithelevatedFe,
Mn,andZninvariousVB20Hinclusions.AreasofKandClenrichmentoverlapand
coincidewithsolid, translucentdaughtercrystals(salts),asobserved in inclusions
BH044(Figure13)andBH061(Figure15). Titaniumisenrichedinsmall, isolated
areas contained within the fluid phase of the inclusions (Figures 13 and 15).
MolybdenumshowstwodistinctpatternsofdistributioninVB20Hinclusions. The
first pattern is as small, enriched areas, coinciding with an observed daughter
crystalasininclusionBH023(Figure16). Thesecondpatternshowsthatthehost
quartz surrounding the fluid inclusions is enriched in Mo relative to the fluid
containedwithintheinclusion(Figure13).
LikeMoinBH044,Zriselevatedinthehostquartzrelativetothefluidinside
the fluid inclusion (Figure 13). Germanium shows the opposite behavior, being
enrichedwithinthe inclusionsrelative to thesurroundinghostquartz(Figures17
and18).
Due to their low fluid density and lack of daughter crystals, elemental
detection in VB60 inclusions proved difficult. Like the VB20H inclusions, Fe,Mn,
andZnareelevatedandcoincide(Figure19)andprobablyreflectthelocationofthe
liquid phase, which is in the lower left corner of the inclusion. As with VB20H
inclusions,Brispresentandshowsthesamedistributionandrelativeabundanceas
Fe,Mn, andZn (Figure19). Copper is highly concentrated in a small area that is

30
adjacenttoazoneofelevatedFe(Figure19)andprobablyindicatesthepresenceof
a Cu‐bearing daughter crystal that is not visible in the inclusion, but which is
attachedtothelargevaporbubble.
Elemental distribution maps for VB35 and VB85 fluid inclusions did not
distinguish relative concentration differences. An example of a typical elemental
distributionmapforaVB35orVB85typeinclusionisshowninFigure20.
SXRFDiscussion
The twodistinct locationsofCuwithinVB20H inclusions indicatediffering
occurrences of Cu within the fluid inclusions and also indicate varying
concentrations of Cu within brines that were trapped by VB20H inclusions. The
coincidentpresenceofCuandFewithavisibleopaquedaughtercrystalmostlikely
confirmsthepresenceofaCu‐Fesulfidedaughtercrystalintheliquidphase. This
patternispresentininclusionsBH044(Figure13),BH023(Figure16),andBH057
(Figure21),amongothers.VB20HinclusionsthatcontainaCu‐Fesulfidedaughter
crystal confirm that the brinewasmore concentrated in Cu, Fe, and S than other
inclusions that display a more diffuse pattern for Cu that is coincident with the
liquid/vapor phase. These inclusions lack a Cu‐Fe sulfide daughter and contain
lowerCu,Fe,andS.
SignalsforFe,Mn,andZncoincideinallinclusionswherethethreeelements
are present (Figures 13, 15, and 19), suggesting the consistent presence of these
metals in the hydrothermal brines. These signals coincidewith the liquid/vapor
phaseof the inclusion,suggesting that theseelementsaremoreabundant inhigh‐

31
densitybrinefluids.ThesethreeelementscouldalsobeconcentratedinaFe‐Mn‐Zn
bearing salt and/or daughter crystal; however, the diffuse nature of the signals
suggests that these elements are enriched in the hydrothermal fluid. The diffuse
nature of elevated Br (Figure 13), Ca (Figures 13 and 14), Cl (Figure 15), and Sr
(Figures 13 and 15) and coincidencewith elevated Fe,Mn, and Zn suggest these
elements are also relatively enriched and in brine liquid/vapor, and were
partitionedintotheliquidphaseduringfluidimmiscibilityandbrineformation.
TheassociationofelevatedKandCl(Figures13and15)withsaltdaughters
confirms the observation of sylvite, and indicates the presence of salt daughter
crystalsincludinghaliteandsylvite.ItisalsolikelythatsomeKandClarepresent
dissolvedwithin the liquid/vaporphase of these inclusions, and these signals are
combinedwiththosederivedfromsoliddaughtercrystals.
The distribution of Ti is consistent with a small daughter crystal or salt
rather than dispersion of dissolved Ti in the liquid/vapor. This is observed in
inclusionsBH044 (Figure13),BH061 (Figure15),BH036 (Figure17), andBH057
(Figure21).
Molybdenumappearstoshowtwodistributionpatterns,butinfact,onlyone
pattern accurately reflects the distribution of Mo within VB20H inclusions. This
patternindicateselevatedMo,mostlikelyinaMo‐bearing(molybdenite)daughter
crystal(Figure16).Inthesecondpattern,Moexhibitslowconcentrationswithinthe
inclusionascomparedtoenrichedMoinsurroundinghostquartz(Figure13).This
pattern is an artifact of the analytical technique (Appel, personal communication,
2011).
32
SimilartoMo,theapparentZrenrichmentinthehostquartzisanartifactof
theanalysis(Appel,personalcommunication,2011),andindicatedthatdissolvedZr
is non‐existent in these fluids (Figures 13 and 15). Alternatively, Ge is enriched
within the inclusions relative to the surrounding host quartz (Figure 17 and 18),
suggestingthatsomeGewastransportedbyhydrothermalbrines.However,since
Geconcentrationsarelikelytobeextremelylowinthehostquartz,concentrations
withinthehydrothermalfluidsarealsoprobablyquitelow.
ElementaldetectioninVB60inclusionsprovedtobedifficultduetothelow
densityofthefluidsandlowelementalconcentrationsdissolvedininclusionfluids;
however,oneVB60inclusionwassuccessfullyanalyzed.Thesmallareaofelevated
CusuggeststhatanonvisibleCu‐bearingdaughtercrystalispresent,butobscured
bythelargevaporbubble(Figure19).BecausethatareaofCuenrichmentdoesnot
overlapwithelevatedFe,thedaughtercrystalappearstobeanFe‐poor,Cu‐bearing
daughtercrystal.However,thepresenceofadaughtercrystaldemonstratesthatCu
can be significantly enriched in low‐density fluids, in such abundances that Cu‐
bearing daughter crystals can precipitate from these vapors during cooling and
depressurizationofthesystem.
Like the VB20H inclusions, the coincidence of Fe, Mn, and Zn in VB60
inclusions most likely indicates these metals are coincidentally present in the
hydrothermal fluid, but do not form daughter crystals. There are no visible
daughter crystals in thisVB60 inclusion; however, due to the large vapor bubble,
solidphasesmaybedifficulttosee.Nevertheless,asinVB20Hinclusions,thediffuse
patternsof Fe,Mn, andZndistribution suggest they remaindissolved in the fluid

33
phase (Figure 19). Bromine is also interpreted as dissolved in the fluid, as its
relativeabundanceanddistributioncoincideswithelevatedFe,Mn,andZn(Figure
19).
Duetosmallfluidinclusionsize,lowelementalabundances,lackofdaughter
crystals, and low fluid densities, elemental distributionmaps for VB35 and VB85
inclusionsdidnotrevealelevatedelementalconcentrationswithintheseinclusions
(Figure20).

34
CHAPTER7
LASERABLATION‐INDUCTIVELYCOUPLEDPLASMA‐MASSSPECTROMETRY
LA‐ICP‐MSData
Elemental concentrationswithin fluid inclusionswere quantified using LA‐
ICP‐MSanalyses.Analyzedelementsinclude:B,Na,K,Ca,Mn,Fe,Zn,As,Rb,Sr,Mo,
Ag,Sb,Ba,W,Au,andPb,andconcentrationsdetectedineachanalyzedinclusionare
listedinAppendix1. Limitsofdetectionvariedforeachelementandduringeach
analyticalrun.Limitsofdetectionvariedfrom>1ppmtoover10000ppm,butwere
generally between 10 and 1000 ppm. Elemental concentrations thatwere below
limits of detection are denoted with a ‘‐‘ in Appendix 1; elements that were not
includedintheanalysisareleftblank.
Ofthe17elementsthatwereanalyzed,someweremorecommonlydetected
thanothers. Arsenic,Ag,Au,B,Mo,Sb,andWwereallrarelydetectedinanyfluid
inclusionstype;wheredetected,theirconcentrationswerealways<450ppm,with
manyhaving concentrations<0.1ppm. Barium,Rb, andSrweremore commonly
detected than the previously mentioned elements, but they typically had low
concentrations.RubidiumandSrconcentrationsrarelyexceeded200ppm,whileBa
concentrationsweretypically<400ppm.VB20HinclusionsareanexceptionandBa
concentrationsreached5031.9ppm,Rbconcentrationsreached765.34ppm,andSr
concentrations reached 350.41 ppm. Barium, Rb, and Sr concentrations were
consistentlyloworbelowdetectioninVB60andVB85inclusions.
Elements that were commonly detected and present in significant
concentrationsinclude:Na,K,Ca,Mn,Fe,Zn,Pb,andCu. Concentrationsforeach

35
analyzed inclusion can be found in Appendix 2; summary data are in Table 4.
Concentrations for these elementswere highest in VB20H inclusions,which have
average concentrations up to an order of magnitude greater than average
concentrations in VB35 inclusions, which contained the second highest average
concentrationsoftheseelements.AverageconcentrationsinVB35inclusionswere
typically less than an order of magnitude greater than average concentrations in
VB60 inclusions. Exceptions includeCu,whichonaveragewasgreaterbyabouta
thirdinVB60inclusionsthaninVB35inclusionsandFewhichwashigherinVB60
inclusionsbyabout7%.AverageelementalconcentrationsarethelowestinVB85
inclusions,withsomeaverageconcentrationsasmuchastwoordersofmagnitude
less thanaverageconcentrations inVB60 inclusions. Sodium,Ca,andCuhavethe
highest average concentrations in VB85 inclusions, with average concentrations
between 227.0 and 247.0 ppm. Iron, K, Mn, and Zn were all detected in VB85
inclusions, but at average concentrations of <75.0 ppm. Lead was detected in
relativelylowconcentrations,withanaverageconcentrationof<1.0ppm.
Elemental abundancedata fromLA‐ICP‐MSwere used to confirm salinities
obtained from ice melting and halite dissolution temperatures during
microthermometry.AbundancesformetalchloridesNaCl,KCl,FeCl2,andCuClwere
summed,andcalculatedsalinitiesareshownforeach inclusion inAppendices2.1‐
2.4.
36
X‐YPlots
X‐Y plots of important elements were evaluated to identify and quantify
elementalcorrelations(Figures22‐37).Inclusiontypesaredifferentiatedbysymbol.
Linearregressionanalyseswereusedtoevaluatedataforeachinclusiontype,and
theR2coefficientofdeterminationbetweenelementpairswascalculated(Table5).
A range of degrees of correlation are indicated,with some elements being highly
correlatedandotherelementalpairsbeingweaklycorrelated,ornotcorrelatedat
all. R2 values are color‐coded based on degree of correlation, and categorized as
high(R2=0.70–1.0),moderate(R2=0.35–0.69),andweak/nocorrelation(R2=
0.0–0.34).
Somegeneraltrendscanbeobservedacrossallinclusionstypes.Manganese
and Zn, alongwithMn and K correlate strongly in all inclusions types (Table 5).
Copper, on the other hand, displays weak or no correlation with all elements in
VB20H inclusions, and weak to moderate correlation with all elements in VB35
inclusions; however, inVB60 andVB85 inclusions, Cu correlates stronglywith all
metals. ElementsinVB35andVB20Hinclusionsgenerallycorrelateweakly,while
elementsinVB60andVB85inclusionsgenerallycorrelatestrongly.
In VB35 fluid inclusions, elemental correlations are generallymoderate to
low (Table 5). Sodium correlates stronglywithK (Figure 22), andMn correlates
stronglywithK(Figure23),andwithZn(Figure24).Coppercorrelatesmoderately
withK(Figure25),Mn(Figure26),Zn(Figure27),Fe(Figure28),andPb(Figure
29).CorrelationsareweakorabsentforCawithNa(Figure30),andK(Figure31);

37
for Cu with Na (Figure 32), Ca (Figure 33), and Ba (Figure 34); for Mn with Fe
(Figure35)andPb(Figure36);andforZnwithFe(Figure37).
In VB20H fluid inclusions, most elemental correlations are similarly low
(Table5).HighcorrelationsexistforMnwithK(Figure23)andZn(Figure24);for
CaandNa(Figure30),andMnandPb(Figure36).ManganeseandFe(Figure35),
andZnandFe(Figure37)correlatemoderately. Weakornocorrelationexistsfor
CuwithK (Figure25),Mn (Figure26), Zn (Figure27), Fe (Figure28),Pb (Figure
29),Na(Figure32),Ca(Figure33),andBa(Figure34);NawithK(Figure22),and
CawithK(Figure31)alsocorrelateweakly.
InVB60fluidinclusions,elementalcorrelationsaregenerallyhigh(Table5).
HighcorrelationsexistforNawithK(Figure22),andMnwithK(Figure23),andZn
(Figure24); forCuwithK (Figure25),Mn(Figure26),Zn (Figure27),Fe (Figure
28),Pb(Figure29),Na(Figure30),andCa(Figure33);forCaandK(Figure31);for
Mnwith Fe (Figure 35) andPb (Figure 36); and for Znwith Fe (Figure 37). All
VB60 plots display a similar pattern: the majority of data plot at relatively high
concentrations of both elements, and two to five data points at lower
concentrations. Moderate correlations exist for Cu with Na (Figure 32) and Ba
(Figure34).InVB60inclusions,noelementalpairshadweakcorrelations.
InVB85fluid inclusions,elementalcorrelationsaregenerallyhighandhigh
correlationsexistbetweenNaandK(Figure22),andMnwithK(Figure23)andZn
(Figure24); forCuwithK (Figure25),Mn(Figure26),Zn (Figure27),Fe (Figure
28),Pb (Figure29),andBa (Figure34); forCawithNa (Figure30)andK (Figure
31);andforMnwithFe(Figure35)andPb(Figure36).Moderatecorrelationsexist
38
betweenCuwithNa(Figure32)andCa(Figure33),andZnandFe(Figure37).In
VB85inclusions,noelementalpairshadweakcorrelations.
X/NaPlots
ElementalconcentrationsmeasuredbyLA‐ICP‐MSwerealsoratioedbymass
to Na concentrations to provide a consistent base for comparison, and inclusions
wereplottedinorderofdecreasingCu/Namassratioforeachinclusiontype.Each
point represents one analysis of a single fluid inclusion. Analyses for which an
elementwasdetected,butwasbelowlimitsofdetectionareshownaspointsbelow
thered line. Basemetalsare included ingroup1(Figure38), typicalsaltcations
and preciousmetals are included in group 2 (Figure 39), and reactive and rarely
detected trace elements are included in group 3 (Figure 40). Copper, a highly
reactive element, is plotted with all three groups to show relationships of other
elementstoCu. ConcentrationrangesaresummarizedinTable6.Elementswere
classifiedasreactiveandnon‐reactivebasedonwhethertheirratioswithNavaried
bygreaterthanaboutanorderofmagnitude,barringoutliers,orlessthananorder
ofmagnitude,respectively(Ulrichetal.,2003). Theclassificationofanelementas
eitherreactiveornon‐reactiveishowever,subjective.Elementalreactivitycanvary
across inclusiontypes for individualelements,andthisclassification isnotalways
clearcut.
Group 1 elements include Cu, Fe, Mn, Zn, and Pb (Figure 38). This group
includes important basemetals thatwere thatwere commonly present and,with
theexceptionofPb,abundantininclusionsthroughoutthedeposit. Massratiosof

39
Cu/Na range from 0.001 to 210 (Figures 38‐40; Table 6) and Cu was below
detection in someVB20H,VB35, andVB60 inclusions,butnot inVB85 inclusions.
The Cu/Na ratios show awide range of values for all inclusion types, and ranges
from 0.004 to 3.5 in VB20H inclusions, from 0.001 to 10 in VB35 inclusions, and
from0.004to30inVB60inclusions. InVB85inclusions,Cu/Naratiosrangefrom
0.025 to 210. The range of values for Cu/Na generally increased fromVB20H to
VB35toVB60toVB85 inclusions. No largegapsorbreaksarepresentacrossthe
range of values for Cu/Na for each fluid inclusion type from relatively high to
relativelylowCu/Naratios(Figure38).
RatiosofFe/Narangefrom0.0007to13.0(Table6),withthemajorityofratios
ranging from 0.7 to 3.0 though Fe is below detection in a significant number of
inclusions (Figure 38). In general, the Fe/Na ratio varies over several orders of
magnitudeforeachinclusiontype,thoughthemajorityofanalysesshowasmaller
degreeofvariation. InVB20Hinclusions,Fe/Naratiosrange from0.0007to11.0,
with most VB20H inclusions ranging from 0.015 to 4.0. There is no correlation
between Fe/Na and the presence or absence of hematite daughter crystals in
inclusions. In VB35 inclusions Fe/Na ratios range from 0.02 to 11.0, with Fe in
many inclusions below detection, andmost Fe/Na ratios range from 0.01 to 1.0.
EightVB35 inclusionswith opaquedaughter crystals hadFe/Na ratios that range
from 0.5 to 0.95 with one outlier of 0.06. With decreasing Cu/Na, Fe detection
decreased, but Fe was still detected in about half of these inclusions. In VB60
inclusions, Fe/Na ratios range from 0.0015 to 13.0, with Fe in many inclusions
belowdetection.RatiosofFe/NainmostVB60inclusionsrangefrom0.01to1.0.In
40
VB85inclusions,Fe/Naratiosrange from0.009to4.0,withFe inmany inclusions
below detection. In VB85 inclusions with a high Cu/Na, Fe is rarely detected.
CopperandFecovarytosomedegreeasatmoderatevaluesofCu/Na,Fe/Naratios
rangefrom0.5to1.0,whereasatverylowCu/Na,Fe/Naratiosrangefrom0.009to
0.035.
RatiosofMn/Narangefrom0.002to6.5(Table6)withmostratiosfrom0.08
to0.5,andMninsomeinclusionsbelowdetection(Figure38). Comparedtomost
other elements, Mn/Na ratios exhibit relatively consistent ratios. In VB20H
inclusions, Mn/Na ratios range from 0.02 to 6.5, Mn in some inclusions is below
detection,andMn/NaratiosinmostVB20Hinclusionsrangefrom0.09to0.55.In
VB20H inclusionswith lowCu/Na ratios,Mndetectionbecomes less common. In
VB35inclusions,Mn/Naratiosrangefrom0.04to6.5,withMninsomeinclusions
belowdetection. RatiosinmostVB35inclusionsrangefrom0.04to0.3andMnis
less commonly detected in VB35 inclusions with low Cu/Na ratios. In VB60
inclusions,Mn/Naratiosrangefrom0.002to0.9,withMninsomeinclusionsbelow
detection. RatiosinmostVB60inclusionsrangefrom0.095to0.3. UnlikeVB20H
andVB35inclusions,MndetectionwasnotlinkedtoCu/NaratioinVB60inclusions.
In VB85 inclusions, Mn/Na ratios range from 0.095 to 0.45, with Mn in some
inclusionsbelowdetection.ManganesewasrarelydetectedinVB85inclusionswith
high Cu/Na ratios, but is more commonly present in VB85 inclusions with low
Cu/Naratios.
The ratios of Zn/Na range from 0.002 to 2.0 (Table 6) with Zn/Na in most
inclusions ranging from 0.02 to 0.2, and Zn in some inclusions below detection

41
(Figure 38). In general, Zn/Na ratios aremost variable in VB20H inclusions, but
most values are more consistent for other inclusion types. In VB20H inclusions,
Zn/Na ratios range from 0.0095 to 2.0,withmost ranging from 0.04 to 0.4. The
Zn/Na ratios in VB20H inclusions are unrelated to Cu/Na ratios. In VB35
inclusions, Zn/Na ratios range from0.008 to 2.0,withmost Zn/Na ratios ranging
from0.015to0.1.ZincwasbelowdetectionintwoVB35inclusions,andtheZn/Na
ratios in VB35 inclusions are unrelated to the Cu/Na ratio. In VB60 inclusions,
Zn/Naratiosrangefrom0.002to0.85,withmostZn/Naratiosrangingfrom0.06to
0.2. Zinc is below detection in one inclusion, and the Zn/Na ratios generally
decreased with decreasing Cu/Na ratio in VB60 inclusions. In VB85 inclusions,
Zn/Naratiosrangefrom0.045to0.5,withmostZn/Naratiosrangingfrom0.045to
0.15. ZincwasbelowdetectioninfourVB85inclusions. Zinc israrelydetectedin
VB85 inclusions with high to moderately high Cu/Na ratios, and was more
commonlydetectedinVB85inclusionswithlowerCu/Naratios.
The ratios of Pb/Na range from0.0006 to 0.2 (Table 6)withPb/Na inmost
inclusions ranging from 0.001 to 0.1, and Pb in some VB35, VB60, and VB85
inclusionsbelowdetection(Figure38). Leadvaluesarelowandingeneral,Pb/Na
ratios are fairly consistent, though analyses of VB20H inclusions show somewhat
greatervariability.InVB20Hinclusions,Pb/Naratiosrangefrom0.001to0.2,with
mostrangingfrom0.04to0.1.InVB35inclusions,Pb/Naratiosrangefrom0.0006
to 0.1, with most ratios ranging from 0.0009 to 0.009, and Pb in some VB35
inclusionsbelowdetection.InVB60inclusions,Pb/Naratiosrangefrom0.0008to
0.1,withmostranging from0.003 to0.03,andPb insomeVB60 inclusionsbelow

42
detection. In VB85 inclusions, Pb/Na ratios range from0.002 to 0.02,withPb in
someVB85inclusionsbelowdetection.
Group 2 elements include K, Ca, Mo, Ag, and Au (Figure 39). This group is
composedof commonsalt cationsand “preciousmetals” thatwere relativelynon‐
reactiveandnotcommonlydetected.
Ratios of K/Na range from 0.008 to 9.5 (Table 6), with the majority of
inclusionshavingratiosbetweenabout0.2and0.95,andKinwithsomeinclusions
below detection (Figure 39). Ratios of K/Na were fairly consistent across all
inclusion types. In VB20H inclusions with high Cu/Na ratios, K/Na ratios range
from 0.09 to 9.5 and Kwas detected in all inclusions. In VB20H inclusionswith
moderatetolowCu/Naratios,K/Naratiosrangefrom0.15to9.0,withmostK/Na
ratiosrangingfrom0.15and1.0;Kinsomeinclusionsisbelowdetection.InVB35
inclusions,K/Narangesfrom0.08to7.0,withmostratiosrangingfrom0.2to0.8.
However, Kwas below detection inmore than half of VB35 inclusions. In VB60
inclusions,K/Naratiosrangefrom0.008to1.0,withmostrangingfrom0.1to1.0.
AsinVB35inclusions,KinmorethanhalfofVB60inclusionswasbelowdetection.
InVB85inclusions,K/Naratiosrangefrom0.05to8.0,withmostrangingfrom0.2
to0.9.K/NaratiosdecreaseasCu/Naratiosdecrease.
RatiosofCa/Narangefrom0.00085to7.0(Table6)withCainsomeinclusions
below detection (Figure 39). Most Ca/Na ratios range from 0.02 to about 1.0.
Calciumhasaverylargerangeofratios,indicatingitsreactivity;however,ratiosare
relatively similar across all inclusions types. In VB20H inclusions, Ca/Na ratios
ranged from 0.0008 to 5.0, and Cawas detected in all but 1 VB20H inclusion. In

43
VB35inclusions,Ca/Naratiosrangefrom0.015to9.0,andCawasdetectedinless
thanhalfofVB35inclusions.InVB60inclusions,theCa/Naratiosrangefrom0.005
to 1.0, decrease with decreasing Cu/Na ratios, and Ca below detection is more
commonatverylowCu/Naratios.InVB85inclusions,Ca/Naratiosrangefrom0.07
to3.0,andCawasnotdetectedinVB85inclusionswithhighCu/Naratios;however,
relativelyhighCa/NaratioswerequantifiedforinclusionswithlowCu/Naratios.
RatiosofMo/Narangefrom0.002to0.0075(Table6)andMowasdetectedin
onlythreeVB20H,oneVB35,andsixVB85inclusions(Figure39).RatiosofMo/Na
inthreeVB20Hinclusionsrangefrom0.004to0.005andMowasonlydetectedin
VB20HinclusionswithhighCu/Naratios.AMo/Naratioof0.0065wasdetectedin
oneVB35inclusionwithmoderatelyhighCu/Na.Molybdenumwasbelowdetection
inallVB60inclusions.RatiosofMo/NainsixVB85inclusionsrangefrom0.002to
0.0075.OnegroupofthreeVB85inclusionshasMo/Naratiosthatrangefrom0.002
to 0.0035, while a second group of three inclusions have ratios that range from
0.007 to 0.0075. All VB85 inclusions inwhichMowas detected have lowCu/Na
ratios.Allotheranalysesindicatewasbelowdetection.
Ratios of Ag/Na range from 0.0045 to 0.0008 (Table 6) and Ag was only
detectedinfourVB20HandtwoVB85inclusions(Figure39).InVB20Hinclusions,
Ag/Na ratios range from 0.0005 to 0.00055. Silver was detected in three VB20H
inclusions with high Cu/Na ratios, and one VB20H inclusions with a moderate
Cu/Na ratio. In VB85 inclusions, Ag/Na are 0.0004 and 0.00085. Silver was
detected in inclusions with low Cu/Na. In all other analyses, Ag was below
detection.

44
Goldwasdetectedabovethe limitsofdetectioninoneVB35inclusion(Table
6). This inclusion had an Au/Na ratio of ~0.0001 and a moderate Cu/Na ratio
(Figure39).
Group3elementsincludeAs,Ba,Sr,W,B,Li,andRb(Figure40).Thisgroup
includes relatively reactive trace elements and elements that were only rarely
detected.ArsenicwithanAs/Naratioof0.006wasonlydetectedinoneLA‐ICP‐MS
analysisinahighCuVB85inclusion(Table6).
RatiosofBa/Narangefrom0.00007to0.18(Table6)withBainanumberof
inclusions below detection (Figure 40). Ratios of Ba/Na are commonly between
0.001and0.02. Ingeneral,Ba/Naratiosexhibitarangeofvaluesforall inclusion
types, and aremost variable in VB20H inclusions. In these inclusions the Ba/Na
ratiosrangefrom0.00007to0.18,andmostinclusionsrangedfrom0.002to0.018.
Ratios of Ba/Na are more consistent at lower Cu/Na ratios, with Ba/Na ratios
rangingfrom0.006to0.01.InVB35inclusions,Ba/Naratiosrangefrom0.0008and
0.04, with some inclusions below detection limits, and most ratios ranging from
0.001to0.008.InVB60inclusions,Ba/Naratiosrangefrom0.00008to0.065,with
someinclusionsbelowdetectionlimits,andmostratiosrangingfrom0.002to0.009.
In VB85 inclusions, Ba/Na ratios range from 0.001 to 0.07, with some inclusions
below detection limits, andmost ratios ranging from 0.004 to 0.03. Bariumwas
primarilydetectedinlow‐Cu/NaVB85inclusions.
Ratios of Sr/Na range from 0.000045 to 0.03 (Table 6) with Sr in some
inclusions below detection (Figure 40). In general Sr/Na ratios show significant
variability in VB20H inclusions and lesser variability in other inclusion types. In

45
VB20H inclusions, Sr/Na ratios range from 0.00006 to 0.03. In VB35 inclusions,
Sr/Na ratios weremore consistent and range from 0.0004 to 0.0085, with some
inclusions below detection limits. In VB60 inclusions, Sr/Na ratios range from
0.0015to0.015,withsomeinclusionsbelowdetectionlimits.VB60inclusionswith
lower Sr/Na ratios coincide with inclusions with lower Cu/Na ratios. In VB85
inclusions, Sr/Na ratios range from 0.0015 to 0.02, with some inclusions below
detection limits. RatiosofSr/NainVB85inclusionshadthesmallestrangeofany
inclusionstype,andSrwasnotdetectedininclusionswithhighCu/Naratio.
TungstenwasonlydetectedinafewVB20HandVB85inclusions(Table6).In
VB20H inclusions, W/Na ratios range from 0.000095 to 0.0008, and in VB85
inclusions W/Na ratios range from 0.008 to 0.0045 (Figure 40). Tungsten was
detectedinVB20HinclusionswithhighandmoderatelyhighCu/NaratiosVB20H’s.
TungstenwasdetectedinVB85inclusionswithmoderatetolowCu/Naratios.
RatiosofB/Narangefrom0.0009to0.055(Table6)withBinmanyinclusions
beingbelowdetection(Figure40).Noregularpatternofdistributionwasobserved
foranyinclusiontype,andonlyafewinclusionsofallinclusionstypescontainedB.
Most analyses thatwere belowdetectionwere fromVB85 inclusions; Bwas only
detectedinVB85inclusionswithmoderatetolow‐Cu/Naratios.
Lithium was only detected in 3 VB20H fluid inclusions and was below
detection in all other inclusion types (Table 6). Ratios of Li/Na in these three
inclusionsrangedfrom0.0003to0.02(Figure40).
RatiosofRb/Narangefrom0.0005to0.07(Table6),withRbinwithsome
inclusionsbelowdetection(Figure40).InVB20Hinclusions,Rb/Naratiosarequite

46
variable and range from 0.0006 to 0.07. In VB35 inclusions, Rb/Na ratios range
from 0.0005 to 0.001, and Rbwas below detection inmost VB35 inclusionswith
highCu/Naratios.InVB60inclusions,Rbwasonlydetectedintwoinclusions:one
VB60 inclusionwith amoderate Cu/Na ratio, and one VB60 inclusionwith a low
Cu/Na ratio, and ratios range from 0.00095 to 0.001. In VB85 inclusions, Rb/Na
ratiosrangefrom0.0008to0.0025.RubidiumwasonlydetectedinVB85inclusions
with low Cu/Na ratios. The largest range of Rb/Na ratios is present in VB20H
inclusions; ratios are more consistent in VB35, VB60, and VB85 inclusions, but
valuesabovedetectionarerarerelativetoVB20Hinclusions.
DiscussionofX‐YandX/NaPlots
Degrees of correlation were calculated and expressed as R2 values for
elementalpairsexaminedbytheX‐Yplotsforeachinclusionstype.Thedegreesof
correlationcanbeusedtointerpretthereactivityoftheelementswithinthevarious
fluids at Batu Hijau. In general, consistently low R2 values for elements in a
particular inclusiontype indicate that thatelementwasreactive,andreactedwith
wall rocks and was variably removed from the fluid as it moved through the
hydrothermal fluid (Ulrichetal., 2001). Alternatively, consistentlyhighR2 values
for elements in a particular inclusion type indicate that the element was non‐
reactive, and remained in the fluid as the fluid moved upward through the
hydrothermalsystem.ElementsthathaveR2valuesindicatingmoderatecorrelation
behaveasmoderatelyreactiveelements. InspectionofTable6indicatesthatmost
elements in fluids trapped in VB60 and VB85 inclusions were non reactive.

47
Alternatively,Cu,Na,K,andCainVB20Hfluidswerereactiveandvariablylosttoor
removedfromwallrocks.Similarly,Cu,Na,K,Ca,Ba,andtoalesserdegreeFeand
Pb in VB35 fluidswere reactive andwere variably lost to or removed fromwall
rocks.
CoppermostfrequentlyexhibitslowandmoderateR2valuesindicatingthat
Cu in VB35 and VB20H fluidswas highly reactive and lost towall rocks through
fluid‐rockreactionandprecipitationofCu‐Fesulfides.Ironisreactiveormoderately
reactive and was likely lost to wall rocks with Cu during the precipitation of
magnetiteandCu‐Fesulfidessuchaschalcopyrite,bornite,anddiginite,alongwith
minorpyrite.However,FeissomewhatlessreactiveinVB20Hfluids,indicatingthat
wall rock reactions and precipitation involving Femay have decreased after fluid
immiscibility generated the VB20H fluid. Potassium, observed to be reactive, is
likely associated with early potassic alteration and the formation of secondary K
feldspar and biotite, and later and cooler phyllic alteration and the formation of
sericite. Barium can be lost to wall rocks as a substitute for other cations in
feldspars(Ulrichetal.,2001).HighR2valuesforMn,Zn,andPbindicatethatthese
elements were relatively non‐reactive, were relatively unaffected by wall‐rock
reactions or mineral precipitation, and were transported through the system in
VB35andVB20Hfluids. Theseresultsandinterpretationsaresupportedbyalack
ofmineralscontainingtheseelementsinthesampledpartsofthedeposit.
Inthenon‐reactiveVB60andVB85fluids,nearlyallelementpairshavehigh
degrees of correlation, indicating that wall‐rock reactions and precipitation was
uncommon as these low density fluids with generally lower concentrations of
48
metals and other elements moved through the deposit. Not all element pairs,
however,hadhighdegreesofcorrelation.InbothVB60andVB85fluids,Cudisplays
moderatereactivitywithsomeelements,suggestingthatCuandpossiblytoalesser
degreeBaandNawereprecipitatingfromthesefluids.Inaddition,FeinVB85fluids
was likelyreactingwithwall rocksand/orprecipitatingwithCu inCu‐Fesulfides,
althoughthesereactionswerelikelyminorincomparisontothoseassociatedwith
VB35andVB20Hfluids.
ThedegreeofreactivityofelementsisalsoindicatedonFigures38through
40,inwhichelementsareratioedtoNa.ReactiveelementsincludeCu,Fe,Ca,K,and
SrandBa;variationsintheconcentrationsoftheseelementsaretheresultofwall
rockreactionsandmineralprecipitationasfluidsmovedthroughthedeposit.Non‐
reactive elements include Pb,Mn, Zn,Mo, Au, Ag, B, Rb,W, As, and Li. Elemental
concentrations and ratios with sodium remain generally consistent while
temperature, pressure, and concentrations of reactive elements vary, suggesting
that lesser to no wall rock reactions or mineral precipitation occurred involving
theseelements.
SpatialdistributionofCuConcentrationsinFluidInclusions
Concentrations were quantified for a number of elements using LA‐ICP‐MS
analyses; however, themain element of interest at BatuHijau is Cu. Average Cu
concentrationsofFIAswereplottedonacross‐sectionthroughthedepositforeach
inclusion type (Figures 41‐44), (PT Newmont Nusa Tenggara, private
communication, 2009). Usingwhole rock Cu assay data along an east‐west cross
49
sectionofthedeposit,acomparisonbetweenCuconcentrationsobtainedfromLA‐
ICP‐MSandwholerockanalysescanbemade(Figures45‐48),(PTNewmontNusa
Tenggara,privatecommunication,2009).
Figures41 through44 illustrate the spatialdistributionofCu concentrations
(ppm) in the various types of fluid inclusions throughout the deposit. In the
followingdiscussion, thedeposit isdivided into threeregionsbasedondepth: the
deepsystem(1300to1000mdepth),themidsystem(1000to600mdepth),and
theshallowsystem(600to0mdepth).
Copper concentrations in VB35 FIAs in the deep system are variable and
range from0.6 to5900ppmCu(Figure41). AsingleVB35 inclusioncontains0.6
ppmCu,while a nearby VB35 FIA averages 5900 ppmCu. In themid system, Cu
concentrationsinVB35FIAshaveaveragesthatrangefrom12to>14000ppm,but
most FIAs average a few thousand ppm Cu (1500 – 4200 ppm). In general, the
highestCuconcentrationsdeterminedforVB35FIAsare found in themidsystem,
though these concentrations are quite variable. Copper concentrations are
significantly lower inVB35FIAaverages in theshallowsystem,whereFIAs range
from125 to 2635ppm. Five of six FIAs averaged less than850ppm; the lowest
average Cu concentration in an FIA was 125 ppm. A single FIA averaged a Cu
concentrationofabout2600ppm.
Due to the lack of suitable FIAs to analyze, no VB20H FIAswere analyzed
fromthedeepsystem. AverageFIACuconcentrations fromthemidsystemrange
from519to24106ppm(Figure42).FourFIAsoriginatingfromthedeeperportion
ofthemidsystemaveragedbetween500and1550ppm,exceptforasingleFIAthat

50
containedanaverageCuconcentrationinexcessof24000ppm.Inthehigherpart
of themid system, Cu concentrationswere higher, averaging 2200 to 5500 ppm.
AverageCuconcentrationsinVB20HFIAsfromtheshallowsystemrangefrom170
to50643ppm.VB20HFIAsnearthehighcenteroftheintrusivecomplexhavethe
highestaverageCuconcentrationsdetectedinallVB20Hinclusions,withfiveFIAs
averaging between 11700 and 50600 ppm. Average Cu concentrations were
significantly lower in two FIAs with average Cu concentrations of 460 and 7800
ppm.VB20HFIAsfromtheintrusionflankshaveaverageCuconcentrationsaslow
as170ppm,andaveragesashighas6300ppm.
DuetothelackofsuitableFIAstoanalyze,noVB60FIAsfromthedeeppart
ofthesystemwereanalyzed.AverageFIACuconcentrationsfromVB60FIAsfrom
themidsystemrangefrom0.08tonearly12000ppm(Figure43).Thefourdeepest
FIAshavehigheraverageCuconcentrationsof1400,4600,9500,and12000ppm,
whereas the shallower FIAs all have average Cu concentrations below 370 ppm,
withtheexceptionoftwoFIAswithaverageconcentrationsof5200ppmand7400
ppm. In the shallow part of the system, an FIA from the deep left flank has an
averageCuconcentrationsof39ppm,whiletheupperrightflankhasoneanalyzed
FIA,withanaverageCuconcentrationof6700ppm.
VB85 FIAs have the lowest overall average Cu concentrations, and only
samples from the shallow systemwere analyzed. All sampleshave relatively low
concentrations with FIA average Cu not exceeding 700 ppm (Figure 44). The
highestaverageCuconcentrations(450–700ppm)comefromthecentralportion
oftheshallowsystem,whereasadjacentFIAshaveCuconcentrationsbelow15ppm.

51
CopperconcentrationsandtheirrelationtoknownCugrades
Figures45through48 illustrateorezoneswithwholerockCugrades from
drill core across thedeposit, allowingCu concentrations in inclusions fluids tobe
comparedwithCuconcentrationsinthedeposit.Ingeneral,movingfromthedeep
system to the levels of the ore body in the higher part of the system, Cu
concentrations in ore fluids decrease as Cu grades in the rock increase to > 0.50
wt%. Areas that contain elevated Cu concentrations in inclusion fluids typically
coincidewithareasoflowCugrade,typicallylessthan0.50wt%Cu,withintherock,
andviceversa,althoughVB20Hinclusionsshowasomewhatdifferentpattern.
VB35FIAswiththehighestaverageCuconcentrationsarelocatedbelow900
mdepthandhaveCuassays that indicate less than0.50wt%Cu in the rocks;Cu
concentrations in the fluids range from0 to >14000ppm,withmore thanhalf of
FIAsaveragingmorethan1500ppmCu(Figure45).Above900mdepth,average
Cuconcentrations inVB35FIAsare lowerwhencompared toVB35FIAs fromthe
deepsystem,rangingfrom125to2600ppm,withallbutoneFIAaveragingbelow
850ppmCu.TheseFIAscoincidewithareasof>0.50wt%Cu;oneVB35FIAwith
relativelylowaverageCuconcentrationof350ppmcoincideswithanareaof>1.50
wt%Cu.
Copper concentrations in VB20H FIAs and inclusions are elevated
throughoutthedepositwhencomparedtootherfluidinclusiontypes;however,FIA
Cuconcentrationsareconsistentlyhigherabove900m,whereCugrades,basedon
wholerockassay,areabove0.50wt%.Thispatternisdifferentfromthatobserved
for VB35 FIAs. The deepest FIAs comprised of VB20H inclusions originate from

52
between 900 and 1000 m depth, and coincide with Cu grades of <0.50 wt%
accordingtowholerockassays(Figure46).TheseVB20HFIAs,frombetween900
an1000mdept, have variable averageCu concentrations that range from520 to
24000ppm; threeVB20HFIAshave averageCu concentrationsof520, 1515, and
1550ppm,whileanotherVB20HFIAhasanaverageCuconcentrationofover24000
ppm. Above900mdepth,averageCuconcentrationsinVB20HFIAsaregenerally
higherthanFIAsfrombelow900m.AverageCuconcentrationsintheseFIAsrange
from170toabove50000ppm,withallbutfiveFIAsaveragingmorethan5000ppm
Cu.ThelocationsoftheseFIAsgenerallycoincidewithCugradesof>0.50wt%,and
commonlycoincidewithareasof>1.50wt%Cu.
VB60 FIAs show a similar pattern as VB35 FIAs, where high average Cu
concentrations in FIAs coincidewith areas of low Cu grades, and low average Cu
concentrationsinFIAscoincidewithhighCugradeintherock.Thehighestaverage
Cu concentrations inVB60FIAs are foundbelow900mdepth, and coincidewith
areasof<0.50wt%Cu(Figure47).AverageCuconcentrationsfromVB60FIAsfrom
below 900m depth ranged from 1400 to 12000 ppm,with three FIAs averaging
>4600 ppm Cu. Above 900 m, average Cu concentrations in VB60 FIAs are
noticeablylower;averageCuconcentrationsreach7400ppm,butaveragesinmost
FIAsarebelow400ppm.
VB85 FIAs have average low Cu concentrations, whereas Cu grades from
wholerockassaysaregenerallyhigh.AllVB85FIAsthatwereanalyzedbyLA‐ICP‐
MSweresampledfrom<600mdepth,andallFIAshaveaverageCuconcentrations
<700ppm(Figure48).ThelocationofallVB85FIAsamplescoincideswithareasof
53
>0.50wt%Cugrade.TwoFIAswithaverageCuconcentrationsof0.97and63.3ppm
coincidewithareascontaining>1.50wt%Cu.
InVB35,VB60,andVB85typeinclusions,aninverserelationshipisobserved
between Cu concentration within ore fluids and Cu grade based on whole rock
assay;whereCuconcentrationinthefluidishigh,Cugradeintherockislow,and
viceversa.Thisrelationshipsuggestsalinkbetweenorefluidsresponsibleforthe
transportofCuandCugrades found in the rocksofBatuHijau. AmajorityofCu
remained dissolved while these fluids were deep in the system, and this Cu was
transportedintotheshallowpartofthesystemwhereprecipitationoccurred.The
patternofCudistributioninVB20Hinclusionsdiffersfromthepatternobservedin
theothertypesoffluidinclusions.InVB20HinclusionsCuconcentrationsgenerally
increaseasthefluidmovesupthroughthesystem;however,Cuconcentrationsare
significant throughout the system. This suggests that a large amount of Cu was
transportedinVB20Hfluids,enoughtoprecipitatesignificantamountsofCuwithin
therockswhilestilltransportingCudissolvedinorefluids.
AbsenceofAuinLA‐ICP‐MSresults
WhileBatuHijauisknowntoproducealargeamountofAualongsideCu,Au
isseeminglyabsent fromtheore fluidsbasedonLA‐ICP‐MSanalysesofboth fluid
inclusion and solid Cu‐Fe sulfide minerals. Gold was detected in a single VB35
inclusionataconcentrationof1.14ppm,Auwasbelowdetectionlimitsinallother
analyses. The question arises: based on known Cu and Au grades and limits of
detection,shouldAubedetectedinthefluids? Basedonanaveragebulkgradeof
54
0.53%Cuand0.40g/tAu(Garwin,2002;ArifandBaker,2004),CuandAuwere
ratio’d to get a bulk Cu/Au ratio in ppm. Using this ratio and the average Cu
concentration of 2695 ppm in VB35 inclusions, a theoretical average Au
concentrationof0.20ppmwascalculatedforVB35inclusions. Limitsofdetection
forAuvariedforeveryLA‐ICP‐MSanalysis;however,mostlimitsofdetectionforAu
were at or above the calculated theoretical Au concentration. The similarity
between these limits of detection and the relatively low theoretical Au
concentrationmayexplainwhyAuwasonlyrarelydetectedinthefluidsfromBatu
Hijau.

55
CHAPTER8
MODELFORDEPOSITFORMATION
Two compositionally similar fluids associated with the emplacement of
PliocenetonalitesatthecenteroftheBatuHijausystemhavebeenidentified.Based
on reconstructed trapping temperatures and elemental concentrations, primarily
thoseofCu,thefirstfluidpulsewastrappedbyVB60inclusionsfoundthroughout
the deposit. A second, cooler and denser but compositionally similar fluid was
initially trapped in VB35 inclusions and subsequently separated into immiscible
vaporandbrinethatweretrappedinVB85andVB20Hinclusions,respectively.The
relationship between the two fluids is not completely understood, but it is
hypothesized that the two fluids are genetically related based on their similar
elemental compositions derived from SXRF and LA‐ICP‐MS analyses. Based on
elevated fluid temperatures, consistent Cu concentrations, and the general non‐
reactivity ofmetals, the fluid trapped byVB60 inclusions is interpreted to be the
earlierofthetwofluids.
Duetothelackofprimaryinclusionslargeenoughforquantitativeanalysis,
and the ambiguity of most crosscutting relationships, these fluids have not been
linkedtoaspecifictonaliteintrusion.Previousworkers(Clodeetal.,1999;Proffett,
minereport,1999;Garwin,2000,2002)notedthatelevatedCuandAuarespatially
associatedparticularlywiththeoldtonalite,butalsowiththeintermediatetonalite,
andthemajorityofCuandAumineralizationislikelyrelatedtothesetwointrusive
events.

56
Fluid1:VB60Inclusions
High temperature, low density fluids trapped by VB60 inclusions exsolved
from a crystallizing intrusion and flooded the ore system. Homogenization
temperaturesinVB60inclusionsarethehighestrelativetoallotherinclusionstypes
with the lowest recorded minimum temperature being 385 °C; minimum
homogenization temperatures for VB60 inclusions were recorded up to 500 °C.
These temperaturesareminimumtemperatures, ashomogenization temperatures
in vapor‐rich inclusions can be underestimated by up to 500 °C (Sterner, 1992).
Such high temperature fluids would have accompanied and perhaps have been
responsiblefor,earlyhightemperaturepotassicalterationinthecentralpartofthe
intrusive system.AlthoughX‐Yplots indicated thatall elements inVB60 inclusion
fluidswerenonreactive,theK/NaplotdoesdidshowsomevariabilityforK.
Generally high Cu concentrations along with the high homogenization
temperatures inVB60 inclusionssupport the interpretation that these fluidswere
early and part of the ore system. Most VB60 inclusions contain >1000 ppm Cu,
many inclusionscontain>4500ppmCu,and insomeinclusionsCuconcentrations
approach 12000 ppm. The highest Cu concentrations in VB60 fluid inclusions
coincidewithareasoflowCugradebasedonNewmontwholerockassay.Inthese
areas,Cu concentrations in inclusionsbasedonLA‐ICP‐MSanalyses show thatCu
remaineddissolved in theore fluidasquartzprecipitatedand trappedVB60 fluid
inclusions.Thispatternisobservedthroughoutthedeposit.TheapparentlackofCu
precipitation from this fluid is likely due to the high temperatures of fluids, but

57
could also be a result of a decrease in porosity and permeability as quartz
precipitatedandformedveins.Thelowesthomogenizationtemperaturedetermined
for VB60 inclusions at Batu Hijau is just below the ideal temperature of Cu
precipitation observed at Bajo de la Alumbrera (400 °C), while most
homogenization temperatures exceed this temperature (Ulrich et al., 2002;
Heinrich,2003).
Of18pairsofelementsevaluatedwithX‐Yplots,R2valuesapproaching1.00
existforallbuttwo.Thissuggeststhatalmostallelements,includingCu,werenon
reactiveandremaineddissolvedwithintheVB60‐formingorefluid,andfluid‐rock
reactionsandprecipitationofelementsfromthefluidswereminimal.R2valuesfor
Cu, however, are slightly lower than R2 values for other elements including base
metalsandtypicalsaltcations,suggestingthatsomeCumayhavebeenlosttoveins,
whilethemajorityofCuremaineddissolvedintheorefluid.
Fluid2:VB35,VB20H,andVB85Inclusions
A second fluid that was modified by changes in system pressure and
temperaturewas trappedby three inclusion types:VB35,VB20H, andVB85. The
secondfluid,initiallytrappedbyVB35inclusions,encounteredconditionsthatledto
immiscibility and the fluid separated to formbrine, trappedbyVB20H inclusions,
andvapor,trappedbyVB85inclusions(Figure49).
Basedoncoolerfluidtemperatures,highCuconcentrations,andevidencefor
increased fluid‐rock reaction and metal precipitation, this second fluid is
interpreted tohavebeen themainore‐forming fluid atBatuHijau. In thedeepest
58
partofthesystem,between1300and850mdepth,trappingtemperaturesforVB35
inclusions are between 120 and 250 °C cooler than minimum homogenization
temperaturesforVB60inclusions.Becausehomogenizationtemperaturesmayhave
beenunderestimatedbyasmuchas500°C(Sterner,1992)forVB60inclusions,the
temperature difference between these two fluids may have been even greater. A
significant temperature change is observed in VB35 inclusions at around 850 m
depth.VB35trappingtemperaturesabovethiselevationareonaverage50°Clower
thanVB35 inclusions frombelow thisdepth; insome inclusions, thisdifference in
trappingtemperaturecanbeasmuchas120°C.
R2valuesfromLA‐ICP‐MSanalysesforVB35inclusionswerehighlyvariable,
indicatingthatsomeelementswerereactivewhileotherswerenot.Manganese,Zn,
and Pb, were non‐reactive and remained dissolved in the VB35 fluids during
transport. Consistent base metal compositions are also evident in all inclusions
analyzedbySXRF,whichshowsstrongcorrelationsbetweenMn,Pb,andZn.These
basemetals likelyremaineddissolvedintheorefluidstobeprecipitatedatcooler
temperatures and shallower depths in the basemetal deposits that are observed
withintheBatuHijauminingdistrict(Garwin,2000).Potassium,Ca,FeandCuare
reactive,suggestingthattheseelementsreactedwithwallrocksandprecipitatedor
werescavengedbythefluidtovaryingdegrees.PotassiumandFelikelytookpartin
wall rock reactions to formK feldspar, biotite, and sericite, and toprecipitate Fe‐
bearingsulfides,respectively. Calciumwasprobablyscavengedfromwallrocksas
primaryplagioclasefeldsparswerealtered.ThereactivityofCuislikelyduetoCu

59
precipitationassociatedwith the formationofCu‐Fe sulfides suchas chalcopyrite,
bornite,anddiginite.
Depositwide immiscibility of theVB35 fluid to form theVB20Hbrine and
VB85vaporphases appears tobedepth‐controlled, andoccurreddominantly at a
depth of about 850m below the surface. While all inclusion types can be found
throughout the entirety of the deposit, there is a significant change at this depth,
characterized by a transition from VB35‐dominated inclusions below 850 m, to
VB20H‐ and VB85‐dominated inclusions above 850 m in A and AB veins. This
distributionsuggeststhatthebuoyantVB35fluidbecameimmisciblelargelydueto
decreasingpressureduringupwardmigration through the system.The consistent
depthof immiscibilitysuggests thatdecreasingpressurewastheprimarycauseof
immiscibilityasthefluidrose.Thisinterpretationismorelikelythanimmiscibility
in response to depressurization from local fracturing events across the deposit,
whichwouldnotberelatedtoasingledepth.
Figure 49 shows a H2O‐NaCl phase diagram illustrating the approximate
pressure,temperature,andsalinityconditionsforfluidsfromeachinclusiontypeat
BatuHijau,withVB60’sshowninorange,VB35’sshowninred,andVB20H’sshown
ingreen,witherrorbarsrepresentingthevariabilityinsalinity.Arangeofpressure,
temperature,andsalinityconditionsoccurforallinclusiontypes,sothepositionof
each point represents average conditions for the bulk of fluids and represents a
possible fluid evolution pathway. VB60 fluids, with minimum trapping
temperatures of about 400 °C, are plotted at the base of a line extended up to a
theoretical maximum trapping temperature of about 1000 °C (Sterner, 1992). A
60
second pathway exhibits a decrease in temperature and pressure for VB35 fluids
shownby the redarrow. Depressurizationof theVB35 fluid led to immiscibility
and the formation of VB20H and VB85 inclusions; the difference in density and
salinity between these two inclusion types is represented by the location of the
VB20HfluidandadashedgreenlineextendingtowardthelocationofVB85fluids.
VB85inclusionswerenotplottedonthisfigureduetotheirexistenceatconditions
thatareoutsidetherealmofcurrentlyavailableexperimentaldata.
TheimmiscibilityofVB35fluidsformedfluidstrappedbyVB20HandVB85
inclusionsthatdiffergreatlyfromoneanother.VB85inclusionswereCu‐poor,and
analysesindicated<700ppmCuinthesefluidsinthedeposit. Conversely,VB20H
inclusionscontainedabundantCu,andwererelativelyenrichedinCuabovethe850
m immiscibility horizonwhen compared to VB20H inclusions from below 850m
depth;highCuconcentrationsinVB20HfluidscoincidewithareasofhighCugrade
basedonwholerockassay,contrastinginthepatternobservedforVB35inclusions.
Significant coolingofVB20H fluids isnotobserved,with all trapping temperature
fallingbetween315and400°C.Thistemperaturerangeisequaltoandbelowthe
temperatureatwhichCuprecipitationoccurredatwithintheBajodelaAlumbrera
deposit(Ulrichetal.,2002Heinrich,2003).Astheratioofthegeneratedvolumeof
liquid to vapor is not known, the amount of Cu transported by each subsequent
phasecannotbedetermined.
FluidcompositionsinVB20Hinclusionsarevariablewhencomparedtothe
compositionallynon‐reactivefluidthatwasfluidtrappedbyearlierVB60inclusions,
andgenerallymirrorVB35fluidswithrespect to thereactivityofelementsduring

61
transport. R2 values for VB20H inclusions are slightly lower than for VB35
inclusions,suggestingafluidthatissomewhatmorereactivethanitsparentalVB35
fluid, especiallywith respect to Cu. Similar toVB35 fluids,Mn, Zn, andPb in the
VB20Hbrinearenon‐reactive,suggestingtheseelementsdidnotprecipitateduring
transportthroughthesystem.Potassium,Ca,Fe,andCuareallreactive,suggesting
thattheseelementswerepartofwallrockreactionsandprecipitation;K,Ca,andFe
were likelypartofwall rock reactions responsible for the formationof sericite,K
feldspar, andbiotite, the scavengingofCa fromalteringplagioclase feldspars, and
theprecipitationofFe‐bearingsulfideminerals,respectively,whileCuprecipitated
inCu‐Fesulfides.
R2 values for VB85 inclusions indicate a fluid that is compositionally
consistent,andgenerallymirrorsVB60fluidswithrespecttoreactivity. Thisfluid
was relativelynon‐reactive and fluid‐rock reactiondidnot cause significantmetal
precipitation; however, while Cu in VB85 fluids is largely non‐reactive, the
moderatelyhighR2values suggest that someCuwas likely lost toprecipitationof
Cu‐Fesulfides.

62
CHAPTER9
CONCLUSIONS
Ore fluids at Batu Hijau likely formed in two stages. An initial high
temperature, compositionally consistent fluidprecipitatedonlyminorCuandwas
trapped inVB60 fluid inclusions. This fluidwas followedbya cooler,denser,but
compositionally similar fluid that was much more reactive and contributed
significantly towall‐rock reaction andmineral precipitation, andwas responsible
fortheformationofVB35inclusions. Thissecondfluidbecameimmiscibleduring
itsascenttowardthesurface,resultingintheformationofbrineandvaporphases,
trappedbyVB20HandVB85inclusions,respectively.Thisbrinephasemirrorsthe
reactivity of its parental VB35‐forming fluid, and it is likely that these two fluids
wereresponsibleforthebulkofCuprecipitatedatBatuHijau.

63
Table1.LA‐ICP‐MSinstrumentanddataparameters
Excimer193nmArFlaserGeoLasProOutputEnergy 150mJEnergyDensityonsample ~710J/cm2RepetitionRate 5HzPitSize Betweenxandx mAblationCellVolume ~1.5cm3CellGasFlow(He) ~1L/min
Agilent7500cequadrupoleICPMSAuxiliarygasflow 1.03l/minArRFpower 1500VDetectorMode Dual8ordersofmagnitudelineardynamic
rangeQuadrupoleSettlingTime 2ms
DataacquisitionparametersSweepsperreading 1Readingperreplicate 200300Replicates 1Dwelltimeperisotope 10msPointsperpeak 1permeasurementExternalStandard NIST610glass
6
Table2.CalculatedtrappingtemperaturesforVB35inclusions
DrillHole FIA Temp(°C) DrillHole FIA Temp(°C) DrillHole FIA Temp(°C)SBD2651341.8 BH001 390 SBD257905.7 FIA062‐1 386 SBD21500.3 FIA055‐3 284SBD2651341.8 BH002 396 SBD257905.7 FIA062‐2 274 SBD21500.3 FIA055‐4 296SBD2651341.8 BH003 396 SBD257905.7 FIA062‐3 286 SBD21500.3 FIA055‐5 297SBD2651341.8 FIA020‐1 286 SBD257905.7 FIA062‐4 387 SBD14433.1 FIA013‐1 301SBD2651341.8 FIA020‐2 288 SBD257905.7 FIA062‐5 386 SBD14433.1 FIA013‐2 290SBD2651341.8 FIA020‐3 293 SBD257905.7 FIA063‐1 274 SBD14433.1 FIA013‐3 276SBD2651341.8 FIA020‐4 287 SBD257905.7 FIA063‐2 275 SBD14433.1 FIA013‐4 302SBD2651341.8 FIA021‐1 367 SBD257905.7 FIA063‐3 270 SBD14433.1 FIA013‐5 286SBD2651341.8 FIA021‐2 350 SBD257905.7 FIA063‐4 276 SBD21484.9 FIA007‐1 298SBD2651341.8 FIA021‐3 360 SBD257905.7 FIA063‐5 269 SBD21484.9 FIA007‐2 299SBD2651341.8 FIA021‐4 358 SBD257905.7 FIA067‐1 278 SBD21484.9 FIA007‐3 299SBD2651341.8 FIA021‐5 334 SBD257905.7 FIA067‐2 281 SBD21484.9 FIA007‐4 321SBD2651341.8 FIA021‐6 347 SBD257905.7 FIA067‐3 376 SBD21484.9 FIA007‐5 319SBD2651341.8 FIA021‐7 353 SBD257905.7 FIA067‐4 377 SBD21484.9 FIA007‐6 309SBD257853.1 FIA042‐2 370 SBD257905.7 FIA067‐5 376 SBD21484.9 FIA007‐7 314SBD257853.1 FIA043‐1 324 SBD257905.7 FIA067‐6 380 SBD21484.9 FIA007‐8 318SBD257853.1 FIA044‐2 380 SBD257905.7 FIA067‐7 375 SBD15480.2 FIA056‐1 324SBD257853.1 FIA047‐1 371 SBD257905.7 FIA067‐8 382 SBD15480.2 FIA057‐1 287SBD257853.1 FIA047‐2 384 SBD257905.7 FIA067‐10 380 SBD15480.2 FIA057‐2 292SBD257853.1 FIA047‐3 382 SBD257905.7 FIA067‐11 375 SBD15480.2 FIA057‐3 293SBD257853.1 FIA047‐4 381 SBD49655.8 FIA027‐1 285 SBD15480.2 FIA057‐4 285SBD257853.1 FIA047‐5 382 SBD49655.8 FIA027‐2 294 SBD15480.2 FIA057‐5 286SBD257853.1 FIA047‐6 386 SBD49655.8 FIA027‐3 296 SBD15480.2 FIA057‐6 294SBD257853.1 FIA047‐7 382 SBD49655.8 FIA027‐4 295 SBD15480.2 FIA058‐1 303SBD257853.1 FIA050‐1 382 SBD49655.8 FIA027‐5 295 SBD15480.2 FIA058‐2 300SBD257853.1 FIA050‐2 380 SBD49655.8 FIA027‐6 295 SBD15480.2 FIA058‐3 301SBD257853.1 FIA050‐3 382 SBD49540.2 FIA036‐1 261 SBD15480.2 FIA058‐4 314SBD257853.1 FIA050‐4 381 SBD49540.2 FIA036‐2 261 SBD257853.1 FIA050‐5 381 SBD49540.2 FIA036‐3 263 SBD257853.1 FIA050‐6 382 SBD49540.2 FIA036‐4 265 SBD257853.1 FIA050‐7 382 SBD49540.2 FIA036‐5 375 SBD257853.1 FIA050‐8 328 SBD49540.2 FIA036‐6 281 SBD257905.7 FIA061‐1 248 SBD49540.2 FIA036‐7 280 SBD257905.7 FIA061‐2 248 SBD49540.2 FIA036‐8 270 SBD257905.7 FIA061‐3 248 SBD21500.3 FIA055‐1 300 SBD257905.7 FIA061‐4 248 SBD21500.3 FIA055‐2 300

65
Table3.CalculatedtrappingtemperaturesforVB20Hinclusions
DrillHole FIA Temp(°C)SBD257853.1 FIA029‐3 370SBD257853.1 FIA049‐1 354SBD257853.1 FIA049‐2 340SBD257853.1 FIA049‐3 350SBD257905.7 FIA064‐1 347SBD257905.7 FIA064‐2 355SBD257905.7 FIA064‐3 349SBD257905.7 FIA064‐4 335SBD86781.4 FIA023‐1 397SBD86781.4 FIA023‐3 359SBD86781.4 FIA023‐2 373SBD86781.4 FIA023‐4 315SBD86781.4 FIA025‐1 324SBD86781.4 FIA025‐2 324SBD86781.4 FIA025‐3 335SBD86781.4 FIA025‐4 335SBD86781.4 FIA025‐5 329SBD86781.4 FIA025‐6 318SBD86781.4 FIA025‐7 323SBD49635.1 FIA038‐1 316SBD49540.2 FIA034‐1 381SBD14449.9 FIA006‐1 340SBD21500.3 FIA054‐1 355

66
Table4.SummaryofLA‐ICP‐MSData
ppmB ppmNa ppmK ppmCa ppmMn ppmFe ppmCu ppmZn ppmAsVB35 low ‐ 0.67 0.18 7.11 0.04 0.41 0.60 0.02 ‐ high 0.02 74386.39 37145.51 10632.98 5439.34 17453.88 20858.34 3054.18 ‐ average ‐ 12877.02 3374.59 1357.90 1330.17 2927.26 2696.25 763.37 ‐ median ‐ 6477.32 601.23 248.95 824.69 673.46 407.24 252.67 ‐VB20H low 63.42 1054.04 1194.93 55.20 699.07 41.34 37.03 172.39 ‐ high 448.62 176387.93 127263.96 25937.48 29375.78 161505.70 143645.37 17280.10 25.59 average 183.71 70367.04 32796.86 5295.36 10287.49 56470.27 11084.55 4559.20 ‐ median 111.41 68750.84 26873.62 3324.39 8801.38 59151.79 2929.65 3718.26 ‐VB60 low 0.00 0.32 0.04 0.01 0.01 0.06 0.05 0.01 ‐ high 0.06 33941.80 4419.12 3130.38 2645.28 19462.67 19128.46 2008.86 ‐ average 0.02 10352.69 1175.68 445.72 713.45 3139.01 3588.19 448.71 ‐ median 0.00 5539.40 524.27 92.75 262.02 852.85 1699.68 341.49 ‐VB85 low 0.00 0.04 0.13 0.01 0.00 0.09 0.17 0.02 ‐ high 31.20 827.47 378.43 774.45 144.99 289.55 834.50 62.99 0.00 average 7.24 247.04 74.38 227.17 20.80 69.75 240.66 18.90 ‐ median 1.15 208.15 34.68 57.72 0.49 6.06 20.63 19.79 ‐
ppmRb ppmSr ppmMo ppmAg ppmBa ppmW ppmAu ppmPbVB35 low 0.32 0.18 ‐ ‐ 0.00 ‐ ‐ 0.00 high 5.32 132.50 0.00 ‐ 116.31 ‐ 1.14 229.76 average 2.47 23.68 ‐ ‐ 31.06 ‐ ‐ 51.43 median 2.10 5.64 ‐ ‐ 14.99 ‐ ‐ 19.29VB20H low 4.04 5.71 214.92 18.30 6.82 7.18 ‐ 16.77 high 765.34 350.41 148.61 28.78 5031.90 32.77 ‐ 1314.97 average 113.96 70.93 179.90 24.33 510.76 15.89 ‐ 388.90 median 78.61 54.34 176.17 25.13 275.45 11.80 ‐ 364.94VB60 low 0.00 0.00 ‐ ‐ 0.00 ‐ ‐ 0.00 high 7.89 33.34 ‐ ‐ 56.97 ‐ ‐ 90.11 average 3.95 7.83 ‐ ‐ 18.98 ‐ ‐ 33.18 median 3.95 5.16 ‐ ‐ 14.94 ‐ ‐ 22.56VB85 low 0.00 0.00 0.00 0.00 0.00 0.00 ‐ 0.00 high 0.35 7.81 0.52 0.00 5.48 0.07 ‐ 3.21 average 0.09 2.25 0.10 0.00 1.25 0.03 0.90 median 0.01 0.75 0.01 0.00 1.12 0.02 0.05
67
Table5.SummaryofR2correlationcoefficientvaluesforelementpairsinFigures23through38
VB35 VB60 VB85 VB20HCa‐Na 0.12 0.75 0.93 0.74Ca‐K 0.17 0.89 0.75 0.22Na‐K 0.85 0.88 0.84 0.10Zn‐Fe 0.00 0.85 0.60 0.44Mn‐Fe 0.00 0.95 0.96 0.41Mn‐Zn 0.96 0.96 0.99 0.92Mn‐Pb 0.28 0.93 1.00 0.88Mn‐K 0.93 0.98 0.89 0.71Cu‐K 0.42 0.76 0.83 0.12Cu‐Ca 0.12 0.71 0.67 0.01Cu‐Mn 0.39 0.82 0.82 0.13Cu‐Zn 0.45 0.82 0.77 0.17Cu‐Fe 0.36 0.81 0.80 0.01Cu‐Pb 0.50 0.73 0.87 0.22Cu‐Ba 0.33 0.60 0.84 0.04Cu‐Na 0.24 0.51 0.48 0.20 0.00‐0.34 Weak/Nocorrelation 0.35‐0.69 Moderatecorrelation 0.70‐1.00 Highcorrelation
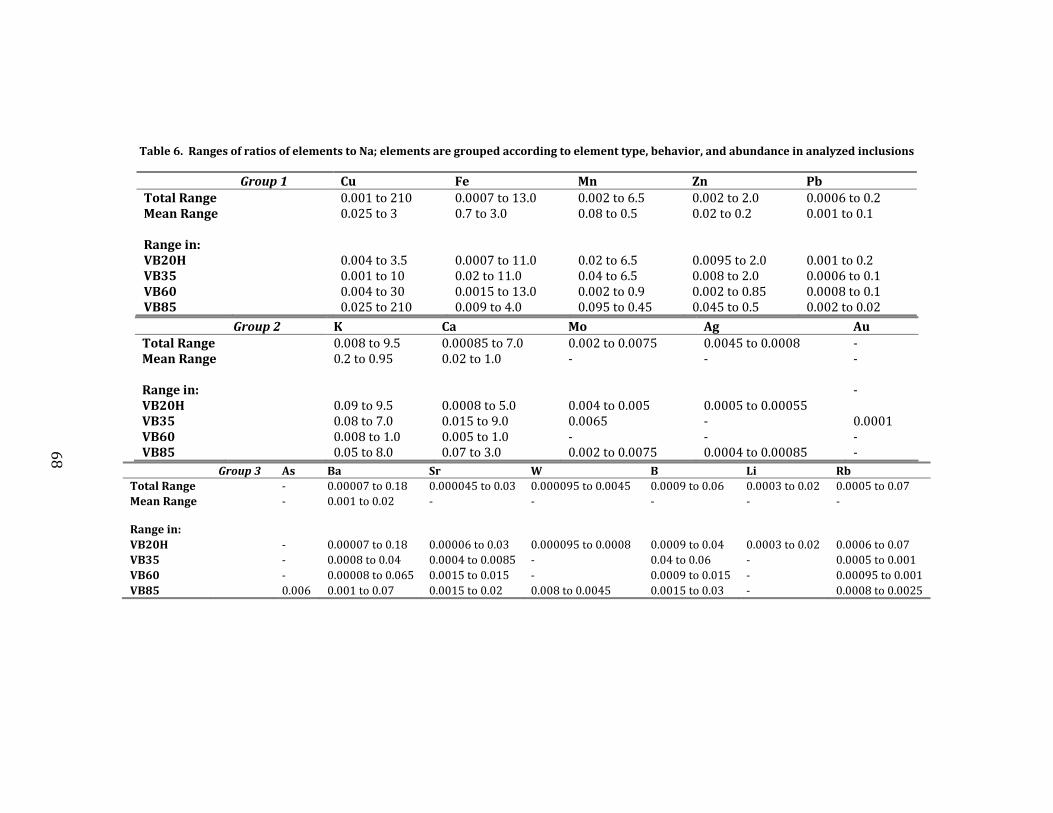
68
Table6.RangesofratiosofelementstoNa;elementsaregroupedaccordingtoelementtype,behavior,andabundanceinanalyzedinclusions
Group1 Cu Fe Mn Zn PbTotalRange 0.001to210 0.0007to13.0 0.002to6.5 0.002to2.0 0.0006to0.2MeanRange 0.025to3 0.7to3.0 0.08to0.5 0.02to0.2 0.001to0.1 Rangein: VB20H 0.004to3.5 0.0007to11.0 0.02to6.5 0.0095to2.0 0.001to0.2VB35 0.001to10 0.02to11.0 0.04to6.5 0.008to2.0 0.0006to0.1VB60 0.004to30 0.0015to13.0 0.002to0.9 0.002to0.85 0.0008to0.1VB85 0.025to210 0.009to4.0 0.095to0.45 0.045to0.5 0.002to0.02 Group2 K Ca Mo Ag AuTotalRange 0.008to9.5 0.00085to7.0 0.002to0.0075 0.0045to0.0008 ‐MeanRange 0.2to0.95 0.02to1.0 ‐ ‐ ‐ Rangein: ‐VB20H 0.09to9.5 0.0008to5.0 0.004to0.005 0.0005to0.00055VB35 0.08to7.0 0.015to9.0 0.0065 ‐ 0.0001VB60 0.008to1.0 0.005to1.0 ‐ ‐ ‐VB85 0.05to8.0 0.07to3.0 0.002to0.0075 0.0004to0.00085 ‐
Group3 As Ba Sr W B Li RbTotalRange ‐ 0.00007to0.18 0.000045to0.03 0.000095to0.0045 0.0009to0.06 0.0003to0.02 0.0005to0.07MeanRange ‐ 0.001to0.02 ‐ ‐ ‐ ‐ ‐ Rangein: VB20H ‐ 0.00007to0.18 0.00006to0.03 0.000095to0.0008 0.0009to0.04 0.0003to0.02 0.0006to0.07VB35 ‐ 0.0008to0.04 0.0004to0.0085 ‐ 0.04to0.06 ‐ 0.0005to0.001VB60 ‐ 0.00008to0.065 0.0015to0.015 ‐ 0.0009to0.015 ‐ 0.00095to0.001VB85 0.006 0.001to0.07 0.0015to0.02 0.008to0.0045 0.0015to0.03 ‐ 0.0008to0.0025
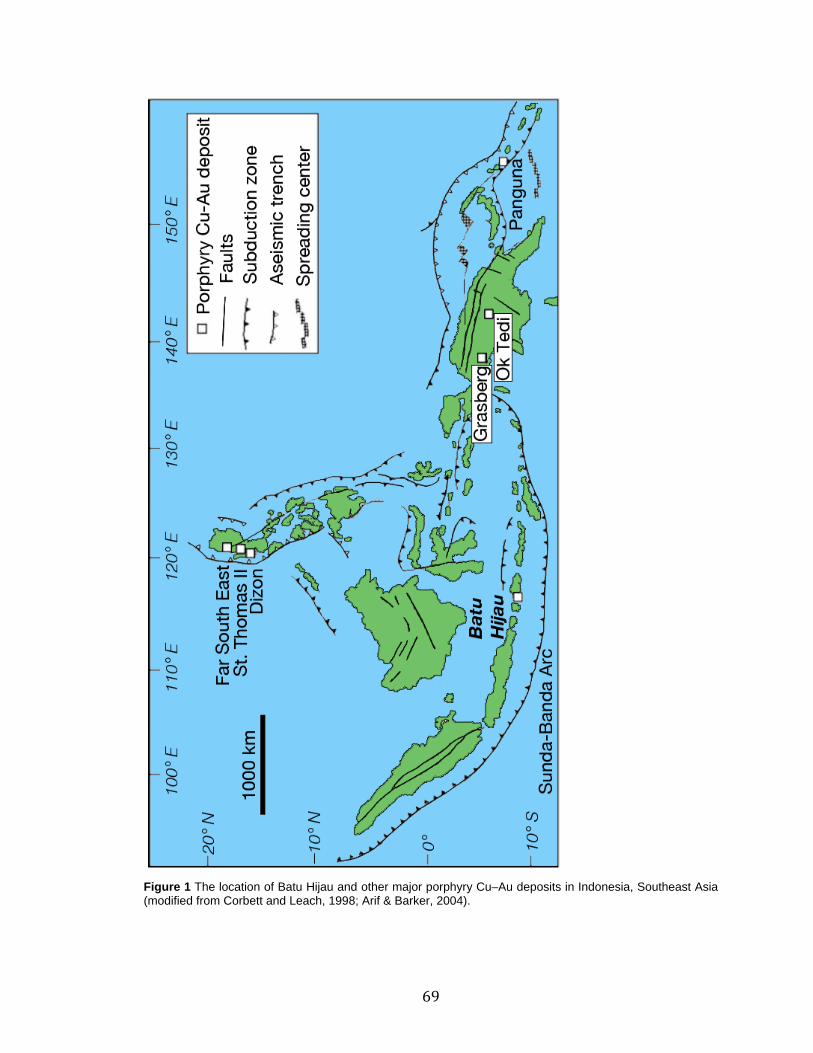
69
Figure 1 The location of Batu Hijau and other major porphyry Cu–Au deposits in Indonesia, Southeast Asia(modified from Corbett and Leach, 1998; Arif & Barker, 2004).

70
Figure 2 Geologic map of southwestern Sumbawa Island, Indonesia. The Batu Hijau mining district iscontained within the smaller pink box (modified from PT Newmont Nusa Tenggara Regional Geology Map,2005)
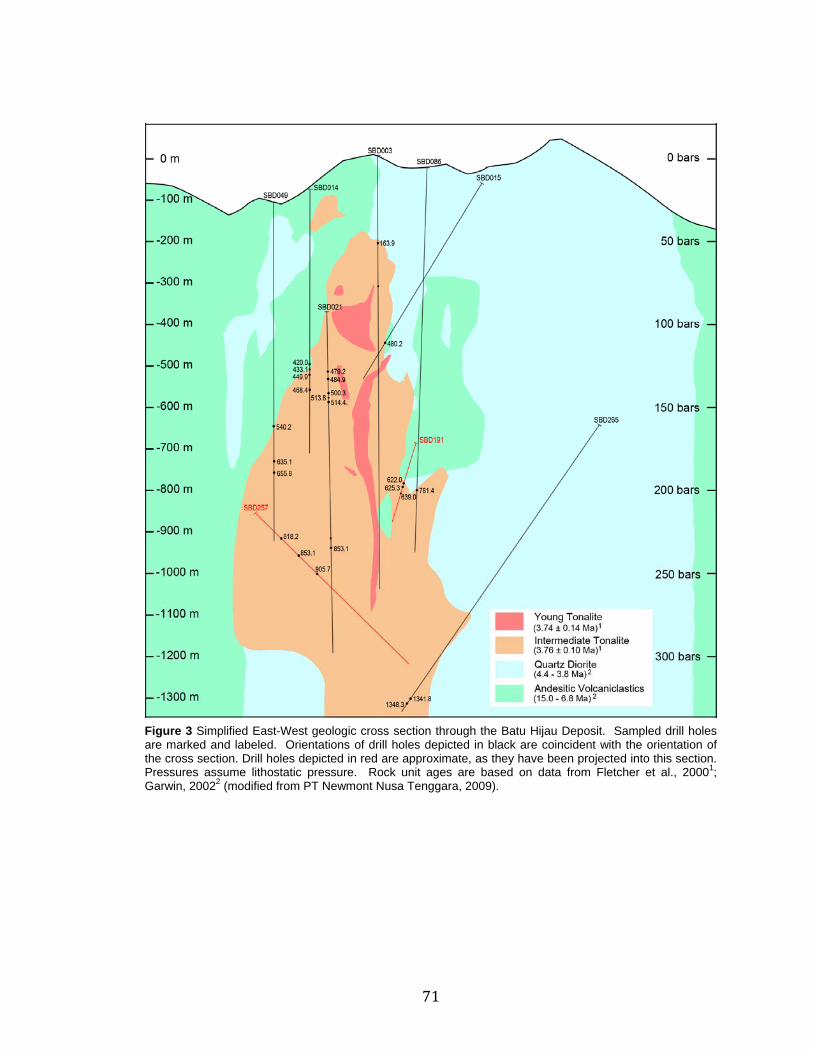
71
Figure 3 Simplified East-West geologic cross section through the Batu Hijau Deposit. Sampled drill holesare marked and labeled. Orientations of drill holes depicted in black are coincident with the orientation ofthe cross section. Drill holes depicted in red are approximate, as they have been projected into this section.Pressures assume lithostatic pressure. Rock unit ages are based on data from Fletcher et al., 20001;Garwin, 20022 (modified from PT Newmont Nusa Tenggara, 2009).
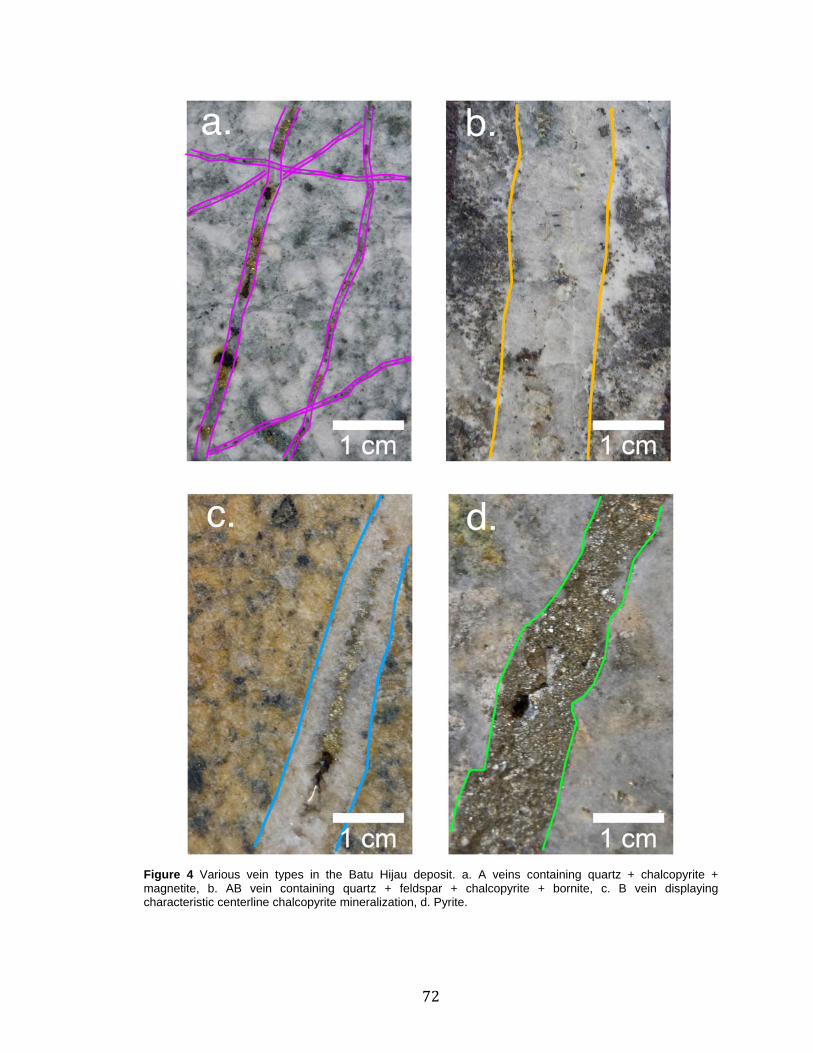
72
Figure 4 Various vein types in the Batu Hijau deposit. a. A veins containing quartz + chalcopyrite + magnetite, b. AB vein containing quartz + feldspar + chalcopyrite + bornite, c. B vein displaying characteristic centerline chalcopyrite mineralization, d. Pyrite.

73
Figure 5 Schematic view of the LA-ICP-MS instrument developed at ETH Zürich, employed at the VT Fluids Research Lab (Heinrich et al., 2003).
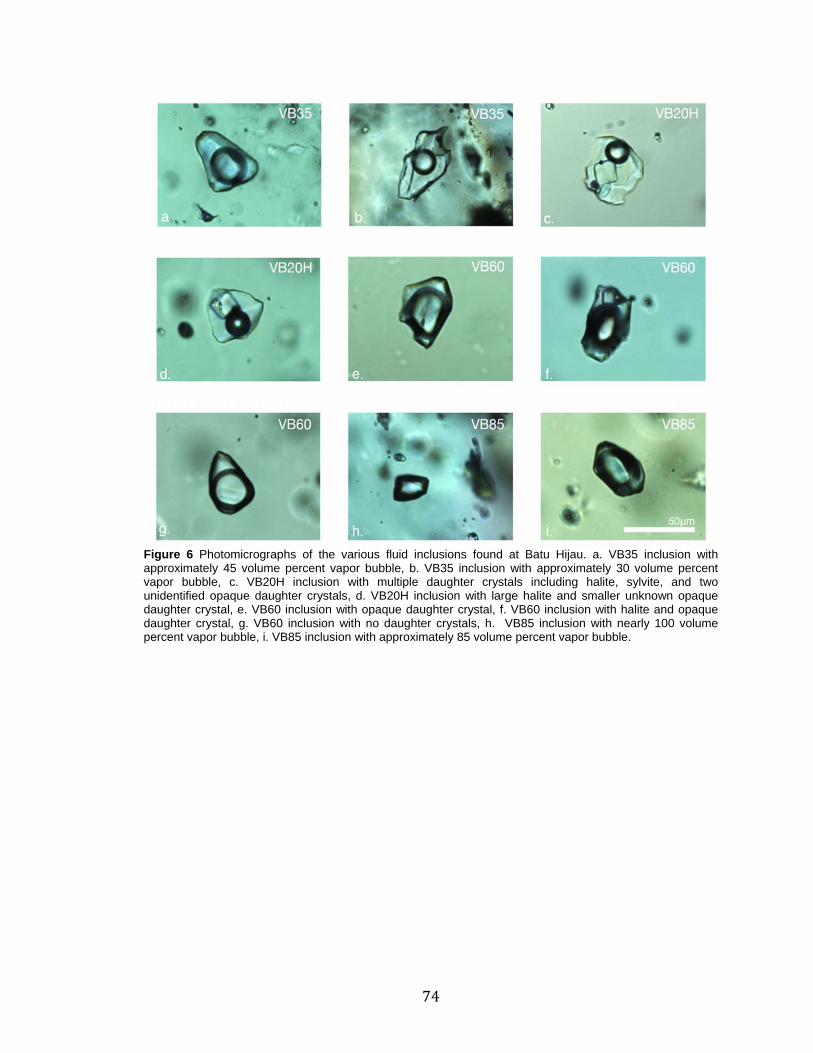
74
Figure 6 Photomicrographs of the various fluid inclusions found at Batu Hijau. a. VB35 inclusion with approximately 45 volume percent vapor bubble, b. VB35 inclusion with approximately 30 volume percent vapor bubble, c. VB20H inclusion with multiple daughter crystals including halite, sylvite, and two unidentified opaque daughter crystals, d. VB20H inclusion with large halite and smaller unknown opaque daughter crystal, e. VB60 inclusion with opaque daughter crystal, f. VB60 inclusion with halite and opaque daughter crystal, g. VB60 inclusion with no daughter crystals, h. VB85 inclusion with nearly 100 volume percent vapor bubble, i. VB85 inclusion with approximately 85 volume percent vapor bubble.
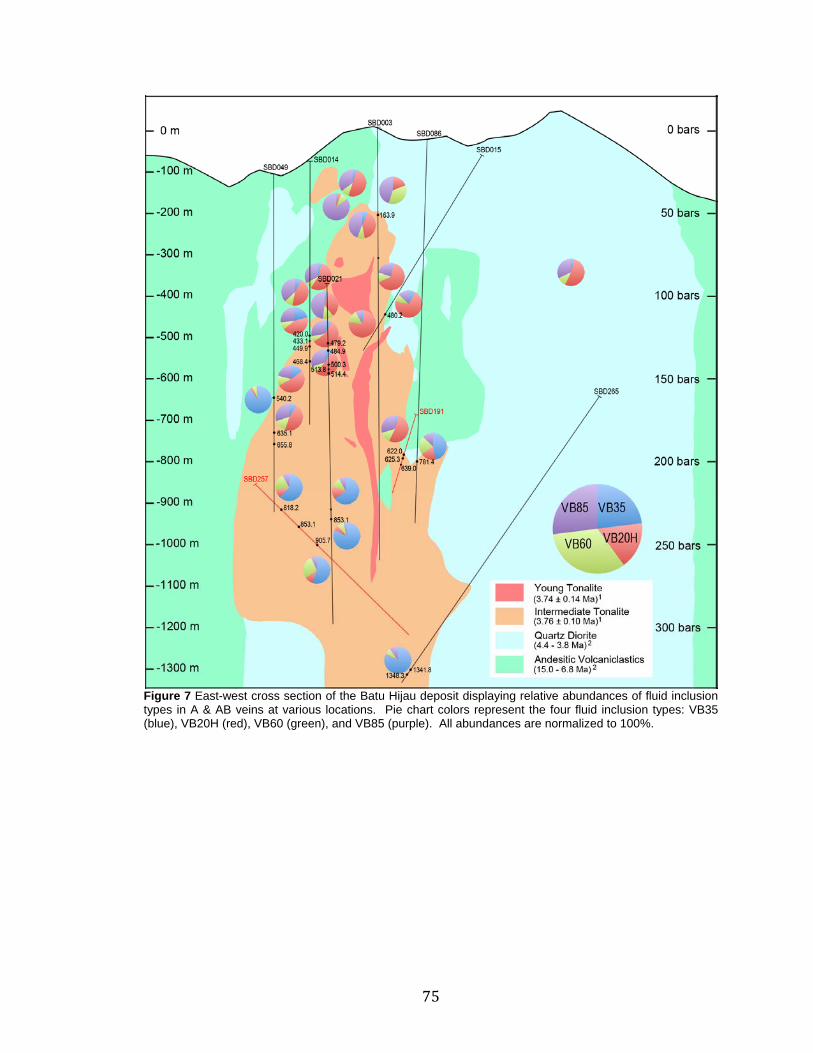
75
Figure 7 East-west cross section of the Batu Hijau deposit displaying relative abundances of fluid inclusion types in A & AB veins at various locations. Pie chart colors represent the four fluid inclusion types: VB35 (blue), VB20H (red), VB60 (green), and VB85 (purple). All abundances are normalized to 100%.
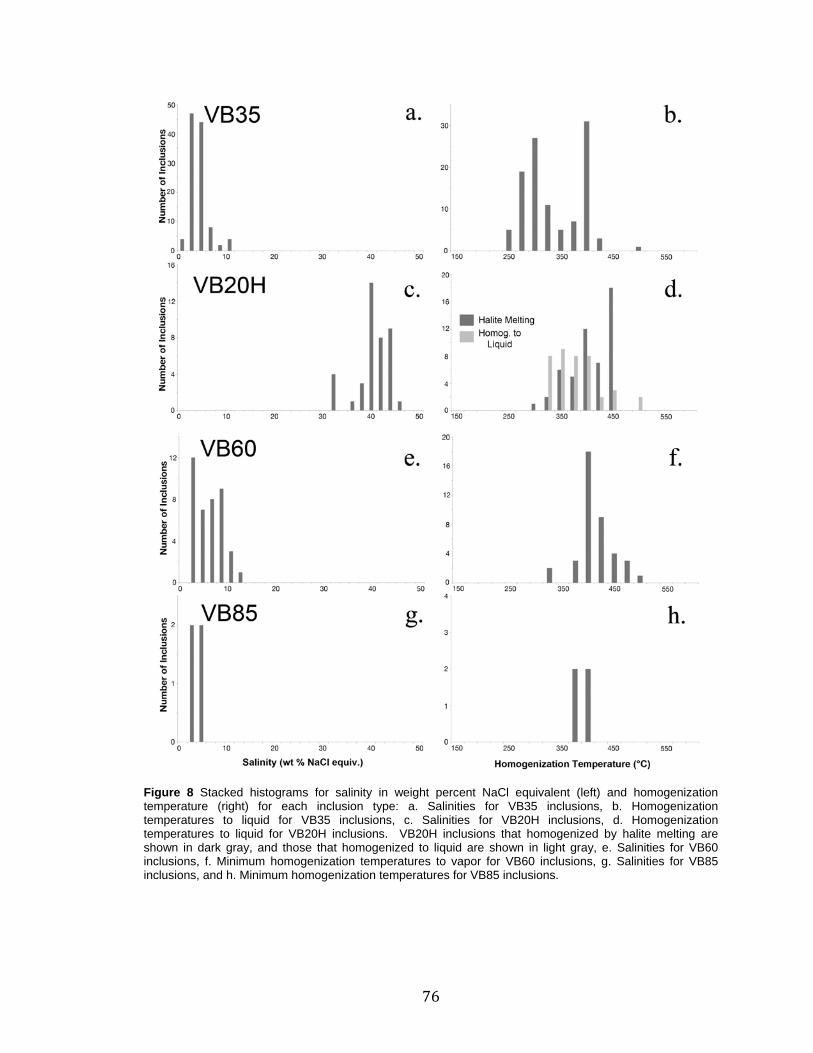
76
Figure 8 Stacked histograms for salinity in weight percent NaCl equivalent (left) and homogenization temperature (right) for each inclusion type: a. Salinities for VB35 inclusions, b. Homogenization temperatures to liquid for VB35 inclusions, c. Salinities for VB20H inclusions, d. Homogenization temperatures to liquid for VB20H inclusions. VB20H inclusions that homogenized by halite melting are shown in dark gray, and those that homogenized to liquid are shown in light gray, e. Salinities for VB60 inclusions, f. Minimum homogenization temperatures to vapor for VB60 inclusions, g. Salinities for VB85 inclusions, and h. Minimum homogenization temperatures for VB85 inclusions.

77
Figure 9 Constant density isochors for VB35 inclusions. Liquid-vapor curve is for a fluid of 5 weight percent NaCl equivalent. Individual black lines extending from liquid-vapor curve are isochors for individual VB35 fluid inclusions. The temperature at the base of each isochore is the homogenization temperature of each inclusion to liquid. The isochore represents a line of constant density and the inclusion could have been trapped anywhere along this line.

78
Figure 10 Constant density isochors for VB20H inclusions. Liquid-vapor curve is for a fluid of 45 weight percent NaCl equivalent. Individual isochors extending from liquid-vapor curve correspond to individual VB20H fluid inclusions. The temperature at the base of each isochore is the homogenization temperature of each inclusion to liquid. Inclusions are differentiated by mode of homogenization; inclusions homogenizing to liquid are in black, while inclusions homogenizing by halite melting are shown in blue. Isochors that do not meet the liquid-vapor curve have salinities other than 45 weight percent NaCl equivalent.
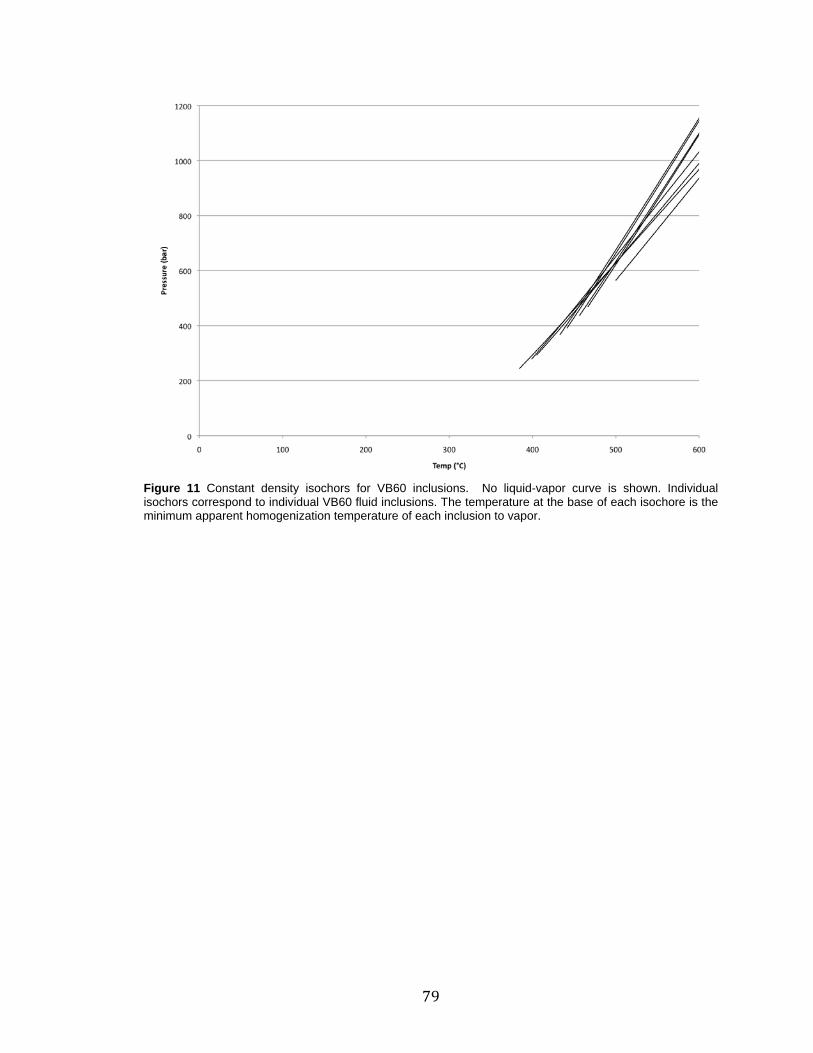
79
Figure 11 Constant density isochors for VB60 inclusions. No liquid-vapor curve is shown. Individual isochors correspond to individual VB60 fluid inclusions. The temperature at the base of each isochore is the minimum apparent homogenization temperature of each inclusion to vapor.

80
Figure 12 Approximate trapping temperatures for 99 VB35 and 23 VB20H inclusions. Histograms are based on relative depth. a. Shallow system (<600 m), b. Mid system (1000 – 600 m) and, c. deep system (1300 to 1000 m). Trapping temperatures are shown on the horizontal axis and were grouped in 25 ˚C intervals; frequency is plotted on the vertical axis.

81
Figure 13 Elemental distribution maps for VB20H inclusion #BH044 exhibiting overlapping high relative concentrations of Cu and Fe, along with elevated abundances of Br, Mn, Zn, K, Pb, and Ti, among other elements. Note the elevated Fe, Mn, and Zn coincide with the inclusion.
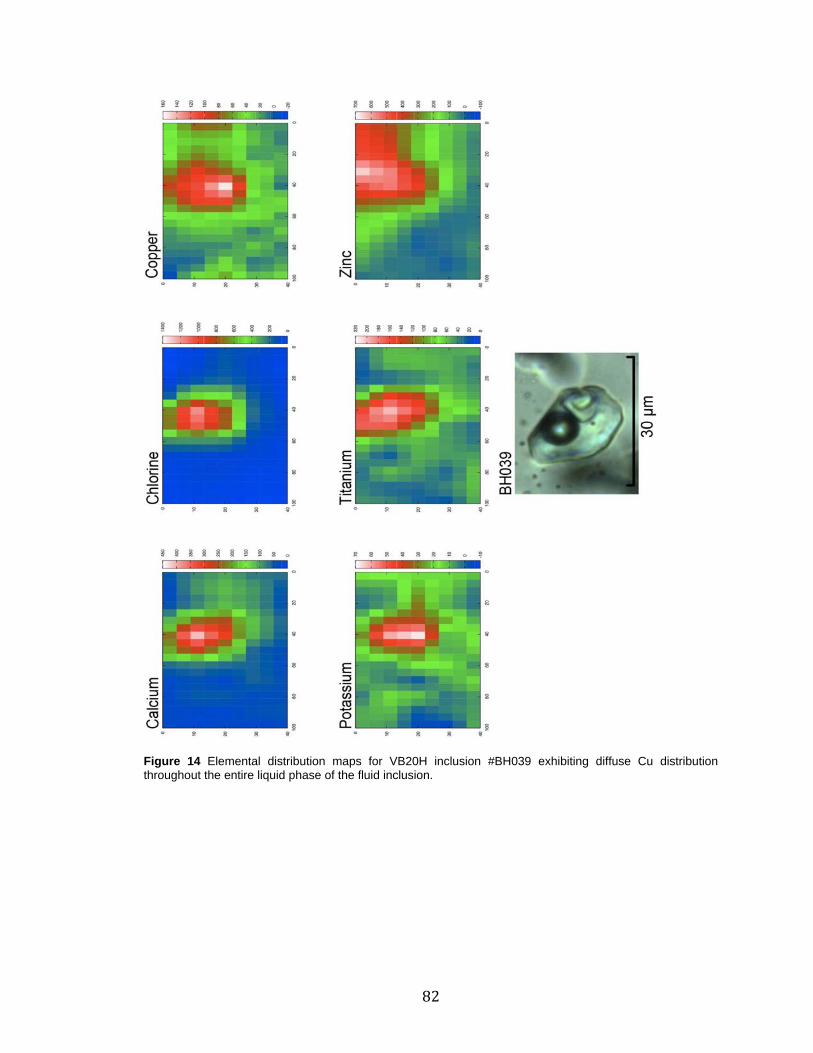
82
Figure 14 Elemental distribution maps for VB20H inclusion #BH039 exhibiting diffuse Cu distribution throughout the entire liquid phase of the fluid inclusion.
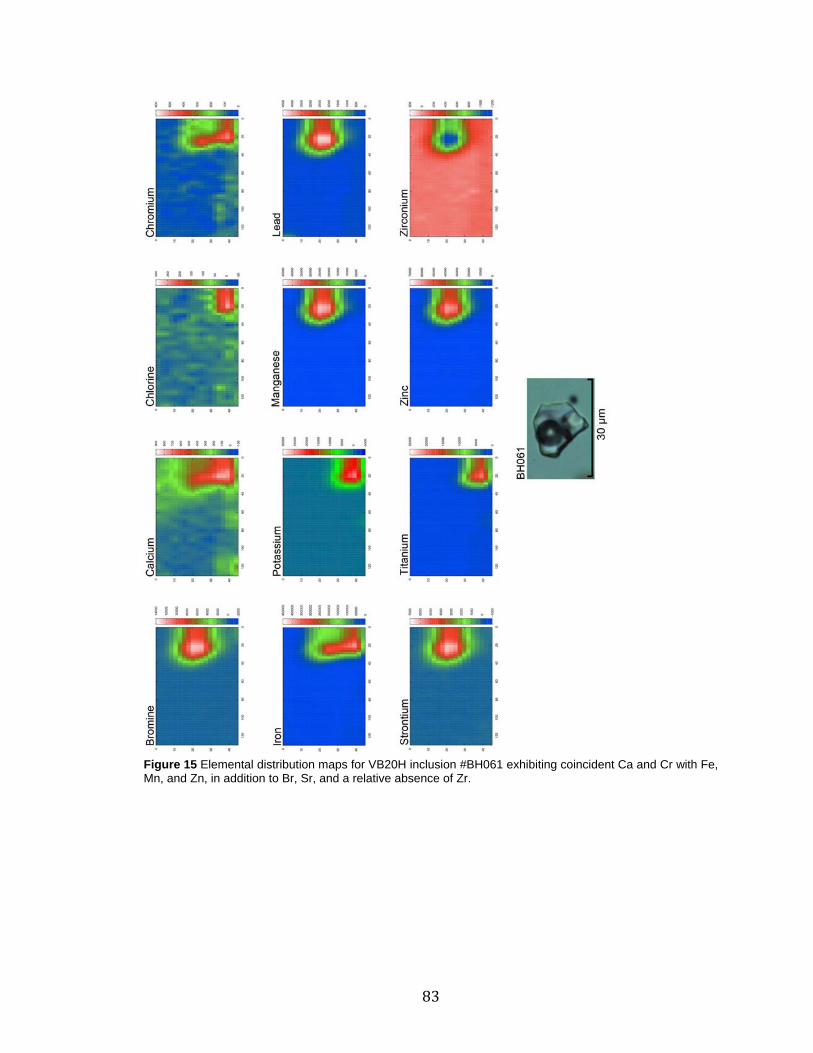
83
Figure 15 Elemental distribution maps for VB20H inclusion #BH061 exhibiting coincident Ca and Cr with Fe, Mn, and Zn, in addition to Br, Sr, and a relative absence of Zr.

84
Figure 16 Elemental distribution maps for VB20H inclusion #BH023 exhibiting concentrated Cu, likely related to the presence of a Cu-bearing daughter crystal.

85
Figure 17 Elemental distribution maps for VB20H inclusion #BH036 exhibiting diffuse Cu throughout the liquid phase of the fluid inclusion.

86
Figure 18 Elemental distribution maps for VB20H inclusion #BH033 exhibiting relative enrichment of Ge within the fluid inclusion, coincident with Mn, Zn, and to a lesser extent, Br.

87
Figure 19 Elemental distribution maps for VB60 inclusion #BH026 exhibiting coincident enrichment of Fe, Mn, and Zn, along with Br. Cu is concentrated into a small area consistent with the presence of a Cu-Fe daughter crystal.

88
Figure 20 Elemental distribution maps of Cl and Mn within inclusion #BH021, demonstrating the lack of apparent patterns that was typically observed in B35 and B85 inclusions. Correlation with a photomicrograph of an individual inclusion was not possible.

89
Figure 21 Elemental distribution maps for VB20H inclusion #BH057 exhibiting overlapping elevated Cu and Fe.

90
Figure 22 Na vs. K plot. Note that Na and K are strongly correlated in all but VB20H inclusions.
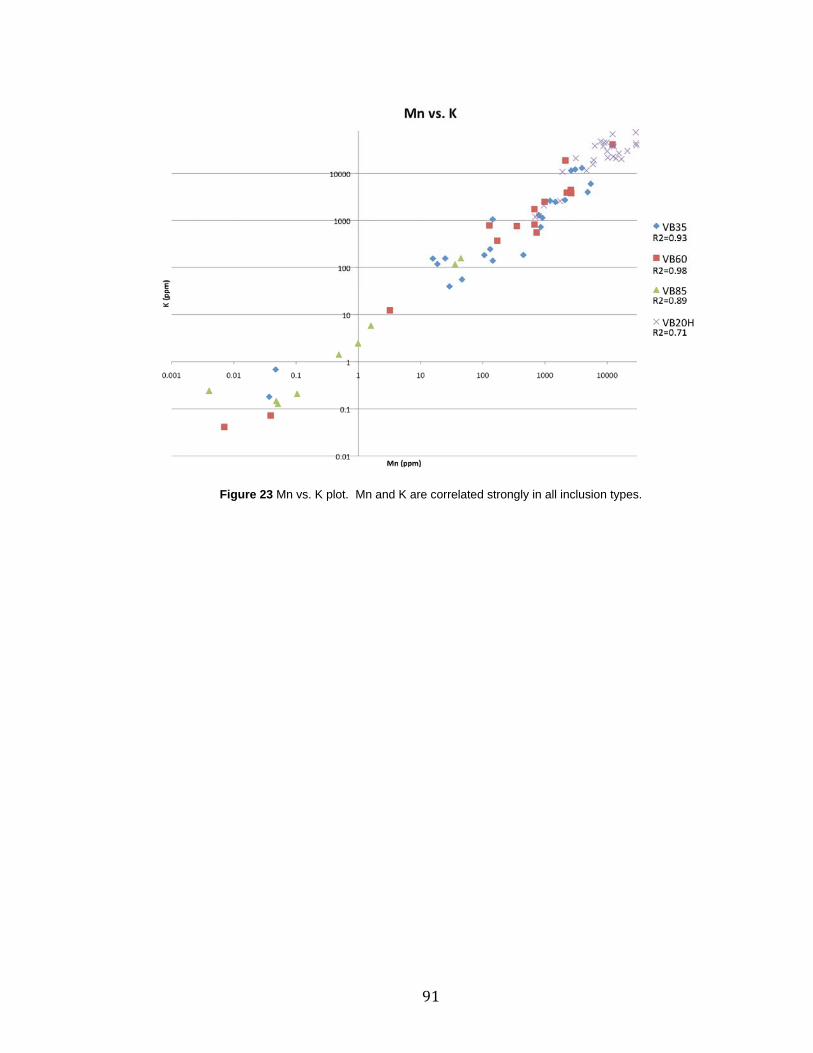
91
Figure 23 Mn vs. K plot. Mn and K are correlated strongly in all inclusion types.
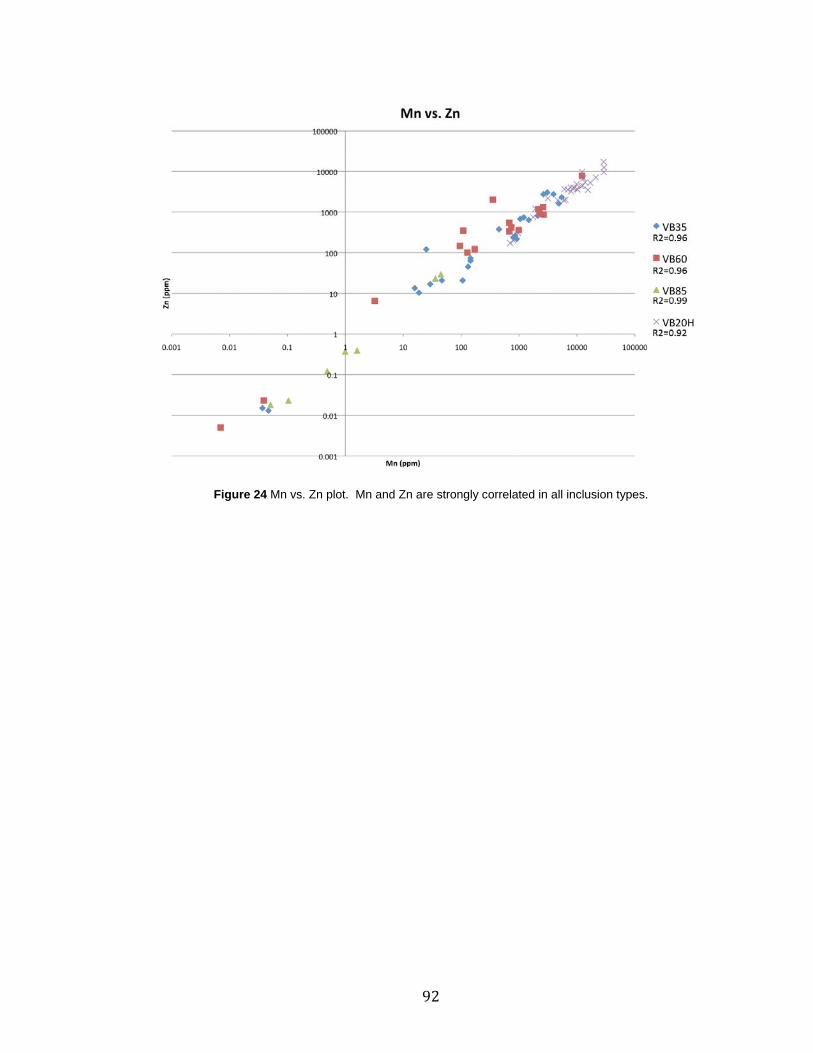
92
Figure 24 Mn vs. Zn plot. Mn and Zn are strongly correlated in all inclusion types.
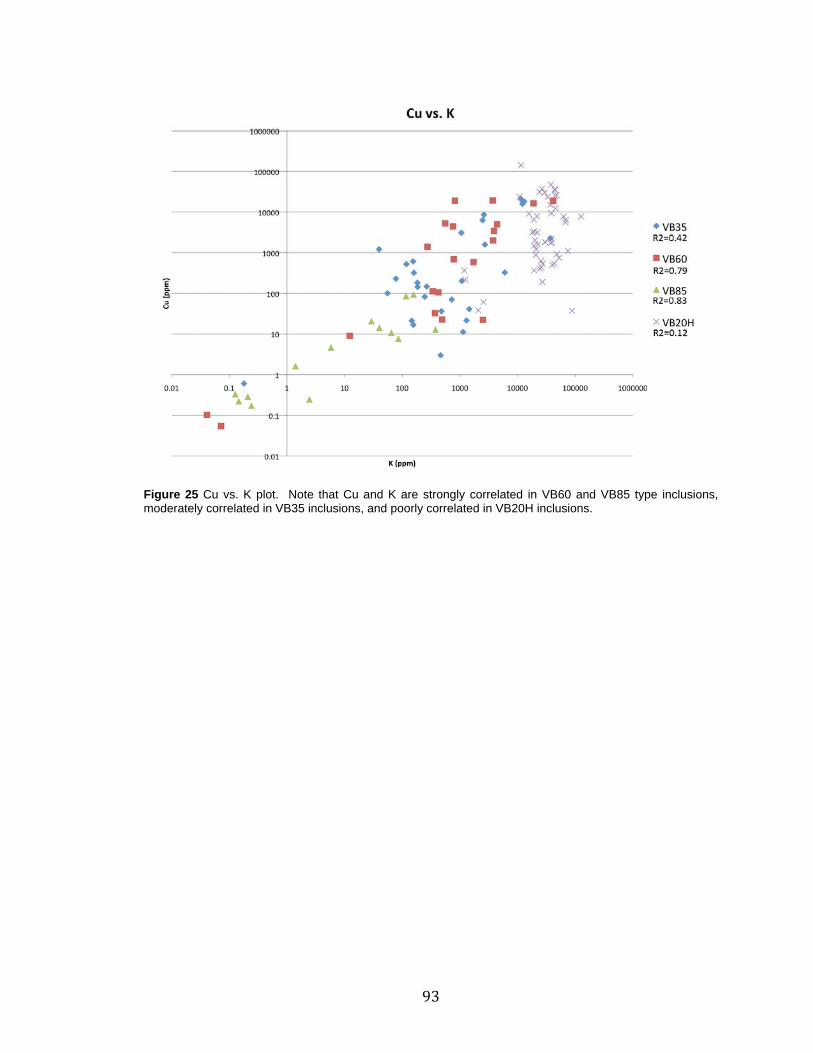
93
Figure 25 Cu vs. K plot. Note that Cu and K are strongly correlated in VB60 and VB85 type inclusions, moderately correlated in VB35 inclusions, and poorly correlated in VB20H inclusions.
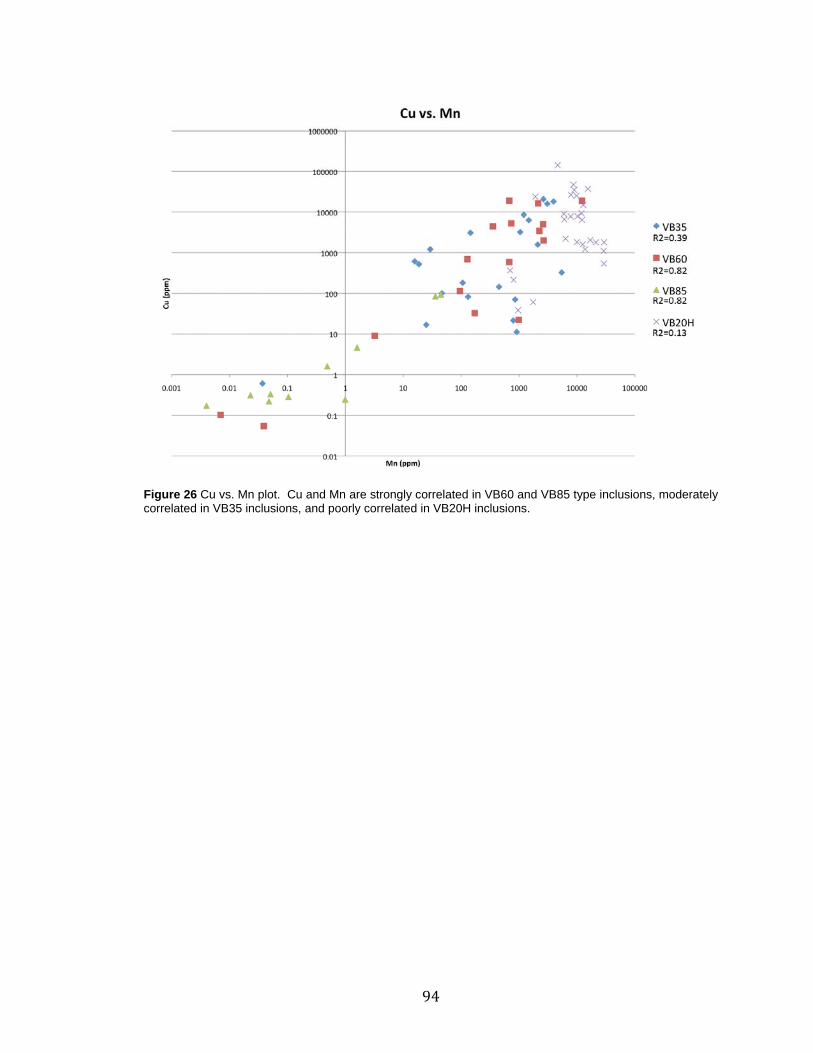
94
Figure 26 Cu vs. Mn plot. Cu and Mn are strongly correlated in VB60 and VB85 type inclusions, moderately correlated in VB35 inclusions, and poorly correlated in VB20H inclusions.

95
Figure 27 Cu vs. Zn plot. Cu and Zn are strongly correlated in VB60 and VB85 type inclusions, moderately correlated in VB35 inclusions, and poorly correlated in VB20H inclusions.
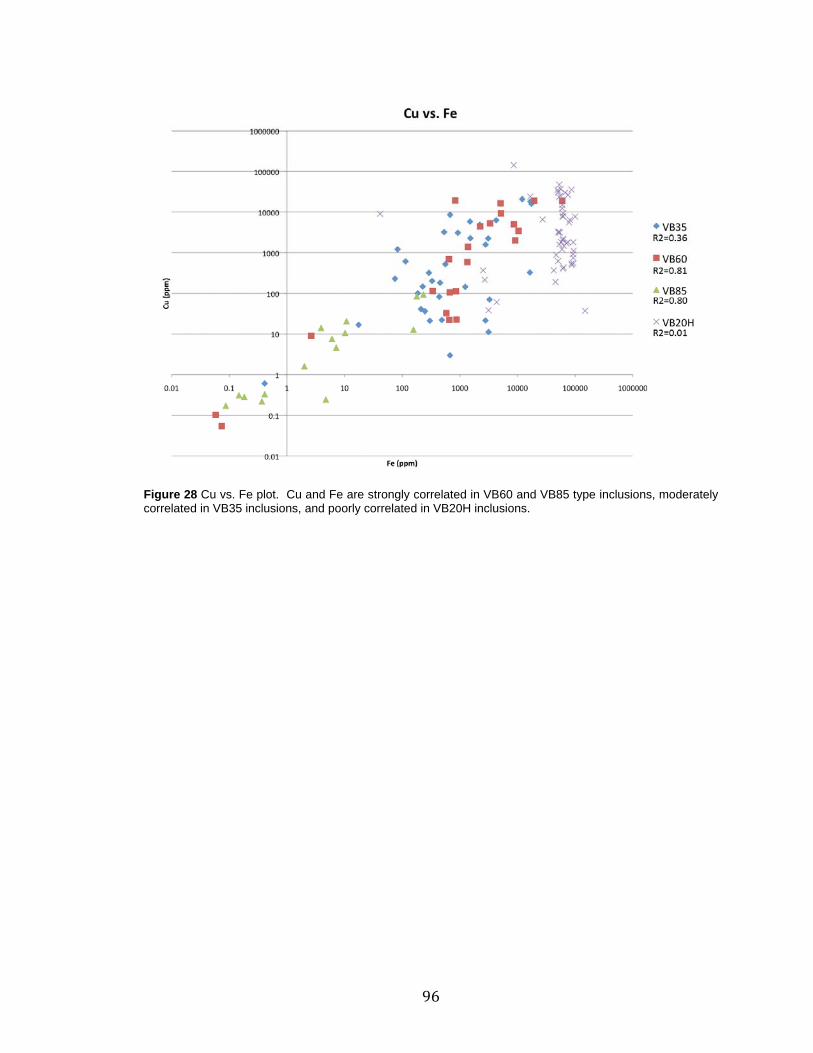
96
Figure 28 Cu vs. Fe plot. Cu and Fe are strongly correlated in VB60 and VB85 type inclusions, moderately correlated in VB35 inclusions, and poorly correlated in VB20H inclusions.
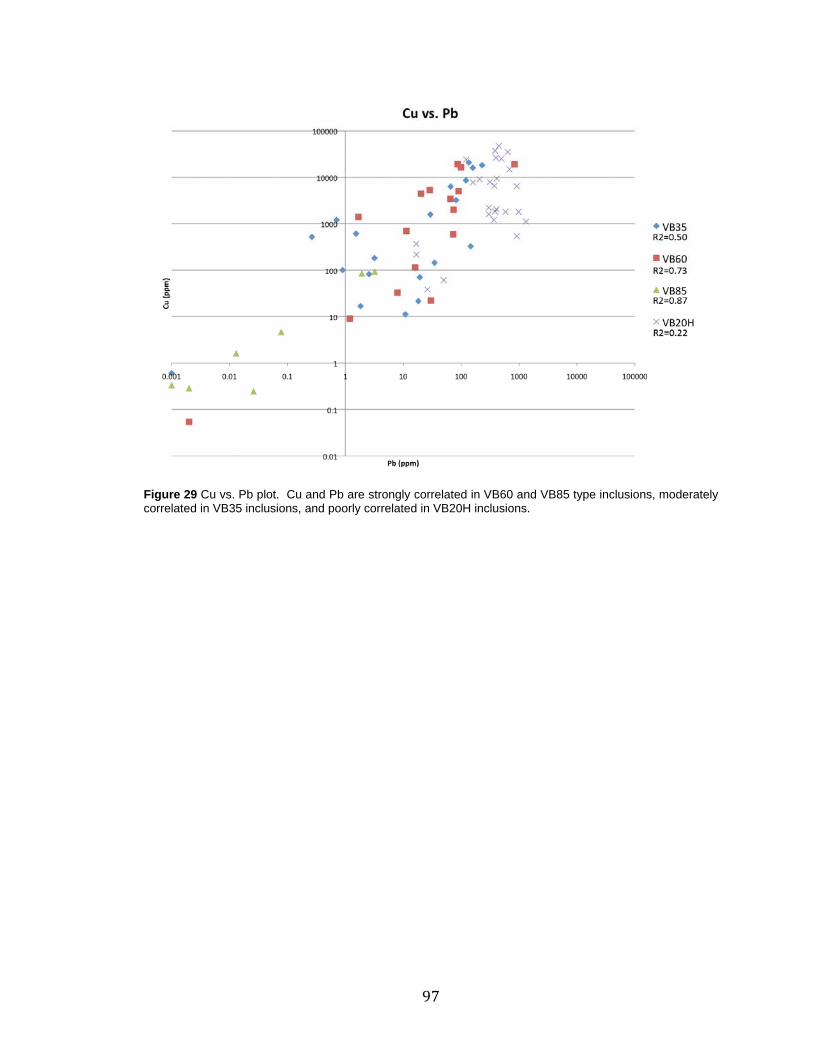
97
Figure 29 Cu vs. Pb plot. Cu and Pb are strongly correlated in VB60 and VB85 type inclusions, moderately correlated in VB35 inclusions, and poorly correlated in VB20H inclusions.
98
Figure 30 Ca vs. Na plot. Ca and Na are strongly correlated in VB60 and VB85 type inclusions, moderately correlated in VB20H inclusions, and poorly correlated in VB35 inclusions.

99
Figure 31 Ca vs. K plot. Ca and K are strongly correlated in VB60 and VB85 type inclusions and poorly correlated in VB35 and VB20H type inclusions.

100
Figure 32 Cu vs. Na plot. Cu and Na are moderately correlated in VB60 and VB85 type inclusions and poorly correlated in VB35 and VB20H type inclusions.

101
Figure 33 Cu vs. Ca plot. Cu and Ca are moderately correlated in VB60 and VB85 type inclusions and poorly correlated in VB35 and VB20H type inclusions.

102
Figure 34 Cu vs. Ba plot. Cu and Ba are strongly correlated in VB85 inclusions, moderately correlated in VB60 inclusions, and poorly correlated in VB35 and VB20H type inclusions.

103
Figure 35 Mn vs. Fe plot. Mn and Fe are strongly correlated in VB60 and VB85 type inclusions, moderately correlated in VB20H inclusions, and poorly correlated in VB35 inclusions.

104
Figure 36 Mn vs. Pb plot. Mn and Pb are strongly correlated in VB60, VB85, and VB20H type inclusions and poorly correlated in VB35 inclusions.

105
Figure 37 Zn vs. Fe plot. Zn and Fe are strongly correlated in VB60 inclusions, moderately correlated in VB85 and VB20H type inclusions, and poorly correlated in VB35 inclusions.
106
Figure 38 Group 1 elements Cu, Pb, Fe, Mn, and Zn ratioed to Na. Ratios are plotted in order of decreasing Cu/Na for each inclusion type. Points at the bottom of the plot, below the red line, indicate analysis for which elements were detected, but were below the limit of detection.
107
Figure 39 Group 2 elements K, Ca, Mo, Ag, and Au ratioed to Na. Ratios are plotted in order of decreasing Cu/Na for each inclusion type. Points at the bottom of the plot, below the red line, indicate analysis for which elements were detected, but were below the limit of detection.

108
Figure 40 Group 3 elements As, Ba, Sr, W, B, Li and Rb ratioed to Na. Ratios are plotted in order of decreasing Cu/Na for each inclusion type. Points at the bottom of the plot, below the red line, indicate analysis for which elements were detected, but were below the limit of detection.
109
Figure 41 East-West cross section through the Batu Hijau deposit. Contained within the boxes are average Cu concentrations for either VB35 FIAs or single inclusions, obtained with LA-ICP-MS analyses, and plotted near the sample location. Standard deviations for FIA averages are listed in parentheses. Concentrations without a standard deviation indicate analyses of a single fluid inclusion. Multiples averages in a single box indicate analysis of multiple FIAs in a single sample.

110
Figure 42 East-West cross section through the Batu Hijau deposit. Contained within the boxes are average Cu concentrations for either VB20H FIAs or single inclusions, obtained with LA-ICP-MS analyses, and plotted near the sample location. Standard deviations for FIA averages are listed in parentheses. Concentrations without a standard deviation indicate analyses of a single fluid inclusion. Multiples averages in a single box indicate analysis of multiple FIAs in a single sample.
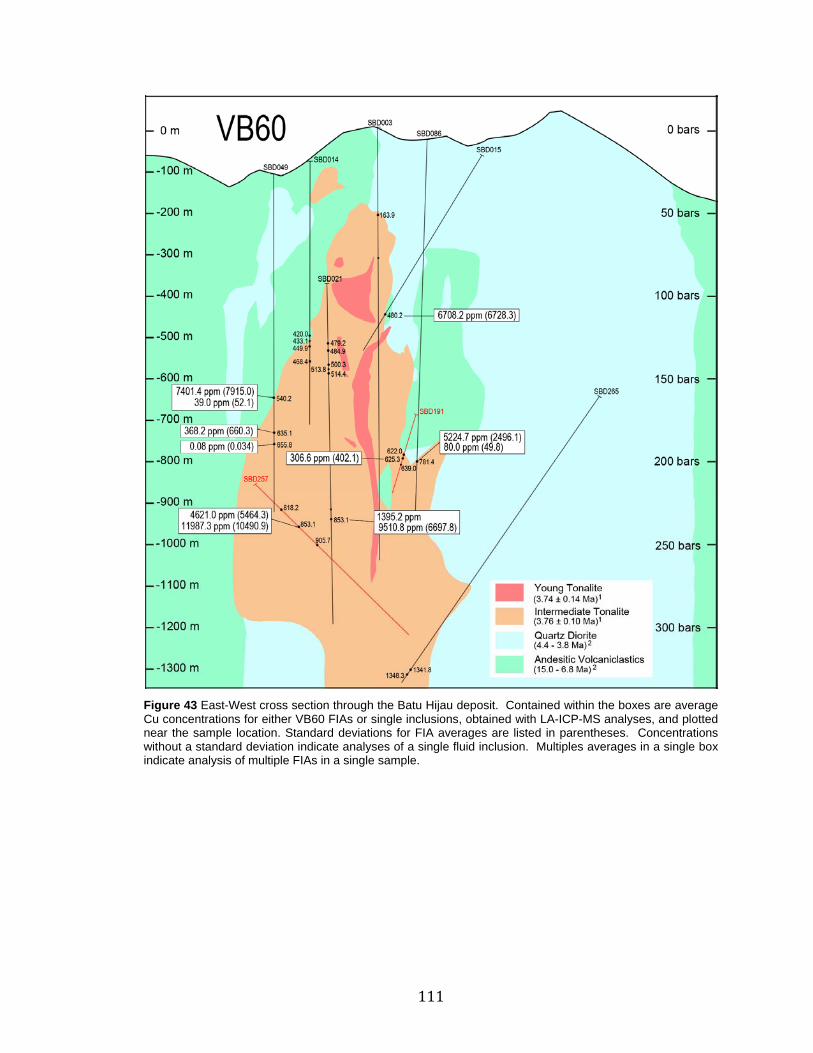
111
Figure 43 East-West cross section through the Batu Hijau deposit. Contained within the boxes are average Cu concentrations for either VB60 FIAs or single inclusions, obtained with LA-ICP-MS analyses, and plotted near the sample location. Standard deviations for FIA averages are listed in parentheses. Concentrations without a standard deviation indicate analyses of a single fluid inclusion. Multiples averages in a single box indicate analysis of multiple FIAs in a single sample.
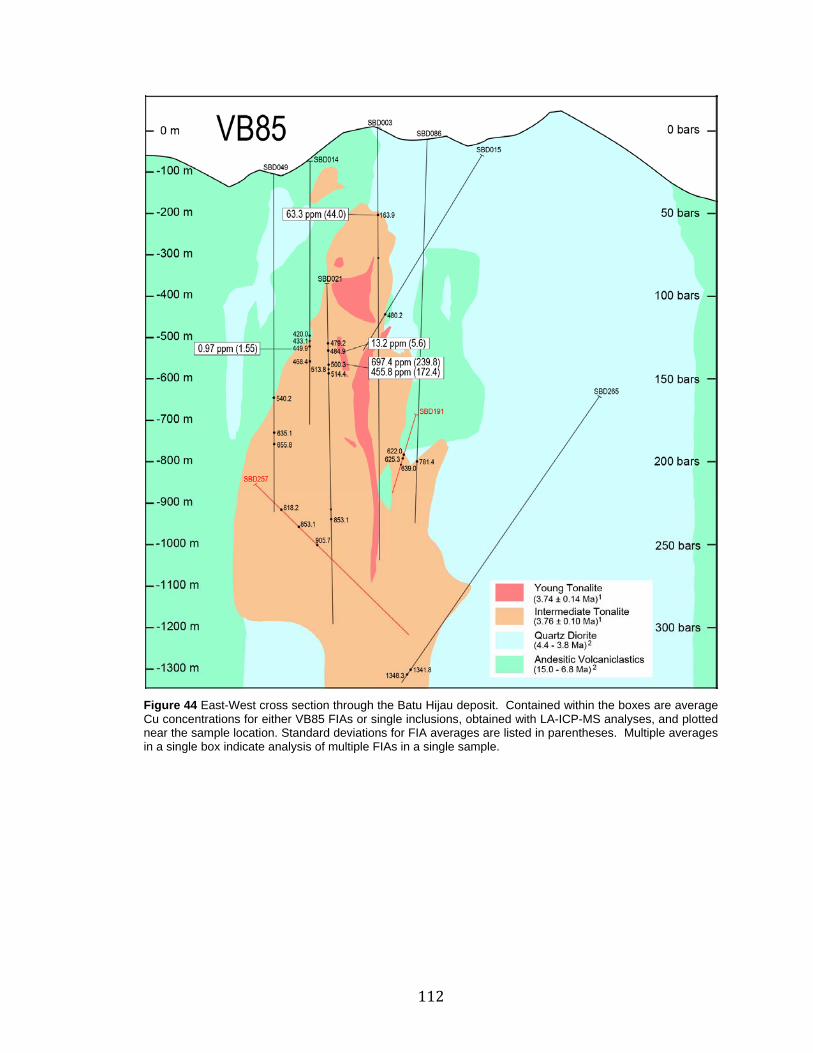
112
Figure 44 East-West cross section through the Batu Hijau deposit. Contained within the boxes are average Cu concentrations for either VB85 FIAs or single inclusions, obtained with LA-ICP-MS analyses, and plotted near the sample location. Standard deviations for FIA averages are listed in parentheses. Multiple averages in a single box indicate analysis of multiple FIAs in a single sample.

113
Figure 45 East-West cross section through the Batu Hijau deposit showing whole rock Cu concentrations obtained from assays from mine drill core. Average Cu concentrations obtained from LA-ICP-MS analyses in VB35 FIAs are plotted for given sample locations. (Johan Arif, Personal Communication, 2009).

114
Figure 46 East-West cross section through the Batu Hijau deposit showing whole rock Cu concentrations obtained from assays from mine drill core. Average Cu concentrations obtained from LA-ICP-MS analyses in VB20H FIAs are plotted for given sample locations. (Johan Arif, Personal Communication, 2009).
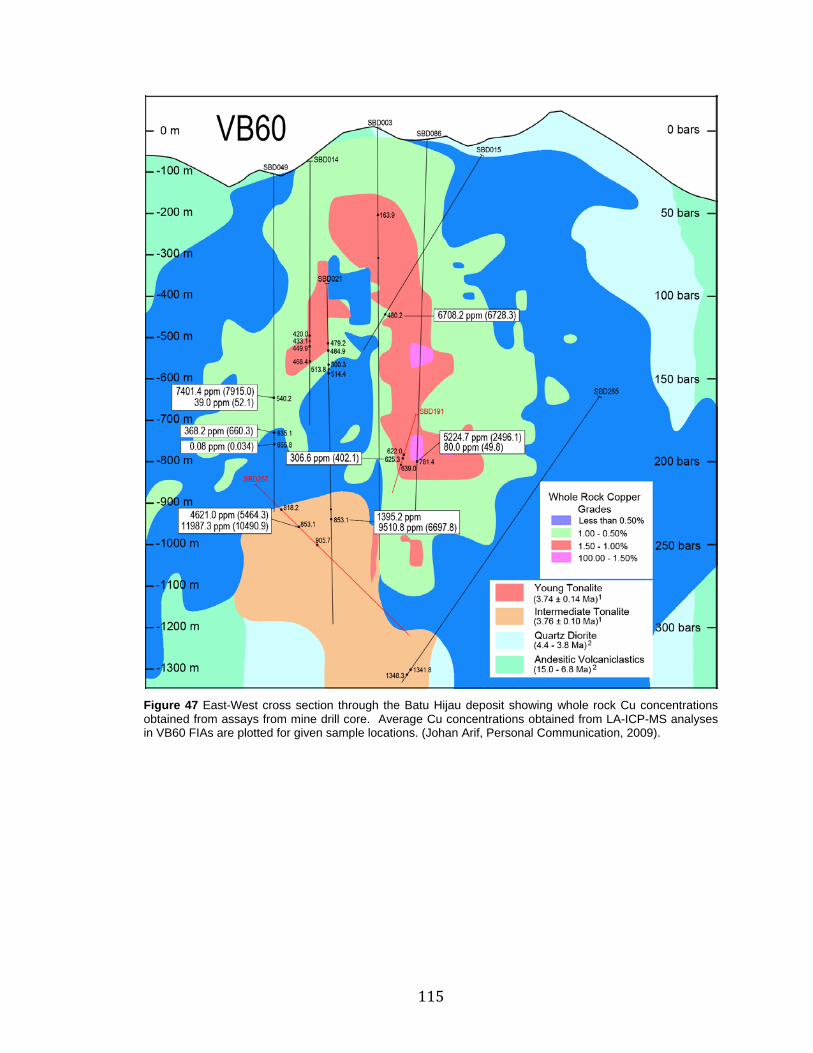
115
Figure 47 East-West cross section through the Batu Hijau deposit showing whole rock Cu concentrations obtained from assays from mine drill core. Average Cu concentrations obtained from LA-ICP-MS analyses in VB60 FIAs are plotted for given sample locations. (Johan Arif, Personal Communication, 2009).

116
Figure 48 East-West cross section through the Batu Hijau deposit showing whole rock Cu concentrations obtained from assays from mine drill core. Average Cu concentrations obtained from LA-ICP-MS analyses in VB85 FIAs are plotted for given sample locations. (Johan Arif, Personal Communication, 2009).

117
Figure 49 Phase diagram for H2O-NaCl (Sourirajan and Kennedy, 1962; Urusova, 1975; Bodnar et al., 1985; modified from Ulrich et al., 2001), displaying the approximate P-T-Salinity conditions for various fluid inclusion types with color-coded error bars displaying the variability of salinities; VB60 inclusion shown in orange, VB35 inclusions shown in red, and VB20H inclusions shown in green. The green dashed line represents conditions of un-mixing of VB35 fluids to form VB20H and VB85 fluids. VB85 inclusions plot at salinities outside of currently available experimental data and are not shown on this figure.
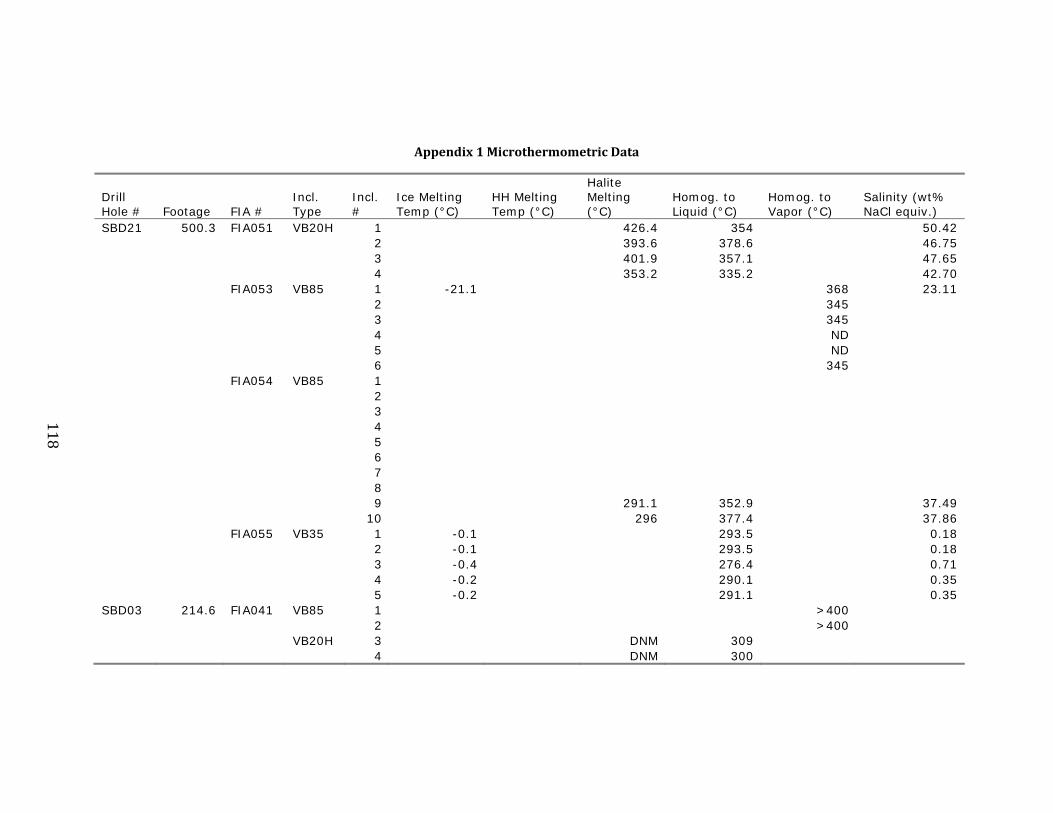
118
Appendix1MicrothermometricData
Drill Hole # Footage FIA #
Incl. Type
Incl. #
Ice Melting Temp (°C)
HH Melting Temp (°C)
Halite Melting (°C)
Homog. to Liquid (°C)
Homog. to Vapor (°C)
Salinity (wt% NaCl equiv.)
SBD21 500.3 FIA051 VB20H 1 426.4 354 50.42 2 393.6 378.6 46.75 3 401.9 357.1 47.65 4 353.2 335.2 42.70 FIA053 VB85 1 -21.1 368 23.11 2 345 3 345 4 ND 5 ND 6 345 FIA054 VB85 1 2 3 4 5 6 7 8 9 291.1 352.9 37.49 10 296 377.4 37.86 FIA055 VB35 1 -0.1 293.5 0.18 2 -0.1 293.5 0.18 3 -0.4 276.4 0.71 4 -0.2 290.1 0.35 5 -0.2 291.1 0.35 SBD03 214.6 FIA041 VB85 1 >400 2 >400 VB20H 3 DNM 309 4 DNM 300
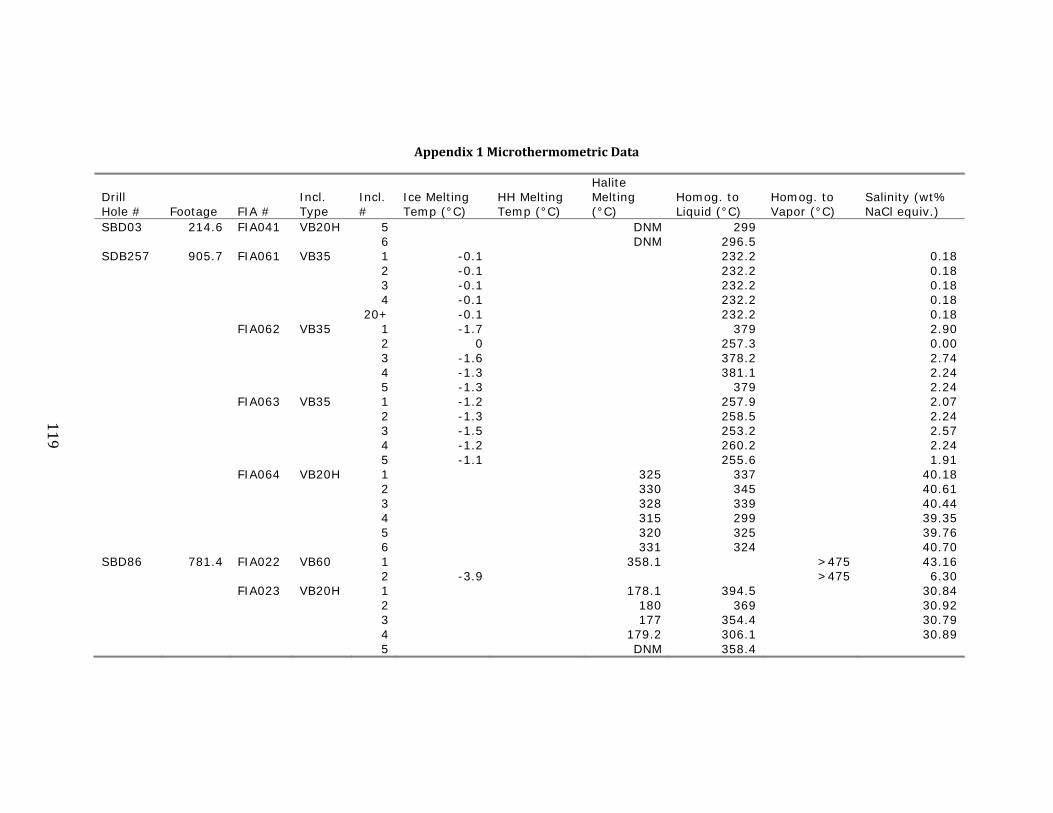
119
Appendix1MicrothermometricData
Drill Hole # Footage FIA #
Incl. Type
Incl. #
Ice Melting Temp (°C)
HH Melting Temp (°C)
Halite Melting (°C)
Homog. to Liquid (°C)
Homog. to Vapor (°C)
Salinity (wt% NaCl equiv.)
SBD03 214.6 FIA041 VB20H 5 DNM 299 6 DNM 296.5 SDB257 905.7 FIA061 VB35 1 -0.1 232.2 0.18 2 -0.1 232.2 0.18 3 -0.1 232.2 0.18 4 -0.1 232.2 0.18 20+ -0.1 232.2 0.18 FIA062 VB35 1 -1.7 379 2.90 2 0 257.3 0.00 3 -1.6 378.2 2.74 4 -1.3 381.1 2.24 5 -1.3 379 2.24 FIA063 VB35 1 -1.2 257.9 2.07 2 -1.3 258.5 2.24 3 -1.5 253.2 2.57 4 -1.2 260.2 2.24 5 -1.1 255.6 1.91 FIA064 VB20H 1 325 337 40.18 2 330 345 40.61 3 328 339 40.44 4 315 299 39.35 5 320 325 39.76 6 331 324 40.70 SBD86 781.4 FIA022 VB60 1 358.1 >475 43.16 2 -3.9 >475 6.30 FIA023 VB20H 1 178.1 394.5 30.84 2 180 369 30.92 3 177 354.4 30.79 4 179.2 306.1 30.89 5 DNM 358.4

120
Appendix1MicrothermometricData
Drill Hole # Footage FIA #
Incl. Type
Incl. #
Ice Melting Temp (°C)
HH Melting Temp (°C)
Halite Melting (°C)
Homog. to Liquid (°C)
Homog. to Vapor (°C)
Salinity (wt% NaCl equiv.)
SBD86 781.4 FIA024 VB60 1 -4.1 432.9 6.59 2 -3.3 408 5.41 3 -3.8 428.1 6.16 4 -2.8 386 4.65 5 -2.9 388 4.80 6 -4.5 441.5 7.17 FIA025 VB20H 1 315 317 39.35 2 314 317 39.27 3 320 327.4 39.76 4 322 327.4 39.93 5 320 322 39.76 6 310 307 38.95 7 315.5 316.5 39.39 SBD15 480.2 FIA056 VB35 1 -2.8 -18 324 4.65 1 -0.3 283 0.53 FIA057 VB35 2 -0.3 287 0.53 3 -0.2 289 0.35 4 -0.1 280 0.18 5 -0.3 281.2 0.53 6 -0.6 290.1 1.05 FIA058 VB35 1 -2.2 300 3.71 2 -1.1 295.8 1.91 3 -1.1 297.1 1.91 4 -1.2 311.8 2.07 FIA059 VB60 1 -2.2 400-410 3.71 2 -1.9 395 3.23 3 -1.1 405-410 1.91 4 -2 400 3.39 5 -2.3 388 3.87

121
Appendix1MicrothermometricData
Drill Hole # Footage FIA #
Incl. Type
Incl. #
Ice Melting Temp (°C)
HH Melting Temp (°C)
Halite Melting (°C)
Homog. to Liquid (°C)
Homog. to Vapor (°C)
Salinity (wt% NaCl equiv.)
SBD15 480.2 FIA059 VB60 6 -1 399 1.74 FIA060 VB20H 1 357.4 381 43.10 2 358 384 43.15 3 355 365 42.87 4 354 368 42.78 5 355 369 42.87 6 355 362.1 42.87 7 359 389 43.25 8 362 402.2 43.54 SBD265 1348.3a FIA020 VB35 1 0 266.4 0.00 2 -0.1 268.8 0.18 3 0 270 0.00 4 -0.1 267.2 0.18 FIA021 VB35 1 -0.1 341.9 0.18 2 -0.2 327 0.35 3 -0.4 336.4 0.71 4 0 333.3 0.00 5 -0.1 311.1 0.18 6 0.1 322.3 0.18 7 -0.2 329 0.35 SBD49 655.8a FIA026 VB60 1 DNM 374.2 2 DNM 364 3 338.1 420-430 4 DNM 410-420 FIA027 VB35 1 -0.4 276.9 0.71 2 -0.3 284.1 0.53 3 -0.2 288.9 0.35 4 -0.2 285 0.35 5 -0.3 287.5 0.53 6 -0.1 287.3 0.18

122
Appendix1MicrothermometricData
Drill Hole # Footage FIA #
Incl. Type
Incl. #
Ice Melting Temp (°C)
HH Melting Temp (°C)
Halite Melting (°C)
Homog. to Liquid (°C)
Homog. to Vapor (°C)
Salinity (wt% NaCl equiv.)
SBD49 635.1 FIA037 VB20H 1 376.2 328.1 44.94 2 386.7 336.7 46.02 3 390.1 339 46.38 4 379.1 313.9 45.24 5 362 308.5 43.54 6 387.5 319.1 46.11 FIA038 VB60 1 -0.5 409.3 0.88 2 -0.3 360.1 0.53 3 -0.5 372.2 0.88 4 -0.6 322.2 1.05 5 -0.2 351 0.35 VB20H 6 255.4 310.2 35.02 SBD257 853.1 FIA042 VB35 1 -5 -7.5 415.6 7.86 2 -5.3 -13.7 >470 8.28 3 -4.9 -15.8 363.8 7.73 4 -5.5 -17.6 398.7 8.55 5 -6.2 -15.5 >470 9.47 6 -6 -18.9 393 9.21 FIA043 VB35 1 -2.4 -5.5 309.3 4.03 FIA050 VB35 1 -1.8 378.9 3.06 2 -1.7 375.4 2.90 3 -1.9 379 3.23 4 -2 377.8 3.39 5 -1.8 376.4 3.06 6 -1.9 378.5 3.23 7 -1.5 378.6 2.57 8 -1.3 312.8 2.24 FIA044 VB35 1 -3.4 -20.2 400 5.56 2 -1.3 -20 376.6 2.24

123
Appendix1MicrothermometricData
Drill Hole # Footage FIA #
Incl. Type
Incl. #
Ice Melting Temp (°C)
HH Melting Temp (°C)
Halite Melting (°C)
Homog. to Liquid (°C)
Homog. to Vapor (°C)
Salinity (wt% NaCl equiv.)
SBD257 853.1 FIA044 VB35 3 -3 -20.4 396.6 4.96 4 -2.8 419.2 4.65 5 -1.9 401.1 3.23 FIA045 VB60 1 -5.6 -10 466.5 8.86 2 -5.5 -10 424 8.55 3 -4.4 388 7.02 4 -2.8 395 4.65 5 -4.8 -10 421 7.59 6 -2.4 -10 401.2 4.03 7 -2.9 394 4.80 FIA046 VB20H 1 341 325.3 41.58 2 341 319.1 41.58 3 318 290 39.60 4 342 327.2 41.67 5 329.2 308.2 40.54 FIA047 VB35 1 -1.4 -19.3 366.6 2.41 2 -1.1 -18.8 382 1.91 3 -1.9 380.1 3.23 4 -1.4 378.7 2.41 5 -1.6 379 2.74 6 -2 385.6 3.39 7 -0.9 379.2 1.57 FIA048 VB35 1 -4.8 -16 456.2 7.59 2 -5 -18.2 456.5 7.86 3 -2.5 -17.1 411.1 4.18 4 -4.1 422 6.59 FIA049 VB20H 1 340.1 345.4 41.50 2 309 330 38.87 3 335 341 41.05 4 339 328 41.40

124
Appendix1MicrothermometricData
Drill Hole # Footage FIA #
Incl. Type
Incl. #
Ice Melting Temp (°C)
HH Melting Temp (°C)
Halite Melting (°C)
Homog. to Liquid (°C)
Homog. to Vapor (°C)
Salinity (wt% NaCl equiv.)
SBD03 163.9 FIA039 VB85 1 353.5 2 376.7 3 >350 4 >360 SBD49 540.2 FIA028 VB85 1 -1.4 376 2.41 2 -1.3 >370 2.24 3 -1.1 385 1.91 4 -1.1 >360 1.91 FIA029 VB20H 1 300 483.4 38.16 2 304.1 479.5 38.48 3 295.3 360.9 37.80 FIA030 VB60 1 -6.9 >415 10.36 2 >390 3 365 >405 43.83 4 >425 5 -6.1 >440 9.34 FIA031 VB60 1 NOI >410 2 NOI 372 3 NOI 376 4 NOI 387 FIA032 VB85 1 319.8 2 322 3 324.6 4 FIA033 VB35 1 -9 -23.3 344.4 12.85 2 -8.6 355.4 12.39 VB85 3 360 4 336.8 5 359.8 FIA034 VB20H 1 436.7 385.5 51.64
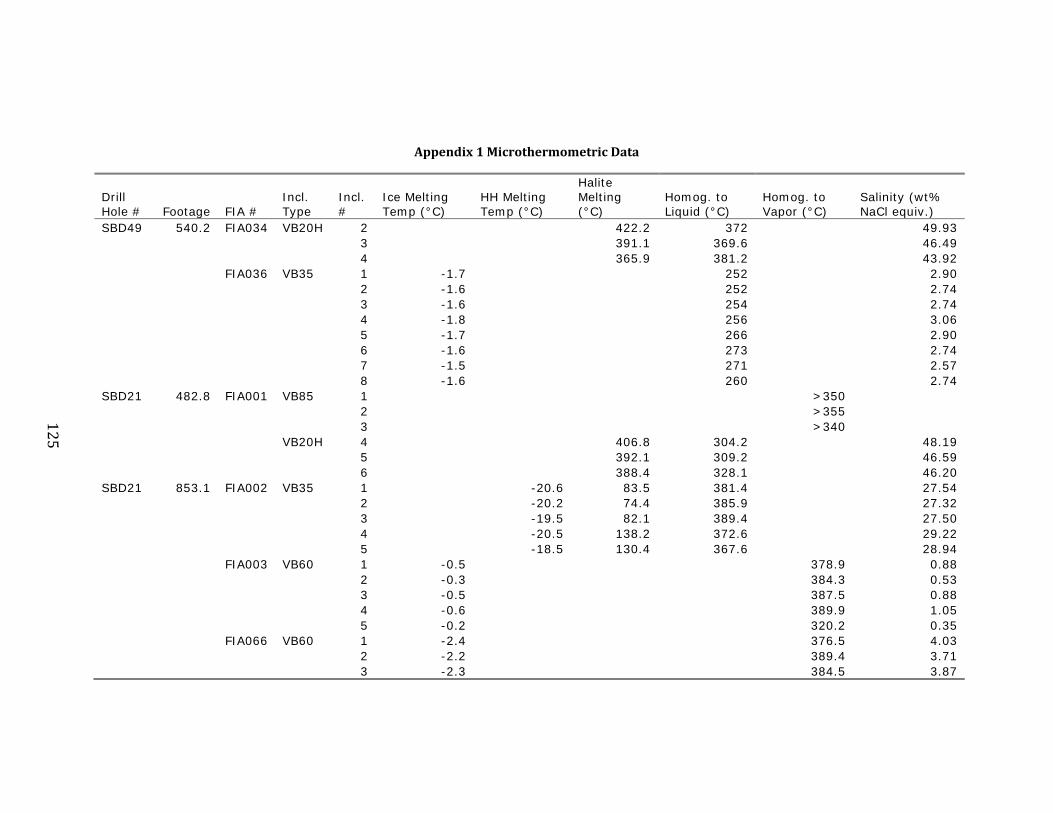
125
Appendix1MicrothermometricData
Drill Hole # Footage FIA #
Incl. Type
Incl. #
Ice Melting Temp (°C)
HH Melting Temp (°C)
Halite Melting (°C)
Homog. to Liquid (°C)
Homog. to Vapor (°C)
Salinity (wt% NaCl equiv.)
SBD49 540.2 FIA034 VB20H 2 422.2 372 49.93 3 391.1 369.6 46.49 4 365.9 381.2 43.92 FIA036 VB35 1 -1.7 252 2.90 2 -1.6 252 2.74 3 -1.6 254 2.74 4 -1.8 256 3.06 5 -1.7 266 2.90 6 -1.6 273 2.74 7 -1.5 271 2.57 8 -1.6 260 2.74 SBD21 482.8 FIA001 VB85 1 >350 2 >355 3 >340 VB20H 4 406.8 304.2 48.19 5 392.1 309.2 46.59 6 388.4 328.1 46.20 SBD21 853.1 FIA002 VB35 1 -20.6 83.5 381.4 27.54 2 -20.2 74.4 385.9 27.32 3 -19.5 82.1 389.4 27.50 4 -20.5 138.2 372.6 29.22 5 -18.5 130.4 367.6 28.94 FIA003 VB60 1 -0.5 378.9 0.88 2 -0.3 384.3 0.53 3 -0.5 387.5 0.88 4 -0.6 389.9 1.05 5 -0.2 320.2 0.35 FIA066 VB60 1 -2.4 376.5 4.03 2 -2.2 389.4 3.71 3 -2.3 384.5 3.87

126
Appendix1MicrothermometricData
Drill Hole # Footage FIA # Incl. Type
Incl. #
Ice Melting Temp (°C)
HH Melting Temp (°C)
Halite Melting (°C)
Homog. to Liquid (°C)
Homog. to Vapor (°C)
Salinity (wt% NaCl equiv.)
SBD21 853.1 FIA066 VB60 4 -2 383.9 3.39 FIA067 VB35 1 -2.3 376.4 3.87 2 -2.1 380.9 3.55 3 -2 374 3.39 4 -1.1 375.5 1.91 5 -0.9 374.5 1.57 6 -1.3 378.1 2.24 7 -1.4 371.1 2.41 8 -1.6 382.3 2.74 9 -2.2 389.4 3.71 10 -2.6 378.9 4.34 11 -1.8 372.2 3.06 SBD14 449.9 FIA004 VB20H 1 429.5 356.6 50.78 2 434.5 366 51.38 3 432.2 369.1 51.10 4 448.1 372.1 53.03 5 437.9 376.6 51.78 6 456.6 370.3 54.08 7 442.2 359.1 52.30 FIA005 VB60/VB85 1 >420 2 >440 3 >450 4 >450 5 >430 VB20H 6 444.3 399.9 52.56 7 410 334.9 48.54 8 418.2 294.4 49.47 9 438.2 392 51.82 10 448.9 345.5 53.12
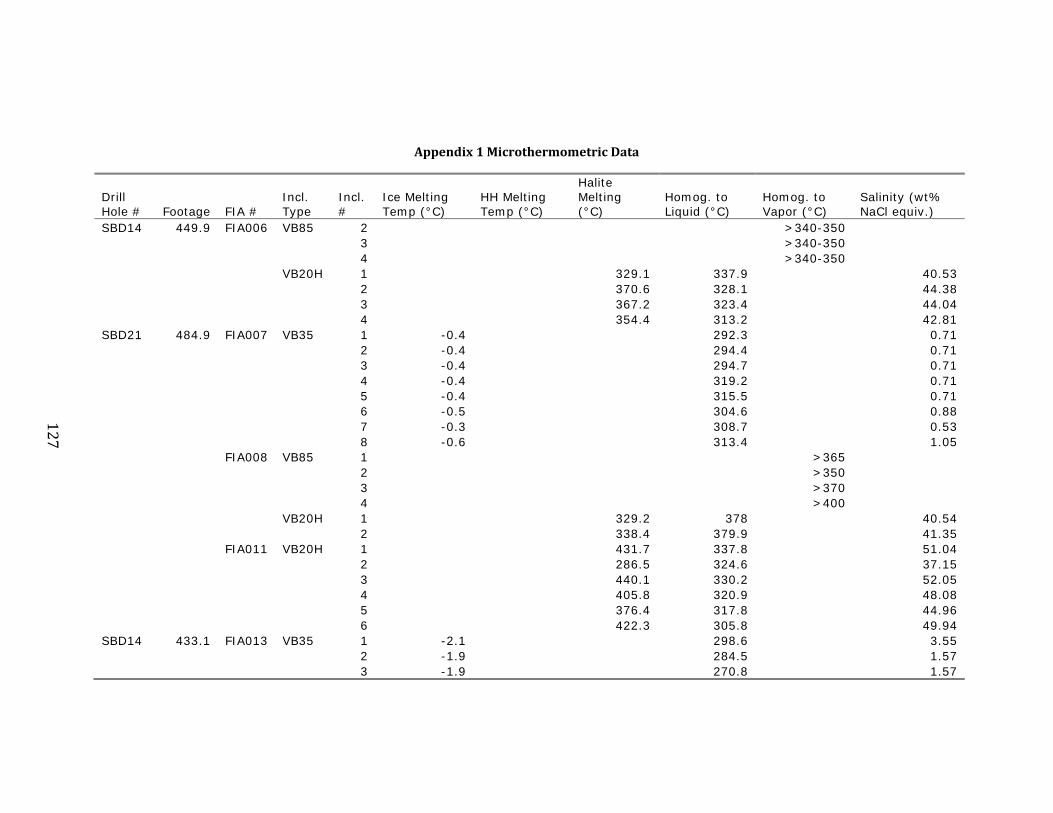
127
Appendix1MicrothermometricData
Drill Hole # Footage FIA #
Incl. Type
Incl. #
Ice Melting Temp (°C)
HH Melting Temp (°C)
Halite Melting (°C)
Homog. to Liquid (°C)
Homog. to Vapor (°C)
Salinity (wt% NaCl equiv.)
SBD14 449.9 FIA006 VB85 2 >340-350 3 >340-350 4 >340-350 VB20H 1 329.1 337.9 40.53 2 370.6 328.1 44.38 3 367.2 323.4 44.04 4 354.4 313.2 42.81 SBD21 484.9 FIA007 VB35 1 -0.4 292.3 0.71 2 -0.4 294.4 0.71 3 -0.4 294.7 0.71 4 -0.4 319.2 0.71 5 -0.4 315.5 0.71 6 -0.5 304.6 0.88 7 -0.3 308.7 0.53 8 -0.6 313.4 1.05 FIA008 VB85 1 >365 2 >350 3 >370 4 >400 VB20H 1 329.2 378 40.54 2 338.4 379.9 41.35 FIA011 VB20H 1 431.7 337.8 51.04 2 286.5 324.6 37.15 3 440.1 330.2 52.05 4 405.8 320.9 48.08 5 376.4 317.8 44.96 6 422.3 305.8 49.94 SBD14 433.1 FIA013 VB35 1 -2.1 298.6 3.55 2 -1.9 284.5 1.57 3 -1.9 270.8 1.57

128
Appendix1MicrothermometricData
ND = Not determined HH = Hydro halite DNM = Did not measure NOI = No observable ice
Drill Hole # Footage FIA #
Incl. Type
Incl. #
Ice Melting Temp (°C)
HH Melting Temp (°C)
Halite Melting (°C)
Homog. to Liquid (°C)
Homog. to Vapor (°C)
Salinity (wt% NaCl equiv.)
SBD14 433.1 FIA013 VB35 4 -2 296.5 3.39 5 -2 281.4 3.39 SBD21 479.2 FIA016 VB20H 1 445 362.2 52.65 2 444.3 353.3 52.56 3 441.1 386.7 52.17 4 443.5 375 52.46 5 360.8 6 442.9 375.9 52.39 FIA017 VB20H 1 380.3 367.6 45.36 2 381.2 390 45.45 3 384.4 389.6 45.78 4 381.1 385.8 45.44 5 380.9 386.7 45.42 6 382 379.4 45.53 SBD21 514.4 BH061 VB20H 301.1 429.4 38.25 BH062 VB20H 298.8 441 38.07 BH063 VB20H 303.1 442.7 38.40 BH064 VB20H 370.3 410.5 44.35 SBD265 1341.8 BH001 VB35 -2.7 370 4.49 BH002 VB35 -3.2 -22 383 5.26 BH003 VB35 -5.4 -22 383.6 8.41
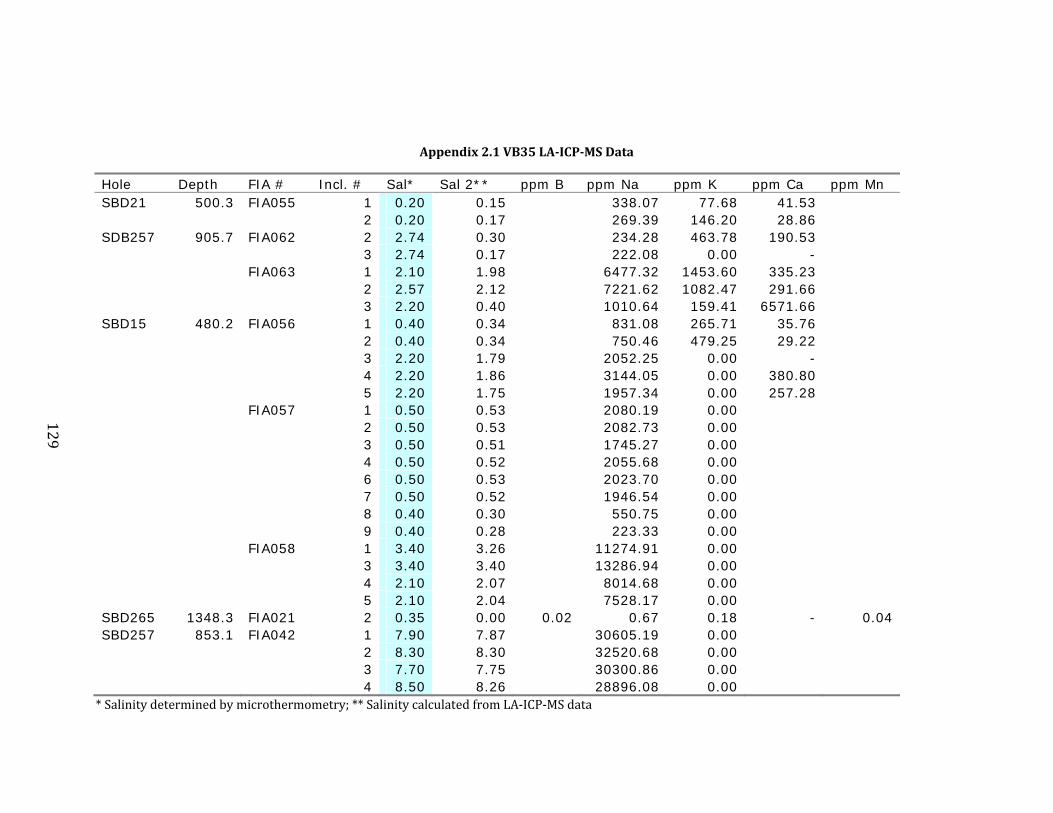
129
Appendix2.1VB35LA‐ICP‐MSData
Hole Depth FIA # Incl. # Sal* Sal 2** ppm B ppm Na ppm K ppm Ca ppm Mn SBD21 500.3 FIA055 1 0.20 0.15 338.07 77.68 41.53 2 0.20 0.17 269.39 146.20 28.86 SDB257 905.7 FIA062 2 2.74 0.30 234.28 463.78 190.53 3 2.74 0.17 222.08 0.00 - FIA063 1 2.10 1.98 6477.32 1453.60 335.23 2 2.57 2.12 7221.62 1082.47 291.66 3 2.20 0.40 1010.64 159.41 6571.66 SBD15 480.2 FIA056 1 0.40 0.34 831.08 265.71 35.76 2 0.40 0.34 750.46 479.25 29.22 3 2.20 1.79 2052.25 0.00 - 4 2.20 1.86 3144.05 0.00 380.80 5 2.20 1.75 1957.34 0.00 257.28 FIA057 1 0.50 0.53 2080.19 0.00 2 0.50 0.53 2082.73 0.00 3 0.50 0.51 1745.27 0.00 4 0.50 0.52 2055.68 0.00 6 0.50 0.53 2023.70 0.00 7 0.50 0.52 1946.54 0.00 8 0.40 0.30 550.75 0.00 9 0.40 0.28 223.33 0.00 FIA058 1 3.40 3.26 11274.91 0.00 3 3.40 3.40 13286.94 0.00 4 2.10 2.07 8014.68 0.00 5 2.10 2.04 7528.17 0.00 SBD265 1348.3 FIA021 2 0.35 0.00 0.02 0.67 0.18 - 0.04 SBD257 853.1 FIA042 1 7.90 7.87 30605.19 0.00 2 8.30 8.30 32520.68 0.00 3 7.70 7.75 30300.86 0.00 4 8.50 8.26 28896.08 0.00 *Salinitydeterminedbymicrothermometry;**SalinitycalculatedfromLA‐ICP‐MSdata

130
Appendix2.1VB35LA‐ICP‐MSData
Hole Depth FIA # Incl. # Sal* Sal 2** ppm B ppm Na ppm K ppm Ca ppm Mn SBD257 853.1 FIA042 5 9.50 9.50 37178.06 0.00 6 9.20 9.24 36153.83 0.00 7 9.20 7.63 27028.71 0.00 8 9.20 7.88 30678.02 0.00 9 9.20 7.89 30935.29 0.00 10 9.20 7.65 27302.74 0.00 FIA043 1 4.00 4.03 15808.12 0.00 2 4.00 3.10 1847.85 0.00 3 4.00 4.03 15639.76 0.00 4 4.00 3.89 13674.31 0.00 5 4.00 4.04 15793.52 0.00 6 4.00 4.00 14920.27 0.00 FIA044 1 5.56 4.73 15921.74 0.00 2 2.24 4.95 19066.72 0.00 3 4.96 4.54 13098.81 0.00 4 4.45 0.50 1946.08 0.00 5 3.32 3.87 3248.11 0.00 6 3.09 4.95 19049.49 0.00 7 2.24 4.91 18585.16 0.00 8 5.56 4.97 19409.06 0.00 FIA047 1 2.41 2.04 4347.33 1136.54 977.83 909.48 2 1.91 2.30 5513.50 723.21 - 855.48 4 2.41 1.99 4341.00 1302.97 1229.45 793.90 5 2.74 2.29 5466.61 1058.98 240.62 144.56 FIA048 1 7.20 5.15 10889.47 4005.87 1964.56 4856.14 2 7.20 6.31 15211.17 2480.19 - 1469.19 3 7.20 5.25 1277.03 6016.38 538.54 5439.34 4 6.60 5.77 17123.79 2719.05 344.13 2096.37 FIA049 1 0.40 0.31 670.08 0.00 3 0.40 0.35 1349.20 0.00
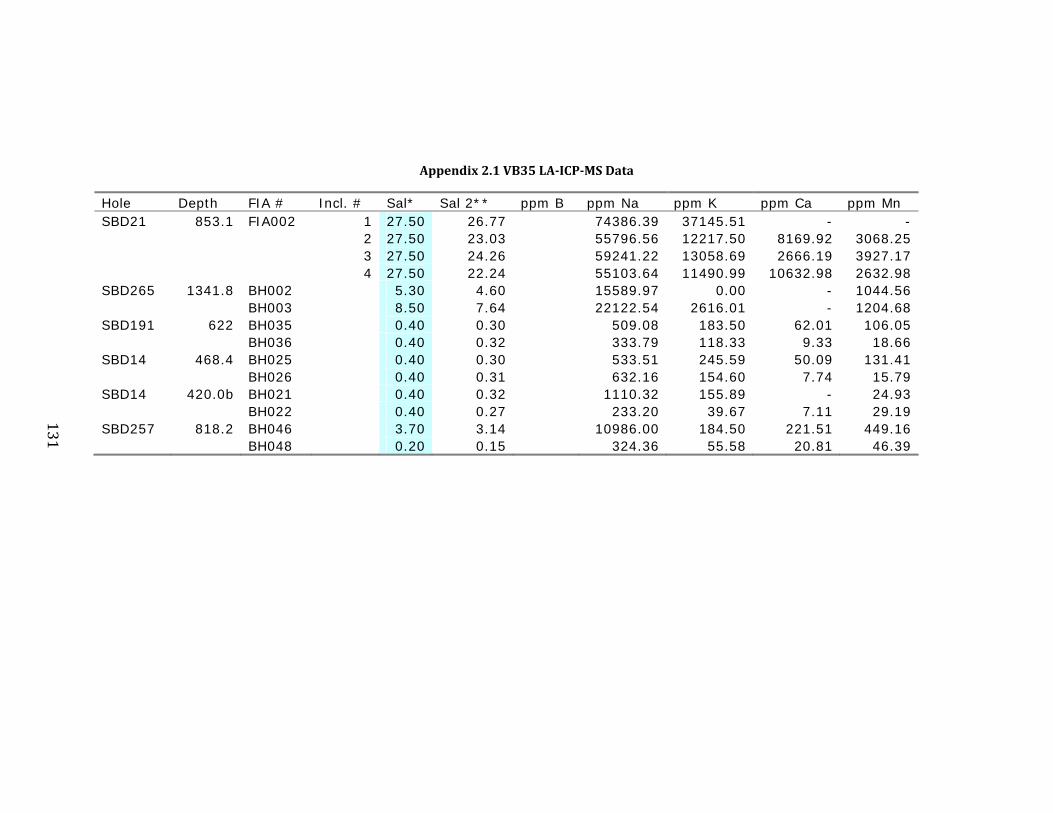
131
Appendix2.1VB35LA‐ICP‐MSData
Hole Depth FIA # Incl. # Sal* Sal 2** ppm B ppm Na ppm K ppm Ca ppm Mn SBD21 853.1 FIA002 1 27.50 26.77 74386.39 37145.51 - - 2 27.50 23.03 55796.56 12217.50 8169.92 3068.25 3 27.50 24.26 59241.22 13058.69 2666.19 3927.17 4 27.50 22.24 55103.64 11490.99 10632.98 2632.98 SBD265 1341.8 BH002 5.30 4.60 15589.97 0.00 - 1044.56 BH003 8.50 7.64 22122.54 2616.01 - 1204.68 SBD191 622 BH035 0.40 0.30 509.08 183.50 62.01 106.05 BH036 0.40 0.32 333.79 118.33 9.33 18.66 SBD14 468.4 BH025 0.40 0.30 533.51 245.59 50.09 131.41 BH026 0.40 0.31 632.16 154.60 7.74 15.79 SBD14 420.0b BH021 0.40 0.32 1110.32 155.89 - 24.93 BH022 0.40 0.27 233.20 39.67 7.11 29.19 SBD257 818.2 BH046 3.70 3.14 10986.00 184.50 221.51 449.16 BH048 0.20 0.15 324.36 55.58 20.81 46.39

132
Appendix2.1VB35LA‐ICP‐MSData
Hole Depth FIA # Incl. # Sal* Sal 2** ppm Fe ppm Cu ppm Zn ppm As ppm Rb SBD21 500.3 FIA055 1 0.2 0.15 74.86 228.35 2 0.2 0.17 301.02 21.11 SDB257 905.7 FIA062 2 2.74 0.30 673.46 2.98 3 2.74 0.17 486.66 22.04 FIA063 1 2.1 1.98 211.53 40.93 2 2.57 2.12 329.65 201.03 3 2.2 0.40 290.24 318.94 SBD15 480.2 FIA056 1 0.4 0.34 226.49 146.48 2 0.4 0.34 248.24 36.13 3 2.2 1.79 2213.00 4892.93 4 2.2 1.86 3100.50 2245.10 5 2.2 1.75 1498.78 5855.36 FIA057 1 0.53 0.53 0.00 0.00 2 0.53 0.53 0.00 0.00 3 0.35 0.51 0.00 407.24 4 0.18 0.52 0.00 0.00 6 1.05 0.53 0.00 73.62 7 0.53 0.52 0.00 166.35 8 0.4 0.30 0.00 1012.49 9 0.4 0.28 0.00 1405.83 FIA058 1 3.4 3.26 0.00 2463.17 3 1.91 3.40 0.00 0.00 4 2.1 2.07 0.00 169.47 5 2.1 2.04 0.00 753.76 SBD265 1348.3 FIA021 2 0.35 0.00 0.41 0.60 0.02 - - SBD257 853.1 FIA042 1 7.9 7.87 0.00 396.36 2 8.3 8.30 0.00 36.09 3 7.7 7.75 0.00 108.54 4 8.5 8.26 0.00 5667.33
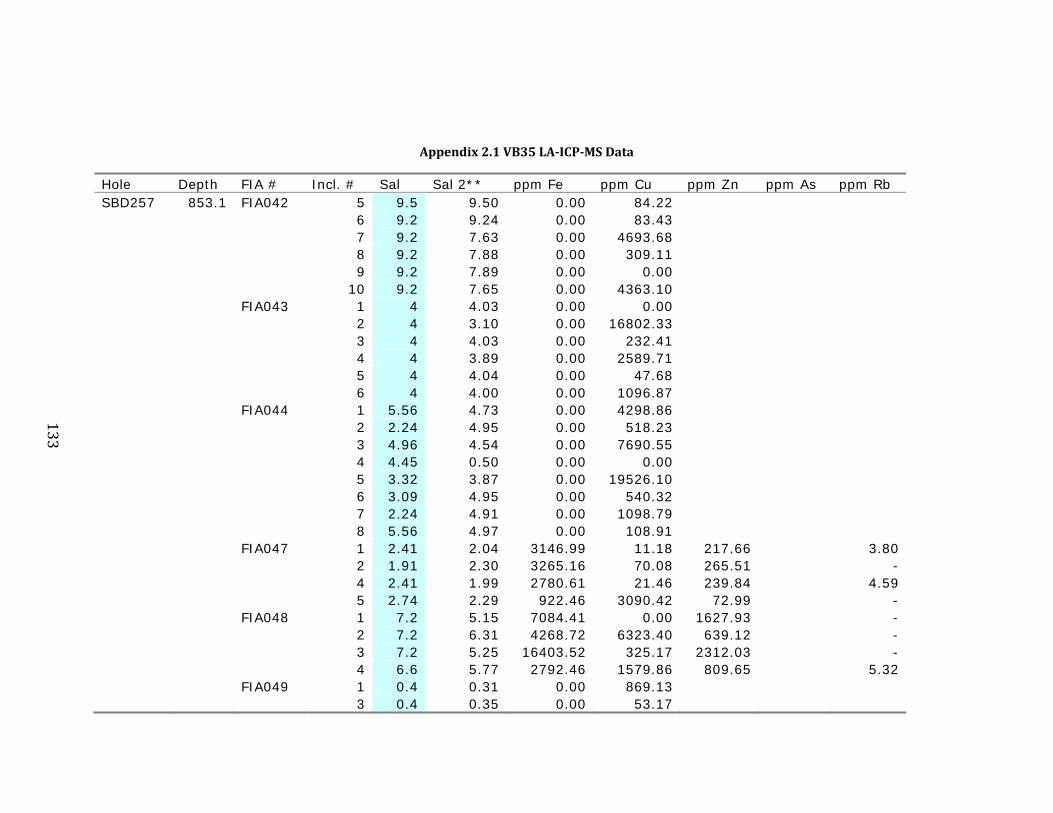
133
Appendix2.1VB35LA‐ICP‐MSData
Hole Depth FIA # Incl. # Sal Sal 2** ppm Fe ppm Cu ppm Zn ppm As ppm Rb SBD257 853.1 FIA042 5 9.5 9.50 0.00 84.22 6 9.2 9.24 0.00 83.43 7 9.2 7.63 0.00 4693.68 8 9.2 7.88 0.00 309.11 9 9.2 7.89 0.00 0.00 10 9.2 7.65 0.00 4363.10 FIA043 1 4 4.03 0.00 0.00 2 4 3.10 0.00 16802.33 3 4 4.03 0.00 232.41 4 4 3.89 0.00 2589.71 5 4 4.04 0.00 47.68 6 4 4.00 0.00 1096.87 FIA044 1 5.56 4.73 0.00 4298.86 2 2.24 4.95 0.00 518.23 3 4.96 4.54 0.00 7690.55 4 4.45 0.50 0.00 0.00 5 3.32 3.87 0.00 19526.10 6 3.09 4.95 0.00 540.32 7 2.24 4.91 0.00 1098.79 8 5.56 4.97 0.00 108.91 FIA047 1 2.41 2.04 3146.99 11.18 217.66 3.80 2 1.91 2.30 3265.16 70.08 265.51 - 4 2.41 1.99 2780.61 21.46 239.84 4.59 5 2.74 2.29 922.46 3090.42 72.99 - FIA048 1 7.2 5.15 7084.41 0.00 1627.93 - 2 7.2 6.31 4268.72 6323.40 639.12 - 3 7.2 5.25 16403.52 325.17 2312.03 - 4 6.6 5.77 2792.46 1579.86 809.65 5.32 FIA049 1 0.4 0.31 0.00 869.13 3 0.4 0.35 0.00 53.17
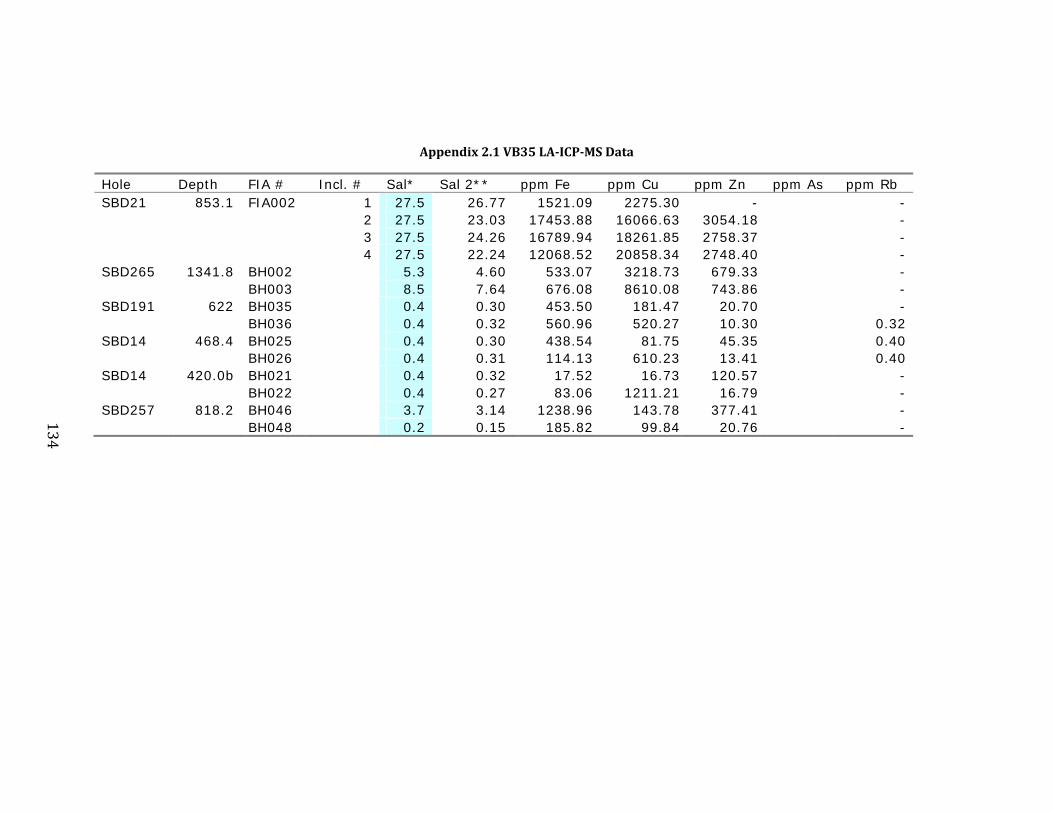
134
Appendix2.1VB35LA‐ICP‐MSData
Hole Depth FIA # Incl. # Sal* Sal 2** ppm Fe ppm Cu ppm Zn ppm As ppm Rb SBD21 853.1 FIA002 1 27.5 26.77 1521.09 2275.30 - - 2 27.5 23.03 17453.88 16066.63 3054.18 - 3 27.5 24.26 16789.94 18261.85 2758.37 - 4 27.5 22.24 12068.52 20858.34 2748.40 - SBD265 1341.8 BH002 5.3 4.60 533.07 3218.73 679.33 - BH003 8.5 7.64 676.08 8610.08 743.86 - SBD191 622 BH035 0.4 0.30 453.50 181.47 20.70 - BH036 0.4 0.32 560.96 520.27 10.30 0.32 SBD14 468.4 BH025 0.4 0.30 438.54 81.75 45.35 0.40 BH026 0.4 0.31 114.13 610.23 13.41 0.40 SBD14 420.0b BH021 0.4 0.32 17.52 16.73 120.57 - BH022 0.4 0.27 83.06 1211.21 16.79 - SBD257 818.2 BH046 3.7 3.14 1238.96 143.78 377.41 - BH048 0.2 0.15 185.82 99.84 20.76 -
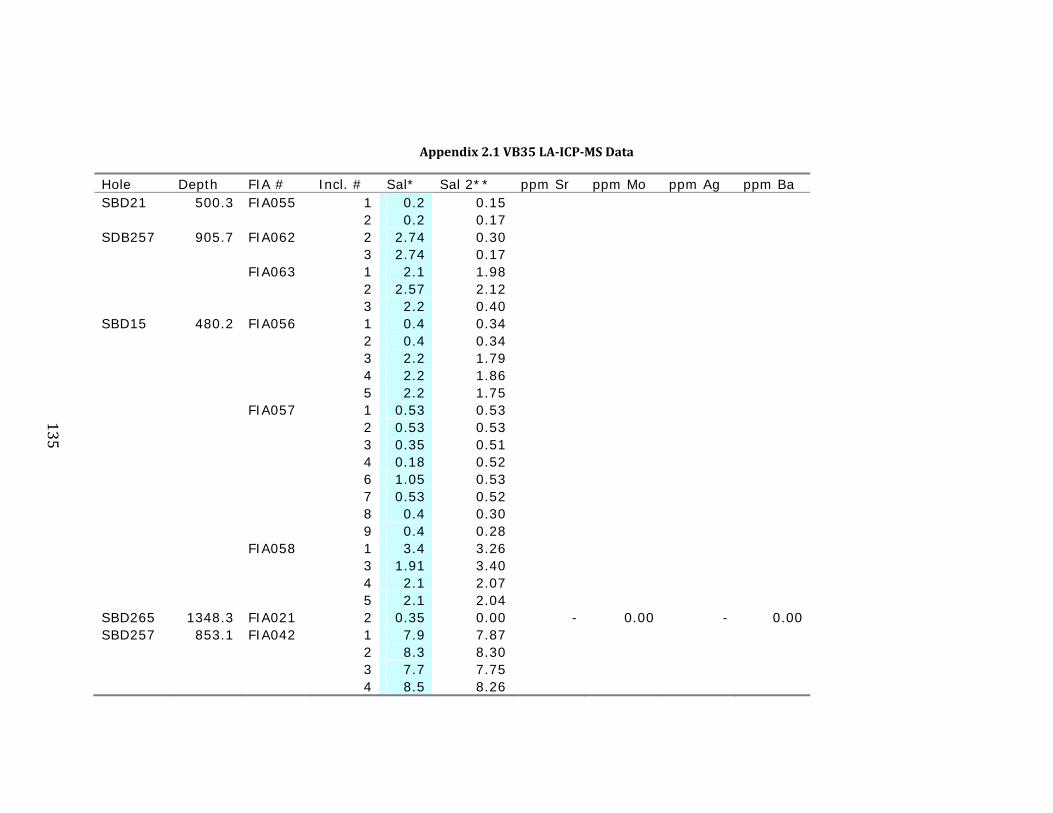
135
Appendix2.1VB35LA‐ICP‐MSData
Hole Depth FIA # Incl. # Sal* Sal 2** ppm Sr ppm Mo ppm Ag ppm Ba SBD21 500.3 FIA055 1 0.2 0.15 2 0.2 0.17 SDB257 905.7 FIA062 2 2.74 0.30 3 2.74 0.17 FIA063 1 2.1 1.98 2 2.57 2.12 3 2.2 0.40 SBD15 480.2 FIA056 1 0.4 0.34 2 0.4 0.34 3 2.2 1.79 4 2.2 1.86 5 2.2 1.75 FIA057 1 0.53 0.53 2 0.53 0.53 3 0.35 0.51 4 0.18 0.52 6 1.05 0.53 7 0.53 0.52 8 0.4 0.30 9 0.4 0.28 FIA058 1 3.4 3.26 3 1.91 3.40 4 2.1 2.07 5 2.1 2.04 SBD265 1348.3 FIA021 2 0.35 0.00 - 0.00 - 0.00 SBD257 853.1 FIA042 1 7.9 7.87 2 8.3 8.30 3 7.7 7.75 4 8.5 8.26
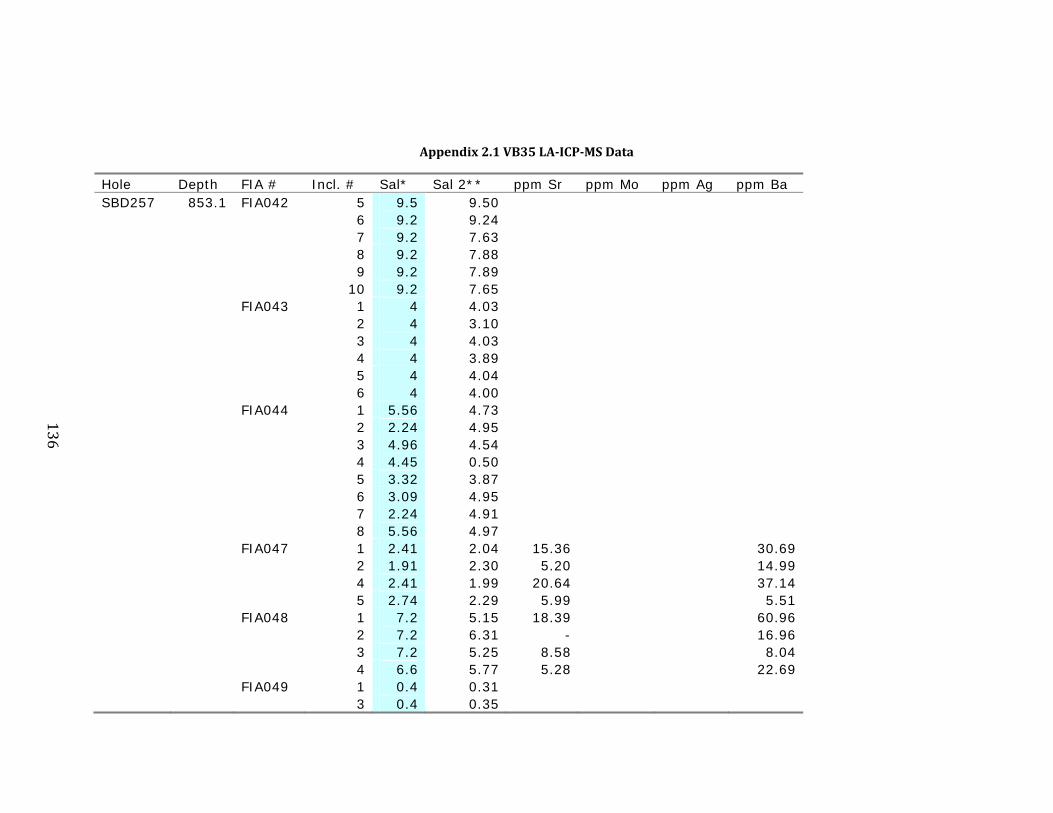
136
Appendix2.1VB35LA‐ICP‐MSData
Hole Depth FIA # Incl. # Sal* Sal 2** ppm Sr ppm Mo ppm Ag ppm Ba SBD257 853.1 FIA042 5 9.5 9.50 6 9.2 9.24 7 9.2 7.63 8 9.2 7.88 9 9.2 7.89 10 9.2 7.65 FIA043 1 4 4.03 2 4 3.10 3 4 4.03 4 4 3.89 5 4 4.04 6 4 4.00 FIA044 1 5.56 4.73 2 2.24 4.95 3 4.96 4.54 4 4.45 0.50 5 3.32 3.87 6 3.09 4.95 7 2.24 4.91 8 5.56 4.97 FIA047 1 2.41 2.04 15.36 30.69 2 1.91 2.30 5.20 14.99 4 2.41 1.99 20.64 37.14 5 2.74 2.29 5.99 5.51 FIA048 1 7.2 5.15 18.39 60.96 2 7.2 6.31 - 16.96 3 7.2 5.25 8.58 8.04 4 6.6 5.77 5.28 22.69 FIA049 1 0.4 0.31 3 0.4 0.35

137
Appendix2.1VB35LA‐ICP‐MSData
Hole Depth FIA # Incl. # Sal* Sal 2** ppm Sr ppm Mo ppm Ag ppm Ba SBD21 853.1 FIA002 1 27.5 26.77 - - 2 27.5 23.03 114.52 114.47 3 27.5 24.26 36.13 116.31 4 27.5 22.24 142.50 112.48 SBD265 1341.8 BH002 5.3 4.60 - - BH003 8.5 7.64 - - SBD191 622 BH035 0.4 0.30 1.21 12.96 BH036 0.4 0.32 0.18 1.98 SBD14 468.4 BH025 0.4 0.30 0.98 6.29 BH026 0.4 0.31 0.16 1.28 SBD14 420.0b BH021 0.4 0.32 - - BH022 0.4 0.27 - 0.12 SBD257 818.2 BH046 3.7 3.14 3.37 25.38 BH048 0.2 0.15 0.31 1.97

138
Appendix2.1VB35LA‐ICP‐MSData
Hole Depth FIA # Incl. # Sal* Sal 2** ppm W ppm Au ppm Pb SBD21 500.3 FIA055 1 0.2 0.15 - 2 0.2 0.17 - SDB257 905.7 FIA062 2 2.74 0.30 - 3 2.74 0.17 - FIA063 1 2.1 1.98 - 2 2.57 2.12 - 3 2.2 0.40 - SBD15 480.2 FIA056 1 0.4 0.34 - 2 0.4 0.34 - 3 2.2 1.79 - 4 2.2 1.86 - 5 2.2 1.75 - FIA057 1 0.53 0.53 - 2 0.53 0.53 - 3 0.35 0.51 - 4 0.18 0.52 - 6 1.05 0.53 - 7 0.53 0.52 - 8 0.4 0.30 - 9 0.4 0.28 - FIA058 1 3.4 3.26 1.14 3 1.91 3.40 - 4 2.1 2.07 - 5 2.1 2.04 - SBD265 1348.3 FIA021 2 0.35 0.00 - 0.00 SBD257 853.1 FIA042 1 7.9 7.87 - 2 8.3 8.30 - 3 7.7 7.75 - 4 8.5 8.26 -
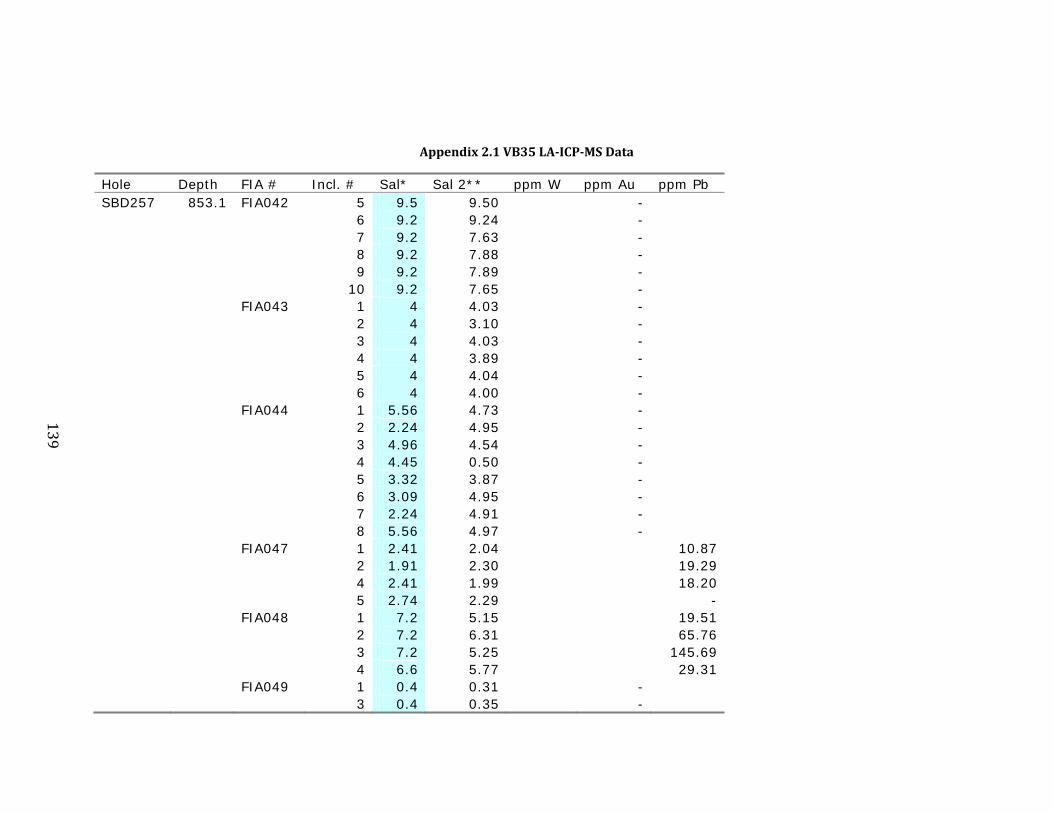
139
Appendix2.1VB35LA‐ICP‐MSData
Hole Depth FIA # Incl. # Sal* Sal 2** ppm W ppm Au ppm Pb SBD257 853.1 FIA042 5 9.5 9.50 - 6 9.2 9.24 - 7 9.2 7.63 - 8 9.2 7.88 - 9 9.2 7.89 - 10 9.2 7.65 - FIA043 1 4 4.03 - 2 4 3.10 - 3 4 4.03 - 4 4 3.89 - 5 4 4.04 - 6 4 4.00 - FIA044 1 5.56 4.73 - 2 2.24 4.95 - 3 4.96 4.54 - 4 4.45 0.50 - 5 3.32 3.87 - 6 3.09 4.95 - 7 2.24 4.91 - 8 5.56 4.97 - FIA047 1 2.41 2.04 10.87 2 1.91 2.30 19.29 4 2.41 1.99 18.20 5 2.74 2.29 - FIA048 1 7.2 5.15 19.51 2 7.2 6.31 65.76 3 7.2 5.25 145.69 4 6.6 5.77 29.31 FIA049 1 0.4 0.31 - 3 0.4 0.35 -

140
Appendix2.1VB35LA‐ICP‐MSData
Hole Depth FIA # Incl. # Sal* Sal 2** ppm W ppm Au ppm Pb SBD21 853.1 FIA002 1 27.5 26.77 - - 2 27.5 23.03 - 158.37 3 27.5 24.26 - 229.76 4 27.5 22.24 - 135.21 SBD265 1341.8 BH002 5.3 4.60 - 81.48 BH003 8.5 7.64 - 120.90 SBD191 622 BH035 0.4 0.30 3.19 BH036 0.4 0.32 0.26 SBD14 468.4 BH025 0.4 0.30 2.57 BH026 0.4 0.31 1.53 SBD14 420.0b BH021 0.4 0.32 1.83 BH022 0.4 0.27 0.70 SBD257 818.2 BH046 3.7 3.14 34.65 BH048 0.2 0.15 0.90

141
Appendix2.2VB20HLA‐ICP‐MSData
Hole Depth FIA # Incl. # Sal* Sal 2** ppm B ppm Na ppm K ppm Ca ppm Mn SBD21 500.3 FIA051 1 55.4 53.19 10347.86 88416.49 8802.59 2 54.6 55.28 144708.37 19258.07 1458.17 3 56.2 54.73 96485.03 47891.09 3390.12 4 55.6 53.02 76542.65 43839.01 2342.54 5 55.6 53.50 109673.89 29445.30 1973.30 SDB257 905.7 FIA064 1 40.4 35.02 76449.10 26993.60 18873.88 2 40.2 34.59 70890.08 25605.85 20335.17 3 40.2 33.22 7841.02 52568.70 25937.48 SBD86 781.4 FIA023 1 30.9 30.18 54588.90 18139.93 1926.60 2 30.8 30.22 56154.10 19334.75 2044.79 3 30.9 30.15 54322.15 21930.98 2035.01 FIA025 1 39.4 37.97 40794.62 40120.53 5029.09 2 39.4 38.55 98462.86 19374.03 3178.00 3 39.4 36.86 86694.20 20729.11 9130.45 4 39.4 37.81 7787.34 62734.34 4018.72 5 39.4 35.15 47063.12 37552.95 13676.44 SBD15 480.2 FIA060 1 43.1 40.24 75534.31 24131.80 4293.08 2 43.2 41.45 38427.65 67920.38 5169.56 3 42.9 39.59 69046.30 33571.72 7350.19 4 42.9 41.86 69575.51 45726.98 1385.80 SBD49 635.1 FIA037 1 44.9 44.86 173015.04 0.00 2 46 45.88 176387.93 0.00 SBD257 853.1 FIA046 1 41.6 34.14 43393.39 30137.46 3089.65 21124.12 2 41.5 30.56 6750.62 39624.33 4588.33 29375.78 3 41.5 31.30 7013.98 43450.50 4310.92 29041.77 4 41.5 35.38 68455.39 20129.66 3324.39 16954.19 5 41.5 40.67 140334.16 24045.19 2702.52 - 6 41.5 39.20 124866.62 18932.18 2666.16 2130.27 7 40.5 36.98 129470.83 3723.42 2703.21 -

142
Appendix2.2VB20HLA‐ICP‐MSData
Hole Depth FIA # Incl. # Sal* Sal 2** ppm B ppm Na ppm K ppm Ca ppm Mn SBD257 853.1 FIA049 4 38.9 41.64 162885.14 0.00 5 38.9 39.03 152227.40 0.00 6 41 41.04 159029.83 0.00 SBD49 540.2 FIA028 1 2.4 1.88 3904.39 1244.84 1020.89 801.94 2 2.4 1.93 4207.25 1194.93 906.71 699.07 3 2.4 1.75 1054.04 2569.68 277.92 1749.96 4 2.4 1.91 3092.59 2078.48 748.78 958.23 FIA029 1 38.2 26.39 86048.58 15776.66 55.20 5917.04 2 38.2 34.77 61922.76 29781.14 684.29 9988.33 3 38.2 34.38 60111.72 21721.22 827.95 10208.17 FIA034 1 49.7 44.48 105222.15 21053.64 2832.84 13804.44 2 49.7 37.97 8820.33 74695.52 3685.50 28832.30 SBD21 853.1 FIA003 4 45.6 43.52 132916.21 10801.24 675.73 1910.23 SBD14 449.9 FIA004 1 50.8 45.00 86428.59 37239.07 2192.13 12843.33 2 26.8 23.87 50978.88 19119.29 1017.37 6056.58 3 43.1 43.45 66327.82 11488.75 631.81 4638.38 4 43.1 42.40 73452.91 26753.64 12791.86 15420.13 SBD21 484.9 2 41 37.94 146.82 63568.66 38609.41 3281.54 6337.09 3 41 35.02 448.62 18563.38 47717.08 4974.14 7884.37 4 41 34.86 - 9595.66 68324.55 1669.89 12210.25 SBD21 479.2 FIA016 1 52.6 45.11 63.42 78426.01 45447.69 9763.99 9835.04 2 52.6 44.88 - 71327.83 38099.09 7785.98 8659.57 3 52.6 45.39 - 34226.93 0.00 3472.17 6919.48 4 52.6 45.32 76.00 78453.22 45030.44 8276.69 8943.20 SBD21 514.4 BH061 38.2 35.37 62844.27 26003.16 10511.73 BH062 38.1 34.81 63462.45 24310.33 11913.33 BH063 38.4 34.41 37415.68 27174.48 14444.53 SBD191 622 BH033 46.4 40.66 69701.46 38631.05 5079.25 11959.84 BH034 46.6 41.16 96291.96 22643.15 4509.64 12497.80 SBD14 468.4 BH024 47.4 43.61 15789.43 127263.96 1899.04 7786.34 SBD257 818.2 BH049 46.4 42.53 142647.63 20929.70 9577.87 3137.44

143
Appendix2.2VB20HLA‐ICP‐MSData
Hole Depth FIA # Incl. # Sal* Sal 2** ppm Fe ppm Cu ppm Zn ppm As ppm Rb SBD21 500.3 FIA051 1 50.42 53.19 148286.45 37.03 2 46.75 55.28 63656.63 1477.22 3 47.65 54.73 91772.34 924.36 4 42.7 53.02 86317.04 35759.53 5 55.6 53.50 66937.52 30196.49 SDB257 905.7 FIA064 1 40.4 35.02 45538.23 190.42 2 40.2 34.59 50745.72 621.42 3 40.2 33.22 92879.74 745.60 SBD86 781.4 FIA023 1 30.9 30.18 54191.40 3150.67 2 30.8 30.22 51517.66 3312.09 3 30.9 30.15 51166.53 3157.63 FIA025 1 39.4 37.97 87382.04 496.83 2 39.4 38.55 42604.06 366.43 3 39.4 36.86 46907.76 877.90 4 39.4 37.81 99835.60 7737.47 5 39.4 35.15 70842.22 1707.81 SBD15 480.2 FIA060 1 43.1 40.24 50721.17 31161.12 2 43.2 41.45 78514.85 5589.42 3 42.9 39.59 52409.34 23562.38 4 42.9 41.86 59314.53 12370.93 SBD49 635.1 FIA037 1 44.9 44.86 0.00 4535.46 2 46 45.88 0.00 5589.30 SBD257 853.1 FIA046 1 41.6 34.14 75067.95 1805.60 7133.90 83.62 2 41.5 30.56 92522.29 1803.95 12641.19 131.11 3 41.5 31.30 93180.01 539.27 9644.29 126.44 4 41.5 35.38 60585.29 2043.35 5294.35 52.10 5 41.5 40.67 1182.83 0.00 - - 6 41.5 39.20 5087.00 16468.71 1170.57 - 7 40.5 36.98 829.53 19493.28 8428.11 -

144
Appendix2.2VB20HLA‐ICP‐MSData
Hole Depth FIA # Incl. # Sal* Sal 2** ppm Fe ppm Cu ppm Zn ppm As ppm Rb SBD257 853.1 FIA049 4 38.9 41.64 0.00 436.58 5 38.9 39.03 0.00 1180.74 6 41 41.04 0.00 2929.65 SBD49 540.2 FIA028 1 2.4 1.88 2700.51 214.57 198.64 4.04 2 2.4 1.93 2531.89 367.07 172.39 4.11 3 2.4 1.75 4343.20 60.66 753.31 4.66 4 2.4 1.91 3144.78 38.29 304.65 8.04 FIA029 1 38.2 26.39 41.34 9072.32 1963.76 34.94 2 38.2 34.77 57293.70 1829.18 3718.26 73.61 3 38.2 34.38 60202.37 7933.34 3575.55 54.00 FIA034 1 49.7 44.48 59151.79 1208.13 5450.40 53.29 2 49.7 37.97 93864.26 1112.58 17280.10 225.88 SBD21 853.1 FIA003 4 45.6 43.52 16678.18 24106.15 1214.10 52.60 SBD14 449.9 FIA004 1 50.8 45.00 59567.24 14952.98 6745.82 61.47 2 51.38 23.87 27256.60 6579.53 3666.69 35.50 3 51.1 43.45 8607.54 143645.37 1955.03 - 4 53.03 42.40 56099.94 37397.37 3516.86 - SBD21 484.9 2 41 37.94 61760.80 2211.33 2004.25 - 165.46 3 41 35.02 75229.03 26452.42 3220.86 - 188.29 4 41 34.86 80987.74 6448.12 9807.74 - 188.78 SBD21 479.2 FIA016 1 52.6 45.11 55139.92 25152.81 4911.28 - 135.17 2 52.6 44.88 52933.27 47516.46 3994.54 - 112.82 3 52.6 45.39 161505.70 0.00 3561.97 - - 4 52.6 45.32 49599.40 35088.01 3884.21 25.59 156.72 SBD21 514.4 BH061 38.2 35.37 63052.22 434.07 BH062 38.1 34.81 61316.90 407.10 BH063 38.4 34.41 86337.09 538.79 SBD191 622 BH033 46.4 40.66 61903.57 9368.67 4331.41 106.68 BH034 46.6 41.16 52968.51 1596.06 4530.49 43.43 SBD14 468.4 BH024 47.4 43.61 62101.50 7819.45 4069.83 765.34 SBD257 818.2 BH049 46.4 42.53 9410.23 0.00 2190.60 94.98
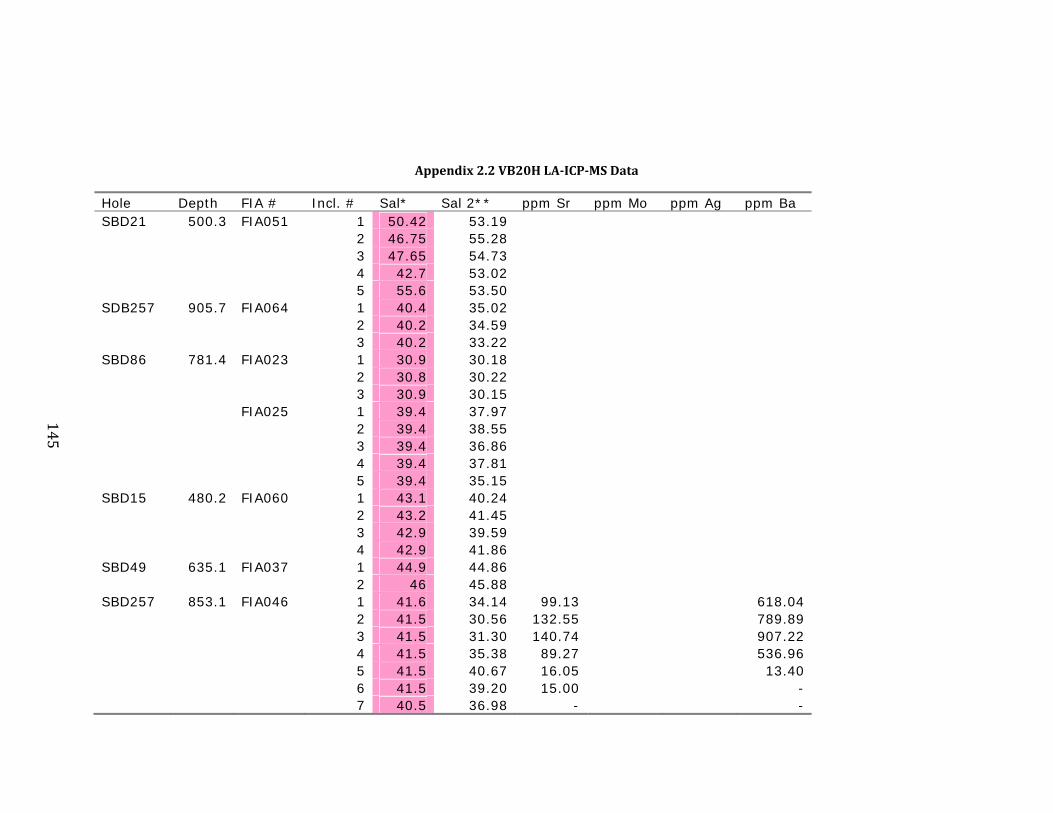
145
Appendix2.2VB20HLA‐ICP‐MSData
Hole Depth FIA # Incl. # Sal* Sal 2** ppm Sr ppm Mo ppm Ag ppm Ba SBD21 500.3 FIA051 1 50.42 53.19 2 46.75 55.28 3 47.65 54.73 4 42.7 53.02 5 55.6 53.50 SDB257 905.7 FIA064 1 40.4 35.02 2 40.2 34.59 3 40.2 33.22 SBD86 781.4 FIA023 1 30.9 30.18 2 30.8 30.22 3 30.9 30.15 FIA025 1 39.4 37.97 2 39.4 38.55 3 39.4 36.86 4 39.4 37.81 5 39.4 35.15 SBD15 480.2 FIA060 1 43.1 40.24 2 43.2 41.45 3 42.9 39.59 4 42.9 41.86 SBD49 635.1 FIA037 1 44.9 44.86 2 46 45.88 SBD257 853.1 FIA046 1 41.6 34.14 99.13 618.04 2 41.5 30.56 132.55 789.89 3 41.5 31.30 140.74 907.22 4 41.5 35.38 89.27 536.96 5 41.5 40.67 16.05 13.40 6 41.5 39.20 15.00 - 7 40.5 36.98 - -

146
Appendix2.2VB20HLA‐ICP‐MSData
Hole Depth FIA # Incl. # Sal* Sal 2** ppm Sr ppm Mo ppm Ag ppm Ba SBD257 853.1 FIA049 4 38.9 41.64 5 38.9 39.03 6 41 41.04 SBD49 540.2 FIA028 1 2.4 1.88 16.59 32.94 2 2.4 1.93 15.13 29.28 3 2.4 1.75 6.17 46.46 4 2.4 1.91 13.31 33.66 FIA029 1 38.2 26.39 8.45 161.22 2 38.2 34.77 17.42 224.09 3 38.2 34.38 14.27 212.35 FIA034 1 49.7 44.48 43.28 579.06 2 49.7 37.97 92.96 1338.12 SBD21 853.1 FIA003 4 45.6 43.52 5.71 6.82 SBD14 449.9 FIA004 1 50.8 45.00 31.89 180.86 2 51.38 23.87 15.70 82.74 3 51.1 43.45 19.52 47.21 4 53.03 42.40 184.04 5031.90 SBD21 484.9 2 41 37.94 54.34 - 18.30 329.74 3 41 35.02 87.68 - - 559.25 4 41 34.86 9.85 - - 70.13 SBD21 479.2 FIA016 1 52.6 45.11 75.98 214.92 28.78 225.08 2 52.6 44.88 81.71 148.61 25.96 329.85 3 52.6 45.39 149.55 - - 246.60 4 52.6 45.32 82.14 176.17 24.29 346.84 SBD21 514.4 BH061 38.2 35.37 BH062 38.1 34.81 BH063 38.4 34.41 SBD191 622 BH033 46.4 40.66 81.17 780.98 BH034 46.6 41.16 187.14 511.22 SBD14 468.4 BH024 47.4 43.61 61.61 746.74 SBD257 818.2 BH049 46.4 42.53 350.41 304.30

147
Appendix2.2VB20HLA‐ICP‐MSData
Hole Depth FIA # Incl. # Sal* Sal 2** ppm W ppm Au ppm Pb SBD21 500.3 FIA051 1 50.42 53.19 - 2 46.75 55.28 - 3 47.65 54.73 - 4 42.7 53.02 - 5 55.6 53.50 - SDB257 905.7 FIA064 1 40.4 35.02 - 2 40.2 34.59 - 3 40.2 33.22 - SBD86 781.4 FIA023 1 30.9 30.18 - 2 30.8 30.22 - 3 30.9 30.15 - FIA025 1 39.4 37.97 - 2 39.4 38.55 - 3 39.4 36.86 - 4 39.4 37.81 - 5 39.4 35.15 - SBD15 480.2 FIA060 1 43.1 40.24 - 2 43.2 41.45 - 3 42.9 39.59 - 4 42.9 41.86 - SBD49 635.1 FIA037 1 44.9 44.86 - 2 46 45.88 - SBD257 853.1 FIA046 1 41.6 34.14 - 582.93 2 41.5 30.56 - 978.83 3 41.5 31.30 - 914.74 4 41.5 35.38 - 407.03 5 41.5 40.67 - 96.95 6 41.5 39.20 - 99.10 7 40.5 36.98 - -
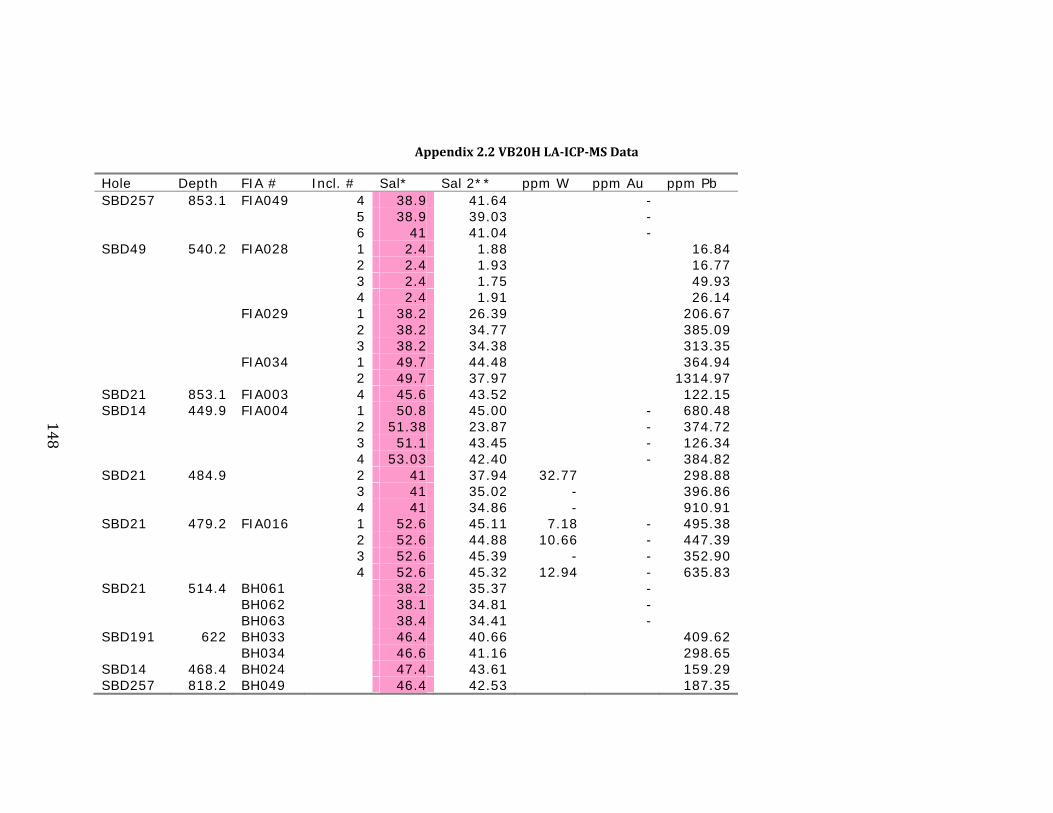
148
Appendix2.2VB20HLA‐ICP‐MSData
Hole Depth FIA # Incl. # Sal* Sal 2** ppm W ppm Au ppm Pb SBD257 853.1 FIA049 4 38.9 41.64 - 5 38.9 39.03 - 6 41 41.04 - SBD49 540.2 FIA028 1 2.4 1.88 16.84 2 2.4 1.93 16.77 3 2.4 1.75 49.93 4 2.4 1.91 26.14 FIA029 1 38.2 26.39 206.67 2 38.2 34.77 385.09 3 38.2 34.38 313.35 FIA034 1 49.7 44.48 364.94 2 49.7 37.97 1314.97 SBD21 853.1 FIA003 4 45.6 43.52 122.15 SBD14 449.9 FIA004 1 50.8 45.00 - 680.48 2 51.38 23.87 - 374.72 3 51.1 43.45 - 126.34 4 53.03 42.40 - 384.82 SBD21 484.9 2 41 37.94 32.77 298.88 3 41 35.02 - 396.86 4 41 34.86 - 910.91 SBD21 479.2 FIA016 1 52.6 45.11 7.18 - 495.38 2 52.6 44.88 10.66 - 447.39 3 52.6 45.39 - - 352.90 4 52.6 45.32 12.94 - 635.83 SBD21 514.4 BH061 38.2 35.37 - BH062 38.1 34.81 - BH063 38.4 34.41 - SBD191 622 BH033 46.4 40.66 409.62 BH034 46.6 41.16 298.65 SBD14 468.4 BH024 47.4 43.61 159.29 SBD257 818.2 BH049 46.4 42.53 187.35
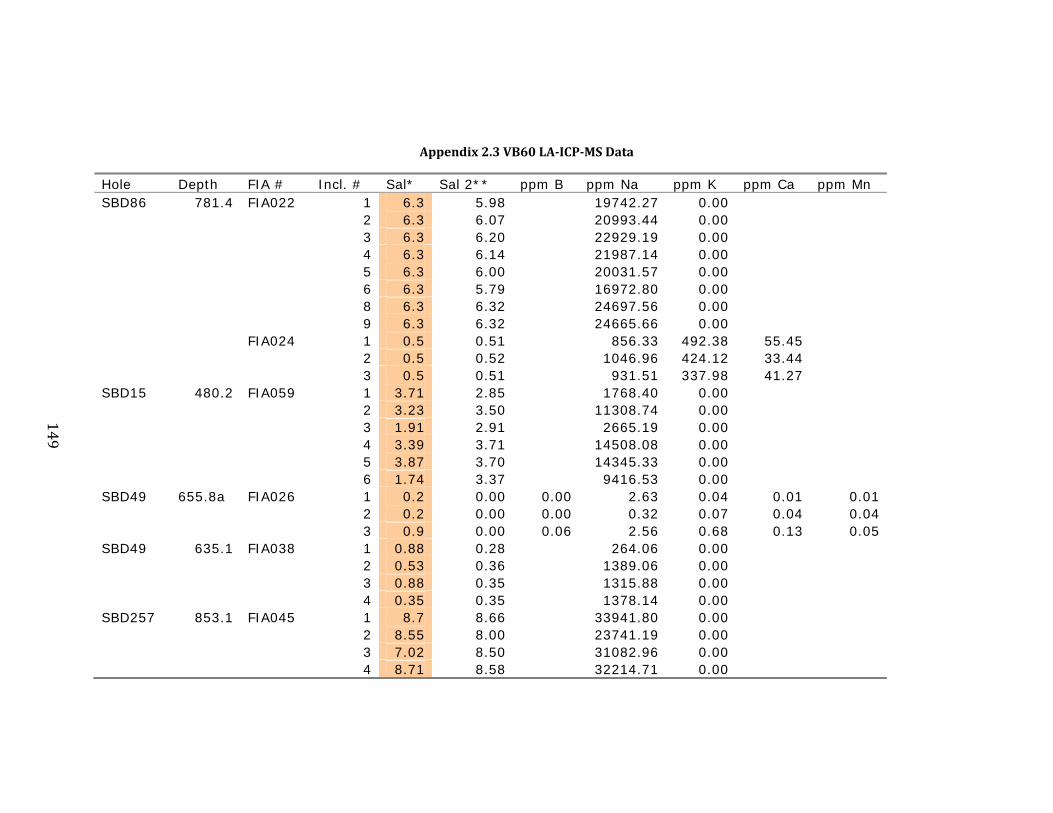
149
Appendix2.3VB60LA‐ICP‐MSData
Hole Depth FIA # Incl. # Sal* Sal 2** ppm B ppm Na ppm K ppm Ca ppm Mn SBD86 781.4 FIA022 1 6.3 5.98 19742.27 0.00 2 6.3 6.07 20993.44 0.00 3 6.3 6.20 22929.19 0.00 4 6.3 6.14 21987.14 0.00 5 6.3 6.00 20031.57 0.00 6 6.3 5.79 16972.80 0.00 8 6.3 6.32 24697.56 0.00 9 6.3 6.32 24665.66 0.00 FIA024 1 0.5 0.51 856.33 492.38 55.45 2 0.5 0.52 1046.96 424.12 33.44 3 0.5 0.51 931.51 337.98 41.27 SBD15 480.2 FIA059 1 3.71 2.85 1768.40 0.00 2 3.23 3.50 11308.74 0.00 3 1.91 2.91 2665.19 0.00 4 3.39 3.71 14508.08 0.00 5 3.87 3.70 14345.33 0.00 6 1.74 3.37 9416.53 0.00 SBD49 655.8a FIA026 1 0.2 0.00 0.00 2.63 0.04 0.01 0.01 2 0.2 0.00 0.00 0.32 0.07 0.04 0.04 3 0.9 0.00 0.06 2.56 0.68 0.13 0.05 SBD49 635.1 FIA038 1 0.88 0.28 264.06 0.00 2 0.53 0.36 1389.06 0.00 3 0.88 0.35 1315.88 0.00 4 0.35 0.35 1378.14 0.00 SBD257 853.1 FIA045 1 8.7 8.66 33941.80 0.00 2 8.55 8.00 23741.19 0.00 3 7.02 8.50 31082.96 0.00 4 8.71 8.58 32214.71 0.00
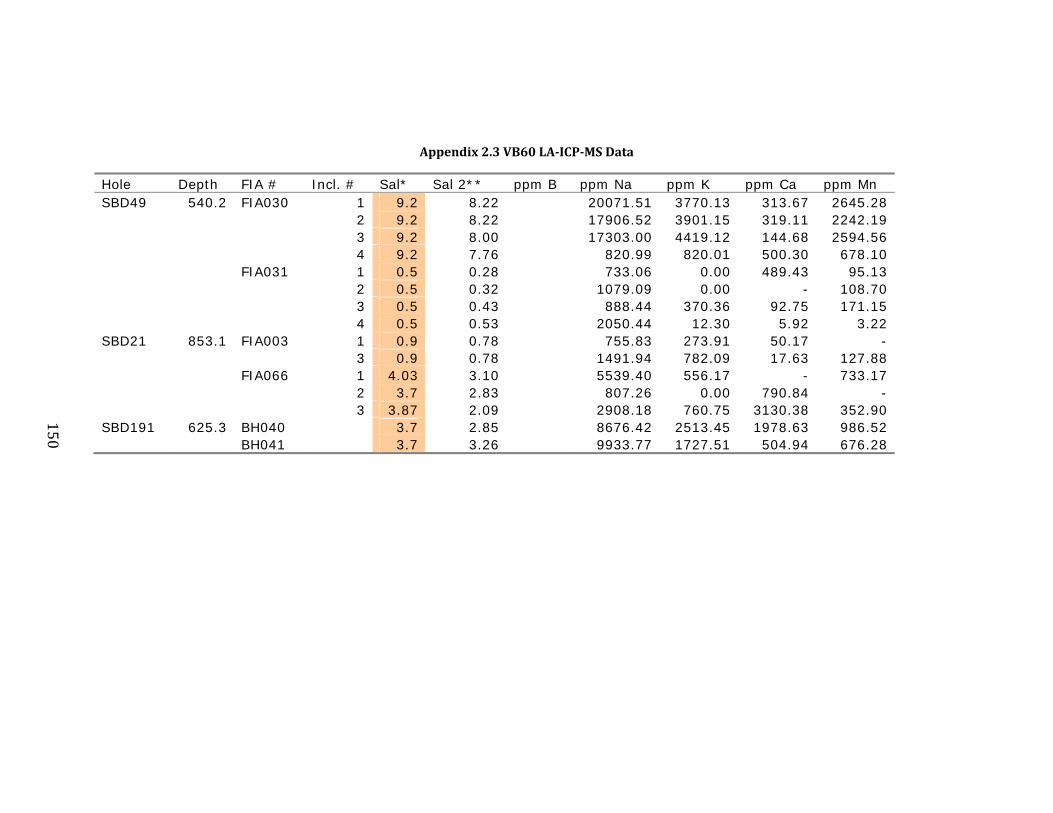
150
Appendix2.3VB60LA‐ICP‐MSData
Hole Depth FIA # Incl. # Sal* Sal 2** ppm B ppm Na ppm K ppm Ca ppm Mn SBD49 540.2 FIA030 1 9.2 8.22 20071.51 3770.13 313.67 2645.28 2 9.2 8.22 17906.52 3901.15 319.11 2242.19 3 9.2 8.00 17303.00 4419.12 144.68 2594.56 4 9.2 7.76 820.99 820.01 500.30 678.10 FIA031 1 0.5 0.28 733.06 0.00 489.43 95.13 2 0.5 0.32 1079.09 0.00 - 108.70 3 0.5 0.43 888.44 370.36 92.75 171.15 4 0.5 0.53 2050.44 12.30 5.92 3.22 SBD21 853.1 FIA003 1 0.9 0.78 755.83 273.91 50.17 - 3 0.9 0.78 1491.94 782.09 17.63 127.88 FIA066 1 4.03 3.10 5539.40 556.17 - 733.17 2 3.7 2.83 807.26 0.00 790.84 - 3 3.87 2.09 2908.18 760.75 3130.38 352.90 SBD191 625.3 BH040 3.7 2.85 8676.42 2513.45 1978.63 986.52 BH041 3.7 3.26 9933.77 1727.51 504.94 676.28

151
Appendix2.3VB60LA‐ICP‐MSData
Hole Depth FIA # Incl. # Sal* Sal 2** ppm Fe ppm Cu ppm Zn ppm As ppm Rb SBD86 781.4 FIA022 1 6.3 5.98 0.00 6064.92 2 6.3 6.07 0.00 4563.58 3 6.3 6.20 0.00 2235.74 4 6.3 6.14 0.00 3369.37 5 6.3 6.00 0.00 5719.69 6 6.3 5.79 0.00 9394.77 8 6.3 6.32 0.00 113.61 9 6.3 6.32 0.00 151.38 FIA024 1 6.59 0.51 873.74 22.65 2 6.16 0.52 667.64 105.03 3 5.41 0.51 852.85 112.45 SBD15 480.2 FIA059 1 3.71 2.85 0.00 15399.96 2 3.23 3.50 0.00 3937.43 3 1.91 2.91 0.00 14318.68 4 3.39 3.71 0.00 93.47 5 3.87 3.70 0.00 289.02 6 1.74 3.37 0.00 6210.60 SBD49 655.8a FIA026 1 0.2 0.00 0.06 0.10 0.01 - - 2 0.2 0.00 0.07 0.05 0.02 - - 3 0.9 0.00 0.13 0.00 0.01 - 0.00 SBD49 635.1 FIA038 1 0.88 0.28 0.00 1356.96 2 0.53 0.36 0.00 5.29 3 0.88 0.35 0.00 92.21 4 0.35 0.35 0.00 18.41 SBD257 853.1 FIA045 1 8.7 8.66 0.00 0.00 2 8.55 8.00 0.00 12495.28 3 7.02 8.50 0.00 3674.29 4 4.65 8.58 0.00 2314.24

152
Appendix2.3VB60LA‐ICP‐MSData
Hole Depth FIA # Incl. # Sal* Sal 2** ppm Fe ppm Cu ppm Zn ppm As ppm Rb SBD49 540.2 FIA030 1 9.2 8.22 9103.17 2004.20 882.21 - 2 9.2 8.22 10420.87 3444.65 954.82 - 3 9.2 8.00 8638.93 5028.43 1323.84 - 4 9.2 7.76 19462.67 19128.46 331.95 - FIA031 1 0.5 0.28 336.71 114.35 147.05 - 2 0.5 0.32 193.31 0.00 351.03 - 3 0.5 0.43 581.99 32.62 123.02 - 4 0.5 0.53 2.64 8.99 6.49 - SBD21 853.1 FIA003 1 0.9 0.78 1382.44 1395.15 52.47 - 3 0.9 0.78 644.30 696.18 101.27 - FIA066 1 4.03 3.10 3338.26 5278.91 422.26 - 2 3.7 2.83 5167.00 9291.12 459.60 - 3 3.87 2.09 2249.04 4432.00 2008.86 - SBD191 625.3 BH040 3.7 2.85 656.09 22.24 363.12 7.89 BH041 3.7 3.26 1347.27 590.92 548.80 -

153
Appendix2.3VB60LA‐ICP‐MSData
Hole Depth FIA # Incl. # Sal* Sal 2** ppm Sr ppm Mo ppm Ag ppm Ba SBD86 781.4 FIA022 1 6.3 5.98 2 6.3 6.07 3 6.3 6.20 4 6.3 6.14 5 6.3 6.00 6 6.3 5.79 8 6.3 6.32 9 6.3 6.32 FIA024 1 6.59 0.51 2 6.16 0.52 3 5.41 0.51 SBD15 480.2 FIA059 1 3.71 2.85 2 3.23 3.50 3 1.91 2.91 4 3.39 3.71 5 3.87 3.70 6 1.74 3.37 SBD49 655.8a FIA026 1 0.2 0.00 - - - - 2 0.2 0.00 - - - 0.00 3 0.9 0.00 0.00 - - 0.00 SBD49 635.1 FIA038 1 0.88 0.28 2 0.53 0.36 3 0.88 0.35 4 0.35 0.35 SBD257 853.1 FIA045 1 8.7 8.66 2 8.55 8.00 3 7.02 8.50 4 4.65 8.58

154
Appendix2.3VB60LA‐ICP‐MSData
Hole Depth FIA # Incl. # Sal* Sal 2** ppm Sr ppm Mo ppm Ag ppm Ba SBD49 540.2 FIA030 1 9.2 8.22 7.39 46.64 2 9.2 8.22 5.16 38.65 3 9.2 8.00 2.88 35.60 4 9.2 7.76 9.86 10.92 FIA031 1 0.5 0.28 - 8.01 2 0.5 0.32 - 19.71 3 0.5 0.43 2.49 13.89 4 0.5 0.53 0.05 0.14 SBD21 853.1 FIA003 1 0.9 0.78 0.63 0.66 3 0.9 0.78 - 1.22 FIA066 1 4.03 3.10 - 19.66 2 3.7 2.83 - 37.06 3 3.87 2.09 17.65 18.62 SBD191 625.3 BH040 3.7 2.85 33.34 56.97 BH041 3.7 3.26 6.71 14.94
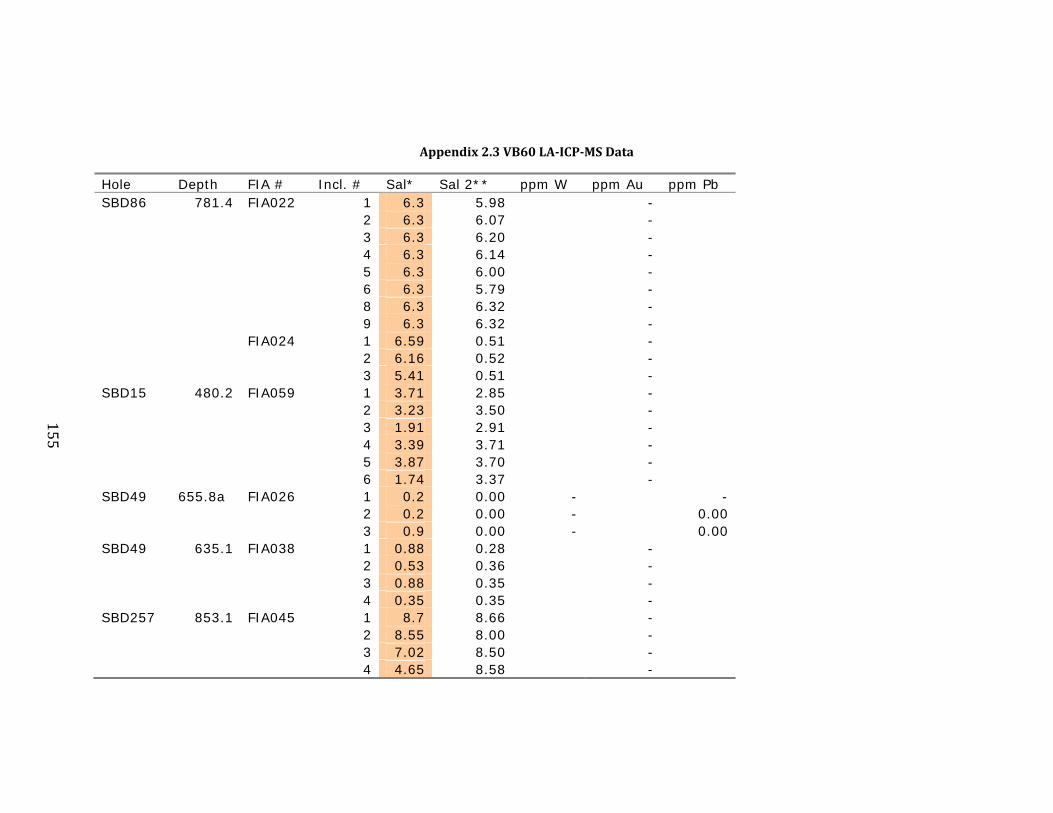
155
Appendix2.3VB60LA‐ICP‐MSData
Hole Depth FIA # Incl. # Sal* Sal 2** ppm W ppm Au ppm Pb SBD86 781.4 FIA022 1 6.3 5.98 - 2 6.3 6.07 - 3 6.3 6.20 - 4 6.3 6.14 - 5 6.3 6.00 - 6 6.3 5.79 - 8 6.3 6.32 - 9 6.3 6.32 - FIA024 1 6.59 0.51 - 2 6.16 0.52 - 3 5.41 0.51 - SBD15 480.2 FIA059 1 3.71 2.85 - 2 3.23 3.50 - 3 1.91 2.91 - 4 3.39 3.71 - 5 3.87 3.70 - 6 1.74 3.37 - SBD49 655.8a FIA026 1 0.2 0.00 - - 2 0.2 0.00 - 0.00 3 0.9 0.00 - 0.00 SBD49 635.1 FIA038 1 0.88 0.28 - 2 0.53 0.36 - 3 0.88 0.35 - 4 0.35 0.35 - SBD257 853.1 FIA045 1 8.7 8.66 - 2 8.55 8.00 - 3 7.02 8.50 - 4 4.65 8.58 -

156
Appendix2.3VB60LA‐ICP‐MSData
Hole Depth FIA # Incl. # Sal* Sal 2** ppm W ppm Au ppm Pb SBD49 540.2 FIA030 1 9.2 8.22 73.84 2 9.2 8.22 65.14 3 9.2 8.00 90.11 4 9.2 7.76 86.97 FIA031 1 0.5 0.28 16.04 2 0.5 0.32 24.91 3 0.5 0.43 7.92 4 0.5 0.53 1.19 SBD21 853.1 FIA003 1 0.9 0.78 1.68 3 0.9 0.78 11.33 FIA066 1 4.03 3.10 28.65 2 3.7 2.83 - 3 3.87 2.09 20.22 SBD191 625.3 BH040 3.7 2.85 29.98 BH041 3.7 3.26 72.83
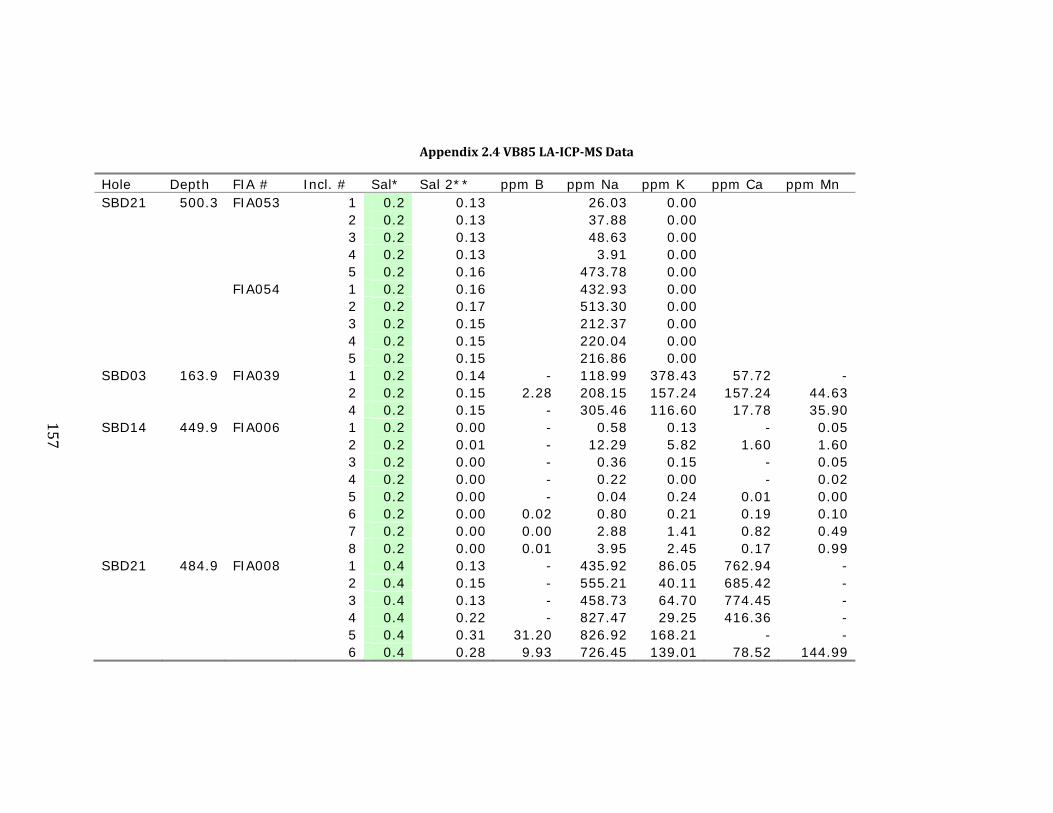
157
Appendix2.4VB85LA‐ICP‐MSData
Hole Depth FIA # Incl. # Sal* Sal 2** ppm B ppm Na ppm K ppm Ca ppm Mn SBD21 500.3 FIA053 1 0.2 0.13 26.03 0.00 2 0.2 0.13 37.88 0.00 3 0.2 0.13 48.63 0.00 4 0.2 0.13 3.91 0.00 5 0.2 0.16 473.78 0.00 FIA054 1 0.2 0.16 432.93 0.00 2 0.2 0.17 513.30 0.00 3 0.2 0.15 212.37 0.00 4 0.2 0.15 220.04 0.00 5 0.2 0.15 216.86 0.00 SBD03 163.9 FIA039 1 0.2 0.14 - 118.99 378.43 57.72 - 2 0.2 0.15 2.28 208.15 157.24 157.24 44.63 4 0.2 0.15 - 305.46 116.60 17.78 35.90 SBD14 449.9 FIA006 1 0.2 0.00 - 0.58 0.13 - 0.05 2 0.2 0.01 - 12.29 5.82 1.60 1.60 3 0.2 0.00 - 0.36 0.15 - 0.05 4 0.2 0.00 - 0.22 0.00 - 0.02 5 0.2 0.00 - 0.04 0.24 0.01 0.00 6 0.2 0.00 0.02 0.80 0.21 0.19 0.10 7 0.2 0.00 0.00 2.88 1.41 0.82 0.49 8 0.2 0.00 0.01 3.95 2.45 0.17 0.99 SBD21 484.9 FIA008 1 0.4 0.13 - 435.92 86.05 762.94 - 2 0.4 0.15 - 555.21 40.11 685.42 - 3 0.4 0.13 - 458.73 64.70 774.45 - 4 0.4 0.22 - 827.47 29.25 416.36 - 5 0.4 0.31 31.20 826.92 168.21 - - 6 0.4 0.28 9.93 726.45 139.01 78.52 144.99

158
Appendix2.4VB85LA‐ICP‐MSData
Hole Depth FIA # Incl. # Sal* Sal 2** ppm Fe ppm Cu ppm Zn ppm As ppm Rb SBD21 500.3 FIA053 1 0.2 0.13 0.00 807.92 2 0.2 0.13 0.00 793.68 3 0.2 0.13 0.00 780.76 4 0.2 0.13 0.00 834.50 5 0.2 0.16 0.00 269.95 FIA054 1 0.2 0.16 0.00 318.97 2 0.2 0.17 0.00 222.46 3 0.2 0.15 0.00 584.02 4 0.2 0.15 0.00 574.83 5 0.2 0.15 0.00 578.64 SBD03 163.9 FIA039 1 0.2 0.14 156.57 12.75 - - - 2 0.2 0.15 233.25 92.91 29.13 - 0.35 4 0.2 0.15 179.05 84.38 23.05 - 0.19 SBD14 449.9 FIA006 1 0.2 0.00 0.41 0.33 0.02 - - 2 0.2 0.01 7.16 4.62 0.39 - 0.02 3 0.2 0.00 0.37 0.22 - - - 4 0.2 0.00 0.15 0.31 - - - 5 0.2 0.00 0.09 0.17 - - - 6 0.2 0.00 0.18 0.28 0.02 0.00 0.00 7 0.2 0.00 2.01 1.61 0.12 - 0.00 8 0.2 0.00 4.73 0.24 0.37 - 0.01 SBD21 484.9 FIA008 1 0.4 0.13 6.06 7.57 20.81 - - 2 0.4 0.15 3.92 14.07 23.88 - - 3 0.4 0.13 10.20 10.57 18.77 - - 4 0.4 0.22 10.80 20.63 47.27 - - 5 0.4 0.31 281.19 0.00 - - - 6 0.4 0.28 289.55 0.00 62.99 - -
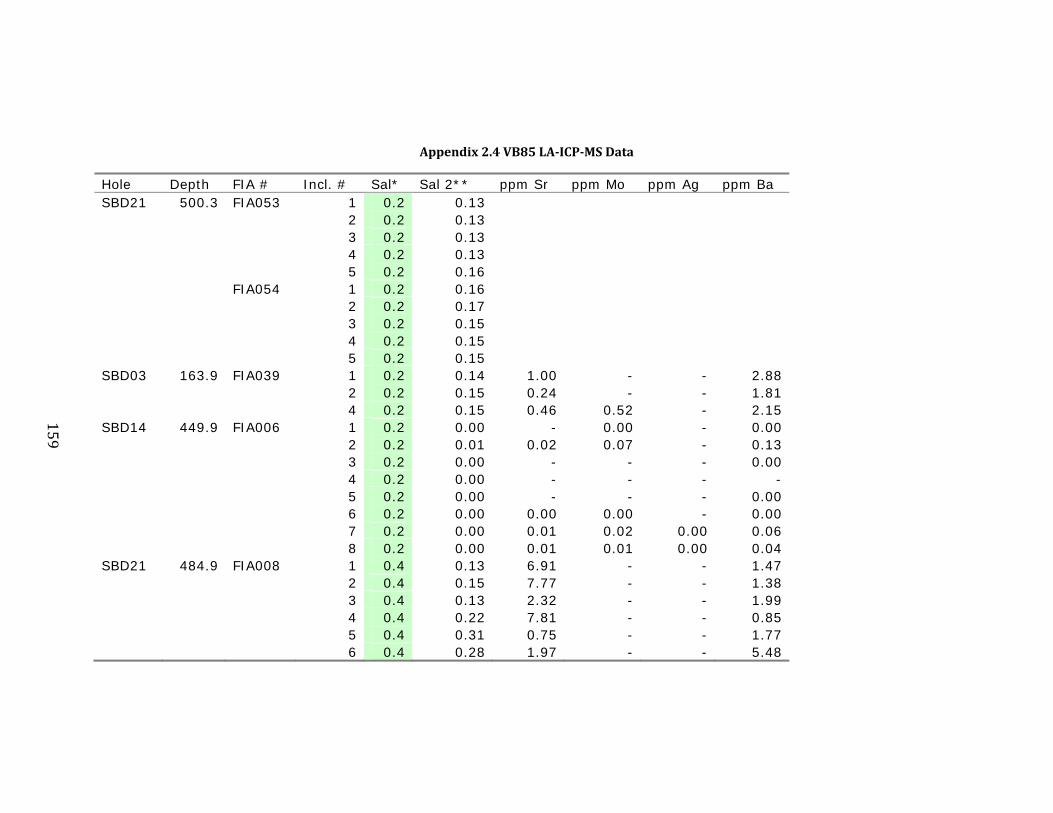
159
Appendix2.4VB85LA‐ICP‐MSData
Hole Depth FIA # Incl. # Sal* Sal 2** ppm Sr ppm Mo ppm Ag ppm Ba SBD21 500.3 FIA053 1 0.2 0.13 2 0.2 0.13 3 0.2 0.13 4 0.2 0.13 5 0.2 0.16 FIA054 1 0.2 0.16 2 0.2 0.17 3 0.2 0.15 4 0.2 0.15 5 0.2 0.15 SBD03 163.9 FIA039 1 0.2 0.14 1.00 - - 2.88 2 0.2 0.15 0.24 - - 1.81 4 0.2 0.15 0.46 0.52 - 2.15 SBD14 449.9 FIA006 1 0.2 0.00 - 0.00 - 0.00 2 0.2 0.01 0.02 0.07 - 0.13 3 0.2 0.00 - - - 0.00 4 0.2 0.00 - - - - 5 0.2 0.00 - - - 0.00 6 0.2 0.00 0.00 0.00 - 0.00 7 0.2 0.00 0.01 0.02 0.00 0.06 8 0.2 0.00 0.01 0.01 0.00 0.04 SBD21 484.9 FIA008 1 0.4 0.13 6.91 - - 1.47 2 0.4 0.15 7.77 - - 1.38 3 0.4 0.13 2.32 - - 1.99 4 0.4 0.22 7.81 - - 0.85 5 0.4 0.31 0.75 - - 1.77 6 0.4 0.28 1.97 - - 5.48
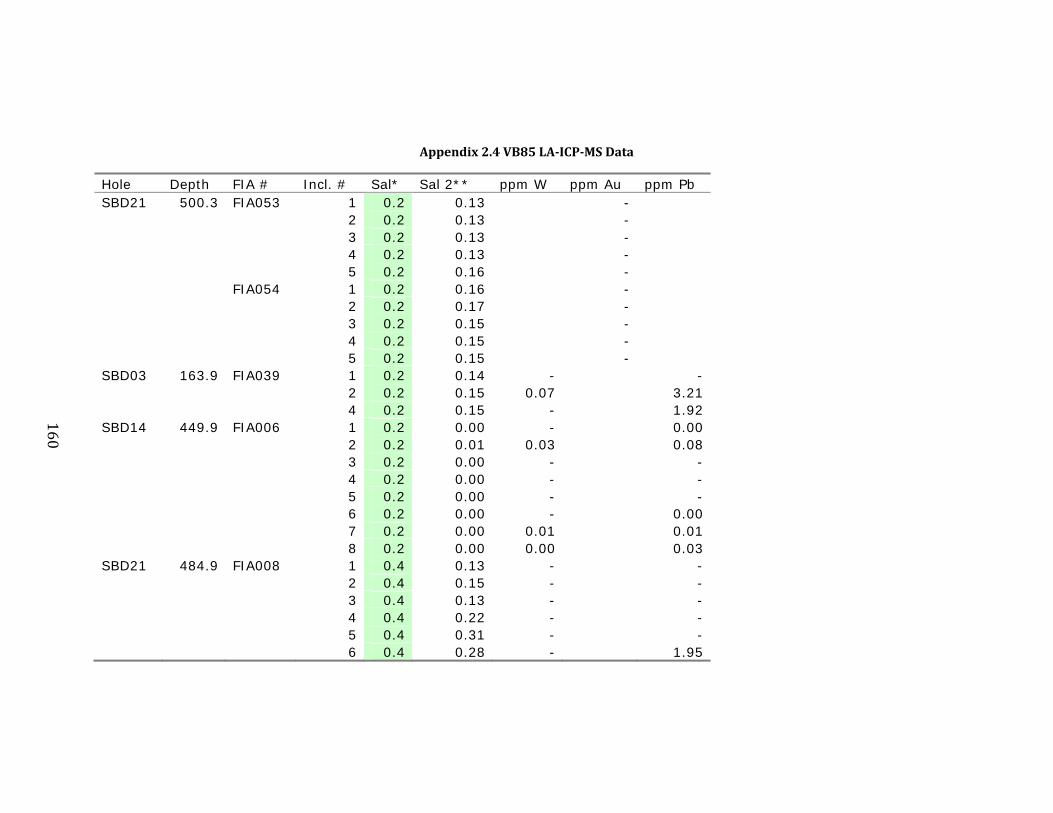
160
Appendix2.4VB85LA‐ICP‐MSData
Hole Depth FIA # Incl. # Sal* Sal 2** ppm W ppm Au ppm Pb SBD21 500.3 FIA053 1 0.2 0.13 - 2 0.2 0.13 - 3 0.2 0.13 - 4 0.2 0.13 - 5 0.2 0.16 - FIA054 1 0.2 0.16 - 2 0.2 0.17 - 3 0.2 0.15 - 4 0.2 0.15 - 5 0.2 0.15 - SBD03 163.9 FIA039 1 0.2 0.14 - - 2 0.2 0.15 0.07 3.21 4 0.2 0.15 - 1.92 SBD14 449.9 FIA006 1 0.2 0.00 - 0.00 2 0.2 0.01 0.03 0.08 3 0.2 0.00 - - 4 0.2 0.00 - - 5 0.2 0.00 - - 6 0.2 0.00 - 0.00 7 0.2 0.00 0.01 0.01 8 0.2 0.00 0.00 0.03 SBD21 484.9 FIA008 1 0.4 0.13 - - 2 0.4 0.15 - - 3 0.4 0.13 - - 4 0.4 0.22 - - 5 0.4 0.31 - - 6 0.4 0.28 - 1.95

161
REFERENCESArif,J.,Baker,T.(2004).GoldparagenesisandchemistryatBatuHijau,Indonesia:
Implicationsforgold‐richporphyrycopperdeposits.MineraliumDeposita,
39,523‐535.
Barberi,S.,Bigioggero,B.,Boriani,A.,Cattaneo,M.,Cavallin,A.,Eva,C.,Cioni,R.,
Gelemini,R.,Giorgetti,F.,Iaccarino,S.,Innocenti,F.,Marinelli,G.,Slejko,D.,
andSudradjat,A.(1987).TheislandofSumbawa:amajorstructural
discontinuityintheIndonesianarc.BollettinodellaSocietaGeologicaItaliana,
106,547‐620.
Bodnar,J.R.,andVityk,M.O.(1994).Interpretationofmicrothermometricdatafor
H2O‐NaClfluidinclusions.inFluidInclusionsinMinerals:Methodsand
Applications,DeVivo,B.,andFrezzotti,M.L.,eds.,pub.byVirginiaTechnical
Institute,Blacksburg,VA,117−130.
Bodnar,R.J.,Burnham,C.W.,andSterner,S.M.(1985).Syntheticfluidinclusionsin
naturalquartz.III.Determinationofphaseequilibriumpropertiesinthe
systemH2O‐NaClto1000°Cand1500bars.GeochimicaetCosmochimica
Acta,49,1861–1873.

162
Burnham,C.W.,andOhmoto,H.(1980).Late‐stageprocessesoffelsicmagmatism.
MiningGeology,SpecialIssue8,1–13.
Clode,C.H.,Proffett,J.M.,Munajat,I.(1999).Timingrelationshipofintrusion,wall‐
rockalteration,andmineralizationintheBatuHijaucopper–goldporphyry
deposit.ProceedingPac‐RimCongress,10–13October1997,Bali,485–498
CorbettG.J.,LeachT.M.(1998).SouthwestPacificrimgold‐coppersystems:
structure,alterationandmineralization.SocietyofEconomicGeologists
SpecialPublication,6,236.
Driesner,T.(2007).ThesystemH2O‐NaCl.PartII:Correlation
Formolarvolume,enthalpy,andisobaricheatcapacityfrom0°to1000°C,1
to5000bars,and0to1XNaCl.GeochimicaetCosmochimicaActa,71(20),
4902−4919.
Fletcher,I.R.,Garwin,S.L.andMcNaughton,N.J.(2000).SHRIMPU‐Pbdatingof
Pliocenezircons.InWoodhead,J.D.,Hergt,J.M.andNoble,W.P.,eds.,Beyond
2000:NewFrontiersinIsotopeGeoscience.Lorne,NSW,2000,Abstractsand
Proceedings,73–74.

163
Garwin,S.L.(2000).Thesetting,geometryandtimingofintrusion‐related
hydrothermalsystemsinthevicinityoftheBatuHijauporphyrycopper‐gold
deposit,Sumbawa,Indonesia.(Unpublisheddoctoraldissertation).University
ofWesternAustralia,Perth,Australia.
Garwin,S.L.(2002).Thegeologicsettingofintrusion‐relatedhydrothermal
systemsneartheBatuHijauporphyrycopper‐golddeposit,Sumbawa,
Indonesia.SocietyofEconomicGeologistsSpecialPublication,9,333‐366.
Goldstein,R.H.,andReynolds,T.J.(1994).Systematicsoffluidinclusionsin
diageneticminerals.SocietyforSedimentaryGeologyShortCourse,31,199.
Hamilton,W.(1979).TectonicsoftheIndonesianregion.U.S.GeologicalSurvey
ProfessionalPaper,1078,345.
Heinrich,C.A.,Pettke,T.,Halter,W.E.,Aigner‐Torres,M.,Audétat,A.,Gunther,D.,
Hattendorf,B.,Bleiner,D.,Guillong,M.,andHorn,I.(2003).Quantitative
multielementanalysisofminerals,fluidandmeltinclusionsbylaser
ablation‐inductivelycoupledplasma‐massspectrometry.Geochimicaet
CosmochimicaActa,67,3473−3497.
164
Imai,A.,Ohno,S.(2005).Primaryoremineralassemblageandfluidinclusion
studyoftheBatuHijauporphyryCu‐Audeposit,Sumbawa,Indonesia.
ResourceGeology,55(3),239–248.
Kesler,S.E.,Chryssoulis,S.L.,andSimon,G.(2002).Goldinporphyrycopper
deposits:Itsabundanceandfate.OreGeologyReviews,21,103−124.
Meldrum,S.J.,Aquino,R.S.,Gonzales,R.I.,Burke,R.J.,Suyadi,A.,Irianto,B.andClarke,
D.S.(1994).TheBatuHijauporphyrycopper‐golddeposit,SumbawaIsland,
Indonesia,invanLeeuwen,T.M.,Hedenquist,J.W.,James,L.P.,andDow,J.A.S.,
eds.,MineraldepositsinIndonesia,DiscoveriesofthePast25Years.Journalof
GeochemicalExploration,50,203–220.
PTNewmontNusaTenggara.(1998).GeologicalreviewoftheBatuHijau
porphyrycopper‐golddeposit,Sumbawa,Indonesia.NusaTenggaraBarat,
Indonesia:MitchellP.A.,ProffettJ.M.,DillesJ.H.
Roedder,E.(1984).FluidInclusions.MineralogicalSocietyofAmerica,Reviewsin
Mineralogy,Vol.12,644pp.

165
Rickers,K.,Thomas,R.,Heinrich,W.(2006).Thebehavioroftraceelementsduring
thechemicalevolutionoftheH2O‐,B‐,andF‐Richgranite–pegmatite–
hydrothermalsystematEhrenfriedersdorf,Germany:aSXRFstudyofmelt
andfluidinclusions.MineraliumDeposita,41,229‐245.
Sillitoe,R.H.,andBonham,H.F.(1990).Sediment‐hostedgolddeposits:distal
productsofmagmatic‐hydrothermalsystems.Geology,18,157−161.
Simon,G.,Kesler,S.E.,Essense,E.J.,andChryssoulis,S.L.(2000).Goldin
porphyrycopperdeposits:Experimentaldeterminationofthedistribution
ofgoldintheCu‐Fe‐Ssystemat400°to700°C.EconomicGeology,95,
259–270.
Sterner,M.(1992).Homogenizationoffluidinclusionstothevaporphase:The
apparenthomogenizationphenomenon.EconomicGeology,87,1616–1623.
Ulrich,T.,Günther,D.,Heinrich,C.A.(2001).TheevolutionofaporphyryCu–Au
depositbasedonLA‐ICP‐MSanalysesoffluidinclusions:Bajodela
Alumbrera,Argentina.EconomicGeology,96,1743–1774.
166
CV
GraduateCollegeUniversityofNevada,LasVegas
JordanArmstrong
LocalAddress: 927SequoiaRubyCt. Henderson,NV89052HomeAddress: 1312DeerhurstDr. Raleigh,NC27614Degrees: BachelorofScience,Geology,2008 AuburnUniversity MasterofScience,Geoscience,2012(Anticipated) UniversityofNevada,LasVegasSpecialHonorsandAwards: UniversityofNevada,LasVegas: BernadaE.FrenchScholarship,2009 EleanorEdwards&MaxOlswangScholarshipforGeology,2009 UNLVCollegeofSciencesScholarship,2009,2010 AuburnUniversity: GeologyAlumniScholarship,2008 CollegeofScienceandMathematicsDean’sList,2007Grants: SocietyofEconomicGeologists/NewmontMiningCorp.Grant,2009 NewmontMiningCo.ResearchGrant,2009Organizations: GeologicalSocietyofAmerica(GSA) SocietyofEconomicGeologists(SEG)ConferencePresentations:
Armstrong,J.,Cline,J.,DecipheringtheEvolutionofOreFluidsattheBatuHijauCopper‐GoldPorphyryDeposit,Sumbawa,Indonesia.Postersessionpresentedat:GeologicalSocietyofAmericaAnnualMeeting&Exposition;2010Oct31–Nov3;Denver,CO.
167
Armstrong,J.,Cline,J.,DecipheringtheEvolutionofOreFluidsattheBatuHijauCopper‐GoldPorphyryDeposit,Sumbawa,Indonesia.Postersessionpresentedat:Pan‐AmericanCurrentResearchonFluidInclusions(PACROFIX);2010Jun7–10;LasVegas,NV.
TeachingExperience: GraduateTeachingAssistant,UniversityofNevada,LasVegas,2009‐2011 PhysicalGeography,HistoricalGeology UndergraduateTeachingAssistant,AuburnUniversity,2008 HistoricalGeology
Top Related