


Languages
Pages
Legal


Deaths
DEATHS
In 2013, Florida resident deaths increased to 180,015. This is a 2.4 percent increase from 2012.
The overall resident death rate per 100,000 population increased slightly from
923.5 in 2012 to 931.8 in 2013. The black female rate increased from 552.7 in 2012 to 562.2 in 2013. The white female rate increased from 979.7 in 2012 to 986.4 in 2013. The white male rate also increased from 1,085.6 in 2012 to 1,094.8 in 2013. The black male rate increased from 648.8 in 2012 to 650.8 in 2013.
Of all resident deaths in 2013, 87.1 percent were persons of non-Hispanic and non-
Haitian origin, 11.6 percent were persons of Hispanic origin, 0.9 percent were persons of Haitian origin, and 0.4 percent were persons whose ethnicity was unknown.
In 2013, cremations occurred more often than burials among whites (65.5 percent
to 23.7 percent). Among blacks, burials occurred more often than cremations (59.3 percent to 31.5 percent). For other races, cremations occurred more often than burials (58.5 percent to 31.6 percent).
Malignant neoplasm (cancer) was the leading cause of death in 2013, accounting
for 42,350 deaths. The cancer age-adjusted death rate per 100,000 population decreased from 2000 to 2013 from 187.8 to 158.7. Cancer was the leading cause of death for individuals aged 45-84 accounting for 30.4 percent of the deaths in this age group.
Heart disease was the second leading cause of death in 2013, accounting for
42,250 deaths. The heart disease age-adjusted death rate per 100,000 population decreased between 2000 and 2013 from 235.9 to 153.4. Heart disease was the leading cause of death among individuals 85 years or older, accounting for 29.9 percent of deaths in this age group.
In 2013, the major external causes of death (unintentional injury, suicide, and
homicide) accounted for 7.0 percent of all resident deaths.
The unintentional injury age-adjusted death rate per 100,000 population decreased from 45.6 in 2006 to 38.8 in 2013. Unintentional injury was the leading cause of death for individuals aged 1-44. This cause of death accounted for 28.6 percent of the deaths in this age group.
The white male and female homicide rates per 100,000 population decreased from
5.4 and 2.1 to 5.0 and 1.9 between 2012 and 2013. The black male rate decreased from 34.3 in 2012 to 31.1 in 2013. The black female rate was unchanged at 5.1 between 2012 and 2013.
There were 12 more resident HIV deaths in 2013 than in 2012, representing a 1.3
percent increase. The HIV age-adjusted death rate per 100,000 population decreased from 4.6 in 2012 to 4.5 in 2013. From 2012 to 2013 the white male and white female HIV rates increased, while the black female and black male HIV rate decreased. The black female rate decreased from 16.2 to 13.4 and the black male rate decreased from 21.7 to 21.3. The white male rate increased from 3.6 to 3.9 and the white female increased from 0.8 to 1.0.

OTHER
MALE FEMALEOTHERBLACKYEAR TOTAL WHITE MALE FEMALE MALE FEMALE
CHART D-1: RESIDENT DEATHS AND RATES PER 100,000 POPULATION, BY RACE AND GENDER,
FLORIDA AND UNITED STATES TOTAL,
CENSUS YEARS 1970-2000 AND 2003-2013
BLACKWHITE
1970 72,214 61,518 10,627 62 36,393 25,067 6,101 4,491 45 17
1980 100,667 88,971 11,560 121 50,581 38,381 6,600 4,957 72 49
1990 133,294 118,304 14,644 306 63,814 54,490 8,189 6,454 194 112
2000 162,839 144,774 17,077 663 73,883 70,886 8,825 8,249 366 297
2003 168,458 149,522 17,920 972 76,600 72,913 9,188 8,731 507 465
2004 168,364 149,215 18,059 1,027 76,237 72,967 9,400 8,654 509 518
2005 170,300 150,102 18,004 2,099 77,370 72,726 9,337 8,665 1,130 969
2006 169,365 148,994 18,314 2,031 77,068 71,916 9,448 8,863 1,055 976
2007 167,708 147,305 18,279 2,107 76,293 70,999 9,612 8,665 1,153 954
2008 170,473 149,966 18,286 2,179 77,736 72,207 9,607 8,672 1,161 1,015
2009 169,854 149,190 18,339 2,292 77,592 71,582 9,531 8,803 1,191 1,099
2010 172,509 151,589 18,251 2,473 78,668 72,901 9,402 8,842 1,329 1,144
2011 172,856 151,836 18,368 2,413 78,815 72,999 9,492 8,868 1,260 1,153
2012 175,849 154,043 18,871 2,757 79,589 74,450 9,846 9,024 1,412 1,345
2013 180,014 157,225 19,432 3,184 81,294 75,928 10,073 9,358 1,592 1,591
YEAR TOTAL WHITE BLACK TOTAL WHITE BLACK MALE FEMALE
WHITE BLACK
MALE FEMALE
UNITED STATES
UNADJUSTED DEATH RATES PER 100,000 POPULATION
FLORIDA
1970 1,054.0 1,065.2 1,014.8 1,303.5 840.2 1,216.3 823.1945.3 999.3946.3
1980 1,023.0 1,060.4 845.8 1,254.5 880.7 1,016.8 690.7878.3 875.4892.5
1990 1,023.0 1,071.6 817.8 1,190.9 959.0 958.0 689.7863.8 871.0888.0
2000 1,013.0 1,096.7 686.5 1,143.5 1,051.8 737.6 638.9854.0 781.1900.2
2003 986.6 1,085.7 676.1 1,134.5 1,038.6 721.6 634.0843.9 762.4894.7
2004 963.4 1,062.2 660.9 1,106.0 1,019.9 716.0 609.6818.8 741.7869.0
2005 952.6 1,048.6 638.9 1,100.9 998.1 689.9 591.6828.4 745.4880.9
2006 928.7 1,024.8 630.5 1,079.1 972.2 677.0 587.4813.1 727.5866.3
2007 906.5 1,002.4 615.3 1,056.2 950.2 672.9 561.9804.6 715.9859.3
2008 914.7 1,016.9 605.5 1,073.1 962.3 661.5 553.2812.9 704.2872.6
2009 907.7 1,010.6 601.3 1,070.5 952.7 649.7 556.1794.5 688.5853.7
2010 916.6 1,023.2 592.0 1,081.1 967.1 633.9 552.7799.5 682.2861.7
2011 912.9 1,021.3 589.1 1,078.9 965.4 632.3 548.6806.6 679.8871.71 1 1
2012 923.5 1,031.7 599.0 1,085.6 979.7 648.8 552.7NA NANA
2013 931.8 1,039.6 604.9 1,094.8 986.4 650.8 562.2NA NANA
1. Preliminary data.
FLORIDA VITAL STATISTICS ANNUAL REPORT 2013 73

GRAPH D-1: RESIDENT AGE-ADJUSTED DEATH RATES PER 100,000 POPULATION, BY
RACE, FLORIDA AND UNITED STATES TOTAL, 2003 - 2013
0
200
400
600
800
1000
1200
2003 2004 2005 2006 2007 2008 2009 2010 2011 2012 2013
Florida TotalFlorida WhiteFlorida BlackU.S. TotalU.S. WhiteU.S. Black
YEAR
RA
TE
1,2
UNITED STATES
TOTAL WHITE BLACKBLACKYEAR TOTAL WHITE
FLORIDA
CHART D-2: RESIDENT AGE-ADJUSTED DEATH RATES PER 100,000
POPULATION, BY RACE, FLORIDA AND UNITED STATES TOTAL,
CENSUS YEARS 1970-2000 AND 2003-2013
1222.6 1970 1,082.9 1,026.2 1,501.2 1193.3 1518.1
1039.1 1980 920.6 882.8 1,281.2 1012.7 1314.8
938.7 1990 854.6 816.8 1,245.5 909.8 1250.3
869.0 2000 795.1 769.5 1,065.6 849.8 1121.4
843.5 2003 766.6 750.1 1,013.8 827.1 1080.5
813.7 2004 741.6 726.8 958.3 798.5 1043.5
815.0 2005 734.5 718.2 931.1 801.1 1035.1
791.8 2006 709.5 695.3 891.5 779.3 997.9
775.3 2007 688.3 675.6 853.4 764.3 972.0
774.9 2008 680.3 671.2 817.8 767.2 947.7
749.6 2009 667.4 658.8 799.7 742.8 912.8
747.0 2010 687.4 678.4 790.5 741.8 898.2
740.6 3 2011 677.9 670.6 763.5
3 3738.1 877.4
NA 2012 680.7 674.6 746.0 NA NA
NA 2013 679.3 672.0 741.8 NA NA
1. Age-Adjusted Death Rates (AADR) for 1970-2013 use the 2000 estimated standard million population.
2. ICD Revision Used: 1970 (ICD-8), 1980-1998 (ICD-9), and 1999-2013 (ICD-10)
3. Preliminary data.
74 FLORIDA VITAL STATISTICS ANNUAL REPORT 2013

OTHER BLACKBLACK WHITETOTALWHITETOTALRANKYEAR
NUMBER OF DEATHS
CAUSE OF DEATH*
RATES
CHART D-3: RESIDENT DEATHS FOR SELECTED LEADING CAUSES AND OTHER SIGNIFICANT CAUSES AND
RATES PER 100,000 POPULATION, BY RACE, FLORIDA, 2003 AND 2013
Cancer ICD-10: C00-C97 12013 42,350 37,332 4,232 757 219.2 246.9 131.7
-2003 39,238 35,326 3,688 218 229.8 256.5 139.1
Heart Diseases ICD-10: I00-I09, I11, I13, I20-I51 22013 42,249 37,350 4,199 660 218.7 247.0 130.7
-2003 48,129 43,480 4,414 230 281.9 315.7 166.5
CLRD ICD-10: J40-J47 32013 11,328 10,594 607 123 58.6 70.1 18.9
-2003 9,030 8,554 444 28 52.9 62.1 16.8
Stroke ICD-10: I60-I69 42013 8,611 7,273 1,129 196 44.6 48.1 35.1
-2003 9,873 8,533 1,239 100 57.8 62.0 46.7
Unintentional Injury ICD-10: V01-X59, Y85-Y86 52013 8,534 7,535 799 179 44.2 49.8 24.9
-2003 7,901 6,945 868 84 46.3 50.4 32.7
Diabetes Mellitus ICD-10: E10-E14 62013 5,209 4,023 1,058 126 27.0 26.6 32.9
-2003 4,754 3,842 875 36 27.8 27.9 33.0
Alzheimers Disease ICD-10: G30 72013 5,064 4,699 301 61 26.2 31.1 9.4
-2003 4,311 4,090 214 6 25.2 29.7 8.1
Nephritis ICD-10: N00-N07, N17-N19, N25-N27 82013 3,106 2,470 580 54 16.1 16.3 18.1
-2003 2,257 1,853 394 10 13.2 13.5 14.9
Suicide ICD-10: X60-X84, Y87.0 92013 2,892 2,648 156 80 15.0 17.5 4.9
-2003 2,294 2,151 118 24 13.4 15.6 4.5
Chronic Liver Dis/Cirrhosis ICD-10: K70, K73-K74 102013 2,656 2,459 144 51 13.7 16.3 4.5
-2003 2,238 2,049 176 12 13.1 14.9 6.6
Influenza and Pneumonia ICD-10: J09-J18 112013 2,644 2,260 325 57 13.7 14.9 10.1
-2003 2,985 2,687 283 15 17.5 19.5 10.7
Hypertension ICD-10: I10, I12, I15 122013 2,140 1,709 387 43 11.1 11.3 12.0
-2003 1,556 1,258 286 12 9.1 9.1 10.8
Septicemia ICD-10: A40-A41 132013 2,084 1,719 326 39 10.8 11.4 10.1
-2003 1,902 1,630 261 11 11.1 11.8 9.8
Parkinsons Disease ICD-10: G20-G21 142013 1,932 1,817 86 29 10.0 12.0 2.7
-2003 1,381 1,334 40 5 8.1 9.7 1.5
Benign Neoplasms ICD-10: D00-D48 152013 1,145 1,028 85 30 5.9 6.8 2.6
-2003 1,004 526 464 12 5.9 3.8 17.5
Homicide ICD-10: X85-Y09, Y87.1 162013 1,143 521 567 48 5.9 3.4 17.7
-2003 1,009 930 72 7 5.9 6.8 2.7
Pneumonitis ICD-10: J69 172013 1,007 898 87 19 5.2 5.9 2.7
-2003 1,120 1,030 85 5 6.6 7.5 3.2
HIV ICD-10: B20-B24 182013 935 365 553 15 4.8 2.4 17.2
-2003 1,742 672 1,061 6 10.2 4.9 40.0
Perinatal Period Conditions ICD-10: P00-P96 192013 681 336 296 47 3.5 2.2 9.2
-2003 1,069 994 70 5 6.3 7.2 2.6
Aortic Aneurysm & Dissection ICD-10: I71 202013 680 593 69 18 3.5 3.9 2.1
-2003 789 422 352 13 4.6 3.1 13.3
Atherosclerosis ICD-10: I70 212013 599 547 44 8 3.1 3.6 1.4
-2003 965 886 75 4 5.7 6.4 2.8
Viral Hepatitis ICD-10: B15-B19 222013 587 507 66 12 3.0 3.4 2.1
-2003 503 442 56 5 2.9 3.2 2.1
Congenital Malformations ICD-10: Q00-Q99 232013 503 364 123 16 2.6 2.4 3.8
-2003 551 417 127 6 3.2 3.0 4.8
Anemias ICD-10: D50-D64 242013 314 234 74 6 1.6 1.5 2.3
-2003 306 222 81 3 1.8 1.6 3.1
Med/Surg Comp ICD-10: Y40-Y84,Y88 252013 195 154 37 4 1.0 1.0 1.2
-2003 127 112 13 2 0.7 0.8 0.5
* ICD-10 codes associated with each cause of death group are presented on pages (xvii-xix).
FLORIDA VITAL STATISTICS ANNUAL REPORT 2013 75
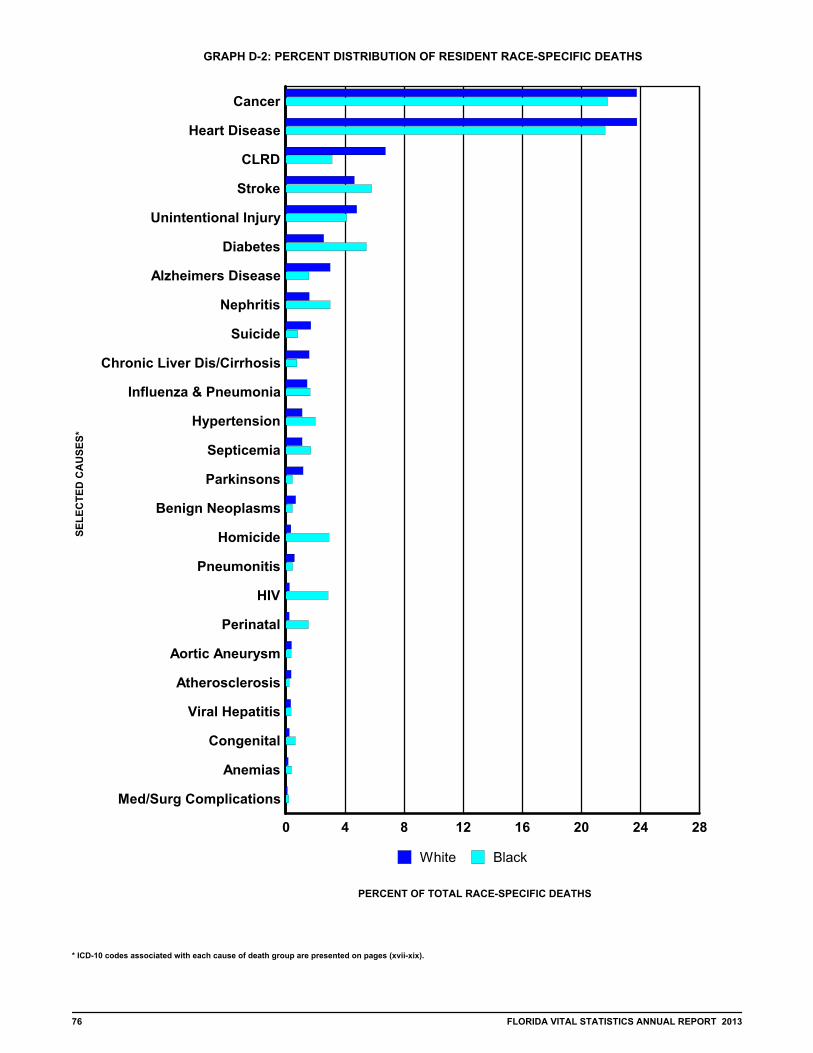
GRAPH D-2: PERCENT DISTRIBUTION OF RESIDENT RACE-SPECIFIC DEATHS
FOR SELECTED LEADING CAUSES, FLORIDA, 2013S
EL
EC
TE
D C
AU
SE
S*
* ICD-10 codes associated with each cause of death group are presented on pages (xvii-xix).
0 4 8 12 16 20 24 28
Cancer
Heart Disease
CLRD
Stroke
Unintentional Injury
Diabetes
Alzheimers Disease
Nephritis
Suicide
Chronic Liver Dis/Cirrhosis
Influenza & Pneumonia
Hypertension
Septicemia
Parkinsons
Benign Neoplasms
Homicide
Pneumonitis
HIV
Perinatal
Aortic Aneurysm
Atherosclerosis
Viral Hepatitis
Congenital
Anemias
Med/Surg Complications
White Black
PERCENT OF TOTAL RACE-SPECIFIC DEATHS
76 FLORIDA VITAL STATISTICS ANNUAL REPORT 2013
ICD-10 CODES
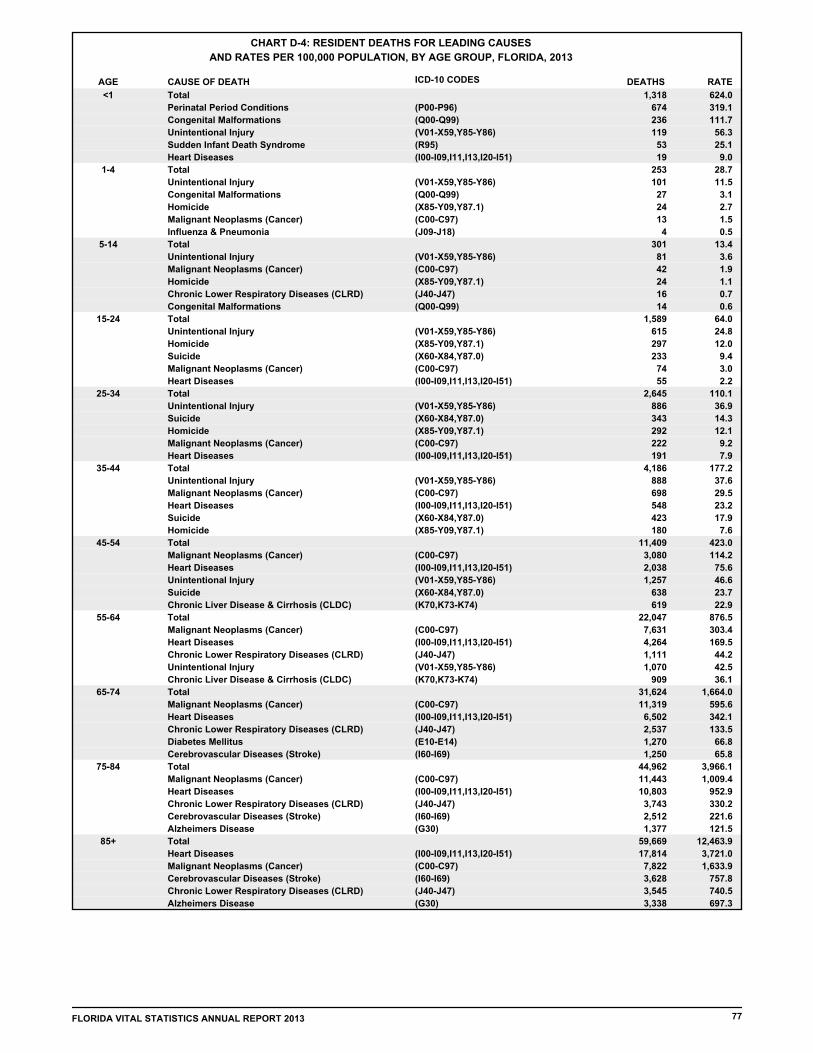
CHART D-4: RESIDENT DEATHS FOR LEADING CAUSES
AND RATES PER 100,000 POPULATION, BY AGE GROUP, FLORIDA, 2013
AGE CAUSE OF DEATH RATEDEATHS
1,318 624.0Total<1
674 319.1Perinatal Period Conditions (P00-P96)
236 111.7Congenital Malformations (Q00-Q99)
119 56.3Unintentional Injury (V01-X59,Y85-Y86)
53 25.1Sudden Infant Death Syndrome (R95)
19 9.0Heart Diseases (I00-I09,I11,I13,I20-I51)
253 28.7Total1-4
101 11.5Unintentional Injury (V01-X59,Y85-Y86)
27 3.1Congenital Malformations (Q00-Q99)
24 2.7Homicide (X85-Y09,Y87.1)
13 1.5Malignant Neoplasms (Cancer) (C00-C97)
4 0.5Influenza & Pneumonia (J09-J18)
301 13.4Total5-14
81 3.6Unintentional Injury (V01-X59,Y85-Y86)
42 1.9Malignant Neoplasms (Cancer) (C00-C97)
24 1.1Homicide (X85-Y09,Y87.1)
16 0.7Chronic Lower Respiratory Diseases (CLRD) (J40-J47)
14 0.6Congenital Malformations (Q00-Q99)
1,589 64.0Total15-24
615 24.8Unintentional Injury (V01-X59,Y85-Y86)
297 12.0Homicide (X85-Y09,Y87.1)
233 9.4Suicide (X60-X84,Y87.0)
74 3.0Malignant Neoplasms (Cancer) (C00-C97)
55 2.2Heart Diseases (I00-I09,I11,I13,I20-I51)
2,645 110.1Total25-34
886 36.9Unintentional Injury (V01-X59,Y85-Y86)
343 14.3Suicide (X60-X84,Y87.0)
292 12.1Homicide (X85-Y09,Y87.1)
222 9.2Malignant Neoplasms (Cancer) (C00-C97)
191 7.9Heart Diseases (I00-I09,I11,I13,I20-I51)
4,186 177.2Total35-44
888 37.6Unintentional Injury (V01-X59,Y85-Y86)
698 29.5Malignant Neoplasms (Cancer) (C00-C97)
548 23.2Heart Diseases (I00-I09,I11,I13,I20-I51)
423 17.9Suicide (X60-X84,Y87.0)
180 7.6Homicide (X85-Y09,Y87.1)
11,409 423.0Total45-54
3,080 114.2Malignant Neoplasms (Cancer) (C00-C97)
2,038 75.6Heart Diseases (I00-I09,I11,I13,I20-I51)
1,257 46.6Unintentional Injury (V01-X59,Y85-Y86)
638 23.7Suicide (X60-X84,Y87.0)
619 22.9Chronic Liver Disease & Cirrhosis (CLDC) (K70,K73-K74)
22,047 876.5Total55-64
7,631 303.4Malignant Neoplasms (Cancer) (C00-C97)
4,264 169.5Heart Diseases (I00-I09,I11,I13,I20-I51)
1,111 44.2Chronic Lower Respiratory Diseases (CLRD) (J40-J47)
1,070 42.5Unintentional Injury (V01-X59,Y85-Y86)
909 36.1Chronic Liver Disease & Cirrhosis (CLDC) (K70,K73-K74)
31,624 1,664.0Total65-74
11,319 595.6Malignant Neoplasms (Cancer) (C00-C97)
6,502 342.1Heart Diseases (I00-I09,I11,I13,I20-I51)
2,537 133.5Chronic Lower Respiratory Diseases (CLRD) (J40-J47)
1,270 66.8Diabetes Mellitus (E10-E14)
1,250 65.8Cerebrovascular Diseases (Stroke) (I60-I69)
44,962 3,966.1Total75-84
11,443 1,009.4Malignant Neoplasms (Cancer) (C00-C97)
10,803 952.9Heart Diseases (I00-I09,I11,I13,I20-I51)
3,743 330.2Chronic Lower Respiratory Diseases (CLRD) (J40-J47)
2,512 221.6Cerebrovascular Diseases (Stroke) (I60-I69)
1,377 121.5Alzheimers Disease (G30)
59,669 12,463.9Total85+
17,814 3,721.0Heart Diseases (I00-I09,I11,I13,I20-I51)
7,822 1,633.9Malignant Neoplasms (Cancer) (C00-C97)
3,628 757.8Cerebrovascular Diseases (Stroke) (I60-I69)
3,545 740.5Chronic Lower Respiratory Diseases (CLRD) (J40-J47)
3,338 697.3Alzheimers Disease (G30)
FLORIDA VITAL STATISTICS ANNUAL REPORT 2013 77

GRAPH D-3: RESIDENT HEART DISEASE DEATH RATES PER 100,000 POPULATION,
BY RACE AND GENDER, FLORIDA, 2003-2013
0
50
100
150
200
250
300
350
2003 2004 2005 2006 2007 2008 2009 2010 2011 2012 2013
TotalWhite MaleWhite FemaleBlack MaleBlack Female
YEAR
RA
TE
CHART D-5: RESIDENT HEART DISEASE DEATHS AND RATES PER 100,000 POPULATION,BY RACE AND GENDER, FLORIDA, CENSUS YEARS 1970-2000 AND 2003-2013
1,2OTHER
MALE FEMALE TOTAL
AADRBLACK
RATES PER 100,000 POPULATION
FEMALE FEMALE
BLACKWHITEWHITE
NUMBER OF DEATHS
MALEMALETOTALFEMALEMALEFEMALEMALETOTALYEAR
1970 26,941 14,837 9,295 1,483 1,269 232.6 295.7 311.5 531.4 393.2 405.6 14 3
1980 38,773 20,560 14,999 1,640 1,539 214.4 252.7 344.2 509.9 394.0 351.5 19 8
1990 45,437 22,208 19,494 1,833 1,826 195.1 214.4 343.1 414.5 348.7 286.5 49 17
2000 50,016 22,911 22,556 2,060 2,254 174.6 172.2 334.7 354.6 311.1 235.9 96 62
2003 48,129 22,392 21,088 2,132 2,282 165.7 167.4 300.4 331.7 281.9 210.7 124 106
2004 46,839 21,846 20,441 2,131 2,179 153.5 162.3 285.7 316.9 268.0 196.5 127 98
2005 45,992 21,515 19,837 2,083 2,100 143.4 153.9 272.3 306.1 257.3 189.3 231 204
2006 43,968 20,659 18,809 2,041 2,011 133.3 146.2 254.3 289.3 241.1 175.3 238 205
2007 41,956 19,757 17,677 2,038 2,030 131.6 142.7 236.6 273.5 226.8 163.8 269 181
2008 41,931 19,802 17,622 2,069 1,958 124.9 142.5 234.9 273.3 225.0 158.0 272 195
2009 41,202 19,886 16,694 2,130 1,983 125.3 145.2 222.2 274.4 220.2 152.8 273 226
2010 41,241 19,899 16,728 2,109 1,937 121.1 142.2 221.9 273.5 219.1 158.3 304 237
2011 40,522 19,622 16,478 1,967 1,923 119.0 131.0 217.9 268.6 214.0 153.0 253 205
2012 41,643 19,941 16,902 2,160 2,083 127.6 142.3 222.4 272.0 218.7 155.3 293 246
2013 42,249 20,415 16,934 2,176 2,023 121.5 140.6 220.0 274.9 218.7 153.4 321 339
1. Age-Adjusted Death Rates (AADR) for 1970-2013 use the 2000 estimated standard million population.
2. ICD Revision Used: 1970 (ICD-8), 1980-1998 (ICD-9), and 1999-2013 (ICD-10).
78 FLORIDA VITAL STATISTICS ANNUAL REPORT 2013

GRAPH D-4: RESIDENT MALIGNANT NEOPLASM (CANCER) DEATH RATES PER 100,000
POPULATION, BY RACE AND GENDER, FLORIDA, 2003-2013
0
40
80
120
160
200
240
280
320
2003 2004 2005 2006 2007 2008 2009 2010 2011 2012 2013
TotalWhite Male
White FemaleBlack MaleBlack Female
YEAR
RA
TE
CHART D-6: RESIDENT MALIGNANT NEOPLASM (CANCER) DEATHS AND RATES PER 100,000
POPULATION, BY RACE AND GENDER, FLORIDA, CENSUS YEARS 1970-2000 AND 2003-2013
1,2OTHER
MALE FEMALE TOTAL
AADRBLACK
RATES PER 100,000 POPULATION
FEMALE FEMALE
BLACKWHITEWHITE
NUMBER OF DEATHS
MALEMALETOTALFEMALEMALEFEMALEMALETOTALYEAR
1970 13,709 7,081 5,123 909 581 4 2 192.3 200.1 253.6 171.7 181.2 106.5
1980 23,762 12,201 9,317 1,347 862 15 12 202.8 241.5 302.6 213.8 207.5 120.1
1990 33,541 16,588 13,786 1,805 1,279 47 29 208.0 257.4 309.6 242.6 211.2 136.7
2000 38,622 18,815 16,023 1,906 1,638 81 85 187.8 240.3 291.2 237.7 159.3 126.9
2003 39,238 19,094 16,230 1,910 1,778 106 112 177.5 229.8 282.8 231.2 150.0 129.1
2004 39,502 19,104 16,355 1,994 1,768 116 151 176.2 226.0 277.1 228.6 151.9 124.5
2005 40,321 19,539 16,479 2,029 1,714 267 264 174.7 225.6 278.0 226.2 149.9 117.0
2006 40,081 19,536 16,322 1,987 1,753 211 265 168.6 219.8 273.5 220.6 142.4 116.2
2007 39,790 19,110 16,332 2,084 1,741 266 249 163.8 215.1 264.6 218.6 145.9 112.9
2008 40,549 19,610 16,418 2,091 1,850 263 309 164.0 217.6 270.7 218.8 144.0 118.0
2009 40,817 19,592 16,695 2,066 1,859 293 304 162.9 218.1 270.3 222.2 140.8 117.4
2010 40,883 19,611 16,630 2,112 1,906 326 285 161.2 217.2 269.5 220.6 142.4 119.1
2011 41,221 19,704 16,643 2,134 1,988 331 338 159.9 217.7 269.7 220.1 142.1 123.0
2012 41,696 20,041 16,805 2,207 1,919 336 370 160.3 219.0 273.4 221.1 145.4 117.5
2013 42,350 20,311 17,021 2,223 2,009 372 385 158.7 219.2 273.5 221.1 143.6 120.7
1. Age-Adjusted Death Rates (AADR) for 1970-2013 use the 2000 estimated standard million population.
2. ICD Revision Used: 1970 (ICD-8), 1980-1998 (ICD-9), and 1999-2013 (ICD-10).
FLORIDA VITAL STATISTICS ANNUAL REPORT 2013 79

0
10
20
30
40
50
60
70
80
2003 2004 2005 2006 2007 2008 2009 2010 2011 2012 2013
TotalWhite MaleWhite FemaleBlack MaleBlack Female
YEAR
RA
TE
GRAPH D-5: RESIDENT CEREBROVASULAR DISEASES (STROKE) DEATH RATES PER 100,000
POPULATION, BY RACE AND GENDER, FLORIDA, 2003-2013
CHART D-7: RESIDENT CEREBROVASCULAR DISEASES (STROKE) DEATHS AND RATES PER 100,000
POPULATION BY RACE AND GENDER, FLORIDA, CENSUS YEARS 1970-2000 AND 2003-2013
1,2OTHER
MALE FEMALE TOTAL
AADRBLACK
RATES PER 100,000 POPULATION
FEMALE FEMALE
BLACKWHITEWHITE
NUMBER OF DEATHS
MALEMALETOTALFEMALEMALEFEMALEMALETOTALYEAR
8,541 1970 3,497 3,814 570 642 4 3 138.0 124.7 125.3 127.8 113.6 117.7
9,192 1980 3,546 4,552 505 581 2 3 87.3 93.4 87.9 104.4 77.8 81.0
8,416 1990 3,115 4,309 428 542 6 15 53.5 64.6 58.1 75.8 50.1 57.9
10,381 2000 3,865 5,317 487 657 24 24 48.6 64.6 59.8 78.9 40.7 50.9
9,873 2003 3,587 4,946 527 711 44 56 42.9 57.8 53.1 70.5 41.4 51.6
9,661 2004 3,456 4,941 541 650 31 39 40.4 55.3 50.1 69.1 41.2 45.8
9,321 2005 3,378 4,581 538 679 60 81 38.2 52.1 48.1 62.9 39.8 46.4
8,864 2006 3,170 4,319 503 728 71 72 35.3 48.6 44.4 58.4 36.0 48.2
8,715 2007 3,119 4,312 515 649 48 70 33.9 47.1 43.2 57.7 36.1 42.1
8,472 2008 3,067 4,186 506 592 60 58 31.9 45.5 42.3 55.8 34.8 37.8
8,385 2009 3,018 4,154 459 609 64 79 30.9 44.8 41.6 55.3 31.3 38.5
8,324 2010 2,961 4,123 470 605 64 95 32.0 44.2 40.7 54.7 31.7 37.8
8,327 2011 2,999 4,082 489 595 68 85 31.5 44.0 41.1 54.0 32.6 36.8
8,372 2012 2,905 4,175 491 617 78 103 31.2 44.0 39.6 54.9 32.4 37.8
8,611 2013 3,163 4,110 542 587 75 121 31.3 44.6 42.6 53.4 35.0 35.3
1. Age-Adjusted Death Rates (AADR) for 1970-2013 use the 2000 estimated standard million population.
2. ICD Revision Used: 1970 (ICD-8), 1980-1998 (ICD-9), and 1999-2013 (ICD-10).
80 FLORIDA VITAL STATISTICS ANNUAL REPORT 2013

0
10
20
30
40
50
60
70
80
2003 2004 2005 2006 2007 2008 2009 2010 2011 2012 2013
TotalWhite MaleWhite FemaleBlack MaleBlack Female
YEAR
RA
TE
GRAPH D-6: RESIDENT CHRONIC LOWER RESPIRATORY DISEASE (CLRD) DEATH RATES
PER 100,000 POPULATION, BY RACE AND GENDER, FLORIDA, 2003-2013
CHART D-8: RESIDENT CHRONIC LOWER RESPIRATORY DISEASE (CLRD) DEATHS AND RATES PER 100,000 POPULATION, BY RACE AND GENDER, FLORIDA, CENSUS YEARS 1970-2000 AND 2003-2013
1,2
TOTAL
OTHER
MALE FEMALE TOTAL
AADRBLACK
RATES PER 100,000 POPULATION
FEMALE FEMALE
BLACKWHITEWHITE
NUMBER OF DEATHS
MALEMALETOTALFEMALEMALEFEMALEMALEYEAR
1,555 1,119 303 92 40 0 0 21.1 22.7 40.1 10.2 18.3 7.3 1970
3,319 2,138 979 162 38 2 0 27.4 33.7 53.0 22.5 25.0 5.3 1980
5,660 2,901 2,429 235 90 3 2 33.6 43.4 54.1 42.7 27.5 9.6 1990
8,605 3,883 4,262 250 180 8 9 39.9 53.5 60.1 63.2 20.9 13.9 2000
9,030 4,020 4,533 269 175 16 12 39.0 52.9 59.5 64.6 21.1 12.7 2003
8,931 3,885 4,607 264 144 17 12 37.8 51.1 56.4 64.4 20.1 10.1 2004
9,454 4,206 4,713 297 187 23 22 39.0 52.9 59.8 64.7 21.9 12.8 2005
8,869 3,890 4,488 245 188 35 21 35.5 48.6 54.5 60.7 17.6 12.5 2006
9,317 4,161 4,651 260 192 21 31 36.5 50.4 57.6 62.2 18.2 12.4 2007
10,154 4,519 5,045 285 232 36 36 38.8 54.5 62.4 67.2 19.6 14.8 2008
10,163 4,459 5,104 291 230 43 32 38.3 54.3 61.5 67.9 19.8 14.5 2009
10,268 4,560 5,120 275 223 47 38 39.3 54.6 62.7 67.9 18.5 13.9 2010
10,241 4,607 5,024 309 210 48 35 38.6 54.1 63.1 66.4 20.6 13.0 2011
10,525 4,664 5,222 296 254 46 40 39.1 55.3 63.6 68.7 19.5 15.6 2012
11,328 4,965 5,629 325 282 70 53 41.0 58.6 66.9 73.1 21.0 16.9 2013
1. Age-Adjusted Death Rates (AADR) for 1970-2013 use the 2000 estimated standard million population.
2. ICD Revision Used: 1970 (ICD-8), 1980-1998 (ICD-9), and 1999-2013 (ICD-10).
FLORIDA VITAL STATISTICS ANNUAL REPORT 2013 81
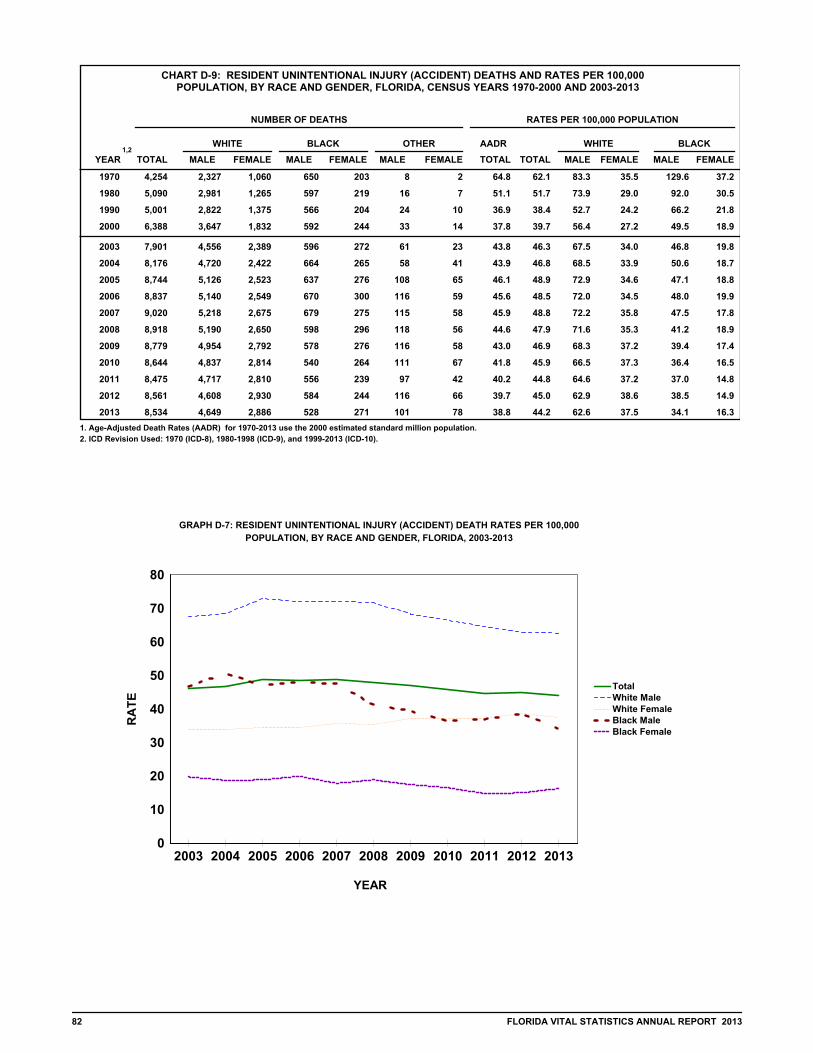
GRAPH D-7: RESIDENT UNINTENTIONAL INJURY (ACCIDENT) DEATH RATES PER 100,000
POPULATION, BY RACE AND GENDER, FLORIDA, 2003-2013
0
10
20
30
40
50
60
70
80
2003 2004 2005 2006 2007 2008 2009 2010 2011 2012 2013
TotalWhite MaleWhite FemaleBlack MaleBlack Female
YEAR
RA
TE
CHART D-9: RESIDENT UNINTENTIONAL INJURY (ACCIDENT) DEATHS AND RATES PER 100,000 POPULATION, BY RACE AND GENDER, FLORIDA, CENSUS YEARS 1970-2000 AND 2003-2013
1,2
TOTAL
OTHER
MALE FEMALE TOTAL
AADRBLACK
RATES PER 100,000 POPULATION
FEMALE FEMALE
BLACKWHITEWHITE
NUMBER OF DEATHS
MALEMALETOTALFEMALEMALEFEMALEMALEYEAR
64.8 1970 4,254 2,327 1,060 650 203 8 2 62.1 83.3 35.5 129.6 37.2
51.1 1980 5,090 2,981 1,265 597 219 16 7 51.7 73.9 29.0 92.0 30.5
36.9 1990 5,001 2,822 1,375 566 204 24 10 38.4 52.7 24.2 66.2 21.8
37.8 2000 6,388 3,647 1,832 592 244 33 14 39.7 56.4 27.2 49.5 18.9
43.8 2003 7,901 4,556 2,389 596 272 61 23 46.3 67.5 34.0 46.8 19.8
43.9 2004 8,176 4,720 2,422 664 265 58 41 46.8 68.5 33.9 50.6 18.7
46.1 2005 8,744 5,126 2,523 637 276 108 65 48.9 72.9 34.6 47.1 18.8
45.6 2006 8,837 5,140 2,549 670 300 116 59 48.5 72.0 34.5 48.0 19.9
45.9 2007 9,020 5,218 2,675 679 275 115 58 48.8 72.2 35.8 47.5 17.8
44.6 2008 8,918 5,190 2,650 598 296 118 56 47.9 71.6 35.3 41.2 18.9
43.0 2009 8,779 4,954 2,792 578 276 116 58 46.9 68.3 37.2 39.4 17.4
41.8 2010 8,644 4,837 2,814 540 264 111 67 45.9 66.5 37.3 36.4 16.5
40.2 2011 8,475 4,717 2,810 556 239 97 42 44.8 64.6 37.2 37.0 14.8
39.7 2012 8,561 4,608 2,930 584 244 116 66 45.0 62.9 38.6 38.5 14.9
38.8 2013 8,534 4,649 2,886 528 271 101 78 44.2 62.6 37.5 34.1 16.3
1. Age-Adjusted Death Rates (AADR) for 1970-2013 use the 2000 estimated standard million population.
2. ICD Revision Used: 1970 (ICD-8), 1980-1998 (ICD-9), and 1999-2013 (ICD-10).
82 FLORIDA VITAL STATISTICS ANNUAL REPORT 2013

CHART D-10: RESIDENT HUMAN IMMUNODEFICIENCY VIRUS (HIV) DEATHS AND RATES PER 100,000
POPULATION, BY RACE AND GENDER, FLORIDA, CENSUS YEARS 1990 AND 2000 AND 2003-2013
1,2
TOTAL
OTHER
MALE FEMALE TOTAL
AADRBLACK
RATES PER 100,000 POPULATION
FEMALE FEMALE
BLACKWHITEWHITE
NUMBER OF DEATHS
MALEMALETOTALFEMALEMALEFEMALEMALEYEAR
1990 2,239 1,255 94 621 264 5 0 17.9 17.2 23.4 1.7 72.6 28.2
2000 1,809 619 127 632 428 0 0 11.4 11.3 9.6 1.9 52.8 33.2
2003 1,742 574 97 636 425 5 1 10.3 10.2 8.5 1.4 49.9 30.9
2004 1,714 542 108 610 444 5 4 10.0 9.8 7.9 1.5 46.5 31.3
2005 1,706 532 136 590 407 27 12 9.7 9.5 7.6 1.9 43.6 27.8
2006 1,746 527 117 640 437 16 8 9.6 9.6 7.4 1.6 45.9 29.0
2007 1,526 456 116 542 396 14 2 8.3 8.2 6.3 1.6 37.9 25.7
2008 1,412 420 102 547 324 14 2 7.5 7.6 5.8 1.4 37.7 20.7
2009 1,232 375 98 445 300 10 4 6.5 6.6 5.2 1.3 30.3 19.0
2010 1,066 322 83 397 249 9 6 5.4 5.7 4.4 1.1 26.8 15.6
2011 1,005 290 82 367 251 9 5 5.1 5.3 4.0 1.1 24.4 15.5
2012 923 264 58 329 264 4 4 4.6 4.8 3.6 0.8 21.7 16.2
2013 935 291 74 330 223 9 6 4.5 4.8 3.9 1.0 21.3 13.4
1. Age-Adjusted Death Rates (AADR) for 1990-2013 use the 2000 estimated standard million population.
2. ICD Revision Used: 1980-1998 (ICD-9), and 1999-2013 (ICD-10).
GRAPH D-8: RESIDENT HUMAN IMMUNODEFICIENCY VIRUS (HIV) DEATH RATES PER 100,000
POPULATION, BY RACE AND GENDER, FLORIDA, 2003-2013
0
10
20
30
40
50
60
70
2003 2004 2005 2006 2007 2008 2009 2010 2011 2012 2013
Total
White Male
White Female
Black MaleBlack Female
YEAR
RA
TE
FLORIDA VITAL STATISTICS ANNUAL REPORT 2013 83

CHART D-11: RESIDENT INFLUENZA & PNEUMONIA DEATHS AND RATES PER 100,000 POPULATION,BY RACE AND GENDER, FLORIDA, CENSUS YEARS 1970-2000 AND 2003-2013
1,2
TOTAL
OTHER
MALE FEMALE TOTAL
AADRBLACK
RATES PER 100,000 POPULATION
FEMALE FEMALE
BLACKWHITEWHITE
NUMBER OF DEATHS
MALEMALETOTALFEMALEMALEFEMALEMALEYEAR
1970 2,361 1,048 786 341 182 1 0 37.0 34.5 37.5 26.3 68.0 33.4
1980 2,164 1,015 859 192 96 1 1 21.3 22.0 25.2 19.7 29.6 13.4
1990 3,476 1,566 1,569 183 146 6 4 22.7 26.7 29.2 27.6 21.4 15.6
2000 3,336 1,426 1,600 143 145 10 5 15.7 20.8 22.1 23.7 12.0 11.2
2003 2,985 1,285 1,402 162 121 9 6 13.1 17.5 19.0 20.0 12.7 8.8
2004 3,025 1,328 1,403 146 132 4 12 12.7 17.3 19.3 19.6 11.1 9.3
2005 2,787 1,195 1,294 137 135 12 13 11.5 15.6 17.0 17.8 10.1 9.2
2006 2,424 1,102 1,056 114 123 12 17 9.7 13.3 15.4 14.3 8.2 8.2
2007 2,221 964 995 107 130 12 13 8.6 12.0 13.3 13.3 7.5 8.4
2008 2,288 995 1,037 98 127 13 18 8.6 12.3 13.7 13.8 6.7 8.1
2009 2,405 1,091 1,030 129 120 12 19 9.2 12.9 15.1 13.7 8.8 7.6
2010 2,217 1,000 926 126 138 16 9 8.6 11.8 13.7 12.3 8.5 8.6
2011 2,418 1,092 1,051 129 111 12 17 9.2 12.8 14.9 13.9 8.6 6.9
2012 2,304 1,061 955 112 129 29 18 8.6 12.1 14.5 12.6 7.4 7.9
2013 2,644 1,132 1,128 154 171 31 26 9.7 13.7 15.2 14.7 10.0 10.3
1. Age-Adjusted Death Rates (AADR) for 1970-2013 use the 2000 estimated standard million population.
2. ICD Revision Used: 1970 (ICD-8), 1980-1998 (ICD-9), and 1999-2013 (ICD-10).
GRAPH D-9: RESIDENT INFLUENZA AND PNUEMONIA DEATH RATES PER 100,000 POPULATION, BY RACE AND
GENDER, FLORIDA, 2003-2013
0
5
10
15
20
25
2003 2004 2005 2006 2007 2008 2009 2010 2011 2012 2013
TotalWhite MaleWhite FemaleBlack MaleBlack Female
YEAR
RA
TE
84 FLORIDA VITAL STATISTICS ANNUAL REPORT 2013

GRAPH D-10: RESIDENT DIABETES MELLITUS DEATH RATES PER 100,000 POPULATION, BY RACE AND
GENDER, FLORIDA, 2003-2013
0
5
10
15
20
25
30
35
40
2003 2004 2005 2006 2007 2008 2009 2010 2011 2012 2013
TotalWhite MaleWhite FemaleBlack MaleBlack Female
YEAR
RA
TE
CHART D-12: RESIDENT DIABETES MELLITUS DEATHS AND RATES PER 100,000 POPULATION,BY RACE AND GENDER, FLORIDA, CENSUS YEARS 1970-2000 AND 2003-2013
1,2
TOTAL
OTHER
MALE FEMALE TOTAL
AADRBLACK
RATES PER 100,000 POPULATION
FEMALE FEMALE
BLACKWHITEWHITE
NUMBER OF DEATHS
MALEMALETOTALFEMALEMALEFEMALEMALEYEAR
1970 1,265 503 486 91 182 1 1 18.3 18.5 18.0 16.3 18.1 33.4
1980 1,618 643 683 96 194 1 1 14.2 16.4 15.9 15.7 14.8 27.0
1990 2,952 1,235 1,199 171 335 7 3 18.4 22.7 23.0 21.1 20.0 35.8
2000 4,463 1,995 1,658 300 477 19 7 21.5 27.8 30.9 24.6 25.1 36.9
2003 4,754 2,127 1,715 364 511 11 25 21.4 27.8 31.5 24.4 28.6 37.1
2004 4,790 2,145 1,699 379 527 23 16 21.2 27.4 31.1 23.7 28.9 37.1
2005 5,181 2,294 1,902 388 510 49 37 22.2 29.0 32.6 26.1 28.7 34.8
2006 5,137 2,335 1,806 401 521 43 30 21.4 28.2 32.7 24.4 28.7 34.5
2007 5,092 2,285 1,780 444 487 52 43 20.9 27.5 31.6 23.8 31.1 31.6
2008 5,154 2,306 1,827 416 506 50 46 20.7 27.7 31.8 24.3 28.6 32.3
2009 4,899 2,297 1,635 414 469 44 37 19.5 26.2 31.7 21.8 28.2 29.6
2010 4,992 2,262 1,729 418 482 62 38 19.7 26.5 31.1 22.9 28.2 30.1
2011 5,044 2,233 1,725 442 528 55 53 19.6 26.6 30.6 22.8 29.4 32.7
2012 5,064 2,324 1,678 445 505 57 54 19.6 26.6 31.7 22.1 29.3 30.9
2013 5,209 2,336 1,687 506 552 76 50 19.6 27.0 31.5 21.9 32.7 33.2
1. Age-Adjusted Death Rates (AADR) for 1970-2013 use the 2000 estimated standard million population.
2. ICD Revision Used: 1970 (ICD-8), 1980-1998 (ICD-9), and 1999-2013 (ICD-10).
FLORIDA VITAL STATISTICS ANNUAL REPORT 2013 85

GRAPH D-11: RESIDENT SUICIDE DEATH RATES PER 100,000 POPULATION, BY RACE AND GENDER,
FLORIDA, 2003-2013
0
4
8
12
16
20
24
28
32
2003 2004 2005 2006 2007 2008 2009 2010 2011 2012 2013
TotalWhite MaleWhite FemaleBlack MaleBlack Female
YEAR
RA
TE
CHART D-13: RESIDENT SUICIDE DEATHS AND RATES PER 100,000 POPULATION,BY RACE AND GENDER, FLORIDA, CENSUS YEARS 1970-2000 AND 2003-2013
1,2
TOTAL
OTHER
MALE FEMALE TOTAL
AADRBLACK
RATES PER 100,000 POPULATION
FEMALE FEMALE
BLACKWHITEWHITE
NUMBER OF DEATHS
MALEMALETOTALFEMALEMALEFEMALEMALEYEAR
16.4 1,028 1970 643 338 28 15 0 2 15.0 23.0 11.3 5.6 2.7
15.2 1,522 1980 1,027 429 52 9 3 1 15.5 25.5 9.8 8.0 1.3
15.3 2,073 1990 1,554 395 97 20 4 3 15.9 29.0 7.0 11.3 2.1
12.6 2,136 2000 1,556 419 126 19 10 2 13.3 24.1 6.2 10.5 1.5
12.8 2,294 2003 1,677 474 100 18 20 4 13.4 24.8 6.8 7.9 1.3
13.0 2,382 2004 1,686 560 91 20 13 10 13.6 24.5 7.8 6.9 1.4
12.3 2,308 2005 1,620 520 102 23 28 15 12.9 23.1 7.1 7.5 1.6
12.4 2,410 2006 1,746 515 80 13 35 21 13.2 24.4 7.0 5.7 0.9
13.1 2,570 2007 1,845 539 102 25 42 17 13.9 25.5 7.2 7.1 1.6
13.8 2,723 2008 1,976 580 107 16 31 12 14.6 27.3 7.7 7.4 1.0
14.5 2,854 2009 2,063 567 133 32 40 19 15.3 28.5 7.5 9.1 2.0
13.5 2,753 2010 1,999 575 97 25 44 12 14.6 27.5 7.6 6.5 1.6
13.5 2,765 2011 2,014 557 121 17 45 11 14.6 27.6 7.4 8.1 1.1
14.2 2,922 2012 2,022 663 140 25 51 21 15.3 27.6 8.7 9.2 1.5
13.8 2,892 2013 2,012 636 124 32 64 16 15.0 27.1 8.3 8.0 1.9
1. Age-Adjusted Death Rates (AADR) for 1970-2013 use the 2000 estimated standard million population.
2. ICD Revision Used: 1970 (ICD-8), 1980-1998 (ICD-9), and 1999-2013 (ICD-10).
86 FLORIDA VITAL STATISTICS ANNUAL REPORT 2013
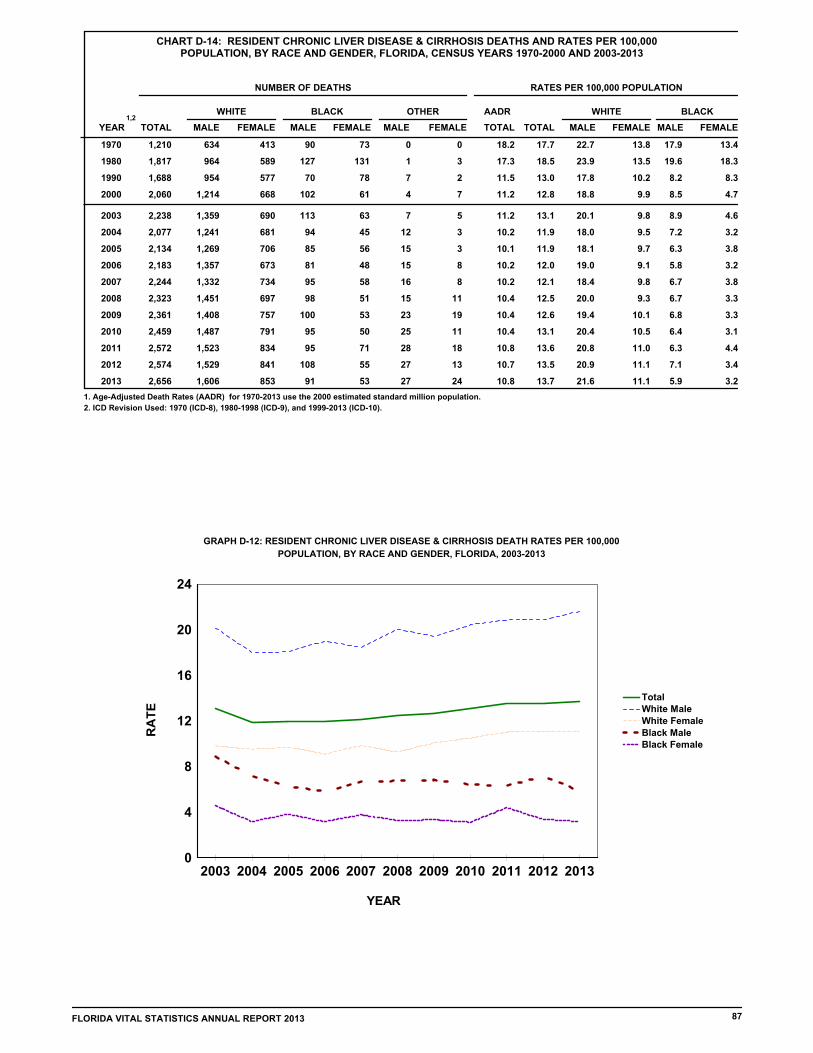
GRAPH D-12: RESIDENT CHRONIC LIVER DISEASE & CIRRHOSIS DEATH RATES PER 100,000
POPULATION, BY RACE AND GENDER, FLORIDA, 2003-2013
0
4
8
12
16
20
24
2003 2004 2005 2006 2007 2008 2009 2010 2011 2012 2013
TotalWhite MaleWhite FemaleBlack MaleBlack Female
YEAR
RA
TE
CHART D-14: RESIDENT CHRONIC LIVER DISEASE & CIRRHOSIS DEATHS AND RATES PER 100,000 POPULATION, BY RACE AND GENDER, FLORIDA, CENSUS YEARS 1970-2000 AND 2003-2013
1,2
TOTAL
OTHER
MALE FEMALE TOTAL
AADRBLACK
RATES PER 100,000 POPULATION
FEMALE FEMALE
BLACKWHITEWHITE
NUMBER OF DEATHS
MALEMALETOTALFEMALEMALEFEMALEMALEYEAR
1,210 1970 634 413 90 73 0 0 18.2 17.7 22.7 13.8 17.9 13.4
1,817 1980 964 589 127 131 1 3 17.3 18.5 23.9 13.5 19.6 18.3
1,688 1990 954 577 70 78 7 2 11.5 13.0 17.8 10.2 8.2 8.3
2,060 2000 1,214 668 102 61 4 7 11.2 12.8 18.8 9.9 8.5 4.7
2,238 2003 1,359 690 113 63 7 5 11.2 13.1 20.1 9.8 8.9 4.6
2,077 2004 1,241 681 94 45 12 3 10.2 11.9 18.0 9.5 7.2 3.2
2,134 2005 1,269 706 85 56 15 3 10.1 11.9 18.1 9.7 6.3 3.8
2,183 2006 1,357 673 81 48 15 8 10.2 12.0 19.0 9.1 5.8 3.2
2,244 2007 1,332 734 95 58 16 8 10.2 12.1 18.4 9.8 6.7 3.8
2,323 2008 1,451 697 98 51 15 11 10.4 12.5 20.0 9.3 6.7 3.3
2,361 2009 1,408 757 100 53 23 19 10.4 12.6 19.4 10.1 6.8 3.3
2,459 2010 1,487 791 95 50 25 11 10.4 13.1 20.4 10.5 6.4 3.1
2,572 2011 1,523 834 95 71 28 18 10.8 13.6 20.8 11.0 6.3 4.4
2,574 2012 1,529 841 108 55 27 13 10.7 13.5 20.9 11.1 7.1 3.4
2,656 2013 1,606 853 91 53 27 24 10.8 13.7 21.6 11.1 5.9 3.2
1. Age-Adjusted Death Rates (AADR) for 1970-2013 use the 2000 estimated standard million population.
2. ICD Revision Used: 1970 (ICD-8), 1980-1998 (ICD-9), and 1999-2013 (ICD-10).
FLORIDA VITAL STATISTICS ANNUAL REPORT 2013 87

GRAPH D-13: RESIDENT HOMICIDE DEATH RATES PER 100,000 POPULATION, BY RACE AND GENDER,
FLORIDA, 2003-2013
0
5
10
15
20
25
30
35
40
2003 2004 2005 2006 2007 2008 2009 2010 2011 2012 2013
TotalWhite MaleWhite FemaleBlack MaleBlack Female
YEAR
RA
TE
CHART D-15: RESIDENT HOMICIDE DEATHS AND RATES PER 100,000 POPULATION,BY RACE AND GENDER, FLORIDA, CENSUS YEARS 1970-2000 AND 2003-2013
1,2
MALETOTAL
OTHER
MALE FEMALE TOTAL
AADRBLACK
RATES PER 100,000 POPULATION
FEMALE FEMALE
BLACKWHITEWHITE
NUMBER OF DEATHS
MALETOTALFEMALEMALEFEMALEMALEYEAR
1970 929 272 104 452 96 1 0 15.2 13.6 9.7 3.5 90.1 17.6
1980 1,504 648 199 531 119 3 3 16.0 15.3 16.1 4.6 81.8 16.6
1990 1,579 525 252 639 143 7 6 12.1 12.1 9.8 4.4 74.8 15.3
2000 956 344 167 356 77 4 3 6.2 5.9 5.3 2.5 29.8 6.0
2003 1,004 357 169 383 81 8 4 6.1 5.9 5.3 2.4 30.1 5.9
2004 1,030 348 186 383 96 11 1 6.1 5.9 5.0 2.6 29.2 6.8
2005 988 338 143 389 71 42 5 5.8 5.5 4.8 2.0 28.7 4.8
2006 1,211 449 186 459 80 22 14 6.9 6.6 6.3 2.5 32.9 5.3
2007 1,319 473 185 535 88 28 10 7.5 7.1 6.5 2.5 37.5 5.7
2008 1,301 458 192 531 85 27 8 7.4 7.0 6.3 2.6 36.6 5.4
2009 1,135 377 176 465 83 17 15 6.4 6.1 5.2 2.3 31.7 5.2
2010 1,096 404 161 422 83 14 10 6.1 5.8 5.6 2.1 28.5 5.2
2011 1,124 396 162 444 86 23 8 6.3 5.9 5.4 2.1 29.6 5.3
2012 1,195 399 162 520 84 16 13 6.6 6.3 5.4 2.1 34.3 5.1
2013 1,143 374 147 482 85 32 16 6.2 5.9 5.0 1.9 31.1 5.1
1. Age-Adjusted Death Rates (AADR) for 1970-2013 use the 2000 estimated standard million population.
2. ICD Revision Used: 1970 (ICD-8), 1980-1998 (ICD-9), and 1999-2013 (ICD-10).
88 FLORIDA VITAL STATISTICS ANNUAL REPORT 2013

GRAPH D-14: PERCENT DISTRIBUTION OF RESIDENT EXTERNAL CAUSES OF MORTALITY,
BY RACE, FLORIDA, 2013
0.0%
10.0%
20.0%
30.0%
40.0%
50.0%
60.0%
70.0%
Unintentional InjurySuicideHomicideOther
White
0.0%
10.0%
20.0%
30.0%
40.0%
50.0%
60.0%
Unintentional InjurySuicideHomicideOther
Black
*Other External category includes Legal Intervention, Undetermined Injury, War Operations & Sequelae, and
Medical & Surgical Care Complications.
Unintentional Injury
Suicide
Homicide
Other External*
White Black
Percent Distribution of Deaths Due to External Causes, 2013
69.0 %
24.0 %
5.0 %
3.0 %
51.0 %
10.0 %
36.0 %
4.0 %
Other
15.0 %
25.0 %
4.0 %
56.0 %
FLORIDA VITAL STATISTICS ANNUAL REPORT 2013 89

CHART D-16: RESIDENT MATERNAL DEATHS AND RATIOS
PER 100,000 LIVE BIRTHS, BY, RACE,
FLORIDA, CENSUS YEARS 1970-2000 AND 2003-2013
TOTAL WHITEWHITETOTALYEAR OTHERBLACK BLACK
21
RATIOSNUMBER OF DEATHS
21 14 0 50.8 24.2 30.4 35 1970
9 6 1 18.1 9.2 12.1 16 1980
9 13 0 28.0 6.0 11.0 22 1990
15 11 0 23.3 10.0 12.7 26 2000
7 15 1 31.8 4.4 10.8 23 2003
14 20 1 42.6 8.7 16.1 35 2004
33 14 5 29.2 19.9 23.0 52 2005
14 18 2 35.4 8.0 14.8 35 2006
28 17 3 33.0 16.0 20.1 48 2007
13 17 2 33.1 7.8 13.8 32 2008
38 20 0 39.6 23.9 26.2 58 2009
23 19 2 38.6 15.0 20.5 44 2010
20 25 2 51.2 13.2 22.0 47 2011
21 20 2 40.8 13.9 20.2 43 2012
39 20 5 41.0 25.4 29.7 64 2013
1. Maternal deaths are assigned to ICD6: 640-689 in 1950, ICD7: 640-689 in 1960, ICD8: 630-678
in 1970-1978, ICD9: 630-676 in 1979-1998, and ICD10: A34, O00-O95, O98-O99 in 1999 to
present.
2. Numerator of ratio is based on deaths by race of decedent from 1950 to present and
denominator of ratio is based on live births by race of infant from 1950 and 1960 and live births
GRAPH D-15: RESIDENT MATERNAL DEATH RATIOS PER 100,000 LIVE BIRTHS, BY RACE,
FLORIDA, CENSUS YEARS 1970-2000 AND 2010-2013
0
10
20
30
40
50
60
1970 1980 1990 2000 2010 2011 2012 2013
WhiteBlack
YEAR
RA
TIO
90 FLORIDA VITAL STATISTICS ANNUAL REPORT 2013
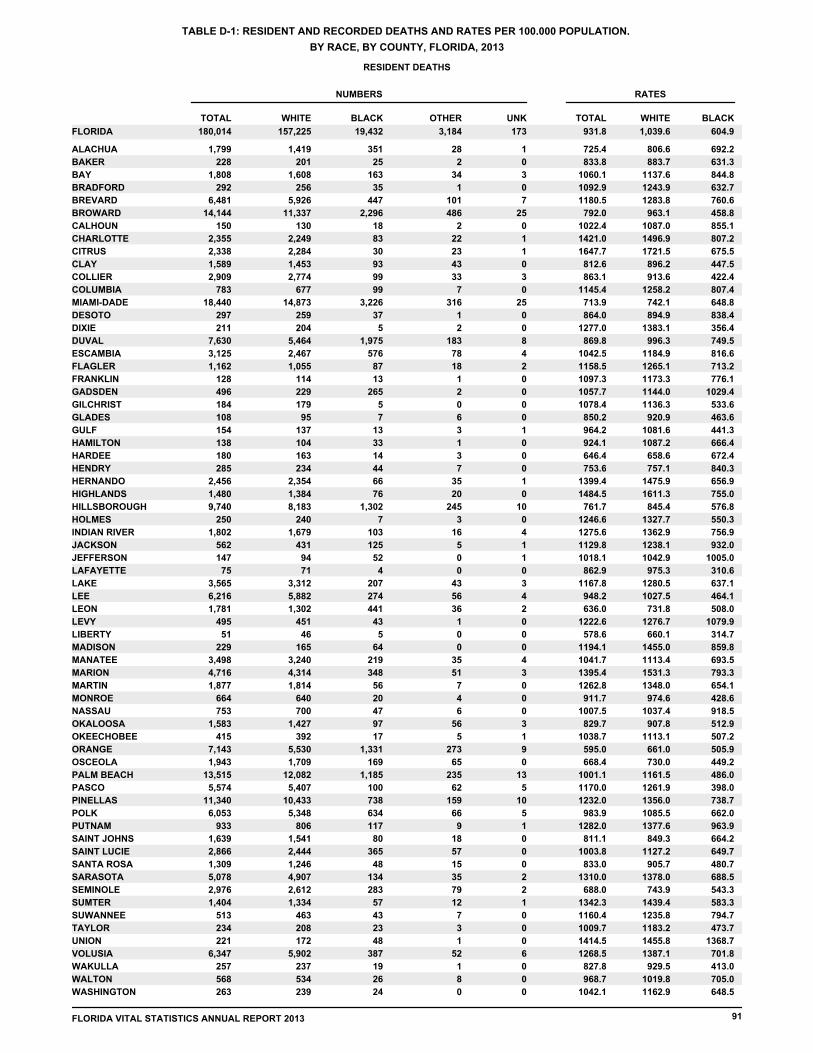
BY RACE, BY COUNTY, FLORIDA, 2013
NUMBERS RATES
WHITETOTAL
RESIDENT DEATHS
TABLE D-1: RESIDENT AND RECORDED DEATHS AND RATES PER 100,000 POPULATION,
BLACKUNKOTHERBLACKWHITETOTAL
FLORIDA 931.8 1,039.6 604.9 173 3,184 19,432 157,225 180,014
725.4 806.6 692.2ALACHUA 1,799 1,419 351 28 1
833.8 883.7 631.3BAKER 228 201 25 2 0
1060.1 1137.6 844.8BAY 1,808 1,608 163 34 3
1092.9 1243.9 632.7BRADFORD 292 256 35 1 0
1180.5 1283.8 760.6BREVARD 6,481 5,926 447 101 7
792.0 963.1 458.8BROWARD 14,144 11,337 2,296 486 25
1022.4 1087.0 855.1CALHOUN 150 130 18 2 0
1421.0 1496.9 807.2CHARLOTTE 2,355 2,249 83 22 1
1647.7 1721.5 675.5CITRUS 2,338 2,284 30 23 1
812.6 896.2 447.5CLAY 1,589 1,453 93 43 0
863.1 913.6 422.4COLLIER 2,909 2,774 99 33 3
1145.4 1258.2 807.4COLUMBIA 783 677 99 7 0
713.9 742.1 648.8MIAMI-DADE 18,440 14,873 3,226 316 25
864.0 894.9 838.4DESOTO 297 259 37 1 0
1277.0 1383.1 356.4DIXIE 211 204 5 2 0
869.8 996.3 749.5DUVAL 7,630 5,464 1,975 183 8
1042.5 1184.9 816.6ESCAMBIA 3,125 2,467 576 78 4
1158.5 1265.1 713.2FLAGLER 1,162 1,055 87 18 2
1097.3 1173.3 776.1FRANKLIN 128 114 13 1 0
1057.7 1144.0 1029.4GADSDEN 496 229 265 2 0
1078.4 1136.3 533.6GILCHRIST 184 179 5 0 0
850.2 920.9 463.6GLADES 108 95 7 6 0
964.2 1081.6 441.3GULF 154 137 13 3 1
924.1 1087.2 666.4HAMILTON 138 104 33 1 0
646.4 658.6 672.4HARDEE 180 163 14 3 0
753.6 757.1 840.3HENDRY 285 234 44 7 0
1399.4 1475.9 656.9HERNANDO 2,456 2,354 66 35 1
1484.5 1611.3 755.0HIGHLANDS 1,480 1,384 76 20 0
761.7 845.4 576.8HILLSBOROUGH 9,740 8,183 1,302 245 10
1246.6 1327.7 550.3HOLMES 250 240 7 3 0
1275.6 1362.9 756.9INDIAN RIVER 1,802 1,679 103 16 4
1129.8 1238.1 932.0JACKSON 562 431 125 5 1
1018.1 1042.9 1005.0JEFFERSON 147 94 52 0 1
862.9 975.3 310.6LAFAYETTE 75 71 4 0 0
1167.8 1280.5 637.1LAKE 3,565 3,312 207 43 3
948.2 1027.5 464.1LEE 6,216 5,882 274 56 4
636.0 731.8 508.0LEON 1,781 1,302 441 36 2
1222.6 1276.7 1079.9LEVY 495 451 43 1 0
578.6 660.1 314.7LIBERTY 51 46 5 0 0
1194.1 1455.0 859.8MADISON 229 165 64 0 0
1041.7 1113.4 693.5MANATEE 3,498 3,240 219 35 4
1395.4 1531.3 793.3MARION 4,716 4,314 348 51 3
1262.8 1348.0 654.1MARTIN 1,877 1,814 56 7 0
911.7 974.6 428.6MONROE 664 640 20 4 0
1007.5 1037.4 918.5NASSAU 753 700 47 6 0
829.7 907.8 512.9OKALOOSA 1,583 1,427 97 56 3
1038.7 1113.1 507.2OKEECHOBEE 415 392 17 5 1
595.0 661.0 505.9ORANGE 7,143 5,530 1,331 273 9
668.4 730.0 449.2OSCEOLA 1,943 1,709 169 65 0
1001.1 1161.5 486.0PALM BEACH 13,515 12,082 1,185 235 13
1170.0 1261.9 398.0PASCO 5,574 5,407 100 62 5
1232.0 1356.0 738.7PINELLAS 11,340 10,433 738 159 10
983.9 1085.5 662.0POLK 6,053 5,348 634 66 5
1282.0 1377.6 963.9PUTNAM 933 806 117 9 1
811.1 849.3 664.2SAINT JOHNS 1,639 1,541 80 18 0
1003.8 1127.2 649.7SAINT LUCIE 2,866 2,444 365 57 0
833.0 905.7 480.7SANTA ROSA 1,309 1,246 48 15 0
1310.0 1378.0 688.5SARASOTA 5,078 4,907 134 35 2
688.0 743.9 543.3SEMINOLE 2,976 2,612 283 79 2
1342.3 1439.4 583.3SUMTER 1,404 1,334 57 12 1
1160.4 1235.8 794.7SUWANNEE 513 463 43 7 0
1009.7 1183.2 473.7TAYLOR 234 208 23 3 0
1414.5 1455.8 1368.7UNION 221 172 48 1 0
1268.5 1387.1 701.8VOLUSIA 6,347 5,902 387 52 6
827.8 929.5 413.0WAKULLA 257 237 19 1 0
968.7 1019.8 705.0WALTON 568 534 26 8 0
1042.1 1162.9 648.5WASHINGTON 263 239 24 0 0
FLORIDA VITAL STATISTICS ANNUAL REPORT 2013 91
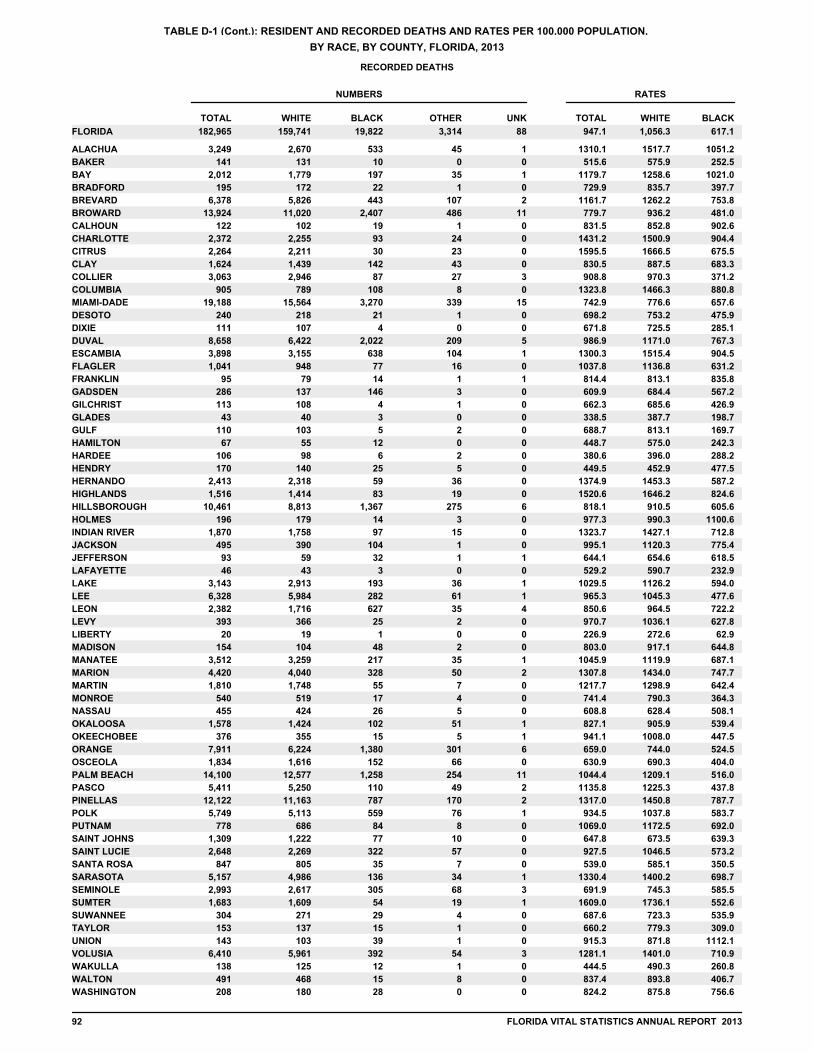
BY RACE, BY COUNTY, FLORIDA, 2013
NUMBERS RATES
WHITETOTAL
RECORDED DEATHS
TABLE D-1 (Cont.): RESIDENT AND RECORDED DEATHS AND RATES PER 100,000 POPULATION,
BLACKUNKOTHERBLACKWHITETOTAL
FLORIDA 947.1 1,056.3 617.1 88 3,314 19,822 159,741 182,965
1310.1 1517.7 1051.2ALACHUA 3,249 2,670 533 45 1
515.6 575.9 252.5BAKER 141 131 10 0 0
1179.7 1258.6 1021.0BAY 2,012 1,779 197 35 1
729.9 835.7 397.7BRADFORD 195 172 22 1 0
1161.7 1262.2 753.8BREVARD 6,378 5,826 443 107 2
779.7 936.2 481.0BROWARD 13,924 11,020 2,407 486 11
831.5 852.8 902.6CALHOUN 122 102 19 1 0
1431.2 1500.9 904.4CHARLOTTE 2,372 2,255 93 24 0
1595.5 1666.5 675.5CITRUS 2,264 2,211 30 23 0
830.5 887.5 683.3CLAY 1,624 1,439 142 43 0
908.8 970.3 371.2COLLIER 3,063 2,946 87 27 3
1323.8 1466.3 880.8COLUMBIA 905 789 108 8 0
742.9 776.6 657.6MIAMI-DADE 19,188 15,564 3,270 339 15
698.2 753.2 475.9DESOTO 240 218 21 1 0
671.8 725.5 285.1DIXIE 111 107 4 0 0
986.9 1171.0 767.3DUVAL 8,658 6,422 2,022 209 5
1300.3 1515.4 904.5ESCAMBIA 3,898 3,155 638 104 1
1037.8 1136.8 631.2FLAGLER 1,041 948 77 16 0
814.4 813.1 835.8FRANKLIN 95 79 14 1 1
609.9 684.4 567.2GADSDEN 286 137 146 3 0
662.3 685.6 426.9GILCHRIST 113 108 4 1 0
338.5 387.7 198.7GLADES 43 40 3 0 0
688.7 813.1 169.7GULF 110 103 5 2 0
448.7 575.0 242.3HAMILTON 67 55 12 0 0
380.6 396.0 288.2HARDEE 106 98 6 2 0
449.5 452.9 477.5HENDRY 170 140 25 5 0
1374.9 1453.3 587.2HERNANDO 2,413 2,318 59 36 0
1520.6 1646.2 824.6HIGHLANDS 1,516 1,414 83 19 0
818.1 910.5 605.6HILLSBOROUGH 10,461 8,813 1,367 275 6
977.3 990.3 1100.6HOLMES 196 179 14 3 0
1323.7 1427.1 712.8INDIAN RIVER 1,870 1,758 97 15 0
995.1 1120.3 775.4JACKSON 495 390 104 1 0
644.1 654.6 618.5JEFFERSON 93 59 32 1 1
529.2 590.7 232.9LAFAYETTE 46 43 3 0 0
1029.5 1126.2 594.0LAKE 3,143 2,913 193 36 1
965.3 1045.3 477.6LEE 6,328 5,984 282 61 1
850.6 964.5 722.2LEON 2,382 1,716 627 35 4
970.7 1036.1 627.8LEVY 393 366 25 2 0
226.9 272.6 62.9LIBERTY 20 19 1 0 0
803.0 917.1 644.8MADISON 154 104 48 2 0
1045.9 1119.9 687.1MANATEE 3,512 3,259 217 35 1
1307.8 1434.0 747.7MARION 4,420 4,040 328 50 2
1217.7 1298.9 642.4MARTIN 1,810 1,748 55 7 0
741.4 790.3 364.3MONROE 540 519 17 4 0
608.8 628.4 508.1NASSAU 455 424 26 5 0
827.1 905.9 539.4OKALOOSA 1,578 1,424 102 51 1
941.1 1008.0 447.5OKEECHOBEE 376 355 15 5 1
659.0 744.0 524.5ORANGE 7,911 6,224 1,380 301 6
630.9 690.3 404.0OSCEOLA 1,834 1,616 152 66 0
1044.4 1209.1 516.0PALM BEACH 14,100 12,577 1,258 254 11
1135.8 1225.3 437.8PASCO 5,411 5,250 110 49 2
1317.0 1450.8 787.7PINELLAS 12,122 11,163 787 170 2
934.5 1037.8 583.7POLK 5,749 5,113 559 76 1
1069.0 1172.5 692.0PUTNAM 778 686 84 8 0
647.8 673.5 639.3SAINT JOHNS 1,309 1,222 77 10 0
927.5 1046.5 573.2SAINT LUCIE 2,648 2,269 322 57 0
539.0 585.1 350.5SANTA ROSA 847 805 35 7 0
1330.4 1400.2 698.7SARASOTA 5,157 4,986 136 34 1
691.9 745.3 585.5SEMINOLE 2,993 2,617 305 68 3
1609.0 1736.1 552.6SUMTER 1,683 1,609 54 19 1
687.6 723.3 535.9SUWANNEE 304 271 29 4 0
660.2 779.3 309.0TAYLOR 153 137 15 1 0
915.3 871.8 1112.1UNION 143 103 39 1 0
1281.1 1401.0 710.9VOLUSIA 6,410 5,961 392 54 3
444.5 490.3 260.8WAKULLA 138 125 12 1 0
837.4 893.8 406.7WALTON 491 468 15 8 0
824.2 875.8 756.6WASHINGTON 208 180 28 0 0
92 FLORIDA VITAL STATISTICS ANNUAL REPORT 2013

TABLE D-2: RESIDENT DEATHS BY RACE AND GENDER, BY COUNTY, FLORIDA, 2013
OTHERBLACKWHITE
FEMALEMALEFEMALEMALEFEMALEMALEFEMALEMALEOTHERBLACKWHITETOTAL
180,014FLORIDA 157,225 19,432 93,066 81,294 10,073 75,928 1,592 1,591 86,941 3,184 9,358
1,799ALACHUA 1,419 351 883 693 173 726 17 11 916 28 178
228BAKER 201 25 122 106 15 95 1 1 106 2 10
1,808BAY 1,608 163 989 876 89 732 21 13 819 34 74
292BRADFORD 256 35 153 136 17 120 0 1 139 1 18
6,481BREVARD 5,926 447 3,402 3,102 252 2,824 45 56 3,079 101 195
14,144BROWARD 11,337 2,296 6,987 5,549 1,192 5,788 232 254 7,157 486 1,104
150CALHOUN 130 18 80 68 12 62 0 2 70 2 6
2,355CHARLOTTE 2,249 83 1,229 1,187 35 1,062 7 15 1,126 22 48
2,338CITRUS 2,284 30 1,286 1,263 13 1,021 9 14 1,052 23 17
1,589CLAY 1,453 93 817 746 47 707 24 19 772 43 46
2,909COLLIER 2,774 99 1,563 1,484 55 1,290 22 11 1,346 33 44
783COLUMBIA 677 99 403 354 47 323 2 5 380 7 52
18,440MIAMI-DADE 14,873 3,226 9,398 7,518 1,698 7,355 168 148 9,041 316 1,528
297DESOTO 259 37 168 145 22 114 1 0 129 1 15
211DIXIE 204 5 129 122 5 82 2 0 82 2 0
7,630DUVAL 5,464 1,975 3,777 2,700 989 2,764 84 99 3,853 183 986
3,125ESCAMBIA 2,467 576 1,598 1,269 291 1,198 36 42 1,527 78 285
1,162FLAGLER 1,055 87 638 583 47 472 7 11 524 18 40
128FRANKLIN 114 13 75 69 6 45 0 1 53 1 7
496GADSDEN 229 265 269 131 136 98 2 0 227 2 129
184GILCHRIST 179 5 92 89 3 90 0 0 92 0 2
108GLADES 95 7 69 59 6 36 4 2 39 6 1
154GULF 137 13 71 60 9 77 2 1 83 3 4
138HAMILTON 104 33 70 51 19 53 0 1 68 1 14
180HARDEE 163 14 102 93 7 70 2 1 78 3 7
285HENDRY 234 44 164 135 24 99 5 2 121 7 20
2,456HERNANDO 2,354 66 1,314 1,258 37 1,096 18 17 1,142 35 29
1,480HIGHLANDS 1,384 76 773 720 42 664 11 9 707 20 34
9,740HILLSBOROUGH 8,183 1,302 4,966 4,154 675 4,029 128 116 4,772 245 626
250HOLMES 240 7 130 128 1 112 1 2 120 3 6
1,802INDIAN RIVER 1,679 103 960 890 58 789 10 6 842 16 45
562JACKSON 431 125 266 201 63 229 1 4 295 5 62
147JEFFERSON 94 52 77 43 33 51 0 0 70 0 19
75LAFAYETTE 71 4 46 45 1 26 0 0 29 0 3
3,565LAKE 3,312 207 1,898 1,777 97 1,535 22 21 1,667 43 110
6,216LEE 5,882 274 3,361 3,184 142 2,698 31 25 2,855 56 132
1,781LEON 1,302 441 831 604 212 698 14 22 950 36 229
495LEVY 451 43 283 265 17 186 1 0 212 1 26
51LIBERTY 46 5 30 27 3 19 0 0 21 0 2
229MADISON 165 64 116 81 35 84 0 0 113 0 29
3,498MANATEE 3,240 219 1,873 1,725 122 1,515 24 11 1,625 35 97
4,716MARION 4,314 348 2,498 2,287 184 2,027 26 25 2,218 51 164
1,877MARTIN 1,814 56 1,013 983 26 831 4 3 864 7 30
664MONROE 640 20 428 414 11 226 3 1 236 4 9
753NASSAU 700 47 404 379 22 321 3 3 349 6 25
1,583OKALOOSA 1,427 97 851 772 56 655 21 35 732 56 41
415OKEECHOBEE 392 17 234 220 11 172 2 3 181 5 6
7,143ORANGE 5,530 1,331 3,639 2,825 667 2,705 143 130 3,504 273 664
1,943OSCEOLA 1,709 169 1,013 902 85 807 26 39 930 65 84
13,515PALM BEACH 12,082 1,185 6,928 6,199 605 5,883 114 121 6,587 235 580
5,574PASCO 5,407 100 2,938 2,841 55 2,566 37 25 2,636 62 45
11,340PINELLAS 10,433 738 5,690 5,209 397 5,224 79 80 5,649 159 341
6,053POLK 5,348 634 3,135 2,774 332 2,574 25 41 2,918 66 302
933PUTNAM 806 117 485 410 69 396 5 4 448 9 48
1,639SAINT JOHNS 1,541 80 811 754 43 787 14 4 828 18 37
2,866SAINT LUCIE 2,444 365 1,530 1,304 194 1,140 32 25 1,336 57 171
1,309SANTA ROSA 1,246 48 662 629 27 617 6 9 647 15 21
5,078SARASOTA 4,907 134 2,578 2,501 60 2,405 16 19 2,499 35 74
2,976SEMINOLE 2,612 283 1,476 1,298 139 1,314 38 41 1,500 79 144
1,404SUMTER 1,334 57 812 775 32 559 4 8 592 12 25
513SUWANNEE 463 43 265 232 31 231 2 5 248 7 12
234TAYLOR 208 23 128 111 15 97 2 1 106 3 8
221UNION 172 48 165 128 36 44 1 0 56 1 12
6,347VOLUSIA 5,902 387 3,281 3,062 185 2,839 31 21 3,065 52 202
257WAKULLA 237 19 140 131 9 106 0 1 117 1 10
568WALTON 534 26 317 299 14 235 4 4 251 8 12
263WASHINGTON 239 24 136 123 13 116 0 0 127 0 11
FLORIDA VITAL STATISTICS ANNUAL REPORT 2013 93
WHITE BLACK OTHERAGE
YEARS FEMALEMALEFEMALEMALEFEMALEMALEFEMALEMALEOTHERBLACKWHITETOTAL
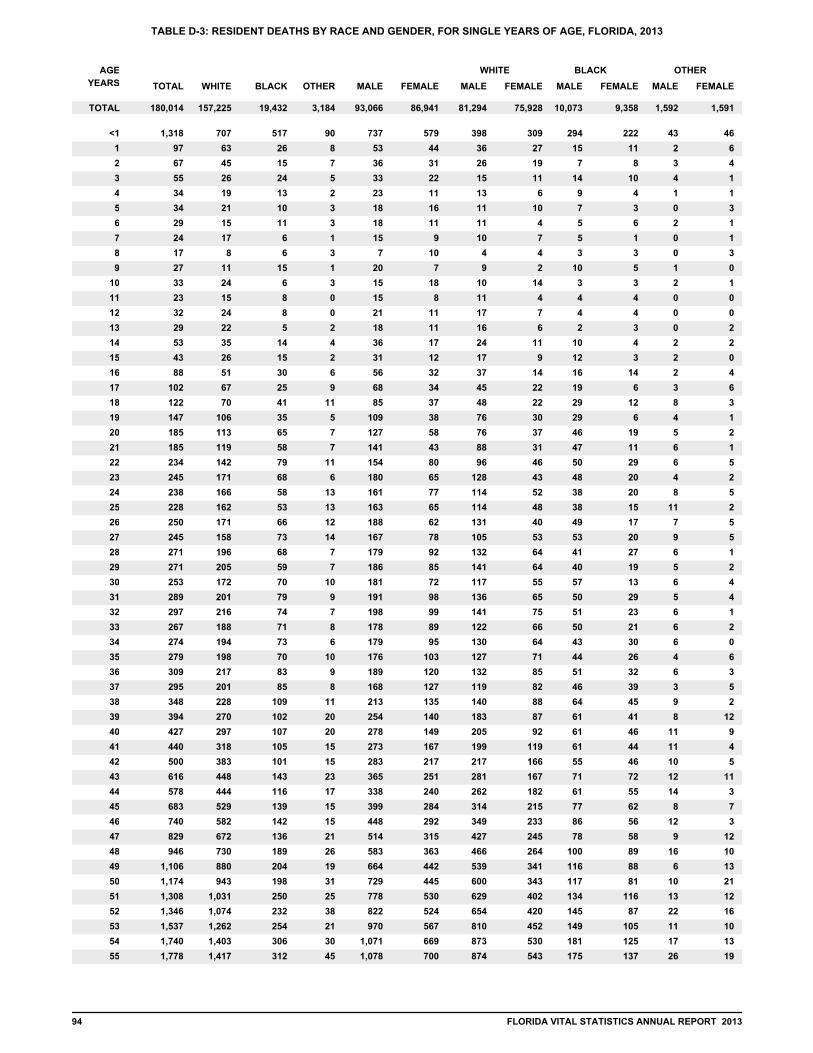
TABLE D-3: RESIDENT DEATHS BY RACE AND GENDER, FOR SINGLE YEARS OF AGE, FLORIDA, 2013
TOTAL 180,014 157,225 19,432 3,184 93,066 86,941 81,294 75,928 10,073 9,358 1,592 1,591
1,318 707 517 90 737 579 398 309 294 222 43 46 <1
97 63 26 8 53 44 36 27 15 11 2 6 1
67 45 15 7 36 31 26 19 7 8 3 4 2
55 26 24 5 33 22 15 11 14 10 4 1 3
34 19 13 2 23 11 13 6 9 4 1 1 4
34 21 10 3 18 16 11 10 7 3 0 3 5
29 15 11 3 18 11 11 4 5 6 2 1 6
24 17 6 1 15 9 10 7 5 1 0 1 7
17 8 6 3 7 10 4 4 3 3 0 3 8
27 11 15 1 20 7 9 2 10 5 1 0 9
33 24 6 3 15 18 10 14 3 3 2 1 10
23 15 8 0 15 8 11 4 4 4 0 0 11
32 24 8 0 21 11 17 7 4 4 0 0 12
29 22 5 2 18 11 16 6 2 3 0 2 13
53 35 14 4 36 17 24 11 10 4 2 2 14
43 26 15 2 31 12 17 9 12 3 2 0 15
88 51 30 6 56 32 37 14 16 14 2 4 16
102 67 25 9 68 34 45 22 19 6 3 6 17
122 70 41 11 85 37 48 22 29 12 8 3 18
147 106 35 5 109 38 76 30 29 6 4 1 19
185 113 65 7 127 58 76 37 46 19 5 2 20
185 119 58 7 141 43 88 31 47 11 6 1 21
234 142 79 11 154 80 96 46 50 29 6 5 22
245 171 68 6 180 65 128 43 48 20 4 2 23
238 166 58 13 161 77 114 52 38 20 8 5 24
228 162 53 13 163 65 114 48 38 15 11 2 25
250 171 66 12 188 62 131 40 49 17 7 5 26
245 158 73 14 167 78 105 53 53 20 9 5 27
271 196 68 7 179 92 132 64 41 27 6 1 28
271 205 59 7 186 85 141 64 40 19 5 2 29
253 172 70 10 181 72 117 55 57 13 6 4 30
289 201 79 9 191 98 136 65 50 29 5 4 31
297 216 74 7 198 99 141 75 51 23 6 1 32
267 188 71 8 178 89 122 66 50 21 6 2 33
274 194 73 6 179 95 130 64 43 30 6 0 34
279 198 70 10 176 103 127 71 44 26 4 6 35
309 217 83 9 189 120 132 85 51 32 6 3 36
295 201 85 8 168 127 119 82 46 39 3 5 37
348 228 109 11 213 135 140 88 64 45 9 2 38
394 270 102 20 254 140 183 87 61 41 8 12 39
427 297 107 20 278 149 205 92 61 46 11 9 40
440 318 105 15 273 167 199 119 61 44 11 4 41
500 383 101 15 283 217 217 166 55 46 10 5 42
616 448 143 23 365 251 281 167 71 72 12 11 43
578 444 116 17 338 240 262 182 61 55 14 3 44
683 529 139 15 399 284 314 215 77 62 8 7 45
740 582 142 15 448 292 349 233 86 56 12 3 46
829 672 136 21 514 315 427 245 78 58 9 12 47
946 730 189 26 583 363 466 264 100 89 16 10 48
1,106 880 204 19 664 442 539 341 116 88 6 13 49
1,174 943 198 31 729 445 600 343 117 81 10 21 50
1,308 1,031 250 25 778 530 629 402 134 116 13 12 51
1,346 1,074 232 38 822 524 654 420 145 87 22 16 52
1,537 1,262 254 21 970 567 810 452 149 105 11 10 53
1,740 1,403 306 30 1,071 669 873 530 181 125 17 13 54
1,778 1,417 312 45 1,078 700 874 543 175 137 26 19 55
94 FLORIDA VITAL STATISTICS ANNUAL REPORT 2013
WHITE BLACK OTHERAGE
YEARS FEMALEMALEFEMALEMALEFEMALEMALEFEMALEMALEOTHERBLACKWHITETOTAL
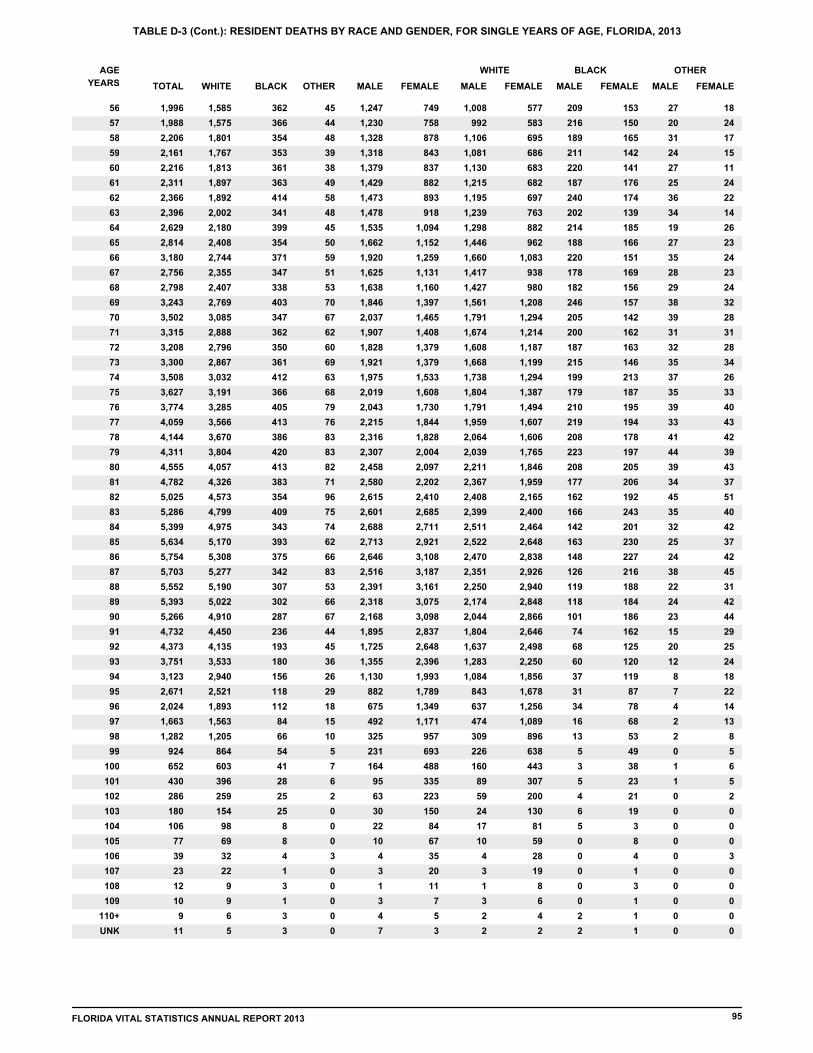
TABLE D-3 (Cont.): RESIDENT DEATHS BY RACE AND GENDER, FOR SINGLE YEARS OF AGE, FLORIDA, 2013
1,996 1,585 362 45 1,247 749 1,008 577 209 153 27 18 56
1,988 1,575 366 44 1,230 758 992 583 216 150 20 24 57
2,206 1,801 354 48 1,328 878 1,106 695 189 165 31 17 58
2,161 1,767 353 39 1,318 843 1,081 686 211 142 24 15 59
2,216 1,813 361 38 1,379 837 1,130 683 220 141 27 11 60
2,311 1,897 363 49 1,429 882 1,215 682 187 176 25 24 61
2,366 1,892 414 58 1,473 893 1,195 697 240 174 36 22 62
2,396 2,002 341 48 1,478 918 1,239 763 202 139 34 14 63
2,629 2,180 399 45 1,535 1,094 1,298 882 214 185 19 26 64
2,814 2,408 354 50 1,662 1,152 1,446 962 188 166 27 23 65
3,180 2,744 371 59 1,920 1,259 1,660 1,083 220 151 35 24 66
2,756 2,355 347 51 1,625 1,131 1,417 938 178 169 28 23 67
2,798 2,407 338 53 1,638 1,160 1,427 980 182 156 29 24 68
3,243 2,769 403 70 1,846 1,397 1,561 1,208 246 157 38 32 69
3,502 3,085 347 67 2,037 1,465 1,791 1,294 205 142 39 28 70
3,315 2,888 362 62 1,907 1,408 1,674 1,214 200 162 31 31 71
3,208 2,796 350 60 1,828 1,379 1,608 1,187 187 163 32 28 72
3,300 2,867 361 69 1,921 1,379 1,668 1,199 215 146 35 34 73
3,508 3,032 412 63 1,975 1,533 1,738 1,294 199 213 37 26 74
3,627 3,191 366 68 2,019 1,608 1,804 1,387 179 187 35 33 75
3,774 3,285 405 79 2,043 1,730 1,791 1,494 210 195 39 40 76
4,059 3,566 413 76 2,215 1,844 1,959 1,607 219 194 33 43 77
4,144 3,670 386 83 2,316 1,828 2,064 1,606 208 178 41 42 78
4,311 3,804 420 83 2,307 2,004 2,039 1,765 223 197 44 39 79
4,555 4,057 413 82 2,458 2,097 2,211 1,846 208 205 39 43 80
4,782 4,326 383 71 2,580 2,202 2,367 1,959 177 206 34 37 81
5,025 4,573 354 96 2,615 2,410 2,408 2,165 162 192 45 51 82
5,286 4,799 409 75 2,601 2,685 2,399 2,400 166 243 35 40 83
5,399 4,975 343 74 2,688 2,711 2,511 2,464 142 201 32 42 84
5,634 5,170 393 62 2,713 2,921 2,522 2,648 163 230 25 37 85
5,754 5,308 375 66 2,646 3,108 2,470 2,838 148 227 24 42 86
5,703 5,277 342 83 2,516 3,187 2,351 2,926 126 216 38 45 87
5,552 5,190 307 53 2,391 3,161 2,250 2,940 119 188 22 31 88
5,393 5,022 302 66 2,318 3,075 2,174 2,848 118 184 24 42 89
5,266 4,910 287 67 2,168 3,098 2,044 2,866 101 186 23 44 90
4,732 4,450 236 44 1,895 2,837 1,804 2,646 74 162 15 29 91
4,373 4,135 193 45 1,725 2,648 1,637 2,498 68 125 20 25 92
3,751 3,533 180 36 1,355 2,396 1,283 2,250 60 120 12 24 93
3,123 2,940 156 26 1,130 1,993 1,084 1,856 37 119 8 18 94
2,671 2,521 118 29 882 1,789 843 1,678 31 87 7 22 95
2,024 1,893 112 18 675 1,349 637 1,256 34 78 4 14 96
1,663 1,563 84 15 492 1,171 474 1,089 16 68 2 13 97
1,282 1,205 66 10 325 957 309 896 13 53 2 8 98
924 864 54 5 231 693 226 638 5 49 0 5 99
652 603 41 7 164 488 160 443 3 38 1 6 100
430 396 28 6 95 335 89 307 5 23 1 5 101
286 259 25 2 63 223 59 200 4 21 0 2 102
180 154 25 0 30 150 24 130 6 19 0 0 103
106 98 8 0 22 84 17 81 5 3 0 0 104
77 69 8 0 10 67 10 59 0 8 0 0 105
39 32 4 3 4 35 4 28 0 4 0 3 106
23 22 1 0 3 20 3 19 0 1 0 0 107
12 9 3 0 1 11 1 8 0 3 0 0 108
10 9 1 0 3 7 3 6 0 1 0 0109
9 6 3 0 4 5 2 4 2 1 0 0110+
11 5 3 0 7 3 2 2 2 1 0 0UNK
FLORIDA VITAL STATISTICS ANNUAL REPORT 2013 95

TABLE D-4: RESIDENT DEATHS BY AGE GROUP, BY COUNTY, FLORIDA, 2013
UNK85+75-8465-7455-6445-5435-4425-3420-2415-1910-145-91-4<1TOTAL
FLORIDA 180,014 1,318 253 131 170 502 1,087 2,645 4,186 11,409 22,047 31,624 44,962 59,669 11
ALACHUA 1,799 28 4 3 1 1 7 43 44 117 274 280 400 597 0
BAKER 228 5 1 0 0 1 1 3 10 18 39 50 53 47 0
BAY 1,808 18 1 2 2 1 8 31 57 165 296 339 417 471 0
BRADFORD 292 6 1 0 0 1 0 6 8 27 57 62 63 61 0
BREVARD 6,481 35 6 1 5 18 33 81 126 412 779 1,104 1,790 2,091 0
BROWARD 14,144 114 15 14 15 50 106 214 359 990 1,716 2,208 3,099 5,241 3
CALHOUN 150 0 0 0 0 2 0 0 2 8 21 40 45 32 0
CHARLOTTE 2,355 1 2 1 0 1 12 10 33 108 213 408 645 921 0
CITRUS 2,338 8 3 0 1 4 4 14 32 128 259 491 671 723 0
CLAY 1,589 10 2 5 0 8 17 20 48 113 218 349 371 428 0
COLLIER 2,909 19 6 2 0 13 10 34 50 101 251 454 836 1,132 1
COLUMBIA 783 6 0 0 2 4 8 15 20 48 114 180 195 191 0
MIAMI-DADE 18,440 138 27 11 19 58 138 312 454 1,123 2,094 3,025 4,670 6,370 1
DESOTO 297 1 1 0 0 1 1 3 7 17 40 62 78 86 0
DIXIE 211 0 1 0 1 1 1 1 5 17 43 50 53 38 0
DUVAL 7,630 111 11 6 10 24 78 166 263 676 1,254 1,331 1,640 2,060 0
ESCAMBIA 3,125 28 7 5 3 16 24 60 98 229 510 553 746 846 0
FLAGLER 1,162 2 3 0 0 2 5 19 17 72 127 231 325 359 0
FRANKLIN 128 2 0 0 0 0 1 3 3 9 25 29 32 24 0
GADSDEN 496 9 0 1 2 5 5 12 12 34 91 81 128 116 0
GILCHRIST 184 0 0 0 0 0 0 3 5 12 29 49 39 47 0
GLADES 108 1 0 1 1 1 0 3 6 10 16 20 29 20 0
GULF 154 1 0 0 0 1 0 1 3 10 25 30 40 43 0
HAMILTON 138 1 0 0 0 1 0 2 4 16 24 35 27 28 0
HARDEE 180 1 0 0 1 1 5 4 6 10 28 41 33 50 0
HENDRY 285 4 0 0 0 4 0 7 10 18 50 62 69 61 0
HERNANDO 2,456 8 2 4 3 4 12 33 54 107 260 465 702 802 0
HIGHLANDS 1,480 3 2 1 2 3 6 10 24 65 133 291 427 513 0
HILLSBOROUGH 9,740 122 16 9 9 33 82 181 308 757 1,328 1,747 2,228 2,920 0
HOLMES 250 2 0 1 0 1 1 3 6 17 36 50 80 53 0
INDIAN RIVER 1,802 8 3 2 2 2 3 14 27 95 177 259 475 735 0
JACKSON 562 4 2 0 2 2 1 7 13 34 76 113 145 163 0
JEFFERSON 147 4 0 0 0 0 0 4 2 13 18 38 39 29 0
LAFAYETTE 75 0 0 0 0 0 0 1 2 7 8 21 20 16 0
LAKE 3,565 23 6 4 2 1 14 32 71 199 348 648 1,054 1,163 0
LEE 6,216 38 15 2 5 13 33 73 119 374 687 1,159 1,655 2,043 0
LEON 1,781 16 2 1 1 9 11 36 53 117 268 303 399 565 0
LEVY 495 2 1 0 0 1 3 7 16 36 77 122 118 112 0
LIBERTY 51 1 3 0 0 0 0 0 2 4 14 10 10 7 0
MADISON 229 0 1 1 0 0 2 3 5 19 25 46 58 69 0
MANATEE 3,498 15 3 3 2 8 23 50 71 199 415 643 841 1,225 0
MARION 4,716 26 9 1 2 4 16 54 88 260 494 952 1,397 1,413 0
MARTIN 1,877 8 2 2 2 6 7 12 38 76 152 281 522 768 1
MONROE 664 4 1 0 1 0 6 8 19 59 128 147 145 146 0
NASSAU 753 1 0 0 1 3 4 11 16 55 110 154 204 194 0
OKALOOSA 1,583 21 2 2 3 9 15 21 39 127 197 290 450 407 0
OKEECHOBEE 415 4 2 0 0 0 5 11 11 38 65 89 103 87 0
ORANGE 7,143 119 20 10 11 33 74 161 247 571 1,026 1,274 1,580 2,017 0
OSCEOLA 1,943 20 3 0 6 12 15 35 56 155 289 417 480 455 0
PALM BEACH 13,515 65 12 6 18 40 67 188 263 659 1,250 1,855 3,235 5,855 2
PASCO 5,574 37 4 0 4 6 24 82 120 340 700 1,093 1,436 1,728 0
PINELLAS 11,340 48 10 4 2 16 45 122 190 676 1,431 1,894 2,703 4,199 0
POLK 6,053 49 9 5 8 20 43 91 154 375 792 1,190 1,602 1,715 0
PUTNAM 933 6 1 1 1 3 2 17 24 60 140 209 246 223 0
SAINT JOHNS 1,639 14 0 2 2 6 14 17 28 84 181 314 372 605 0
SAINT LUCIE 2,866 13 5 2 0 6 13 29 59 169 363 525 745 937 0
SANTA ROSA 1,309 11 2 2 1 6 6 28 35 110 181 291 328 308 0
SARASOTA 5,078 15 3 0 0 5 14 44 66 223 421 742 1,363 2,182 0
SEMINOLE 2,976 24 7 6 4 13 17 48 71 212 382 485 730 977 0
SUMTER 1,404 2 1 0 1 0 3 6 14 50 117 356 459 394 1
SUWANNEE 513 5 2 0 1 1 5 9 9 32 64 106 137 142 0
TAYLOR 234 0 0 0 0 1 0 6 5 21 35 59 56 51 0
UNION 221 1 0 0 0 1 3 6 12 34 65 35 40 24 0
VOLUSIA 6,347 21 10 4 9 12 29 97 137 386 824 1,118 1,608 2,091 1
WAKULLA 257 3 1 1 1 1 1 4 7 21 42 68 60 47 0
WALTON 568 6 0 2 1 2 2 9 13 45 91 130 139 127 1
WASHINGTON 263 0 0 0 0 0 1 5 5 24 31 58 73 66 0
96 FLORIDA VITAL STATISTICS ANNUAL REPORT 2013

TABLE D-4 (Cont.): RESIDENT DEATHS FOR WHITE MALES BY AGE GROUP, BY COUNTY, FLORIDA, 2013
UNK85+75-8465-7455-6445-5435-4425-3420-2415-1910-145-91-4<1TOTAL
FLORIDA 81,294 398 90 45 78 223 502 1,269 1,865 5,661 11,138 15,990 21,553 22,480 2
ALACHUA 693 12 2 0 1 0 3 17 22 47 115 128 149 197 0
BAKER 106 4 0 0 0 0 1 1 6 9 19 20 28 18 0
BAY 876 5 0 1 2 1 5 20 31 90 170 181 197 173 0
BRADFORD 136 3 1 0 0 0 0 3 3 13 29 39 28 17 0
BREVARD 3,102 15 2 0 4 7 16 48 54 204 435 603 900 814 0
BROWARD 5,549 18 2 1 3 20 35 77 117 440 767 1,023 1,286 1,759 1
CALHOUN 68 0 0 0 0 1 0 0 2 2 13 18 23 9 0
CHARLOTTE 1,187 1 1 1 0 0 7 9 20 69 114 231 344 390 0
CITRUS 1,263 3 2 0 0 4 1 8 19 82 162 276 374 332 0
CLAY 746 3 2 1 0 5 6 10 29 52 111 189 177 161 0
COLLIER 1,484 5 1 0 0 8 5 16 25 55 134 251 462 522 0
COLUMBIA 354 5 0 0 0 2 5 10 6 21 61 87 86 71 0
MIAMI-DADE 7,518 36 9 5 8 18 57 120 171 493 951 1,427 2,082 2,141 0
DESOTO 145 1 1 0 0 0 1 0 4 10 19 34 43 32 0
DIXIE 122 0 0 0 1 0 1 0 2 11 29 27 33 18 0
DUVAL 2,700 22 2 1 3 6 26 67 93 259 509 539 557 616 0
ESCAMBIA 1,269 9 2 1 2 7 12 27 42 107 222 254 309 275 0
FLAGLER 583 1 3 0 0 1 4 12 11 40 70 118 171 152 0
FRANKLIN 69 0 0 0 0 0 1 3 2 5 13 20 17 8 0
GADSDEN 131 0 0 0 1 2 1 2 2 12 17 29 35 30 0
GILCHRIST 89 0 0 0 0 0 0 2 4 7 14 26 16 20 0
GLADES 59 0 0 0 1 0 0 2 4 4 9 6 22 11 0
GULF 60 1 0 0 0 0 0 0 1 5 11 16 16 10 0
HAMILTON 51 1 0 0 0 0 0 1 1 6 10 11 13 8 0
HARDEE 93 1 0 0 1 1 5 3 2 7 12 23 14 24 0
HENDRY 135 1 0 0 0 3 0 4 5 10 25 34 29 24 0
HERNANDO 1,258 3 0 3 2 3 7 19 29 55 150 257 380 350 0
HIGHLANDS 720 1 0 1 1 2 2 7 14 24 72 149 236 211 0
HILLSBOROUGH 4,154 35 5 4 4 11 45 92 155 386 609 797 985 1,026 0
HOLMES 128 2 0 1 0 1 0 2 3 9 23 29 41 17 0
INDIAN RIVER 890 1 1 1 1 0 2 8 14 50 104 132 251 325 0
JACKSON 201 0 1 0 0 0 0 3 6 13 29 49 58 42 0
JEFFERSON 43 0 0 0 0 0 0 0 1 4 7 14 11 6 0
LAFAYETTE 45 0 0 0 0 0 0 0 2 5 6 15 10 7 0
LAKE 1,777 9 2 2 2 1 8 21 38 108 185 357 553 491 0
LEE 3,184 16 5 0 3 5 19 39 51 211 393 651 907 884 0
LEON 604 3 0 1 1 3 2 16 17 43 99 131 142 146 0
LEVY 265 1 1 0 0 1 0 5 5 27 41 79 64 41 0
LIBERTY 27 1 1 0 0 0 0 0 0 2 8 7 5 3 0
MADISON 81 0 0 1 0 0 2 2 1 4 11 23 20 17 0
MANATEE 1,725 5 1 1 0 6 9 27 37 113 215 356 449 506 0
MARION 2,287 9 5 0 1 2 8 24 44 124 268 504 715 583 0
MARTIN 983 4 0 1 0 3 5 10 20 48 97 167 294 333 1
MONROE 414 1 1 0 1 0 4 7 13 41 95 97 89 65 0
NASSAU 379 0 0 0 0 3 4 5 10 35 69 91 97 65 0
OKALOOSA 772 12 1 2 1 4 9 10 20 61 115 162 229 146 0
OKEECHOBEE 220 1 1 0 0 0 2 5 4 17 46 48 58 38 0
ORANGE 2,825 30 7 3 5 19 27 61 107 250 483 545 642 646 0
OSCEOLA 902 7 2 0 3 11 3 21 26 88 159 220 214 148 0
PALM BEACH 6,199 20 4 1 7 12 23 92 116 329 610 925 1,597 2,463 0
PASCO 2,841 22 1 0 4 2 14 50 60 202 397 600 751 738 0
PINELLAS 5,209 14 3 0 1 9 22 58 97 355 805 979 1,326 1,540 0
POLK 2,774 16 6 2 3 10 27 46 67 194 403 599 755 646 0
PUTNAM 410 2 1 0 1 1 0 8 13 30 66 101 122 65 0
SAINT JOHNS 754 6 0 1 1 2 8 9 13 50 96 168 182 218 0
SAINT LUCIE 1,304 1 0 0 0 4 5 13 18 78 173 266 371 375 0
SANTA ROSA 629 3 2 2 0 4 6 20 20 55 105 148 149 115 0
SARASOTA 2,501 6 1 0 0 4 9 29 28 122 244 399 719 940 0
SEMINOLE 1,298 6 3 4 1 6 10 24 30 111 185 248 347 323 0
SUMTER 775 1 0 0 0 0 2 5 8 24 70 210 287 168 0
SUWANNEE 232 2 1 0 0 0 4 5 4 17 31 57 67 44 0
TAYLOR 111 0 0 0 0 0 0 3 4 9 14 33 28 20 0
UNION 128 1 0 0 0 0 3 4 5 23 37 23 24 8 0
VOLUSIA 3,062 7 3 1 7 6 18 46 65 217 472 598 828 794 0
WAKULLA 131 2 1 0 1 0 0 1 4 11 22 33 36 20 0
WALTON 299 1 0 1 0 2 0 4 10 29 59 74 70 49 0
WASHINGTON 123 0 0 0 0 0 1 4 4 15 14 33 31 21 0
FLORIDA VITAL STATISTICS ANNUAL REPORT 2013 97

TABLE D-4 (Cont.): RESIDENT DEATHS FOR WHITE FEMALES BY AGE GROUP, BY COUNTY, FLORIDA, 2013
UNK85+75-8465-7455-6445-5435-4425-3420-2415-1910-145-91-4<1TOTAL
FLORIDA 75,928 309 63 27 42 97 209 594 1,139 3,445 6,791 11,359 18,693 33,158 2
ALACHUA 726 2 1 0 0 0 0 10 12 30 80 94 174 323 0
BAKER 95 1 0 0 0 0 0 1 2 6 16 23 21 25 0
BAY 732 6 0 1 0 0 3 4 16 54 84 115 178 271 0
BRADFORD 120 1 0 0 0 0 0 1 4 10 21 19 29 35 0
BREVARD 2,824 9 1 0 1 4 7 15 47 156 271 395 763 1,155 0
BROWARD 5,788 13 1 0 2 8 17 44 78 233 446 690 1,265 2,990 1
CALHOUN 62 0 0 0 0 0 0 0 0 2 5 19 16 20 0
CHARLOTTE 1,062 0 1 0 0 1 3 1 12 34 85 163 275 487 0
CITRUS 1,021 4 1 0 1 0 3 5 10 40 85 205 284 383 0
CLAY 707 5 0 3 0 1 6 5 16 49 85 130 166 241 0
COLLIER 1,290 8 5 1 0 2 1 14 12 36 96 175 342 598 0
COLUMBIA 323 0 0 0 1 1 2 3 5 16 35 72 85 103 0
MIAMI-DADE 7,355 33 10 3 4 6 16 44 105 268 477 891 1,884 3,614 0
DESOTO 114 0 0 0 0 0 0 2 1 2 15 18 26 50 0
DIXIE 82 0 1 0 0 1 0 1 3 4 12 22 18 20 0
DUVAL 2,764 21 1 1 2 5 7 24 56 180 332 418 641 1,076 0
ESCAMBIA 1,198 2 1 1 0 1 6 12 25 66 152 182 303 447 0
FLAGLER 472 0 0 0 0 0 1 2 3 26 48 98 119 175 0
FRANKLIN 45 1 0 0 0 0 0 0 0 3 7 9 12 13 0
GADSDEN 98 1 0 0 0 0 0 0 0 4 13 11 32 37 0
GILCHRIST 90 0 0 0 0 0 0 1 1 5 13 22 22 26 0
GLADES 36 1 0 0 0 0 0 0 0 4 5 10 7 9 0
GULF 77 0 0 0 0 0 0 1 2 2 10 11 24 27 0
HAMILTON 53 0 0 0 0 1 0 0 1 6 9 14 7 15 0
HARDEE 70 0 0 0 0 0 0 0 2 2 12 13 17 24 0
HENDRY 99 1 0 0 0 0 0 1 3 5 14 19 27 29 0
HERNANDO 1,096 3 1 1 1 1 5 10 22 43 89 191 293 436 0
HIGHLANDS 664 0 1 0 1 0 1 1 6 29 46 124 169 286 0
HILLSBOROUGH 4,029 35 3 1 2 9 11 52 76 206 413 632 946 1,643 0
HOLMES 112 0 0 0 0 0 1 1 3 8 12 18 36 33 0
INDIAN RIVER 789 1 0 1 0 1 1 3 8 30 53 104 195 392 0
JACKSON 229 1 0 0 0 2 1 2 5 14 23 35 60 86 0
JEFFERSON 51 0 0 0 0 0 0 2 1 2 6 8 15 17 0
LAFAYETTE 26 0 0 0 0 0 0 1 0 2 2 4 8 9 0
LAKE 1,535 9 2 2 0 0 2 8 18 57 121 247 432 637 0
LEE 2,698 10 4 2 1 5 8 23 45 134 235 441 677 1,113 0
LEON 698 5 2 0 0 0 4 1 8 25 68 101 159 325 0
LEVY 186 1 0 0 0 0 2 1 4 4 29 39 47 59 0
LIBERTY 19 0 0 0 0 0 0 0 2 1 6 2 4 4 0
MADISON 84 0 1 0 0 0 0 0 2 5 7 16 22 31 0
MANATEE 1,515 3 1 0 2 1 6 16 21 66 147 225 349 678 0
MARION 2,027 8 2 1 0 1 4 16 30 99 165 366 583 752 0
MARTIN 831 2 2 1 1 1 2 2 10 23 47 100 212 428 0
MONROE 226 1 0 0 0 0 2 1 5 16 30 47 47 77 0
NASSAU 321 0 0 0 1 0 0 4 6 16 34 53 87 120 0
OKALOOSA 655 2 0 0 1 2 3 5 9 44 58 103 193 235 0
OKEECHOBEE 172 3 1 0 0 0 3 5 4 16 17 33 42 48 0
ORANGE 2,705 26 3 0 4 6 18 34 51 149 269 413 633 1,099 0
OSCEOLA 807 3 1 0 2 0 7 9 18 48 98 150 200 271 0
PALM BEACH 5,883 9 1 1 4 5 11 36 59 201 391 650 1,387 3,128 0
PASCO 2,566 9 3 0 0 3 7 21 54 123 278 466 646 956 0
PINELLAS 5,224 12 5 1 1 5 10 29 54 222 445 747 1,177 2,516 0
POLK 2,574 16 1 1 4 6 5 24 37 120 261 463 685 951 0
PUTNAM 396 0 0 1 0 2 1 7 8 16 55 82 86 138 0
SAINT JOHNS 787 6 0 1 1 4 4 7 12 30 63 124 171 364 0
SAINT LUCIE 1,140 3 0 1 0 1 2 4 15 57 113 184 273 487 0
SANTA ROSA 617 7 0 0 1 2 0 6 13 45 66 125 166 186 0
SARASOTA 2,405 6 1 0 0 1 4 12 29 83 157 311 611 1,190 0
SEMINOLE 1,314 7 4 1 2 3 3 16 25 72 134 178 286 583 0
SUMTER 559 1 0 0 0 0 1 0 4 19 38 128 158 210 0
SUWANNEE 231 1 0 0 1 0 0 3 2 8 25 38 65 88 0
TAYLOR 97 0 0 0 0 0 0 2 0 9 18 20 21 27 0
UNION 44 0 0 0 0 0 0 2 1 3 10 7 10 11 0
VOLUSIA 2,839 8 1 1 1 4 5 32 49 126 279 439 686 1,208 0
WAKULLA 106 0 0 0 0 1 1 1 3 10 17 30 19 24 0
WALTON 235 2 0 0 0 0 1 2 2 14 26 52 62 73 1
WASHINGTON 116 0 0 0 0 0 0 1 1 7 11 21 36 39 0
98 FLORIDA VITAL STATISTICS ANNUAL REPORT 2013
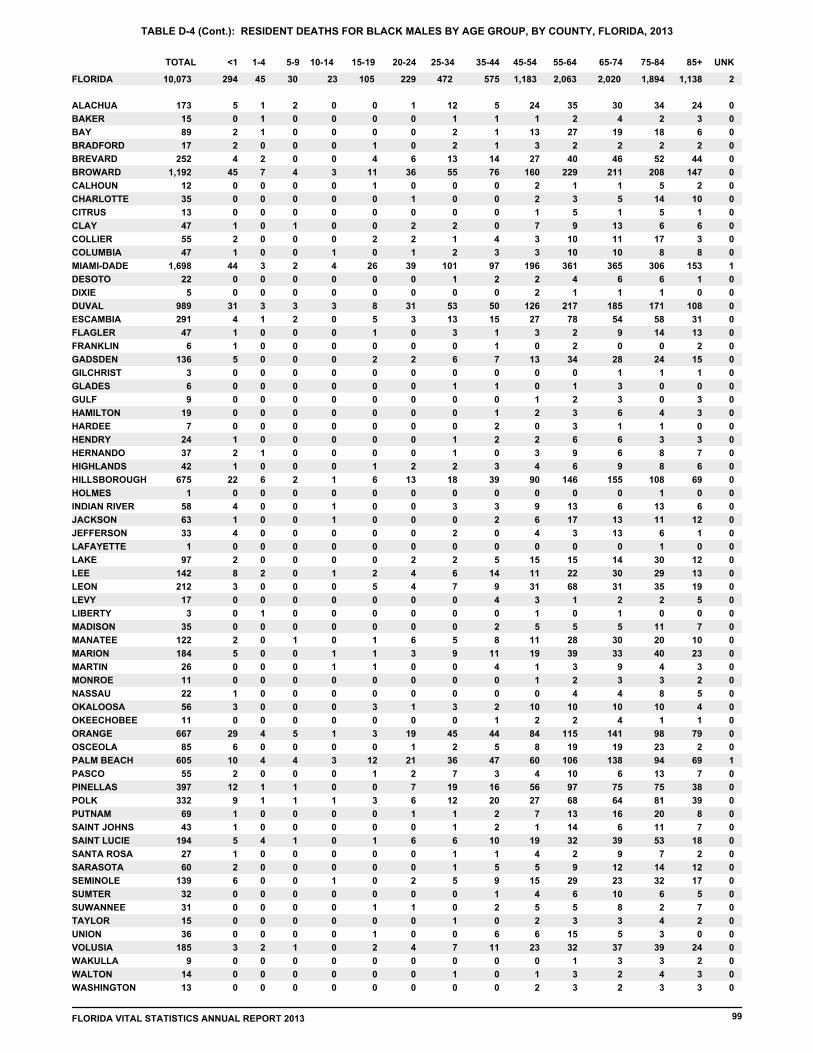
TABLE D-4 (Cont.): RESIDENT DEATHS FOR BLACK MALES BY AGE GROUP, BY COUNTY, FLORIDA, 2013
UNK85+75-8465-7455-6445-5435-4425-3420-2415-1910-145-91-4<1TOTAL
FLORIDA 10,073 294 45 30 23 105 229 472 575 1,183 2,063 2,020 1,894 1,138 2
ALACHUA 173 5 1 2 0 0 1 12 5 24 35 30 34 24 0
BAKER 15 0 1 0 0 0 0 1 1 1 2 4 2 3 0
BAY 89 2 1 0 0 0 0 2 1 13 27 19 18 6 0
BRADFORD 17 2 0 0 0 1 0 2 1 3 2 2 2 2 0
BREVARD 252 4 2 0 0 4 6 13 14 27 40 46 52 44 0
BROWARD 1,192 45 7 4 3 11 36 55 76 160 229 211 208 147 0
CALHOUN 12 0 0 0 0 1 0 0 0 2 1 1 5 2 0
CHARLOTTE 35 0 0 0 0 0 1 0 0 2 3 5 14 10 0
CITRUS 13 0 0 0 0 0 0 0 0 1 5 1 5 1 0
CLAY 47 1 0 1 0 0 2 2 0 7 9 13 6 6 0
COLLIER 55 2 0 0 0 2 2 1 4 3 10 11 17 3 0
COLUMBIA 47 1 0 0 1 0 1 2 3 3 10 10 8 8 0
MIAMI-DADE 1,698 44 3 2 4 26 39 101 97 196 361 365 306 153 1
DESOTO 22 0 0 0 0 0 0 1 2 2 4 6 6 1 0
DIXIE 5 0 0 0 0 0 0 0 0 2 1 1 1 0 0
DUVAL 989 31 3 3 3 8 31 53 50 126 217 185 171 108 0
ESCAMBIA 291 4 1 2 0 5 3 13 15 27 78 54 58 31 0
FLAGLER 47 1 0 0 0 1 0 3 1 3 2 9 14 13 0
FRANKLIN 6 1 0 0 0 0 0 0 1 0 2 0 0 2 0
GADSDEN 136 5 0 0 0 2 2 6 7 13 34 28 24 15 0
GILCHRIST 3 0 0 0 0 0 0 0 0 0 0 1 1 1 0
GLADES 6 0 0 0 0 0 0 1 1 0 1 3 0 0 0
GULF 9 0 0 0 0 0 0 0 0 1 2 3 0 3 0
HAMILTON 19 0 0 0 0 0 0 0 1 2 3 6 4 3 0
HARDEE 7 0 0 0 0 0 0 0 2 0 3 1 1 0 0
HENDRY 24 1 0 0 0 0 0 1 2 2 6 6 3 3 0
HERNANDO 37 2 1 0 0 0 0 1 0 3 9 6 8 7 0
HIGHLANDS 42 1 0 0 0 1 2 2 3 4 6 9 8 6 0
HILLSBOROUGH 675 22 6 2 1 6 13 18 39 90 146 155 108 69 0
HOLMES 1 0 0 0 0 0 0 0 0 0 0 0 1 0 0
INDIAN RIVER 58 4 0 0 1 0 0 3 3 9 13 6 13 6 0
JACKSON 63 1 0 0 1 0 0 0 2 6 17 13 11 12 0
JEFFERSON 33 4 0 0 0 0 0 2 0 4 3 13 6 1 0
LAFAYETTE 1 0 0 0 0 0 0 0 0 0 0 0 1 0 0
LAKE 97 2 0 0 0 0 2 2 5 15 15 14 30 12 0
LEE 142 8 2 0 1 2 4 6 14 11 22 30 29 13 0
LEON 212 3 0 0 0 5 4 7 9 31 68 31 35 19 0
LEVY 17 0 0 0 0 0 0 0 4 3 1 2 2 5 0
LIBERTY 3 0 1 0 0 0 0 0 0 1 0 1 0 0 0
MADISON 35 0 0 0 0 0 0 0 2 5 5 5 11 7 0
MANATEE 122 2 0 1 0 1 6 5 8 11 28 30 20 10 0
MARION 184 5 0 0 1 1 3 9 11 19 39 33 40 23 0
MARTIN 26 0 0 0 1 1 0 0 4 1 3 9 4 3 0
MONROE 11 0 0 0 0 0 0 0 0 1 2 3 3 2 0
NASSAU 22 1 0 0 0 0 0 0 0 0 4 4 8 5 0
OKALOOSA 56 3 0 0 0 3 1 3 2 10 10 10 10 4 0
OKEECHOBEE 11 0 0 0 0 0 0 0 1 2 2 4 1 1 0
ORANGE 667 29 4 5 1 3 19 45 44 84 115 141 98 79 0
OSCEOLA 85 6 0 0 0 0 1 2 5 8 19 19 23 2 0
PALM BEACH 605 10 4 4 3 12 21 36 47 60 106 138 94 69 1
PASCO 55 2 0 0 0 1 2 7 3 4 10 6 13 7 0
PINELLAS 397 12 1 1 0 0 7 19 16 56 97 75 75 38 0
POLK 332 9 1 1 1 3 6 12 20 27 68 64 81 39 0
PUTNAM 69 1 0 0 0 0 1 1 2 7 13 16 20 8 0
SAINT JOHNS 43 1 0 0 0 0 0 1 2 1 14 6 11 7 0
SAINT LUCIE 194 5 4 1 0 1 6 6 10 19 32 39 53 18 0
SANTA ROSA 27 1 0 0 0 0 0 1 1 4 2 9 7 2 0
SARASOTA 60 2 0 0 0 0 0 1 5 5 9 12 14 12 0
SEMINOLE 139 6 0 0 1 0 2 5 9 15 29 23 32 17 0
SUMTER 32 0 0 0 0 0 0 0 1 4 6 10 6 5 0
SUWANNEE 31 0 0 0 0 1 1 0 2 5 5 8 2 7 0
TAYLOR 15 0 0 0 0 0 0 1 0 2 3 3 4 2 0
UNION 36 0 0 0 0 1 0 0 6 6 15 5 3 0 0
VOLUSIA 185 3 2 1 0 2 4 7 11 23 32 37 39 24 0
WAKULLA 9 0 0 0 0 0 0 0 0 0 1 3 3 2 0
WALTON 14 0 0 0 0 0 0 1 0 1 3 2 4 3 0
WASHINGTON 13 0 0 0 0 0 0 0 0 2 3 2 3 3 0
FLORIDA VITAL STATISTICS ANNUAL REPORT 2013 99

TABLE D-4 (Cont.): RESIDENT DEATHS FOR BLACK FEMALES BY AGE GROUP, BY COUNTY, FLORIDA, 2013
UNK85+75-8465-7455-6445-5435-4425-3420-2415-1910-145-91-4<1TOTAL
FLORIDA 9,358 222 33 18 18 41 99 214 446 867 1,562 1,625 1,998 2,214 1
ALACHUA 178 6 0 1 0 1 3 4 4 13 38 25 34 49 0
BAKER 10 0 0 0 0 1 0 0 1 2 2 2 1 1 0
BAY 74 2 0 0 0 0 0 3 7 4 9 15 16 18 0
BRADFORD 18 0 0 0 0 0 0 0 0 1 4 2 4 7 0
BREVARD 195 3 0 1 0 2 3 3 10 14 23 39 44 53 0
BROWARD 1,104 24 0 7 5 7 13 25 61 118 200 203 217 224 0
CALHOUN 6 0 0 0 0 0 0 0 0 2 2 1 1 0 0
CHARLOTTE 48 0 0 0 0 0 0 0 1 1 8 7 8 23 0
CITRUS 17 0 0 0 0 0 0 1 1 3 3 2 2 5 0
CLAY 46 0 0 0 0 0 1 2 2 1 7 7 9 17 0
COLLIER 44 2 0 1 0 1 1 1 5 5 8 6 8 6 0
COLUMBIA 52 0 0 0 0 0 0 0 5 7 7 10 15 8 0
MIAMI-DADE 1,528 19 5 1 3 4 21 32 65 148 257 275 315 383 0
DESOTO 15 0 0 0 0 1 0 0 0 3 2 3 3 3 0
DIXIE 0 0 0 0 0 0 0 0 0 0 0 0 0 0 0
DUVAL 986 31 4 0 1 1 12 20 50 93 164 157 227 226 0
ESCAMBIA 285 9 1 0 1 2 3 6 10 21 51 44 54 83 0
FLAGLER 40 0 0 0 0 0 0 2 2 2 7 2 13 12 0
FRANKLIN 7 0 0 0 0 0 0 0 0 1 3 0 2 1 0
GADSDEN 129 3 0 1 1 0 2 4 3 5 27 13 36 34 0
GILCHRIST 2 0 0 0 0 0 0 0 0 0 2 0 0 0 0
GLADES 1 0 0 0 0 1 0 0 0 0 0 0 0 0 0
GULF 4 0 0 0 0 0 0 0 0 0 2 0 0 2 0
HAMILTON 14 0 0 0 0 0 0 1 1 2 2 4 2 2 0
HARDEE 7 0 0 0 0 0 0 1 0 0 1 2 1 2 0
HENDRY 20 0 0 0 0 0 0 0 0 1 3 3 8 5 0
HERNANDO 29 0 0 0 0 0 0 2 1 1 6 3 8 8 0
HIGHLANDS 34 0 0 0 0 0 1 0 0 6 5 7 6 9 0
HILLSBOROUGH 626 20 0 1 2 3 6 13 26 54 116 110 132 143 0
HOLMES 6 0 0 0 0 0 0 0 0 0 1 3 0 2 0
INDIAN RIVER 45 0 1 0 0 1 0 0 1 2 6 12 12 10 0
JACKSON 62 1 1 0 0 0 0 2 0 1 5 13 16 23 0
JEFFERSON 19 0 0 0 0 0 0 0 0 2 2 3 7 5 0
LAFAYETTE 3 0 0 0 0 0 0 0 0 0 0 2 1 0 0
LAKE 110 2 2 0 0 0 1 1 8 15 16 21 27 17 0
LEE 132 3 2 0 0 1 2 4 8 11 27 23 27 24 0
LEON 229 3 0 0 0 1 0 8 16 14 29 36 58 64 0
LEVY 26 0 0 0 0 0 0 1 3 2 6 2 5 7 0
LIBERTY 2 0 1 0 0 0 0 0 0 0 0 0 1 0 0
MADISON 29 0 0 0 0 0 0 1 0 5 2 2 5 14 0
MANATEE 97 4 0 0 0 0 2 2 2 7 19 23 12 26 0
MARION 164 4 2 0 0 0 0 4 2 12 17 37 42 44 0
MARTIN 30 1 0 0 0 1 0 0 4 3 4 5 8 4 0
MONROE 9 1 0 0 0 0 0 0 0 0 1 0 6 1 0
NASSAU 25 0 0 0 0 0 0 0 0 4 2 6 10 3 0
OKALOOSA 41 2 0 0 0 0 2 1 1 4 4 5 8 14 0
OKEECHOBEE 6 0 0 0 0 0 0 0 2 2 0 0 2 0 0
ORANGE 664 29 5 1 1 2 6 12 34 73 121 113 133 134 0
OSCEOLA 84 3 0 0 0 0 2 1 4 7 7 16 28 16 0
PALM BEACH 580 19 3 0 3 4 10 13 27 54 109 99 104 134 1
PASCO 45 1 0 0 0 0 1 2 2 6 6 10 10 7 0
PINELLAS 341 8 1 1 0 2 3 9 16 31 57 69 71 73 0
POLK 302 7 1 0 0 1 3 9 25 32 46 47 70 61 0
PUTNAM 48 2 0 0 0 0 0 1 1 5 5 6 17 11 0
SAINT JOHNS 37 0 0 0 0 0 0 0 1 3 7 9 5 12 0
SAINT LUCIE 171 3 0 0 0 0 0 5 13 14 32 27 37 40 0
SANTA ROSA 21 0 0 0 0 0 0 1 1 4 4 5 2 4 0
SARASOTA 74 1 1 0 0 0 1 2 3 9 4 15 12 26 0
SEMINOLE 144 4 0 1 0 3 0 2 5 12 23 25 31 38 0
SUMTER 25 0 0 0 0 0 0 1 1 2 2 6 6 7 0
SUWANNEE 12 1 1 0 0 0 0 0 1 2 2 3 0 2 0
TAYLOR 8 0 0 0 0 1 0 0 1 1 0 1 2 2 0
UNION 12 0 0 0 0 0 0 0 0 1 3 0 3 5 0
VOLUSIA 202 2 2 0 0 0 0 9 8 18 27 36 47 53 0
WAKULLA 10 1 0 1 0 0 0 2 0 0 2 1 2 1 0
WALTON 12 1 0 1 1 0 0 1 1 1 2 0 2 2 0
WASHINGTON 11 0 0 0 0 0 0 0 0 0 3 2 3 3 0
100 FLORIDA VITAL STATISTICS ANNUAL REPORT 2013

TABLE D-4 (Cont.): RESIDENT DEATHS FOR OTHER MALES BY AGE GROUP, BY COUNTY, FLORIDA, 2013
UNK85+75-8465-7455-6445-5435-4425-3420-2415-1910-145-91-4<1TOTAL
FLORIDA 1,592 43 10 3 4 19 29 67 88 124 269 331 377 228 0
ALACHUA 17 1 0 0 0 0 0 0 1 1 4 1 8 1 0
BAKER 1 0 0 0 0 0 0 0 0 0 0 1 0 0 0
BAY 21 2 0 0 0 0 0 1 2 3 4 3 4 2 0
BRADFORD 0 0 0 0 0 0 0 0 0 0 0 0 0 0 0
BREVARD 45 2 0 0 0 0 1 2 1 3 4 10 14 8 0
BROWARD 232 5 1 0 2 2 2 9 15 18 41 47 50 40 0
CALHOUN 0 0 0 0 0 0 0 0 0 0 0 0 0 0 0
CHARLOTTE 7 0 0 0 0 0 1 0 0 1 1 1 0 3 0
CITRUS 9 1 0 0 0 0 0 0 2 0 2 2 1 1 0
CLAY 24 0 0 0 0 1 1 1 1 1 2 7 9 1 0
COLLIER 22 1 0 0 0 0 0 1 2 1 3 6 6 2 0
COLUMBIA 2 0 0 0 0 0 0 0 0 0 0 1 1 0 0
MIAMI-DADE 168 3 0 0 0 1 3 9 8 7 22 48 49 18 0
DESOTO 1 0 0 0 0 0 0 0 0 0 0 1 0 0 0
DIXIE 2 0 0 0 0 0 0 0 0 0 1 0 1 0 0
DUVAL 84 3 0 0 0 2 1 2 6 8 19 15 21 7 0
ESCAMBIA 36 2 2 1 0 1 0 1 3 4 4 8 8 2 0
FLAGLER 7 0 0 0 0 0 0 0 0 0 0 2 4 1 0
FRANKLIN 0 0 0 0 0 0 0 0 0 0 0 0 0 0 0
GADSDEN 2 0 0 0 0 1 0 0 0 0 0 0 1 0 0
GILCHRIST 0 0 0 0 0 0 0 0 0 0 0 0 0 0 0
GLADES 4 0 0 1 0 0 0 0 1 1 0 1 0 0 0
GULF 2 0 0 0 0 1 0 0 0 0 0 0 0 1 0
HAMILTON 0 0 0 0 0 0 0 0 0 0 0 0 0 0 0
HARDEE 2 0 0 0 0 0 0 0 0 1 0 1 0 0 0
HENDRY 5 1 0 0 0 1 0 1 0 0 2 0 0 0 0
HERNANDO 18 0 0 0 0 0 0 1 2 3 3 3 5 1 0
HIGHLANDS 11 0 0 0 0 0 0 0 1 1 3 2 4 0 0
HILLSBOROUGH 128 2 1 0 0 4 6 5 5 13 25 25 25 17 0
HOLMES 1 0 0 0 0 0 0 0 0 0 0 0 1 0 0
INDIAN RIVER 10 2 1 0 0 0 0 0 0 2 0 2 2 1 0
JACKSON 1 0 0 0 0 0 0 0 0 0 1 0 0 0 0
JEFFERSON 0 0 0 0 0 0 0 0 0 0 0 0 0 0 0
LAFAYETTE 0 0 0 0 0 0 0 0 0 0 0 0 0 0 0
LAKE 22 1 0 0 0 0 0 0 1 1 4 5 7 3 0
LEE 31 0 1 0 0 0 0 1 0 4 6 5 9 5 0
LEON 14 0 0 0 0 0 0 3 1 3 1 2 1 3 0
LEVY 1 0 0 0 0 0 1 0 0 0 0 0 0 0 0
LIBERTY 0 0 0 0 0 0 0 0 0 0 0 0 0 0 0
MADISON 0 0 0 0 0 0 0 0 0 0 0 0 0 0 0
MANATEE 24 0 1 0 0 0 0 0 2 2 3 8 8 0 0
MARION 26 0 0 0 0 0 1 0 0 4 4 6 6 5 0
MARTIN 4 1 0 0 0 0 0 0 0 0 1 0 2 0 0
MONROE 3 1 0 0 0 0 0 0 1 0 0 0 0 1 0
NASSAU 3 0 0 0 0 0 0 2 0 0 1 0 0 0 0
OKALOOSA 21 0 1 0 0 0 0 1 7 4 4 2 0 2 0
OKEECHOBEE 2 0 0 0 0 0 0 1 0 0 0 1 0 0 0
ORANGE 143 4 0 1 0 2 3 7 8 8 26 32 32 20 0
OSCEOLA 26 0 0 0 0 0 1 2 3 2 1 2 8 7 0
PALM BEACH 114 3 0 0 0 3 2 9 8 7 19 22 24 17 0
PASCO 37 2 0 0 0 0 0 1 0 3 6 5 8 12 0
PINELLAS 79 1 0 0 0 0 2 3 1 8 14 15 22 13 0
POLK 25 0 0 0 0 0 0 0 1 2 8 6 3 5 0
PUTNAM 5 1 0 0 0 0 0 0 0 1 1 2 0 0 0
SAINT JOHNS 14 1 0 0 0 0 1 0 0 0 0 7 2 3 0
SAINT LUCIE 32 1 0 0 0 0 0 0 1 0 8 6 6 10 0
SANTA ROSA 6 0 0 0 0 0 0 0 0 1 1 2 2 0 0
SARASOTA 16 0 0 0 0 0 0 0 1 3 3 2 2 5 0
SEMINOLE 38 0 0 0 0 0 2 1 1 1 6 5 17 5 0
SUMTER 4 0 0 0 1 0 0 0 0 0 1 0 1 1 0
SUWANNEE 2 0 0 0 0 0 0 1 0 0 1 0 0 0 0
TAYLOR 2 0 0 0 0 0 0 0 0 0 0 2 0 0 0
UNION 1 0 0 0 0 0 0 0 0 1 0 0 0 0 0
VOLUSIA 31 1 2 0 1 0 1 1 2 1 9 5 3 5 0
WAKULLA 0 0 0 0 0 0 0 0 0 0 0 0 0 0 0
WALTON 4 1 0 0 0 0 0 1 0 0 0 2 0 0 0
WASHINGTON 0 0 0 0 0 0 0 0 0 0 0 0 0 0 0
FLORIDA VITAL STATISTICS ANNUAL REPORT 2013 101

TABLE D-4 (Cont.): RESIDENT DEATHS FOR OTHER FEMALES BY AGE GROUP, BY COUNTY, FLORIDA, 2013
UNK85+75-8465-7455-6445-5435-4425-3420-2415-1910-145-91-4<1TOTAL
FLORIDA 1,591 46 12 8 5 14 15 26 60 117 190 273 410 415 0
ALACHUA 11 2 0 0 0 0 0 0 0 2 2 2 1 2 0
BAKER 1 0 0 0 0 0 0 0 0 0 0 0 1 0 0
BAY 13 1 0 0 0 0 0 1 0 1 1 5 4 0 0
BRADFORD 1 0 0 0 0 0 0 0 0 0 1 0 0 0 0
BREVARD 56 2 1 0 0 1 0 0 0 8 6 9 14 15 0
BROWARD 254 6 4 2 0 2 3 4 8 19 28 33 69 76 0
CALHOUN 2 0 0 0 0 0 0 0 0 0 0 1 0 1 0
CHARLOTTE 15 0 0 0 0 0 0 0 0 1 2 1 3 8 0
CITRUS 14 0 0 0 0 0 0 0 0 2 2 5 4 1 0
CLAY 19 1 0 0 0 1 1 0 0 3 4 3 4 2 0
COLLIER 11 1 0 0 0 0 1 0 2 1 0 5 0 1 0
COLUMBIA 5 0 0 0 0 1 0 0 1 1 1 0 0 1 0
MIAMI-DADE 148 2 0 0 0 2 0 6 5 8 20 18 28 59 0
DESOTO 0 0 0 0 0 0 0 0 0 0 0 0 0 0 0
DIXIE 0 0 0 0 0 0 0 0 0 0 0 0 0 0 0
DUVAL 99 3 1 1 1 2 1 0 8 9 11 16 23 23 0
ESCAMBIA 42 2 0 0 0 0 0 1 3 4 3 9 12 8 0
FLAGLER 11 0 0 0 0 0 0 0 0 1 0 1 3 6 0
FRANKLIN 1 0 0 0 0 0 0 0 0 0 0 0 1 0 0
GADSDEN 0 0 0 0 0 0 0 0 0 0 0 0 0 0 0
GILCHRIST 0 0 0 0 0 0 0 0 0 0 0 0 0 0 0
GLADES 2 0 0 0 0 0 0 0 0 1 1 0 0 0 0
GULF 1 0 0 0 0 0 0 0 0 1 0 0 0 0 0
HAMILTON 1 0 0 0 0 0 0 0 0 0 0 0 1 0 0
HARDEE 1 0 0 0 0 0 0 0 0 0 0 1 0 0 0
HENDRY 2 0 0 0 0 0 0 0 0 0 0 0 2 0 0
HERNANDO 17 0 0 0 0 0 0 0 0 2 3 4 8 0 0
HIGHLANDS 9 1 1 0 0 0 0 0 0 1 1 0 4 1 0
HILLSBOROUGH 116 6 1 1 0 0 1 1 7 8 14 26 30 21 0
HOLMES 2 0 0 0 0 0 0 0 0 0 0 0 1 1 0
INDIAN RIVER 6 0 0 0 0 0 0 0 1 2 1 1 1 0 0
JACKSON 4 1 0 0 1 0 0 0 0 0 0 2 0 0 0
JEFFERSON 0 0 0 0 0 0 0 0 0 0 0 0 0 0 0
LAFAYETTE 0 0 0 0 0 0 0 0 0 0 0 0 0 0 0
LAKE 21 0 0 0 0 0 0 0 1 3 6 4 4 3 0
LEE 25 1 1 0 0 0 0 0 1 3 2 7 6 4 0
LEON 22 2 0 0 0 0 1 0 2 1 2 2 4 8 0
LEVY 0 0 0 0 0 0 0 0 0 0 0 0 0 0 0
LIBERTY 0 0 0 0 0 0 0 0 0 0 0 0 0 0 0
MADISON 0 0 0 0 0 0 0 0 0 0 0 0 0 0 0
MANATEE 11 1 0 1 0 0 0 0 1 0 3 0 2 3 0
MARION 25 0 0 0 0 0 0 1 1 2 1 6 10 4 0
MARTIN 3 0 0 0 0 0 0 0 0 1 0 0 2 0 0
MONROE 1 0 0 0 0 0 0 0 0 1 0 0 0 0 0
NASSAU 3 0 0 0 0 0 0 0 0 0 0 0 2 1 0
OKALOOSA 35 2 0 0 1 0 0 1 0 2 6 8 9 6 0
OKEECHOBEE 3 0 0 0 0 0 0 0 0 0 0 3 0 0 0
ORANGE 130 1 1 0 0 1 1 1 2 7 11 29 38 38 0
OSCEOLA 39 1 0 0 1 1 1 0 0 2 5 10 7 11 0
PALM BEACH 121 4 0 0 1 3 0 2 6 7 14 20 27 37 0
PASCO 25 1 0 0 0 0 0 1 1 2 3 4 7 6 0
PINELLAS 80 1 0 1 0 0 1 4 4 4 11 8 29 17 0
POLK 41 1 0 1 0 0 1 0 3 0 4 11 8 12 0
PUTNAM 4 0 0 0 0 0 0 0 0 1 0 1 1 1 0
SAINT JOHNS 4 0 0 0 0 0 1 0 0 0 1 0 1 1 0
SAINT LUCIE 25 0 1 0 0 0 0 1 2 1 5 3 5 7 0
SANTA ROSA 9 0 0 0 0 0 0 0 0 1 3 2 2 1 0
SARASOTA 19 0 0 0 0 0 0 0 0 1 3 2 5 8 0
SEMINOLE 41 1 0 0 0 0 0 0 1 1 4 6 17 11 0
SUMTER 8 0 1 0 0 0 0 0 0 1 0 2 1 3 0
SUWANNEE 5 1 0 0 0 0 0 0 0 0 0 0 3 1 0
TAYLOR 1 0 0 0 0 0 0 0 0 0 0 0 1 0 0
UNION 0 0 0 0 0 0 0 0 0 0 0 0 0 0 0
VOLUSIA 21 0 0 1 0 0 1 2 0 1 4 2 4 6 0
WAKULLA 1 0 0 0 0 0 0 0 0 0 0 1 0 0 0
WALTON 4 1 0 0 0 0 1 0 0 0 1 0 1 0 0
WASHINGTON 0 0 0 0 0 0 0 0 0 0 0 0 0 0 0
102 FLORIDA VITAL STATISTICS ANNUAL REPORT 2013
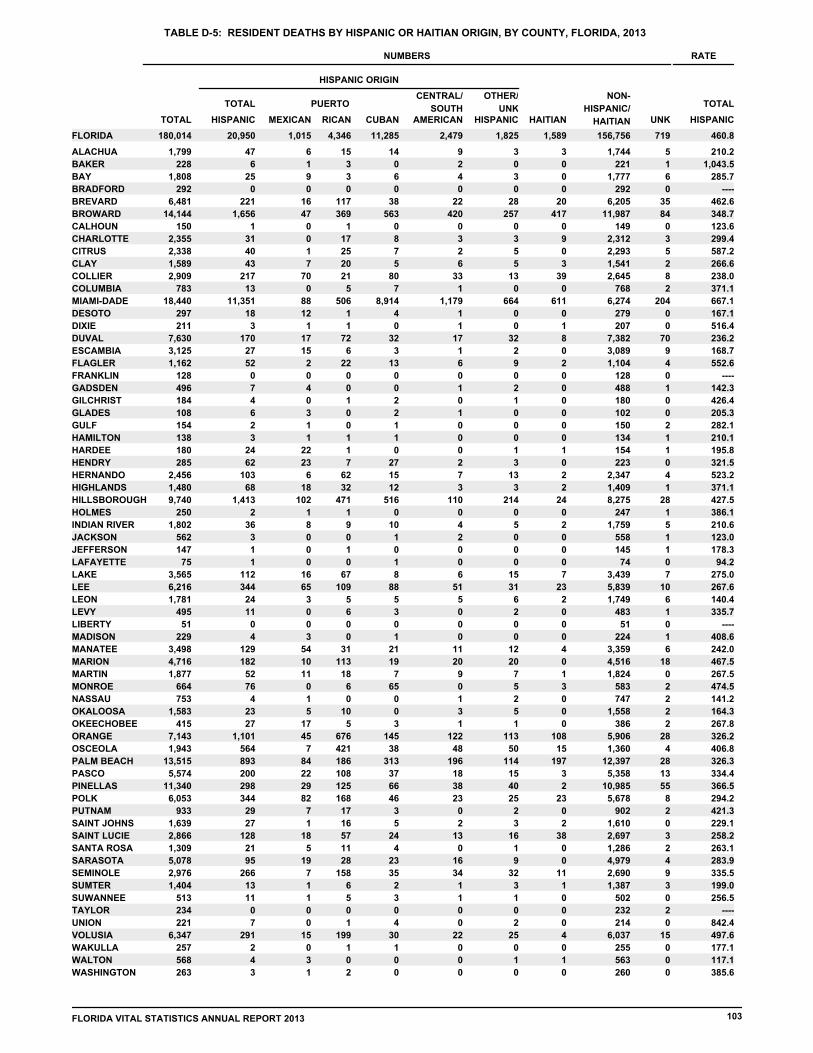
TOTAL HISPANICCUBANRICANMEXICANHISPANIC
NON-
HISPANIC/
HAITIAN
NUMBERS
UNK
RATE
TOTAL
HAITIANHISPANICAMERICAN
OTHER/
UNK
CENTRAL/
SOUTHPUERTOTOTAL
HISPANIC ORIGIN
TABLE D-5: RESIDENT DEATHS BY HISPANIC OR HAITIAN ORIGIN, BY COUNTY, FLORIDA, 2013
FLORIDA 180,014 20,950 1,015 4,346 11,285 2,479 1,825 1,589 156,756 719 460.8
ALACHUA 1,799 47 6 15 14 9 3 3 1,744 5 210.2
BAKER 228 6 1 3 0 2 0 0 221 1 1,043.5
BAY 1,808 25 9 3 6 4 3 0 1,777 6 285.7
BRADFORD 292 0 0 0 0 0 0 0 292 0 ----
BREVARD 6,481 221 16 117 38 22 28 20 6,205 35 462.6
BROWARD 14,144 1,656 47 369 563 420 257 417 11,987 84 348.7
CALHOUN 150 1 0 1 0 0 0 0 149 0 123.6
CHARLOTTE 2,355 31 0 17 8 3 3 9 2,312 3 299.4
CITRUS 2,338 40 1 25 7 2 5 0 2,293 5 587.2
CLAY 1,589 43 7 20 5 6 5 3 1,541 2 266.6
COLLIER 2,909 217 70 21 80 33 13 39 2,645 8 238.0
COLUMBIA 783 13 0 5 7 1 0 0 768 2 371.1
MIAMI-DADE 18,440 11,351 88 506 8,914 1,179 664 611 6,274 204 667.1
DESOTO 297 18 12 1 4 1 0 0 279 0 167.1
DIXIE 211 3 1 1 0 1 0 1 207 0 516.4
DUVAL 7,630 170 17 72 32 17 32 8 7,382 70 236.2
ESCAMBIA 3,125 27 15 6 3 1 2 0 3,089 9 168.7
FLAGLER 1,162 52 2 22 13 6 9 2 1,104 4 552.6
FRANKLIN 128 0 0 0 0 0 0 0 128 0 ----
GADSDEN 496 7 4 0 0 1 2 0 488 1 142.3
GILCHRIST 184 4 0 1 2 0 1 0 180 0 426.4
GLADES 108 6 3 0 2 1 0 0 102 0 205.3
GULF 154 2 1 0 1 0 0 0 150 2 282.1
HAMILTON 138 3 1 1 1 0 0 0 134 1 210.1
HARDEE 180 24 22 1 0 0 1 1 154 1 195.8
HENDRY 285 62 23 7 27 2 3 0 223 0 321.5
HERNANDO 2,456 103 6 62 15 7 13 2 2,347 4 523.2
HIGHLANDS 1,480 68 18 32 12 3 3 2 1,409 1 371.1
HILLSBOROUGH 9,740 1,413 102 471 516 110 214 24 8,275 28 427.5
HOLMES 250 2 1 1 0 0 0 0 247 1 386.1
INDIAN RIVER 1,802 36 8 9 10 4 5 2 1,759 5 210.6
JACKSON 562 3 0 0 1 2 0 0 558 1 123.0
JEFFERSON 147 1 0 1 0 0 0 0 145 1 178.3
LAFAYETTE 75 1 0 0 1 0 0 0 74 0 94.2
LAKE 3,565 112 16 67 8 6 15 7 3,439 7 275.0
LEE 6,216 344 65 109 88 51 31 23 5,839 10 267.6
LEON 1,781 24 3 5 5 5 6 2 1,749 6 140.4
LEVY 495 11 0 6 3 0 2 0 483 1 335.7
LIBERTY 51 0 0 0 0 0 0 0 51 0 ----
MADISON 229 4 3 0 1 0 0 0 224 1 408.6
MANATEE 3,498 129 54 31 21 11 12 4 3,359 6 242.0
MARION 4,716 182 10 113 19 20 20 0 4,516 18 467.5
MARTIN 1,877 52 11 18 7 9 7 1 1,824 0 267.5
MONROE 664 76 0 6 65 0 5 3 583 2 474.5
NASSAU 753 4 1 0 0 1 2 0 747 2 141.2
OKALOOSA 1,583 23 5 10 0 3 5 0 1,558 2 164.3
OKEECHOBEE 415 27 17 5 3 1 1 0 386 2 267.8
ORANGE 7,143 1,101 45 676 145 122 113 108 5,906 28 326.2
OSCEOLA 1,943 564 7 421 38 48 50 15 1,360 4 406.8
PALM BEACH 13,515 893 84 186 313 196 114 197 12,397 28 326.3
PASCO 5,574 200 22 108 37 18 15 3 5,358 13 334.4
PINELLAS 11,340 298 29 125 66 38 40 2 10,985 55 366.5
POLK 6,053 344 82 168 46 23 25 23 5,678 8 294.2
PUTNAM 933 29 7 17 3 0 2 0 902 2 421.3
SAINT JOHNS 1,639 27 1 16 5 2 3 2 1,610 0 229.1
SAINT LUCIE 2,866 128 18 57 24 13 16 38 2,697 3 258.2
SANTA ROSA 1,309 21 5 11 4 0 1 0 1,286 2 263.1
SARASOTA 5,078 95 19 28 23 16 9 0 4,979 4 283.9
SEMINOLE 2,976 266 7 158 35 34 32 11 2,690 9 335.5
SUMTER 1,404 13 1 6 2 1 3 1 1,387 3 199.0
SUWANNEE 513 11 1 5 3 1 1 0 502 0 256.5
TAYLOR 234 0 0 0 0 0 0 0 232 2 ----
UNION 221 7 0 1 4 0 2 0 214 0 842.4
VOLUSIA 6,347 291 15 199 30 22 25 4 6,037 15 497.6
WAKULLA 257 2 0 1 1 0 0 0 255 0 177.1
WALTON 568 4 3 0 0 0 1 1 563 0 117.1
WASHINGTON 263 3 1 2 0 0 0 0 260 0 385.6
FLORIDA VITAL STATISTICS ANNUAL REPORT 2013 103
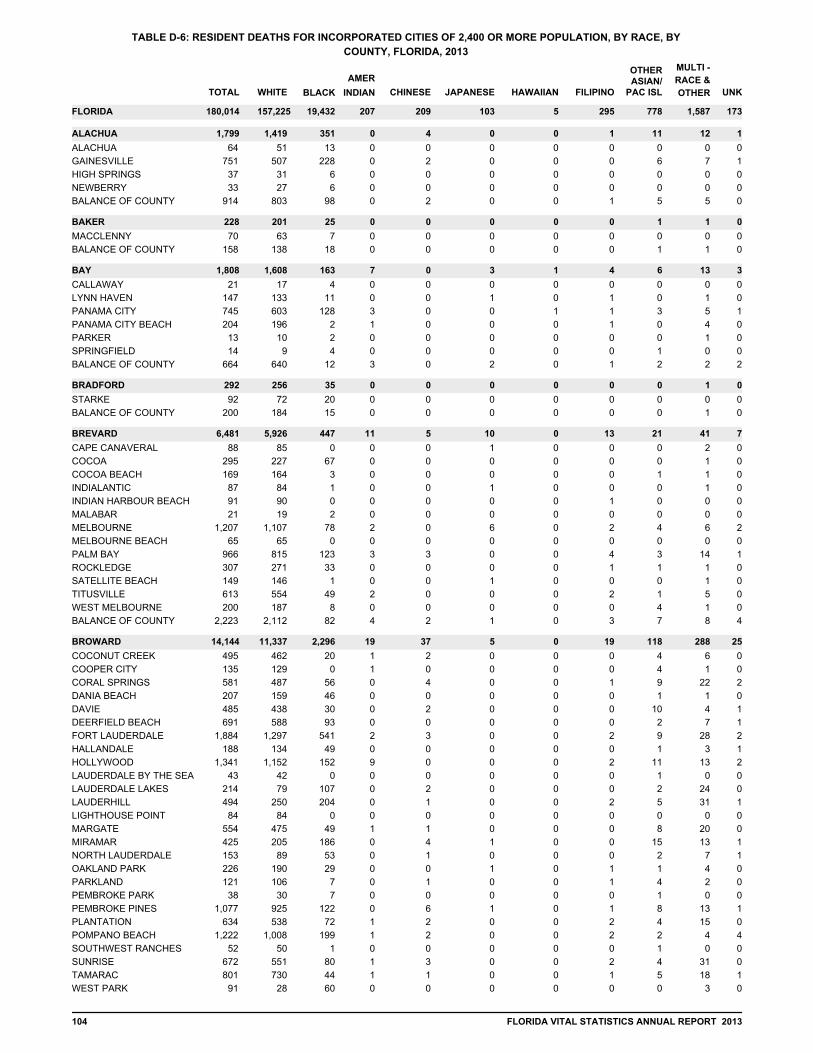
UNK
MULTI -
RACE &
OTHER
OTHERASIAN/
PAC ISLFILIPINOHAWAIIANJAPANESECHINESE
AMER
INDIANBLACKWHITETOTAL
TABLE D-6: RESIDENT DEATHS FOR INCORPORATED CITIES OF 2,400 OR MORE POPULATION, BY RACE, BY
COUNTY, FLORIDA, 2013
FLORIDA 180,014 157,225 19,432 207 209 103 5 295 778 1,587 173
1,799 1,419 351 0 4 0 0 1 11 12 1ALACHUA
ALACHUA 64 51 13 0 0 0 0 0 0 0 0
GAINESVILLE 751 507 228 0 2 0 0 0 6 7 1
HIGH SPRINGS 37 31 6 0 0 0 0 0 0 0 0
NEWBERRY 33 27 6 0 0 0 0 0 0 0 0
BALANCE OF COUNTY 914 803 98 0 2 0 0 1 5 5 0
228 201 25 0 0 0 0 0 1 1 0BAKER
MACCLENNY 70 63 7 0 0 0 0 0 0 0 0
BALANCE OF COUNTY 158 138 18 0 0 0 0 0 1 1 0
1,808 1,608 163 7 0 3 1 4 6 13 3BAY
CALLAWAY 21 17 4 0 0 0 0 0 0 0 0
LYNN HAVEN 147 133 11 0 0 1 0 1 0 1 0
PANAMA CITY 745 603 128 3 0 0 1 1 3 5 1
PANAMA CITY BEACH 204 196 2 1 0 0 0 1 0 4 0
PARKER 13 10 2 0 0 0 0 0 0 1 0
SPRINGFIELD 14 9 4 0 0 0 0 0 1 0 0
BALANCE OF COUNTY 664 640 12 3 0 2 0 1 2 2 2
292 256 35 0 0 0 0 0 0 1 0BRADFORD
STARKE 92 72 20 0 0 0 0 0 0 0 0
BALANCE OF COUNTY 200 184 15 0 0 0 0 0 0 1 0
6,481 5,926 447 11 5 10 0 13 21 41 7BREVARD
CAPE CANAVERAL 88 85 0 0 0 1 0 0 0 2 0
COCOA 295 227 67 0 0 0 0 0 0 1 0
COCOA BEACH 169 164 3 0 0 0 0 0 1 1 0
INDIALANTIC 87 84 1 0 0 1 0 0 0 1 0
INDIAN HARBOUR BEACH 91 90 0 0 0 0 0 1 0 0 0
MALABAR 21 19 2 0 0 0 0 0 0 0 0
MELBOURNE 1,207 1,107 78 2 0 6 0 2 4 6 2
MELBOURNE BEACH 65 65 0 0 0 0 0 0 0 0 0
PALM BAY 966 815 123 3 3 0 0 4 3 14 1
ROCKLEDGE 307 271 33 0 0 0 0 1 1 1 0
SATELLITE BEACH 149 146 1 0 0 1 0 0 0 1 0
TITUSVILLE 613 554 49 2 0 0 0 2 1 5 0
WEST MELBOURNE 200 187 8 0 0 0 0 0 4 1 0
BALANCE OF COUNTY 2,223 2,112 82 4 2 1 0 3 7 8 4
14,144 11,337 2,296 19 37 5 0 19 118 288 25BROWARD
COCONUT CREEK 495 462 20 1 2 0 0 0 4 6 0
COOPER CITY 135 129 0 1 0 0 0 0 4 1 0
CORAL SPRINGS 581 487 56 0 4 0 0 1 9 22 2
DANIA BEACH 207 159 46 0 0 0 0 0 1 1 0
DAVIE 485 438 30 0 2 0 0 0 10 4 1
DEERFIELD BEACH 691 588 93 0 0 0 0 0 2 7 1
FORT LAUDERDALE 1,884 1,297 541 2 3 0 0 2 9 28 2
HALLANDALE 188 134 49 0 0 0 0 0 1 3 1
HOLLYWOOD 1,341 1,152 152 9 0 0 0 2 11 13 2
LAUDERDALE BY THE SEA 43 42 0 0 0 0 0 0 1 0 0
LAUDERDALE LAKES 214 79 107 0 2 0 0 0 2 24 0
LAUDERHILL 494 250 204 0 1 0 0 2 5 31 1
LIGHTHOUSE POINT 84 84 0 0 0 0 0 0 0 0 0
MARGATE 554 475 49 1 1 0 0 0 8 20 0
MIRAMAR 425 205 186 0 4 1 0 0 15 13 1
NORTH LAUDERDALE 153 89 53 0 1 0 0 0 2 7 1
OAKLAND PARK 226 190 29 0 0 1 0 1 1 4 0
PARKLAND 121 106 7 0 1 0 0 1 4 2 0
PEMBROKE PARK 38 30 7 0 0 0 0 0 1 0 0
PEMBROKE PINES 1,077 925 122 0 6 1 0 1 8 13 1
PLANTATION 634 538 72 1 2 0 0 2 4 15 0
POMPANO BEACH 1,222 1,008 199 1 2 0 0 2 2 4 4
SOUTHWEST RANCHES 52 50 1 0 0 0 0 0 1 0 0
SUNRISE 672 551 80 1 3 0 0 2 4 31 0
TAMARAC 801 730 44 1 1 0 0 1 5 18 1
WEST PARK 91 28 60 0 0 0 0 0 0 3 0
104 FLORIDA VITAL STATISTICS ANNUAL REPORT 2013
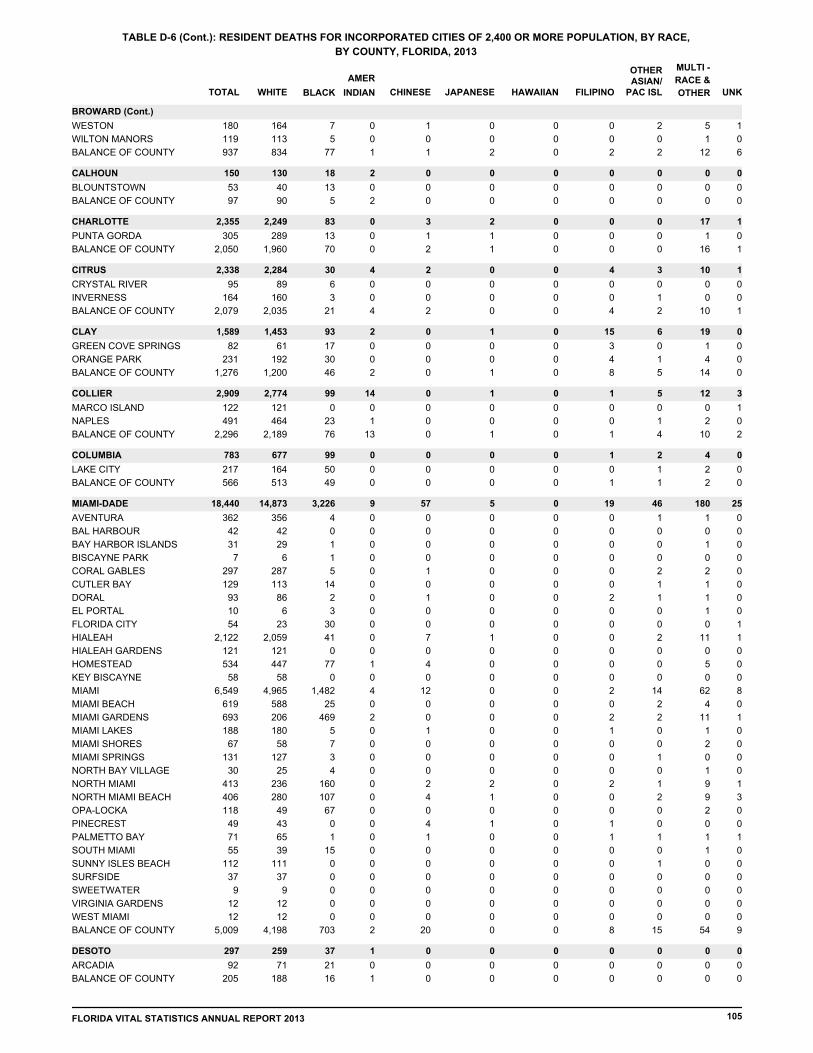
UNK
MULTI -
RACE &
OTHER
OTHERASIAN/
PAC ISLFILIPINOHAWAIIANJAPANESECHINESE
AMER
INDIANBLACKWHITETOTAL
TABLE D-6 (Cont.): RESIDENT DEATHS FOR INCORPORATED CITIES OF 2,400 OR MORE POPULATION, BY RACE,
BY COUNTY, FLORIDA, 2013
BROWARD (Cont.)
WESTON 180 164 7 0 1 0 0 0 2 5 1
WILTON MANORS 119 113 5 0 0 0 0 0 0 1 0
BALANCE OF COUNTY 937 834 77 1 1 2 0 2 2 12 6
150 130 18 2 0 0 0 0 0 0 0CALHOUN
BLOUNTSTOWN 53 40 13 0 0 0 0 0 0 0 0
BALANCE OF COUNTY 97 90 5 2 0 0 0 0 0 0 0
2,355 2,249 83 0 3 2 0 0 0 17 1CHARLOTTE
PUNTA GORDA 305 289 13 0 1 1 0 0 0 1 0
BALANCE OF COUNTY 2,050 1,960 70 0 2 1 0 0 0 16 1
2,338 2,284 30 4 2 0 0 4 3 10 1CITRUS
CRYSTAL RIVER 95 89 6 0 0 0 0 0 0 0 0
INVERNESS 164 160 3 0 0 0 0 0 1 0 0
BALANCE OF COUNTY 2,079 2,035 21 4 2 0 0 4 2 10 1
1,589 1,453 93 2 0 1 0 15 6 19 0CLAY
GREEN COVE SPRINGS 82 61 17 0 0 0 0 3 0 1 0
ORANGE PARK 231 192 30 0 0 0 0 4 1 4 0
BALANCE OF COUNTY 1,276 1,200 46 2 0 1 0 8 5 14 0
2,909 2,774 99 14 0 1 0 1 5 12 3COLLIER
MARCO ISLAND 122 121 0 0 0 0 0 0 0 0 1
NAPLES 491 464 23 1 0 0 0 0 1 2 0
BALANCE OF COUNTY 2,296 2,189 76 13 0 1 0 1 4 10 2
783 677 99 0 0 0 0 1 2 4 0COLUMBIA
LAKE CITY 217 164 50 0 0 0 0 0 1 2 0
BALANCE OF COUNTY 566 513 49 0 0 0 0 1 1 2 0
18,440 14,873 3,226 9 57 5 0 19 46 180 25MIAMI-DADE
AVENTURA 362 356 4 0 0 0 0 0 1 1 0
BAL HARBOUR 42 42 0 0 0 0 0 0 0 0 0
BAY HARBOR ISLANDS 31 29 1 0 0 0 0 0 0 1 0
BISCAYNE PARK 7 6 1 0 0 0 0 0 0 0 0
CORAL GABLES 297 287 5 0 1 0 0 0 2 2 0
CUTLER BAY 129 113 14 0 0 0 0 0 1 1 0
DORAL 93 86 2 0 1 0 0 2 1 1 0
EL PORTAL 10 6 3 0 0 0 0 0 0 1 0
FLORIDA CITY 54 23 30 0 0 0 0 0 0 0 1
HIALEAH 2,122 2,059 41 0 7 1 0 0 2 11 1
HIALEAH GARDENS 121 121 0 0 0 0 0 0 0 0 0
HOMESTEAD 534 447 77 1 4 0 0 0 0 5 0
KEY BISCAYNE 58 58 0 0 0 0 0 0 0 0 0
MIAMI 6,549 4,965 1,482 4 12 0 0 2 14 62 8
MIAMI BEACH 619 588 25 0 0 0 0 0 2 4 0
MIAMI GARDENS 693 206 469 2 0 0 0 2 2 11 1
MIAMI LAKES 188 180 5 0 1 0 0 1 0 1 0
MIAMI SHORES 67 58 7 0 0 0 0 0 0 2 0
MIAMI SPRINGS 131 127 3 0 0 0 0 0 1 0 0
NORTH BAY VILLAGE 30 25 4 0 0 0 0 0 0 1 0
NORTH MIAMI 413 236 160 0 2 2 0 2 1 9 1
NORTH MIAMI BEACH 406 280 107 0 4 1 0 0 2 9 3
OPA-LOCKA 118 49 67 0 0 0 0 0 0 2 0
PINECREST 49 43 0 0 4 1 0 1 0 0 0
PALMETTO BAY 71 65 1 0 1 0 0 1 1 1 1
SOUTH MIAMI 55 39 15 0 0 0 0 0 0 1 0
SUNNY ISLES BEACH 112 111 0 0 0 0 0 0 1 0 0
SURFSIDE 37 37 0 0 0 0 0 0 0 0 0
SWEETWATER 9 9 0 0 0 0 0 0 0 0 0
VIRGINIA GARDENS 12 12 0 0 0 0 0 0 0 0 0
WEST MIAMI 12 12 0 0 0 0 0 0 0 0 0
BALANCE OF COUNTY 5,009 4,198 703 2 20 0 0 8 15 54 9
297 259 37 1 0 0 0 0 0 0 0DESOTO
ARCADIA 92 71 21 0 0 0 0 0 0 0 0
BALANCE OF COUNTY 205 188 16 1 0 0 0 0 0 0 0
FLORIDA VITAL STATISTICS ANNUAL REPORT 2013 105
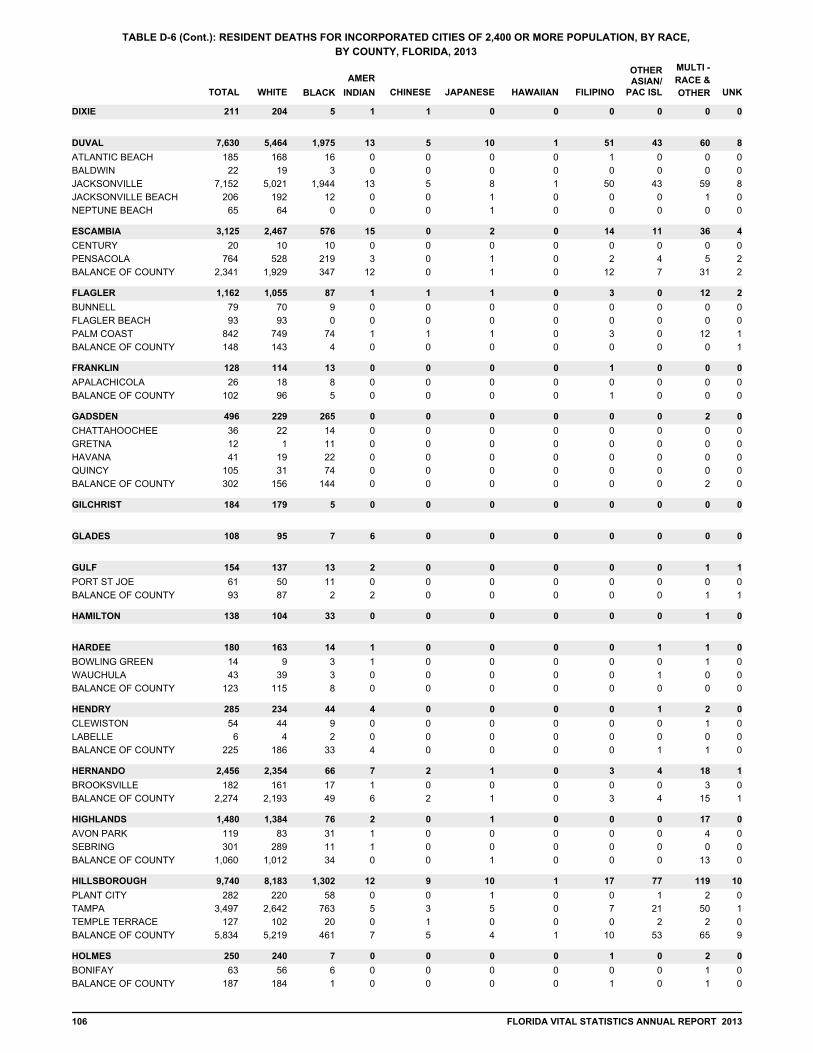
UNK
MULTI -
RACE &
OTHER
OTHERASIAN/
PAC ISLFILIPINOHAWAIIANJAPANESECHINESE
AMER
INDIANBLACKWHITETOTAL
TABLE D-6 (Cont.): RESIDENT DEATHS FOR INCORPORATED CITIES OF 2,400 OR MORE POPULATION, BY RACE,
BY COUNTY, FLORIDA, 2013
211 204 5 1 1 0 0 0 0 0 0DIXIE
7,630 5,464 1,975 13 5 10 1 51 43 60 8DUVAL
ATLANTIC BEACH 185 168 16 0 0 0 0 1 0 0 0
BALDWIN 22 19 3 0 0 0 0 0 0 0 0
JACKSONVILLE 7,152 5,021 1,944 13 5 8 1 50 43 59 8
JACKSONVILLE BEACH 206 192 12 0 0 1 0 0 0 1 0
NEPTUNE BEACH 65 64 0 0 0 1 0 0 0 0 0
3,125 2,467 576 15 0 2 0 14 11 36 4ESCAMBIA
CENTURY 20 10 10 0 0 0 0 0 0 0 0
PENSACOLA 764 528 219 3 0 1 0 2 4 5 2
BALANCE OF COUNTY 2,341 1,929 347 12 0 1 0 12 7 31 2
1,162 1,055 87 1 1 1 0 3 0 12 2FLAGLER
BUNNELL 79 70 9 0 0 0 0 0 0 0 0
FLAGLER BEACH 93 93 0 0 0 0 0 0 0 0 0
PALM COAST 842 749 74 1 1 1 0 3 0 12 1
BALANCE OF COUNTY 148 143 4 0 0 0 0 0 0 0 1
128 114 13 0 0 0 0 1 0 0 0FRANKLIN
APALACHICOLA 26 18 8 0 0 0 0 0 0 0 0
BALANCE OF COUNTY 102 96 5 0 0 0 0 1 0 0 0
496 229 265 0 0 0 0 0 0 2 0GADSDEN
CHATTAHOOCHEE 36 22 14 0 0 0 0 0 0 0 0
GRETNA 12 1 11 0 0 0 0 0 0 0 0
HAVANA 41 19 22 0 0 0 0 0 0 0 0
QUINCY 105 31 74 0 0 0 0 0 0 0 0
BALANCE OF COUNTY 302 156 144 0 0 0 0 0 0 2 0
184 179 5 0 0 0 0 0 0 0 0GILCHRIST
108 95 7 6 0 0 0 0 0 0 0GLADES
154 137 13 2 0 0 0 0 0 1 1GULF
PORT ST JOE 61 50 11 0 0 0 0 0 0 0 0
BALANCE OF COUNTY 93 87 2 2 0 0 0 0 0 1 1
138 104 33 0 0 0 0 0 0 1 0HAMILTON
180 163 14 1 0 0 0 0 1 1 0HARDEE
BOWLING GREEN 14 9 3 1 0 0 0 0 0 1 0
WAUCHULA 43 39 3 0 0 0 0 0 1 0 0
BALANCE OF COUNTY 123 115 8 0 0 0 0 0 0 0 0
285 234 44 4 0 0 0 0 1 2 0HENDRY
CLEWISTON 54 44 9 0 0 0 0 0 0 1 0
LABELLE 6 4 2 0 0 0 0 0 0 0 0
BALANCE OF COUNTY 225 186 33 4 0 0 0 0 1 1 0
2,456 2,354 66 7 2 1 0 3 4 18 1HERNANDO
BROOKSVILLE 182 161 17 1 0 0 0 0 0 3 0
BALANCE OF COUNTY 2,274 2,193 49 6 2 1 0 3 4 15 1
1,480 1,384 76 2 0 1 0 0 0 17 0HIGHLANDS
AVON PARK 119 83 31 1 0 0 0 0 0 4 0
SEBRING 301 289 11 1 0 0 0 0 0 0 0
BALANCE OF COUNTY 1,060 1,012 34 0 0 1 0 0 0 13 0
9,740 8,183 1,302 12 9 10 1 17 77 119 10HILLSBOROUGH
PLANT CITY 282 220 58 0 0 1 0 0 1 2 0
TAMPA 3,497 2,642 763 5 3 5 0 7 21 50 1
TEMPLE TERRACE 127 102 20 0 1 0 0 0 2 2 0
BALANCE OF COUNTY 5,834 5,219 461 7 5 4 1 10 53 65 9
250 240 7 0 0 0 0 1 0 2 0HOLMES
BONIFAY 63 56 6 0 0 0 0 0 0 1 0
BALANCE OF COUNTY 187 184 1 0 0 0 0 1 0 1 0
106 FLORIDA VITAL STATISTICS ANNUAL REPORT 2013

UNK
MULTI -
RACE &
OTHER
OTHERASIAN/
PAC ISLFILIPINOHAWAIIANJAPANESECHINESE
AMER
INDIANBLACKWHITETOTAL
TABLE D-6 (Cont.): RESIDENT DEATHS FOR INCORPORATED CITIES OF 2,400 OR MORE POPULATION, BY RACE,
BY COUNTY, FLORIDA, 2013
1,802 1,679 103 2 2 0 0 1 4 7 4INDIAN RIVER
FELLSMERE 10 6 4 0 0 0 0 0 0 0 0
INDIAN RIVER SHORES 5 5 0 0 0 0 0 0 0 0 0
SEBASTIAN 272 264 4 0 0 0 0 0 2 1 1
VERO BEACH 370 346 18 0 1 0 0 0 2 0 3
BALANCE OF COUNTY 1,145 1,058 77 2 1 0 0 1 0 6 0
562 431 125 1 0 0 0 0 2 2 1JACKSON
GRACEVILLE 39 31 8 0 0 0 0 0 0 0 0
MARIANNA 103 62 40 0 0 0 0 0 1 0 0
BALANCE OF COUNTY 420 338 77 1 0 0 0 0 1 2 1
147 94 52 0 0 0 0 0 0 0 1JEFFERSON
MONTICELLO 47 32 15 0 0 0 0 0 0 0 0
BALANCE OF COUNTY 100 62 37 0 0 0 0 0 0 0 1
75 71 4 0 0 0 0 0 0 0 0LAFAYETTE
3,565 3,312 207 5 2 4 0 2 12 18 3LAKE
CLERMONT 288 255 20 0 0 1 0 1 5 6 0
EUSTIS 190 171 18 1 0 0 0 0 0 0 0
FRUITLAND PARK 59 57 2 0 0 0 0 0 0 0 0
GROVELAND 54 44 7 0 0 0 0 1 1 1 0
LADY LAKE 194 181 9 0 1 0 0 0 0 3 0
LEESBURG 417 363 49 1 0 0 0 0 1 2 1
MASCOTTE 18 17 1 0 0 0 0 0 0 0 0
MINNEOLA 43 42 0 0 0 0 0 0 0 1 0
MOUNT DORA 224 200 22 0 0 0 0 0 2 0 0
TAVARES 227 214 13 0 0 0 0 0 0 0 0
UMATILLA 42 40 1 0 0 1 0 0 0 0 0
BALANCE OF COUNTY 1,809 1,728 65 3 1 2 0 0 3 5 2
6,216 5,882 274 1 4 5 0 5 11 30 4LEE
BONITA SPRINGS 371 363 1 0 2 0 0 0 2 2 1
CAPE CORAL 1,406 1,366 29 0 0 0 0 2 2 6 1
FORT MYERS 701 565 129 1 0 0 0 0 2 3 1
FORT MYERS BEACH 74 74 0 0 0 0 0 0 0 0 0
SANIBEL 51 51 0 0 0 0 0 0 0 0 0
BALANCE OF COUNTY 3,613 3,463 115 0 2 5 0 3 5 19 1
1,781 1,302 441 0 2 0 1 2 10 21 2LEON
TALLAHASSEE 1,195 840 327 0 2 0 1 2 9 13 1
BALANCE OF COUNTY 586 462 114 0 0 0 0 0 1 8 1
495 451 43 0 0 0 0 0 0 1 0LEVY
WILLISTON 49 34 15 0 0 0 0 0 0 0 0
BALANCE OF COUNTY 446 417 28 0 0 0 0 0 0 1 0
51 46 5 0 0 0 0 0 0 0 0LIBERTY
229 165 64 0 0 0 0 0 0 0 0MADISON
MADISON 54 33 21 0 0 0 0 0 0 0 0
BALANCE OF COUNTY 175 132 43 0 0 0 0 0 0 0 0
3,498 3,240 219 2 1 2 0 2 5 23 4MANATEE
BRADENTON 906 807 90 0 0 0 0 0 1 5 3
BRADENTON BEACH 10 10 0 0 0 0 0 0 0 0 0
HOLMES BEACH 38 38 0 0 0 0 0 0 0 0 0
LONGBOAT KEY 27 26 0 0 0 0 0 0 1 0 0
PALMETTO 150 129 21 0 0 0 0 0 0 0 0
BALANCE OF COUNTY 2,367 2,230 108 2 1 2 0 2 3 18 1
4,716 4,314 348 5 1 2 0 1 14 28 3MARION
BELLEVIEW 61 58 2 0 0 0 0 0 0 1 0
OCALA 851 717 124 0 0 0 0 0 3 6 1
BALANCE OF COUNTY 3,804 3,539 222 5 1 2 0 1 11 21 2
1,877 1,814 56 1 0 0 0 1 2 3 0MARTIN
PORT SAINT LUCIE 4 3 1 0 0 0 0 0 0 0 0
STUART 475 455 18 0 0 0 0 0 1 1 0
FLORIDA VITAL STATISTICS ANNUAL REPORT 2013 107
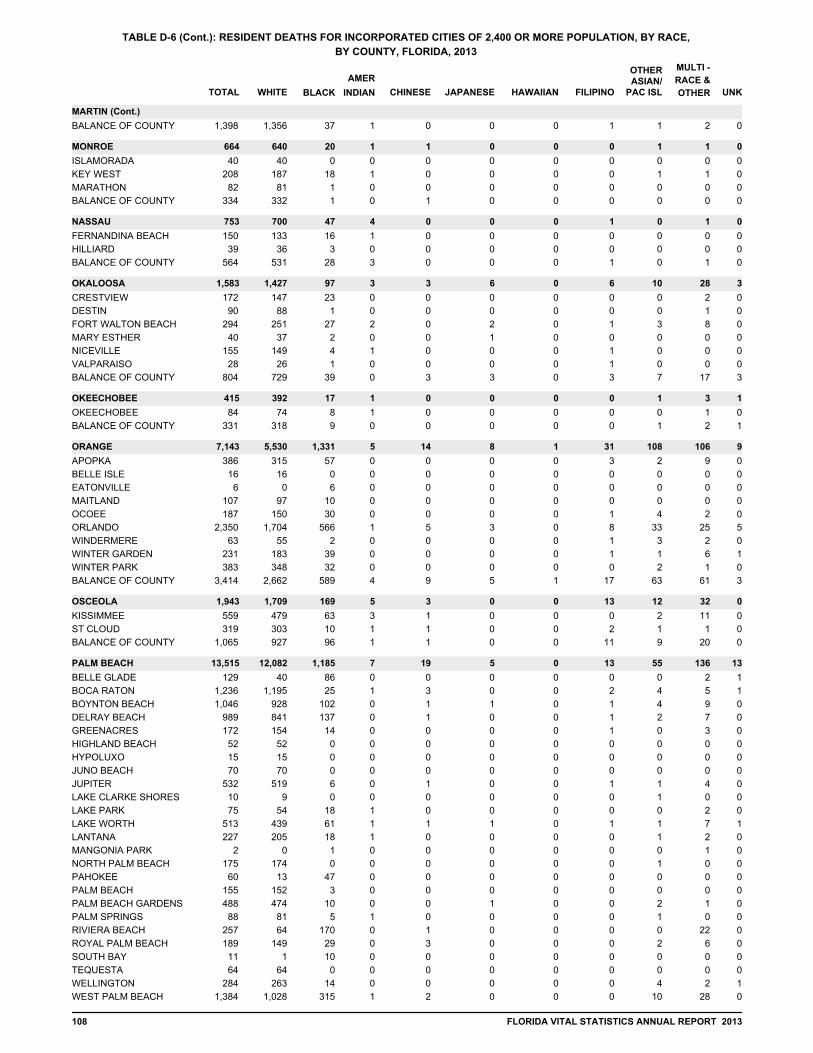
UNK
MULTI -
RACE &
OTHER
OTHERASIAN/
PAC ISLFILIPINOHAWAIIANJAPANESECHINESE
AMER
INDIANBLACKWHITETOTAL
TABLE D-6 (Cont.): RESIDENT DEATHS FOR INCORPORATED CITIES OF 2,400 OR MORE POPULATION, BY RACE,
BY COUNTY, FLORIDA, 2013
MARTIN (Cont.)
BALANCE OF COUNTY 1,398 1,356 37 1 0 0 0 1 1 2 0
664 640 20 1 1 0 0 0 1 1 0MONROE
ISLAMORADA 40 40 0 0 0 0 0 0 0 0 0
KEY WEST 208 187 18 1 0 0 0 0 1 1 0
MARATHON 82 81 1 0 0 0 0 0 0 0 0
BALANCE OF COUNTY 334 332 1 0 1 0 0 0 0 0 0
753 700 47 4 0 0 0 1 0 1 0NASSAU
FERNANDINA BEACH 150 133 16 1 0 0 0 0 0 0 0
HILLIARD 39 36 3 0 0 0 0 0 0 0 0
BALANCE OF COUNTY 564 531 28 3 0 0 0 1 0 1 0
1,583 1,427 97 3 3 6 0 6 10 28 3OKALOOSA
CRESTVIEW 172 147 23 0 0 0 0 0 0 2 0
DESTIN 90 88 1 0 0 0 0 0 0 1 0
FORT WALTON BEACH 294 251 27 2 0 2 0 1 3 8 0
MARY ESTHER 40 37 2 0 0 1 0 0 0 0 0
NICEVILLE 155 149 4 1 0 0 0 1 0 0 0
VALPARAISO 28 26 1 0 0 0 0 1 0 0 0
BALANCE OF COUNTY 804 729 39 0 3 3 0 3 7 17 3
415 392 17 1 0 0 0 0 1 3 1OKEECHOBEE
OKEECHOBEE 84 74 8 1 0 0 0 0 0 1 0
BALANCE OF COUNTY 331 318 9 0 0 0 0 0 1 2 1
7,143 5,530 1,331 5 14 8 1 31 108 106 9ORANGE
APOPKA 386 315 57 0 0 0 0 3 2 9 0
BELLE ISLE 16 16 0 0 0 0 0 0 0 0 0
EATONVILLE 6 0 6 0 0 0 0 0 0 0 0
MAITLAND 107 97 10 0 0 0 0 0 0 0 0
OCOEE 187 150 30 0 0 0 0 1 4 2 0
ORLANDO 2,350 1,704 566 1 5 3 0 8 33 25 5
WINDERMERE 63 55 2 0 0 0 0 1 3 2 0
WINTER GARDEN 231 183 39 0 0 0 0 1 1 6 1
WINTER PARK 383 348 32 0 0 0 0 0 2 1 0
BALANCE OF COUNTY 3,414 2,662 589 4 9 5 1 17 63 61 3
1,943 1,709 169 5 3 0 0 13 12 32 0OSCEOLA
KISSIMMEE 559 479 63 3 1 0 0 0 2 11 0
ST CLOUD 319 303 10 1 1 0 0 2 1 1 0
BALANCE OF COUNTY 1,065 927 96 1 1 0 0 11 9 20 0
13,515 12,082 1,185 7 19 5 0 13 55 136 13PALM BEACH
BELLE GLADE 129 40 86 0 0 0 0 0 0 2 1
BOCA RATON 1,236 1,195 25 1 3 0 0 2 4 5 1
BOYNTON BEACH 1,046 928 102 0 1 1 0 1 4 9 0
DELRAY BEACH 989 841 137 0 1 0 0 1 2 7 0
GREENACRES 172 154 14 0 0 0 0 1 0 3 0
HIGHLAND BEACH 52 52 0 0 0 0 0 0 0 0 0
HYPOLUXO 15 15 0 0 0 0 0 0 0 0 0
JUNO BEACH 70 70 0 0 0 0 0 0 0 0 0
JUPITER 532 519 6 0 1 0 0 1 1 4 0
LAKE CLARKE SHORES 10 9 0 0 0 0 0 0 1 0 0
LAKE PARK 75 54 18 1 0 0 0 0 0 2 0
LAKE WORTH 513 439 61 1 1 1 0 1 1 7 1
LANTANA 227 205 18 1 0 0 0 0 1 2 0
MANGONIA PARK 2 0 1 0 0 0 0 0 0 1 0
NORTH PALM BEACH 175 174 0 0 0 0 0 0 1 0 0
PAHOKEE 60 13 47 0 0 0 0 0 0 0 0
PALM BEACH 155 152 3 0 0 0 0 0 0 0 0
PALM BEACH GARDENS 488 474 10 0 0 1 0 0 2 1 0
PALM SPRINGS 88 81 5 1 0 0 0 0 1 0 0
RIVIERA BEACH 257 64 170 0 1 0 0 0 0 22 0
ROYAL PALM BEACH 189 149 29 0 3 0 0 0 2 6 0
SOUTH BAY 11 1 10 0 0 0 0 0 0 0 0
TEQUESTA 64 64 0 0 0 0 0 0 0 0 0
WELLINGTON 284 263 14 0 0 0 0 0 4 2 1
WEST PALM BEACH 1,384 1,028 315 1 2 0 0 0 10 28 0
108 FLORIDA VITAL STATISTICS ANNUAL REPORT 2013

UNK
MULTI -
RACE &
OTHER
OTHERASIAN/
PAC ISLFILIPINOHAWAIIANJAPANESECHINESE
AMER
INDIANBLACKWHITETOTAL
TABLE D-6 (Cont.): RESIDENT DEATHS FOR INCORPORATED CITIES OF 2,400 OR MORE POPULATION, BY RACE,
BY COUNTY, FLORIDA, 2013
PALM BEACH (Cont.)
BALANCE OF COUNTY 5,292 5,098 114 1 6 2 0 6 21 35 9
5,574 5,407 100 5 3 3 0 6 13 32 5PASCO
DADE CITY 126 113 11 0 0 1 0 0 1 0 0
NEW PORT RICHEY 337 330 4 0 0 0 0 0 1 1 1
PORT RICHEY 90 88 1 0 0 0 0 0 0 1 0
ZEPHYRHILLS 256 249 4 1 0 0 0 0 0 2 0
BALANCE OF COUNTY 4,765 4,627 80 4 3 2 0 6 11 28 4
11,340 10,433 738 4 9 4 0 16 64 62 10PINELLAS
BELLEAIR 45 45 0 0 0 0 0 0 0 0 0
BELLEAIR BLUFFS 30 30 0 0 0 0 0 0 0 0 0
CLEARWATER 1,508 1,405 90 0 2 0 0 0 4 7 0
DUNEDIN 459 446 6 0 1 0 0 2 0 3 1
GULFPORT 151 146 3 0 0 0 0 0 0 1 1
INDIAN ROCKS BEACH 34 34 0 0 0 0 0 0 0 0 0
KENNETH CITY 40 39 0 0 0 0 0 0 0 1 0
LARGO 1,175 1,130 35 1 0 1 0 2 2 4 0
MADEIRA BEACH 58 58 0 0 0 0 0 0 0 0 0
OLDSMAR 118 116 1 0 0 0 0 0 0 1 0
PINELLAS PARK 496 472 7 0 0 2 0 4 9 2 0
REDINGTON SHORES 29 29 0 0 0 0 0 0 0 0 0
SAFETY HARBOR 131 125 4 1 0 0 0 0 1 0 0
SEMINOLE 399 396 0 0 0 0 0 0 0 2 1
SOUTH PASADENA 108 106 2 0 0 0 0 0 0 0 0
ST PETERSBURG 2,806 2,225 516 1 2 1 0 5 29 27 0
ST PETERSBURG BEACH 87 86 1 0 0 0 0 0 0 0 0
TARPON SPRINGS 241 225 13 1 0 0 0 0 1 1 0
TREASURE ISLAND 61 61 0 0 0 0 0 0 0 0 0
BALANCE OF COUNTY 3,364 3,259 60 0 4 0 0 3 18 13 7
6,053 5,348 634 2 3 1 0 6 20 34 5POLK
AUBURNDALE 136 121 14 0 0 0 0 0 1 0 0
BARTOW 161 113 46 0 0 0 0 1 0 1 0
DUNDEE 22 21 1 0 0 0 0 0 0 0 0
EAGLE LAKE 23 21 1 1 0 0 0 0 0 0 0
FORT MEADE 65 55 10 0 0 0 0 0 0 0 0
FROSTPROOF 41 39 2 0 0 0 0 0 0 0 0
HAINES CITY 194 145 46 0 0 0 0 0 0 3 0
LAKE ALFRED 50 44 6 0 0 0 0 0 0 0 0
LAKE WALES 200 158 40 0 0 1 0 0 0 0 1
LAKELAND 1,382 1,165 197 0 2 0 0 3 4 10 1
MULBERRY 59 44 13 0 0 0 0 0 0 2 0
WINTER HAVEN 534 436 91 0 0 0 0 0 2 4 1
BALANCE OF COUNTY 3,186 2,986 167 1 1 0 0 2 13 14 2
933 806 117 2 0 0 0 0 0 7 1PUTNAM
PALATKA 137 85 50 0 0 0 0 0 0 2 0
BALANCE OF COUNTY 796 721 67 2 0 0 0 0 0 5 1
1,639 1,541 80 0 4 0 0 4 2 8 0SAINT JOHNS
ST AUGUSTINE 261 222 36 0 1 0 0 0 1 1 0
ST AUGUSTINE BEACH 15 15 0 0 0 0 0 0 0 0 0
BALANCE OF COUNTY 1,363 1,304 44 0 3 0 0 4 1 7 0
2,866 2,444 365 3 0 1 0 3 7 43 0SAINT LUCIE
FORT PIERCE 524 328 188 0 0 0 0 0 1 7 0
PORT ST LUCIE 1,298 1,162 101 3 0 0 0 2 6 24 0
BALANCE OF COUNTY 1,044 954 76 0 0 1 0 1 0 12 0
1,309 1,246 48 4 0 0 0 5 3 3 0SANTA ROSA
GULF BREEZE 87 87 0 0 0 0 0 0 0 0 0
MILTON 129 111 16 0 0 0 0 0 1 1 0
BALANCE OF COUNTY 1,093 1,048 32 4 0 0 0 5 2 2 0
5,078 4,907 134 4 3 1 0 3 9 15 2SARASOTA
LONGBOAT KEY 35 35 0 0 0 0 0 0 0 0 0
NORTH PORT 427 405 16 0 0 0 0 1 0 5 0
SARASOTA 693 610 78 1 1 0 0 0 2 1 0
FLORIDA VITAL STATISTICS ANNUAL REPORT 2013 109

UNK
MULTI -
RACE &
OTHER
OTHERASIAN/
PAC ISLFILIPINOHAWAIIANJAPANESECHINESE
AMER
INDIANBLACKWHITETOTAL
TABLE D-6 (Cont.): RESIDENT DEATHS FOR INCORPORATED CITIES OF 2,400 OR MORE POPULATION, BY RACE,
BY COUNTY, FLORIDA, 2013
SARASOTA (Cont.)
VENICE 464 463 0 0 0 0 0 0 1 0 0
BALANCE OF COUNTY 3,459 3,394 40 3 2 1 0 2 6 9 2
2,976 2,612 283 1 5 3 0 3 36 31 2SEMINOLE
ALTAMONTE SPRINGS 324 274 43 0 0 0 0 0 2 5 0
CASSELBERRY 210 193 9 0 2 0 0 1 3 2 0
LAKE MARY 172 155 13 1 0 0 0 0 2 1 0
LONGWOOD 326 300 16 0 0 1 0 0 4 3 2
MAITLAND 26 24 2 0 0 0 0 0 0 0 0
OVIEDO 203 175 21 0 2 0 0 0 3 2 0
SANFORD 447 332 108 0 0 0 0 1 2 4 0
WINTER SPRINGS 223 208 8 0 0 1 0 0 4 2 0
BALANCE OF COUNTY 1,045 951 63 0 1 1 0 1 16 12 0
1,404 1,334 57 2 1 1 0 2 0 6 1SUMTER
BUSHNELL 38 34 3 1 0 0 0 0 0 0 0
WILDWOOD 103 86 15 0 0 0 0 0 0 2 0
BALANCE OF COUNTY 1,263 1,214 39 1 1 1 0 2 0 4 1
513 463 43 0 0 2 0 0 1 4 0SUWANNEE
LIVE OAK 92 75 16 0 0 1 0 0 0 0 0
BALANCE OF COUNTY 421 388 27 0 0 1 0 0 1 4 0
234 208 23 0 0 0 0 0 1 2 0TAYLOR
PERRY 84 62 21 0 0 0 0 0 1 0 0
BALANCE OF COUNTY 150 146 2 0 0 0 0 0 0 2 0
221 172 48 1 0 0 0 0 0 0 0UNION
6,347 5,902 387 1 3 2 0 1 16 29 6VOLUSIA
DAYTONA BEACH 857 674 175 1 0 0 0 0 2 4 1
DAYTONA BEACH SHORES 52 51 0 0 1 0 0 0 0 0 0
DEBARY 212 203 7 0 0 0 0 0 0 2 0
DELAND 545 484 57 0 0 0 0 0 0 3 1
DELTONA 661 615 36 0 1 0 0 0 1 8 0
EDGEWATER 295 292 3 0 0 0 0 0 0 0 0
HOLLY HILL 229 217 10 0 0 0 0 0 0 1 1
LAKE HELEN 27 24 3 0 0 0 0 0 0 0 0
NEW SMYRNA BEACH 405 380 24 0 0 0 0 0 0 1 0
ORANGE CITY 215 206 7 0 0 0 0 0 0 2 0
ORMOND BEACH 754 731 15 0 1 2 0 0 4 0 1
PIERSON 14 11 3 0 0 0 0 0 0 0 0
PONCE INLET 25 25 0 0 0 0 0 0 0 0 0
PORT ORANGE 818 806 7 0 0 0 0 1 3 1 0
SOUTH DAYTONA 168 155 6 0 0 0 0 0 4 3 0
BALANCE OF COUNTY 1,070 1,028 34 0 0 0 0 0 2 4 2
257 237 19 1 0 0 0 0 0 0 0WAKULLA
568 534 26 1 0 1 0 1 3 2 0WALTON
DEFUNIAK SPRINGS 87 68 17 0 0 0 0 0 2 0 0
BALANCE OF COUNTY 481 466 9 1 0 1 0 1 1 2 0
263 239 24 0 0 0 0 0 0 0 0WASHINGTON
CHIPLEY 76 65 11 0 0 0 0 0 0 0 0
BALANCE OF COUNTY 187 174 13 0 0 0 0 0 0 0 0
110 FLORIDA VITAL STATISTICS ANNUAL REPORT 2013

TABLE D-7: RESIDENT DEATHS BY MONTH, BY COUNTY, FLORIDA, 2013
DECNOVOCTSEPAUGJULJUNMAYAPRMARFEBJANTOTAL
FLORIDA 180,014 16,852 14,778 16,289 15,286 14,472 14,497 14,280 14,040 14,664 14,521 15,447 14,888
ALACHUA 1,799 149 151 165 157 147 139 144 132 146 152 168 149
BAKER 228 29 14 23 14 26 15 16 18 11 18 26 18
BAY 1,808 160 133 172 168 153 136 148 149 151 153 157 128
BRADFORD 292 31 16 31 28 25 15 37 26 19 22 26 16
BREVARD 6,481 599 598 591 550 489 505 564 522 500 502 568 493
BROWARD 14,144 1,325 1,114 1,274 1,195 1,141 1,122 1,114 1,114 1,188 1,178 1,167 1,212
CALHOUN 150 16 14 15 8 13 7 11 10 15 6 17 18
CHARLOTTE 2,355 215 179 210 193 184 188 181 207 198 166 220 214
CITRUS 2,338 236 198 206 190 199 170 190 192 172 176 209 200
CLAY 1,589 133 131 139 140 114 130 143 130 134 124 133 138
COLLIER 2,909 265 250 286 248 234 225 226 229 229 249 234 234
COLUMBIA 783 69 66 72 66 62 72 74 52 61 64 68 57
MIAMI-DADE 18,440 1,651 1,470 1,657 1,532 1,500 1,521 1,514 1,476 1,489 1,510 1,624 1,496
DESOTO 297 26 28 35 29 18 17 36 24 21 16 23 24
DIXIE 211 24 22 16 11 9 20 27 23 20 12 15 12
DUVAL 7,630 680 627 682 673 587 581 606 628 666 617 686 597
ESCAMBIA 3,125 327 248 273 264 267 235 269 222 235 249 281 255
FLAGLER 1,162 110 77 115 105 95 101 87 76 96 101 95 104
FRANKLIN 128 11 15 14 13 7 6 14 11 8 7 6 16
GADSDEN 496 46 40 45 47 33 42 32 24 45 45 53 44
GILCHRIST 184 17 20 12 16 14 12 14 22 10 19 16 12
GLADES 108 14 10 8 10 9 7 9 9 10 9 6 7
GULF 154 14 16 14 15 10 9 13 11 8 6 18 20
HAMILTON 138 10 9 11 5 12 4 14 13 12 16 20 12
HARDEE 180 22 18 9 19 8 15 9 18 16 16 14 16
HENDRY 285 22 24 30 24 16 23 26 22 21 36 26 15
HERNANDO 2,456 247 210 207 215 179 195 206 185 199 192 219 202
HIGHLANDS 1,480 132 135 133 128 119 124 122 95 123 120 129 120
HILLSBOROUGH 9,740 963 818 938 820 783 753 776 743 763 759 836 788
HOLMES 250 21 20 28 22 28 19 19 21 21 26 13 12
INDIAN RIVER 1,802 186 138 163 176 154 156 140 134 126 143 160 126
JACKSON 562 49 41 60 53 37 54 41 45 47 49 42 44
JEFFERSON 147 14 11 13 14 13 10 10 8 13 13 14 14
LAFAYETTE 75 4 7 8 7 7 6 8 4 9 7 4 4
LAKE 3,565 325 285 333 323 292 284 252 282 283 275 321 310
LEE 6,216 590 515 568 510 511 498 474 475 530 495 509 541
LEON 1,781 159 131 156 166 152 123 156 141 134 160 143 160
LEVY 495 40 43 46 49 44 33 36 30 42 37 51 44
LIBERTY 51 5 3 3 3 3 5 4 5 4 3 6 7
MADISON 229 19 16 28 23 20 23 12 19 16 14 27 12
MANATEE 3,498 327 312 312 304 275 287 282 261 299 297 276 266
MARION 4,716 442 440 380 394 338 370 374 361 404 397 430 386
MARTIN 1,877 163 152 181 157 163 164 148 119 157 156 177 140
MONROE 664 61 57 58 51 54 57 51 44 53 55 60 63
NASSAU 753 66 65 69 70 59 60 61 47 54 67 60 75
OKALOOSA 1,583 160 105 144 111 135 129 122 146 133 120 134 144
OKEECHOBEE 415 47 32 30 29 41 28 30 27 44 34 38 35
ORANGE 7,143 625 574 604 559 628 617 564 577 590 550 638 617
OSCEOLA 1,943 166 161 186 159 141 183 155 142 155 162 176 157
PALM BEACH 13,515 1,280 1,104 1,191 1,164 1,112 1,108 1,043 1,045 1,089 1,114 1,105 1,160
PASCO 5,574 552 446 489 522 419 453 448 405 440 443 490 467
PINELLAS 11,340 1,107 942 1,025 973 929 956 874 901 931 863 944 895
POLK 6,053 599 485 533 498 482 476 454 503 508 492 493 530
PUTNAM 933 94 61 101 81 75 76 85 66 80 69 69 76
SAINT JOHNS 1,639 167 134 140 133 130 144 127 120 141 137 132 134
SAINT LUCIE 2,866 236 257 278 252 236 256 228 202 248 208 239 226
SANTA ROSA 1,309 117 102 130 98 109 116 94 95 117 115 116 100
SARASOTA 5,078 475 439 475 421 408 380 376 397 370 408 453 476
SEMINOLE 2,976 275 232 293 245 225 259 242 231 259 259 229 227
SUMTER 1,404 120 120 141 124 123 105 105 127 111 100 117 111
SUWANNEE 513 44 48 47 39 43 43 38 29 38 54 40 50
TAYLOR 234 24 24 15 15 20 21 19 18 16 18 25 19
UNION 221 21 14 19 18 20 15 21 13 25 16 20 19
VOLUSIA 6,347 619 520 559 531 511 508 479 526 520 519 542 513
WAKULLA 257 21 23 24 30 17 19 16 16 15 24 21 31
WALTON 568 63 47 45 43 38 43 42 44 49 58 40 56
WASHINGTON 263 20 18 26 26 22 20 24 16 25 21 25 20
FLORIDA VITAL STATISTICS ANNUAL REPORT 2013 111

TABLE D-8: RECORDED DEATHS BY DISPOSITION OF REMAINS AND PERCENT OF RECORDED
DEATHS, BY COUNTY, FLORIDA, 2013
NUMBER OF RECORDED DEATHS PERCENT OF RECORDED DEATHS
UNKOTHER
REMOVED
FROM FLCREMATIONBURIAL*UNKOTHER
REMOVED
FROM FLCREMATIONBURIAL*TOTAL
FLORIDA 182,965 50,635 112,829 17,329 2,145 27 27.7 61.7 9.5 1.2 0.0
ALACHUA 3,249 1,197 1,858 160 34 0 36.8 57.2 4.9 1.0 0.0
BAKER 141 85 42 14 0 0 60.3 29.8 9.9 0.0 0.0
BAY 2,012 706 1,083 202 21 0 35.1 53.8 10.0 1.0 0.0
BRADFORD 195 92 92 9 2 0 47.2 47.2 4.6 1.0 0.0
BREVARD 6,378 1,165 4,536 492 184 1 18.3 71.1 7.7 2.9 0.0
BROWARD 13,924 4,636 7,451 1,674 161 2 33.3 53.5 12.0 1.2 0.0
CALHOUN 122 69 44 9 0 0 56.6 36.1 7.4 0.0 0.0
CHARLOTTE 2,372 291 1,799 267 14 1 12.3 75.8 11.3 0.6 0.0
CITRUS 2,264 367 1,700 153 44 0 16.2 75.1 6.8 1.9 0.0
CLAY 1,624 530 937 132 25 0 32.6 57.7 8.1 1.5 0.0
COLLIER 3,063 316 2,271 431 44 1 10.3 74.1 14.1 1.4 0.0
COLUMBIA 905 385 464 46 10 0 42.5 51.3 5.1 1.1 0.0
MIAMI-DADE 19,188 8,677 9,044 1,171 295 1 45.2 47.1 6.1 1.5 0.0
DESOTO 240 70 153 14 3 0 29.2 63.8 5.8 1.3 0.0
DIXIE 111 44 63 2 1 1 39.6 56.8 1.8 0.9 0.9
DUVAL 8,658 3,337 4,503 726 92 0 38.5 52.0 8.4 1.1 0.0
ESCAMBIA 3,898 1,693 1,683 499 20 3 43.4 43.2 12.8 0.5 0.1
FLAGLER 1,041 161 758 115 7 0 15.5 72.8 11.0 0.7 0.0
FRANKLIN 95 50 33 8 4 0 52.6 34.7 8.4 4.2 0.0
GADSDEN 286 189 70 25 2 0 66.1 24.5 8.7 0.7 0.0
GILCHRIST 113 41 68 4 0 0 36.3 60.2 3.5 0.0 0.0
GLADES 43 11 26 6 0 0 25.6 60.5 14.0 0.0 0.0
GULF 110 56 47 7 0 0 50.9 42.7 6.4 0.0 0.0
HAMILTON 67 33 24 9 1 0 49.3 35.8 13.4 1.5 0.0
HARDEE 106 52 48 5 1 0 49.1 45.3 4.7 0.9 0.0
HENDRY 170 63 85 21 1 0 37.1 50.0 12.4 0.6 0.0
HERNANDO 2,413 434 1,750 208 21 0 18.0 72.5 8.6 0.9 0.0
HIGHLANDS 1,516 341 1,045 122 8 0 22.5 68.9 8.0 0.5 0.0
HILLSBOROUGH 10,461 3,013 6,451 772 225 0 28.8 61.7 7.4 2.2 0.0
HOLMES 196 100 45 50 1 0 51.0 23.0 25.5 0.5 0.0
INDIAN RIVER 1,870 293 1,434 131 12 0 15.7 76.7 7.0 0.6 0.0
JACKSON 495 305 123 58 8 1 61.6 24.8 11.7 1.6 0.2
JEFFERSON 93 43 38 9 3 0 46.2 40.9 9.7 3.2 0.0
LAFAYETTE 46 20 25 1 0 0 43.5 54.3 2.2 0.0 0.0
LAKE 3,143 672 2,155 284 32 0 21.4 68.6 9.0 1.0 0.0
LEE 6,328 848 4,669 764 47 0 13.4 73.8 12.1 0.7 0.0
LEON 2,382 1,090 1,013 254 23 2 45.8 42.5 10.7 1.0 0.1
LEVY 393 112 260 17 4 0 28.5 66.2 4.3 1.0 0.0
LIBERTY 20 10 9 1 0 0 50.0 45.0 5.0 0.0 0.0
MADISON 154 100 49 4 1 0 64.9 31.8 2.6 0.6 0.0
MANATEE 3,512 546 2,625 306 35 0 15.5 74.7 8.7 1.0 0.0
MARION 4,420 889 3,103 356 71 1 20.1 70.2 8.1 1.6 0.0
MARTIN 1,810 237 1,375 183 15 0 13.1 76.0 10.1 0.8 0.0
MONROE 540 65 427 43 5 0 12.0 79.1 8.0 0.9 0.0
NASSAU 455 161 243 49 2 0 35.4 53.4 10.8 0.4 0.0
OKALOOSA 1,578 504 879 180 15 0 31.9 55.7 11.4 1.0 0.0
OKEECHOBEE 376 99 247 25 5 0 26.3 65.7 6.6 1.3 0.0
ORANGE 7,911 2,271 4,809 718 109 4 28.7 60.8 9.1 1.4 0.1
OSCEOLA 1,834 394 1,179 243 18 0 21.5 64.3 13.2 1.0 0.0
PALM BEACH 14,100 4,160 7,358 2,469 111 2 29.5 52.2 17.5 0.8 0.0
PASCO 5,411 923 4,021 438 29 0 17.1 74.3 8.1 0.5 0.0
PINELLAS 12,122 2,115 8,912 990 103 2 17.4 73.5 8.2 0.8 0.0
POLK 5,749 1,673 3,627 413 35 1 29.1 63.1 7.2 0.6 0.0
PUTNAM 778 278 448 29 23 0 35.7 57.6 3.7 3.0 0.0
SAINT JOHNS 1,309 258 921 121 8 1 19.7 70.4 9.2 0.6 0.1
SAINT LUCIE 2,648 577 1,789 255 27 0 21.8 67.6 9.6 1.0 0.0
SANTA ROSA 847 333 410 101 3 0 39.3 48.4 11.9 0.4 0.0
SARASOTA 5,157 641 3,926 513 76 1 12.4 76.1 9.9 1.5 0.0
SEMINOLE 2,993 774 1,957 244 18 0 25.9 65.4 8.2 0.6 0.0
SUMTER 1,683 235 1,253 183 12 0 14.0 74.5 10.9 0.7 0.0
SUWANNEE 304 125 161 13 4 1 41.1 53.0 4.3 1.3 0.3
TAYLOR 153 62 79 9 2 1 40.5 51.6 5.9 1.3 0.7
UNION 143 37 101 5 0 0 25.9 70.6 3.5 0.0 0.0
VOLUSIA 6,410 1,231 4,664 455 60 0 19.2 72.8 7.1 0.9 0.0
WAKULLA 138 64 61 7 6 0 46.4 44.2 5.1 4.3 0.0
WALTON 491 178 244 67 2 0 36.3 49.7 13.6 0.4 0.0
WASHINGTON 208 108 62 38 0 0 51.9 29.8 18.3 0.0 0.0
*Includes entombment.
112 FLORIDA VITAL STATISTICS ANNUAL REPORT 2013
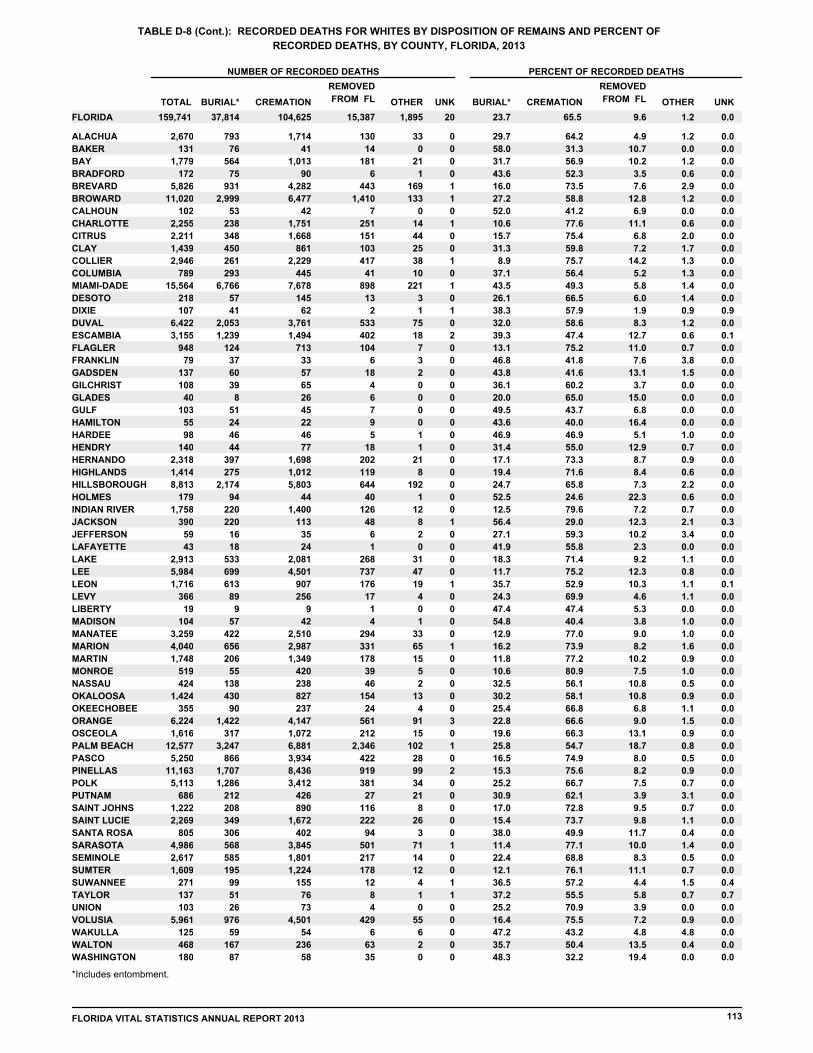
TABLE D-8 (Cont.): RECORDED DEATHS FOR WHITES BY DISPOSITION OF REMAINS AND PERCENT OF
RECORDED DEATHS, BY COUNTY, FLORIDA, 2013
NUMBER OF RECORDED DEATHS PERCENT OF RECORDED DEATHS
UNKOTHER
REMOVED
FROM FLCREMATIONBURIAL*UNKOTHER
REMOVED
FROM FLCREMATIONBURIAL*TOTAL
FLORIDA 159,741 37,814 104,625 15,387 1,895 20 23.7 65.5 9.6 1.2 0.0
ALACHUA 2,670 793 1,714 130 33 0 29.7 64.2 4.9 1.2 0.0
BAKER 131 76 41 14 0 0 58.0 31.3 10.7 0.0 0.0
BAY 1,779 564 1,013 181 21 0 31.7 56.9 10.2 1.2 0.0
BRADFORD 172 75 90 6 1 0 43.6 52.3 3.5 0.6 0.0
BREVARD 5,826 931 4,282 443 169 1 16.0 73.5 7.6 2.9 0.0
BROWARD 11,020 2,999 6,477 1,410 133 1 27.2 58.8 12.8 1.2 0.0
CALHOUN 102 53 42 7 0 0 52.0 41.2 6.9 0.0 0.0
CHARLOTTE 2,255 238 1,751 251 14 1 10.6 77.6 11.1 0.6 0.0
CITRUS 2,211 348 1,668 151 44 0 15.7 75.4 6.8 2.0 0.0
CLAY 1,439 450 861 103 25 0 31.3 59.8 7.2 1.7 0.0
COLLIER 2,946 261 2,229 417 38 1 8.9 75.7 14.2 1.3 0.0
COLUMBIA 789 293 445 41 10 0 37.1 56.4 5.2 1.3 0.0
MIAMI-DADE 15,564 6,766 7,678 898 221 1 43.5 49.3 5.8 1.4 0.0
DESOTO 218 57 145 13 3 0 26.1 66.5 6.0 1.4 0.0
DIXIE 107 41 62 2 1 1 38.3 57.9 1.9 0.9 0.9
DUVAL 6,422 2,053 3,761 533 75 0 32.0 58.6 8.3 1.2 0.0
ESCAMBIA 3,155 1,239 1,494 402 18 2 39.3 47.4 12.7 0.6 0.1
FLAGLER 948 124 713 104 7 0 13.1 75.2 11.0 0.7 0.0
FRANKLIN 79 37 33 6 3 0 46.8 41.8 7.6 3.8 0.0
GADSDEN 137 60 57 18 2 0 43.8 41.6 13.1 1.5 0.0
GILCHRIST 108 39 65 4 0 0 36.1 60.2 3.7 0.0 0.0
GLADES 40 8 26 6 0 0 20.0 65.0 15.0 0.0 0.0
GULF 103 51 45 7 0 0 49.5 43.7 6.8 0.0 0.0
HAMILTON 55 24 22 9 0 0 43.6 40.0 16.4 0.0 0.0
HARDEE 98 46 46 5 1 0 46.9 46.9 5.1 1.0 0.0
HENDRY 140 44 77 18 1 0 31.4 55.0 12.9 0.7 0.0
HERNANDO 2,318 397 1,698 202 21 0 17.1 73.3 8.7 0.9 0.0
HIGHLANDS 1,414 275 1,012 119 8 0 19.4 71.6 8.4 0.6 0.0
HILLSBOROUGH 8,813 2,174 5,803 644 192 0 24.7 65.8 7.3 2.2 0.0
HOLMES 179 94 44 40 1 0 52.5 24.6 22.3 0.6 0.0
INDIAN RIVER 1,758 220 1,400 126 12 0 12.5 79.6 7.2 0.7 0.0
JACKSON 390 220 113 48 8 1 56.4 29.0 12.3 2.1 0.3
JEFFERSON 59 16 35 6 2 0 27.1 59.3 10.2 3.4 0.0
LAFAYETTE 43 18 24 1 0 0 41.9 55.8 2.3 0.0 0.0
LAKE 2,913 533 2,081 268 31 0 18.3 71.4 9.2 1.1 0.0
LEE 5,984 699 4,501 737 47 0 11.7 75.2 12.3 0.8 0.0
LEON 1,716 613 907 176 19 1 35.7 52.9 10.3 1.1 0.1
LEVY 366 89 256 17 4 0 24.3 69.9 4.6 1.1 0.0
LIBERTY 19 9 9 1 0 0 47.4 47.4 5.3 0.0 0.0
MADISON 104 57 42 4 1 0 54.8 40.4 3.8 1.0 0.0
MANATEE 3,259 422 2,510 294 33 0 12.9 77.0 9.0 1.0 0.0
MARION 4,040 656 2,987 331 65 1 16.2 73.9 8.2 1.6 0.0
MARTIN 1,748 206 1,349 178 15 0 11.8 77.2 10.2 0.9 0.0
MONROE 519 55 420 39 5 0 10.6 80.9 7.5 1.0 0.0
NASSAU 424 138 238 46 2 0 32.5 56.1 10.8 0.5 0.0
OKALOOSA 1,424 430 827 154 13 0 30.2 58.1 10.8 0.9 0.0
OKEECHOBEE 355 90 237 24 4 0 25.4 66.8 6.8 1.1 0.0
ORANGE 6,224 1,422 4,147 561 91 3 22.8 66.6 9.0 1.5 0.0
OSCEOLA 1,616 317 1,072 212 15 0 19.6 66.3 13.1 0.9 0.0
PALM BEACH 12,577 3,247 6,881 2,346 102 1 25.8 54.7 18.7 0.8 0.0
PASCO 5,250 866 3,934 422 28 0 16.5 74.9 8.0 0.5 0.0
PINELLAS 11,163 1,707 8,436 919 99 2 15.3 75.6 8.2 0.9 0.0
POLK 5,113 1,286 3,412 381 34 0 25.2 66.7 7.5 0.7 0.0
PUTNAM 686 212 426 27 21 0 30.9 62.1 3.9 3.1 0.0
SAINT JOHNS 1,222 208 890 116 8 0 17.0 72.8 9.5 0.7 0.0
SAINT LUCIE 2,269 349 1,672 222 26 0 15.4 73.7 9.8 1.1 0.0
SANTA ROSA 805 306 402 94 3 0 38.0 49.9 11.7 0.4 0.0
SARASOTA 4,986 568 3,845 501 71 1 11.4 77.1 10.0 1.4 0.0
SEMINOLE 2,617 585 1,801 217 14 0 22.4 68.8 8.3 0.5 0.0
SUMTER 1,609 195 1,224 178 12 0 12.1 76.1 11.1 0.7 0.0
SUWANNEE 271 99 155 12 4 1 36.5 57.2 4.4 1.5 0.4
TAYLOR 137 51 76 8 1 1 37.2 55.5 5.8 0.7 0.7
UNION 103 26 73 4 0 0 25.2 70.9 3.9 0.0 0.0
VOLUSIA 5,961 976 4,501 429 55 0 16.4 75.5 7.2 0.9 0.0
WAKULLA 125 59 54 6 6 0 47.2 43.2 4.8 4.8 0.0
WALTON 468 167 236 63 2 0 35.7 50.4 13.5 0.4 0.0
WASHINGTON 180 87 58 35 0 0 48.3 32.2 19.4 0.0 0.0
*Includes entombment.
FLORIDA VITAL STATISTICS ANNUAL REPORT 2013 113

TABLE D-8 (Cont.): RECORDED DEATHS FOR BLACKS BY DISPOSITION OF REMAINS AND PERCENT OF
RECORDED DEATHS, BY COUNTY, FLORIDA, 2013
NUMBER OF RECORDED DEATHS PERCENT OF RECORDED DEATHS
UNKOTHER
REMOVED
FROM FLCREMATIONBURIAL*UNKOTHER
REMOVED
FROM FLCREMATIONBURIAL*TOTAL
FLORIDA 19,822 11,754 6,237 1,648 177 6 59.3 31.5 8.3 0.9 0.0
ALACHUA 533 393 111 29 0 0 73.7 20.8 5.4 0.0 0.0
BAKER 10 9 1 0 0 0 90.0 10.0 0.0 0.0 0.0
BAY 197 130 48 19 0 0 66.0 24.4 9.6 0.0 0.0
BRADFORD 22 17 2 3 0 0 77.3 9.1 13.6 0.0 0.0
BREVARD 443 215 180 38 10 0 48.5 40.6 8.6 2.3 0.0
BROWARD 2,407 1,428 746 215 17 1 59.3 31.0 8.9 0.7 0.0
CALHOUN 19 16 2 1 0 0 84.2 10.5 5.3 0.0 0.0
CHARLOTTE 93 45 33 15 0 0 48.4 35.5 16.1 0.0 0.0
CITRUS 30 18 12 0 0 0 60.0 40.0 0.0 0.0 0.0
CLAY 142 65 51 26 0 0 45.8 35.9 18.3 0.0 0.0
COLLIER 87 48 26 11 2 0 55.2 29.9 12.6 2.3 0.0
COLUMBIA 108 88 15 5 0 0 81.5 13.9 4.6 0.0 0.0
MIAMI-DADE 3,270 1,774 1,189 237 70 0 54.3 36.4 7.2 2.1 0.0
DESOTO 21 13 7 1 0 0 61.9 33.3 4.8 0.0 0.0
DIXIE 4 3 1 0 0 0 75.0 25.0 0.0 0.0 0.0
DUVAL 2,022 1,211 620 178 13 0 59.9 30.7 8.8 0.6 0.0
ESCAMBIA 638 412 137 87 1 1 64.6 21.5 13.6 0.2 0.2
FLAGLER 77 34 33 10 0 0 44.2 42.9 13.0 0.0 0.0
FRANKLIN 14 13 0 1 0 0 92.9 0.0 7.1 0.0 0.0
GADSDEN 146 127 12 7 0 0 87.0 8.2 4.8 0.0 0.0
GILCHRIST 4 2 2 0 0 0 50.0 50.0 0.0 0.0 0.0
GLADES 3 3 0 0 0 0 100.0 0.0 0.0 0.0 0.0
GULF 5 4 1 0 0 0 80.0 20.0 0.0 0.0 0.0
HAMILTON 12 9 2 0 1 0 75.0 16.7 0.0 8.3 0.0
HARDEE 6 5 1 0 0 0 83.3 16.7 0.0 0.0 0.0
HENDRY 25 16 8 1 0 0 64.0 32.0 4.0 0.0 0.0
HERNANDO 59 30 25 4 0 0 50.8 42.4 6.8 0.0 0.0
HIGHLANDS 83 58 25 0 0 0 69.9 30.1 0.0 0.0 0.0
HILLSBOROUGH 1,367 771 465 106 25 0 56.4 34.0 7.8 1.8 0.0
HOLMES 14 5 1 8 0 0 35.7 7.1 57.1 0.0 0.0
INDIAN RIVER 97 69 23 5 0 0 71.1 23.7 5.2 0.0 0.0
JACKSON 104 84 10 10 0 0 80.8 9.6 9.6 0.0 0.0
JEFFERSON 32 27 2 3 0 0 84.4 6.3 9.4 0.0 0.0
LAFAYETTE 3 2 1 0 0 0 66.7 33.3 0.0 0.0 0.0
LAKE 193 131 50 12 0 0 67.9 25.9 6.2 0.0 0.0
LEE 282 132 129 21 0 0 46.8 45.7 7.4 0.0 0.0
LEON 627 467 80 76 3 1 74.5 12.8 12.1 0.5 0.2
LEVY 25 22 3 0 0 0 88.0 12.0 0.0 0.0 0.0
LIBERTY 1 1 0 0 0 0 100.0 0.0 0.0 0.0 0.0
MADISON 48 42 6 0 0 0 87.5 12.5 0.0 0.0 0.0
MANATEE 217 120 88 9 0 0 55.3 40.6 4.1 0.0 0.0
MARION 328 223 77 24 4 0 68.0 23.5 7.3 1.2 0.0
MARTIN 55 29 22 4 0 0 52.7 40.0 7.3 0.0 0.0
MONROE 17 10 3 4 0 0 58.8 17.6 23.5 0.0 0.0
NASSAU 26 22 2 2 0 0 84.6 7.7 7.7 0.0 0.0
OKALOOSA 102 58 22 21 1 0 56.9 21.6 20.6 1.0 0.0
OKEECHOBEE 15 7 7 1 0 0 46.7 46.7 6.7 0.0 0.0
ORANGE 1,380 751 487 131 10 1 54.4 35.3 9.5 0.7 0.1
OSCEOLA 152 62 66 22 2 0 40.8 43.4 14.5 1.3 0.0
PALM BEACH 1,258 810 336 106 5 1 64.4 26.7 8.4 0.4 0.1
PASCO 110 46 51 13 0 0 41.8 46.4 11.8 0.0 0.0
PINELLAS 787 368 360 57 2 0 46.8 45.7 7.2 0.3 0.0
POLK 559 371 166 22 0 0 66.4 29.7 3.9 0.0 0.0
PUTNAM 84 64 17 2 1 0 76.2 20.2 2.4 1.2 0.0
SAINT JOHNS 77 47 25 4 0 1 61.0 32.5 5.2 0.0 1.3
SAINT LUCIE 322 206 91 24 1 0 64.0 28.3 7.5 0.3 0.0
SANTA ROSA 35 24 5 6 0 0 68.6 14.3 17.1 0.0 0.0
SARASOTA 136 68 55 8 5 0 50.0 40.4 5.9 3.7 0.0
SEMINOLE 305 168 111 26 0 0 55.1 36.4 8.5 0.0 0.0
SUMTER 54 35 17 2 0 0 64.8 31.5 3.7 0.0 0.0
SUWANNEE 29 25 3 1 0 0 86.2 10.3 3.4 0.0 0.0
TAYLOR 15 11 2 1 1 0 73.3 13.3 6.7 6.7 0.0
UNION 39 11 27 1 0 0 28.2 69.2 2.6 0.0 0.0
VOLUSIA 392 243 123 23 3 0 62.0 31.4 5.9 0.8 0.0
WAKULLA 12 5 6 1 0 0 41.7 50.0 8.3 0.0 0.0
WALTON 15 10 4 1 0 0 66.7 26.7 6.7 0.0 0.0
WASHINGTON 28 21 4 3 0 0 75.0 14.3 10.7 0.0 0.0
*Includes entombment.
114 FLORIDA VITAL STATISTICS ANNUAL REPORT 2013
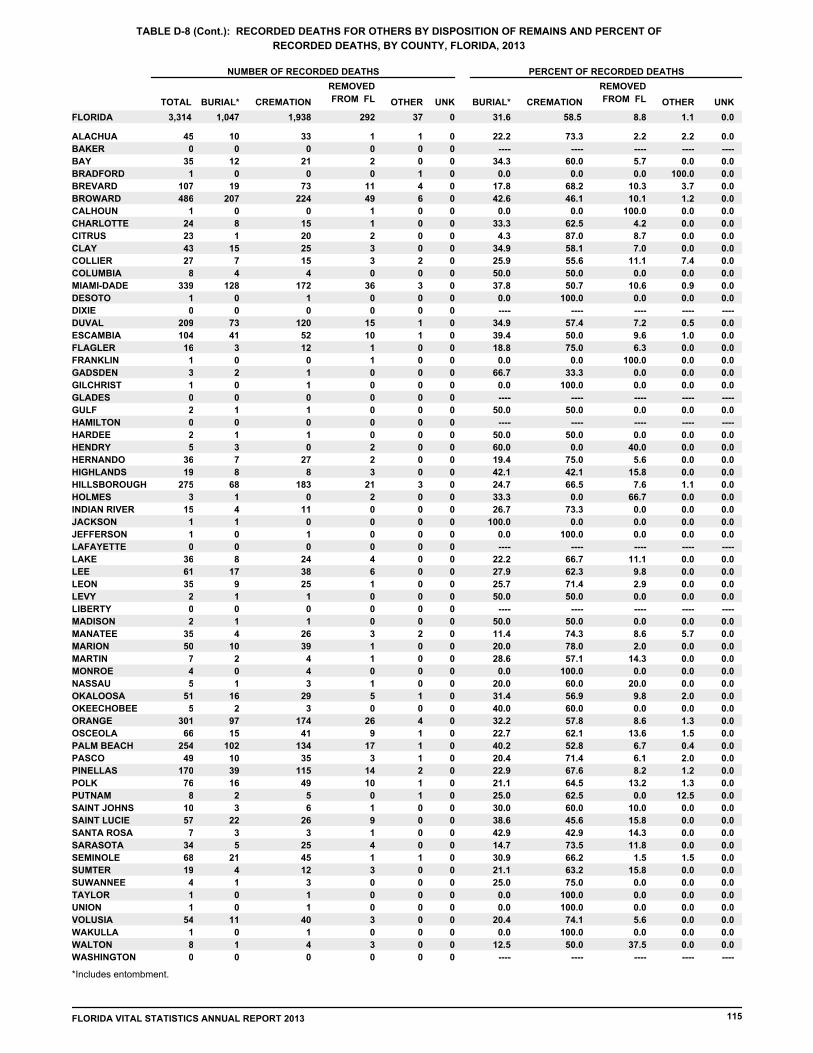
TABLE D-8 (Cont.): RECORDED DEATHS FOR OTHERS BY DISPOSITION OF REMAINS AND PERCENT OF
RECORDED DEATHS, BY COUNTY, FLORIDA, 2013
NUMBER OF RECORDED DEATHS PERCENT OF RECORDED DEATHS
UNKOTHER
REMOVED
FROM FLCREMATIONBURIAL*UNKOTHER
REMOVED
FROM FLCREMATIONBURIAL*TOTAL
FLORIDA 3,314 1,047 1,938 292 37 0 31.6 58.5 8.8 1.1 0.0
ALACHUA 45 10 33 1 1 0 22.2 73.3 2.2 2.2 0.0
BAKER 0 0 0 0 0 0 ---- ---- ---- ---- ----
BAY 35 12 21 2 0 0 34.3 60.0 5.7 0.0 0.0
BRADFORD 1 0 0 0 1 0 0.0 0.0 0.0 100.0 0.0
BREVARD 107 19 73 11 4 0 17.8 68.2 10.3 3.7 0.0
BROWARD 486 207 224 49 6 0 42.6 46.1 10.1 1.2 0.0
CALHOUN 1 0 0 1 0 0 0.0 0.0 100.0 0.0 0.0
CHARLOTTE 24 8 15 1 0 0 33.3 62.5 4.2 0.0 0.0
CITRUS 23 1 20 2 0 0 4.3 87.0 8.7 0.0 0.0
CLAY 43 15 25 3 0 0 34.9 58.1 7.0 0.0 0.0
COLLIER 27 7 15 3 2 0 25.9 55.6 11.1 7.4 0.0
COLUMBIA 8 4 4 0 0 0 50.0 50.0 0.0 0.0 0.0
MIAMI-DADE 339 128 172 36 3 0 37.8 50.7 10.6 0.9 0.0
DESOTO 1 0 1 0 0 0 0.0 100.0 0.0 0.0 0.0
DIXIE 0 0 0 0 0 0 ---- ---- ---- ---- ----
DUVAL 209 73 120 15 1 0 34.9 57.4 7.2 0.5 0.0
ESCAMBIA 104 41 52 10 1 0 39.4 50.0 9.6 1.0 0.0
FLAGLER 16 3 12 1 0 0 18.8 75.0 6.3 0.0 0.0
FRANKLIN 1 0 0 1 0 0 0.0 0.0 100.0 0.0 0.0
GADSDEN 3 2 1 0 0 0 66.7 33.3 0.0 0.0 0.0
GILCHRIST 1 0 1 0 0 0 0.0 100.0 0.0 0.0 0.0
GLADES 0 0 0 0 0 0 ---- ---- ---- ---- ----
GULF 2 1 1 0 0 0 50.0 50.0 0.0 0.0 0.0
HAMILTON 0 0 0 0 0 0 ---- ---- ---- ---- ----
HARDEE 2 1 1 0 0 0 50.0 50.0 0.0 0.0 0.0
HENDRY 5 3 0 2 0 0 60.0 0.0 40.0 0.0 0.0
HERNANDO 36 7 27 2 0 0 19.4 75.0 5.6 0.0 0.0
HIGHLANDS 19 8 8 3 0 0 42.1 42.1 15.8 0.0 0.0
HILLSBOROUGH 275 68 183 21 3 0 24.7 66.5 7.6 1.1 0.0
HOLMES 3 1 0 2 0 0 33.3 0.0 66.7 0.0 0.0
INDIAN RIVER 15 4 11 0 0 0 26.7 73.3 0.0 0.0 0.0
JACKSON 1 1 0 0 0 0 100.0 0.0 0.0 0.0 0.0
JEFFERSON 1 0 1 0 0 0 0.0 100.0 0.0 0.0 0.0
LAFAYETTE 0 0 0 0 0 0 ---- ---- ---- ---- ----
LAKE 36 8 24 4 0 0 22.2 66.7 11.1 0.0 0.0
LEE 61 17 38 6 0 0 27.9 62.3 9.8 0.0 0.0
LEON 35 9 25 1 0 0 25.7 71.4 2.9 0.0 0.0
LEVY 2 1 1 0 0 0 50.0 50.0 0.0 0.0 0.0
LIBERTY 0 0 0 0 0 0 ---- ---- ---- ---- ----
MADISON 2 1 1 0 0 0 50.0 50.0 0.0 0.0 0.0
MANATEE 35 4 26 3 2 0 11.4 74.3 8.6 5.7 0.0
MARION 50 10 39 1 0 0 20.0 78.0 2.0 0.0 0.0
MARTIN 7 2 4 1 0 0 28.6 57.1 14.3 0.0 0.0
MONROE 4 0 4 0 0 0 0.0 100.0 0.0 0.0 0.0
NASSAU 5 1 3 1 0 0 20.0 60.0 20.0 0.0 0.0
OKALOOSA 51 16 29 5 1 0 31.4 56.9 9.8 2.0 0.0
OKEECHOBEE 5 2 3 0 0 0 40.0 60.0 0.0 0.0 0.0
ORANGE 301 97 174 26 4 0 32.2 57.8 8.6 1.3 0.0
OSCEOLA 66 15 41 9 1 0 22.7 62.1 13.6 1.5 0.0
PALM BEACH 254 102 134 17 1 0 40.2 52.8 6.7 0.4 0.0
PASCO 49 10 35 3 1 0 20.4 71.4 6.1 2.0 0.0
PINELLAS 170 39 115 14 2 0 22.9 67.6 8.2 1.2 0.0
POLK 76 16 49 10 1 0 21.1 64.5 13.2 1.3 0.0
PUTNAM 8 2 5 0 1 0 25.0 62.5 0.0 12.5 0.0
SAINT JOHNS 10 3 6 1 0 0 30.0 60.0 10.0 0.0 0.0
SAINT LUCIE 57 22 26 9 0 0 38.6 45.6 15.8 0.0 0.0
SANTA ROSA 7 3 3 1 0 0 42.9 42.9 14.3 0.0 0.0
SARASOTA 34 5 25 4 0 0 14.7 73.5 11.8 0.0 0.0
SEMINOLE 68 21 45 1 1 0 30.9 66.2 1.5 1.5 0.0
SUMTER 19 4 12 3 0 0 21.1 63.2 15.8 0.0 0.0
SUWANNEE 4 1 3 0 0 0 25.0 75.0 0.0 0.0 0.0
TAYLOR 1 0 1 0 0 0 0.0 100.0 0.0 0.0 0.0
UNION 1 0 1 0 0 0 0.0 100.0 0.0 0.0 0.0
VOLUSIA 54 11 40 3 0 0 20.4 74.1 5.6 0.0 0.0
WAKULLA 1 0 1 0 0 0 0.0 100.0 0.0 0.0 0.0
WALTON 8 1 4 3 0 0 12.5 50.0 37.5 0.0 0.0
WASHINGTON 0 0 0 0 0 0 ---- ---- ---- ---- ----
*Includes entombment.
FLORIDA VITAL STATISTICS ANNUAL REPORT 2013 115

TOTAL WHITE BLACK OTHER MALE FEMALE
TABLE D-9: RESIDENT DEATHS FOR 113 CAUSE GROUPS*, BY RACE AND GENDER, FLORIDA, 2013
180,014 157,225 19,432 3,184 93,066 86,941Total
2 2 0 0 1 1Salmonella Infections
0 0 0 0 0 0Shigellosis & Amebiasis
687 613 65 9 270 417Certain Other Intestinal Infections
34 22 9 3 23 11Tuberculosis
23 14 7 2 17 6 Respiratory Tuberculosis
11 8 2 1 6 5 Other Tuberculosis
1 1 0 0 1 0Whooping Cough
0 0 0 0 0 0Scarlet Fever & Erysipelas
8 6 1 1 5 3Meningococcal Infection
2,084 1,719 326 39 1,007 1,077Septicemia
4 2 2 0 1 3Syphilis
0 0 0 0 0 0Acute Poliomyelitis
0 0 0 0 0 0Arthropod-Borne Viral Encephalitis
0 0 0 0 0 0Measles
587 507 66 12 392 195Viral Hepatitis
935 365 553 15 631 304Human Immunodeficiency Virus (HIV)
1 1 0 0 1 0Malaria
325 273 48 4 162 163Other & Unspecified Infectious and Parasitic Diseases & Sequelae
42,350 37,332 4,232 757 22,922 19,428Malignant Neoplasms (Cancer)
720 638 69 12 523 197 Lip, Oral Cavity, Pharynx
1,059 967 75 17 837 222 Esophagus
766 588 144 33 467 299 Stomach
3,706 3,188 445 69 2,012 1,694 Colon, Rectum and Anus
1,709 1,487 175 45 1,156 553 Liver & Intrahepatic Bile Ducts
2,770 2,455 268 46 1,426 1,344 Pancreas
297 256 33 8 251 46 Larynx
11,823 10,708 937 171 6,529 5,294 Trachea, Bronchus and Lung
778 766 7 4 524 254 Melanoma of Skin
2,790 2,345 382 61 41 2,749 Breast
349 265 71 13 0 349 Cervix Uteri
652 525 112 15 0 652 Corpus Uteri & Uterus, Part Unspecified
971 871 70 29 0 971 Ovary
2,125 1,745 341 38 2,125 0 Prostate
911 835 67 8 608 303 Kidney & Renal Pelvis
1,227 1,129 83 15 913 314 Bladder
1,006 930 59 17 530 476 Meninges, Brain, & Other Parts of Central Nervous System
4,164 3,646 439 77 2,422 1,742 Lymphoid, Hematopoietic and Related Tissue
82 69 9 4 48 34 Hodgkins Disease
1,549 1,381 141 26 872 677 Non-Hodgkins Lymphoma
1,688 1,524 140 23 1,025 663 Leukemia
841 669 148 24 476 365 Multiple Myeloma & Immunoprolifera Neoplasms
4 3 1 0 1 3 Other & Unspec--Lymphoid, Hematopoietic and Related Tissue
4,527 3,988 455 79 2,558 1,969 All Other & Unspecified Malignant Neoplasms
1,145 1,028 85 30 627 518In Situ, Benign, Uncertain and Unknown Behavior Neoplasms
314 234 74 6 144 170Anemias
5,209 4,023 1,058 126 2,919 2,290Diabetes Mellitus
133 106 23 4 53 80Nutritional Deficiencies
123 97 23 3 50 73 Malnutrition
10 9 0 1 3 7 Other Nutritional Deficiencies
21 17 3 1 13 8Meningitis
1,932 1,817 86 29 1,203 728Parkinsons Disease
5,064 4,699 301 61 1,721 3,343Alzheimers Disease
54,958 48,028 5,932 944 28,670 26,287Major Cardiovascular Diseases
42,249 37,350 4,199 660 22,939 19,309 Heart Diseases
202 178 20 4 75 127 Acute Rheumatic Fever & Chronic Rheumatic Heart Diseases
2,694 2,185 457 48 1,415 1,279 Hypertensive Heart Disease
221 168 50 3 109 112 Hypertensive Heart & Renal Disease
27,712 24,737 2,523 427 15,580 12,131 Ischemic Heart Diseases
7,465 6,578 749 131 4,100 3,365 Acute Myocardial Infarction
158 141 15 2 72 86 Other Acute Ischemic Heart Diseases
20,089 18,018 1,759 294 11,408 8,680 Other Forms of Chronic Ischemic Heart Disease
3,946 3,509 376 57 2,238 1,708 Atherosclerotic Cardiovascular Disease
16,143 14,509 1,383 237 9,170 6,972 All Other Chronic Ischemic Heart Disease
11,420 10,082 1,149 178 5,760 5,660 Other Heart Diseases
88 74 13 1 55 33 Acute & Subacute Endocarditis
44 42 2 0 24 20 Pericardium Diseases & Acute Myocarditis
3,024 2,724 248 48 1,454 1,570 Heart Failure
8,264 7,242 886 129 4,227 4,037 All Other Forms of Heart Disease
2,140 1,709 387 43 960 1,180 Essential Hypertension & Hypertensive Renal Disease
116 FLORIDA VITAL STATISTICS ANNUAL REPORT 2013
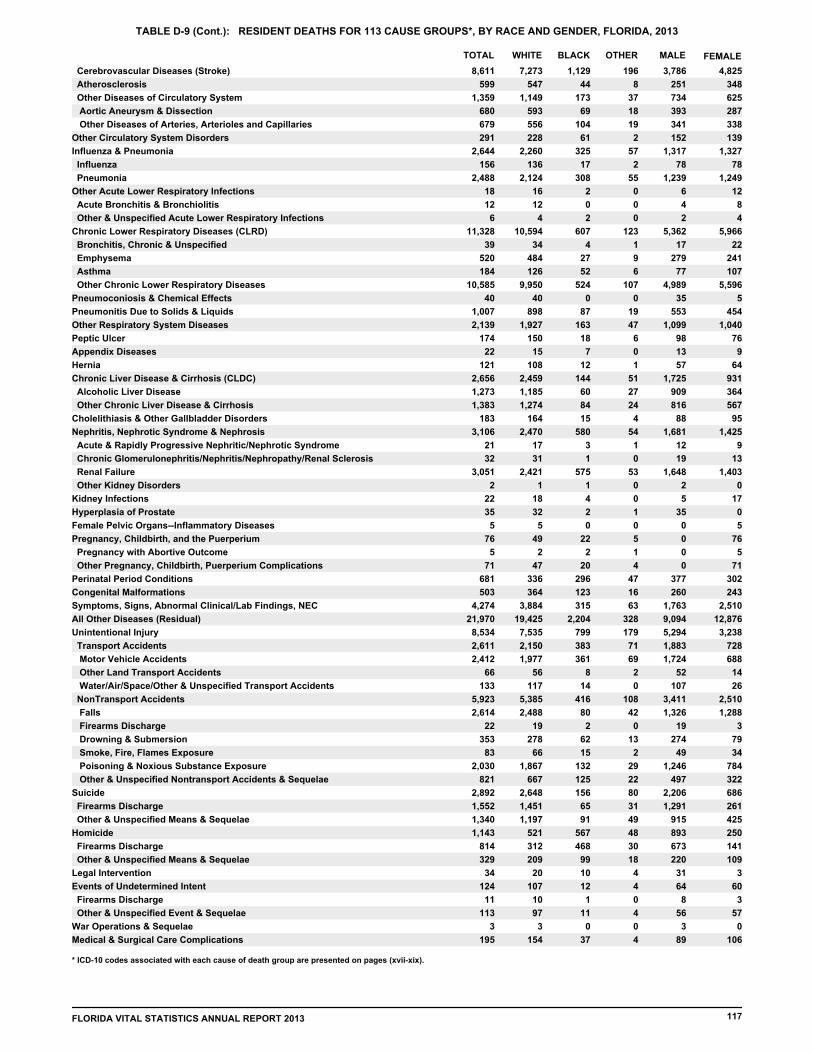
TOTAL WHITE BLACK OTHER MALE FEMALE
TABLE D-9 (Cont.): RESIDENT DEATHS FOR 113 CAUSE GROUPS*, BY RACE AND GENDER, FLORIDA, 2013
8,611 7,273 1,129 196 3,786 4,825 Cerebrovascular Diseases (Stroke)
599 547 44 8 251 348 Atherosclerosis
1,359 1,149 173 37 734 625 Other Diseases of Circulatory System
680 593 69 18 393 287 Aortic Aneurysm & Dissection
679 556 104 19 341 338 Other Diseases of Arteries, Arterioles and Capillaries
291 228 61 2 152 139Other Circulatory System Disorders
2,644 2,260 325 57 1,317 1,327Influenza & Pneumonia
156 136 17 2 78 78 Influenza
2,488 2,124 308 55 1,239 1,249 Pneumonia
18 16 2 0 6 12Other Acute Lower Respiratory Infections
12 12 0 0 4 8 Acute Bronchitis & Bronchiolitis
6 4 2 0 2 4 Other & Unspecified Acute Lower Respiratory Infections
11,328 10,594 607 123 5,362 5,966Chronic Lower Respiratory Diseases (CLRD)
39 34 4 1 17 22 Bronchitis, Chronic & Unspecified
520 484 27 9 279 241 Emphysema
184 126 52 6 77 107 Asthma
10,585 9,950 524 107 4,989 5,596 Other Chronic Lower Respiratory Diseases
40 40 0 0 35 5Pneumoconiosis & Chemical Effects
1,007 898 87 19 553 454Pneumonitis Due to Solids & Liquids
2,139 1,927 163 47 1,099 1,040Other Respiratory System Diseases
174 150 18 6 98 76Peptic Ulcer
22 15 7 0 13 9Appendix Diseases
121 108 12 1 57 64Hernia
2,656 2,459 144 51 1,725 931Chronic Liver Disease & Cirrhosis (CLDC)
1,273 1,185 60 27 909 364 Alcoholic Liver Disease
1,383 1,274 84 24 816 567 Other Chronic Liver Disease & Cirrhosis
183 164 15 4 88 95Cholelithiasis & Other Gallbladder Disorders
3,106 2,470 580 54 1,681 1,425Nephritis, Nephrotic Syndrome & Nephrosis
21 17 3 1 12 9 Acute & Rapidly Progressive Nephritic/Nephrotic Syndrome
32 31 1 0 19 13 Chronic Glomerulonephritis/Nephritis/Nephropathy/Renal Sclerosis
3,051 2,421 575 53 1,648 1,403 Renal Failure
2 1 1 0 2 0 Other Kidney Disorders
22 18 4 0 5 17Kidney Infections
35 32 2 1 35 0Hyperplasia of Prostate
5 5 0 0 0 5Female Pelvic Organs--Inflammatory Diseases
76 49 22 5 0 76Pregnancy, Childbirth, and the Puerperium
5 2 2 1 0 5 Pregnancy with Abortive Outcome
71 47 20 4 0 71 Other Pregnancy, Childbirth, Puerperium Complications
681 336 296 47 377 302Perinatal Period Conditions
503 364 123 16 260 243Congenital Malformations
4,274 3,884 315 63 1,763 2,510Symptoms, Signs, Abnormal Clinical/Lab Findings, NEC
21,970 19,425 2,204 328 9,094 12,876All Other Diseases (Residual)
8,534 7,535 799 179 5,294 3,238Unintentional Injury
2,611 2,150 383 71 1,883 728 Transport Accidents
2,412 1,977 361 69 1,724 688 Motor Vehicle Accidents
66 56 8 2 52 14 Other Land Transport Accidents
133 117 14 0 107 26 Water/Air/Space/Other & Unspecified Transport Accidents
5,923 5,385 416 108 3,411 2,510 NonTransport Accidents
2,614 2,488 80 42 1,326 1,288 Falls
22 19 2 0 19 3 Firearms Discharge
353 278 62 13 274 79 Drowning & Submersion
83 66 15 2 49 34 Smoke, Fire, Flames Exposure
2,030 1,867 132 29 1,246 784 Poisoning & Noxious Substance Exposure
821 667 125 22 497 322 Other & Unspecified Nontransport Accidents & Sequelae
2,892 2,648 156 80 2,206 686Suicide
1,552 1,451 65 31 1,291 261 Firearms Discharge
1,340 1,197 91 49 915 425 Other & Unspecified Means & Sequelae
1,143 521 567 48 893 250Homicide
814 312 468 30 673 141 Firearms Discharge
329 209 99 18 220 109 Other & Unspecified Means & Sequelae
34 20 10 4 31 3Legal Intervention
124 107 12 4 64 60Events of Undetermined Intent
11 10 1 0 8 3 Firearms Discharge
113 97 11 4 56 57 Other & Unspecified Event & Sequelae
3 3 0 0 3 0War Operations & Sequelae
195 154 37 4 89 106Medical & Surgical Care Complications
* ICD-10 codes associated with each cause of death group are presented on pages (xvii-xix).
FLORIDA VITAL STATISTICS ANNUAL REPORT 2013 117

TABLE D-9 (Cont.): RESIDENT DEATHS FOR 113 CAUSE GROUPS*, BY RACE AND GENDER, FLORIDA, 2013
TOTAL MALE FEMALE MALE FEMALE MALE FEMALE
OTHERBLACKWHITE
180,014 75,928 10,073 1,592 1,591 9,358 81,294Total
2 1 0 0 0 0 1Salmonella Infections
0 0 0 0 0 0 0Shigellosis & Amebiasis
687 378 28 7 2 37 235Certain Other Intestinal Infections
34 7 6 2 1 3 15Tuberculosis
23 4 5 2 0 2 10 Respiratory Tuberculosis
11 3 1 0 1 1 5 Other Tuberculosis
1 0 0 0 0 0 1Whooping Cough
0 0 0 0 0 0 0Scarlet Fever & Erysipelas
8 2 1 0 1 0 4Meningococcal Infection
2,084 886 154 20 19 172 833Septicemia
4 2 1 0 0 1 0Syphilis
0 0 0 0 0 0 0Acute Poliomyelitis
0 0 0 0 0 0 0Arthropod-Borne Viral Encephalitis
0 0 0 0 0 0 0Measles
587 154 34 4 8 32 353Viral Hepatitis
935 74 330 9 6 223 291Human Immunodeficiency Virus (HIV)
1 0 0 0 0 0 1Malaria
325 130 19 0 4 29 143Other & Unspecified Infectious and Parasitic Diseases & Sequelae
42,350 17,021 2,223 372 385 2,009 20,311Malignant Neoplasms (Cancer)
720 167 43 9 3 26 471 Lip, Oral Cavity, Pharynx
1,059 200 61 9 8 14 767 Esophagus
766 230 90 18 15 54 358 Stomach
3,706 1,455 242 35 34 203 1,733 Colon, Rectum and Anus
1,709 486 124 29 16 51 1,001 Liver & Intrahepatic Bile Ducts
2,770 1,178 128 21 25 140 1,277 Pancreas
297 40 28 7 1 5 216 Larynx
11,823 4,853 575 95 76 362 5,855 Trachea, Bronchus and Lung
778 249 4 3 1 3 517 Melanoma of Skin
2,790 2,307 3 0 61 379 38 Breast
349 265 0 0 13 71 0 Cervix Uteri
652 525 0 0 15 112 0 Corpus Uteri & Uterus, Part Unspecified
971 871 0 0 29 70 0 Ovary
2,125 0 341 38 0 0 1,745 Prostate
911 273 38 7 1 29 562 Kidney & Renal Pelvis
1,227 277 50 11 4 33 852 Bladder
1,006 442 30 12 5 29 488 Meninges, Brain, & Other Parts of Central Nervous System
4,164 1,501 234 41 36 205 2,145 Lymphoid, Hematopoietic and Related Tissue
82 30 6 3 1 3 39 Hodgkins Disease
1,549 599 74 15 11 67 782 Non-Hodgkins Lymphoma
1,688 588 77 11 12 63 936 Leukemia
841 281 76 12 12 72 388 Multiple Myeloma & Immunoprolifera Neoplasms
4 3 1 0 0 0 0 Other & Unspec--Lymphoid, Hematopoietic and Related Tissue
4,527 1,702 232 37 42 223 2,286 All Other & Unspecified Malignant Neoplasms
1,145 464 47 16 14 38 564In Situ, Benign, Uncertain and Unknown Behavior Neoplasms
314 130 36 4 2 38 104Anemias
5,209 1,687 506 76 50 552 2,336Diabetes Mellitus
133 66 13 0 4 10 40Nutritional Deficiencies
123 60 13 0 3 10 37 Malnutrition
10 6 0 0 1 0 3 Other Nutritional Deficiencies
21 8 3 1 0 0 9Meningitis
1,932 677 48 16 13 38 1,139Parkinsons Disease
5,064 3,096 97 21 40 204 1,603Alzheimers Disease
54,958 22,836 3,003 442 502 2,929 25,191Major Cardiovascular Diseases
42,249 16,934 2,176 321 339 2,023 20,415 Heart Diseases
202 113 8 2 2 12 65 Acute Rheumatic Fever & Chronic Rheumatic Heart Diseases
2,694 1,054 261 20 28 196 1,131 Hypertensive Heart Disease
221 85 25 1 2 25 83 Hypertensive Heart & Renal Disease
27,712 10,705 1,316 214 213 1,207 14,031 Ischemic Heart Diseases
7,465 2,919 374 61 70 375 3,659 Acute Myocardial Infarction
158 77 7 1 1 8 64 Other Acute Ischemic Heart Diseases
20,089 7,709 935 152 142 824 10,308 Other Forms of Chronic Ischemic Heart Disease
3,946 1,517 212 30 27 164 1,992 Atherosclerotic Cardiovascular Disease
16,143 6,192 723 122 115 660 8,316 All Other Chronic Ischemic Heart Disease
11,420 4,977 566 84 94 583 5,105 Other Heart Diseases
88 29 9 1 0 4 45 Acute & Subacute Endocarditis
44 19 1 0 0 1 23 Pericardium Diseases & Acute Myocarditis
3,024 1,414 122 20 28 126 1,310 Heart Failure
8,264 3,515 434 63 66 452 3,727 All Other Forms of Heart Disease
118 FLORIDA VITAL STATISTICS ANNUAL REPORT 2013

TABLE D-9 (Cont.): RESIDENT DEATHS FOR 113 CAUSE GROUPS*, BY RACE AND GENDER, FLORIDA, 2013
TOTAL MALE FEMALE MALE FEMALE MALE FEMALE
OTHERBLACKWHITE
2,140 961 189 22 21 198 748 Essential Hypertension & Hypertensive Renal Disease
8,611 4,110 542 75 121 587 3,163 Cerebrovascular Diseases (Stroke)
599 315 17 2 6 27 232 Atherosclerosis
1,359 516 79 22 15 94 633 Other Diseases of Circulatory System
680 251 39 12 6 30 342 Aortic Aneurysm & Dissection
679 265 40 10 9 64 291 Other Diseases of Arteries, Arterioles and Capillaries
291 110 33 1 1 28 118Other Circulatory System Disorders
2,644 1,128 154 31 26 171 1,132Influenza & Pneumonia
156 65 7 0 2 10 71 Influenza
2,488 1,063 147 31 24 161 1,061 Pneumonia
18 10 0 0 0 2 6Other Acute Lower Respiratory Infections
12 8 0 0 0 0 4 Acute Bronchitis & Bronchiolitis
6 2 0 0 0 2 2 Other & Unspecified Acute Lower Respiratory Infections
11,328 5,629 325 70 53 282 4,965Chronic Lower Respiratory Diseases (CLRD)
39 19 2 0 1 2 15 Bronchitis, Chronic & Unspecified
520 231 20 6 3 7 253 Emphysema
184 78 25 4 2 27 48 Asthma
10,585 5,301 278 60 47 246 4,649 Other Chronic Lower Respiratory Diseases
40 5 0 0 0 0 35Pneumoconiosis & Chemical Effects
1,007 410 54 10 9 33 488Pneumonitis Due to Solids & Liquids
2,139 937 79 28 19 84 990Other Respiratory System Diseases
174 67 11 4 2 7 83Peptic Ulcer
22 7 5 0 0 2 8Appendix Diseases
121 58 6 1 0 6 50Hernia
2,656 853 91 27 24 53 1,606Chronic Liver Disease & Cirrhosis (CLDC)
1,273 337 43 18 9 17 848 Alcoholic Liver Disease
1,383 516 48 9 15 36 758 Other Chronic Liver Disease & Cirrhosis
183 83 5 2 2 10 81Cholelithiasis & Other Gallbladder Disorders
3,106 1,098 282 25 29 298 1,372Nephritis, Nephrotic Syndrome & Nephrosis
21 8 2 1 0 1 9 Acute & Rapidly Progressive Nephritic/Nephrotic Syndrome
32 12 0 0 0 1 19 Chronic Glomerulonephritis/Nephritis/Nephropathy/Renal Sclerosis
3,051 1,078 279 24 29 296 1,343 Renal Failure
2 0 1 0 0 0 1 Other Kidney Disorders
22 13 0 0 0 4 5Kidney Infections
35 0 2 1 0 0 32Hyperplasia of Prostate
5 5 0 0 0 0 0Female Pelvic Organs--Inflammatory Diseases
76 49 0 0 5 22 0Pregnancy, Childbirth, and the Puerperium
5 2 0 0 1 2 0 Pregnancy with Abortive Outcome
71 47 0 0 4 20 0 Other Pregnancy, Childbirth, Puerperium Complications
681 152 166 25 21 129 184Perinatal Period Conditions
503 171 62 5 11 61 193Congenital Malformations
4,274 2,301 145 27 36 170 1,582Symptoms, Signs, Abnormal Clinical/Lab Findings, NEC
21,970 11,416 935 142 186 1,269 8,009All Other Diseases (Residual)
8,534 2,886 528 101 78 271 4,649Unintentional Injury
2,611 569 254 42 29 129 1,581 Transport Accidents
2,412 534 237 40 29 124 1,443 Motor Vehicle Accidents
66 11 5 2 0 3 45 Other Land Transport Accidents
133 24 12 0 0 2 93 Water/Air/Space/Other & Unspecified Transport Accidents
5,923 2,317 274 59 49 142 3,068 NonTransport Accidents
2,614 1,239 54 21 21 26 1,249 Falls
22 3 2 0 0 0 16 Firearms Discharge
353 63 50 9 4 12 215 Drowning & Submersion
83 26 8 1 1 7 40 Smoke, Fire, Flames Exposure
2,030 723 85 15 14 47 1,144 Poisoning & Noxious Substance Exposure
821 263 75 13 9 50 404 Other & Unspecified Nontransport Accidents & Sequelae
2,892 636 124 64 16 32 2,012Suicide
1,552 249 58 27 4 7 1,202 Firearms Discharge
1,340 387 66 37 12 25 810 Other & Unspecified Means & Sequelae
1,143 147 482 32 16 85 374Homicide
814 79 413 24 6 55 233 Firearms Discharge
329 68 69 8 10 30 141 Other & Unspecified Means & Sequelae
34 3 10 4 0 0 17Legal Intervention
124 54 10 1 3 2 53Events of Undetermined Intent
11 3 1 0 0 0 7 Firearms Discharge
113 51 9 1 3 2 46 Other & Unspecified Event & Sequelae
3 0 0 0 0 0 3War Operations & Sequelae
195 81 15 1 3 22 73Medical & Surgical Care Complications
* ICD-10 codes associated with each cause of death group are presented on pages (xvii-xix).
FLORIDA VITAL STATISTICS ANNUAL REPORT 2013 119

TABLE D-10: RESIDENT DEATHS FOR 358 CAUSE GROUPS*, BY AGE GROUP, FLORIDA, 2013
TOTAL <1 1-4 5-9 10-14 15-19 20-24 25-34 35-44 45-54 55-64 65-74 75-84 85+ UNK
AGE GROUPS
180,014 11 59,669 44,962 31,624 22,047 11,409 4,186 2,645 1,087 502 170 131 253 1,318TOTAL
35 8 3 2 5 30 114 235 582 942 767 986 958 1 4,668INFECTIOUS & PARASITIC
DISEASES
Cholera 0 0 0 0 0 0 0 0 0 0 0 0 0 0 0
Typhoid Fever 0 0 0 0 0 0 0 0 0 0 0 0 0 0 0
Paratyphoid Fever & Oth Salmonella 2 0 0 0 0 0 0 0 0 0 1 1 0 0 0
Shigellosis 0 0 0 0 0 0 0 0 0 0 0 0 0 0 0
Other Bacterial Food-Borne Intox 0 0 0 0 0 0 0 0 0 0 0 0 0 0 0
Amebiasis 0 0 0 0 0 0 0 0 0 0 0 0 0 0 0
Intestinal Infections/Other Spec Org 516 1 0 0 0 0 0 2 4 9 30 86 182 202 0
Diarrhea/Gastroenteritis-Infect Org 171 18 1 0 1 0 1 1 1 5 19 26 43 55 0
Respiratory Tuberculosis 23 0 0 0 0 0 1 2 0 3 4 7 2 4 0
Other Tuberculosis 11 0 0 0 0 0 1 1 0 2 4 0 2 1 0
Plague 0 0 0 0 0 0 0 0 0 0 0 0 0 0 0
Brucellosis 0 0 0 0 0 0 0 0 0 0 0 0 0 0 0
Tetanus 0 0 0 0 0 0 0 0 0 0 0 0 0 0 0
Diphtheria 0 0 0 0 0 0 0 0 0 0 0 0 0 0 0
Whooping Cough 1 1 0 0 0 0 0 0 0 0 0 0 0 0 0
Scarlet Fever & Erysipelas 0 0 0 0 0 0 0 0 0 0 0 0 0 0 0
Meningococcal Infection 8 1 1 0 0 1 1 1 1 0 2 0 0 0 0
Septicemia 2,084 9 3 1 0 4 9 20 40 106 277 386 621 607 1
Other Zoonotic/Bacterial Diseases 121 1 0 0 0 0 0 3 1 8 21 29 24 34 0
Cardiovascular Syphilis 0 0 0 0 0 0 0 0 0 0 0 0 0 0 0
Neurosyphilis 3 0 0 0 0 0 0 0 0 1 0 1 0 1 0
Other & Unspecified Syphilis 1 0 0 0 0 0 0 0 0 0 0 1 0 0 0
Gonococcal Infection 1 0 0 0 0 0 1 0 0 0 0 0 0 0 0
Other Infections-Sex Transmiss 0 0 0 0 0 0 0 0 0 0 0 0 0 0 0
Lyme Disease 0 0 0 0 0 0 0 0 0 0 0 0 0 0 0
Typhus Fever 0 0 0 0 0 0 0 0 0 0 0 0 0 0 0
Spirochetes/Chlamydia/Rickettsia 0 0 0 0 0 0 0 0 0 0 0 0 0 0 0
Acute Poliomyelitis 0 0 0 0 0 0 0 0 0 0 0 0 0 0 0
Rabies 0 0 0 0 0 0 0 0 0 0 0 0 0 0 0
Viral Encephalitis -- Arthropod-Borne 0 0 0 0 0 0 0 0 0 0 0 0 0 0 0
Yellow Fever 0 0 0 0 0 0 0 0 0 0 0 0 0 0 0
Oth Arthropod-Borne Vir/Hemorr Fev 3 0 0 0 0 0 0 0 0 1 1 1 0 0 0
Herpes Viral (Herpes Simplex) Infect 13 1 0 0 0 0 0 0 0 0 2 3 2 5 0
Zoster (Herpes Zoster) 6 0 0 0 0 0 0 1 0 0 0 0 1 4 0
Smallpox 0 0 0 0 0 0 0 0 0 0 0 0 0 0 0
Measles 0 0 0 0 0 0 0 0 0 0 0 0 0 0 0
Rubella (German Measles) 0 0 0 0 0 0 0 0 0 0 0 0 0 0 0
Viral Hepatitis 587 0 0 0 0 0 0 4 14 109 305 101 38 16 0
HIV Disease-Infect/Parasitic Dis 303 0 0 0 0 0 2 29 48 104 86 28 4 2 0
HIV Disease-Malignant Neoplasms 85 0 0 0 0 0 0 5 15 36 18 10 1 0 0
HIV Disease-Oth Spec Diseases 109 0 0 0 0 0 3 4 17 44 28 5 7 1 0
HIV Disease-Other Conditions 185 0 0 0 0 0 3 12 34 53 51 22 9 1 0
Unspecified HIV Disease 253 0 0 0 0 0 5 26 52 79 65 17 8 1 0
All Other Viral Diseases 61 3 2 2 0 0 2 1 2 12 7 15 11 4 0
Mycoses 33 0 0 0 0 0 1 2 1 4 5 6 9 5 0
Malaria 1 0 0 0 0 0 0 0 1 0 0 0 0 0 0
Leishmaniasis 0 0 0 0 0 0 0 0 0 0 0 0 0 0 0
Trypanosomiasis 1 0 0 0 0 0 0 0 0 0 0 1 0 0 0
Pneumocystosis 9 0 0 0 0 0 0 0 1 3 2 0 3 0 0
Other Protozoal Diseases 1 0 0 0 1 0 0 0 0 0 0 0 0 0 0
Schistosomiasis (Bilharziasis) 0 0 0 0 0 0 0 0 0 0 0 0 0 0 0
120 FLORIDA VITAL STATISTICS ANNUAL REPORT 2013

TABLE D-10 (Cont.): RESIDENT DEATHS FOR 358 CAUSE GROUPS*, BY AGE GROUP, FLORIDA, 2013
TOTAL <1 1-4 5-9 10-14 15-19 20-24 25-34 35-44 45-54 55-64 65-74 75-84 85+ UNK
AGE GROUPS
INFECTIOUS & PARASITIC
DISEASES (Cont.)
Other & Unspecified Helminthiases 4 0 0 0 0 0 0 0 0 0 1 2 1 0 0
Sequelae of Tuberculosis 3 0 0 0 0 0 0 0 0 1 0 0 1 1 0
Sequelae of Poliomyelitis 6 0 0 0 0 0 0 0 0 0 1 0 2 3 0
All Other Infect/Parasit Dis & Seq 63 0 1 0 0 0 0 0 3 2 12 19 15 11 0
10 15 24 22 35 47 235 712 3,127 7,732 11,517 11,792 8,226 1 43,495NEOPLASMS
Cancer: Lip 9 0 0 0 0 0 0 0 1 3 1 0 2 2 0
Cancer: Tongue 212 0 0 0 0 0 1 3 12 23 57 58 34 24 0
Cancer: Pharynx 291 0 0 0 0 0 0 1 7 34 78 89 53 29 0
Cancer: Oth--Lip/Oral/Pharynx 208 0 0 0 0 0 0 1 1 23 49 51 50 33 0
Cancer: Esophagus 1,059 0 0 0 0 0 0 1 6 87 234 347 250 133 1
Cancer: Stomach 766 0 0 0 0 0 1 8 29 66 138 187 200 137 0
Cancer: Small Intestine 72 0 0 0 0 0 0 1 1 3 8 25 15 19 0
Cancer: Colon 3,043 0 0 0 0 2 1 11 58 249 530 695 812 685 0
Cancer: Rectosigmoid/Rectum 601 0 0 0 0 0 0 1 13 65 143 131 146 102 0
Cancer: Anus & Anal Canal 62 0 0 0 0 0 0 0 6 5 14 17 12 8 0
Cancer: Liver 1,339 0 1 0 0 1 1 3 15 101 451 345 255 166 0
Cancer: Intrahepatic Bile Duct 370 0 0 0 0 0 0 1 4 26 80 99 109 51 0
Cancer: Gblad/Extrahepatic B Duct 214 0 0 0 0 0 1 1 1 21 26 63 65 36 0
Cancer: Pancreas 2,770 0 0 0 0 1 0 6 20 161 454 811 798 519 0
Cancer: Other Digestive Organs 103 0 0 0 0 0 0 1 1 5 13 26 28 29 0
Cancer: Nasal Cav/Mid Ear/Sinus 30 0 1 0 0 0 0 2 0 7 3 5 8 4 0
Cancer: Larynx 297 0 0 0 0 0 0 0 1 31 82 83 71 29 0
Cancer: Trachea/Bronchus/Lung 11,823 0 0 0 0 0 0 6 71 713 2,289 3,716 3,351 1,677 0
Cancer: Thymus/Heart/Med/Pleura 20 0 0 0 0 0 0 1 1 3 2 8 1 4 0
Cancer: Other Respir/Intrathoracic 4 0 0 0 0 0 0 0 0 1 1 2 0 0 0
Cancer: Bone & Articular Cartilage 93 0 0 1 3 2 3 8 2 10 7 22 21 14 0
Cancer: Melanoma of Skin 778 0 0 0 0 0 2 7 29 64 138 189 195 154 0
Cancer: Other Skin 275 0 0 0 0 0 0 0 7 12 33 61 72 90 0
Cancer: Mesothelioma 154 0 0 0 0 0 0 0 0 3 16 49 52 34 0
Cancer: Kaposis Sarcoma 8 0 0 0 0 0 0 1 2 0 0 0 2 3 0
Cancer: Other Meso & Soft Tissue 311 0 1 0 3 5 2 12 15 30 55 66 75 47 0
Cancer: Breast 2,790 0 0 0 0 0 0 17 125 362 577 627 589 493 0
Cancer: Vulva & Vagina 82 0 0 0 0 0 0 1 0 8 14 12 21 26 0
Cancer: Cervex Uteri 349 0 0 0 0 0 1 18 39 78 91 67 31 24 0
Cancer: Corpus Uteri/Uterus,Unsp 652 0 0 0 0 0 0 1 11 54 133 221 147 85 0
Cancer: Ovary 971 0 0 0 0 0 3 1 28 87 206 239 273 134 0
Cancer: Other Female Genital Org 21 0 0 0 0 0 0 1 0 1 3 6 7 3 0
Cancer: Placenta 1 0 0 0 0 0 1 0 0 0 0 0 0 0 0
Cancer: Prostate 2,125 0 0 0 0 0 0 1 3 33 189 461 752 686 0
Cancer: Testis 25 0 0 0 0 0 1 8 3 3 4 5 1 0 0
Cancer: Penis/Other Male Gen Org 25 0 0 0 0 0 0 2 2 5 2 10 3 1 0
Cancer: Kidney & Renal Pelvis 911 0 1 0 0 0 2 3 16 68 165 237 256 163 0
Cancer: Bladder 1,227 0 0 0 0 0 0 0 4 36 113 246 405 423 0
Cancer: Other Sites Urinary Tract 53 0 0 0 0 0 0 0 0 3 4 12 13 21 0
Cancer: Eye & Adnexa 12 0 0 0 0 0 0 0 0 3 2 3 1 3 0
Cancer: Brain 992 2 1 7 8 8 5 25 51 113 185 257 222 108 0
Cancer: Other Parts of CNS 14 0 0 0 0 0 0 1 0 3 1 3 3 3 0
Cancer: Thyroid/Oth Endo Glands 172 0 1 3 2 0 1 1 5 9 24 44 46 36 0
Cancer: Other & Unspecified Sites 2,852 0 1 0 2 2 3 14 29 234 499 705 711 652 0
Cancer: Hodgkins Disease 82 0 0 0 1 0 2 9 3 12 8 19 17 11 0
Cancer: Non-Hodgkins Lymphoma 1,549 0 0 1 0 2 4 18 33 92 204 363 472 360 0
Cancer: Oth Lymph/Hematopoietic 4 0 0 0 0 0 0 0 1 0 0 0 2 1 0
FLORIDA VITAL STATISTICS ANNUAL REPORT 2013 121
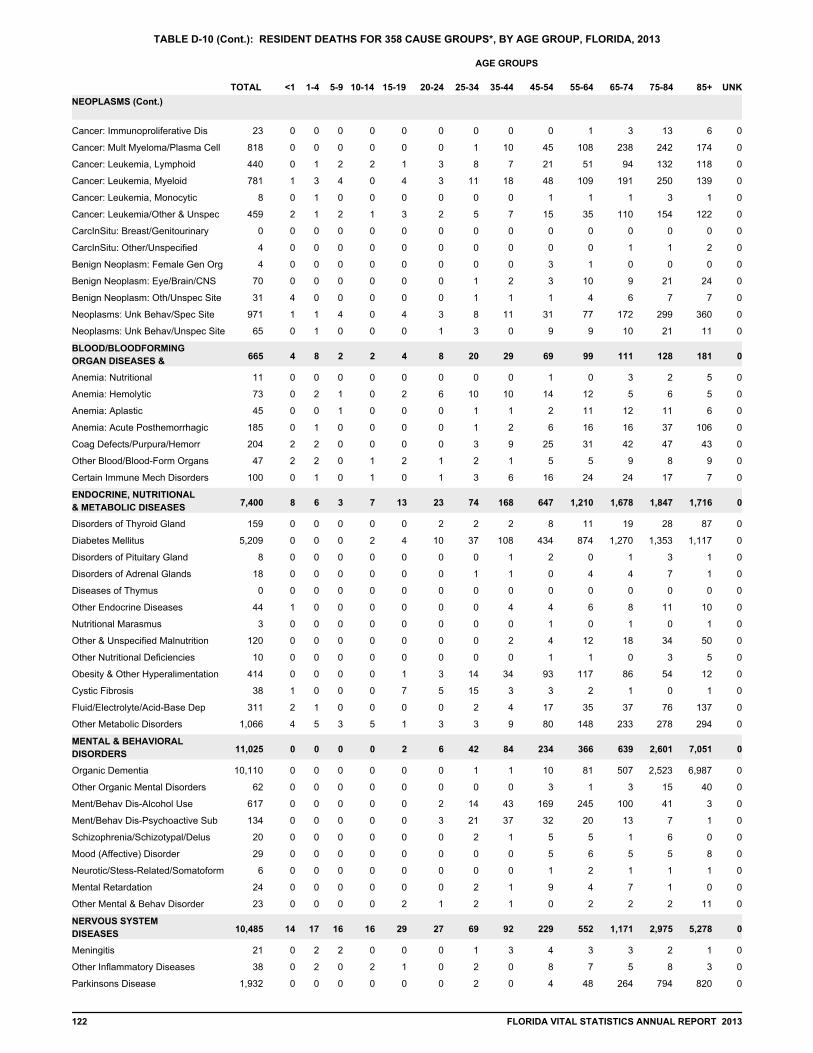
TABLE D-10 (Cont.): RESIDENT DEATHS FOR 358 CAUSE GROUPS*, BY AGE GROUP, FLORIDA, 2013
TOTAL <1 1-4 5-9 10-14 15-19 20-24 25-34 35-44 45-54 55-64 65-74 75-84 85+ UNK
AGE GROUPS
NEOPLASMS (Cont.)
Cancer: Immunoproliferative Dis 23 0 0 0 0 0 0 0 0 0 1 3 13 6 0
Cancer: Mult Myeloma/Plasma Cell 818 0 0 0 0 0 0 1 10 45 108 238 242 174 0
Cancer: Leukemia, Lymphoid 440 0 1 2 2 1 3 8 7 21 51 94 132 118 0
Cancer: Leukemia, Myeloid 781 1 3 4 0 4 3 11 18 48 109 191 250 139 0
Cancer: Leukemia, Monocytic 8 0 1 0 0 0 0 0 0 1 1 1 3 1 0
Cancer: Leukemia/Other & Unspec 459 2 1 2 1 3 2 5 7 15 35 110 154 122 0
CarcInSitu: Breast/Genitourinary 0 0 0 0 0 0 0 0 0 0 0 0 0 0 0
CarcInSitu: Other/Unspecified 4 0 0 0 0 0 0 0 0 0 0 1 1 2 0
Benign Neoplasm: Female Gen Org 4 0 0 0 0 0 0 0 0 3 1 0 0 0 0
Benign Neoplasm: Eye/Brain/CNS 70 0 0 0 0 0 0 1 2 3 10 9 21 24 0
Benign Neoplasm: Oth/Unspec Site 31 4 0 0 0 0 0 1 1 1 4 6 7 7 0
Neoplasms: Unk Behav/Spec Site 971 1 1 4 0 4 3 8 11 31 77 172 299 360 0
Neoplasms: Unk Behav/Unspec Site 65 0 1 0 0 0 1 3 0 9 9 10 21 11 0
4 8 2 2 4 8 20 29 69 99 111 128 181 0 665BLOOD/BLOODFORMING
ORGAN DISEASES &
Anemia: Nutritional 11 0 0 0 0 0 0 0 0 1 0 3 2 5 0
Anemia: Hemolytic 73 0 2 1 0 2 6 10 10 14 12 5 6 5 0
Anemia: Aplastic 45 0 0 1 0 0 0 1 1 2 11 12 11 6 0
Anemia: Acute Posthemorrhagic 185 0 1 0 0 0 0 1 2 6 16 16 37 106 0
Coag Defects/Purpura/Hemorr 204 2 2 0 0 0 0 3 9 25 31 42 47 43 0
Other Blood/Blood-Form Organs 47 2 2 0 1 2 1 2 1 5 5 9 8 9 0
Certain Immune Mech Disorders 100 0 1 0 1 0 1 3 6 16 24 24 17 7 0
8 6 3 7 13 23 74 168 647 1,210 1,678 1,847 1,716 0 7,400ENDOCRINE, NUTRITIONAL
& METABOLIC DISEASES
Disorders of Thyroid Gland 159 0 0 0 0 0 2 2 2 8 11 19 28 87 0
Diabetes Mellitus 5,209 0 0 0 2 4 10 37 108 434 874 1,270 1,353 1,117 0
Disorders of Pituitary Gland 8 0 0 0 0 0 0 0 1 2 0 1 3 1 0
Disorders of Adrenal Glands 18 0 0 0 0 0 0 1 1 0 4 4 7 1 0
Diseases of Thymus 0 0 0 0 0 0 0 0 0 0 0 0 0 0 0
Other Endocrine Diseases 44 1 0 0 0 0 0 0 4 4 6 8 11 10 0
Nutritional Marasmus 3 0 0 0 0 0 0 0 0 1 0 1 0 1 0
Other & Unspecified Malnutrition 120 0 0 0 0 0 0 0 2 4 12 18 34 50 0
Other Nutritional Deficiencies 10 0 0 0 0 0 0 0 0 1 1 0 3 5 0
Obesity & Other Hyperalimentation 414 0 0 0 0 1 3 14 34 93 117 86 54 12 0
Cystic Fibrosis 38 1 0 0 0 7 5 15 3 3 2 1 0 1 0
Fluid/Electrolyte/Acid-Base Dep 311 2 1 0 0 0 0 2 4 17 35 37 76 137 0
Other Metabolic Disorders 1,066 4 5 3 5 1 3 3 9 80 148 233 278 294 0
0 0 0 0 2 6 42 84 234 366 639 2,601 7,051 0 11,025MENTAL & BEHAVIORAL
DISORDERS
Organic Dementia 10,110 0 0 0 0 0 0 1 1 10 81 507 2,523 6,987 0
Other Organic Mental Disorders 62 0 0 0 0 0 0 0 0 3 1 3 15 40 0
Ment/Behav Dis-Alcohol Use 617 0 0 0 0 0 2 14 43 169 245 100 41 3 0
Ment/Behav Dis-Psychoactive Sub 134 0 0 0 0 0 3 21 37 32 20 13 7 1 0
Schizophrenia/Schizotypal/Delus 20 0 0 0 0 0 0 2 1 5 5 1 6 0 0
Mood (Affective) Disorder 29 0 0 0 0 0 0 0 0 5 6 5 5 8 0
Neurotic/Stess-Related/Somatoform 6 0 0 0 0 0 0 0 0 1 2 1 1 1 0
Mental Retardation 24 0 0 0 0 0 0 2 1 9 4 7 1 0 0
Other Mental & Behav Disorder 23 0 0 0 0 2 1 2 1 0 2 2 2 11 0
14 17 16 16 29 27 69 92 229 552 1,171 2,975 5,278 0 10,485NERVOUS SYSTEM
DISEASES
Meningitis 21 0 2 2 0 0 0 1 3 4 3 3 2 1 0
Other Inflammatory Diseases 38 0 2 0 2 1 0 2 0 8 7 5 8 3 0
Parkinsons Disease 1,932 0 0 0 0 0 0 2 0 4 48 264 794 820 0
122 FLORIDA VITAL STATISTICS ANNUAL REPORT 2013
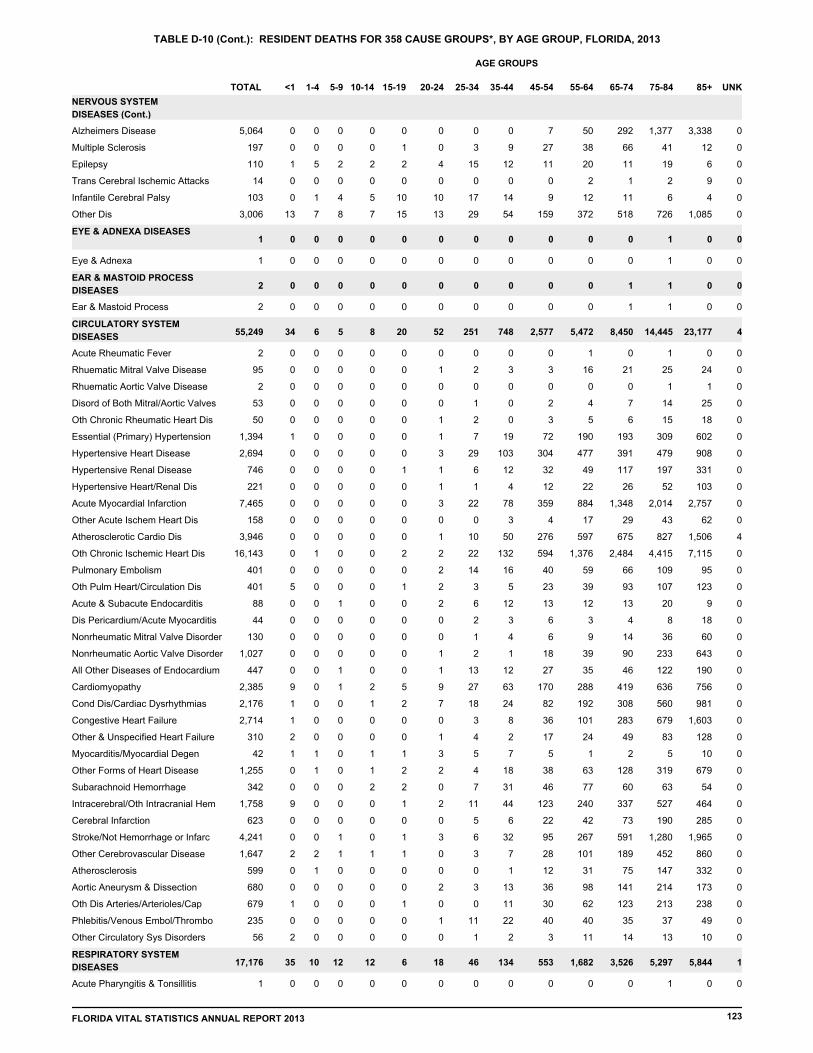
TABLE D-10 (Cont.): RESIDENT DEATHS FOR 358 CAUSE GROUPS*, BY AGE GROUP, FLORIDA, 2013
TOTAL <1 1-4 5-9 10-14 15-19 20-24 25-34 35-44 45-54 55-64 65-74 75-84 85+ UNK
AGE GROUPS
NERVOUS SYSTEM
DISEASES (Cont.)
Alzheimers Disease 5,064 0 0 0 0 0 0 0 0 7 50 292 1,377 3,338 0
Multiple Sclerosis 197 0 0 0 0 1 0 3 9 27 38 66 41 12 0
Epilepsy 110 1 5 2 2 2 4 15 12 11 20 11 19 6 0
Trans Cerebral Ischemic Attacks 14 0 0 0 0 0 0 0 0 0 2 1 2 9 0
Infantile Cerebral Palsy 103 0 1 4 5 10 10 17 14 9 12 11 6 4 0
Other Dis 3,006 13 7 8 7 15 13 29 54 159 372 518 726 1,085 0
0 0 0 0 0 0 0 0 0 0 0 1 0 0 1EYE & ADNEXA DISEASES
Eye & Adnexa 1 0 0 0 0 0 0 0 0 0 0 0 1 0 0
0 0 0 0 0 0 0 0 0 0 1 1 0 0 2EAR & MASTOID PROCESS
DISEASES
Ear & Mastoid Process 2 0 0 0 0 0 0 0 0 0 0 1 1 0 0
34 6 5 8 20 52 251 748 2,577 5,472 8,450 14,445 23,177 4 55,249CIRCULATORY SYSTEM
DISEASES
Acute Rheumatic Fever 2 0 0 0 0 0 0 0 0 0 1 0 1 0 0
Rhuematic Mitral Valve Disease 95 0 0 0 0 0 1 2 3 3 16 21 25 24 0
Rhuematic Aortic Valve Disease 2 0 0 0 0 0 0 0 0 0 0 0 1 1 0
Disord of Both Mitral/Aortic Valves 53 0 0 0 0 0 0 1 0 2 4 7 14 25 0
Oth Chronic Rheumatic Heart Dis 50 0 0 0 0 0 1 2 0 3 5 6 15 18 0
Essential (Primary) Hypertension 1,394 1 0 0 0 0 1 7 19 72 190 193 309 602 0
Hypertensive Heart Disease 2,694 0 0 0 0 0 3 29 103 304 477 391 479 908 0
Hypertensive Renal Disease 746 0 0 0 0 1 1 6 12 32 49 117 197 331 0
Hypertensive Heart/Renal Dis 221 0 0 0 0 0 1 1 4 12 22 26 52 103 0
Acute Myocardial Infarction 7,465 0 0 0 0 0 3 22 78 359 884 1,348 2,014 2,757 0
Other Acute Ischem Heart Dis 158 0 0 0 0 0 0 0 3 4 17 29 43 62 0
Atherosclerotic Cardio Dis 3,946 0 0 0 0 0 1 10 50 276 597 675 827 1,506 4
Oth Chronic Ischemic Heart Dis 16,143 0 1 0 0 2 2 22 132 594 1,376 2,484 4,415 7,115 0
Pulmonary Embolism 401 0 0 0 0 0 2 14 16 40 59 66 109 95 0
Oth Pulm Heart/Circulation Dis 401 5 0 0 0 1 2 3 5 23 39 93 107 123 0
Acute & Subacute Endocarditis 88 0 0 1 0 0 2 6 12 13 12 13 20 9 0
Dis Pericardium/Acute Myocarditis 44 0 0 0 0 0 0 2 3 6 3 4 8 18 0
Nonrheumatic Mitral Valve Disorder 130 0 0 0 0 0 0 1 4 6 9 14 36 60 0
Nonrheumatic Aortic Valve Disorder 1,027 0 0 0 0 0 1 2 1 18 39 90 233 643 0
All Other Diseases of Endocardium 447 0 0 1 0 0 1 13 12 27 35 46 122 190 0
Cardiomyopathy 2,385 9 0 1 2 5 9 27 63 170 288 419 636 756 0
Cond Dis/Cardiac Dysrhythmias 2,176 1 0 0 1 2 7 18 24 82 192 308 560 981 0
Congestive Heart Failure 2,714 1 0 0 0 0 0 3 8 36 101 283 679 1,603 0
Other & Unspecified Heart Failure 310 2 0 0 0 0 1 4 2 17 24 49 83 128 0
Myocarditis/Myocardial Degen 42 1 1 0 1 1 3 5 7 5 1 2 5 10 0
Other Forms of Heart Disease 1,255 0 1 0 1 2 2 4 18 38 63 128 319 679 0
Subarachnoid Hemorrhage 342 0 0 0 2 2 0 7 31 46 77 60 63 54 0
Intracerebral/Oth Intracranial Hem 1,758 9 0 0 0 1 2 11 44 123 240 337 527 464 0
Cerebral Infarction 623 0 0 0 0 0 0 5 6 22 42 73 190 285 0
Stroke/Not Hemorrhage or Infarc 4,241 0 0 1 0 1 3 6 32 95 267 591 1,280 1,965 0
Other Cerebrovascular Disease 1,647 2 2 1 1 1 0 3 7 28 101 189 452 860 0
Atherosclerosis 599 0 1 0 0 0 0 0 1 12 31 75 147 332 0
Aortic Aneurysm & Dissection 680 0 0 0 0 0 2 3 13 36 98 141 214 173 0
Oth Dis Arteries/Arterioles/Cap 679 1 0 0 0 1 0 0 11 30 62 123 213 238 0
Phlebitis/Venous Embol/Thrombo 235 0 0 0 0 0 1 11 22 40 40 35 37 49 0
Other Circulatory Sys Disorders 56 2 0 0 0 0 0 1 2 3 11 14 13 10 0
35 10 12 12 6 18 46 134 553 1,682 3,526 5,297 5,844 1 17,176RESPIRATORY SYSTEM
DISEASES
Acute Pharyngitis & Tonsillitis 1 0 0 0 0 0 0 0 0 0 0 0 1 0 0
FLORIDA VITAL STATISTICS ANNUAL REPORT 2013 123
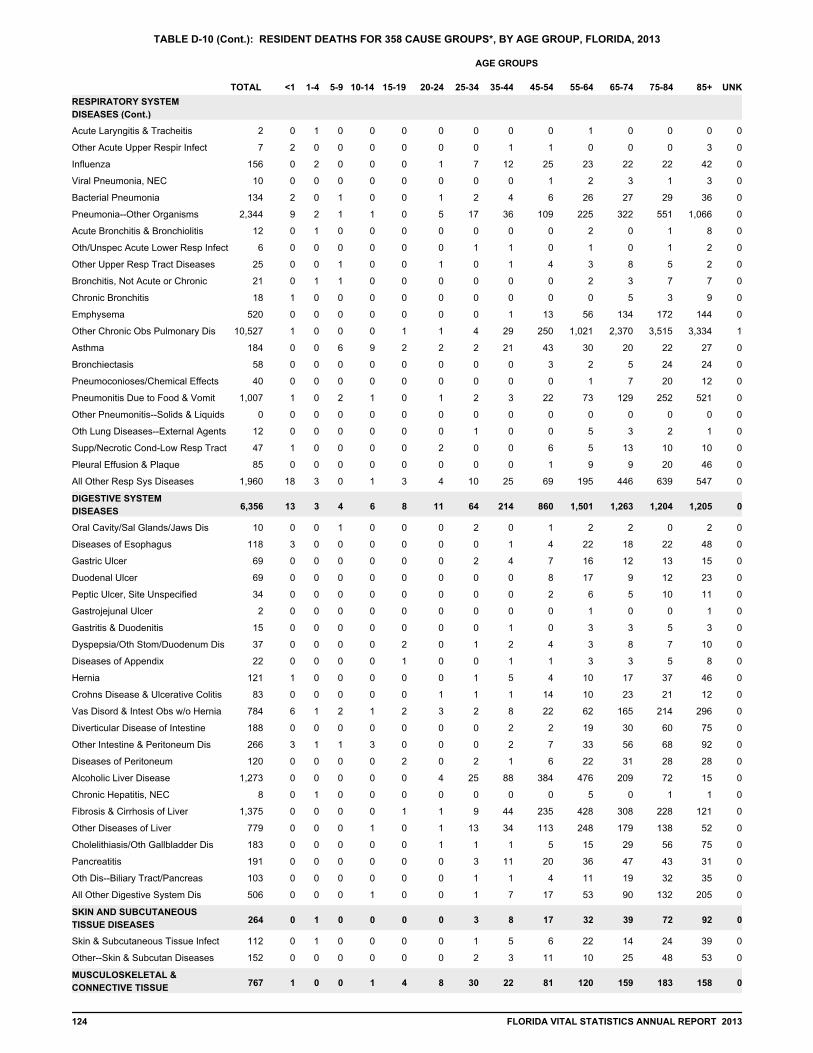
TABLE D-10 (Cont.): RESIDENT DEATHS FOR 358 CAUSE GROUPS*, BY AGE GROUP, FLORIDA, 2013
TOTAL <1 1-4 5-9 10-14 15-19 20-24 25-34 35-44 45-54 55-64 65-74 75-84 85+ UNK
AGE GROUPS
RESPIRATORY SYSTEM
DISEASES (Cont.)
Acute Laryngitis & Tracheitis 2 0 1 0 0 0 0 0 0 0 1 0 0 0 0
Other Acute Upper Respir Infect 7 2 0 0 0 0 0 0 1 1 0 0 0 3 0
Influenza 156 0 2 0 0 0 1 7 12 25 23 22 22 42 0
Viral Pneumonia, NEC 10 0 0 0 0 0 0 0 0 1 2 3 1 3 0
Bacterial Pneumonia 134 2 0 1 0 0 1 2 4 6 26 27 29 36 0
Pneumonia--Other Organisms 2,344 9 2 1 1 0 5 17 36 109 225 322 551 1,066 0
Acute Bronchitis & Bronchiolitis 12 0 1 0 0 0 0 0 0 0 2 0 1 8 0
Oth/Unspec Acute Lower Resp Infect 6 0 0 0 0 0 0 1 1 0 1 0 1 2 0
Other Upper Resp Tract Diseases 25 0 0 1 0 0 1 0 1 4 3 8 5 2 0
Bronchitis, Not Acute or Chronic 21 0 1 1 0 0 0 0 0 0 2 3 7 7 0
Chronic Bronchitis 18 1 0 0 0 0 0 0 0 0 0 5 3 9 0
Emphysema 520 0 0 0 0 0 0 0 1 13 56 134 172 144 0
Other Chronic Obs Pulmonary Dis 10,527 1 0 0 0 1 1 4 29 250 1,021 2,370 3,515 3,334 1
Asthma 184 0 0 6 9 2 2 2 21 43 30 20 22 27 0
Bronchiectasis 58 0 0 0 0 0 0 0 0 3 2 5 24 24 0
Pneumoconioses/Chemical Effects 40 0 0 0 0 0 0 0 0 0 1 7 20 12 0
Pneumonitis Due to Food & Vomit 1,007 1 0 2 1 0 1 2 3 22 73 129 252 521 0
Other Pneumonitis--Solids & Liquids 0 0 0 0 0 0 0 0 0 0 0 0 0 0 0
Oth Lung Diseases--External Agents 12 0 0 0 0 0 0 1 0 0 5 3 2 1 0
Supp/Necrotic Cond-Low Resp Tract 47 1 0 0 0 0 2 0 0 6 5 13 10 10 0
Pleural Effusion & Plaque 85 0 0 0 0 0 0 0 0 1 9 9 20 46 0
All Other Resp Sys Diseases 1,960 18 3 0 1 3 4 10 25 69 195 446 639 547 0
13 3 4 6 8 11 64 214 860 1,501 1,263 1,204 1,205 0 6,356DIGESTIVE SYSTEM
DISEASES
Oral Cavity/Sal Glands/Jaws Dis 10 0 0 1 0 0 0 2 0 1 2 2 0 2 0
Diseases of Esophagus 118 3 0 0 0 0 0 0 1 4 22 18 22 48 0
Gastric Ulcer 69 0 0 0 0 0 0 2 4 7 16 12 13 15 0
Duodenal Ulcer 69 0 0 0 0 0 0 0 0 8 17 9 12 23 0
Peptic Ulcer, Site Unspecified 34 0 0 0 0 0 0 0 0 2 6 5 10 11 0
Gastrojejunal Ulcer 2 0 0 0 0 0 0 0 0 0 1 0 0 1 0
Gastritis & Duodenitis 15 0 0 0 0 0 0 0 1 0 3 3 5 3 0
Dyspepsia/Oth Stom/Duodenum Dis 37 0 0 0 0 2 0 1 2 4 3 8 7 10 0
Diseases of Appendix 22 0 0 0 0 1 0 0 1 1 3 3 5 8 0
Hernia 121 1 0 0 0 0 0 1 5 4 10 17 37 46 0
Crohns Disease & Ulcerative Colitis 83 0 0 0 0 0 1 1 1 14 10 23 21 12 0
Vas Disord & Intest Obs w/o Hernia 784 6 1 2 1 2 3 2 8 22 62 165 214 296 0
Diverticular Disease of Intestine 188 0 0 0 0 0 0 0 2 2 19 30 60 75 0
Other Intestine & Peritoneum Dis 266 3 1 1 3 0 0 0 2 7 33 56 68 92 0
Diseases of Peritoneum 120 0 0 0 0 2 0 2 1 6 22 31 28 28 0
Alcoholic Liver Disease 1,273 0 0 0 0 0 4 25 88 384 476 209 72 15 0
Chronic Hepatitis, NEC 8 0 1 0 0 0 0 0 0 0 5 0 1 1 0
Fibrosis & Cirrhosis of Liver 1,375 0 0 0 0 1 1 9 44 235 428 308 228 121 0
Other Diseases of Liver 779 0 0 0 1 0 1 13 34 113 248 179 138 52 0
Cholelithiasis/Oth Gallbladder Dis 183 0 0 0 0 0 1 1 1 5 15 29 56 75 0
Pancreatitis 191 0 0 0 0 0 0 3 11 20 36 47 43 31 0
Oth Dis--Biliary Tract/Pancreas 103 0 0 0 0 0 0 1 1 4 11 19 32 35 0
All Other Digestive System Dis 506 0 0 0 1 0 0 1 7 17 53 90 132 205 0
0 1 0 0 0 0 3 8 17 32 39 72 92 0 264SKIN AND SUBCUTANEOUS
TISSUE DISEASES
Skin & Subcutaneous Tissue Infect 112 0 1 0 0 0 0 1 5 6 22 14 24 39 0
Other--Skin & Subcutan Diseases 152 0 0 0 0 0 0 2 3 11 10 25 48 53 0
1 0 0 1 4 8 30 22 81 120 159 183 158 0 767MUSCULOSKELETAL &
CONNECTIVE TISSUE
124 FLORIDA VITAL STATISTICS ANNUAL REPORT 2013

TABLE D-10 (Cont.): RESIDENT DEATHS FOR 358 CAUSE GROUPS*, BY AGE GROUP, FLORIDA, 2013
TOTAL <1 1-4 5-9 10-14 15-19 20-24 25-34 35-44 45-54 55-64 65-74 75-84 85+ UNK
AGE GROUPS
MUSCULOSKELETAL &
CONNECTIVE TISSUE
Rheumatoid Arthritis & Inflam 128 0 0 0 0 0 0 1 0 11 14 29 45 28 0
Systemic Lupus Erythematosus 101 0 0 0 0 2 4 9 11 16 23 15 13 8 0
Other Arthropat & Related Disord 249 0 0 0 0 1 2 13 8 26 39 64 51 45 0
Dorsopathies 71 0 0 0 1 1 1 1 0 6 14 16 12 19 0
Soft Tissue Disorders 90 1 0 0 0 0 1 5 0 14 15 12 26 16 0
Osteoporosis 29 0 0 0 0 0 0 0 0 0 0 2 9 18 0
Oth Ost/Chond/Muscskel/Tis Dis 99 0 0 0 0 0 0 1 3 8 15 21 27 24 0
5 2 1 0 0 4 21 58 170 347 713 1,176 1,505 0 4,002GENITOURINARY SYSTEM
DISEASES
Acute/Rapid Progress Nephritic Syn 13 0 0 0 0 0 0 0 0 0 1 1 5 6 0
Nephrotic Syndrome 8 0 1 1 0 0 0 0 0 0 1 0 1 4 0
Other Glomerular Diseases 20 0 0 0 0 0 0 0 0 3 2 2 9 4 0
Renal Tubulo-Interstitial Diseases 45 0 0 0 0 0 0 0 3 4 3 7 7 21 0
Renal Failure 3,051 5 0 0 0 0 4 18 46 136 288 581 890 1,083 0
Urolithiasis 18 0 0 0 0 0 0 0 0 1 3 3 6 5 0
Other Kidney Disorders 14 0 0 0 0 0 0 0 0 1 0 6 3 4 0
Urinary Tract Infect, Site Unspec 596 0 1 0 0 0 0 1 5 12 29 76 194 278 0
Other Diseases of Urinary System 169 0 0 0 0 0 0 1 3 10 14 28 45 68 0
Hyperplasia of Prostate 35 0 0 0 0 0 0 0 0 1 2 3 6 23 0
Oth Dis of Male Genital Organs 14 0 0 0 0 0 0 0 1 2 2 2 6 1 0
Disorders of Breast 1 0 0 0 0 0 0 0 0 0 0 0 0 1 0
Inflam Dis: Female Pelvic Organs 5 0 0 0 0 0 0 1 0 0 1 2 1 0 0
Noninflam Dis: Female Gen Tract 13 0 0 0 0 0 0 0 0 0 1 2 3 7 0
0 0 0 0 1 13 37 24 1 0 0 0 0 0 76PREGNANCY, CHILDBIRTH &
THE PUERPERIUM
Ectopic Pregnancy 3 0 0 0 0 0 1 2 0 0 0 0 0 0 0
Spontaneous Abortion 1 0 0 0 0 0 0 0 1 0 0 0 0 0 0
Medical Abortion 0 0 0 0 0 0 0 0 0 0 0 0 0 0 0
Other Abortion 1 0 0 0 0 0 0 1 0 0 0 0 0 0 0
Other Pregnancy: Abort Outcome 0 0 0 0 0 0 0 0 0 0 0 0 0 0 0
Eclampsia & Pre-Eclampsia 8 0 0 0 0 0 1 4 3 0 0 0 0 0 0
Hemorr-Preg/Birth/Placenta Previa 3 0 0 0 0 0 0 0 3 0 0 0 0 0 0
Obstetric Embolism 4 0 0 0 0 0 1 1 2 0 0 0 0 0 0
Other Comp--Puerperium Related 7 0 0 0 0 0 1 5 1 0 0 0 0 0 0
All Other Direct Obstetric Causes 20 0 0 0 0 1 2 12 5 0 0 0 0 0 0
Obstetric Death-Unspec Cause 3 0 0 0 0 0 0 3 0 0 0 0 0 0 0
Oth Deaths--Preg/Childbirth/Puer 12 0 0 0 0 0 3 3 6 0 0 0 0 0 0
Indirect Obstetric Deaths 14 0 0 0 0 0 4 6 3 1 0 0 0 0 0
674 2 1 1 1 0 0 0 0 0 1 0 1 0 681PERINATAL PERIOD
CONDITIONS
Mat Comp--Pregnancy/Labor/Del 182 180 1 0 0 0 0 0 0 0 0 0 0 1 0
Short Gest & LBW Disorders 211 211 0 0 0 0 0 0 0 0 0 0 0 0 0
Birth Trauma 2 2 0 0 0 0 0 0 0 0 0 0 0 0 0
Intrauterine Hypoxia/Birth Asphyxia 30 27 0 1 1 1 0 0 0 0 0 0 0 0 0
Respiratory Distress of Newborn 36 36 0 0 0 0 0 0 0 0 0 0 0 0 0
Other Respiratory Conditions 42 42 0 0 0 0 0 0 0 0 0 0 0 0 0
Infections-Perinatal Period 50 50 0 0 0 0 0 0 0 0 0 0 0 0 0
Other & Unspecified Conditions 128 126 1 0 0 0 0 0 0 0 0 1 0 0 0
236 27 8 6 6 11 28 16 39 50 25 27 24 0 503CONGENITAL
MALFORMATIONS
Anencephaly/Sim Malformations 13 13 0 0 0 0 0 0 0 0 0 0 0 0 0
Spina Bifida 7 2 0 0 0 0 0 2 1 1 1 0 0 0 0
Other Cong Malfs of Nervous Sys 41 19 8 3 1 0 0 3 1 2 2 1 1 0 0
FLORIDA VITAL STATISTICS ANNUAL REPORT 2013 125
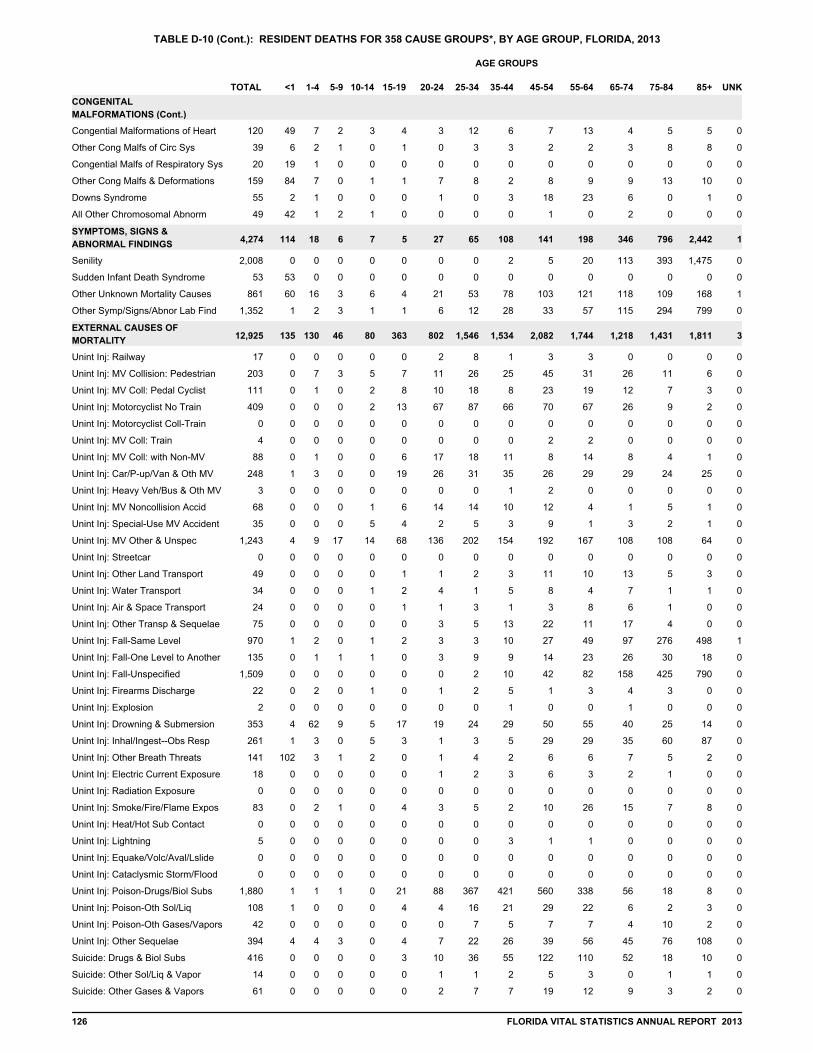
TABLE D-10 (Cont.): RESIDENT DEATHS FOR 358 CAUSE GROUPS*, BY AGE GROUP, FLORIDA, 2013
TOTAL <1 1-4 5-9 10-14 15-19 20-24 25-34 35-44 45-54 55-64 65-74 75-84 85+ UNK
AGE GROUPS
CONGENITAL
MALFORMATIONS (Cont.)
Congential Malformations of Heart 120 49 7 2 3 4 3 12 6 7 13 4 5 5 0
Other Cong Malfs of Circ Sys 39 6 2 1 0 1 0 3 3 2 2 3 8 8 0
Congential Malfs of Respiratory Sys 20 19 1 0 0 0 0 0 0 0 0 0 0 0 0
Other Cong Malfs & Deformations 159 84 7 0 1 1 7 8 2 8 9 9 13 10 0
Downs Syndrome 55 2 1 0 0 0 1 0 3 18 23 6 0 1 0
All Other Chromosomal Abnorm 49 42 1 2 1 0 0 0 0 1 0 2 0 0 0
114 18 6 7 5 27 65 108 141 198 346 796 2,442 1 4,274SYMPTOMS, SIGNS &
ABNORMAL FINDINGS
Senility 2,008 0 0 0 0 0 0 0 2 5 20 113 393 1,475 0
Sudden Infant Death Syndrome 53 53 0 0 0 0 0 0 0 0 0 0 0 0 0
Other Unknown Mortality Causes 861 60 16 3 6 4 21 53 78 103 121 118 109 168 1
Other Symp/Signs/Abnor Lab Find 1,352 1 2 3 1 1 6 12 28 33 57 115 294 799 0
135 130 46 80 363 802 1,546 1,534 2,082 1,744 1,218 1,431 1,811 3 12,925EXTERNAL CAUSES OF
MORTALITY
Unint Inj: Railway 17 0 0 0 0 0 2 8 1 3 3 0 0 0 0
Unint Inj: MV Collision: Pedestrian 203 0 7 3 5 7 11 26 25 45 31 26 11 6 0
Unint Inj: MV Coll: Pedal Cyclist 111 0 1 0 2 8 10 18 8 23 19 12 7 3 0
Unint Inj: Motorcyclist No Train 409 0 0 0 2 13 67 87 66 70 67 26 9 2 0
Unint Inj: Motorcyclist Coll-Train 0 0 0 0 0 0 0 0 0 0 0 0 0 0 0
Unint Inj: MV Coll: Train 4 0 0 0 0 0 0 0 0 2 2 0 0 0 0
Unint Inj: MV Coll: with Non-MV 88 0 1 0 0 6 17 18 11 8 14 8 4 1 0
Unint Inj: Car/P-up/Van & Oth MV 248 1 3 0 0 19 26 31 35 26 29 29 24 25 0
Unint Inj: Heavy Veh/Bus & Oth MV 3 0 0 0 0 0 0 0 1 2 0 0 0 0 0
Unint Inj: MV Noncollision Accid 68 0 0 0 1 6 14 14 10 12 4 1 5 1 0
Unint Inj: Special-Use MV Accident 35 0 0 0 5 4 2 5 3 9 1 3 2 1 0
Unint Inj: MV Other & Unspec 1,243 4 9 17 14 68 136 202 154 192 167 108 108 64 0
Unint Inj: Streetcar 0 0 0 0 0 0 0 0 0 0 0 0 0 0 0
Unint Inj: Other Land Transport 49 0 0 0 0 1 1 2 3 11 10 13 5 3 0
Unint Inj: Water Transport 34 0 0 0 1 2 4 1 5 8 4 7 1 1 0
Unint Inj: Air & Space Transport 24 0 0 0 0 1 1 3 1 3 8 6 1 0 0
Unint Inj: Other Transp & Sequelae 75 0 0 0 0 0 3 5 13 22 11 17 4 0 0
Unint Inj: Fall-Same Level 970 1 2 0 1 2 3 3 10 27 49 97 276 498 1
Unint Inj: Fall-One Level to Another 135 0 1 1 1 0 3 9 9 14 23 26 30 18 0
Unint Inj: Fall-Unspecified 1,509 0 0 0 0 0 0 2 10 42 82 158 425 790 0
Unint Inj: Firearms Discharge 22 0 2 0 1 0 1 2 5 1 3 4 3 0 0
Unint Inj: Explosion 2 0 0 0 0 0 0 0 1 0 0 1 0 0 0
Unint Inj: Drowning & Submersion 353 4 62 9 5 17 19 24 29 50 55 40 25 14 0
Unint Inj: Inhal/Ingest--Obs Resp 261 1 3 0 5 3 1 3 5 29 29 35 60 87 0
Unint Inj: Other Breath Threats 141 102 3 1 2 0 1 4 2 6 6 7 5 2 0
Unint Inj: Electric Current Exposure 18 0 0 0 0 0 1 2 3 6 3 2 1 0 0
Unint Inj: Radiation Exposure 0 0 0 0 0 0 0 0 0 0 0 0 0 0 0
Unint Inj: Smoke/Fire/Flame Expos 83 0 2 1 0 4 3 5 2 10 26 15 7 8 0
Unint Inj: Heat/Hot Sub Contact 0 0 0 0 0 0 0 0 0 0 0 0 0 0 0
Unint Inj: Lightning 5 0 0 0 0 0 0 0 3 1 1 0 0 0 0
Unint Inj: Equake/Volc/Aval/Lslide 0 0 0 0 0 0 0 0 0 0 0 0 0 0 0
Unint Inj: Cataclysmic Storm/Flood 0 0 0 0 0 0 0 0 0 0 0 0 0 0 0
Unint Inj: Poison-Drugs/Biol Subs 1,880 1 1 1 0 21 88 367 421 560 338 56 18 8 0
Unint Inj: Poison-Oth Sol/Liq 108 1 0 0 0 4 4 16 21 29 22 6 2 3 0
Unint Inj: Poison-Oth Gases/Vapors 42 0 0 0 0 0 0 7 5 7 7 4 10 2 0
Unint Inj: Other Sequelae 394 4 4 3 0 4 7 22 26 39 56 45 76 108 0
Suicide: Drugs & Biol Subs 416 0 0 0 0 3 10 36 55 122 110 52 18 10 0
Suicide: Other Sol/Liq & Vapor 14 0 0 0 0 0 1 1 2 5 3 0 1 1 0
Suicide: Other Gases & Vapors 61 0 0 0 0 0 2 7 7 19 12 9 3 2 0
126 FLORIDA VITAL STATISTICS ANNUAL REPORT 2013

TABLE D-10 (Cont.): RESIDENT DEATHS FOR 358 CAUSE GROUPS*, BY AGE GROUP, FLORIDA, 2013
TOTAL <1 1-4 5-9 10-14 15-19 20-24 25-34 35-44 45-54 55-64 65-74 75-84 85+ UNK
AGE GROUPS
EXTERNAL CAUSES OF
MORTALITY (Cont.)
Suicide: Hang/Strangle/Suffocate 608 0 0 1 9 35 47 96 127 138 75 42 22 16 0
Suicide: Firearms Discharge 1,552 0 0 0 3 37 80 173 191 297 281 227 174 89 0
Suicide: Jump From High Place 64 0 0 0 0 1 5 8 12 13 11 8 4 2 0
Suicide: Other Unspec Sequelae 177 0 0 0 1 2 10 22 29 44 35 18 12 4 0
Homicide: Drugs/Biol/Noxious Subs 8 0 1 0 1 1 0 0 1 2 1 1 0 0 0
Homicide: Hang/Strangle/Suffocate 37 0 1 1 2 4 1 3 4 9 2 6 2 1 1
Homicide: Firearms Discharge 814 1 3 2 13 74 187 244 127 85 45 18 12 3 0
Homicide: Sharp Object 101 0 0 0 1 4 13 26 17 12 12 8 5 3 0
Homicide: Blunt Object 2 0 0 0 0 0 0 0 0 1 0 0 1 0 0
Homicide: Bodily Force 3 0 1 0 0 0 0 0 0 1 1 0 0 0 0
Homicide: Sex Assault-Body Force 0 0 0 0 0 0 0 0 0 0 0 0 0 0 0
Homicide: Neg/Aban/Oth Maltreat 16 5 5 0 0 2 0 1 1 0 0 0 1 0 1
Homicide: Other Sequelae 162 6 13 4 0 4 7 18 30 26 29 13 9 3 0
Undet Inj: Poison-Drugs/Biol Subs 63 0 1 2 1 1 2 10 17 13 9 6 1 0 0
Undet Inj: Poison-Oth Sol/Liq 1 0 0 0 0 0 0 0 0 1 0 0 0 0 0
Undet Inj: Poison-Other Gases/Vap 3 0 0 0 0 0 0 0 0 1 1 0 1 0 0
Undet Inj: Firearms Discharge 11 0 0 0 0 1 1 0 3 2 3 1 0 0 0
Undet Inj: Fall/Jump/Push 2 0 0 0 0 0 1 1 0 0 0 0 0 0 0
Undet Inj: Other Sequelae 44 3 4 0 0 2 3 2 8 11 6 2 3 0 0
Legal: Execution 7 0 0 0 0 0 0 0 1 2 3 1 0 0 0
Legal: Other Interven & Seque 27 0 0 0 0 2 6 4 5 4 4 1 0 1 0
War Operations & Sequelae 3 0 0 0 0 0 0 0 0 0 0 1 2 0 0
Med/Surg Care: Therapy-Drug/Med 24 0 0 0 1 0 0 2 1 3 4 7 4 2 0
Med/Surg Care: Misadventure 4 0 0 0 0 0 0 0 0 0 0 2 0 2 0
Med/Surg Care: Oth Complications 167 1 0 0 3 0 1 6 8 14 27 43 37 27 0
* ICD-10 codes associated with each cause of death group are presented on pages (xx-xxvi).
FLORIDA VITAL STATISTICS ANNUAL REPORT 2013 127

TABLE D-11: RESIDENT DEATHS FOR SELECTED CAUSES*, BY AGE GROUPS, BY COUNTY, FLORIDA, 2013
TOTAL <1 1-4 5-9 10-14 15-19 20-24 25-34 35-44 45-54 55-64 65-74 75-84 85+ UNK
AGE GROUPS
180,014 1,318 253 131 170 502 1,087 2,645 4,186 11,409 22,047 31,624 44,962 11 59,669FLORIDA
42,350 5 13 20 22 31 43 222 698 3,080 7,631 11,319 11,443 1 7,822Cancer
42,249 19 3 3 5 13 42 191 548 2,038 4,264 6,502 10,803 4 17,814Heart Diseases
11,328 2 1 7 9 3 3 6 51 309 1,111 2,537 3,743 1 3,545Chronic Lower Resp Diseases
8,611 11 2 2 3 5 5 32 120 314 727 1,250 2,512 0 3,628Stroke
8,534 119 101 36 45 190 425 886 888 1,257 1,070 752 1,119 1 1,645Unintentional Injury
5,209 0 0 0 2 4 10 37 108 434 874 1,270 1,353 0 1,117Diabetes Mellitus
5,064 0 0 0 0 0 0 0 0 7 50 292 1,377 0 3,338Alzheimer's Disease
3,106 5 1 1 0 0 4 18 46 140 292 590 908 0 1,101Nephritis
2,892 0 0 1 13 78 155 343 423 638 527 356 234 0 124Suicide
2,656 0 1 0 0 1 5 34 132 619 909 517 301 0 137Chronic Liver Disease/Cirrhosis
2,644 11 4 2 1 0 7 26 52 141 276 374 603 0 1,147Influenza & Pneumonia
2,140 1 0 0 0 1 2 13 31 104 239 310 506 0 933Hypertension
2,084 9 3 1 0 4 9 20 40 106 277 386 621 1 607Septicemia
1,932 0 0 0 0 0 0 2 0 4 48 264 794 0 820Parkinson's Disease
1,145 5 2 4 0 4 4 13 14 47 101 198 349 0 404Benign Neoplasms
1,143 12 24 7 17 89 208 292 180 136 90 46 30 2 10Homicide
1,007 1 0 2 1 0 1 2 3 22 73 129 252 0 521Pneumonitis
935 0 0 0 0 0 13 76 166 316 248 82 29 0 5Human Immunodeficiency Virus
681 674 2 1 1 1 0 0 0 0 0 1 0 0 1Perinatal Period Conditions
680 0 0 0 0 0 2 3 13 36 98 141 214 0 173Aortic Aneurysm & Dissection
599 0 1 0 0 0 0 0 1 12 31 75 147 0 332Atherosclerosis
587 0 0 0 0 0 0 4 14 109 305 101 38 0 16Viral Hepatitis
503 236 27 8 6 6 11 28 16 39 50 25 27 0 24Congenital Malformations
314 0 3 2 0 2 6 12 13 23 39 36 56 0 122Anemias
195 1 0 0 4 0 1 8 9 17 31 52 41 0 31Medical & Surgical Complications
31,082 204 60 32 40 64 117 359 585 1,422 2,645 3,978 7,399 1 14,176All Other Natural Causes
356 4 5 2 5 6 14 25 43 51 57 64 48 0 32All Other External Causes
TOTAL <1 1-4 5-9 10-14 15-19 20-24 25-34 35-44 45-54 55-64 65-74 75-84 85+ UNK
AGE GROUPS
1,799 28 4 3 1 1 7 43 44 117 274 280 400 0 597ALACHUA
446 0 0 0 0 0 1 3 7 29 111 111 101 0 83Cancer
378 0 0 0 0 0 1 0 3 19 39 57 92 0 167Heart Diseases
87 0 0 0 0 0 0 0 0 2 16 19 27 0 23Chronic Lower Resp Diseases
85 0 0 0 0 0 0 1 0 3 10 5 26 0 40Stroke
100 0 1 0 0 0 1 15 11 7 14 4 18 0 29Unintentional Injury
72 0 0 0 0 0 0 1 2 12 9 11 21 0 16Diabetes Mellitus
47 0 0 0 0 0 0 0 0 0 0 3 6 0 38Alzheimer's Disease
28 0 0 0 0 0 0 1 2 1 4 6 5 0 9Nephritis
31 0 0 0 1 1 2 6 4 7 6 1 0 0 3Suicide
27 0 0 0 0 0 0 1 4 5 9 4 3 0 1Chronic Liver Disease/Cirrhosis
23 0 0 0 0 0 0 0 1 5 6 2 3 0 6Influenza & Pneumonia
30 0 0 0 0 0 0 0 0 2 5 3 6 0 14Hypertension
13 1 0 0 0 0 0 0 0 1 3 1 5 0 2Septicemia
19 0 0 0 0 0 0 0 0 0 0 2 9 0 8Parkinson's Disease
7 0 0 0 0 0 0 0 1 0 0 1 1 0 4Benign Neoplasms
13 0 1 0 0 0 2 5 3 0 2 0 0 0 0Homicide
7 0 0 0 0 0 0 0 0 1 1 1 2 0 2Pneumonitis
17 0 0 0 0 0 0 4 1 4 6 2 0 0 0Human Immunodeficiency Virus
19 19 0 0 0 0 0 0 0 0 0 0 0 0 0Perinatal Period Conditions
3 0 0 0 0 0 0 0 0 0 1 0 2 0 0Aortic Aneurysm & Dissection
2 0 0 0 0 0 0 0 0 0 0 0 1 0 1Atherosclerosis
5 0 0 0 0 0 0 1 0 0 2 2 0 0 0Viral Hepatitis
8 2 0 1 0 0 0 1 0 1 1 1 1 0 0Congenital Malformations
2 0 0 0 0 0 0 0 0 1 1 0 0 0 0Anemias
1 0 0 0 0 0 0 0 0 0 1 0 0 0 0Medical & Surgical Complications
325 6 2 2 0 0 0 4 4 16 27 44 70 0 150All Other Natural Causes
3 0 0 0 0 0 0 0 1 1 1 0 0 0 0All Other External Causes
* ICD-10 codes associated with each cause of death group are presented on pages (xvii-xix).
128 FLORIDA VITAL STATISTICS ANNUAL REPORT 2013

TABLE D-11 (Cont.): RESIDENT DEATHS FOR SELECTED CAUSES*, BY AGE GROUPS, BY COUNTY, FLORIDA, 2013
TOTAL <1 1-4 5-9 10-14 15-19 20-24 25-34 35-44 45-54 55-64 65-74 75-84 85+ UNK
AGE GROUPS
228 5 1 0 0 1 1 3 10 18 39 50 53 0 47BAKER
59 0 0 0 0 0 0 0 1 5 16 16 10 0 11Cancer
55 0 0 0 0 0 0 0 2 4 4 11 17 0 17Heart Diseases
18 0 0 0 0 0 0 0 0 0 6 8 2 0 2Chronic Lower Resp Diseases
9 0 0 0 0 0 0 0 0 0 1 1 3 0 4Stroke
9 1 0 0 0 0 0 1 4 1 1 1 0 0 0Unintentional Injury
7 0 0 0 0 0 0 0 0 1 2 2 2 0 0Diabetes Mellitus
7 0 0 0 0 0 0 0 0 0 1 0 3 0 3Alzheimer's Disease
3 0 0 0 0 0 0 0 0 0 1 0 1 0 1Nephritis
1 0 0 0 0 0 0 0 0 1 0 0 0 0 0Suicide
2 0 0 0 0 0 0 0 0 0 1 0 1 0 0Chronic Liver Disease/Cirrhosis
3 0 0 0 0 0 0 0 0 0 0 0 1 0 2Influenza & Pneumonia
4 0 0 0 0 0 0 1 0 0 1 1 1 0 0Hypertension
1 0 0 0 0 0 0 0 0 0 0 1 0 0 0Septicemia
3 0 0 0 0 0 0 0 0 0 0 2 0 0 1Parkinson's Disease
1 0 0 0 0 0 0 0 0 0 1 0 0 0 0Benign Neoplasms
0 0 0 0 0 0 0 0 0 0 0 0 0 0 0Homicide
1 0 0 0 0 0 0 0 0 1 0 0 0 0 0Pneumonitis
2 0 0 0 0 0 0 0 1 1 0 0 0 0 0Human Immunodeficiency Virus
2 2 0 0 0 0 0 0 0 0 0 0 0 0 0Perinatal Period Conditions
2 0 0 0 0 0 0 0 0 0 0 1 1 0 0Aortic Aneurysm & Dissection
0 0 0 0 0 0 0 0 0 0 0 0 0 0 0Atherosclerosis
0 0 0 0 0 0 0 0 0 0 0 0 0 0 0Viral Hepatitis
3 2 1 0 0 0 0 0 0 0 0 0 0 0 0Congenital Malformations
0 0 0 0 0 0 0 0 0 0 0 0 0 0 0Anemias
1 0 0 0 0 0 0 0 0 0 0 1 0 0 0Medical & Surgical Complications
35 0 0 0 0 1 1 1 2 4 4 5 11 0 6All Other Natural Causes
1 0 0 0 0 0 0 0 0 0 0 1 0 0 0All Other External Causes
TOTAL <1 1-4 5-9 10-14 15-19 20-24 25-34 35-44 45-54 55-64 65-74 75-84 85+ UNK
AGE GROUPS
1,808 18 1 2 2 1 8 31 57 165 296 339 417 0 471BAY
402 0 0 0 0 0 0 1 8 40 102 104 83 0 64Cancer
450 0 0 0 0 0 0 4 9 31 60 82 118 0 146Heart Diseases
150 0 0 0 0 0 0 0 1 4 16 40 57 0 32Chronic Lower Resp Diseases
72 0 0 0 0 0 0 0 1 7 6 11 23 0 24Stroke
77 5 1 1 0 0 3 16 9 18 4 3 10 0 7Unintentional Injury
73 0 0 0 0 0 0 0 0 4 10 22 18 0 19Diabetes Mellitus
64 0 0 0 0 0 0 0 0 0 0 5 21 0 38Alzheimer's Disease
27 0 0 0 0 0 0 0 0 3 1 10 9 0 4Nephritis
35 0 0 0 0 0 1 5 5 7 12 3 2 0 0Suicide
41 0 0 0 0 0 0 0 5 16 15 3 0 0 2Chronic Liver Disease/Cirrhosis
31 0 0 0 0 0 0 0 0 4 3 4 6 0 14Influenza & Pneumonia
51 0 0 0 0 0 0 0 1 1 1 3 10 0 35Hypertension
13 0 0 0 0 0 0 0 1 0 4 1 2 0 5Septicemia
9 0 0 0 0 0 0 0 0 0 1 2 4 0 2Parkinson's Disease
10 0 0 0 0 0 0 0 1 1 1 4 1 0 2Benign Neoplasms
11 0 0 0 1 1 2 0 1 1 2 2 0 0 1Homicide
6 0 0 0 0 0 0 0 0 0 1 0 2 0 3Pneumonitis
7 0 0 0 0 0 1 1 0 1 2 2 0 0 0Human Immunodeficiency Virus
6 6 0 0 0 0 0 0 0 0 0 0 0 0 0Perinatal Period Conditions
3 0 0 0 0 0 0 0 0 0 1 1 0 0 1Aortic Aneurysm & Dissection
4 0 0 0 0 0 0 0 0 0 0 1 1 0 2Atherosclerosis
20 0 0 0 0 0 0 0 0 6 13 0 1 0 0Viral Hepatitis
10 5 0 0 1 0 0 0 1 0 1 1 0 0 1Congenital Malformations
3 0 0 0 0 0 0 0 1 1 1 0 0 0 0Anemias
1 0 0 0 0 0 0 0 0 0 0 1 0 0 0Medical & Surgical Complications
230 2 0 1 0 0 1 3 13 20 39 34 48 0 69All Other Natural Causes
1 0 0 0 0 0 0 0 0 0 0 1 0 0 0All Other External Causes
* ICD-10 codes associated with each cause of death group are presented on pages (xvii-xix).
FLORIDA VITAL STATISTICS ANNUAL REPORT 2013 129

TABLE D-11 (Cont.): RESIDENT DEATHS FOR SELECTED CAUSES*, BY AGE GROUPS, BY COUNTY, FLORIDA, 2013
TOTAL <1 1-4 5-9 10-14 15-19 20-24 25-34 35-44 45-54 55-64 65-74 75-84 85+ UNK
AGE GROUPS
292 6 1 0 0 1 0 6 8 27 57 62 63 0 61BRADFORD
79 0 0 0 0 0 0 0 2 9 23 18 19 0 8Cancer
70 0 0 0 0 0 0 1 1 6 8 11 16 0 27Heart Diseases
23 0 0 0 0 0 0 0 0 2 6 10 5 0 0Chronic Lower Resp Diseases
9 0 0 0 0 0 0 0 0 1 1 3 2 0 2Stroke
12 0 0 0 0 0 0 2 1 3 1 2 2 0 1Unintentional Injury
9 0 0 0 0 0 0 0 0 0 2 2 3 0 2Diabetes Mellitus
4 0 0 0 0 0 0 0 0 0 0 2 0 0 2Alzheimer's Disease
4 0 0 0 0 0 0 0 0 0 1 2 0 0 1Nephritis
6 0 0 0 0 0 0 1 1 1 2 0 1 0 0Suicide
7 0 0 0 0 0 0 0 0 1 3 3 0 0 0Chronic Liver Disease/Cirrhosis
2 0 0 0 0 0 0 0 0 1 1 0 0 0 0Influenza & Pneumonia
4 0 0 0 0 0 0 0 0 0 0 2 1 0 1Hypertension
2 0 0 0 0 0 0 0 0 0 0 2 0 0 0Septicemia
3 0 0 0 0 0 0 0 0 0 0 0 0 0 3Parkinson's Disease
0 0 0 0 0 0 0 0 0 0 0 0 0 0 0Benign Neoplasms
1 0 0 0 0 0 0 1 0 0 0 0 0 0 0Homicide
1 0 0 0 0 0 0 0 0 0 0 1 0 0 0Pneumonitis
1 0 0 0 0 0 0 0 1 0 0 0 0 0 0Human Immunodeficiency Virus
4 4 0 0 0 0 0 0 0 0 0 0 0 0 0Perinatal Period Conditions
3 0 0 0 0 0 0 0 0 0 0 1 2 0 0Aortic Aneurysm & Dissection
1 0 0 0 0 0 0 0 0 0 0 0 1 0 0Atherosclerosis
0 0 0 0 0 0 0 0 0 0 0 0 0 0 0Viral Hepatitis
3 0 1 0 0 0 0 0 0 0 2 0 0 0 0Congenital Malformations
1 0 0 0 0 0 0 0 0 0 1 0 0 0 0Anemias
0 0 0 0 0 0 0 0 0 0 0 0 0 0 0Medical & Surgical Complications
39 2 0 0 0 1 0 1 1 2 5 2 11 0 14All Other Natural Causes
4 0 0 0 0 0 0 0 1 1 1 1 0 0 0All Other External Causes
TOTAL <1 1-4 5-9 10-14 15-19 20-24 25-34 35-44 45-54 55-64 65-74 75-84 85+ UNK
AGE GROUPS
6,481 35 6 1 5 18 33 81 126 412 779 1,104 1,790 0 2,091BREVARD
1,628 0 0 0 1 0 0 4 18 128 292 404 487 0 294Cancer
1,451 0 0 0 1 0 0 5 11 68 132 214 421 0 599Heart Diseases
426 0 0 0 0 0 0 0 1 14 48 88 152 0 123Chronic Lower Resp Diseases
271 2 0 0 0 0 0 1 2 11 27 32 87 0 109Stroke
293 3 1 1 1 10 13 25 32 50 39 22 40 0 56Unintentional Injury
158 0 0 0 0 1 0 2 4 9 24 39 46 0 33Diabetes Mellitus
237 0 0 0 0 0 0 0 0 0 4 11 60 0 162Alzheimer's Disease
117 0 0 0 0 0 0 0 2 5 7 23 30 0 50Nephritis
126 0 0 0 1 2 7 18 20 20 29 18 5 0 6Suicide
134 0 0 0 0 0 0 4 5 29 53 27 10 0 6Chronic Liver Disease/Cirrhosis
119 0 0 0 0 0 2 0 2 4 8 24 23 0 56Influenza & Pneumonia
77 0 0 0 0 0 0 0 0 5 3 9 21 0 39Hypertension
68 0 0 0 0 0 1 0 1 2 6 13 26 0 19Septicemia
69 0 0 0 0 0 0 0 0 0 2 10 28 0 29Parkinson's Disease
37 1 0 0 0 0 0 0 0 1 2 4 15 0 14Benign Neoplasms
31 1 0 0 0 1 5 7 8 3 2 2 2 0 0Homicide
33 0 0 0 0 0 0 0 0 1 1 3 9 0 19Pneumonitis
9 0 0 0 0 0 0 2 4 1 2 0 0 0 0Human Immunodeficiency Virus
20 20 0 0 0 0 0 0 0 0 0 0 0 0 0Perinatal Period Conditions
32 0 0 0 0 0 1 0 0 3 3 5 11 0 9Aortic Aneurysm & Dissection
20 0 0 0 0 0 0 0 0 1 2 0 8 0 9Atherosclerosis
24 0 0 0 0 0 0 1 0 6 10 4 3 0 0Viral Hepatitis
19 5 2 0 0 1 0 4 0 2 1 2 2 0 0Congenital Malformations
15 0 0 0 0 0 0 0 0 1 1 4 4 0 5Anemias
8 0 0 0 0 0 0 0 0 1 1 2 4 0 0Medical & Surgical Complications
1,048 3 3 0 1 3 3 7 16 44 79 143 294 0 452All Other Natural Causes
12 0 0 0 0 0 1 1 0 2 2 2 4 0 0All Other External Causes
* ICD-10 codes associated with each cause of death group are presented on pages (xvii-xix).
130 FLORIDA VITAL STATISTICS ANNUAL REPORT 2013

TABLE D-11 (Cont.): RESIDENT DEATHS FOR SELECTED CAUSES*, BY AGE GROUPS, BY COUNTY, FLORIDA, 2013
TOTAL <1 1-4 5-9 10-14 15-19 20-24 25-34 35-44 45-54 55-64 65-74 75-84 85+ UNK
AGE GROUPS
14,144 114 15 14 15 50 106 214 359 990 1,716 2,208 3,099 3 5,241BROWARD
3,381 0 1 3 1 4 5 20 59 300 636 855 797 0 700Cancer
3,664 0 2 0 0 2 9 15 45 158 349 478 799 1 1,806Heart Diseases
716 0 0 0 2 1 0 0 2 17 62 121 209 0 302Chronic Lower Resp Diseases
769 0 1 0 0 1 1 4 20 34 71 81 208 0 348Stroke
584 8 4 2 4 11 42 71 77 97 82 47 58 1 80Unintentional Injury
279 0 0 0 1 0 1 2 11 31 43 62 61 0 67Diabetes Mellitus
361 0 0 0 0 0 0 0 0 0 5 21 80 0 255Alzheimer's Disease
318 0 0 0 0 0 0 0 4 21 29 55 81 0 128Nephritis
210 0 0 0 1 9 8 26 28 50 44 23 13 0 8Suicide
179 0 0 0 0 0 1 1 8 39 59 34 27 0 10Chronic Liver Disease/Cirrhosis
194 1 0 0 0 0 1 1 3 13 19 20 42 0 94Influenza & Pneumonia
137 0 0 0 0 0 0 2 2 6 19 21 28 0 59Hypertension
179 2 0 0 0 0 2 3 3 16 15 41 47 0 50Septicemia
173 0 0 0 0 0 0 0 0 0 1 16 75 0 81Parkinson's Disease
103 2 0 0 0 1 1 0 2 4 8 17 30 0 38Benign Neoplasms
97 0 0 1 1 12 20 19 16 13 6 1 4 1 3Homicide
73 0 0 0 0 0 0 0 0 2 7 13 14 0 37Pneumonitis
122 0 0 0 0 0 0 7 21 45 33 14 2 0 0Human Immunodeficiency Virus
62 62 0 0 0 0 0 0 0 0 0 0 0 0 0Perinatal Period Conditions
50 0 0 0 0 0 0 0 1 5 5 7 18 0 14Aortic Aneurysm & Dissection
82 0 0 0 0 0 0 0 0 3 0 5 12 0 62Atherosclerosis
36 0 0 0 0 0 0 0 1 4 13 11 6 0 1Viral Hepatitis
38 23 4 2 0 0 1 1 2 1 0 1 2 0 1Congenital Malformations
35 0 0 2 0 1 1 5 2 1 3 4 7 0 9Anemias
14 0 0 0 0 0 0 0 1 1 1 4 4 0 3Medical & Surgical Complications
2,253 15 2 3 5 8 11 34 47 125 201 251 471 0 1,080All Other Natural Causes
36 1 1 1 0 0 2 3 4 5 5 6 5 0 3All Other External Causes
TOTAL <1 1-4 5-9 10-14 15-19 20-24 25-34 35-44 45-54 55-64 65-74 75-84 85+ UNK
AGE GROUPS
150 0 0 0 0 2 0 0 2 8 21 40 45 0 32CALHOUN
32 0 0 0 0 0 0 0 0 2 5 12 10 0 3Cancer
45 0 0 0 0 0 0 0 1 2 7 6 18 0 11Heart Diseases
17 0 0 0 0 0 0 0 0 1 1 7 8 0 0Chronic Lower Resp Diseases
1 0 0 0 0 0 0 0 0 0 0 0 1 0 0Stroke
5 0 0 0 0 1 0 0 0 0 1 2 0 0 1Unintentional Injury
7 0 0 0 0 0 0 0 0 0 1 4 2 0 0Diabetes Mellitus
11 0 0 0 0 0 0 0 0 0 0 0 3 0 8Alzheimer's Disease
2 0 0 0 0 0 0 0 0 0 0 0 0 0 2Nephritis
0 0 0 0 0 0 0 0 0 0 0 0 0 0 0Suicide
2 0 0 0 0 0 0 0 0 0 1 1 0 0 0Chronic Liver Disease/Cirrhosis
2 0 0 0 0 0 0 0 0 1 0 0 1 0 0Influenza & Pneumonia
2 0 0 0 0 0 0 0 0 0 0 0 1 0 1Hypertension
2 0 0 0 0 0 0 0 0 1 0 1 0 0 0Septicemia
1 0 0 0 0 0 0 0 0 0 0 1 0 0 0Parkinson's Disease
1 0 0 0 0 0 0 0 0 0 0 0 0 0 1Benign Neoplasms
1 0 0 0 0 1 0 0 0 0 0 0 0 0 0Homicide
2 0 0 0 0 0 0 0 0 0 0 1 0 0 1Pneumonitis
1 0 0 0 0 0 0 0 0 1 0 0 0 0 0Human Immunodeficiency Virus
0 0 0 0 0 0 0 0 0 0 0 0 0 0 0Perinatal Period Conditions
0 0 0 0 0 0 0 0 0 0 0 0 0 0 0Aortic Aneurysm & Dissection
0 0 0 0 0 0 0 0 0 0 0 0 0 0 0Atherosclerosis
1 0 0 0 0 0 0 0 1 0 0 0 0 0 0Viral Hepatitis
1 0 0 0 0 0 0 0 0 0 1 0 0 0 0Congenital Malformations
0 0 0 0 0 0 0 0 0 0 0 0 0 0 0Anemias
0 0 0 0 0 0 0 0 0 0 0 0 0 0 0Medical & Surgical Complications
14 0 0 0 0 0 0 0 0 0 4 5 1 0 4All Other Natural Causes
0 0 0 0 0 0 0 0 0 0 0 0 0 0 0All Other External Causes
* ICD-10 codes associated with each cause of death group are presented on pages (xvii-xix).
FLORIDA VITAL STATISTICS ANNUAL REPORT 2013 131
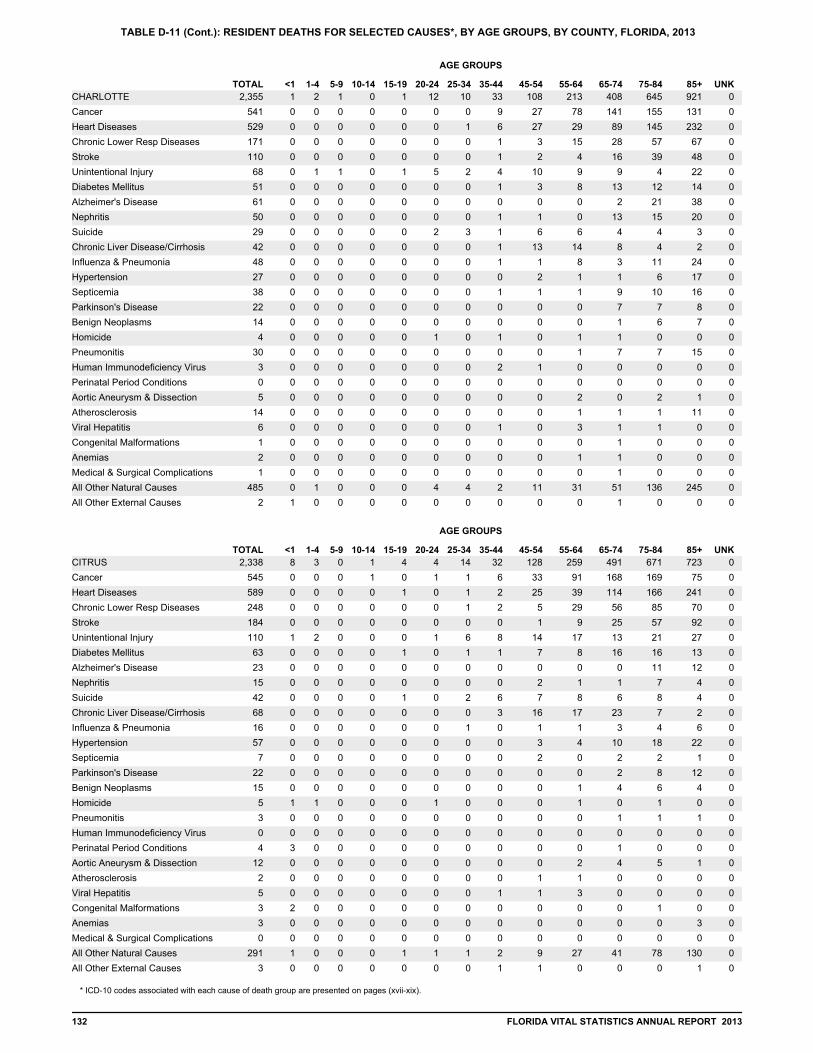
TABLE D-11 (Cont.): RESIDENT DEATHS FOR SELECTED CAUSES*, BY AGE GROUPS, BY COUNTY, FLORIDA, 2013
TOTAL <1 1-4 5-9 10-14 15-19 20-24 25-34 35-44 45-54 55-64 65-74 75-84 85+ UNK
AGE GROUPS
2,355 1 2 1 0 1 12 10 33 108 213 408 645 0 921CHARLOTTE
541 0 0 0 0 0 0 0 9 27 78 141 155 0 131Cancer
529 0 0 0 0 0 0 1 6 27 29 89 145 0 232Heart Diseases
171 0 0 0 0 0 0 0 1 3 15 28 57 0 67Chronic Lower Resp Diseases
110 0 0 0 0 0 0 0 1 2 4 16 39 0 48Stroke
68 0 1 1 0 1 5 2 4 10 9 9 4 0 22Unintentional Injury
51 0 0 0 0 0 0 0 1 3 8 13 12 0 14Diabetes Mellitus
61 0 0 0 0 0 0 0 0 0 0 2 21 0 38Alzheimer's Disease
50 0 0 0 0 0 0 0 1 1 0 13 15 0 20Nephritis
29 0 0 0 0 0 2 3 1 6 6 4 4 0 3Suicide
42 0 0 0 0 0 0 0 1 13 14 8 4 0 2Chronic Liver Disease/Cirrhosis
48 0 0 0 0 0 0 0 1 1 8 3 11 0 24Influenza & Pneumonia
27 0 0 0 0 0 0 0 0 2 1 1 6 0 17Hypertension
38 0 0 0 0 0 0 0 1 1 1 9 10 0 16Septicemia
22 0 0 0 0 0 0 0 0 0 0 7 7 0 8Parkinson's Disease
14 0 0 0 0 0 0 0 0 0 0 1 6 0 7Benign Neoplasms
4 0 0 0 0 0 1 0 1 0 1 1 0 0 0Homicide
30 0 0 0 0 0 0 0 0 0 1 7 7 0 15Pneumonitis
3 0 0 0 0 0 0 0 2 1 0 0 0 0 0Human Immunodeficiency Virus
0 0 0 0 0 0 0 0 0 0 0 0 0 0 0Perinatal Period Conditions
5 0 0 0 0 0 0 0 0 0 2 0 2 0 1Aortic Aneurysm & Dissection
14 0 0 0 0 0 0 0 0 0 1 1 1 0 11Atherosclerosis
6 0 0 0 0 0 0 0 1 0 3 1 1 0 0Viral Hepatitis
1 0 0 0 0 0 0 0 0 0 0 1 0 0 0Congenital Malformations
2 0 0 0 0 0 0 0 0 0 1 1 0 0 0Anemias
1 0 0 0 0 0 0 0 0 0 0 1 0 0 0Medical & Surgical Complications
485 0 1 0 0 0 4 4 2 11 31 51 136 0 245All Other Natural Causes
2 1 0 0 0 0 0 0 0 0 0 1 0 0 0All Other External Causes
TOTAL <1 1-4 5-9 10-14 15-19 20-24 25-34 35-44 45-54 55-64 65-74 75-84 85+ UNK
AGE GROUPS
2,338 8 3 0 1 4 4 14 32 128 259 491 671 0 723CITRUS
545 0 0 0 1 0 1 1 6 33 91 168 169 0 75Cancer
589 0 0 0 0 1 0 1 2 25 39 114 166 0 241Heart Diseases
248 0 0 0 0 0 0 1 2 5 29 56 85 0 70Chronic Lower Resp Diseases
184 0 0 0 0 0 0 0 0 1 9 25 57 0 92Stroke
110 1 2 0 0 0 1 6 8 14 17 13 21 0 27Unintentional Injury
63 0 0 0 0 1 0 1 1 7 8 16 16 0 13Diabetes Mellitus
23 0 0 0 0 0 0 0 0 0 0 0 11 0 12Alzheimer's Disease
15 0 0 0 0 0 0 0 0 2 1 1 7 0 4Nephritis
42 0 0 0 0 1 0 2 6 7 8 6 8 0 4Suicide
68 0 0 0 0 0 0 0 3 16 17 23 7 0 2Chronic Liver Disease/Cirrhosis
16 0 0 0 0 0 0 1 0 1 1 3 4 0 6Influenza & Pneumonia
57 0 0 0 0 0 0 0 0 3 4 10 18 0 22Hypertension
7 0 0 0 0 0 0 0 0 2 0 2 2 0 1Septicemia
22 0 0 0 0 0 0 0 0 0 0 2 8 0 12Parkinson's Disease
15 0 0 0 0 0 0 0 0 0 1 4 6 0 4Benign Neoplasms
5 1 1 0 0 0 1 0 0 0 1 0 1 0 0Homicide
3 0 0 0 0 0 0 0 0 0 0 1 1 0 1Pneumonitis
0 0 0 0 0 0 0 0 0 0 0 0 0 0 0Human Immunodeficiency Virus
4 3 0 0 0 0 0 0 0 0 0 1 0 0 0Perinatal Period Conditions
12 0 0 0 0 0 0 0 0 0 2 4 5 0 1Aortic Aneurysm & Dissection
2 0 0 0 0 0 0 0 0 1 1 0 0 0 0Atherosclerosis
5 0 0 0 0 0 0 0 1 1 3 0 0 0 0Viral Hepatitis
3 2 0 0 0 0 0 0 0 0 0 0 1 0 0Congenital Malformations
3 0 0 0 0 0 0 0 0 0 0 0 0 0 3Anemias
0 0 0 0 0 0 0 0 0 0 0 0 0 0 0Medical & Surgical Complications
291 1 0 0 0 1 1 1 2 9 27 41 78 0 130All Other Natural Causes
3 0 0 0 0 0 0 0 1 1 0 0 0 0 1All Other External Causes
* ICD-10 codes associated with each cause of death group are presented on pages (xvii-xix).
132 FLORIDA VITAL STATISTICS ANNUAL REPORT 2013
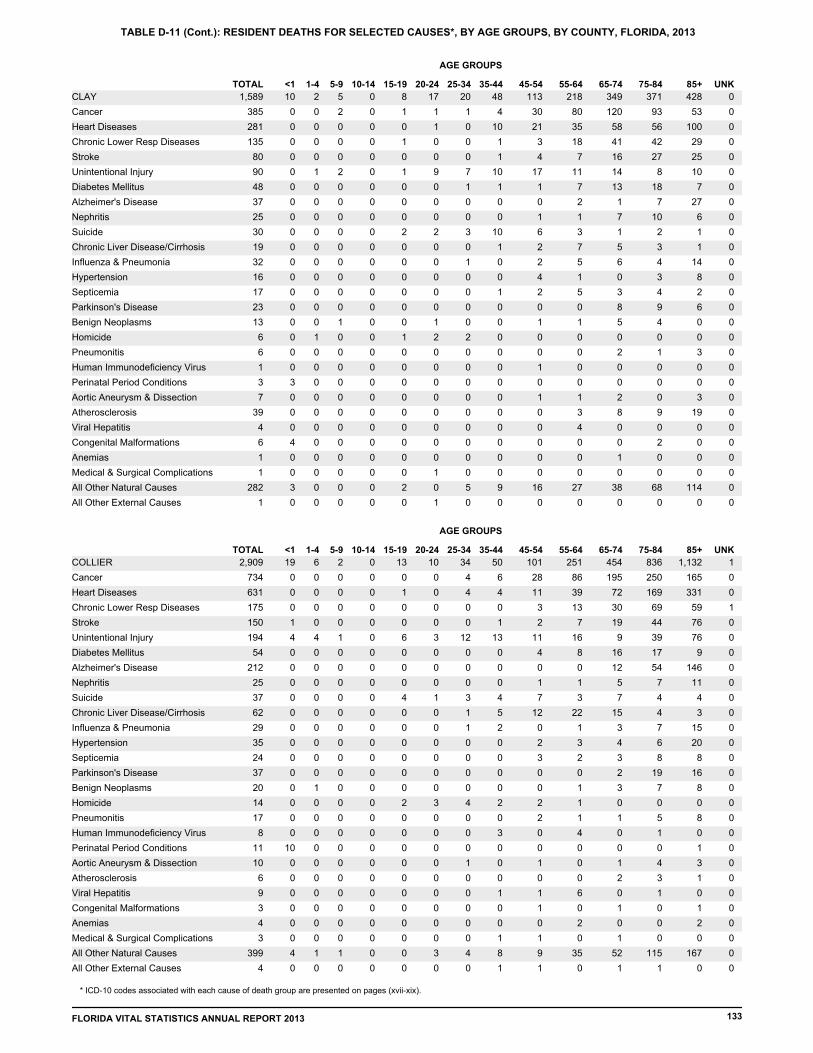
TABLE D-11 (Cont.): RESIDENT DEATHS FOR SELECTED CAUSES*, BY AGE GROUPS, BY COUNTY, FLORIDA, 2013
TOTAL <1 1-4 5-9 10-14 15-19 20-24 25-34 35-44 45-54 55-64 65-74 75-84 85+ UNK
AGE GROUPS
1,589 10 2 5 0 8 17 20 48 113 218 349 371 0 428CLAY
385 0 0 2 0 1 1 1 4 30 80 120 93 0 53Cancer
281 0 0 0 0 0 1 0 10 21 35 58 56 0 100Heart Diseases
135 0 0 0 0 1 0 0 1 3 18 41 42 0 29Chronic Lower Resp Diseases
80 0 0 0 0 0 0 0 1 4 7 16 27 0 25Stroke
90 0 1 2 0 1 9 7 10 17 11 14 8 0 10Unintentional Injury
48 0 0 0 0 0 0 1 1 1 7 13 18 0 7Diabetes Mellitus
37 0 0 0 0 0 0 0 0 0 2 1 7 0 27Alzheimer's Disease
25 0 0 0 0 0 0 0 0 1 1 7 10 0 6Nephritis
30 0 0 0 0 2 2 3 10 6 3 1 2 0 1Suicide
19 0 0 0 0 0 0 0 1 2 7 5 3 0 1Chronic Liver Disease/Cirrhosis
32 0 0 0 0 0 0 1 0 2 5 6 4 0 14Influenza & Pneumonia
16 0 0 0 0 0 0 0 0 4 1 0 3 0 8Hypertension
17 0 0 0 0 0 0 0 1 2 5 3 4 0 2Septicemia
23 0 0 0 0 0 0 0 0 0 0 8 9 0 6Parkinson's Disease
13 0 0 1 0 0 1 0 0 1 1 5 4 0 0Benign Neoplasms
6 0 1 0 0 1 2 2 0 0 0 0 0 0 0Homicide
6 0 0 0 0 0 0 0 0 0 0 2 1 0 3Pneumonitis
1 0 0 0 0 0 0 0 0 1 0 0 0 0 0Human Immunodeficiency Virus
3 3 0 0 0 0 0 0 0 0 0 0 0 0 0Perinatal Period Conditions
7 0 0 0 0 0 0 0 0 1 1 2 0 0 3Aortic Aneurysm & Dissection
39 0 0 0 0 0 0 0 0 0 3 8 9 0 19Atherosclerosis
4 0 0 0 0 0 0 0 0 0 4 0 0 0 0Viral Hepatitis
6 4 0 0 0 0 0 0 0 0 0 0 2 0 0Congenital Malformations
1 0 0 0 0 0 0 0 0 0 0 1 0 0 0Anemias
1 0 0 0 0 0 1 0 0 0 0 0 0 0 0Medical & Surgical Complications
282 3 0 0 0 2 0 5 9 16 27 38 68 0 114All Other Natural Causes
1 0 0 0 0 0 1 0 0 0 0 0 0 0 0All Other External Causes
TOTAL <1 1-4 5-9 10-14 15-19 20-24 25-34 35-44 45-54 55-64 65-74 75-84 85+ UNK
AGE GROUPS
2,909 19 6 2 0 13 10 34 50 101 251 454 836 1 1,132COLLIER
734 0 0 0 0 0 0 4 6 28 86 195 250 0 165Cancer
631 0 0 0 0 1 0 4 4 11 39 72 169 0 331Heart Diseases
175 0 0 0 0 0 0 0 0 3 13 30 69 1 59Chronic Lower Resp Diseases
150 1 0 0 0 0 0 0 1 2 7 19 44 0 76Stroke
194 4 4 1 0 6 3 12 13 11 16 9 39 0 76Unintentional Injury
54 0 0 0 0 0 0 0 0 4 8 16 17 0 9Diabetes Mellitus
212 0 0 0 0 0 0 0 0 0 0 12 54 0 146Alzheimer's Disease
25 0 0 0 0 0 0 0 0 1 1 5 7 0 11Nephritis
37 0 0 0 0 4 1 3 4 7 3 7 4 0 4Suicide
62 0 0 0 0 0 0 1 5 12 22 15 4 0 3Chronic Liver Disease/Cirrhosis
29 0 0 0 0 0 0 1 2 0 1 3 7 0 15Influenza & Pneumonia
35 0 0 0 0 0 0 0 0 2 3 4 6 0 20Hypertension
24 0 0 0 0 0 0 0 0 3 2 3 8 0 8Septicemia
37 0 0 0 0 0 0 0 0 0 0 2 19 0 16Parkinson's Disease
20 0 1 0 0 0 0 0 0 0 1 3 7 0 8Benign Neoplasms
14 0 0 0 0 2 3 4 2 2 1 0 0 0 0Homicide
17 0 0 0 0 0 0 0 0 2 1 1 5 0 8Pneumonitis
8 0 0 0 0 0 0 0 3 0 4 0 1 0 0Human Immunodeficiency Virus
11 10 0 0 0 0 0 0 0 0 0 0 0 0 1Perinatal Period Conditions
10 0 0 0 0 0 0 1 0 1 0 1 4 0 3Aortic Aneurysm & Dissection
6 0 0 0 0 0 0 0 0 0 0 2 3 0 1Atherosclerosis
9 0 0 0 0 0 0 0 1 1 6 0 1 0 0Viral Hepatitis
3 0 0 0 0 0 0 0 0 1 0 1 0 0 1Congenital Malformations
4 0 0 0 0 0 0 0 0 0 2 0 0 0 2Anemias
3 0 0 0 0 0 0 0 1 1 0 1 0 0 0Medical & Surgical Complications
399 4 1 1 0 0 3 4 8 9 35 52 115 0 167All Other Natural Causes
4 0 0 0 0 0 0 0 1 1 0 1 1 0 0All Other External Causes
* ICD-10 codes associated with each cause of death group are presented on pages (xvii-xix).
FLORIDA VITAL STATISTICS ANNUAL REPORT 2013 133

TABLE D-11 (Cont.): RESIDENT DEATHS FOR SELECTED CAUSES*, BY AGE GROUPS, BY COUNTY, FLORIDA, 2013
TOTAL <1 1-4 5-9 10-14 15-19 20-24 25-34 35-44 45-54 55-64 65-74 75-84 85+ UNK
AGE GROUPS
783 6 0 0 2 4 8 15 20 48 114 180 195 0 191COLUMBIA
177 0 0 0 0 0 0 0 1 14 32 49 53 0 28Cancer
145 0 0 0 0 0 0 0 3 9 26 27 44 0 36Heart Diseases
77 0 0 0 0 0 0 0 0 2 7 29 27 0 12Chronic Lower Resp Diseases
39 0 0 0 0 0 0 0 0 0 5 8 7 0 19Stroke
52 0 0 0 1 3 5 6 6 6 7 6 6 0 6Unintentional Injury
31 0 0 0 0 0 0 1 0 1 4 13 4 0 8Diabetes Mellitus
15 0 0 0 0 0 0 0 0 0 0 1 7 0 7Alzheimer's Disease
13 0 0 0 0 0 0 1 0 0 1 7 1 0 3Nephritis
13 0 0 0 0 0 0 2 3 1 1 4 1 0 1Suicide
7 0 0 0 0 0 0 0 1 1 3 1 1 0 0Chronic Liver Disease/Cirrhosis
11 0 0 0 0 0 1 0 0 1 3 2 3 0 1Influenza & Pneumonia
4 0 0 0 0 0 0 0 0 0 0 1 1 0 2Hypertension
7 0 0 0 0 0 0 0 0 0 3 0 3 0 1Septicemia
7 0 0 0 0 0 0 0 0 0 0 0 3 0 4Parkinson's Disease
5 0 0 0 0 0 0 1 0 0 0 2 2 0 0Benign Neoplasms
8 0 0 0 1 0 1 4 1 1 0 0 0 0 0Homicide
1 0 0 0 0 0 0 0 0 0 1 0 0 0 0Pneumonitis
5 0 0 0 0 0 0 0 1 3 1 0 0 0 0Human Immunodeficiency Virus
4 4 0 0 0 0 0 0 0 0 0 0 0 0 0Perinatal Period Conditions
6 0 0 0 0 0 0 0 0 0 2 0 1 0 3Aortic Aneurysm & Dissection
1 0 0 0 0 0 0 0 0 0 0 0 0 0 1Atherosclerosis
4 0 0 0 0 0 0 0 0 1 3 0 0 0 0Viral Hepatitis
2 0 0 0 0 1 0 0 0 0 0 0 0 0 1Congenital Malformations
1 0 0 0 0 0 0 0 0 0 0 0 0 0 1Anemias
1 0 0 0 0 0 0 0 0 0 1 0 0 0 0Medical & Surgical Complications
145 2 0 0 0 0 1 0 4 8 13 30 31 0 56All Other Natural Causes
2 0 0 0 0 0 0 0 0 0 2 0 0 0 0All Other External Causes
TOTAL <1 1-4 5-9 10-14 15-19 20-24 25-34 35-44 45-54 55-64 65-74 75-84 85+ UNK
AGE GROUPS
18,440 138 27 11 19 58 138 312 454 1,123 2,094 3,025 4,670 1 6,370MIAMI-DADE
4,100 0 3 5 3 5 4 25 82 307 715 1,047 1,119 0 785Cancer
4,995 4 0 0 1 3 1 15 57 210 445 758 1,341 1 2,159Heart Diseases
885 0 0 0 1 0 0 1 5 20 61 158 284 0 355Chronic Lower Resp Diseases
872 1 0 0 0 0 1 6 14 28 77 131 256 0 358Stroke
626 12 10 3 2 11 37 74 62 92 67 55 90 0 111Unintentional Injury
623 0 0 0 0 0 1 4 9 41 100 145 167 0 156Diabetes Mellitus
500 0 0 0 0 0 0 0 0 1 2 28 133 0 336Alzheimer's Disease
310 1 0 0 0 0 1 5 7 16 34 47 97 0 102Nephritis
215 0 0 1 2 7 13 32 35 39 29 27 23 0 7Suicide
207 0 0 0 0 0 1 3 6 36 70 38 34 0 19Chronic Liver Disease/Cirrhosis
241 0 1 0 0 0 0 1 6 16 22 31 59 0 105Influenza & Pneumonia
239 1 0 0 0 0 0 2 5 10 25 42 54 0 100Hypertension
223 1 0 0 0 1 0 1 3 8 38 34 68 0 69Septicemia
208 0 0 0 0 0 0 0 0 1 5 24 88 0 90Parkinson's Disease
127 0 0 0 0 0 0 2 1 9 13 17 47 0 38Benign Neoplasms
236 0 3 0 2 26 47 72 34 23 14 10 3 0 2Homicide
108 0 0 0 0 0 0 0 1 3 5 11 32 0 56Pneumonitis
227 0 0 0 0 0 5 22 35 68 67 18 8 0 4Human Immunodeficiency Virus
65 65 0 0 0 0 0 0 0 0 0 0 0 0 0Perinatal Period Conditions
65 0 0 0 0 0 0 0 0 6 6 13 23 0 17Aortic Aneurysm & Dissection
18 0 0 0 0 0 0 0 0 1 2 2 4 0 9Atherosclerosis
70 0 0 0 0 0 0 0 3 12 33 12 5 0 5Viral Hepatitis
48 27 2 0 2 0 0 1 1 5 6 2 2 0 0Congenital Malformations
31 0 0 0 0 0 3 2 4 4 1 2 9 0 6Anemias
23 0 0 0 0 0 0 2 0 1 6 6 6 0 2Medical & Surgical Complications
3,155 26 8 2 6 4 24 41 81 165 251 363 713 0 1,471All Other Natural Causes
31 0 0 0 0 1 0 3 3 2 6 8 6 0 2All Other External Causes
* ICD-10 codes associated with each cause of death group are presented on pages (xvii-xix).
134 FLORIDA VITAL STATISTICS ANNUAL REPORT 2013
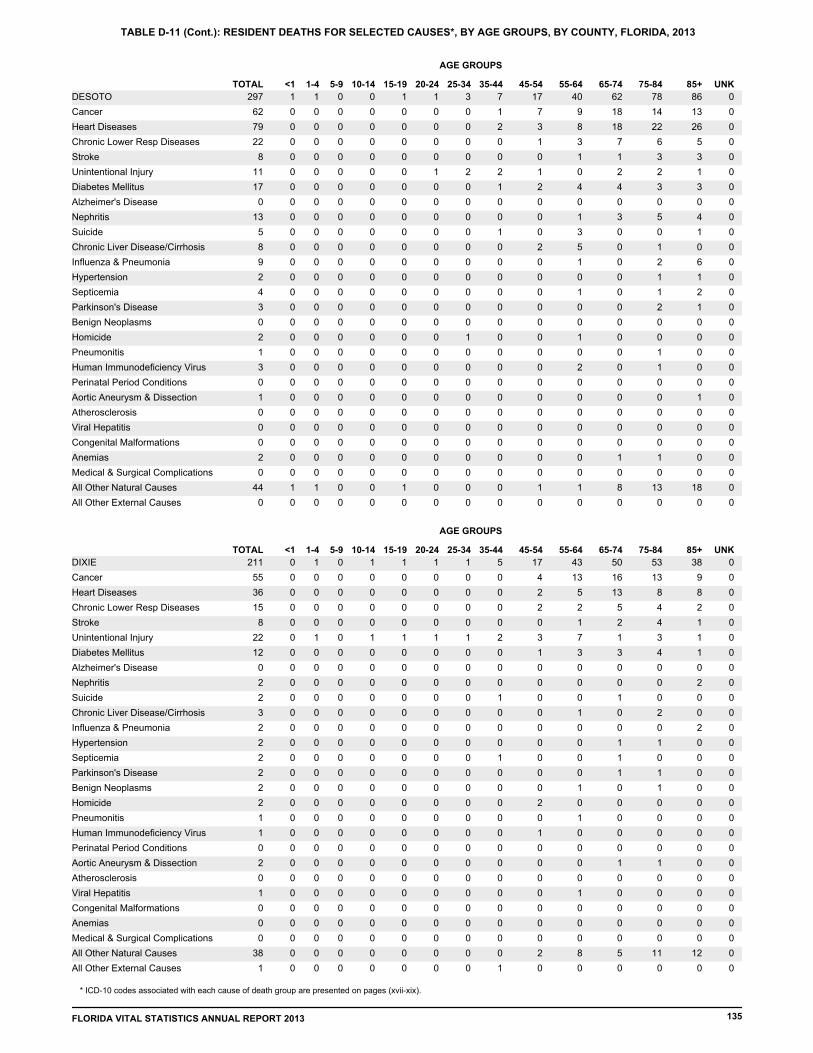
TABLE D-11 (Cont.): RESIDENT DEATHS FOR SELECTED CAUSES*, BY AGE GROUPS, BY COUNTY, FLORIDA, 2013
TOTAL <1 1-4 5-9 10-14 15-19 20-24 25-34 35-44 45-54 55-64 65-74 75-84 85+ UNK
AGE GROUPS
297 1 1 0 0 1 1 3 7 17 40 62 78 0 86DESOTO
62 0 0 0 0 0 0 0 1 7 9 18 14 0 13Cancer
79 0 0 0 0 0 0 0 2 3 8 18 22 0 26Heart Diseases
22 0 0 0 0 0 0 0 0 1 3 7 6 0 5Chronic Lower Resp Diseases
8 0 0 0 0 0 0 0 0 0 1 1 3 0 3Stroke
11 0 0 0 0 0 1 2 2 1 0 2 2 0 1Unintentional Injury
17 0 0 0 0 0 0 0 1 2 4 4 3 0 3Diabetes Mellitus
0 0 0 0 0 0 0 0 0 0 0 0 0 0 0Alzheimer's Disease
13 0 0 0 0 0 0 0 0 0 1 3 5 0 4Nephritis
5 0 0 0 0 0 0 0 1 0 3 0 0 0 1Suicide
8 0 0 0 0 0 0 0 0 2 5 0 1 0 0Chronic Liver Disease/Cirrhosis
9 0 0 0 0 0 0 0 0 0 1 0 2 0 6Influenza & Pneumonia
2 0 0 0 0 0 0 0 0 0 0 0 1 0 1Hypertension
4 0 0 0 0 0 0 0 0 0 1 0 1 0 2Septicemia
3 0 0 0 0 0 0 0 0 0 0 0 2 0 1Parkinson's Disease
0 0 0 0 0 0 0 0 0 0 0 0 0 0 0Benign Neoplasms
2 0 0 0 0 0 0 1 0 0 1 0 0 0 0Homicide
1 0 0 0 0 0 0 0 0 0 0 0 1 0 0Pneumonitis
3 0 0 0 0 0 0 0 0 0 2 0 1 0 0Human Immunodeficiency Virus
0 0 0 0 0 0 0 0 0 0 0 0 0 0 0Perinatal Period Conditions
1 0 0 0 0 0 0 0 0 0 0 0 0 0 1Aortic Aneurysm & Dissection
0 0 0 0 0 0 0 0 0 0 0 0 0 0 0Atherosclerosis
0 0 0 0 0 0 0 0 0 0 0 0 0 0 0Viral Hepatitis
0 0 0 0 0 0 0 0 0 0 0 0 0 0 0Congenital Malformations
2 0 0 0 0 0 0 0 0 0 0 1 1 0 0Anemias
0 0 0 0 0 0 0 0 0 0 0 0 0 0 0Medical & Surgical Complications
44 1 1 0 0 1 0 0 0 1 1 8 13 0 18All Other Natural Causes
0 0 0 0 0 0 0 0 0 0 0 0 0 0 0All Other External Causes
TOTAL <1 1-4 5-9 10-14 15-19 20-24 25-34 35-44 45-54 55-64 65-74 75-84 85+ UNK
AGE GROUPS
211 0 1 0 1 1 1 1 5 17 43 50 53 0 38DIXIE
55 0 0 0 0 0 0 0 0 4 13 16 13 0 9Cancer
36 0 0 0 0 0 0 0 0 2 5 13 8 0 8Heart Diseases
15 0 0 0 0 0 0 0 0 2 2 5 4 0 2Chronic Lower Resp Diseases
8 0 0 0 0 0 0 0 0 0 1 2 4 0 1Stroke
22 0 1 0 1 1 1 1 2 3 7 1 3 0 1Unintentional Injury
12 0 0 0 0 0 0 0 0 1 3 3 4 0 1Diabetes Mellitus
0 0 0 0 0 0 0 0 0 0 0 0 0 0 0Alzheimer's Disease
2 0 0 0 0 0 0 0 0 0 0 0 0 0 2Nephritis
2 0 0 0 0 0 0 0 1 0 0 1 0 0 0Suicide
3 0 0 0 0 0 0 0 0 0 1 0 2 0 0Chronic Liver Disease/Cirrhosis
2 0 0 0 0 0 0 0 0 0 0 0 0 0 2Influenza & Pneumonia
2 0 0 0 0 0 0 0 0 0 0 1 1 0 0Hypertension
2 0 0 0 0 0 0 0 1 0 0 1 0 0 0Septicemia
2 0 0 0 0 0 0 0 0 0 0 1 1 0 0Parkinson's Disease
2 0 0 0 0 0 0 0 0 0 1 0 1 0 0Benign Neoplasms
2 0 0 0 0 0 0 0 0 2 0 0 0 0 0Homicide
1 0 0 0 0 0 0 0 0 0 1 0 0 0 0Pneumonitis
1 0 0 0 0 0 0 0 0 1 0 0 0 0 0Human Immunodeficiency Virus
0 0 0 0 0 0 0 0 0 0 0 0 0 0 0Perinatal Period Conditions
2 0 0 0 0 0 0 0 0 0 0 1 1 0 0Aortic Aneurysm & Dissection
0 0 0 0 0 0 0 0 0 0 0 0 0 0 0Atherosclerosis
1 0 0 0 0 0 0 0 0 0 1 0 0 0 0Viral Hepatitis
0 0 0 0 0 0 0 0 0 0 0 0 0 0 0Congenital Malformations
0 0 0 0 0 0 0 0 0 0 0 0 0 0 0Anemias
0 0 0 0 0 0 0 0 0 0 0 0 0 0 0Medical & Surgical Complications
38 0 0 0 0 0 0 0 0 2 8 5 11 0 12All Other Natural Causes
1 0 0 0 0 0 0 0 1 0 0 0 0 0 0All Other External Causes
* ICD-10 codes associated with each cause of death group are presented on pages (xvii-xix).
FLORIDA VITAL STATISTICS ANNUAL REPORT 2013 135
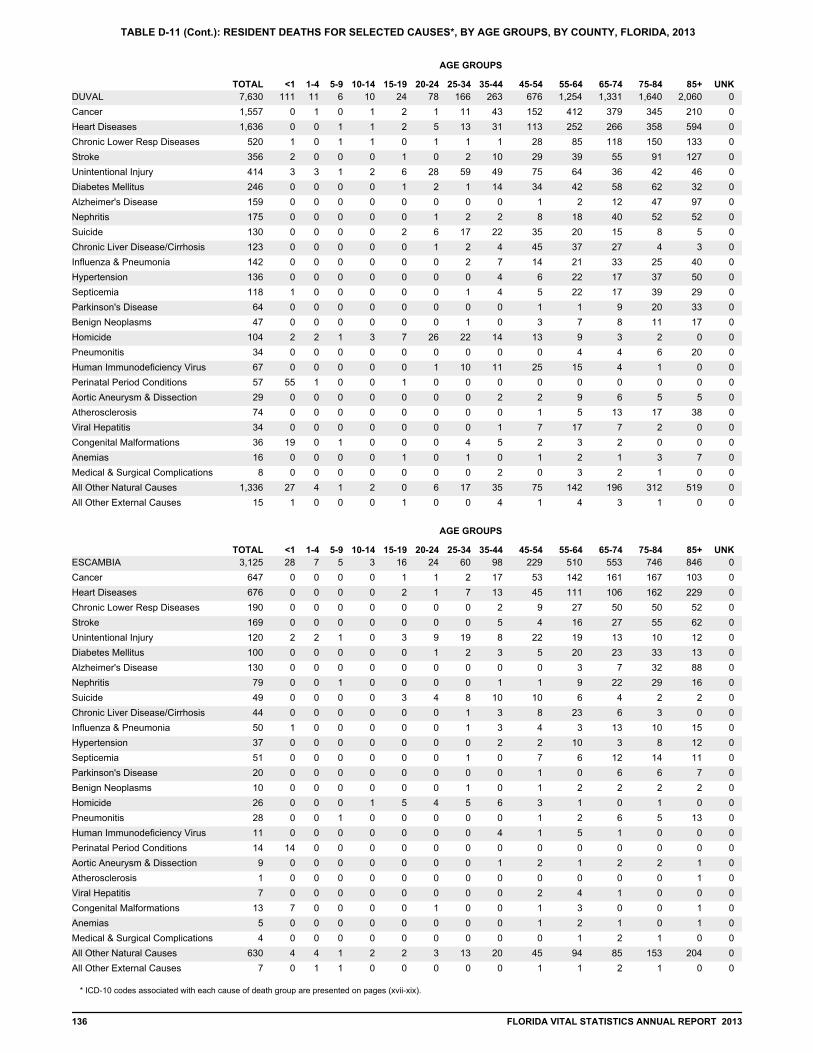
TABLE D-11 (Cont.): RESIDENT DEATHS FOR SELECTED CAUSES*, BY AGE GROUPS, BY COUNTY, FLORIDA, 2013
TOTAL <1 1-4 5-9 10-14 15-19 20-24 25-34 35-44 45-54 55-64 65-74 75-84 85+ UNK
AGE GROUPS
7,630 111 11 6 10 24 78 166 263 676 1,254 1,331 1,640 0 2,060DUVAL
1,557 0 1 0 1 2 1 11 43 152 412 379 345 0 210Cancer
1,636 0 0 1 1 2 5 13 31 113 252 266 358 0 594Heart Diseases
520 1 0 1 1 0 1 1 1 28 85 118 150 0 133Chronic Lower Resp Diseases
356 2 0 0 0 1 0 2 10 29 39 55 91 0 127Stroke
414 3 3 1 2 6 28 59 49 75 64 36 42 0 46Unintentional Injury
246 0 0 0 0 1 2 1 14 34 42 58 62 0 32Diabetes Mellitus
159 0 0 0 0 0 0 0 0 1 2 12 47 0 97Alzheimer's Disease
175 0 0 0 0 0 1 2 2 8 18 40 52 0 52Nephritis
130 0 0 0 0 2 6 17 22 35 20 15 8 0 5Suicide
123 0 0 0 0 0 1 2 4 45 37 27 4 0 3Chronic Liver Disease/Cirrhosis
142 0 0 0 0 0 0 2 7 14 21 33 25 0 40Influenza & Pneumonia
136 0 0 0 0 0 0 0 4 6 22 17 37 0 50Hypertension
118 1 0 0 0 0 0 1 4 5 22 17 39 0 29Septicemia
64 0 0 0 0 0 0 0 0 1 1 9 20 0 33Parkinson's Disease
47 0 0 0 0 0 0 1 0 3 7 8 11 0 17Benign Neoplasms
104 2 2 1 3 7 26 22 14 13 9 3 2 0 0Homicide
34 0 0 0 0 0 0 0 0 0 4 4 6 0 20Pneumonitis
67 0 0 0 0 0 1 10 11 25 15 4 1 0 0Human Immunodeficiency Virus
57 55 1 0 0 1 0 0 0 0 0 0 0 0 0Perinatal Period Conditions
29 0 0 0 0 0 0 0 2 2 9 6 5 0 5Aortic Aneurysm & Dissection
74 0 0 0 0 0 0 0 0 1 5 13 17 0 38Atherosclerosis
34 0 0 0 0 0 0 0 1 7 17 7 2 0 0Viral Hepatitis
36 19 0 1 0 0 0 4 5 2 3 2 0 0 0Congenital Malformations
16 0 0 0 0 1 0 1 0 1 2 1 3 0 7Anemias
8 0 0 0 0 0 0 0 2 0 3 2 1 0 0Medical & Surgical Complications
1,336 27 4 1 2 0 6 17 35 75 142 196 312 0 519All Other Natural Causes
15 1 0 0 0 1 0 0 4 1 4 3 1 0 0All Other External Causes
TOTAL <1 1-4 5-9 10-14 15-19 20-24 25-34 35-44 45-54 55-64 65-74 75-84 85+ UNK
AGE GROUPS
3,125 28 7 5 3 16 24 60 98 229 510 553 746 0 846ESCAMBIA
647 0 0 0 0 1 1 2 17 53 142 161 167 0 103Cancer
676 0 0 0 0 2 1 7 13 45 111 106 162 0 229Heart Diseases
190 0 0 0 0 0 0 0 2 9 27 50 50 0 52Chronic Lower Resp Diseases
169 0 0 0 0 0 0 0 5 4 16 27 55 0 62Stroke
120 2 2 1 0 3 9 19 8 22 19 13 10 0 12Unintentional Injury
100 0 0 0 0 0 1 2 3 5 20 23 33 0 13Diabetes Mellitus
130 0 0 0 0 0 0 0 0 0 3 7 32 0 88Alzheimer's Disease
79 0 0 1 0 0 0 0 1 1 9 22 29 0 16Nephritis
49 0 0 0 0 3 4 8 10 10 6 4 2 0 2Suicide
44 0 0 0 0 0 0 1 3 8 23 6 3 0 0Chronic Liver Disease/Cirrhosis
50 1 0 0 0 0 0 1 3 4 3 13 10 0 15Influenza & Pneumonia
37 0 0 0 0 0 0 0 2 2 10 3 8 0 12Hypertension
51 0 0 0 0 0 0 1 0 7 6 12 14 0 11Septicemia
20 0 0 0 0 0 0 0 0 1 0 6 6 0 7Parkinson's Disease
10 0 0 0 0 0 0 1 0 1 2 2 2 0 2Benign Neoplasms
26 0 0 0 1 5 4 5 6 3 1 0 1 0 0Homicide
28 0 0 1 0 0 0 0 0 1 2 6 5 0 13Pneumonitis
11 0 0 0 0 0 0 0 4 1 5 1 0 0 0Human Immunodeficiency Virus
14 14 0 0 0 0 0 0 0 0 0 0 0 0 0Perinatal Period Conditions
9 0 0 0 0 0 0 0 1 2 1 2 2 0 1Aortic Aneurysm & Dissection
1 0 0 0 0 0 0 0 0 0 0 0 0 0 1Atherosclerosis
7 0 0 0 0 0 0 0 0 2 4 1 0 0 0Viral Hepatitis
13 7 0 0 0 0 1 0 0 1 3 0 0 0 1Congenital Malformations
5 0 0 0 0 0 0 0 0 1 2 1 0 0 1Anemias
4 0 0 0 0 0 0 0 0 0 1 2 1 0 0Medical & Surgical Complications
630 4 4 1 2 2 3 13 20 45 94 85 153 0 204All Other Natural Causes
7 0 1 1 0 0 0 0 0 1 1 2 1 0 0All Other External Causes
* ICD-10 codes associated with each cause of death group are presented on pages (xvii-xix).
136 FLORIDA VITAL STATISTICS ANNUAL REPORT 2013

TABLE D-11 (Cont.): RESIDENT DEATHS FOR SELECTED CAUSES*, BY AGE GROUPS, BY COUNTY, FLORIDA, 2013
TOTAL <1 1-4 5-9 10-14 15-19 20-24 25-34 35-44 45-54 55-64 65-74 75-84 85+ UNK
AGE GROUPS
1,162 2 3 0 0 2 5 19 17 72 127 231 325 0 359FLAGLER
319 0 0 0 0 0 0 2 6 17 55 84 103 0 52Cancer
242 0 0 0 0 0 0 4 2 11 18 48 78 0 81Heart Diseases
69 0 0 0 0 0 0 0 2 0 5 22 17 0 23Chronic Lower Resp Diseases
55 0 0 0 0 0 0 0 0 3 4 11 19 0 18Stroke
38 0 0 0 0 1 2 8 0 9 3 6 6 0 3Unintentional Injury
38 0 0 0 0 0 0 0 0 2 9 7 8 0 12Diabetes Mellitus
20 0 0 0 0 0 0 0 0 0 0 1 5 0 14Alzheimer's Disease
8 0 0 0 0 0 0 0 0 0 0 2 2 0 4Nephritis
17 0 0 0 0 1 2 1 1 6 3 1 2 0 0Suicide
14 0 0 0 0 0 0 0 0 6 2 3 1 0 2Chronic Liver Disease/Cirrhosis
12 0 0 0 0 0 0 0 0 1 1 0 5 0 5Influenza & Pneumonia
17 0 0 0 0 0 0 0 0 2 1 2 4 0 8Hypertension
22 0 0 0 0 0 0 0 1 1 3 7 2 0 8Septicemia
18 0 0 0 0 0 0 0 0 0 2 2 4 0 10Parkinson's Disease
12 0 0 0 0 0 0 0 0 1 2 2 5 0 2Benign Neoplasms
8 0 0 0 0 0 0 2 1 3 1 0 1 0 0Homicide
4 0 0 0 0 0 0 0 0 0 2 0 2 0 0Pneumonitis
1 0 0 0 0 0 0 0 0 1 0 0 0 0 0Human Immunodeficiency Virus
0 0 0 0 0 0 0 0 0 0 0 0 0 0 0Perinatal Period Conditions
2 0 0 0 0 0 0 0 0 0 0 0 0 0 2Aortic Aneurysm & Dissection
2 0 0 0 0 0 0 0 0 1 0 1 0 0 0Atherosclerosis
3 0 0 0 0 0 0 0 0 1 0 2 0 0 0Viral Hepatitis
4 0 1 0 0 0 0 1 0 1 0 0 1 0 0Congenital Malformations
0 0 0 0 0 0 0 0 0 0 0 0 0 0 0Anemias
3 0 0 0 0 0 0 0 0 0 0 2 0 0 1Medical & Surgical Complications
232 2 1 0 0 0 1 1 3 6 16 28 60 0 114All Other Natural Causes
5 0 1 0 0 0 0 0 1 0 0 2 0 0 1All Other External Causes
TOTAL <1 1-4 5-9 10-14 15-19 20-24 25-34 35-44 45-54 55-64 65-74 75-84 85+ UNK
AGE GROUPS
128 2 0 0 0 0 1 3 3 9 25 29 32 0 24FRANKLIN
35 0 0 0 0 0 0 0 0 2 13 13 6 0 1Cancer
27 0 0 0 0 0 0 0 2 2 4 7 9 0 3Heart Diseases
14 0 0 0 0 0 0 0 0 0 1 4 7 0 2Chronic Lower Resp Diseases
6 0 0 0 0 0 0 0 0 1 1 0 0 0 4Stroke
8 0 0 0 0 0 1 1 1 1 0 0 3 0 1Unintentional Injury
4 0 0 0 0 0 0 0 0 0 1 2 0 0 1Diabetes Mellitus
4 0 0 0 0 0 0 0 0 0 1 0 1 0 2Alzheimer's Disease
2 0 0 0 0 0 0 0 0 0 0 0 1 0 1Nephritis
1 0 0 0 0 0 0 1 0 0 0 0 0 0 0Suicide
1 0 0 0 0 0 0 0 0 0 1 0 0 0 0Chronic Liver Disease/Cirrhosis
2 0 0 0 0 0 0 0 0 0 0 0 0 0 2Influenza & Pneumonia
1 0 0 0 0 0 0 0 0 0 1 0 0 0 0Hypertension
0 0 0 0 0 0 0 0 0 0 0 0 0 0 0Septicemia
2 0 0 0 0 0 0 0 0 0 0 1 1 0 0Parkinson's Disease
1 0 0 0 0 0 0 0 0 0 0 0 1 0 0Benign Neoplasms
0 0 0 0 0 0 0 0 0 0 0 0 0 0 0Homicide
0 0 0 0 0 0 0 0 0 0 0 0 0 0 0Pneumonitis
0 0 0 0 0 0 0 0 0 0 0 0 0 0 0Human Immunodeficiency Virus
1 1 0 0 0 0 0 0 0 0 0 0 0 0 0Perinatal Period Conditions
1 0 0 0 0 0 0 0 0 0 0 1 0 0 0Aortic Aneurysm & Dissection
0 0 0 0 0 0 0 0 0 0 0 0 0 0 0Atherosclerosis
0 0 0 0 0 0 0 0 0 0 0 0 0 0 0Viral Hepatitis
1 0 0 0 0 0 0 1 0 0 0 0 0 0 0Congenital Malformations
0 0 0 0 0 0 0 0 0 0 0 0 0 0 0Anemias
0 0 0 0 0 0 0 0 0 0 0 0 0 0 0Medical & Surgical Complications
17 1 0 0 0 0 0 0 0 3 2 1 3 0 7All Other Natural Causes
0 0 0 0 0 0 0 0 0 0 0 0 0 0 0All Other External Causes
* ICD-10 codes associated with each cause of death group are presented on pages (xvii-xix).
FLORIDA VITAL STATISTICS ANNUAL REPORT 2013 137

TABLE D-11 (Cont.): RESIDENT DEATHS FOR SELECTED CAUSES*, BY AGE GROUPS, BY COUNTY, FLORIDA, 2013
TOTAL <1 1-4 5-9 10-14 15-19 20-24 25-34 35-44 45-54 55-64 65-74 75-84 85+ UNK
AGE GROUPS
496 9 0 1 2 5 5 12 12 34 91 81 128 0 116GADSDEN
108 0 0 0 0 0 1 0 1 11 30 27 26 0 12Cancer
103 0 0 0 0 0 0 1 1 3 19 22 32 0 25Heart Diseases
17 0 0 0 0 0 0 0 0 2 1 3 10 0 1Chronic Lower Resp Diseases
28 0 0 0 0 0 0 0 2 1 6 3 7 0 9Stroke
22 0 0 1 0 2 2 0 1 2 6 1 3 0 4Unintentional Injury
26 0 0 0 0 0 0 2 1 2 5 1 9 0 6Diabetes Mellitus
12 0 0 0 0 0 0 0 0 0 0 1 2 0 9Alzheimer's Disease
8 0 0 0 0 0 0 0 0 1 1 2 2 0 2Nephritis
8 0 0 0 0 1 0 2 0 2 1 1 1 0 0Suicide
4 0 0 0 0 0 0 0 0 1 2 0 0 0 1Chronic Liver Disease/Cirrhosis
9 0 0 0 0 0 0 0 0 1 0 1 1 0 6Influenza & Pneumonia
10 0 0 0 0 0 0 1 0 0 4 1 1 0 3Hypertension
6 0 0 0 0 0 0 1 0 0 0 1 3 0 1Septicemia
6 0 0 0 0 0 0 0 0 0 0 2 2 0 2Parkinson's Disease
0 0 0 0 0 0 0 0 0 0 0 0 0 0 0Benign Neoplasms
5 0 0 0 0 0 2 1 2 0 0 0 0 0 0Homicide
6 0 0 0 0 0 0 0 0 0 1 2 3 0 0Pneumonitis
3 0 0 0 0 0 0 2 1 0 0 0 0 0 0Human Immunodeficiency Virus
4 4 0 0 0 0 0 0 0 0 0 0 0 0 0Perinatal Period Conditions
1 0 0 0 0 0 0 0 0 0 0 0 0 0 1Aortic Aneurysm & Dissection
2 0 0 0 0 0 0 0 0 1 0 0 0 0 1Atherosclerosis
4 0 0 0 0 0 0 0 0 2 2 0 0 0 0Viral Hepatitis
5 3 0 0 1 1 0 0 0 0 0 0 0 0 0Congenital Malformations
2 0 0 0 0 0 0 0 0 1 0 0 0 0 1Anemias
1 0 0 0 0 0 0 0 0 0 0 0 1 0 0Medical & Surgical Complications
96 2 0 0 1 1 0 2 3 4 13 13 25 0 32All Other Natural Causes
1 0 0 0 0 0 0 0 0 0 0 0 1 0 0All Other External Causes
TOTAL <1 1-4 5-9 10-14 15-19 20-24 25-34 35-44 45-54 55-64 65-74 75-84 85+ UNK
AGE GROUPS
184 0 0 0 0 0 0 3 5 12 29 49 39 0 47GILCHRIST
57 0 0 0 0 0 0 1 0 5 17 15 10 0 9Cancer
33 0 0 0 0 0 0 0 1 2 3 7 8 0 12Heart Diseases
12 0 0 0 0 0 0 0 0 0 0 6 2 0 4Chronic Lower Resp Diseases
7 0 0 0 0 0 0 0 0 1 2 2 2 0 0Stroke
13 0 0 0 0 0 0 2 2 0 0 2 2 0 5Unintentional Injury
8 0 0 0 0 0 0 0 0 0 1 4 1 0 2Diabetes Mellitus
0 0 0 0 0 0 0 0 0 0 0 0 0 0 0Alzheimer's Disease
0 0 0 0 0 0 0 0 0 0 0 0 0 0 0Nephritis
2 0 0 0 0 0 0 0 2 0 0 0 0 0 0Suicide
3 0 0 0 0 0 0 0 0 1 1 1 0 0 0Chronic Liver Disease/Cirrhosis
6 0 0 0 0 0 0 0 0 0 1 3 0 0 2Influenza & Pneumonia
3 0 0 0 0 0 0 0 0 0 0 0 2 0 1Hypertension
2 0 0 0 0 0 0 0 0 0 0 1 0 0 1Septicemia
0 0 0 0 0 0 0 0 0 0 0 0 0 0 0Parkinson's Disease
0 0 0 0 0 0 0 0 0 0 0 0 0 0 0Benign Neoplasms
1 0 0 0 0 0 0 0 0 0 1 0 0 0 0Homicide
1 0 0 0 0 0 0 0 0 0 0 1 0 0 0Pneumonitis
0 0 0 0 0 0 0 0 0 0 0 0 0 0 0Human Immunodeficiency Virus
0 0 0 0 0 0 0 0 0 0 0 0 0 0 0Perinatal Period Conditions
0 0 0 0 0 0 0 0 0 0 0 0 0 0 0Aortic Aneurysm & Dissection
0 0 0 0 0 0 0 0 0 0 0 0 0 0 0Atherosclerosis
0 0 0 0 0 0 0 0 0 0 0 0 0 0 0Viral Hepatitis
0 0 0 0 0 0 0 0 0 0 0 0 0 0 0Congenital Malformations
0 0 0 0 0 0 0 0 0 0 0 0 0 0 0Anemias
1 0 0 0 0 0 0 0 0 0 0 1 0 0 0Medical & Surgical Complications
35 0 0 0 0 0 0 0 0 3 3 6 12 0 11All Other Natural Causes
1 0 0 0 0 0 0 0 0 0 0 1 0 0 0All Other External Causes
* ICD-10 codes associated with each cause of death group are presented on pages (xvii-xix).
138 FLORIDA VITAL STATISTICS ANNUAL REPORT 2013

TABLE D-11 (Cont.): RESIDENT DEATHS FOR SELECTED CAUSES*, BY AGE GROUPS, BY COUNTY, FLORIDA, 2013
TOTAL <1 1-4 5-9 10-14 15-19 20-24 25-34 35-44 45-54 55-64 65-74 75-84 85+ UNK
AGE GROUPS
108 1 0 1 1 1 0 3 6 10 16 20 29 0 20GLADES
27 0 0 1 0 1 0 0 1 2 4 8 8 0 2Cancer
29 0 0 0 0 0 0 0 1 2 3 4 10 0 9Heart Diseases
4 0 0 0 0 0 0 0 0 0 1 0 3 0 0Chronic Lower Resp Diseases
7 0 0 0 0 0 0 0 0 2 0 3 1 0 1Stroke
7 0 0 0 0 0 0 3 2 0 0 1 1 0 0Unintentional Injury
7 0 0 0 0 0 0 0 0 1 2 2 1 0 1Diabetes Mellitus
1 0 0 0 0 0 0 0 0 0 0 0 0 0 1Alzheimer's Disease
1 0 0 0 0 0 0 0 0 0 0 0 1 0 0Nephritis
1 0 0 0 0 0 0 0 1 0 0 0 0 0 0Suicide
5 0 0 0 0 0 0 0 1 1 1 1 1 0 0Chronic Liver Disease/Cirrhosis
2 0 0 0 0 0 0 0 0 0 1 0 1 0 0Influenza & Pneumonia
0 0 0 0 0 0 0 0 0 0 0 0 0 0 0Hypertension
2 0 0 0 0 0 0 0 0 0 0 0 1 0 1Septicemia
2 0 0 0 0 0 0 0 0 0 0 0 0 0 2Parkinson's Disease
1 0 0 0 0 0 0 0 0 0 0 0 0 0 1Benign Neoplasms
0 0 0 0 0 0 0 0 0 0 0 0 0 0 0Homicide
0 0 0 0 0 0 0 0 0 0 0 0 0 0 0Pneumonitis
0 0 0 0 0 0 0 0 0 0 0 0 0 0 0Human Immunodeficiency Virus
0 0 0 0 0 0 0 0 0 0 0 0 0 0 0Perinatal Period Conditions
1 0 0 0 0 0 0 0 0 0 1 0 0 0 0Aortic Aneurysm & Dissection
0 0 0 0 0 0 0 0 0 0 0 0 0 0 0Atherosclerosis
0 0 0 0 0 0 0 0 0 0 0 0 0 0 0Viral Hepatitis
1 1 0 0 0 0 0 0 0 0 0 0 0 0 0Congenital Malformations
0 0 0 0 0 0 0 0 0 0 0 0 0 0 0Anemias
0 0 0 0 0 0 0 0 0 0 0 0 0 0 0Medical & Surgical Complications
10 0 0 0 1 0 0 0 0 2 3 1 1 0 2All Other Natural Causes
0 0 0 0 0 0 0 0 0 0 0 0 0 0 0All Other External Causes
TOTAL <1 1-4 5-9 10-14 15-19 20-24 25-34 35-44 45-54 55-64 65-74 75-84 85+ UNK
AGE GROUPS
154 1 0 0 0 1 0 1 3 10 25 30 40 0 43GULF
38 0 0 0 0 1 0 0 0 1 6 13 10 0 7Cancer
31 0 0 0 0 0 0 0 0 3 4 4 8 0 12Heart Diseases
27 0 0 0 0 0 0 0 1 0 5 5 9 0 7Chronic Lower Resp Diseases
3 0 0 0 0 0 0 0 0 1 0 0 1 0 1Stroke
1 0 0 0 0 0 0 0 0 0 0 0 1 0 0Unintentional Injury
9 0 0 0 0 0 0 0 0 2 4 1 0 0 2Diabetes Mellitus
9 0 0 0 0 0 0 0 0 0 0 1 5 0 3Alzheimer's Disease
6 0 0 0 0 0 0 0 0 0 1 0 1 0 4Nephritis
3 0 0 0 0 0 0 0 0 2 0 1 0 0 0Suicide
0 0 0 0 0 0 0 0 0 0 0 0 0 0 0Chronic Liver Disease/Cirrhosis
0 0 0 0 0 0 0 0 0 0 0 0 0 0 0Influenza & Pneumonia
2 0 0 0 0 0 0 0 0 0 1 0 0 0 1Hypertension
2 0 0 0 0 0 0 0 1 0 0 0 1 0 0Septicemia
1 0 0 0 0 0 0 0 0 0 0 0 0 0 1Parkinson's Disease
0 0 0 0 0 0 0 0 0 0 0 0 0 0 0Benign Neoplasms
0 0 0 0 0 0 0 0 0 0 0 0 0 0 0Homicide
2 0 0 0 0 0 0 0 0 0 1 0 0 0 1Pneumonitis
1 0 0 0 0 0 0 0 0 1 0 0 0 0 0Human Immunodeficiency Virus
1 1 0 0 0 0 0 0 0 0 0 0 0 0 0Perinatal Period Conditions
0 0 0 0 0 0 0 0 0 0 0 0 0 0 0Aortic Aneurysm & Dissection
0 0 0 0 0 0 0 0 0 0 0 0 0 0 0Atherosclerosis
2 0 0 0 0 0 0 0 0 0 1 1 0 0 0Viral Hepatitis
0 0 0 0 0 0 0 0 0 0 0 0 0 0 0Congenital Malformations
0 0 0 0 0 0 0 0 0 0 0 0 0 0 0Anemias
1 0 0 0 0 0 0 0 0 0 0 0 0 0 1Medical & Surgical Complications
15 0 0 0 0 0 0 1 1 0 2 4 4 0 3All Other Natural Causes
1 0 0 0 0 0 0 0 0 0 0 0 0 0 1All Other External Causes
* ICD-10 codes associated with each cause of death group are presented on pages (xvii-xix).
FLORIDA VITAL STATISTICS ANNUAL REPORT 2013 139

TABLE D-11 (Cont.): RESIDENT DEATHS FOR SELECTED CAUSES*, BY AGE GROUPS, BY COUNTY, FLORIDA, 2013
TOTAL <1 1-4 5-9 10-14 15-19 20-24 25-34 35-44 45-54 55-64 65-74 75-84 85+ UNK
AGE GROUPS
138 1 0 0 0 1 0 2 4 16 24 35 27 0 28HAMILTON
29 0 0 0 0 0 0 0 0 5 11 9 3 0 1Cancer
35 0 0 0 0 0 0 0 1 3 3 10 10 0 8Heart Diseases
9 0 0 0 0 0 0 0 0 0 2 3 2 0 2Chronic Lower Resp Diseases
8 0 0 0 0 0 0 0 0 0 1 1 3 0 3Stroke
8 0 0 0 0 1 0 0 1 3 1 0 1 0 1Unintentional Injury
0 0 0 0 0 0 0 0 0 0 0 0 0 0 0Diabetes Mellitus
6 0 0 0 0 0 0 0 0 0 0 1 0 0 5Alzheimer's Disease
2 0 0 0 0 0 0 0 0 1 0 0 1 0 0Nephritis
1 0 0 0 0 0 0 0 0 0 0 1 0 0 0Suicide
2 0 0 0 0 0 0 0 0 1 0 1 0 0 0Chronic Liver Disease/Cirrhosis
5 0 0 0 0 0 0 1 1 0 1 0 0 0 2Influenza & Pneumonia
1 0 0 0 0 0 0 0 0 0 0 0 0 0 1Hypertension
1 0 0 0 0 0 0 0 0 0 0 0 1 0 0Septicemia
1 0 0 0 0 0 0 0 0 0 0 0 1 0 0Parkinson's Disease
0 0 0 0 0 0 0 0 0 0 0 0 0 0 0Benign Neoplasms
0 0 0 0 0 0 0 0 0 0 0 0 0 0 0Homicide
1 0 0 0 0 0 0 0 0 0 0 1 0 0 0Pneumonitis
2 0 0 0 0 0 0 1 0 1 0 0 0 0 0Human Immunodeficiency Virus
0 0 0 0 0 0 0 0 0 0 0 0 0 0 0Perinatal Period Conditions
0 0 0 0 0 0 0 0 0 0 0 0 0 0 0Aortic Aneurysm & Dissection
1 0 0 0 0 0 0 0 0 0 0 1 0 0 0Atherosclerosis
1 0 0 0 0 0 0 0 0 0 1 0 0 0 0Viral Hepatitis
0 0 0 0 0 0 0 0 0 0 0 0 0 0 0Congenital Malformations
0 0 0 0 0 0 0 0 0 0 0 0 0 0 0Anemias
0 0 0 0 0 0 0 0 0 0 0 0 0 0 0Medical & Surgical Complications
25 1 0 0 0 0 0 0 1 2 4 7 5 0 5All Other Natural Causes
0 0 0 0 0 0 0 0 0 0 0 0 0 0 0All Other External Causes
TOTAL <1 1-4 5-9 10-14 15-19 20-24 25-34 35-44 45-54 55-64 65-74 75-84 85+ UNK
AGE GROUPS
180 1 0 0 1 1 5 4 6 10 28 41 33 0 50HARDEE
43 0 0 0 0 0 0 0 0 2 9 14 10 0 8Cancer
39 0 0 0 0 0 0 1 0 2 11 9 7 0 9Heart Diseases
9 0 0 0 0 0 0 0 0 0 0 2 4 0 3Chronic Lower Resp Diseases
4 0 0 0 0 0 0 0 0 0 0 1 0 0 3Stroke
14 0 0 0 1 1 2 1 1 2 2 1 1 0 2Unintentional Injury
13 0 0 0 0 0 0 0 1 1 1 2 3 0 5Diabetes Mellitus
5 0 0 0 0 0 0 0 0 0 1 0 1 0 3Alzheimer's Disease
4 0 0 0 0 0 0 0 0 0 0 1 1 0 2Nephritis
4 0 0 0 0 0 2 1 0 0 0 0 1 0 0Suicide
4 0 0 0 0 0 0 0 1 1 0 2 0 0 0Chronic Liver Disease/Cirrhosis
6 0 0 0 0 0 0 1 0 1 0 2 1 0 1Influenza & Pneumonia
1 0 0 0 0 0 0 0 0 0 0 0 0 0 1Hypertension
1 0 0 0 0 0 0 0 0 0 0 0 1 0 0Septicemia
1 0 0 0 0 0 0 0 0 0 0 0 0 0 1Parkinson's Disease
1 0 0 0 0 0 0 0 1 0 0 0 0 0 0Benign Neoplasms
3 0 0 0 0 0 1 0 1 1 0 0 0 0 0Homicide
0 0 0 0 0 0 0 0 0 0 0 0 0 0 0Pneumonitis
0 0 0 0 0 0 0 0 0 0 0 0 0 0 0Human Immunodeficiency Virus
0 0 0 0 0 0 0 0 0 0 0 0 0 0 0Perinatal Period Conditions
0 0 0 0 0 0 0 0 0 0 0 0 0 0 0Aortic Aneurysm & Dissection
0 0 0 0 0 0 0 0 0 0 0 0 0 0 0Atherosclerosis
0 0 0 0 0 0 0 0 0 0 0 0 0 0 0Viral Hepatitis
1 1 0 0 0 0 0 0 0 0 0 0 0 0 0Congenital Malformations
1 0 0 0 0 0 0 0 0 0 0 0 0 0 1Anemias
0 0 0 0 0 0 0 0 0 0 0 0 0 0 0Medical & Surgical Complications
26 0 0 0 0 0 0 0 1 0 4 7 3 0 11All Other Natural Causes
0 0 0 0 0 0 0 0 0 0 0 0 0 0 0All Other External Causes
* ICD-10 codes associated with each cause of death group are presented on pages (xvii-xix).
140 FLORIDA VITAL STATISTICS ANNUAL REPORT 2013

TABLE D-11 (Cont.): RESIDENT DEATHS FOR SELECTED CAUSES*, BY AGE GROUPS, BY COUNTY, FLORIDA, 2013
TOTAL <1 1-4 5-9 10-14 15-19 20-24 25-34 35-44 45-54 55-64 65-74 75-84 85+ UNK
AGE GROUPS
285 4 0 0 0 4 0 7 10 18 50 62 69 0 61HENDRY
74 0 0 0 0 0 0 1 3 5 19 15 18 0 13Cancer
56 0 0 0 0 0 0 0 1 0 7 14 17 0 17Heart Diseases
17 0 0 0 0 0 0 0 1 0 2 7 5 0 2Chronic Lower Resp Diseases
17 0 0 0 0 0 0 0 1 2 3 4 5 0 2Stroke
25 1 0 0 0 4 0 5 2 4 4 2 1 0 2Unintentional Injury
12 0 0 0 0 0 0 1 0 0 1 6 3 0 1Diabetes Mellitus
10 0 0 0 0 0 0 0 0 0 0 1 2 0 7Alzheimer's Disease
6 0 0 0 0 0 0 0 0 0 1 2 1 0 2Nephritis
1 0 0 0 0 0 0 0 0 0 0 1 0 0 0Suicide
3 0 0 0 0 0 0 0 0 1 2 0 0 0 0Chronic Liver Disease/Cirrhosis
6 0 0 0 0 0 0 0 0 0 1 0 3 0 2Influenza & Pneumonia
4 0 0 0 0 0 0 0 1 0 1 1 0 0 1Hypertension
1 0 0 0 0 0 0 0 0 0 0 0 1 0 0Septicemia
1 0 0 0 0 0 0 0 0 0 0 1 0 0 0Parkinson's Disease
1 0 0 0 0 0 0 0 0 0 0 0 1 0 0Benign Neoplasms
3 0 0 0 0 0 0 0 1 0 1 1 0 0 0Homicide
0 0 0 0 0 0 0 0 0 0 0 0 0 0 0Pneumonitis
1 0 0 0 0 0 0 0 0 1 0 0 0 0 0Human Immunodeficiency Virus
2 2 0 0 0 0 0 0 0 0 0 0 0 0 0Perinatal Period Conditions
4 0 0 0 0 0 0 0 0 0 2 1 0 0 1Aortic Aneurysm & Dissection
0 0 0 0 0 0 0 0 0 0 0 0 0 0 0Atherosclerosis
1 0 0 0 0 0 0 0 0 1 0 0 0 0 0Viral Hepatitis
1 1 0 0 0 0 0 0 0 0 0 0 0 0 0Congenital Malformations
1 0 0 0 0 0 0 0 0 0 0 0 1 0 0Anemias
0 0 0 0 0 0 0 0 0 0 0 0 0 0 0Medical & Surgical Complications
36 0 0 0 0 0 0 0 0 4 6 6 11 0 9All Other Natural Causes
0 0 0 0 0 0 0 0 0 0 0 0 0 0 0All Other External Causes
TOTAL <1 1-4 5-9 10-14 15-19 20-24 25-34 35-44 45-54 55-64 65-74 75-84 85+ UNK
AGE GROUPS
2,456 8 2 4 3 4 12 33 54 107 260 465 702 0 802HERNANDO
574 0 0 0 0 0 1 2 5 27 93 158 171 0 117Cancer
470 0 0 0 0 0 0 0 5 20 45 89 146 0 165Heart Diseases
182 0 0 0 0 0 0 0 0 5 22 49 61 0 45Chronic Lower Resp Diseases
108 0 0 0 0 0 0 3 0 2 10 10 35 0 48Stroke
142 1 1 0 0 3 8 11 19 9 15 10 21 0 44Unintentional Injury
84 0 0 0 0 0 0 1 0 7 12 22 29 0 13Diabetes Mellitus
68 0 0 0 0 0 0 0 0 0 0 3 21 0 44Alzheimer's Disease
29 0 0 0 0 0 0 0 0 1 2 6 13 0 7Nephritis
40 0 0 0 2 0 2 8 7 8 5 4 3 0 1Suicide
40 0 0 0 0 0 0 1 3 2 14 9 10 0 1Chronic Liver Disease/Cirrhosis
19 0 0 0 0 0 0 1 0 1 1 5 4 0 7Influenza & Pneumonia
24 0 0 0 0 0 0 0 0 2 2 4 6 0 10Hypertension
16 0 0 0 0 0 0 0 1 1 3 3 5 0 3Septicemia
23 0 0 0 0 0 0 0 0 0 0 5 10 0 8Parkinson's Disease
13 0 0 0 0 0 0 0 1 1 0 4 4 0 3Benign Neoplasms
8 0 0 2 0 1 0 1 2 1 0 1 0 0 0Homicide
10 0 0 0 0 0 0 0 0 1 3 2 3 0 1Pneumonitis
2 0 0 0 0 0 0 1 0 0 1 0 0 0 0Human Immunodeficiency Virus
4 4 0 0 0 0 0 0 0 0 0 0 0 0 0Perinatal Period Conditions
11 0 0 0 0 0 0 0 0 0 1 4 1 0 5Aortic Aneurysm & Dissection
5 0 0 0 0 0 0 0 0 0 0 3 0 0 2Atherosclerosis
4 0 0 0 0 0 0 0 0 1 0 3 0 0 0Viral Hepatitis
1 1 0 0 0 0 0 0 0 0 0 0 0 0 0Congenital Malformations
6 0 0 0 0 0 0 0 0 0 1 0 1 0 4Anemias
1 0 0 0 0 0 0 0 0 0 0 0 0 0 1Medical & Surgical Complications
564 2 1 2 1 0 1 3 11 15 30 71 157 0 270All Other Natural Causes
5 0 0 0 0 0 0 1 0 3 0 0 0 0 1All Other External Causes
* ICD-10 codes associated with each cause of death group are presented on pages (xvii-xix).
FLORIDA VITAL STATISTICS ANNUAL REPORT 2013 141

TABLE D-11 (Cont.): RESIDENT DEATHS FOR SELECTED CAUSES*, BY AGE GROUPS, BY COUNTY, FLORIDA, 2013
TOTAL <1 1-4 5-9 10-14 15-19 20-24 25-34 35-44 45-54 55-64 65-74 75-84 85+ UNK
AGE GROUPS
1,480 3 2 1 2 3 6 10 24 65 133 291 427 0 513HIGHLANDS
344 0 0 0 0 0 0 1 2 21 43 108 105 0 64Cancer
334 0 0 0 0 1 1 0 4 8 33 53 93 0 141Heart Diseases
148 0 0 0 0 0 0 0 0 1 9 32 48 0 58Chronic Lower Resp Diseases
59 0 0 0 0 0 0 0 0 2 2 10 19 0 26Stroke
67 0 2 0 2 2 2 4 4 11 8 5 11 0 16Unintentional Injury
59 0 0 0 0 0 0 0 1 2 4 14 19 0 19Diabetes Mellitus
14 0 0 0 0 0 0 0 0 0 0 1 7 0 6Alzheimer's Disease
30 0 0 0 0 0 0 0 0 0 3 4 8 0 15Nephritis
27 0 0 0 0 0 2 2 4 4 3 4 4 0 4Suicide
19 0 0 0 0 0 0 1 1 2 7 2 3 0 3Chronic Liver Disease/Cirrhosis
31 0 0 0 0 0 0 0 1 1 0 2 7 0 20Influenza & Pneumonia
20 0 0 0 0 0 0 0 0 0 1 2 5 0 12Hypertension
22 0 0 0 0 0 0 0 0 0 3 0 10 0 9Septicemia
17 0 0 0 0 0 0 0 0 0 0 5 7 0 5Parkinson's Disease
10 0 0 0 0 0 0 0 0 0 0 5 2 0 3Benign Neoplasms
4 0 0 0 0 0 1 2 0 0 0 1 0 0 0Homicide
15 0 0 0 0 0 0 0 0 2 1 0 4 0 8Pneumonitis
5 0 0 0 0 0 0 0 1 2 1 1 0 0 0Human Immunodeficiency Virus
2 2 0 0 0 0 0 0 0 0 0 0 0 0 0Perinatal Period Conditions
6 0 0 0 0 0 0 0 0 1 0 3 1 0 1Aortic Aneurysm & Dissection
3 0 0 0 0 0 0 0 0 0 0 0 0 0 3Atherosclerosis
4 0 0 0 0 0 0 0 0 0 2 1 1 0 0Viral Hepatitis
0 0 0 0 0 0 0 0 0 0 0 0 0 0 0Congenital Malformations
1 0 0 0 0 0 0 0 0 0 0 0 0 0 1Anemias
4 0 0 0 0 0 0 0 0 0 0 0 2 0 2Medical & Surgical Complications
232 1 0 1 0 0 0 0 6 8 13 37 69 0 97All Other Natural Causes
5 0 0 0 0 0 0 0 0 0 0 1 2 0 2All Other External Causes
TOTAL <1 1-4 5-9 10-14 15-19 20-24 25-34 35-44 45-54 55-64 65-74 75-84 85+ UNK
AGE GROUPS
9,740 122 16 9 9 33 82 181 308 757 1,328 1,747 2,228 0 2,920HILLSBOROUGH
2,194 0 0 0 1 2 2 16 52 211 426 597 511 0 376Cancer
2,206 0 0 0 0 0 6 10 47 173 282 363 533 0 792Heart Diseases
595 0 0 1 0 0 0 0 5 15 60 149 181 0 184Chronic Lower Resp Diseases
405 1 1 1 0 0 0 3 7 13 46 64 108 0 161Stroke
595 11 6 2 2 14 24 65 66 87 69 55 69 0 125Unintentional Injury
295 0 0 0 0 1 1 3 2 24 57 73 68 0 66Diabetes Mellitus
284 0 0 0 0 0 0 0 0 0 2 20 78 0 184Alzheimer's Disease
165 0 0 0 0 0 1 0 7 9 28 35 45 0 40Nephritis
167 0 0 0 2 4 10 25 30 33 33 16 9 0 5Suicide
129 0 0 0 0 0 1 5 9 26 47 24 15 0 2Chronic Liver Disease/Cirrhosis
160 1 0 0 0 0 1 2 5 8 23 25 28 0 67Influenza & Pneumonia
119 0 0 0 0 0 0 0 5 10 13 14 24 0 53Hypertension
178 1 1 1 0 0 1 4 4 5 23 30 58 0 50Septicemia
92 0 0 0 0 0 0 0 0 0 4 12 40 0 36Parkinson's Disease
41 0 0 1 0 0 1 0 1 3 5 6 10 0 14Benign Neoplasms
72 0 3 0 0 6 19 12 10 9 5 6 1 0 1Homicide
54 0 0 0 0 0 0 0 1 0 5 9 12 0 27Pneumonitis
64 0 0 0 0 0 1 4 13 21 18 4 2 0 1Human Immunodeficiency Virus
79 76 1 1 1 0 0 0 0 0 0 0 0 0 0Perinatal Period Conditions
30 0 0 0 0 0 0 0 0 2 7 5 9 0 7Aortic Aneurysm & Dissection
6 0 0 0 0 0 0 0 0 0 0 2 2 0 2Atherosclerosis
24 0 0 0 0 0 0 0 0 4 17 3 0 0 0Viral Hepatitis
32 22 1 1 0 0 0 0 0 3 3 1 0 0 1Congenital Malformations
15 0 0 0 0 0 0 0 1 2 4 0 2 0 6Anemias
20 1 0 0 1 0 0 0 1 1 4 4 4 0 4Medical & Surgical Complications
1,705 9 3 1 2 5 12 30 41 96 146 230 415 0 715All Other Natural Causes
28 1 0 0 1 1 1 2 2 3 5 4 4 0 4All Other External Causes
* ICD-10 codes associated with each cause of death group are presented on pages (xvii-xix).
142 FLORIDA VITAL STATISTICS ANNUAL REPORT 2013
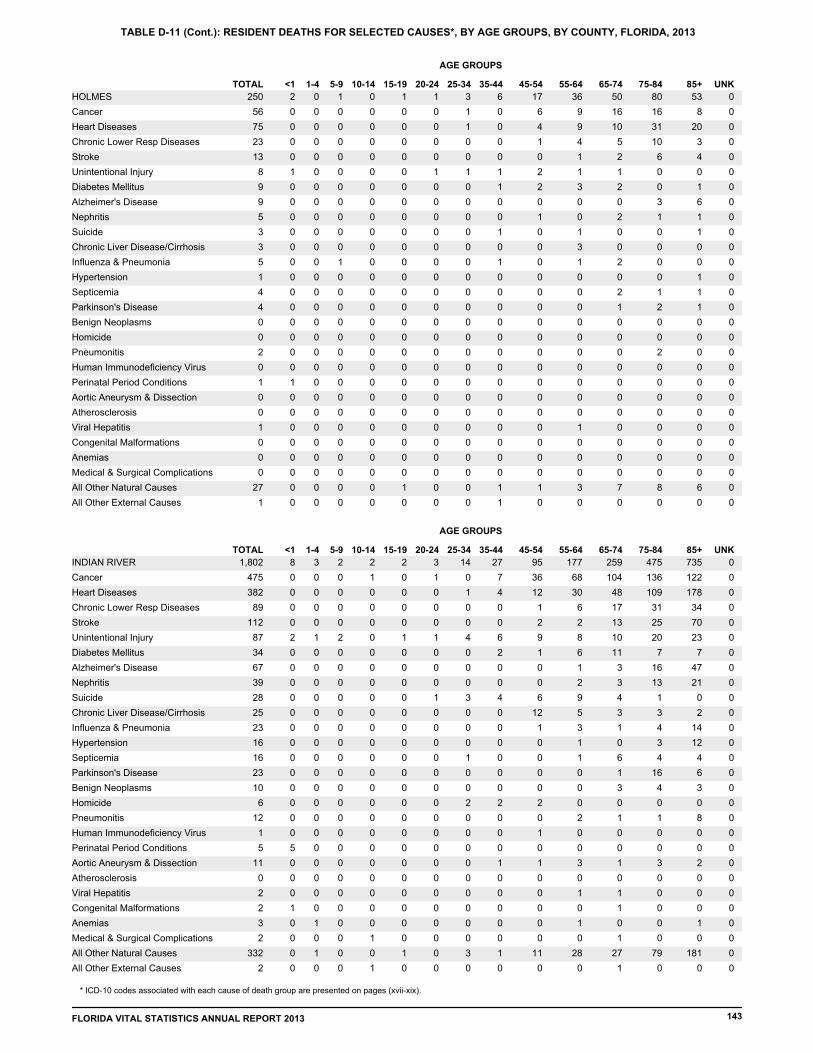
TABLE D-11 (Cont.): RESIDENT DEATHS FOR SELECTED CAUSES*, BY AGE GROUPS, BY COUNTY, FLORIDA, 2013
TOTAL <1 1-4 5-9 10-14 15-19 20-24 25-34 35-44 45-54 55-64 65-74 75-84 85+ UNK
AGE GROUPS
250 2 0 1 0 1 1 3 6 17 36 50 80 0 53HOLMES
56 0 0 0 0 0 0 1 0 6 9 16 16 0 8Cancer
75 0 0 0 0 0 0 1 0 4 9 10 31 0 20Heart Diseases
23 0 0 0 0 0 0 0 0 1 4 5 10 0 3Chronic Lower Resp Diseases
13 0 0 0 0 0 0 0 0 0 1 2 6 0 4Stroke
8 1 0 0 0 0 1 1 1 2 1 1 0 0 0Unintentional Injury
9 0 0 0 0 0 0 0 1 2 3 2 0 0 1Diabetes Mellitus
9 0 0 0 0 0 0 0 0 0 0 0 3 0 6Alzheimer's Disease
5 0 0 0 0 0 0 0 0 1 0 2 1 0 1Nephritis
3 0 0 0 0 0 0 0 1 0 1 0 0 0 1Suicide
3 0 0 0 0 0 0 0 0 0 3 0 0 0 0Chronic Liver Disease/Cirrhosis
5 0 0 1 0 0 0 0 1 0 1 2 0 0 0Influenza & Pneumonia
1 0 0 0 0 0 0 0 0 0 0 0 0 0 1Hypertension
4 0 0 0 0 0 0 0 0 0 0 2 1 0 1Septicemia
4 0 0 0 0 0 0 0 0 0 0 1 2 0 1Parkinson's Disease
0 0 0 0 0 0 0 0 0 0 0 0 0 0 0Benign Neoplasms
0 0 0 0 0 0 0 0 0 0 0 0 0 0 0Homicide
2 0 0 0 0 0 0 0 0 0 0 0 2 0 0Pneumonitis
0 0 0 0 0 0 0 0 0 0 0 0 0 0 0Human Immunodeficiency Virus
1 1 0 0 0 0 0 0 0 0 0 0 0 0 0Perinatal Period Conditions
0 0 0 0 0 0 0 0 0 0 0 0 0 0 0Aortic Aneurysm & Dissection
0 0 0 0 0 0 0 0 0 0 0 0 0 0 0Atherosclerosis
1 0 0 0 0 0 0 0 0 0 1 0 0 0 0Viral Hepatitis
0 0 0 0 0 0 0 0 0 0 0 0 0 0 0Congenital Malformations
0 0 0 0 0 0 0 0 0 0 0 0 0 0 0Anemias
0 0 0 0 0 0 0 0 0 0 0 0 0 0 0Medical & Surgical Complications
27 0 0 0 0 1 0 0 1 1 3 7 8 0 6All Other Natural Causes
1 0 0 0 0 0 0 0 1 0 0 0 0 0 0All Other External Causes
TOTAL <1 1-4 5-9 10-14 15-19 20-24 25-34 35-44 45-54 55-64 65-74 75-84 85+ UNK
AGE GROUPS
1,802 8 3 2 2 2 3 14 27 95 177 259 475 0 735INDIAN RIVER
475 0 0 0 1 0 1 0 7 36 68 104 136 0 122Cancer
382 0 0 0 0 0 0 1 4 12 30 48 109 0 178Heart Diseases
89 0 0 0 0 0 0 0 0 1 6 17 31 0 34Chronic Lower Resp Diseases
112 0 0 0 0 0 0 0 0 2 2 13 25 0 70Stroke
87 2 1 2 0 1 1 4 6 9 8 10 20 0 23Unintentional Injury
34 0 0 0 0 0 0 0 2 1 6 11 7 0 7Diabetes Mellitus
67 0 0 0 0 0 0 0 0 0 1 3 16 0 47Alzheimer's Disease
39 0 0 0 0 0 0 0 0 0 2 3 13 0 21Nephritis
28 0 0 0 0 0 1 3 4 6 9 4 1 0 0Suicide
25 0 0 0 0 0 0 0 0 12 5 3 3 0 2Chronic Liver Disease/Cirrhosis
23 0 0 0 0 0 0 0 0 1 3 1 4 0 14Influenza & Pneumonia
16 0 0 0 0 0 0 0 0 0 1 0 3 0 12Hypertension
16 0 0 0 0 0 0 1 0 0 1 6 4 0 4Septicemia
23 0 0 0 0 0 0 0 0 0 0 1 16 0 6Parkinson's Disease
10 0 0 0 0 0 0 0 0 0 0 3 4 0 3Benign Neoplasms
6 0 0 0 0 0 0 2 2 2 0 0 0 0 0Homicide
12 0 0 0 0 0 0 0 0 0 2 1 1 0 8Pneumonitis
1 0 0 0 0 0 0 0 0 1 0 0 0 0 0Human Immunodeficiency Virus
5 5 0 0 0 0 0 0 0 0 0 0 0 0 0Perinatal Period Conditions
11 0 0 0 0 0 0 0 1 1 3 1 3 0 2Aortic Aneurysm & Dissection
0 0 0 0 0 0 0 0 0 0 0 0 0 0 0Atherosclerosis
2 0 0 0 0 0 0 0 0 0 1 1 0 0 0Viral Hepatitis
2 1 0 0 0 0 0 0 0 0 0 1 0 0 0Congenital Malformations
3 0 1 0 0 0 0 0 0 0 1 0 0 0 1Anemias
2 0 0 0 1 0 0 0 0 0 0 1 0 0 0Medical & Surgical Complications
332 0 1 0 0 1 0 3 1 11 28 27 79 0 181All Other Natural Causes
2 0 0 0 1 0 0 0 0 0 0 1 0 0 0All Other External Causes
* ICD-10 codes associated with each cause of death group are presented on pages (xvii-xix).
FLORIDA VITAL STATISTICS ANNUAL REPORT 2013 143
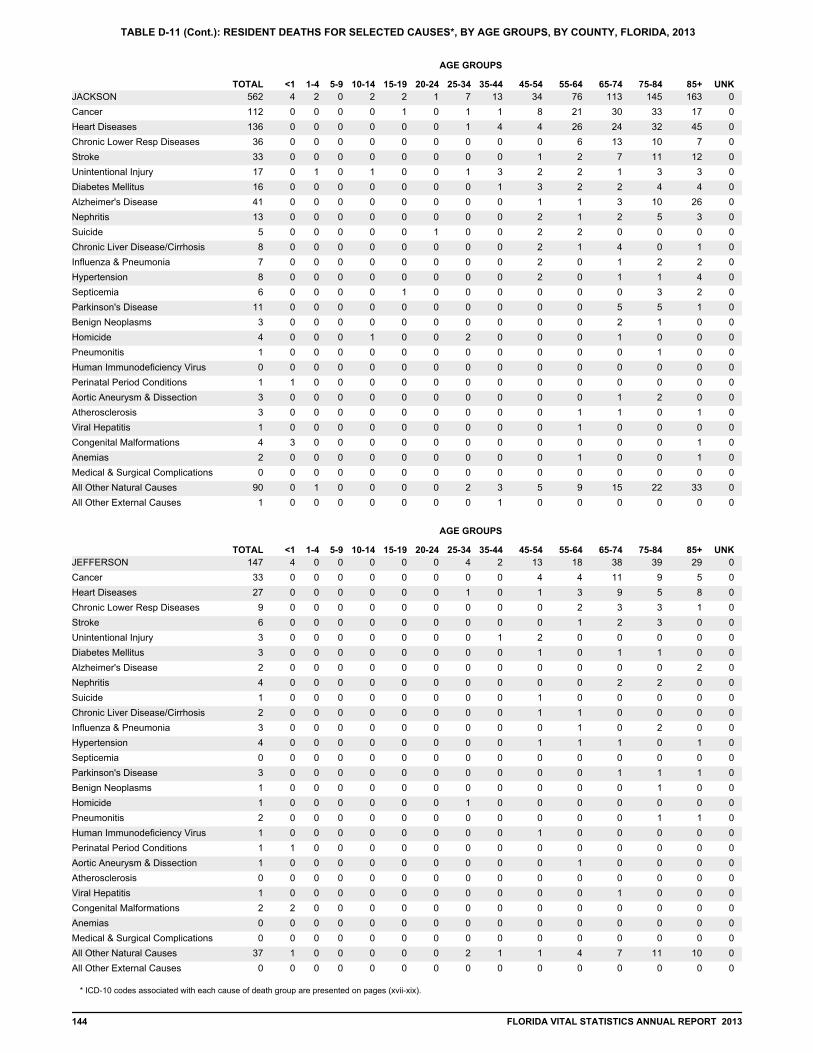
TABLE D-11 (Cont.): RESIDENT DEATHS FOR SELECTED CAUSES*, BY AGE GROUPS, BY COUNTY, FLORIDA, 2013
TOTAL <1 1-4 5-9 10-14 15-19 20-24 25-34 35-44 45-54 55-64 65-74 75-84 85+ UNK
AGE GROUPS
562 4 2 0 2 2 1 7 13 34 76 113 145 0 163JACKSON
112 0 0 0 0 1 0 1 1 8 21 30 33 0 17Cancer
136 0 0 0 0 0 0 1 4 4 26 24 32 0 45Heart Diseases
36 0 0 0 0 0 0 0 0 0 6 13 10 0 7Chronic Lower Resp Diseases
33 0 0 0 0 0 0 0 0 1 2 7 11 0 12Stroke
17 0 1 0 1 0 0 1 3 2 2 1 3 0 3Unintentional Injury
16 0 0 0 0 0 0 0 1 3 2 2 4 0 4Diabetes Mellitus
41 0 0 0 0 0 0 0 0 1 1 3 10 0 26Alzheimer's Disease
13 0 0 0 0 0 0 0 0 2 1 2 5 0 3Nephritis
5 0 0 0 0 0 1 0 0 2 2 0 0 0 0Suicide
8 0 0 0 0 0 0 0 0 2 1 4 0 0 1Chronic Liver Disease/Cirrhosis
7 0 0 0 0 0 0 0 0 2 0 1 2 0 2Influenza & Pneumonia
8 0 0 0 0 0 0 0 0 2 0 1 1 0 4Hypertension
6 0 0 0 0 1 0 0 0 0 0 0 3 0 2Septicemia
11 0 0 0 0 0 0 0 0 0 0 5 5 0 1Parkinson's Disease
3 0 0 0 0 0 0 0 0 0 0 2 1 0 0Benign Neoplasms
4 0 0 0 1 0 0 2 0 0 0 1 0 0 0Homicide
1 0 0 0 0 0 0 0 0 0 0 0 1 0 0Pneumonitis
0 0 0 0 0 0 0 0 0 0 0 0 0 0 0Human Immunodeficiency Virus
1 1 0 0 0 0 0 0 0 0 0 0 0 0 0Perinatal Period Conditions
3 0 0 0 0 0 0 0 0 0 0 1 2 0 0Aortic Aneurysm & Dissection
3 0 0 0 0 0 0 0 0 0 1 1 0 0 1Atherosclerosis
1 0 0 0 0 0 0 0 0 0 1 0 0 0 0Viral Hepatitis
4 3 0 0 0 0 0 0 0 0 0 0 0 0 1Congenital Malformations
2 0 0 0 0 0 0 0 0 0 1 0 0 0 1Anemias
0 0 0 0 0 0 0 0 0 0 0 0 0 0 0Medical & Surgical Complications
90 0 1 0 0 0 0 2 3 5 9 15 22 0 33All Other Natural Causes
1 0 0 0 0 0 0 0 1 0 0 0 0 0 0All Other External Causes
TOTAL <1 1-4 5-9 10-14 15-19 20-24 25-34 35-44 45-54 55-64 65-74 75-84 85+ UNK
AGE GROUPS
147 4 0 0 0 0 0 4 2 13 18 38 39 0 29JEFFERSON
33 0 0 0 0 0 0 0 0 4 4 11 9 0 5Cancer
27 0 0 0 0 0 0 1 0 1 3 9 5 0 8Heart Diseases
9 0 0 0 0 0 0 0 0 0 2 3 3 0 1Chronic Lower Resp Diseases
6 0 0 0 0 0 0 0 0 0 1 2 3 0 0Stroke
3 0 0 0 0 0 0 0 1 2 0 0 0 0 0Unintentional Injury
3 0 0 0 0 0 0 0 0 1 0 1 1 0 0Diabetes Mellitus
2 0 0 0 0 0 0 0 0 0 0 0 0 0 2Alzheimer's Disease
4 0 0 0 0 0 0 0 0 0 0 2 2 0 0Nephritis
1 0 0 0 0 0 0 0 0 1 0 0 0 0 0Suicide
2 0 0 0 0 0 0 0 0 1 1 0 0 0 0Chronic Liver Disease/Cirrhosis
3 0 0 0 0 0 0 0 0 0 1 0 2 0 0Influenza & Pneumonia
4 0 0 0 0 0 0 0 0 1 1 1 0 0 1Hypertension
0 0 0 0 0 0 0 0 0 0 0 0 0 0 0Septicemia
3 0 0 0 0 0 0 0 0 0 0 1 1 0 1Parkinson's Disease
1 0 0 0 0 0 0 0 0 0 0 0 1 0 0Benign Neoplasms
1 0 0 0 0 0 0 1 0 0 0 0 0 0 0Homicide
2 0 0 0 0 0 0 0 0 0 0 0 1 0 1Pneumonitis
1 0 0 0 0 0 0 0 0 1 0 0 0 0 0Human Immunodeficiency Virus
1 1 0 0 0 0 0 0 0 0 0 0 0 0 0Perinatal Period Conditions
1 0 0 0 0 0 0 0 0 0 1 0 0 0 0Aortic Aneurysm & Dissection
0 0 0 0 0 0 0 0 0 0 0 0 0 0 0Atherosclerosis
1 0 0 0 0 0 0 0 0 0 0 1 0 0 0Viral Hepatitis
2 2 0 0 0 0 0 0 0 0 0 0 0 0 0Congenital Malformations
0 0 0 0 0 0 0 0 0 0 0 0 0 0 0Anemias
0 0 0 0 0 0 0 0 0 0 0 0 0 0 0Medical & Surgical Complications
37 1 0 0 0 0 0 2 1 1 4 7 11 0 10All Other Natural Causes
0 0 0 0 0 0 0 0 0 0 0 0 0 0 0All Other External Causes
* ICD-10 codes associated with each cause of death group are presented on pages (xvii-xix).
144 FLORIDA VITAL STATISTICS ANNUAL REPORT 2013

TABLE D-11 (Cont.): RESIDENT DEATHS FOR SELECTED CAUSES*, BY AGE GROUPS, BY COUNTY, FLORIDA, 2013
TOTAL <1 1-4 5-9 10-14 15-19 20-24 25-34 35-44 45-54 55-64 65-74 75-84 85+ UNK
AGE GROUPS
75 0 0 0 0 0 0 1 2 7 8 21 20 0 16LAFAYETTE
13 0 0 0 0 0 0 0 0 2 1 3 7 0 0Cancer
23 0 0 0 0 0 0 0 0 2 4 5 6 0 6Heart Diseases
6 0 0 0 0 0 0 0 0 0 1 2 1 0 2Chronic Lower Resp Diseases
2 0 0 0 0 0 0 0 0 0 0 2 0 0 0Stroke
5 0 0 0 0 0 0 1 1 1 0 0 1 0 1Unintentional Injury
9 0 0 0 0 0 0 0 1 0 0 6 1 0 1Diabetes Mellitus
1 0 0 0 0 0 0 0 0 0 0 0 1 0 0Alzheimer's Disease
2 0 0 0 0 0 0 0 0 1 0 0 1 0 0Nephritis
0 0 0 0 0 0 0 0 0 0 0 0 0 0 0Suicide
0 0 0 0 0 0 0 0 0 0 0 0 0 0 0Chronic Liver Disease/Cirrhosis
2 0 0 0 0 0 0 0 0 0 1 0 0 0 1Influenza & Pneumonia
0 0 0 0 0 0 0 0 0 0 0 0 0 0 0Hypertension
0 0 0 0 0 0 0 0 0 0 0 0 0 0 0Septicemia
0 0 0 0 0 0 0 0 0 0 0 0 0 0 0Parkinson's Disease
0 0 0 0 0 0 0 0 0 0 0 0 0 0 0Benign Neoplasms
0 0 0 0 0 0 0 0 0 0 0 0 0 0 0Homicide
0 0 0 0 0 0 0 0 0 0 0 0 0 0 0Pneumonitis
0 0 0 0 0 0 0 0 0 0 0 0 0 0 0Human Immunodeficiency Virus
0 0 0 0 0 0 0 0 0 0 0 0 0 0 0Perinatal Period Conditions
0 0 0 0 0 0 0 0 0 0 0 0 0 0 0Aortic Aneurysm & Dissection
0 0 0 0 0 0 0 0 0 0 0 0 0 0 0Atherosclerosis
0 0 0 0 0 0 0 0 0 0 0 0 0 0 0Viral Hepatitis
0 0 0 0 0 0 0 0 0 0 0 0 0 0 0Congenital Malformations
0 0 0 0 0 0 0 0 0 0 0 0 0 0 0Anemias
0 0 0 0 0 0 0 0 0 0 0 0 0 0 0Medical & Surgical Complications
12 0 0 0 0 0 0 0 0 1 1 3 2 0 5All Other Natural Causes
0 0 0 0 0 0 0 0 0 0 0 0 0 0 0All Other External Causes
TOTAL <1 1-4 5-9 10-14 15-19 20-24 25-34 35-44 45-54 55-64 65-74 75-84 85+ UNK
AGE GROUPS
3,565 23 6 4 2 1 14 32 71 199 348 648 1,054 0 1,163LAKE
877 0 1 1 1 0 0 10 17 62 135 244 264 0 142Cancer
749 0 0 0 0 0 1 1 13 28 53 109 260 0 284Heart Diseases
231 0 0 0 0 0 0 0 0 4 22 56 79 0 70Chronic Lower Resp Diseases
155 1 0 0 0 0 0 1 1 3 5 24 51 0 69Stroke
194 6 2 2 0 1 6 9 16 18 17 23 42 0 52Unintentional Injury
124 0 0 0 0 0 0 0 0 11 10 32 42 0 29Diabetes Mellitus
93 0 0 0 0 0 0 0 0 0 1 5 27 0 60Alzheimer's Disease
33 0 0 0 0 0 0 0 1 3 2 8 7 0 12Nephritis
43 0 0 0 0 0 2 3 8 7 10 5 6 0 2Suicide
50 0 0 0 0 0 0 0 0 14 9 16 5 0 6Chronic Liver Disease/Cirrhosis
51 0 0 0 0 0 0 0 1 2 6 6 10 0 26Influenza & Pneumonia
64 0 0 0 0 0 0 1 0 4 6 6 18 0 29Hypertension
41 1 0 0 0 0 0 0 0 2 4 7 12 0 15Septicemia
61 0 0 0 0 0 0 0 0 0 2 6 25 0 28Parkinson's Disease
24 0 0 0 0 0 0 1 0 1 2 7 7 0 6Benign Neoplasms
7 0 1 0 0 0 0 4 2 0 0 0 0 0 0Homicide
12 0 0 0 0 0 0 0 0 1 2 0 3 0 6Pneumonitis
19 0 0 0 0 0 0 0 6 8 2 2 1 0 0Human Immunodeficiency Virus
8 8 0 0 0 0 0 0 0 0 0 0 0 0 0Perinatal Period Conditions
17 0 0 0 0 0 0 0 0 1 2 2 9 0 3Aortic Aneurysm & Dissection
38 0 0 0 0 0 0 0 0 1 1 2 13 0 21Atherosclerosis
10 0 0 0 0 0 0 0 0 3 4 2 1 0 0Viral Hepatitis
9 3 1 0 0 0 1 0 0 1 1 0 1 0 1Congenital Malformations
5 0 0 0 0 0 0 0 0 0 0 3 1 0 1Anemias
2 0 0 0 0 0 0 0 0 0 1 0 1 0 0Medical & Surgical Complications
640 4 1 1 1 0 3 2 6 25 51 82 166 0 298All Other Natural Causes
3 0 0 0 0 0 1 0 0 0 1 0 1 0 0All Other External Causes
* ICD-10 codes associated with each cause of death group are presented on pages (xvii-xix).
FLORIDA VITAL STATISTICS ANNUAL REPORT 2013 145

TABLE D-11 (Cont.): RESIDENT DEATHS FOR SELECTED CAUSES*, BY AGE GROUPS, BY COUNTY, FLORIDA, 2013
TOTAL <1 1-4 5-9 10-14 15-19 20-24 25-34 35-44 45-54 55-64 65-74 75-84 85+ UNK
AGE GROUPS
6,216 38 15 2 5 13 33 73 119 374 687 1,159 1,655 0 2,043LEE
1,598 1 1 1 1 2 1 9 18 108 247 469 455 0 285Cancer
1,634 3 0 0 0 0 2 8 20 64 150 229 414 0 744Heart Diseases
427 0 0 1 2 0 0 0 3 15 39 87 157 0 123Chronic Lower Resp Diseases
235 1 0 0 0 0 0 1 7 7 16 35 74 0 94Stroke
306 2 6 0 0 4 16 24 28 37 29 28 56 0 76Unintentional Injury
187 0 0 0 0 0 0 1 2 17 32 49 51 0 35Diabetes Mellitus
161 0 0 0 0 0 0 0 0 0 0 11 38 0 112Alzheimer's Disease
69 1 0 0 0 0 0 0 0 3 6 11 23 0 25Nephritis
100 0 0 0 0 3 3 7 16 25 16 14 10 0 6Suicide
97 0 0 0 0 0 0 0 2 28 35 20 9 0 3Chronic Liver Disease/Cirrhosis
51 0 0 0 0 0 0 2 1 0 4 2 11 0 31Influenza & Pneumonia
79 0 0 0 0 0 0 0 0 1 9 12 30 0 27Hypertension
38 0 1 0 0 0 1 0 0 2 3 8 10 0 13Septicemia
70 0 0 0 0 0 0 0 0 0 0 14 31 0 25Parkinson's Disease
46 0 0 0 0 0 0 0 0 1 7 8 15 0 15Benign Neoplasms
30 0 3 0 0 2 7 7 3 4 4 0 0 0 0Homicide
15 0 0 0 1 0 0 0 0 1 0 0 4 0 9Pneumonitis
11 0 0 0 0 0 0 0 3 6 1 1 0 0 0Human Immunodeficiency Virus
18 18 0 0 0 0 0 0 0 0 0 0 0 0 0Perinatal Period Conditions
22 0 0 0 0 0 0 0 0 0 3 6 7 0 6Aortic Aneurysm & Dissection
46 0 0 0 0 0 0 0 0 1 4 6 15 0 20Atherosclerosis
25 0 0 0 0 0 0 0 0 5 15 2 2 0 1Viral Hepatitis
10 7 1 0 0 0 1 0 0 0 0 0 0 0 1Congenital Malformations
8 0 1 0 0 0 1 0 0 1 2 0 0 0 3Anemias
4 0 0 0 0 0 0 2 0 0 0 1 0 0 1Medical & Surgical Complications
922 5 2 0 1 2 1 12 16 47 65 145 241 0 385All Other Natural Causes
5 0 0 0 0 0 0 2 0 1 0 1 0 0 1All Other External Causes
TOTAL <1 1-4 5-9 10-14 15-19 20-24 25-34 35-44 45-54 55-64 65-74 75-84 85+ UNK
AGE GROUPS
1,781 16 2 1 1 9 11 36 53 117 268 303 399 0 565LEON
397 0 0 0 1 0 0 2 12 26 87 108 95 0 66Cancer
384 0 0 0 0 0 0 2 10 22 60 62 76 0 152Heart Diseases
91 0 0 0 0 0 0 0 0 2 9 20 35 0 25Chronic Lower Resp Diseases
82 0 0 0 0 0 0 0 1 5 8 11 22 0 35Stroke
81 1 1 0 0 2 7 9 5 8 11 8 8 0 21Unintentional Injury
49 0 0 0 0 0 0 1 3 6 9 13 11 0 6Diabetes Mellitus
49 0 0 0 0 0 0 0 0 0 1 3 17 0 28Alzheimer's Disease
21 0 0 0 0 0 0 0 1 2 2 1 5 0 10Nephritis
36 0 0 0 0 2 3 4 4 7 9 5 2 0 0Suicide
22 0 0 0 0 1 0 1 1 4 5 6 4 0 0Chronic Liver Disease/Cirrhosis
38 0 0 0 0 0 0 1 1 0 7 4 9 0 16Influenza & Pneumonia
24 0 0 0 0 0 0 1 0 1 2 5 6 0 9Hypertension
22 0 0 0 0 0 0 0 1 2 4 7 6 0 2Septicemia
19 0 0 0 0 0 0 0 0 0 2 0 10 0 7Parkinson's Disease
13 0 0 0 0 0 0 0 0 1 2 0 4 0 6Benign Neoplasms
20 0 1 1 0 3 1 3 4 3 2 1 1 0 0Homicide
24 0 0 0 0 0 0 1 0 0 1 1 9 0 12Pneumonitis
8 0 0 0 0 0 0 1 1 3 3 0 0 0 0Human Immunodeficiency Virus
10 10 0 0 0 0 0 0 0 0 0 0 0 0 0Perinatal Period Conditions
5 0 0 0 0 0 0 0 0 1 1 0 2 0 1Aortic Aneurysm & Dissection
12 0 0 0 0 0 0 0 0 0 0 0 3 0 9Atherosclerosis
10 0 0 0 0 0 0 0 0 3 4 3 0 0 0Viral Hepatitis
9 2 0 0 0 0 0 1 1 1 1 0 1 0 2Congenital Malformations
3 0 0 0 0 0 0 1 0 1 0 0 0 0 1Anemias
4 0 0 0 0 0 0 0 0 2 0 1 1 0 0Medical & Surgical Complications
346 3 0 0 0 1 0 8 8 17 38 42 72 0 157All Other Natural Causes
4 0 0 0 0 0 0 0 0 2 0 1 1 0 0All Other External Causes
* ICD-10 codes associated with each cause of death group are presented on pages (xvii-xix).
146 FLORIDA VITAL STATISTICS ANNUAL REPORT 2013

TABLE D-11 (Cont.): RESIDENT DEATHS FOR SELECTED CAUSES*, BY AGE GROUPS, BY COUNTY, FLORIDA, 2013
TOTAL <1 1-4 5-9 10-14 15-19 20-24 25-34 35-44 45-54 55-64 65-74 75-84 85+ UNK
AGE GROUPS
495 2 1 0 0 1 3 7 16 36 77 122 118 0 112LEVY
120 0 0 0 0 0 0 0 4 6 28 42 29 0 11Cancer
107 0 0 0 0 0 0 0 1 9 19 21 20 0 37Heart Diseases
30 0 0 0 0 0 0 0 0 2 4 11 9 0 4Chronic Lower Resp Diseases
26 0 0 0 0 0 0 0 0 2 2 5 7 0 10Stroke
29 0 0 0 0 0 3 4 2 6 5 3 3 0 3Unintentional Injury
22 0 0 0 0 0 0 1 0 0 2 6 5 0 8Diabetes Mellitus
5 0 0 0 0 0 0 0 0 0 0 0 2 0 3Alzheimer's Disease
6 0 0 0 0 0 0 0 1 0 0 0 4 0 1Nephritis
12 0 0 0 0 0 0 1 3 2 2 3 1 0 0Suicide
10 0 0 0 0 0 0 0 1 1 3 2 2 0 1Chronic Liver Disease/Cirrhosis
6 0 0 0 0 0 0 0 0 0 1 1 3 0 1Influenza & Pneumonia
10 0 0 0 0 0 0 0 0 1 0 0 5 0 4Hypertension
5 0 0 0 0 0 0 0 1 0 0 1 1 0 2Septicemia
2 0 0 0 0 0 0 0 0 0 0 0 0 0 2Parkinson's Disease
3 0 0 0 0 0 0 0 0 0 0 2 0 0 1Benign Neoplasms
1 0 0 0 0 0 0 0 0 1 0 0 0 0 0Homicide
1 0 0 0 0 0 0 0 0 0 1 0 0 0 0Pneumonitis
0 0 0 0 0 0 0 0 0 0 0 0 0 0 0Human Immunodeficiency Virus
2 2 0 0 0 0 0 0 0 0 0 0 0 0 0Perinatal Period Conditions
1 0 0 0 0 0 0 0 0 0 1 0 0 0 0Aortic Aneurysm & Dissection
0 0 0 0 0 0 0 0 0 0 0 0 0 0 0Atherosclerosis
3 0 0 0 0 0 0 0 0 1 1 1 0 0 0Viral Hepatitis
2 0 0 0 0 0 0 0 0 0 0 1 1 0 0Congenital Malformations
3 0 0 0 0 0 0 0 0 1 1 0 1 0 0Anemias
0 0 0 0 0 0 0 0 0 0 0 0 0 0 0Medical & Surgical Complications
87 0 1 0 0 1 0 1 2 4 7 22 25 0 24All Other Natural Causes
1 0 0 0 0 0 0 0 1 0 0 0 0 0 0All Other External Causes
TOTAL <1 1-4 5-9 10-14 15-19 20-24 25-34 35-44 45-54 55-64 65-74 75-84 85+ UNK
AGE GROUPS
51 1 3 0 0 0 0 0 2 4 14 10 10 0 7LIBERTY
14 0 0 0 0 0 0 0 0 2 8 2 1 0 1Cancer
6 0 0 0 0 0 0 0 0 0 0 2 3 0 1Heart Diseases
8 0 0 0 0 0 0 0 0 0 1 2 4 0 1Chronic Lower Resp Diseases
1 0 0 0 0 0 0 0 0 0 0 0 1 0 0Stroke
9 0 3 0 0 0 0 0 1 2 1 0 1 0 1Unintentional Injury
2 0 0 0 0 0 0 0 1 0 0 1 0 0 0Diabetes Mellitus
0 0 0 0 0 0 0 0 0 0 0 0 0 0 0Alzheimer's Disease
1 0 0 0 0 0 0 0 0 0 0 1 0 0 0Nephritis
0 0 0 0 0 0 0 0 0 0 0 0 0 0 0Suicide
2 0 0 0 0 0 0 0 0 0 1 0 0 0 1Chronic Liver Disease/Cirrhosis
0 0 0 0 0 0 0 0 0 0 0 0 0 0 0Influenza & Pneumonia
0 0 0 0 0 0 0 0 0 0 0 0 0 0 0Hypertension
0 0 0 0 0 0 0 0 0 0 0 0 0 0 0Septicemia
0 0 0 0 0 0 0 0 0 0 0 0 0 0 0Parkinson's Disease
0 0 0 0 0 0 0 0 0 0 0 0 0 0 0Benign Neoplasms
0 0 0 0 0 0 0 0 0 0 0 0 0 0 0Homicide
0 0 0 0 0 0 0 0 0 0 0 0 0 0 0Pneumonitis
0 0 0 0 0 0 0 0 0 0 0 0 0 0 0Human Immunodeficiency Virus
1 1 0 0 0 0 0 0 0 0 0 0 0 0 0Perinatal Period Conditions
0 0 0 0 0 0 0 0 0 0 0 0 0 0 0Aortic Aneurysm & Dissection
0 0 0 0 0 0 0 0 0 0 0 0 0 0 0Atherosclerosis
0 0 0 0 0 0 0 0 0 0 0 0 0 0 0Viral Hepatitis
0 0 0 0 0 0 0 0 0 0 0 0 0 0 0Congenital Malformations
1 0 0 0 0 0 0 0 0 0 1 0 0 0 0Anemias
0 0 0 0 0 0 0 0 0 0 0 0 0 0 0Medical & Surgical Complications
6 0 0 0 0 0 0 0 0 0 2 2 0 0 2All Other Natural Causes
0 0 0 0 0 0 0 0 0 0 0 0 0 0 0All Other External Causes
* ICD-10 codes associated with each cause of death group are presented on pages (xvii-xix).
FLORIDA VITAL STATISTICS ANNUAL REPORT 2013 147

TABLE D-11 (Cont.): RESIDENT DEATHS FOR SELECTED CAUSES*, BY AGE GROUPS, BY COUNTY, FLORIDA, 2013
TOTAL <1 1-4 5-9 10-14 15-19 20-24 25-34 35-44 45-54 55-64 65-74 75-84 85+ UNK
AGE GROUPS
229 0 1 1 0 0 2 3 5 19 25 46 58 0 69MADISON
54 0 0 0 0 0 0 0 2 4 6 18 16 0 8Cancer
48 0 0 0 0 0 0 0 0 6 3 6 14 0 19Heart Diseases
17 0 0 0 0 0 0 0 0 1 4 6 4 0 2Chronic Lower Resp Diseases
12 0 0 0 0 0 0 0 0 0 0 4 4 0 4Stroke
17 0 1 1 0 0 1 2 2 2 2 2 2 0 2Unintentional Injury
3 0 0 0 0 0 0 0 0 0 1 1 0 0 1Diabetes Mellitus
4 0 0 0 0 0 0 0 0 0 0 0 2 0 2Alzheimer's Disease
8 0 0 0 0 0 0 0 0 1 1 0 1 0 5Nephritis
4 0 0 0 0 0 1 1 0 1 1 0 0 0 0Suicide
2 0 0 0 0 0 0 0 0 0 1 0 1 0 0Chronic Liver Disease/Cirrhosis
9 0 0 0 0 0 0 0 0 0 0 0 4 0 5Influenza & Pneumonia
3 0 0 0 0 0 0 0 0 0 0 2 0 0 1Hypertension
2 0 0 0 0 0 0 0 0 0 0 0 1 0 1Septicemia
0 0 0 0 0 0 0 0 0 0 0 0 0 0 0Parkinson's Disease
4 0 0 0 0 0 0 0 0 0 0 0 4 0 0Benign Neoplasms
0 0 0 0 0 0 0 0 0 0 0 0 0 0 0Homicide
1 0 0 0 0 0 0 0 0 0 0 0 0 0 1Pneumonitis
2 0 0 0 0 0 0 0 0 1 0 1 0 0 0Human Immunodeficiency Virus
0 0 0 0 0 0 0 0 0 0 0 0 0 0 0Perinatal Period Conditions
1 0 0 0 0 0 0 0 1 0 0 0 0 0 0Aortic Aneurysm & Dissection
0 0 0 0 0 0 0 0 0 0 0 0 0 0 0Atherosclerosis
0 0 0 0 0 0 0 0 0 0 0 0 0 0 0Viral Hepatitis
0 0 0 0 0 0 0 0 0 0 0 0 0 0 0Congenital Malformations
1 0 0 0 0 0 0 0 0 0 0 0 0 0 1Anemias
0 0 0 0 0 0 0 0 0 0 0 0 0 0 0Medical & Surgical Complications
35 0 0 0 0 0 0 0 0 3 6 6 5 0 15All Other Natural Causes
0 0 0 0 0 0 0 0 0 0 0 0 0 0 0All Other External Causes
TOTAL <1 1-4 5-9 10-14 15-19 20-24 25-34 35-44 45-54 55-64 65-74 75-84 85+ UNK
AGE GROUPS
3,498 15 3 3 2 8 23 50 71 199 415 643 841 0 1,225MANATEE
814 1 0 1 0 0 1 3 13 46 160 219 221 0 149Cancer
931 1 0 0 0 0 0 9 11 36 68 157 225 0 424Heart Diseases
193 0 0 0 0 0 0 0 2 2 17 55 57 0 60Chronic Lower Resp Diseases
179 0 0 0 0 0 0 2 0 4 16 26 54 0 77Stroke
165 3 1 1 0 2 9 15 22 24 20 12 20 0 36Unintentional Injury
62 0 0 0 0 0 0 0 2 5 15 16 13 0 11Diabetes Mellitus
57 0 0 0 0 0 0 0 0 0 0 3 16 0 38Alzheimer's Disease
104 0 0 0 0 0 0 0 0 2 10 22 31 0 39Nephritis
69 0 0 0 0 2 4 6 4 19 18 6 4 0 6Suicide
63 0 0 0 0 0 0 1 1 12 19 19 7 0 4Chronic Liver Disease/Cirrhosis
36 0 0 0 0 0 0 0 2 2 2 7 13 0 10Influenza & Pneumonia
30 0 0 0 0 0 0 0 0 1 1 9 6 0 13Hypertension
33 0 1 0 0 0 0 0 1 1 1 7 10 0 12Septicemia
36 0 0 0 0 0 0 0 0 0 3 7 14 0 12Parkinson's Disease
28 0 0 0 0 0 0 0 0 0 2 5 9 0 12Benign Neoplasms
14 0 0 0 1 1 4 5 1 2 0 0 0 0 0Homicide
33 0 0 0 0 0 0 0 0 0 1 5 8 0 19Pneumonitis
15 0 0 0 0 0 1 3 1 5 3 2 0 0 0Human Immunodeficiency Virus
7 7 0 0 0 0 0 0 0 0 0 0 0 0 0Perinatal Period Conditions
15 0 0 0 0 0 0 0 0 0 1 4 5 0 5Aortic Aneurysm & Dissection
10 0 0 0 0 0 0 0 0 0 1 2 3 0 4Atherosclerosis
5 0 0 0 0 0 0 0 0 1 4 0 0 0 0Viral Hepatitis
10 2 0 0 1 0 0 1 2 0 3 1 0 0 0Congenital Malformations
10 0 0 0 0 0 0 0 0 1 1 0 2 0 6Anemias
2 0 0 0 0 0 0 0 0 1 0 1 0 0 0Medical & Surgical Complications
565 1 1 1 0 3 3 4 7 33 47 57 122 0 286All Other Natural Causes
9 0 0 0 0 0 1 1 2 3 1 1 0 0 0All Other External Causes
* ICD-10 codes associated with each cause of death group are presented on pages (xvii-xix).
148 FLORIDA VITAL STATISTICS ANNUAL REPORT 2013
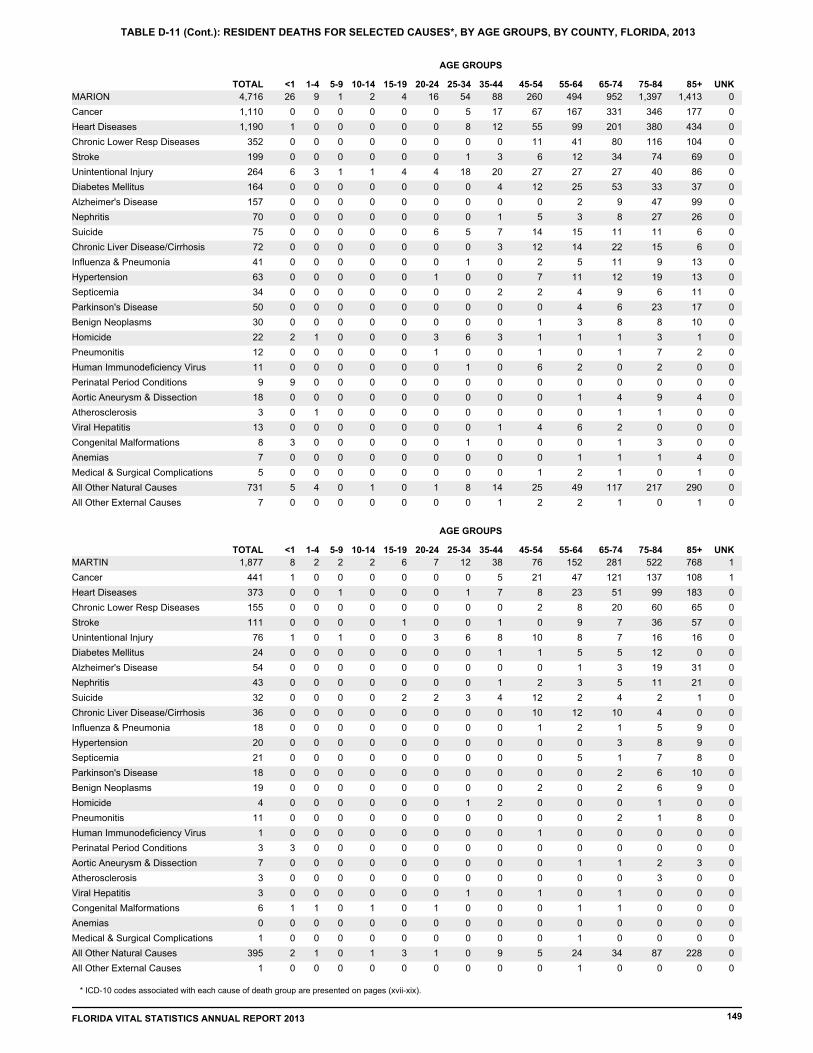
TABLE D-11 (Cont.): RESIDENT DEATHS FOR SELECTED CAUSES*, BY AGE GROUPS, BY COUNTY, FLORIDA, 2013
TOTAL <1 1-4 5-9 10-14 15-19 20-24 25-34 35-44 45-54 55-64 65-74 75-84 85+ UNK
AGE GROUPS
4,716 26 9 1 2 4 16 54 88 260 494 952 1,397 0 1,413MARION
1,110 0 0 0 0 0 0 5 17 67 167 331 346 0 177Cancer
1,190 1 0 0 0 0 0 8 12 55 99 201 380 0 434Heart Diseases
352 0 0 0 0 0 0 0 0 11 41 80 116 0 104Chronic Lower Resp Diseases
199 0 0 0 0 0 0 1 3 6 12 34 74 0 69Stroke
264 6 3 1 1 4 4 18 20 27 27 27 40 0 86Unintentional Injury
164 0 0 0 0 0 0 0 4 12 25 53 33 0 37Diabetes Mellitus
157 0 0 0 0 0 0 0 0 0 2 9 47 0 99Alzheimer's Disease
70 0 0 0 0 0 0 0 1 5 3 8 27 0 26Nephritis
75 0 0 0 0 0 6 5 7 14 15 11 11 0 6Suicide
72 0 0 0 0 0 0 0 3 12 14 22 15 0 6Chronic Liver Disease/Cirrhosis
41 0 0 0 0 0 0 1 0 2 5 11 9 0 13Influenza & Pneumonia
63 0 0 0 0 0 1 0 0 7 11 12 19 0 13Hypertension
34 0 0 0 0 0 0 0 2 2 4 9 6 0 11Septicemia
50 0 0 0 0 0 0 0 0 0 4 6 23 0 17Parkinson's Disease
30 0 0 0 0 0 0 0 0 1 3 8 8 0 10Benign Neoplasms
22 2 1 0 0 0 3 6 3 1 1 1 3 0 1Homicide
12 0 0 0 0 0 1 0 0 1 0 1 7 0 2Pneumonitis
11 0 0 0 0 0 0 1 0 6 2 0 2 0 0Human Immunodeficiency Virus
9 9 0 0 0 0 0 0 0 0 0 0 0 0 0Perinatal Period Conditions
18 0 0 0 0 0 0 0 0 0 1 4 9 0 4Aortic Aneurysm & Dissection
3 0 1 0 0 0 0 0 0 0 0 1 1 0 0Atherosclerosis
13 0 0 0 0 0 0 0 1 4 6 2 0 0 0Viral Hepatitis
8 3 0 0 0 0 0 1 0 0 0 1 3 0 0Congenital Malformations
7 0 0 0 0 0 0 0 0 0 1 1 1 0 4Anemias
5 0 0 0 0 0 0 0 0 1 2 1 0 0 1Medical & Surgical Complications
731 5 4 0 1 0 1 8 14 25 49 117 217 0 290All Other Natural Causes
7 0 0 0 0 0 0 0 1 2 2 1 0 0 1All Other External Causes
TOTAL <1 1-4 5-9 10-14 15-19 20-24 25-34 35-44 45-54 55-64 65-74 75-84 85+ UNK
AGE GROUPS
1,877 8 2 2 2 6 7 12 38 76 152 281 522 1 768MARTIN
441 1 0 0 0 0 0 0 5 21 47 121 137 1 108Cancer
373 0 0 1 0 0 0 1 7 8 23 51 99 0 183Heart Diseases
155 0 0 0 0 0 0 0 0 2 8 20 60 0 65Chronic Lower Resp Diseases
111 0 0 0 0 1 0 0 1 0 9 7 36 0 57Stroke
76 1 0 1 0 0 3 6 8 10 8 7 16 0 16Unintentional Injury
24 0 0 0 0 0 0 0 1 1 5 5 12 0 0Diabetes Mellitus
54 0 0 0 0 0 0 0 0 0 1 3 19 0 31Alzheimer's Disease
43 0 0 0 0 0 0 0 1 2 3 5 11 0 21Nephritis
32 0 0 0 0 2 2 3 4 12 2 4 2 0 1Suicide
36 0 0 0 0 0 0 0 0 10 12 10 4 0 0Chronic Liver Disease/Cirrhosis
18 0 0 0 0 0 0 0 0 1 2 1 5 0 9Influenza & Pneumonia
20 0 0 0 0 0 0 0 0 0 0 3 8 0 9Hypertension
21 0 0 0 0 0 0 0 0 0 5 1 7 0 8Septicemia
18 0 0 0 0 0 0 0 0 0 0 2 6 0 10Parkinson's Disease
19 0 0 0 0 0 0 0 0 2 0 2 6 0 9Benign Neoplasms
4 0 0 0 0 0 0 1 2 0 0 0 1 0 0Homicide
11 0 0 0 0 0 0 0 0 0 0 2 1 0 8Pneumonitis
1 0 0 0 0 0 0 0 0 1 0 0 0 0 0Human Immunodeficiency Virus
3 3 0 0 0 0 0 0 0 0 0 0 0 0 0Perinatal Period Conditions
7 0 0 0 0 0 0 0 0 0 1 1 2 0 3Aortic Aneurysm & Dissection
3 0 0 0 0 0 0 0 0 0 0 0 3 0 0Atherosclerosis
3 0 0 0 0 0 0 1 0 1 0 1 0 0 0Viral Hepatitis
6 1 1 0 1 0 1 0 0 0 1 1 0 0 0Congenital Malformations
0 0 0 0 0 0 0 0 0 0 0 0 0 0 0Anemias
1 0 0 0 0 0 0 0 0 0 1 0 0 0 0Medical & Surgical Complications
395 2 1 0 1 3 1 0 9 5 24 34 87 0 228All Other Natural Causes
1 0 0 0 0 0 0 0 0 0 1 0 0 0 0All Other External Causes
* ICD-10 codes associated with each cause of death group are presented on pages (xvii-xix).
FLORIDA VITAL STATISTICS ANNUAL REPORT 2013 149

TABLE D-11 (Cont.): RESIDENT DEATHS FOR SELECTED CAUSES*, BY AGE GROUPS, BY COUNTY, FLORIDA, 2013
TOTAL <1 1-4 5-9 10-14 15-19 20-24 25-34 35-44 45-54 55-64 65-74 75-84 85+ UNK
AGE GROUPS
664 4 1 0 1 0 6 8 19 59 128 147 145 0 146MONROE
201 0 0 0 0 0 0 0 3 15 53 59 42 0 29Cancer
141 1 0 0 0 0 0 0 1 9 22 28 33 0 47Heart Diseases
31 0 0 0 0 0 0 0 0 3 2 9 13 0 4Chronic Lower Resp Diseases
16 0 0 0 0 0 0 0 1 0 2 3 3 0 7Stroke
39 0 1 0 0 0 1 4 4 6 8 10 4 0 1Unintentional Injury
11 0 0 0 0 0 0 0 0 0 2 2 5 0 2Diabetes Mellitus
18 0 0 0 0 0 0 0 0 0 0 2 6 0 10Alzheimer's Disease
8 0 0 0 0 0 0 0 0 0 1 2 3 0 2Nephritis
32 0 0 0 1 0 4 2 9 7 2 5 0 0 2Suicide
20 0 0 0 0 0 0 0 0 6 7 5 2 0 0Chronic Liver Disease/Cirrhosis
7 0 0 0 0 0 0 0 0 0 1 1 1 0 4Influenza & Pneumonia
6 0 0 0 0 0 0 0 1 0 2 0 1 0 2Hypertension
3 0 0 0 0 0 0 0 0 0 1 0 1 0 1Septicemia
3 0 0 0 0 0 0 0 0 0 0 0 2 0 1Parkinson's Disease
3 0 0 0 0 0 0 0 0 0 0 2 0 0 1Benign Neoplasms
2 0 0 0 0 0 0 0 0 2 0 0 0 0 0Homicide
1 0 0 0 0 0 0 0 0 0 0 1 0 0 0Pneumonitis
4 0 0 0 0 0 0 0 0 2 2 0 0 0 0Human Immunodeficiency Virus
2 2 0 0 0 0 0 0 0 0 0 0 0 0 0Perinatal Period Conditions
2 0 0 0 0 0 0 0 0 0 0 1 1 0 0Aortic Aneurysm & Dissection
6 0 0 0 0 0 0 0 0 0 0 0 2 0 4Atherosclerosis
9 0 0 0 0 0 0 0 0 2 6 1 0 0 0Viral Hepatitis
1 0 0 0 0 0 0 0 0 0 0 1 0 0 0Congenital Malformations
2 0 0 0 0 0 0 0 0 0 0 1 0 0 1Anemias
0 0 0 0 0 0 0 0 0 0 0 0 0 0 0Medical & Surgical Complications
96 1 0 0 0 0 1 2 0 7 17 14 26 0 28All Other Natural Causes
0 0 0 0 0 0 0 0 0 0 0 0 0 0 0All Other External Causes
TOTAL <1 1-4 5-9 10-14 15-19 20-24 25-34 35-44 45-54 55-64 65-74 75-84 85+ UNK
AGE GROUPS
753 1 0 0 1 3 4 11 16 55 110 154 204 0 194NASSAU
204 0 0 0 0 0 1 0 3 12 46 63 51 0 28Cancer
175 0 0 0 0 0 0 0 1 11 16 29 59 0 59Heart Diseases
56 0 0 0 0 0 0 0 1 2 3 15 22 0 13Chronic Lower Resp Diseases
27 0 0 0 0 0 0 0 0 2 1 6 10 0 8Stroke
45 0 0 0 1 2 2 7 5 8 12 5 1 0 2Unintentional Injury
10 0 0 0 0 0 0 0 0 2 0 3 3 0 2Diabetes Mellitus
19 0 0 0 0 0 0 0 0 0 0 0 10 0 9Alzheimer's Disease
14 0 0 0 0 0 0 0 1 1 1 4 4 0 3Nephritis
19 0 0 0 0 1 1 1 1 3 6 4 2 0 0Suicide
14 0 0 0 0 0 0 1 0 4 8 1 0 0 0Chronic Liver Disease/Cirrhosis
17 0 0 0 0 0 0 0 0 0 0 4 4 0 9Influenza & Pneumonia
7 0 0 0 0 0 0 0 0 0 0 1 2 0 4Hypertension
5 0 0 0 0 0 0 0 0 0 1 1 2 0 1Septicemia
3 0 0 0 0 0 0 0 0 0 0 1 1 0 1Parkinson's Disease
4 0 0 0 0 0 0 0 1 0 0 1 1 0 1Benign Neoplasms
4 0 0 0 0 0 0 0 2 2 0 0 0 0 0Homicide
10 0 0 0 0 0 0 0 0 1 2 0 3 0 4Pneumonitis
1 0 0 0 0 0 0 0 1 0 0 0 0 0 0Human Immunodeficiency Virus
1 1 0 0 0 0 0 0 0 0 0 0 0 0 0Perinatal Period Conditions
2 0 0 0 0 0 0 0 0 0 0 1 0 0 1Aortic Aneurysm & Dissection
3 0 0 0 0 0 0 0 0 0 0 1 2 0 0Atherosclerosis
1 0 0 0 0 0 0 0 0 0 1 0 0 0 0Viral Hepatitis
1 0 0 0 0 0 0 0 0 0 1 0 0 0 0Congenital Malformations
0 0 0 0 0 0 0 0 0 0 0 0 0 0 0Anemias
2 0 0 0 0 0 0 0 0 1 0 0 1 0 0Medical & Surgical Complications
107 0 0 0 0 0 0 2 0 6 12 14 25 0 48All Other Natural Causes
2 0 0 0 0 0 0 0 0 1 0 0 1 0 0All Other External Causes
* ICD-10 codes associated with each cause of death group are presented on pages (xvii-xix).
150 FLORIDA VITAL STATISTICS ANNUAL REPORT 2013

TABLE D-11 (Cont.): RESIDENT DEATHS FOR SELECTED CAUSES*, BY AGE GROUPS, BY COUNTY, FLORIDA, 2013
TOTAL <1 1-4 5-9 10-14 15-19 20-24 25-34 35-44 45-54 55-64 65-74 75-84 85+ UNK
AGE GROUPS
1,583 21 2 2 3 9 15 21 39 127 197 290 450 0 407OKALOOSA
352 0 0 0 0 0 0 1 3 32 65 96 104 0 51Cancer
349 1 0 0 0 0 0 0 8 24 34 63 110 0 109Heart Diseases
140 0 0 0 0 0 0 0 1 7 17 29 57 0 29Chronic Lower Resp Diseases
74 0 0 0 0 0 0 1 1 2 13 14 23 0 20Stroke
52 2 0 0 2 3 4 2 6 11 5 5 7 0 5Unintentional Injury
47 0 0 0 1 0 1 0 0 2 6 14 13 0 10Diabetes Mellitus
60 0 0 0 0 0 0 0 0 0 2 3 20 0 35Alzheimer's Disease
36 0 0 0 0 0 0 0 1 0 1 9 10 0 15Nephritis
44 0 0 0 0 3 7 5 7 10 5 2 5 0 0Suicide
19 0 0 0 0 0 0 0 1 9 4 2 0 0 3Chronic Liver Disease/Cirrhosis
32 0 0 0 0 0 1 0 1 3 3 1 4 0 19Influenza & Pneumonia
18 0 0 0 0 0 0 1 0 3 3 3 3 0 5Hypertension
17 0 0 0 0 0 0 0 0 1 2 5 4 0 5Septicemia
15 0 0 0 0 0 0 0 0 0 0 2 7 0 6Parkinson's Disease
10 0 0 0 0 0 0 0 0 0 2 3 2 0 3Benign Neoplasms
6 1 1 0 0 1 0 2 1 0 0 0 0 0 0Homicide
11 0 0 0 0 0 0 0 0 0 2 2 3 0 4Pneumonitis
2 0 0 0 0 0 0 0 0 1 0 0 1 0 0Human Immunodeficiency Virus
8 8 0 0 0 0 0 0 0 0 0 0 0 0 0Perinatal Period Conditions
7 0 0 0 0 0 0 0 0 0 1 1 1 0 4Aortic Aneurysm & Dissection
1 0 0 0 0 0 0 0 0 0 0 1 0 0 0Atherosclerosis
4 0 0 0 0 0 0 0 0 0 3 0 0 0 1Viral Hepatitis
13 7 0 1 0 1 0 0 0 0 1 0 2 0 1Congenital Malformations
0 0 0 0 0 0 0 0 0 0 0 0 0 0 0Anemias
3 0 0 0 0 0 0 0 1 0 1 0 0 0 1Medical & Surgical Complications
259 2 1 1 0 1 1 8 8 22 27 35 73 0 80All Other Natural Causes
5 0 0 0 0 0 1 1 1 0 1 0 0 0 1All Other External Causes
TOTAL <1 1-4 5-9 10-14 15-19 20-24 25-34 35-44 45-54 55-64 65-74 75-84 85+ UNK
AGE GROUPS
415 4 2 0 0 0 5 11 11 38 65 89 103 0 87OKEECHOBEE
105 0 0 0 0 0 0 1 1 9 25 36 21 0 12Cancer
109 0 0 0 0 0 0 0 1 6 14 16 34 0 38Heart Diseases
21 0 0 0 0 0 0 0 0 0 1 4 14 0 2Chronic Lower Resp Diseases
16 0 0 0 0 0 1 0 0 0 1 5 4 0 5Stroke
27 1 2 0 0 0 4 3 2 7 5 1 2 0 0Unintentional Injury
12 0 0 0 0 0 0 0 0 1 4 3 2 0 2Diabetes Mellitus
9 0 0 0 0 0 0 0 0 0 0 0 3 0 6Alzheimer's Disease
6 0 0 0 0 0 0 0 0 0 0 3 2 0 1Nephritis
5 0 0 0 0 0 0 0 0 2 0 1 1 0 1Suicide
3 0 0 0 0 0 0 0 1 0 1 1 0 0 0Chronic Liver Disease/Cirrhosis
15 0 0 0 0 0 0 0 0 1 0 3 6 0 5Influenza & Pneumonia
3 0 0 0 0 0 0 0 0 1 0 1 0 0 1Hypertension
1 0 0 0 0 0 0 0 1 0 0 0 0 0 0Septicemia
3 0 0 0 0 0 0 0 0 0 0 2 0 0 1Parkinson's Disease
1 0 0 0 0 0 0 0 0 0 0 1 0 0 0Benign Neoplasms
2 0 0 0 0 0 0 1 1 0 0 0 0 0 0Homicide
4 0 0 0 0 0 0 0 0 0 0 3 0 0 1Pneumonitis
1 0 0 0 0 0 0 0 0 1 0 0 0 0 0Human Immunodeficiency Virus
2 2 0 0 0 0 0 0 0 0 0 0 0 0 0Perinatal Period Conditions
1 0 0 0 0 0 0 0 0 0 0 0 1 0 0Aortic Aneurysm & Dissection
1 0 0 0 0 0 0 0 0 0 0 1 0 0 0Atherosclerosis
1 0 0 0 0 0 0 0 0 0 1 0 0 0 0Viral Hepatitis
2 0 0 0 0 0 0 1 0 0 0 1 0 0 0Congenital Malformations
1 0 0 0 0 0 0 0 0 0 0 1 0 0 0Anemias
2 0 0 0 0 0 0 0 0 0 0 0 0 0 2Medical & Surgical Complications
60 1 0 0 0 0 0 5 4 9 13 5 13 0 10All Other Natural Causes
2 0 0 0 0 0 0 0 0 0 0 0 0 0 2All Other External Causes
* ICD-10 codes associated with each cause of death group are presented on pages (xvii-xix).
FLORIDA VITAL STATISTICS ANNUAL REPORT 2013 151

TABLE D-11 (Cont.): RESIDENT DEATHS FOR SELECTED CAUSES*, BY AGE GROUPS, BY COUNTY, FLORIDA, 2013
TOTAL <1 1-4 5-9 10-14 15-19 20-24 25-34 35-44 45-54 55-64 65-74 75-84 85+ UNK
AGE GROUPS
7,143 119 20 10 11 33 74 161 247 571 1,026 1,274 1,580 0 2,017ORANGE
1,702 0 0 2 1 2 2 12 31 174 363 464 381 0 270Cancer
1,521 1 0 0 2 1 2 12 35 108 211 242 374 0 533Heart Diseases
354 0 0 0 1 1 0 0 2 8 29 86 116 0 111Chronic Lower Resp Diseases
371 0 0 0 1 1 0 1 7 24 41 62 102 0 132Stroke
389 3 10 3 2 17 30 53 61 42 41 30 42 0 55Unintentional Injury
258 0 0 0 0 0 0 4 6 22 43 72 53 0 58Diabetes Mellitus
176 0 0 0 0 0 0 0 0 0 6 10 51 0 109Alzheimer's Disease
110 0 0 0 0 0 0 0 2 8 13 24 33 0 30Nephritis
122 0 0 0 0 3 7 23 20 28 20 13 6 0 2Suicide
86 0 1 0 0 0 1 0 5 15 40 14 7 0 3Chronic Liver Disease/Cirrhosis
131 1 0 0 0 0 0 2 4 15 11 24 27 0 47Influenza & Pneumonia
87 0 0 0 0 0 1 0 3 2 7 12 20 0 42Hypertension
114 0 0 0 0 1 3 2 2 6 17 17 33 0 33Septicemia
81 0 0 0 0 0 0 1 0 0 0 14 35 0 31Parkinson's Disease
38 0 0 0 0 0 0 0 2 2 3 3 13 0 15Benign Neoplasms
74 0 2 1 2 2 13 24 14 8 4 3 1 0 0Homicide
30 0 0 0 0 0 0 1 0 0 2 2 5 0 20Pneumonitis
57 0 0 0 0 0 2 2 10 23 13 6 1 0 0Human Immunodeficiency Virus
69 69 0 0 0 0 0 0 0 0 0 0 0 0 0Perinatal Period Conditions
35 0 0 0 0 0 0 1 1 4 5 7 9 0 8Aortic Aneurysm & Dissection
24 0 0 0 0 0 0 0 0 0 0 1 2 0 21Atherosclerosis
23 0 0 0 0 0 0 0 0 2 14 6 1 0 0Viral Hepatitis
43 26 3 0 0 2 0 2 0 3 5 0 2 0 0Congenital Malformations
13 0 0 0 0 0 0 0 0 1 2 1 5 0 4Anemias
10 0 0 0 0 0 0 1 0 1 2 3 2 0 1Medical & Surgical Complications
1,207 19 4 4 2 2 12 18 40 72 133 158 252 0 491All Other Natural Causes
21 0 0 0 0 1 1 3 2 3 2 3 5 0 1All Other External Causes
TOTAL <1 1-4 5-9 10-14 15-19 20-24 25-34 35-44 45-54 55-64 65-74 75-84 85+ UNK
AGE GROUPS
1,943 20 3 0 6 12 15 35 56 155 289 417 480 0 455OSCEOLA
458 0 0 0 2 0 3 4 13 50 112 126 96 0 52Cancer
494 0 0 0 0 0 0 2 8 29 60 105 142 0 148Heart Diseases
103 0 0 0 0 0 1 0 0 4 14 27 31 0 26Chronic Lower Resp Diseases
72 0 0 0 0 1 0 0 1 5 9 15 15 0 26Stroke
116 3 3 0 1 3 6 11 14 19 17 10 9 0 20Unintentional Injury
63 0 0 0 0 0 0 0 3 5 8 14 24 0 9Diabetes Mellitus
37 0 0 0 0 0 0 0 0 0 0 6 13 0 18Alzheimer's Disease
41 0 0 0 0 0 0 0 0 2 6 12 15 0 6Nephritis
28 0 0 0 0 1 1 5 3 6 7 2 3 0 0Suicide
38 0 0 0 0 0 0 1 4 9 10 10 4 0 0Chronic Liver Disease/Cirrhosis
34 0 0 0 1 0 0 1 0 3 3 8 8 0 10Influenza & Pneumonia
18 0 0 0 0 0 0 0 0 0 1 4 7 0 6Hypertension
36 1 0 0 0 0 0 0 1 2 9 4 13 0 6Septicemia
14 0 0 0 0 0 0 0 0 0 1 0 6 0 7Parkinson's Disease
10 0 0 0 0 2 0 0 0 0 0 2 3 0 3Benign Neoplasms
10 1 0 0 0 2 2 5 0 0 0 0 0 0 0Homicide
8 0 0 0 0 0 0 0 0 0 0 3 2 0 3Pneumonitis
7 0 0 0 0 0 0 0 0 4 1 1 1 0 0Human Immunodeficiency Virus
10 10 0 0 0 0 0 0 0 0 0 0 0 0 0Perinatal Period Conditions
8 0 0 0 0 0 0 0 2 0 0 2 3 0 1Aortic Aneurysm & Dissection
3 0 0 0 0 0 0 0 0 0 0 0 0 0 3Atherosclerosis
8 0 0 0 0 0 0 0 0 1 5 1 0 0 1Viral Hepatitis
5 5 0 0 0 0 0 0 0 0 0 0 0 0 0Congenital Malformations
5 0 0 0 0 0 0 0 2 0 0 2 0 0 1Anemias
5 0 0 0 1 0 0 0 0 0 0 1 2 0 1Medical & Surgical Complications
309 0 0 0 1 3 2 6 5 16 26 61 82 0 107All Other Natural Causes
6 0 0 0 1 0 0 0 0 0 0 2 2 0 1All Other External Causes
* ICD-10 codes associated with each cause of death group are presented on pages (xvii-xix).
152 FLORIDA VITAL STATISTICS ANNUAL REPORT 2013

TABLE D-11 (Cont.): RESIDENT DEATHS FOR SELECTED CAUSES*, BY AGE GROUPS, BY COUNTY, FLORIDA, 2013
TOTAL <1 1-4 5-9 10-14 15-19 20-24 25-34 35-44 45-54 55-64 65-74 75-84 85+ UNK
AGE GROUPS
13,515 65 12 6 18 40 67 188 263 659 1,250 1,855 3,235 2 5,855PALM BEACH
3,218 1 0 1 0 4 3 20 42 164 414 722 973 0 874Cancer
3,458 0 0 0 0 0 0 13 33 99 232 352 775 2 1,952Heart Diseases
656 0 0 1 0 0 0 0 2 12 43 113 203 0 282Chronic Lower Resp Diseases
754 1 0 0 1 0 0 2 6 26 47 83 189 0 399Stroke
634 10 5 1 5 20 31 72 64 98 76 45 80 0 127Unintentional Injury
265 0 0 0 0 0 0 0 3 17 57 57 71 0 60Diabetes Mellitus
440 0 0 0 0 0 0 0 0 2 3 23 109 0 303Alzheimer's Disease
244 0 0 0 0 0 0 0 2 10 12 32 65 0 123Nephritis
214 0 0 0 2 2 9 22 27 59 40 26 18 0 9Suicide
167 0 0 0 0 0 0 1 7 35 47 36 21 0 20Chronic Liver Disease/Cirrhosis
166 1 2 0 0 0 0 2 2 3 14 18 42 0 82Influenza & Pneumonia
117 0 0 0 0 0 0 0 2 5 16 19 21 0 54Hypertension
144 0 0 0 0 0 0 0 2 5 14 22 36 0 65Septicemia
201 0 0 0 0 0 0 0 0 0 7 20 66 0 108Parkinson's Disease
111 0 0 1 0 1 0 1 0 2 8 17 28 0 53Benign Neoplasms
88 1 0 0 4 6 14 22 17 13 9 1 1 0 0Homicide
96 1 0 0 0 0 0 0 1 2 2 9 15 0 66Pneumonitis
69 0 0 0 0 0 2 6 13 22 16 8 2 0 0Human Immunodeficiency Virus
31 31 0 0 0 0 0 0 0 0 0 0 0 0 0Perinatal Period Conditions
48 0 0 0 0 0 0 0 1 1 10 10 15 0 11Aortic Aneurysm & Dissection
49 0 0 0 0 0 0 0 0 0 2 1 14 0 32Atherosclerosis
41 0 0 0 0 0 0 0 2 6 23 5 1 0 4Viral Hepatitis
22 10 3 0 0 0 1 0 0 1 3 1 1 0 2Congenital Malformations
19 0 0 0 0 0 0 0 0 0 4 0 2 0 13Anemias
17 0 0 0 0 0 0 3 1 1 2 5 2 0 3Medical & Surgical Complications
2,216 9 2 2 6 6 5 23 33 75 143 227 480 0 1,205All Other Natural Causes
33 0 0 0 0 1 2 4 4 2 7 7 3 0 3All Other External Causes
TOTAL <1 1-4 5-9 10-14 15-19 20-24 25-34 35-44 45-54 55-64 65-74 75-84 85+ UNK
AGE GROUPS
5,574 37 4 0 4 6 24 82 120 340 700 1,093 1,436 0 1,728PASCO
1,309 0 0 0 0 0 1 5 22 91 244 356 349 0 241Cancer
1,183 1 0 0 0 0 0 7 15 55 115 212 313 0 465Heart Diseases
444 0 0 0 1 0 0 1 0 13 57 119 143 0 110Chronic Lower Resp Diseases
293 0 0 0 0 0 0 0 4 14 25 50 77 0 123Stroke
294 4 1 0 1 5 13 27 34 55 40 26 39 0 49Unintentional Injury
176 0 0 0 0 0 2 2 5 17 27 50 48 0 25Diabetes Mellitus
139 0 0 0 0 0 0 0 0 0 1 5 53 0 80Alzheimer's Disease
96 1 1 0 0 0 0 0 0 1 7 23 31 0 32Nephritis
92 0 0 0 0 0 4 12 12 22 16 14 8 0 4Suicide
93 0 0 0 0 0 0 1 4 18 34 20 11 0 5Chronic Liver Disease/Cirrhosis
57 1 1 0 0 0 0 0 2 4 6 7 14 0 22Influenza & Pneumonia
49 0 0 0 0 0 0 1 1 1 6 9 11 0 20Hypertension
50 0 0 0 0 0 0 2 0 2 8 10 17 0 11Septicemia
45 0 0 0 0 0 0 0 0 0 0 12 15 0 18Parkinson's Disease
22 0 0 0 0 0 0 0 0 1 2 3 6 0 10Benign Neoplasms
21 0 0 0 0 1 3 7 2 4 3 0 1 0 0Homicide
27 0 0 0 0 0 0 0 0 0 3 8 6 0 10Pneumonitis
9 0 0 0 0 0 0 1 2 3 2 1 0 0 0Human Immunodeficiency Virus
17 17 0 0 0 0 0 0 0 0 0 0 0 0 0Perinatal Period Conditions
25 0 0 0 0 0 1 0 0 0 2 8 8 0 6Aortic Aneurysm & Dissection
9 0 0 0 0 0 0 0 0 0 1 1 3 0 4Atherosclerosis
13 0 0 0 0 0 0 0 0 0 6 5 2 0 0Viral Hepatitis
16 6 0 0 0 0 0 2 1 2 1 1 2 0 1Congenital Malformations
6 0 0 0 0 0 0 1 0 1 1 0 1 0 2Anemias
3 0 0 0 1 0 0 0 0 0 1 0 0 0 1Medical & Surgical Complications
1,073 7 1 0 0 0 0 13 15 34 89 149 277 0 488All Other Natural Causes
9 0 0 0 2 0 0 0 1 2 2 1 0 0 1All Other External Causes
* ICD-10 codes associated with each cause of death group are presented on pages (xvii-xix).
FLORIDA VITAL STATISTICS ANNUAL REPORT 2013 153

TABLE D-11 (Cont.): RESIDENT DEATHS FOR SELECTED CAUSES*, BY AGE GROUPS, BY COUNTY, FLORIDA, 2013
TOTAL <1 1-4 5-9 10-14 15-19 20-24 25-34 35-44 45-54 55-64 65-74 75-84 85+ UNK
AGE GROUPS
11,340 48 10 4 2 16 45 122 190 676 1,431 1,894 2,703 0 4,199PINELLAS
2,522 0 2 0 1 1 0 8 35 155 447 706 671 0 496Cancer
2,620 1 0 1 0 0 4 12 20 124 315 382 614 0 1,147Heart Diseases
725 0 0 1 0 0 0 0 1 24 66 175 228 0 230Chronic Lower Resp Diseases
468 1 0 0 0 0 1 0 4 14 36 56 128 0 228Stroke
535 4 1 1 1 6 17 45 40 88 89 35 76 0 132Unintentional Injury
338 0 0 0 0 0 1 2 5 42 60 67 83 0 78Diabetes Mellitus
349 0 0 0 0 0 0 0 0 0 0 16 88 0 245Alzheimer's Disease
140 0 0 0 0 0 0 1 1 3 20 31 25 0 59Nephritis
168 0 0 0 0 5 6 18 30 37 32 18 14 0 8Suicide
177 0 0 0 0 0 0 2 11 45 74 22 19 0 4Chronic Liver Disease/Cirrhosis
172 1 0 0 0 0 0 2 2 5 17 27 42 0 76Influenza & Pneumonia
125 0 0 0 0 0 0 1 1 5 14 17 34 0 53Hypertension
96 0 0 0 0 1 0 0 0 2 13 19 33 0 28Septicemia
104 0 0 0 0 0 0 0 0 1 3 14 45 0 41Parkinson's Disease
79 0 1 1 0 0 1 2 0 5 4 7 23 0 35Benign Neoplasms
43 0 1 0 0 0 8 9 7 9 3 3 3 0 0Homicide
66 0 0 0 0 0 0 0 0 0 6 5 17 0 38Pneumonitis
48 0 0 0 0 0 0 2 5 17 15 8 1 0 0Human Immunodeficiency Virus
28 28 0 0 0 0 0 0 0 0 0 0 0 0 0Perinatal Period Conditions
25 0 0 0 0 0 0 1 1 0 4 0 9 0 10Aortic Aneurysm & Dissection
39 0 0 0 0 0 0 0 1 0 2 14 7 0 15Atherosclerosis
41 0 0 0 0 0 0 0 0 8 23 5 4 0 1Viral Hepatitis
22 8 2 0 0 0 2 1 0 4 2 2 1 0 0Congenital Malformations
11 0 0 0 0 0 1 0 0 0 2 2 0 0 6Anemias
5 0 0 0 0 0 0 0 0 0 0 2 2 0 1Medical & Surgical Complications
2,363 5 1 0 0 2 2 14 21 85 178 260 533 0 1,262All Other Natural Causes
23 0 2 0 0 1 2 2 5 3 3 2 2 0 1All Other External Causes
TOTAL <1 1-4 5-9 10-14 15-19 20-24 25-34 35-44 45-54 55-64 65-74 75-84 85+ UNK
AGE GROUPS
6,053 49 9 5 8 20 43 91 154 375 792 1,190 1,602 0 1,715POLK
1,383 0 1 3 0 2 4 9 31 92 249 411 370 0 211Cancer
1,503 3 1 0 0 0 1 10 21 76 156 257 426 0 552Heart Diseases
437 1 0 0 0 0 1 1 4 10 41 106 163 0 110Chronic Lower Resp Diseases
285 0 0 0 1 0 0 1 6 10 30 53 87 0 97Stroke
298 9 5 1 5 11 18 36 25 43 46 26 37 0 36Unintentional Injury
170 0 0 0 0 0 0 1 3 15 41 40 46 0 24Diabetes Mellitus
94 0 0 0 0 0 0 0 0 0 0 6 25 0 63Alzheimer's Disease
94 0 0 0 0 0 0 2 3 6 11 22 32 0 18Nephritis
82 0 0 0 1 5 9 4 15 18 11 10 6 0 3Suicide
83 0 0 0 0 0 0 0 4 20 31 12 10 0 6Chronic Liver Disease/Cirrhosis
139 1 0 0 0 0 0 0 1 3 18 22 38 0 56Influenza & Pneumonia
52 0 0 0 0 0 0 0 1 2 14 10 7 0 18Hypertension
103 0 0 0 0 0 0 1 2 10 11 24 34 0 21Septicemia
38 0 0 0 0 0 0 0 0 0 1 8 16 0 13Parkinson's Disease
29 0 0 0 0 0 0 0 0 3 2 5 11 0 8Benign Neoplasms
29 1 0 0 0 1 5 8 4 2 5 2 0 0 1Homicide
63 0 0 0 0 0 0 0 0 1 2 4 20 0 36Pneumonitis
34 0 0 0 0 0 0 2 13 7 10 0 2 0 0Human Immunodeficiency Virus
23 23 0 0 0 0 0 0 0 0 0 0 0 0 0Perinatal Period Conditions
34 0 0 0 0 0 0 0 0 1 9 8 9 0 7Aortic Aneurysm & Dissection
15 0 0 0 0 0 0 0 0 0 0 3 5 0 7Atherosclerosis
14 0 0 0 0 0 0 0 0 5 4 4 0 0 1Viral Hepatitis
9 3 0 0 0 0 2 0 1 1 1 0 0 0 1Congenital Malformations
10 0 0 0 0 0 0 1 1 1 0 3 1 0 3Anemias
7 0 0 0 0 0 0 0 0 2 0 4 1 0 0Medical & Surgical Complications
1,016 8 2 1 1 1 2 14 18 47 98 149 255 0 420All Other Natural Causes
11 0 0 0 0 0 1 1 1 2 0 5 1 0 0All Other External Causes
* ICD-10 codes associated with each cause of death group are presented on pages (xvii-xix).
154 FLORIDA VITAL STATISTICS ANNUAL REPORT 2013
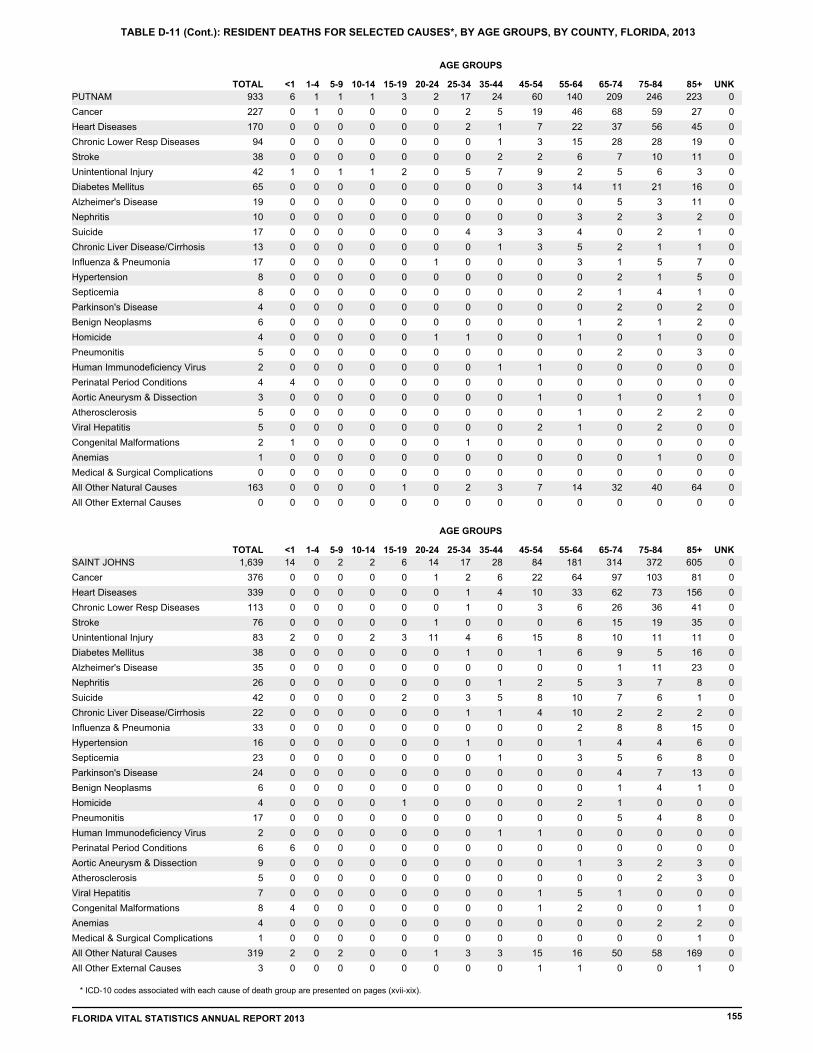
TABLE D-11 (Cont.): RESIDENT DEATHS FOR SELECTED CAUSES*, BY AGE GROUPS, BY COUNTY, FLORIDA, 2013
TOTAL <1 1-4 5-9 10-14 15-19 20-24 25-34 35-44 45-54 55-64 65-74 75-84 85+ UNK
AGE GROUPS
933 6 1 1 1 3 2 17 24 60 140 209 246 0 223PUTNAM
227 0 1 0 0 0 0 2 5 19 46 68 59 0 27Cancer
170 0 0 0 0 0 0 2 1 7 22 37 56 0 45Heart Diseases
94 0 0 0 0 0 0 0 1 3 15 28 28 0 19Chronic Lower Resp Diseases
38 0 0 0 0 0 0 0 2 2 6 7 10 0 11Stroke
42 1 0 1 1 2 0 5 7 9 2 5 6 0 3Unintentional Injury
65 0 0 0 0 0 0 0 0 3 14 11 21 0 16Diabetes Mellitus
19 0 0 0 0 0 0 0 0 0 0 5 3 0 11Alzheimer's Disease
10 0 0 0 0 0 0 0 0 0 3 2 3 0 2Nephritis
17 0 0 0 0 0 0 4 3 3 4 0 2 0 1Suicide
13 0 0 0 0 0 0 0 1 3 5 2 1 0 1Chronic Liver Disease/Cirrhosis
17 0 0 0 0 0 1 0 0 0 3 1 5 0 7Influenza & Pneumonia
8 0 0 0 0 0 0 0 0 0 0 2 1 0 5Hypertension
8 0 0 0 0 0 0 0 0 0 2 1 4 0 1Septicemia
4 0 0 0 0 0 0 0 0 0 0 2 0 0 2Parkinson's Disease
6 0 0 0 0 0 0 0 0 0 1 2 1 0 2Benign Neoplasms
4 0 0 0 0 0 1 1 0 0 1 0 1 0 0Homicide
5 0 0 0 0 0 0 0 0 0 0 2 0 0 3Pneumonitis
2 0 0 0 0 0 0 0 1 1 0 0 0 0 0Human Immunodeficiency Virus
4 4 0 0 0 0 0 0 0 0 0 0 0 0 0Perinatal Period Conditions
3 0 0 0 0 0 0 0 0 1 0 1 0 0 1Aortic Aneurysm & Dissection
5 0 0 0 0 0 0 0 0 0 1 0 2 0 2Atherosclerosis
5 0 0 0 0 0 0 0 0 2 1 0 2 0 0Viral Hepatitis
2 1 0 0 0 0 0 1 0 0 0 0 0 0 0Congenital Malformations
1 0 0 0 0 0 0 0 0 0 0 0 1 0 0Anemias
0 0 0 0 0 0 0 0 0 0 0 0 0 0 0Medical & Surgical Complications
163 0 0 0 0 1 0 2 3 7 14 32 40 0 64All Other Natural Causes
0 0 0 0 0 0 0 0 0 0 0 0 0 0 0All Other External Causes
TOTAL <1 1-4 5-9 10-14 15-19 20-24 25-34 35-44 45-54 55-64 65-74 75-84 85+ UNK
AGE GROUPS
1,639 14 0 2 2 6 14 17 28 84 181 314 372 0 605SAINT JOHNS
376 0 0 0 0 0 1 2 6 22 64 97 103 0 81Cancer
339 0 0 0 0 0 0 1 4 10 33 62 73 0 156Heart Diseases
113 0 0 0 0 0 0 1 0 3 6 26 36 0 41Chronic Lower Resp Diseases
76 0 0 0 0 0 1 0 0 0 6 15 19 0 35Stroke
83 2 0 0 2 3 11 4 6 15 8 10 11 0 11Unintentional Injury
38 0 0 0 0 0 0 1 0 1 6 9 5 0 16Diabetes Mellitus
35 0 0 0 0 0 0 0 0 0 0 1 11 0 23Alzheimer's Disease
26 0 0 0 0 0 0 0 1 2 5 3 7 0 8Nephritis
42 0 0 0 0 2 0 3 5 8 10 7 6 0 1Suicide
22 0 0 0 0 0 0 1 1 4 10 2 2 0 2Chronic Liver Disease/Cirrhosis
33 0 0 0 0 0 0 0 0 0 2 8 8 0 15Influenza & Pneumonia
16 0 0 0 0 0 0 1 0 0 1 4 4 0 6Hypertension
23 0 0 0 0 0 0 0 1 0 3 5 6 0 8Septicemia
24 0 0 0 0 0 0 0 0 0 0 4 7 0 13Parkinson's Disease
6 0 0 0 0 0 0 0 0 0 0 1 4 0 1Benign Neoplasms
4 0 0 0 0 1 0 0 0 0 2 1 0 0 0Homicide
17 0 0 0 0 0 0 0 0 0 0 5 4 0 8Pneumonitis
2 0 0 0 0 0 0 0 1 1 0 0 0 0 0Human Immunodeficiency Virus
6 6 0 0 0 0 0 0 0 0 0 0 0 0 0Perinatal Period Conditions
9 0 0 0 0 0 0 0 0 0 1 3 2 0 3Aortic Aneurysm & Dissection
5 0 0 0 0 0 0 0 0 0 0 0 2 0 3Atherosclerosis
7 0 0 0 0 0 0 0 0 1 5 1 0 0 0Viral Hepatitis
8 4 0 0 0 0 0 0 0 1 2 0 0 0 1Congenital Malformations
4 0 0 0 0 0 0 0 0 0 0 0 2 0 2Anemias
1 0 0 0 0 0 0 0 0 0 0 0 0 0 1Medical & Surgical Complications
319 2 0 2 0 0 1 3 3 15 16 50 58 0 169All Other Natural Causes
3 0 0 0 0 0 0 0 0 1 1 0 0 0 1All Other External Causes
* ICD-10 codes associated with each cause of death group are presented on pages (xvii-xix).
FLORIDA VITAL STATISTICS ANNUAL REPORT 2013 155

TABLE D-11 (Cont.): RESIDENT DEATHS FOR SELECTED CAUSES*, BY AGE GROUPS, BY COUNTY, FLORIDA, 2013
TOTAL <1 1-4 5-9 10-14 15-19 20-24 25-34 35-44 45-54 55-64 65-74 75-84 85+ UNK
AGE GROUPS
2,866 13 5 2 0 6 13 29 59 169 363 525 745 0 937SAINT LUCIE
735 0 1 0 0 0 2 2 11 40 140 215 205 0 119Cancer
638 0 0 0 0 0 0 5 6 37 66 96 173 0 255Heart Diseases
223 0 0 1 0 0 0 0 2 4 14 51 80 0 71Chronic Lower Resp Diseases
135 0 0 0 0 0 0 0 0 7 11 22 41 0 54Stroke
119 1 1 1 0 3 5 7 17 21 17 16 14 0 16Unintentional Injury
80 0 0 0 0 0 0 0 1 4 8 22 26 0 19Diabetes Mellitus
88 0 0 0 0 0 0 0 0 0 0 7 24 0 57Alzheimer's Disease
48 0 0 0 0 0 0 2 0 1 4 4 13 0 24Nephritis
41 0 0 0 0 2 2 2 5 5 9 9 2 0 5Suicide
59 0 0 0 0 0 0 0 0 17 20 12 9 0 1Chronic Liver Disease/Cirrhosis
29 1 0 0 0 0 0 0 0 1 5 3 6 0 13Influenza & Pneumonia
30 0 0 0 0 0 0 0 0 1 5 6 9 0 9Hypertension
23 0 0 0 0 0 0 0 0 1 2 3 9 0 8Septicemia
23 0 0 0 0 0 0 1 0 0 0 2 11 0 9Parkinson's Disease
17 1 0 0 0 0 0 0 0 0 3 2 4 0 7Benign Neoplasms
15 1 0 0 0 1 3 5 1 2 2 0 0 0 0Homicide
7 0 0 0 0 0 0 0 0 0 0 0 3 0 4Pneumonitis
15 0 0 0 0 0 0 1 3 5 4 1 1 0 0Human Immunodeficiency Virus
7 7 0 0 0 0 0 0 0 0 0 0 0 0 0Perinatal Period Conditions
11 0 0 0 0 0 0 0 1 1 2 1 5 0 1Aortic Aneurysm & Dissection
3 0 0 0 0 0 0 0 0 0 1 0 1 0 1Atherosclerosis
11 0 0 0 0 0 0 0 0 2 6 1 2 0 0Viral Hepatitis
5 1 0 0 0 0 0 2 0 1 1 0 0 0 0Congenital Malformations
3 0 0 0 0 0 0 0 0 0 0 0 1 0 2Anemias
3 0 0 0 0 0 0 0 0 1 0 0 2 0 0Medical & Surgical Complications
495 1 3 0 0 0 1 2 12 18 41 52 104 0 261All Other Natural Causes
4 0 0 0 0 0 0 0 0 1 1 0 2 0 0All Other External Causes
TOTAL <1 1-4 5-9 10-14 15-19 20-24 25-34 35-44 45-54 55-64 65-74 75-84 85+ UNK
AGE GROUPS
1,309 11 2 2 1 6 6 28 35 110 181 291 328 0 308SANTA ROSA
326 0 0 0 1 1 0 2 7 36 67 103 74 0 35Cancer
266 0 0 0 0 0 1 1 3 18 31 65 66 0 81Heart Diseases
100 0 0 0 0 0 0 0 2 5 12 25 34 0 22Chronic Lower Resp Diseases
74 0 0 1 0 0 0 0 2 3 5 12 32 0 19Stroke
64 1 2 0 0 3 1 13 8 10 10 5 5 0 6Unintentional Injury
32 0 0 0 0 0 0 0 0 6 7 5 8 0 6Diabetes Mellitus
47 0 0 0 0 0 0 0 0 0 0 5 12 0 30Alzheimer's Disease
29 0 0 0 0 0 0 0 0 2 2 9 10 0 6Nephritis
29 0 0 0 0 0 3 5 4 8 4 2 3 0 0Suicide
12 0 0 0 0 0 0 0 0 2 6 4 0 0 0Chronic Liver Disease/Cirrhosis
22 0 0 0 0 0 0 0 0 1 2 3 1 0 15Influenza & Pneumonia
10 0 0 0 0 0 0 0 0 1 1 1 3 0 4Hypertension
18 0 0 0 0 0 0 1 1 2 4 2 3 0 5Septicemia
10 0 0 0 0 0 0 0 0 0 0 1 8 0 1Parkinson's Disease
9 0 0 0 0 0 0 0 0 0 0 2 5 0 2Benign Neoplasms
7 0 0 0 0 1 0 3 1 1 1 0 0 0 0Homicide
6 0 0 0 0 0 0 0 0 0 0 1 3 0 2Pneumonitis
1 0 0 0 0 0 0 0 1 0 0 0 0 0 0Human Immunodeficiency Virus
4 4 0 0 0 0 0 0 0 0 0 0 0 0 0Perinatal Period Conditions
4 0 0 0 0 0 0 0 0 0 1 0 1 0 2Aortic Aneurysm & Dissection
1 0 0 0 0 0 0 0 0 0 0 0 1 0 0Atherosclerosis
2 0 0 0 0 0 0 0 0 0 0 1 1 0 0Viral Hepatitis
5 4 0 0 0 0 0 0 1 0 0 0 0 0 0Congenital Malformations
4 0 0 0 0 0 0 0 0 0 0 1 1 0 2Anemias
2 0 0 0 0 0 0 0 0 0 2 0 0 0 0Medical & Surgical Complications
223 2 0 1 0 1 1 3 5 14 26 44 57 0 69All Other Natural Causes
3 0 0 0 0 0 0 0 0 1 2 0 0 0 0All Other External Causes
* ICD-10 codes associated with each cause of death group are presented on pages (xvii-xix).
156 FLORIDA VITAL STATISTICS ANNUAL REPORT 2013

TABLE D-11 (Cont.): RESIDENT DEATHS FOR SELECTED CAUSES*, BY AGE GROUPS, BY COUNTY, FLORIDA, 2013
TOTAL <1 1-4 5-9 10-14 15-19 20-24 25-34 35-44 45-54 55-64 65-74 75-84 85+ UNK
AGE GROUPS
5,078 15 3 0 0 5 14 44 66 223 421 742 1,363 0 2,182SARASOTA
1,289 0 0 0 0 0 0 7 15 60 168 325 424 0 290Cancer
1,056 0 0 0 0 0 1 3 5 33 76 118 259 0 561Heart Diseases
298 0 0 0 0 0 0 0 0 4 18 54 110 0 112Chronic Lower Resp Diseases
241 0 0 0 0 0 0 1 3 3 14 24 69 0 127Stroke
194 2 1 0 0 1 4 15 17 25 21 17 27 0 64Unintentional Injury
92 0 0 0 0 0 0 0 2 10 16 16 25 0 23Diabetes Mellitus
131 0 0 0 0 0 0 0 0 1 1 7 29 0 93Alzheimer's Disease
106 1 0 0 0 0 1 0 1 2 6 16 43 0 36Nephritis
85 0 0 0 0 2 6 9 6 18 16 16 9 0 3Suicide
59 0 0 0 0 0 0 0 6 20 18 5 6 0 4Chronic Liver Disease/Cirrhosis
80 0 0 0 0 0 0 0 0 2 1 4 21 0 52Influenza & Pneumonia
39 0 0 0 0 0 0 0 0 2 4 4 8 0 21Hypertension
49 1 0 0 0 0 0 0 1 0 4 6 15 0 22Septicemia
71 0 0 0 0 0 0 0 0 0 2 4 29 0 36Parkinson's Disease
35 0 0 0 0 0 0 0 0 0 2 8 12 0 13Benign Neoplasms
8 0 2 0 0 1 0 1 1 1 0 1 0 0 1Homicide
36 0 0 0 0 0 0 0 0 0 3 3 6 0 24Pneumonitis
5 0 0 0 0 0 0 0 0 3 1 1 0 0 0Human Immunodeficiency Virus
7 7 0 0 0 0 0 0 0 0 0 0 0 0 0Perinatal Period Conditions
15 0 0 0 0 0 0 0 0 1 1 4 4 0 5Aortic Aneurysm & Dissection
8 0 0 0 0 0 0 0 0 0 0 0 2 0 6Atherosclerosis
7 0 0 0 0 0 0 1 0 2 3 0 0 0 1Viral Hepatitis
12 1 0 0 0 0 0 1 0 1 1 2 2 0 4Congenital Malformations
7 0 0 0 0 0 0 0 0 0 0 1 2 0 4Anemias
4 0 0 0 0 0 0 0 0 1 0 1 0 0 2Medical & Surgical Complications
1,139 3 0 0 0 1 2 6 9 34 44 105 259 0 676All Other Natural Causes
4 0 0 0 0 0 0 0 0 1 0 1 0 0 2All Other External Causes
TOTAL <1 1-4 5-9 10-14 15-19 20-24 25-34 35-44 45-54 55-64 65-74 75-84 85+ UNK
AGE GROUPS
2,976 24 7 6 4 13 17 48 71 212 382 485 730 0 977SEMINOLE
732 0 0 0 3 1 3 6 12 54 141 182 198 0 132Cancer
615 1 0 0 0 0 0 2 6 41 63 94 151 0 257Heart Diseases
184 0 1 0 0 0 0 0 1 5 15 33 65 0 64Chronic Lower Resp Diseases
153 0 0 0 0 0 0 1 2 5 11 26 45 0 63Stroke
162 0 4 1 0 6 7 19 16 33 15 17 15 0 29Unintentional Injury
111 0 0 0 0 0 0 0 2 11 18 22 27 0 31Diabetes Mellitus
79 0 0 0 0 0 0 0 0 0 2 5 22 0 50Alzheimer's Disease
54 0 0 0 0 0 0 3 0 2 6 8 15 0 20Nephritis
61 0 0 0 0 2 1 6 14 15 12 6 2 0 3Suicide
44 0 0 0 0 0 0 2 4 11 13 4 9 0 1Chronic Liver Disease/Cirrhosis
49 0 0 1 0 0 0 0 0 3 7 7 11 0 20Influenza & Pneumonia
54 0 0 0 0 0 0 0 0 1 3 9 12 0 29Hypertension
41 0 0 0 0 0 0 0 1 3 10 5 11 0 11Septicemia
37 0 0 0 0 0 0 0 0 0 3 5 15 0 14Parkinson's Disease
17 1 0 0 0 0 0 1 1 2 3 2 5 0 2Benign Neoplasms
11 1 0 0 0 1 2 4 1 0 2 0 0 0 0Homicide
8 0 0 1 0 0 0 0 0 0 1 0 4 0 2Pneumonitis
8 0 0 0 0 0 0 0 1 2 4 0 1 0 0Human Immunodeficiency Virus
16 16 0 0 0 0 0 0 0 0 0 0 0 0 0Perinatal Period Conditions
6 0 0 0 0 0 0 0 0 0 0 2 1 0 3Aortic Aneurysm & Dissection
2 0 0 0 0 0 0 0 0 0 0 0 1 0 1Atherosclerosis
12 0 0 0 0 0 0 0 0 4 5 2 1 0 0Viral Hepatitis
8 2 1 2 0 0 0 0 0 2 1 0 0 0 0Congenital Malformations
9 0 0 0 0 0 0 0 0 0 0 1 2 0 6Anemias
4 0 0 0 0 0 0 0 0 0 0 1 1 0 2Medical & Surgical Complications
495 3 1 1 1 3 4 3 10 16 46 54 116 0 237All Other Natural Causes
7 0 0 0 0 0 0 1 0 2 0 1 1 0 2All Other External Causes
* ICD-10 codes associated with each cause of death group are presented on pages (xvii-xix).
FLORIDA VITAL STATISTICS ANNUAL REPORT 2013 157

TABLE D-11 (Cont.): RESIDENT DEATHS FOR SELECTED CAUSES*, BY AGE GROUPS, BY COUNTY, FLORIDA, 2013
TOTAL <1 1-4 5-9 10-14 15-19 20-24 25-34 35-44 45-54 55-64 65-74 75-84 85+ UNK
AGE GROUPS
1,404 2 1 0 1 0 3 6 14 50 117 356 459 1 394SUMTER
416 0 0 0 1 0 0 0 2 16 43 145 151 0 58Cancer
299 0 0 0 0 0 0 0 3 6 17 57 102 0 114Heart Diseases
70 0 0 0 0 0 0 0 0 0 6 19 25 0 20Chronic Lower Resp Diseases
71 0 0 0 0 0 0 0 0 1 2 24 22 0 22Stroke
66 0 0 0 0 0 2 4 2 3 6 7 20 0 22Unintentional Injury
39 0 0 0 0 0 0 0 2 2 8 13 6 0 8Diabetes Mellitus
30 0 0 0 0 0 0 0 0 0 1 2 9 0 18Alzheimer's Disease
16 0 0 0 0 0 0 0 2 1 1 1 3 0 8Nephritis
24 0 0 0 0 0 0 1 2 7 1 7 5 0 1Suicide
13 0 0 0 0 0 0 0 0 2 7 3 1 0 0Chronic Liver Disease/Cirrhosis
23 0 0 0 0 0 0 0 0 1 2 2 10 0 8Influenza & Pneumonia
10 0 0 0 0 0 0 0 0 2 0 0 4 0 4Hypertension
12 0 0 0 0 0 0 0 0 1 0 5 3 0 3Septicemia
24 0 0 0 0 0 0 0 0 0 1 2 13 0 8Parkinson's Disease
13 0 0 0 0 0 0 0 0 0 1 3 4 0 5Benign Neoplasms
3 0 0 0 0 0 0 0 1 0 1 0 0 1 0Homicide
3 0 0 0 0 0 0 0 0 1 0 0 2 0 0Pneumonitis
0 0 0 0 0 0 0 0 0 0 0 0 0 0 0Human Immunodeficiency Virus
1 1 0 0 0 0 0 0 0 0 0 0 0 0 0Perinatal Period Conditions
6 0 0 0 0 0 0 0 0 0 1 4 1 0 0Aortic Aneurysm & Dissection
8 0 0 0 0 0 0 0 0 1 1 0 1 0 5Atherosclerosis
4 0 0 0 0 0 0 0 0 0 1 2 1 0 0Viral Hepatitis
3 1 1 0 0 0 0 0 0 0 0 0 0 0 1Congenital Malformations
2 0 0 0 0 0 0 0 0 0 0 1 0 0 1Anemias
1 0 0 0 0 0 0 0 0 0 1 0 0 0 0Medical & Surgical Complications
243 0 0 0 0 0 1 1 0 6 15 56 76 0 88All Other Natural Causes
2 0 0 0 0 0 0 0 0 0 2 0 0 0 0All Other External Causes
TOTAL <1 1-4 5-9 10-14 15-19 20-24 25-34 35-44 45-54 55-64 65-74 75-84 85+ UNK
AGE GROUPS
513 5 2 0 1 1 5 9 9 32 64 106 137 0 142SUWANNEE
122 0 0 0 0 0 0 0 0 8 25 40 36 0 13Cancer
117 0 0 0 0 0 1 0 2 2 8 23 30 0 51Heart Diseases
35 0 0 0 0 0 0 0 0 1 5 12 13 0 4Chronic Lower Resp Diseases
19 0 0 0 0 0 0 0 1 1 1 1 6 0 9Stroke
25 1 1 0 0 1 3 3 2 4 4 2 2 0 2Unintentional Injury
12 0 0 0 0 0 0 0 1 2 3 2 1 0 3Diabetes Mellitus
19 0 0 0 0 0 0 0 0 0 1 1 7 0 10Alzheimer's Disease
7 1 0 0 0 0 0 0 0 0 0 1 3 0 2Nephritis
7 0 0 0 0 0 1 1 0 2 0 3 0 0 0Suicide
5 0 0 0 0 0 0 0 0 1 3 0 1 0 0Chronic Liver Disease/Cirrhosis
9 0 0 0 0 0 0 0 1 0 1 1 3 0 3Influenza & Pneumonia
9 0 0 0 0 0 0 0 0 0 0 2 3 0 4Hypertension
7 0 0 0 0 0 0 0 0 1 1 1 2 0 2Septicemia
7 0 0 0 0 0 0 0 0 0 2 0 4 0 1Parkinson's Disease
2 0 0 0 0 0 0 0 0 0 0 1 0 0 1Benign Neoplasms
3 0 0 0 0 0 0 0 1 1 0 1 0 0 0Homicide
2 0 0 0 0 0 0 0 0 0 0 0 0 0 2Pneumonitis
4 0 0 0 0 0 0 1 0 3 0 0 0 0 0Human Immunodeficiency Virus
1 1 0 0 0 0 0 0 0 0 0 0 0 0 0Perinatal Period Conditions
5 0 0 0 0 0 0 0 0 0 0 1 2 0 2Aortic Aneurysm & Dissection
1 0 0 0 0 0 0 0 0 0 0 0 0 0 1Atherosclerosis
5 0 0 0 0 0 0 0 1 1 2 1 0 0 0Viral Hepatitis
2 1 1 0 0 0 0 0 0 0 0 0 0 0 0Congenital Malformations
0 0 0 0 0 0 0 0 0 0 0 0 0 0 0Anemias
0 0 0 0 0 0 0 0 0 0 0 0 0 0 0Medical & Surgical Complications
88 1 0 0 1 0 0 4 0 5 8 13 24 0 32All Other Natural Causes
0 0 0 0 0 0 0 0 0 0 0 0 0 0 0All Other External Causes
* ICD-10 codes associated with each cause of death group are presented on pages (xvii-xix).
158 FLORIDA VITAL STATISTICS ANNUAL REPORT 2013

TABLE D-11 (Cont.): RESIDENT DEATHS FOR SELECTED CAUSES*, BY AGE GROUPS, BY COUNTY, FLORIDA, 2013
TOTAL <1 1-4 5-9 10-14 15-19 20-24 25-34 35-44 45-54 55-64 65-74 75-84 85+ UNK
AGE GROUPS
234 0 0 0 0 1 0 6 5 21 35 59 56 0 51TAYLOR
64 0 0 0 0 0 0 0 0 3 15 18 15 0 13Cancer
51 0 0 0 0 0 0 1 0 4 6 16 15 0 9Heart Diseases
16 0 0 0 0 0 0 0 0 1 0 6 3 0 6Chronic Lower Resp Diseases
16 0 0 0 0 0 0 0 1 0 1 4 9 0 1Stroke
11 0 0 0 0 1 0 2 1 1 2 2 1 0 1Unintentional Injury
10 0 0 0 0 0 0 0 0 1 2 4 2 0 1Diabetes Mellitus
3 0 0 0 0 0 0 0 0 0 0 1 1 0 1Alzheimer's Disease
3 0 0 0 0 0 0 0 0 0 0 0 1 0 2Nephritis
7 0 0 0 0 0 0 2 0 3 2 0 0 0 0Suicide
5 0 0 0 0 0 0 0 2 2 0 1 0 0 0Chronic Liver Disease/Cirrhosis
6 0 0 0 0 0 0 0 0 1 2 0 2 0 1Influenza & Pneumonia
2 0 0 0 0 0 0 0 0 0 0 0 0 0 2Hypertension
2 0 0 0 0 0 0 0 0 1 0 1 0 0 0Septicemia
2 0 0 0 0 0 0 0 0 0 0 0 2 0 0Parkinson's Disease
0 0 0 0 0 0 0 0 0 0 0 0 0 0 0Benign Neoplasms
2 0 0 0 0 0 0 1 1 0 0 0 0 0 0Homicide
0 0 0 0 0 0 0 0 0 0 0 0 0 0 0Pneumonitis
0 0 0 0 0 0 0 0 0 0 0 0 0 0 0Human Immunodeficiency Virus
0 0 0 0 0 0 0 0 0 0 0 0 0 0 0Perinatal Period Conditions
0 0 0 0 0 0 0 0 0 0 0 0 0 0 0Aortic Aneurysm & Dissection
0 0 0 0 0 0 0 0 0 0 0 0 0 0 0Atherosclerosis
0 0 0 0 0 0 0 0 0 0 0 0 0 0 0Viral Hepatitis
1 0 0 0 0 0 0 0 0 1 0 0 0 0 0Congenital Malformations
1 0 0 0 0 0 0 0 0 0 0 0 1 0 0Anemias
2 0 0 0 0 0 0 0 0 0 0 1 1 0 0Medical & Surgical Complications
30 0 0 0 0 0 0 0 0 3 5 5 3 0 14All Other Natural Causes
2 0 0 0 0 0 0 0 0 0 0 1 1 0 0All Other External Causes
TOTAL <1 1-4 5-9 10-14 15-19 20-24 25-34 35-44 45-54 55-64 65-74 75-84 85+ UNK
AGE GROUPS
221 1 0 0 0 1 3 6 12 34 65 35 40 0 24UNION
66 0 0 0 0 0 1 0 3 17 18 13 11 0 3Cancer
33 0 0 0 0 0 0 0 1 2 10 5 8 0 7Heart Diseases
13 0 0 0 0 0 0 0 0 0 4 1 4 0 4Chronic Lower Resp Diseases
10 0 0 0 0 0 0 0 0 1 5 1 3 0 0Stroke
11 1 0 0 0 1 0 1 2 0 3 1 1 0 1Unintentional Injury
2 0 0 0 0 0 0 0 0 0 2 0 0 0 0Diabetes Mellitus
4 0 0 0 0 0 0 0 0 0 0 0 2 0 2Alzheimer's Disease
2 0 0 0 0 0 0 0 0 0 1 0 0 0 1Nephritis
6 0 0 0 0 0 1 1 1 1 1 1 0 0 0Suicide
6 0 0 0 0 0 0 0 0 4 1 1 0 0 0Chronic Liver Disease/Cirrhosis
2 0 0 0 0 0 0 0 0 0 0 2 0 0 0Influenza & Pneumonia
1 0 0 0 0 0 0 0 0 0 0 1 0 0 0Hypertension
4 0 0 0 0 0 0 0 0 1 2 1 0 0 0Septicemia
2 0 0 0 0 0 0 0 0 0 0 0 2 0 0Parkinson's Disease
2 0 0 0 0 0 0 0 0 0 1 1 0 0 0Benign Neoplasms
4 0 0 0 0 0 1 1 1 0 0 0 1 0 0Homicide
1 0 0 0 0 0 0 0 0 0 0 0 1 0 0Pneumonitis
7 0 0 0 0 0 0 1 1 0 4 1 0 0 0Human Immunodeficiency Virus
0 0 0 0 0 0 0 0 0 0 0 0 0 0 0Perinatal Period Conditions
1 0 0 0 0 0 0 0 0 0 0 0 1 0 0Aortic Aneurysm & Dissection
0 0 0 0 0 0 0 0 0 0 0 0 0 0 0Atherosclerosis
14 0 0 0 0 0 0 0 0 3 9 2 0 0 0Viral Hepatitis
1 0 0 0 0 0 0 1 0 0 0 0 0 0 0Congenital Malformations
1 0 0 0 0 0 0 0 0 1 0 0 0 0 0Anemias
1 0 0 0 0 0 0 0 1 0 0 0 0 0 0Medical & Surgical Complications
23 0 0 0 0 0 0 1 2 2 2 4 6 0 6All Other Natural Causes
5 0 0 0 0 0 0 0 1 2 2 0 0 0 0All Other External Causes
* ICD-10 codes associated with each cause of death group are presented on pages (xvii-xix).
FLORIDA VITAL STATISTICS ANNUAL REPORT 2013 159

TABLE D-11 (Cont.): RESIDENT DEATHS FOR SELECTED CAUSES*, BY AGE GROUPS, BY COUNTY, FLORIDA, 2013
TOTAL <1 1-4 5-9 10-14 15-19 20-24 25-34 35-44 45-54 55-64 65-74 75-84 85+ UNK
AGE GROUPS
6,347 21 10 4 9 12 29 97 137 386 824 1,118 1,608 1 2,091VOLUSIA
1,481 1 1 0 1 0 1 13 20 106 273 382 421 0 262Cancer
1,469 0 0 0 0 0 3 5 24 78 157 246 346 0 610Heart Diseases
474 0 0 0 1 0 0 0 3 16 41 103 169 0 141Chronic Lower Resp Diseases
294 0 0 0 0 0 0 0 1 8 26 43 101 0 115Stroke
275 0 5 2 5 4 13 32 34 42 37 26 28 0 47Unintentional Injury
226 0 0 0 0 0 0 2 5 11 38 51 61 0 58Diabetes Mellitus
234 0 0 0 0 0 0 0 0 0 2 13 64 0 155Alzheimer's Disease
112 0 0 0 0 0 0 1 1 5 17 21 25 0 42Nephritis
105 0 0 0 0 3 6 13 12 22 25 11 10 0 3Suicide
107 0 0 0 0 0 0 3 10 24 37 17 12 0 4Chronic Liver Disease/Cirrhosis
85 2 0 0 0 0 0 1 0 4 10 10 23 0 35Influenza & Pneumonia
87 0 0 0 0 1 0 0 2 3 11 10 13 0 47Hypertension
72 0 0 0 0 0 1 2 1 4 9 19 19 0 17Septicemia
67 0 0 0 0 0 0 0 0 0 1 8 27 0 31Parkinson's Disease
48 0 0 0 0 0 0 3 0 1 5 8 11 0 20Benign Neoplasms
24 0 1 1 0 2 4 6 2 3 1 3 1 0 0Homicide
28 0 0 0 0 0 0 0 0 0 4 4 8 0 12Pneumonitis
22 0 0 0 0 0 0 1 4 9 5 3 0 0 0Human Immunodeficiency Virus
11 11 0 0 0 0 0 0 0 0 0 0 0 0 0Perinatal Period Conditions
29 0 0 0 0 0 0 0 1 1 2 9 10 0 6Aortic Aneurysm & Dissection
15 0 0 0 0 0 0 0 0 0 1 0 4 0 10Atherosclerosis
21 0 0 0 0 0 0 0 1 3 14 3 0 0 0Viral Hepatitis
13 5 1 0 0 0 0 1 1 2 2 0 0 0 1Congenital Malformations
21 0 1 0 0 0 0 1 2 1 2 1 3 0 10Anemias
6 0 0 0 0 0 0 0 1 1 0 2 2 0 0Medical & Surgical Complications
1,013 2 1 1 2 2 1 13 12 42 102 123 247 1 464All Other Natural Causes
7 0 0 0 0 0 0 0 1 1 1 2 2 0 0All Other External Causes
TOTAL <1 1-4 5-9 10-14 15-19 20-24 25-34 35-44 45-54 55-64 65-74 75-84 85+ UNK
AGE GROUPS
257 3 1 1 1 1 1 4 7 21 42 68 60 0 47WAKULLA
74 0 0 0 0 0 0 2 2 13 14 22 12 0 9Cancer
40 0 0 0 0 0 0 0 1 3 7 7 13 0 9Heart Diseases
24 0 0 0 0 0 0 0 0 1 4 6 7 0 6Chronic Lower Resp Diseases
10 0 0 0 0 0 0 0 0 0 0 4 4 0 2Stroke
15 0 0 0 0 0 0 2 2 2 1 3 4 0 1Unintentional Injury
12 0 0 0 0 0 0 0 0 1 0 6 2 0 3Diabetes Mellitus
6 0 0 0 0 0 0 0 0 0 0 0 1 0 5Alzheimer's Disease
5 0 0 0 0 0 0 0 0 0 0 2 2 0 1Nephritis
5 0 0 0 0 1 0 0 0 1 0 1 1 0 1Suicide
6 0 0 0 0 0 0 0 1 0 3 2 0 0 0Chronic Liver Disease/Cirrhosis
1 0 0 0 0 0 0 0 0 0 1 0 0 0 0Influenza & Pneumonia
3 0 0 0 0 0 0 0 0 0 1 1 1 0 0Hypertension
0 0 0 0 0 0 0 0 0 0 0 0 0 0 0Septicemia
1 0 0 0 0 0 0 0 0 0 0 0 1 0 0Parkinson's Disease
3 0 0 0 0 0 0 0 1 0 0 1 1 0 0Benign Neoplasms
0 0 0 0 0 0 0 0 0 0 0 0 0 0 0Homicide
2 0 0 0 0 0 0 0 0 0 1 1 0 0 0Pneumonitis
1 0 0 0 0 0 0 0 0 0 0 0 1 0 0Human Immunodeficiency Virus
2 2 0 0 0 0 0 0 0 0 0 0 0 0 0Perinatal Period Conditions
2 0 0 0 0 0 0 0 0 0 0 1 0 0 1Aortic Aneurysm & Dissection
1 0 0 0 0 0 0 0 0 0 1 0 0 0 0Atherosclerosis
1 0 0 0 0 0 0 0 0 0 1 0 0 0 0Viral Hepatitis
2 1 0 0 0 0 1 0 0 0 0 0 0 0 0Congenital Malformations
2 0 0 0 0 0 0 0 0 0 0 2 0 0 0Anemias
0 0 0 0 0 0 0 0 0 0 0 0 0 0 0Medical & Surgical Complications
38 0 1 1 1 0 0 0 0 0 8 9 9 0 9All Other Natural Causes
0 0 0 0 0 0 0 0 0 0 0 0 0 0 0All Other External Causes
* ICD-10 codes associated with each cause of death group are presented on pages (xvii-xix).
160 FLORIDA VITAL STATISTICS ANNUAL REPORT 2013

TABLE D-11 (Cont.): RESIDENT DEATHS FOR SELECTED CAUSES*, BY AGE GROUPS, BY COUNTY, FLORIDA, 2013
TOTAL <1 1-4 5-9 10-14 15-19 20-24 25-34 35-44 45-54 55-64 65-74 75-84 85+ UNK
AGE GROUPS
568 6 0 2 1 2 2 9 13 45 91 130 139 1 127WALTON
131 0 0 0 0 0 0 0 0 12 31 46 28 0 14Cancer
139 1 0 0 0 0 0 0 0 11 18 29 34 0 46Heart Diseases
50 0 0 1 0 0 0 0 0 2 8 14 11 0 14Chronic Lower Resp Diseases
20 0 0 0 0 0 0 0 0 1 3 4 6 0 6Stroke
28 0 0 1 1 2 2 4 5 2 4 2 1 0 4Unintentional Injury
17 0 0 0 0 0 0 0 0 2 1 5 7 0 2Diabetes Mellitus
12 0 0 0 0 0 0 0 0 0 0 0 2 0 10Alzheimer's Disease
8 0 0 0 0 0 0 0 0 0 0 2 4 0 2Nephritis
13 0 0 0 0 0 0 3 0 4 2 3 1 0 0Suicide
11 0 0 0 0 0 0 0 1 3 3 1 2 0 1Chronic Liver Disease/Cirrhosis
6 0 0 0 0 0 0 0 0 0 1 0 3 0 2Influenza & Pneumonia
4 0 0 0 0 0 0 0 0 0 0 1 1 0 2Hypertension
10 0 0 0 0 0 0 0 0 0 3 3 3 1 0Septicemia
6 0 0 0 0 0 0 0 0 0 0 0 5 0 1Parkinson's Disease
6 0 0 0 0 0 0 0 1 0 3 0 0 0 2Benign Neoplasms
1 0 0 0 0 0 0 0 0 0 0 0 1 0 0Homicide
3 0 0 0 0 0 0 0 0 0 0 0 3 0 0Pneumonitis
1 0 0 0 0 0 0 0 0 0 1 0 0 0 0Human Immunodeficiency Virus
1 1 0 0 0 0 0 0 0 0 0 0 0 0 0Perinatal Period Conditions
5 0 0 0 0 0 0 0 0 0 0 0 4 0 1Aortic Aneurysm & Dissection
2 0 0 0 0 0 0 0 0 0 0 1 1 0 0Atherosclerosis
0 0 0 0 0 0 0 0 0 0 0 0 0 0 0Viral Hepatitis
2 1 0 0 0 0 0 0 0 0 0 0 0 0 1Congenital Malformations
1 0 0 0 0 0 0 0 0 0 0 0 1 0 0Anemias
0 0 0 0 0 0 0 0 0 0 0 0 0 0 0Medical & Surgical Complications
88 3 0 0 0 0 0 2 5 8 13 19 19 0 19All Other Natural Causes
2 0 0 0 0 0 0 0 1 0 0 0 1 0 0All Other External Causes
TOTAL <1 1-4 5-9 10-14 15-19 20-24 25-34 35-44 45-54 55-64 65-74 75-84 85+ UNK
AGE GROUPS
263 0 0 0 0 0 1 5 5 24 31 58 73 0 66WASHINGTON
62 0 0 0 0 0 0 0 1 5 11 25 14 0 6Cancer
68 0 0 0 0 0 0 0 1 8 4 16 20 0 19Heart Diseases
19 0 0 0 0 0 0 0 0 1 2 2 9 0 5Chronic Lower Resp Diseases
12 0 0 0 0 0 0 0 0 1 0 1 6 0 4Stroke
14 0 0 0 0 0 1 3 1 3 0 2 2 0 2Unintentional Injury
8 0 0 0 0 0 0 0 0 1 1 2 4 0 0Diabetes Mellitus
14 0 0 0 0 0 0 0 0 1 1 0 7 0 5Alzheimer's Disease
6 0 0 0 0 0 0 0 0 0 0 1 3 0 2Nephritis
1 0 0 0 0 0 0 1 0 0 0 0 0 0 0Suicide
1 0 0 0 0 0 0 0 0 1 0 0 0 0 0Chronic Liver Disease/Cirrhosis
9 0 0 0 0 0 0 0 1 1 2 0 1 0 4Influenza & Pneumonia
0 0 0 0 0 0 0 0 0 0 0 0 0 0 0Hypertension
2 0 0 0 0 0 0 0 0 0 1 1 0 0 0Septicemia
1 0 0 0 0 0 0 0 0 0 0 0 0 0 1Parkinson's Disease
1 0 0 0 0 0 0 0 0 0 0 1 0 0 0Benign Neoplasms
3 0 0 0 0 0 0 1 1 0 1 0 0 0 0Homicide
2 0 0 0 0 0 0 0 0 0 0 0 1 0 1Pneumonitis
1 0 0 0 0 0 0 0 0 0 1 0 0 0 0Human Immunodeficiency Virus
0 0 0 0 0 0 0 0 0 0 0 0 0 0 0Perinatal Period Conditions
1 0 0 0 0 0 0 0 0 0 1 0 0 0 0Aortic Aneurysm & Dissection
0 0 0 0 0 0 0 0 0 0 0 0 0 0 0Atherosclerosis
0 0 0 0 0 0 0 0 0 0 0 0 0 0 0Viral Hepatitis
2 0 0 0 0 0 0 0 0 0 2 0 0 0 0Congenital Malformations
1 0 0 0 0 0 0 0 0 1 0 0 0 0 0Anemias
0 0 0 0 0 0 0 0 0 0 0 0 0 0 0Medical & Surgical Complications
34 0 0 0 0 0 0 0 0 1 3 7 6 0 17All Other Natural Causes
0 0 0 0 0 0 0 0 0 0 0 0 0 0 0All Other External Causes
* ICD-10 codes associated with each cause of death group are presented on pages (xvii-xix).
FLORIDA VITAL STATISTICS ANNUAL REPORT 2013 161

TABLE D-12: RESIDENT DEATHS BY SELECTED CAUSES, BY COUNTY, FLORIDA, 2013
ALL
CAUSES
CANCER
HEART
DISEASE
CLRD
STROKE
UNINTENT
INJURY
DIA-
BETES
ALZ-
HEIMERS
NEPHRITIS
SUICIDE
FLORIDA 180,014 42,350 42,249 8,611 8,534 5,209 5,064 2,892 11,328 3,106
ALACHUA 1,799 446 378 85 100 72 47 31 87 28
BAKER 228 59 55 9 9 7 7 1 18 3
BAY 1,808 402 450 72 77 73 64 35 150 27
BRADFORD 292 79 70 9 12 9 4 6 23 4
BREVARD 6,481 1,628 1,451 271 293 158 237 126 426 117
BROWARD 14,144 3,381 3,664 769 584 279 361 210 716 318
CALHOUN 150 32 45 1 5 7 11 0 17 2
CHARLOTTE 2,355 541 529 110 68 51 61 29 171 50
CITRUS 2,338 545 589 184 110 63 23 42 248 15
CLAY 1,589 385 281 80 90 48 37 30 135 25
COLLIER 2,909 734 631 150 194 54 212 37 175 25
COLUMBIA 783 177 145 39 52 31 15 13 77 13
MIAMI-DADE 18,440 4,100 4,995 872 626 623 500 215 885 310
DESOTO 297 62 79 8 11 17 0 5 22 13
DIXIE 211 55 36 8 22 12 0 2 15 2
DUVAL 7,630 1,557 1,636 356 414 246 159 130 520 175
ESCAMBIA 3,125 647 676 169 120 100 130 49 190 79
FLAGLER 1,162 319 242 55 38 38 20 17 69 8
FRANKLIN 128 35 27 6 8 4 4 1 14 2
GADSDEN 496 108 103 28 22 26 12 8 17 8
GILCHRIST 184 57 33 7 13 8 0 2 12 0
GLADES 108 27 29 7 7 7 1 1 4 1
GULF 154 38 31 3 1 9 9 3 27 6
HAMILTON 138 29 35 8 8 0 6 1 9 2
HARDEE 180 43 39 4 14 13 5 4 9 4
HENDRY 285 74 56 17 25 12 10 1 17 6
HERNANDO 2,456 574 470 108 142 84 68 40 182 29
HIGHLANDS 1,480 344 334 59 67 59 14 27 148 30
HILLSBOROUGH 9,740 2,194 2,206 405 595 295 284 167 595 165
HOLMES 250 56 75 13 8 9 9 3 23 5
INDIAN RIVER 1,802 475 382 112 87 34 67 28 89 39
JACKSON 562 112 136 33 17 16 41 5 36 13
JEFFERSON 147 33 27 6 3 3 2 1 9 4
LAFAYETTE 75 13 23 2 5 9 1 0 6 2
LAKE 3,565 877 749 155 194 124 93 43 231 33
LEE 6,216 1,598 1,634 235 306 187 161 100 427 69
LEON 1,781 397 384 82 81 49 49 36 91 21
LEVY 495 120 107 26 29 22 5 12 30 6
LIBERTY 51 14 6 1 9 2 0 0 8 1
MADISON 229 54 48 12 17 3 4 4 17 8
MANATEE 3,498 814 931 179 165 62 57 69 193 104
MARION 4,716 1,110 1,190 199 264 164 157 75 352 70
MARTIN 1,877 441 373 111 76 24 54 32 155 43
MONROE 664 201 141 16 39 11 18 32 31 8
NASSAU 753 204 175 27 45 10 19 19 56 14
OKALOOSA 1,583 352 349 74 52 47 60 44 140 36
OKEECHOBEE 415 105 109 16 27 12 9 5 21 6
ORANGE 7,143 1,702 1,521 371 389 258 176 122 354 110
OSCEOLA 1,943 458 494 72 116 63 37 28 103 41
PALM BEACH 13,515 3,218 3,458 754 634 265 440 214 656 244
PASCO 5,574 1,309 1,183 293 294 176 139 92 444 96
PINELLAS 11,340 2,522 2,620 468 535 338 349 168 725 140
POLK 6,053 1,383 1,503 285 298 170 94 82 437 94
PUTNAM 933 227 170 38 42 65 19 17 94 10
SAINT JOHNS 1,639 376 339 76 83 38 35 42 113 26
SAINT LUCIE 2,866 735 638 135 119 80 88 41 223 48
SANTA ROSA 1,309 326 266 74 64 32 47 29 100 29
SARASOTA 5,078 1,289 1,056 241 194 92 131 85 298 106
SEMINOLE 2,976 732 615 153 162 111 79 61 184 54
SUMTER 1,404 416 299 71 66 39 30 24 70 16
SUWANNEE 513 122 117 19 25 12 19 7 35 7
TAYLOR 234 64 51 16 11 10 3 7 16 3
UNION 221 66 33 10 11 2 4 6 13 2
VOLUSIA 6,347 1,481 1,469 294 275 226 234 105 474 112
WAKULLA 257 74 40 10 15 12 6 5 24 5
WALTON 568 131 139 20 28 17 12 13 50 8
WASHINGTON 263 62 68 12 14 8 14 1 19 6
162 FLORIDA VITAL STATISTICS ANNUAL REPORT 2013
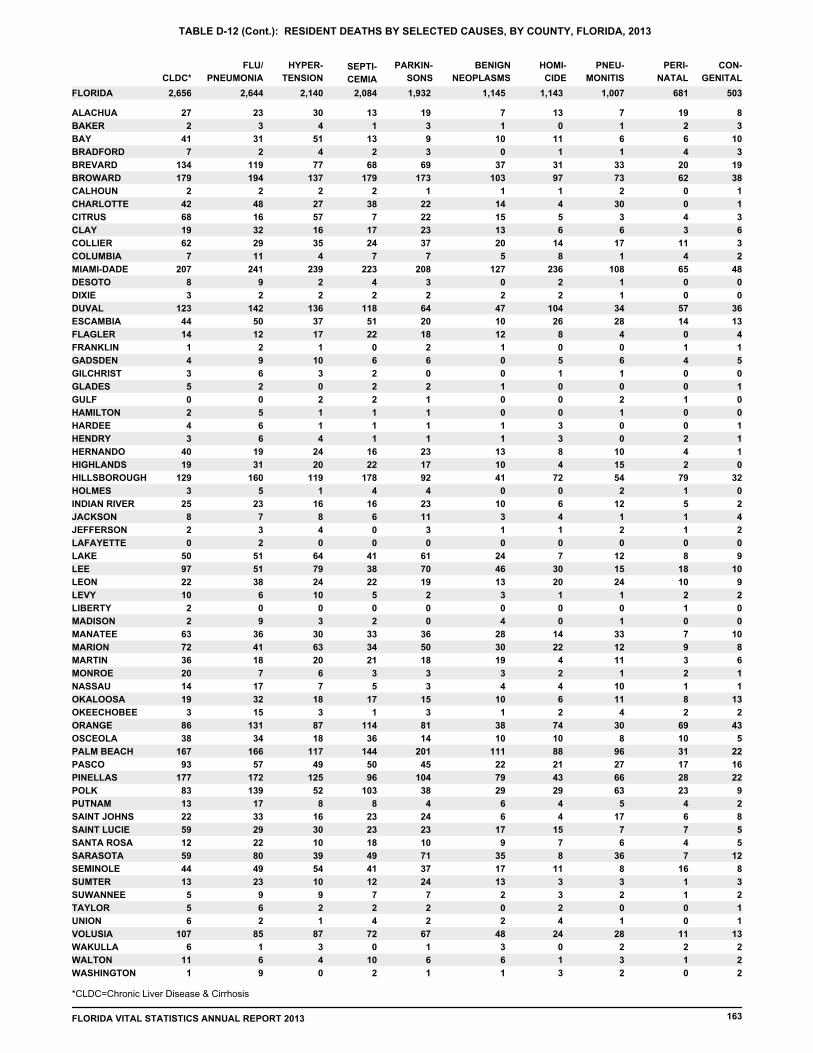
TABLE D-12 (Cont.): RESIDENT DEATHS BY SELECTED CAUSES, BY COUNTY, FLORIDA, 2013
CLDC*
FLU/
PNEUMONIA
HYPER-
TENSION
SEPTI-
CEMIA
PARKIN-
SONS
BENIGN
NEOPLASMS
HOMI-
CIDE
PNEU-
MONITIS
PERI-
NATAL
CON-
GENITAL
FLORIDA 2,656 2,644 2,140 1,932 1,145 1,143 1,007 503 2,084 681
ALACHUA 27 23 30 19 7 13 7 8 13 19
BAKER 2 3 4 3 1 0 1 3 1 2
BAY 41 31 51 9 10 11 6 10 13 6
BRADFORD 7 2 4 3 0 1 1 3 2 4
BREVARD 134 119 77 69 37 31 33 19 68 20
BROWARD 179 194 137 173 103 97 73 38 179 62
CALHOUN 2 2 2 1 1 1 2 1 2 0
CHARLOTTE 42 48 27 22 14 4 30 1 38 0
CITRUS 68 16 57 22 15 5 3 3 7 4
CLAY 19 32 16 23 13 6 6 6 17 3
COLLIER 62 29 35 37 20 14 17 3 24 11
COLUMBIA 7 11 4 7 5 8 1 2 7 4
MIAMI-DADE 207 241 239 208 127 236 108 48 223 65
DESOTO 8 9 2 3 0 2 1 0 4 0
DIXIE 3 2 2 2 2 2 1 0 2 0
DUVAL 123 142 136 64 47 104 34 36 118 57
ESCAMBIA 44 50 37 20 10 26 28 13 51 14
FLAGLER 14 12 17 18 12 8 4 4 22 0
FRANKLIN 1 2 1 2 1 0 0 1 0 1
GADSDEN 4 9 10 6 0 5 6 5 6 4
GILCHRIST 3 6 3 0 0 1 1 0 2 0
GLADES 5 2 0 2 1 0 0 1 2 0
GULF 0 0 2 1 0 0 2 0 2 1
HAMILTON 2 5 1 1 0 0 1 0 1 0
HARDEE 4 6 1 1 1 3 0 1 1 0
HENDRY 3 6 4 1 1 3 0 1 1 2
HERNANDO 40 19 24 23 13 8 10 1 16 4
HIGHLANDS 19 31 20 17 10 4 15 0 22 2
HILLSBOROUGH 129 160 119 92 41 72 54 32 178 79
HOLMES 3 5 1 4 0 0 2 0 4 1
INDIAN RIVER 25 23 16 23 10 6 12 2 16 5
JACKSON 8 7 8 11 3 4 1 4 6 1
JEFFERSON 2 3 4 3 1 1 2 2 0 1
LAFAYETTE 0 2 0 0 0 0 0 0 0 0
LAKE 50 51 64 61 24 7 12 9 41 8
LEE 97 51 79 70 46 30 15 10 38 18
LEON 22 38 24 19 13 20 24 9 22 10
LEVY 10 6 10 2 3 1 1 2 5 2
LIBERTY 2 0 0 0 0 0 0 0 0 1
MADISON 2 9 3 0 4 0 1 0 2 0
MANATEE 63 36 30 36 28 14 33 10 33 7
MARION 72 41 63 50 30 22 12 8 34 9
MARTIN 36 18 20 18 19 4 11 6 21 3
MONROE 20 7 6 3 3 2 1 1 3 2
NASSAU 14 17 7 3 4 4 10 1 5 1
OKALOOSA 19 32 18 15 10 6 11 13 17 8
OKEECHOBEE 3 15 3 3 1 2 4 2 1 2
ORANGE 86 131 87 81 38 74 30 43 114 69
OSCEOLA 38 34 18 14 10 10 8 5 36 10
PALM BEACH 167 166 117 201 111 88 96 22 144 31
PASCO 93 57 49 45 22 21 27 16 50 17
PINELLAS 177 172 125 104 79 43 66 22 96 28
POLK 83 139 52 38 29 29 63 9 103 23
PUTNAM 13 17 8 4 6 4 5 2 8 4
SAINT JOHNS 22 33 16 24 6 4 17 8 23 6
SAINT LUCIE 59 29 30 23 17 15 7 5 23 7
SANTA ROSA 12 22 10 10 9 7 6 5 18 4
SARASOTA 59 80 39 71 35 8 36 12 49 7
SEMINOLE 44 49 54 37 17 11 8 8 41 16
SUMTER 13 23 10 24 13 3 3 3 12 1
SUWANNEE 5 9 9 7 2 3 2 2 7 1
TAYLOR 5 6 2 2 0 2 0 1 2 0
UNION 6 2 1 2 2 4 1 1 4 0
VOLUSIA 107 85 87 67 48 24 28 13 72 11
WAKULLA 6 1 3 1 3 0 2 2 0 2
WALTON 11 6 4 6 6 1 3 2 10 1
WASHINGTON 1 9 0 1 1 3 2 2 2 0
*CLDC=Chronic Liver Disease & Cirrhosis
FLORIDA VITAL STATISTICS ANNUAL REPORT 2013 163
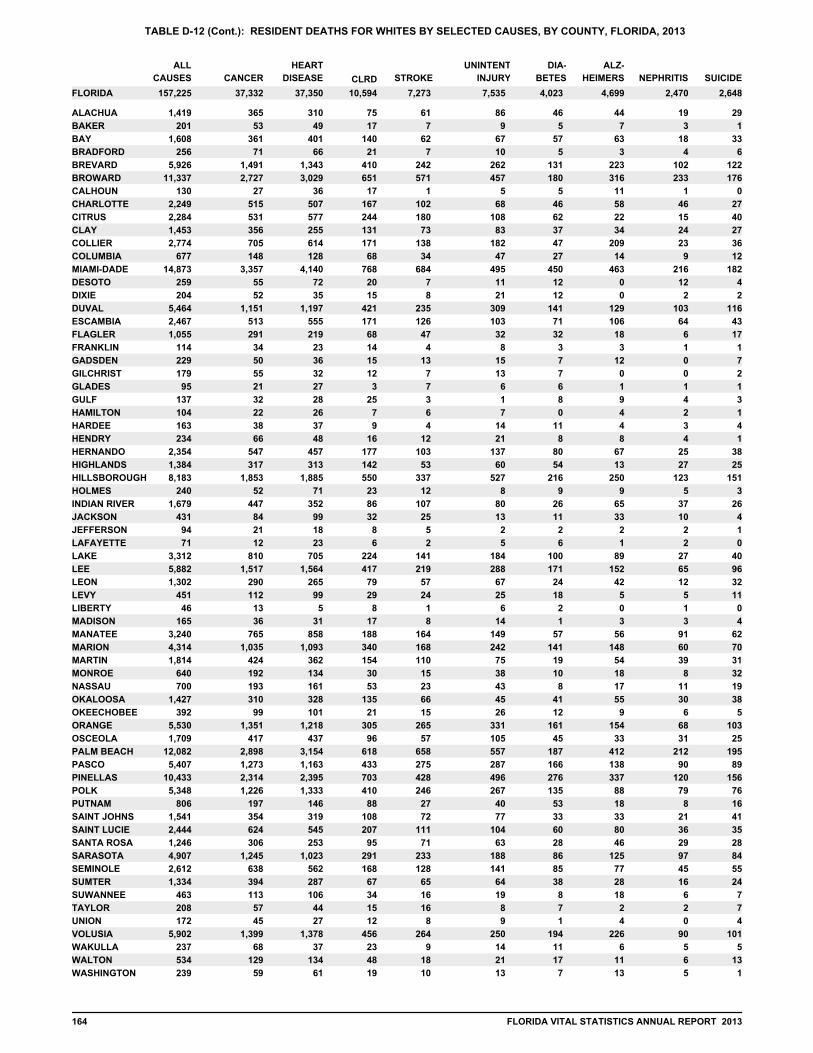
TABLE D-12 (Cont.): RESIDENT DEATHS FOR WHITES BY SELECTED CAUSES, BY COUNTY, FLORIDA, 2013
ALL
CAUSES
CANCER
HEART
DISEASE
CLRD
STROKE
UNINTENT
INJURY
DIA-
BETES
ALZ-
HEIMERS
NEPHRITIS
SUICIDE
FLORIDA 157,225 37,332 37,350 7,273 7,535 4,023 4,699 2,648 10,594 2,470
ALACHUA 1,419 365 310 61 86 46 44 29 75 19
BAKER 201 53 49 7 9 5 7 1 17 3
BAY 1,608 361 401 62 67 57 63 33 140 18
BRADFORD 256 71 66 7 10 5 3 6 21 4
BREVARD 5,926 1,491 1,343 242 262 131 223 122 410 102
BROWARD 11,337 2,727 3,029 571 457 180 316 176 651 233
CALHOUN 130 27 36 1 5 5 11 0 17 1
CHARLOTTE 2,249 515 507 102 68 46 58 27 167 46
CITRUS 2,284 531 577 180 108 62 22 40 244 15
CLAY 1,453 356 255 73 83 37 34 27 131 24
COLLIER 2,774 705 614 138 182 47 209 36 171 23
COLUMBIA 677 148 128 34 47 27 14 12 68 9
MIAMI-DADE 14,873 3,357 4,140 684 495 450 463 182 768 216
DESOTO 259 55 72 7 11 12 0 4 20 12
DIXIE 204 52 35 8 21 12 0 2 15 2
DUVAL 5,464 1,151 1,197 235 309 141 129 116 421 103
ESCAMBIA 2,467 513 555 126 103 71 106 43 171 64
FLAGLER 1,055 291 219 47 32 32 18 17 68 6
FRANKLIN 114 34 23 4 8 3 3 1 14 1
GADSDEN 229 50 36 13 15 7 12 7 15 0
GILCHRIST 179 55 32 7 13 7 0 2 12 0
GLADES 95 21 27 7 6 6 1 1 3 1
GULF 137 32 28 3 1 8 9 3 25 4
HAMILTON 104 22 26 6 7 0 4 1 7 2
HARDEE 163 38 37 4 14 11 4 4 9 3
HENDRY 234 66 48 12 21 8 8 1 16 4
HERNANDO 2,354 547 457 103 137 80 67 38 177 25
HIGHLANDS 1,384 317 313 53 60 54 13 25 142 27
HILLSBOROUGH 8,183 1,853 1,885 337 527 216 250 151 550 123
HOLMES 240 52 71 12 8 9 9 3 23 5
INDIAN RIVER 1,679 447 352 107 80 26 65 26 86 37
JACKSON 431 84 99 25 13 11 33 4 32 10
JEFFERSON 94 21 18 5 2 2 2 1 8 2
LAFAYETTE 71 12 23 2 5 6 1 0 6 2
LAKE 3,312 810 705 141 184 100 89 40 224 27
LEE 5,882 1,517 1,564 219 288 171 152 96 417 65
LEON 1,302 290 265 57 67 24 42 32 79 12
LEVY 451 112 99 24 25 18 5 11 29 5
LIBERTY 46 13 5 1 6 2 0 0 8 1
MADISON 165 36 31 8 14 1 3 4 17 3
MANATEE 3,240 765 858 164 149 57 56 62 188 91
MARION 4,314 1,035 1,093 168 242 141 148 70 340 60
MARTIN 1,814 424 362 110 75 19 54 31 154 39
MONROE 640 192 134 15 38 10 18 32 30 8
NASSAU 700 193 161 23 43 8 17 19 53 11
OKALOOSA 1,427 310 328 66 45 41 55 38 135 30
OKEECHOBEE 392 99 101 15 26 12 9 5 21 6
ORANGE 5,530 1,351 1,218 265 331 161 154 103 305 68
OSCEOLA 1,709 417 437 57 105 45 33 25 96 31
PALM BEACH 12,082 2,898 3,154 658 557 187 412 195 618 212
PASCO 5,407 1,273 1,163 275 287 166 138 89 433 90
PINELLAS 10,433 2,314 2,395 428 496 276 337 156 703 120
POLK 5,348 1,226 1,333 246 267 135 88 76 410 79
PUTNAM 806 197 146 27 40 53 18 16 88 8
SAINT JOHNS 1,541 354 319 72 77 33 33 41 108 21
SAINT LUCIE 2,444 624 545 111 104 60 80 35 207 36
SANTA ROSA 1,246 306 253 71 63 28 46 28 95 29
SARASOTA 4,907 1,245 1,023 233 188 86 125 84 291 97
SEMINOLE 2,612 638 562 128 141 85 77 55 168 45
SUMTER 1,334 394 287 65 64 38 28 24 67 16
SUWANNEE 463 113 106 16 19 8 18 7 34 6
TAYLOR 208 57 44 16 8 7 2 7 15 2
UNION 172 45 27 8 9 1 4 4 12 0
VOLUSIA 5,902 1,399 1,378 264 250 194 226 101 456 90
WAKULLA 237 68 37 9 14 11 6 5 23 5
WALTON 534 129 134 18 21 17 11 13 48 6
WASHINGTON 239 59 61 10 13 7 13 1 19 5
164 FLORIDA VITAL STATISTICS ANNUAL REPORT 2013

TABLE D-12 (Cont.): RESIDENT DEATHS FOR WHITES BY SELECTED CAUSES, BY COUNTY, FLORIDA, 2013
CLDC*
FLU/
PNEUMONIA
HYPER-
TENSION
SEPTI-
CEMIA
PARKIN-
SONS
BENIGN
NEOPLASMS
HOMI-
CIDE
PNEU-
MONITIS
PERI-
NATAL
CON-
GENITAL
FLORIDA 2,459 2,260 1,709 1,817 1,028 521 898 364 1,719 336
ALACHUA 24 16 21 17 6 4 3 4 6 10
BAKER 2 3 2 2 1 0 0 2 1 2
BAY 40 29 47 9 10 8 6 8 10 4
BRADFORD 6 2 3 3 0 0 1 3 1 2
BREVARD 126 111 70 60 32 16 30 17 63 13
BROWARD 163 160 93 156 90 32 66 17 130 12
CALHOUN 2 1 2 1 1 0 2 1 1 0
CHARLOTTE 42 45 26 22 13 3 29 1 36 0
CITRUS 66 16 55 21 14 5 3 3 7 4
CLAY 19 26 13 22 10 4 5 5 17 2
COLLIER 60 27 35 37 19 5 16 3 19 9
COLUMBIA 7 10 3 7 5 3 1 2 5 3
MIAMI-DADE 177 193 169 191 107 82 87 33 169 29
DESOTO 8 9 1 3 0 0 1 0 4 0
DIXIE 3 2 2 2 2 2 1 0 2 0
DUVAL 108 99 72 52 39 36 26 23 67 21
ESCAMBIA 33 35 22 17 6 12 24 8 38 4
FLAGLER 13 11 16 18 11 6 4 4 22 0
FRANKLIN 1 2 1 2 1 0 0 1 0 0
GADSDEN 3 6 2 4 0 0 3 1 3 0
GILCHRIST 3 6 3 0 0 1 1 0 2 0
GLADES 3 2 0 2 1 0 0 1 2 0
GULF 0 0 2 1 0 0 2 0 2 1
HAMILTON 2 5 0 0 0 0 0 0 0 0
HARDEE 3 5 1 1 1 3 0 1 1 0
HENDRY 2 5 2 1 0 2 0 1 0 0
HERNANDO 38 17 22 23 12 8 10 0 15 3
HIGHLANDS 18 31 19 17 9 1 14 0 20 1
HILLSBOROUGH 117 126 92 83 32 38 45 22 140 43
HOLMES 3 5 1 4 0 0 2 0 4 1
INDIAN RIVER 25 23 16 22 9 4 12 1 14 1
JACKSON 8 6 4 11 2 2 1 2 4 0
JEFFERSON 1 2 2 3 1 0 1 0 0 0
LAFAYETTE 0 2 0 0 0 0 0 0 0 0
LAKE 49 48 57 59 22 6 12 8 38 6
LEE 92 49 73 64 45 17 13 9 36 8
LEON 18 26 14 16 9 4 21 7 15 4
LEVY 10 6 6 1 3 1 1 2 3 2
LIBERTY 2 0 0 0 0 0 0 0 0 1
MADISON 2 6 0 0 4 0 1 0 0 0
MANATEE 62 34 21 35 28 7 32 8 28 3
MARION 66 35 52 49 28 15 12 6 31 5
MARTIN 35 17 19 18 19 3 10 5 21 3
MONROE 20 7 5 3 3 2 1 1 3 1
NASSAU 13 14 6 3 4 4 10 1 4 0
OKALOOSA 19 30 16 15 9 3 9 13 14 3
OKEECHOBEE 3 14 3 3 1 2 4 2 1 2
ORANGE 76 90 64 76 31 27 26 26 82 28
OSCEOLA 32 31 17 12 9 7 7 4 32 5
PALM BEACH 157 144 98 194 106 31 86 15 131 16
PASCO 89 54 45 45 21 17 27 14 48 16
PINELLAS 164 152 110 103 74 31 62 17 92 16
POLK 78 120 43 35 25 11 56 9 89 14
PUTNAM 13 14 8 4 6 1 5 1 8 1
SAINT JOHNS 22 32 14 23 6 4 16 7 21 5
SAINT LUCIE 58 24 20 21 14 5 7 4 22 3
SANTA ROSA 11 21 10 10 9 6 6 5 17 3
SARASOTA 56 79 37 70 33 6 34 12 47 5
SEMINOLE 39 41 46 36 12 5 8 5 32 8
SUMTER 11 22 7 24 12 2 3 2 11 1
SUWANNEE 5 9 9 7 2 3 2 1 6 1
TAYLOR 4 6 2 2 0 1 0 1 2 0
UNION 6 1 1 2 2 4 1 1 4 0
VOLUSIA 101 80 80 66 47 14 23 11 66 9
WAKULLA 6 1 3 1 3 0 2 1 0 2
WALTON 11 6 3 6 6 1 3 1 8 0
WASHINGTON 1 8 0 0 1 3 2 1 2 0
*CLDC=Chronic Liver Disease & Cirrhosis
FLORIDA VITAL STATISTICS ANNUAL REPORT 2013 165

TABLE D-12 (Cont.): RESIDENT DEATHS FOR BLACKS BY SELECTED CAUSES, BY COUNTY, FLORIDA, 2013
ALL
CAUSES
CANCER
HEART
DISEASE
CLRD
STROKE
UNINTENT
INJURY
DIA-
BETES
ALZ-
HEIMERS
NEPHRITIS
SUICIDE
FLORIDA 19,432 4,232 4,199 1,129 799 1,058 301 156 607 580
ALACHUA 351 74 61 23 13 25 3 1 10 9
BAKER 25 6 6 1 0 1 0 0 1 0
BAY 163 32 43 9 7 15 1 1 8 8
BRADFORD 35 7 4 2 2 4 1 0 2 0
BREVARD 447 111 92 23 24 25 11 2 10 12
BROWARD 2,296 550 504 167 101 86 29 17 51 74
CALHOUN 18 5 7 0 0 2 0 0 0 1
CHARLOTTE 83 22 15 7 0 4 2 1 4 4
CITRUS 30 8 7 3 1 1 1 1 2 0
CLAY 93 15 20 4 4 8 1 2 2 0
COLLIER 99 20 14 11 8 4 1 1 1 2
COLUMBIA 99 29 15 5 3 4 1 1 9 4
MIAMI-DADE 3,226 661 769 175 116 158 33 29 105 88
DESOTO 37 7 7 1 0 5 0 1 2 1
DIXIE 5 1 1 0 1 0 0 0 0 0
DUVAL 1,975 360 405 106 89 96 28 12 88 69
ESCAMBIA 576 117 109 38 13 27 21 2 15 13
FLAGLER 87 24 19 6 4 6 2 0 1 2
FRANKLIN 13 1 4 2 0 1 1 0 0 1
GADSDEN 265 58 67 15 7 19 0 0 2 7
GILCHRIST 5 2 1 0 0 1 0 0 0 0
GLADES 7 4 1 0 1 0 0 0 1 0
GULF 13 5 2 0 0 0 0 0 1 2
HAMILTON 33 7 8 2 1 0 2 0 2 0
HARDEE 14 4 2 0 0 2 1 0 0 0
HENDRY 44 8 8 5 1 4 2 0 1 2
HERNANDO 66 12 10 4 3 4 1 1 2 3
HIGHLANDS 76 23 18 5 5 3 1 2 5 2
HILLSBOROUGH 1,302 280 274 60 51 68 29 5 33 39
HOLMES 7 4 2 1 0 0 0 0 0 0
INDIAN RIVER 103 22 24 5 7 7 2 2 3 2
JACKSON 125 28 34 7 4 5 8 1 4 3
JEFFERSON 52 12 9 1 1 1 0 0 1 2
LAFAYETTE 4 1 0 0 0 3 0 0 0 0
LAKE 207 55 34 13 9 19 3 1 5 6
LEE 274 70 54 14 12 14 7 4 9 4
LEON 441 101 109 25 13 23 7 1 12 8
LEVY 43 8 8 2 3 4 0 1 1 1
LIBERTY 5 1 1 0 3 0 0 0 0 0
MADISON 64 18 17 4 3 2 1 0 0 5
MANATEE 219 35 65 12 13 5 1 4 5 12
MARION 348 65 85 23 17 21 8 4 11 10
MARTIN 56 14 10 1 0 5 0 1 1 4
MONROE 20 8 7 1 0 1 0 0 0 0
NASSAU 47 10 13 4 2 2 2 0 2 3
OKALOOSA 97 24 9 6 4 6 5 3 3 6
OKEECHOBEE 17 3 7 1 0 0 0 0 0 0
ORANGE 1,331 292 243 84 44 84 18 13 38 39
OSCEOLA 169 26 41 13 8 15 2 1 6 7
PALM BEACH 1,185 260 249 77 63 70 25 10 30 29
PASCO 100 23 12 8 4 8 0 2 5 3
PINELLAS 738 170 194 22 32 56 10 7 18 16
POLK 634 139 154 31 28 30 5 4 25 15
PUTNAM 117 25 24 11 2 11 1 1 5 2
SAINT JOHNS 80 17 17 3 4 4 1 1 5 5
SAINT LUCIE 365 98 83 18 13 16 6 4 14 12
SANTA ROSA 48 15 10 2 0 4 1 1 3 0
SARASOTA 134 34 27 6 4 6 5 1 6 8
SEMINOLE 283 69 40 17 17 20 1 4 13 8
SUMTER 57 17 11 5 1 1 1 0 3 0
SUWANNEE 43 8 9 2 3 4 1 0 1 1
TAYLOR 23 6 7 0 3 3 0 0 1 1
UNION 48 20 6 2 2 1 0 2 1 2
VOLUSIA 387 71 77 28 17 31 6 4 15 21
WAKULLA 19 6 2 1 1 1 0 0 1 0
WALTON 26 1 4 2 5 0 1 0 2 1
WASHINGTON 24 3 7 2 1 1 1 0 0 1
166 FLORIDA VITAL STATISTICS ANNUAL REPORT 2013
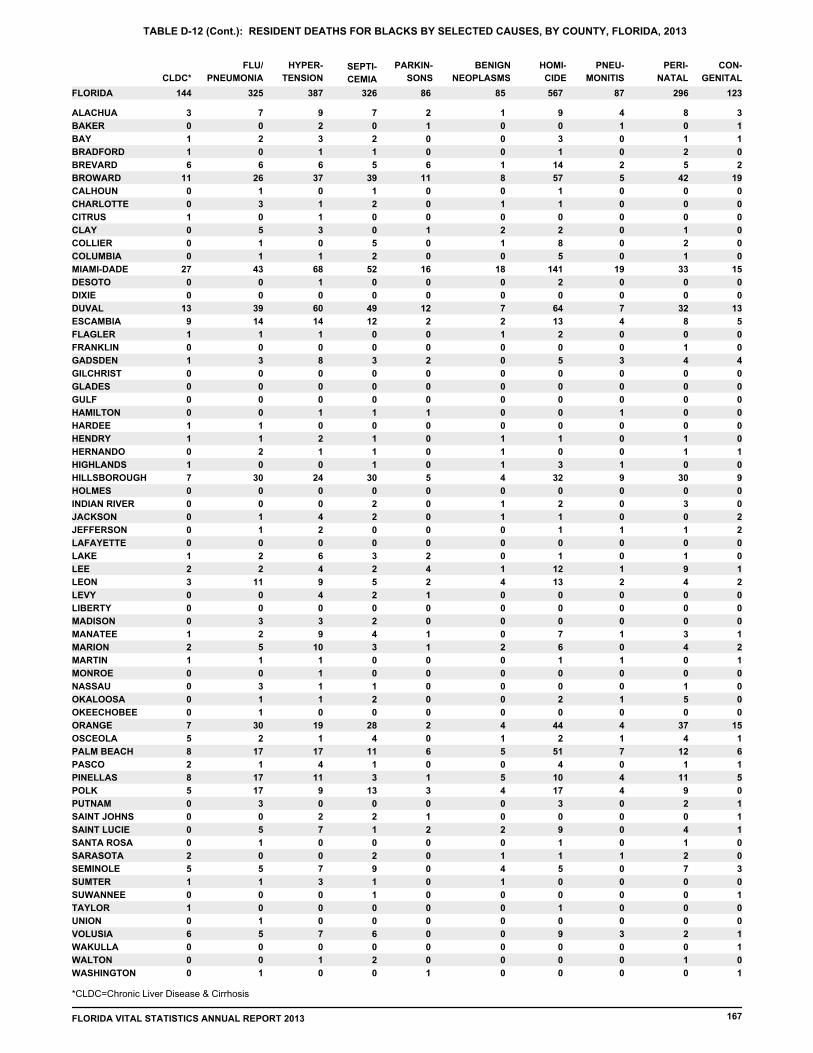
TABLE D-12 (Cont.): RESIDENT DEATHS FOR BLACKS BY SELECTED CAUSES, BY COUNTY, FLORIDA, 2013
CLDC*
FLU/
PNEUMONIA
HYPER-
TENSION
SEPTI-
CEMIA
PARKIN-
SONS
BENIGN
NEOPLASMS
HOMI-
CIDE
PNEU-
MONITIS
PERI-
NATAL
CON-
GENITAL
FLORIDA 144 325 387 86 85 567 87 123 326 296
ALACHUA 3 7 9 2 1 9 4 3 7 8
BAKER 0 0 2 1 0 0 1 1 0 0
BAY 1 2 3 0 0 3 0 1 2 1
BRADFORD 1 0 1 0 0 1 0 0 1 2
BREVARD 6 6 6 6 1 14 2 2 5 5
BROWARD 11 26 37 11 8 57 5 19 39 42
CALHOUN 0 1 0 0 0 1 0 0 1 0
CHARLOTTE 0 3 1 0 1 1 0 0 2 0
CITRUS 1 0 1 0 0 0 0 0 0 0
CLAY 0 5 3 1 2 2 0 0 0 1
COLLIER 0 1 0 0 1 8 0 0 5 2
COLUMBIA 0 1 1 0 0 5 0 0 2 1
MIAMI-DADE 27 43 68 16 18 141 19 15 52 33
DESOTO 0 0 1 0 0 2 0 0 0 0
DIXIE 0 0 0 0 0 0 0 0 0 0
DUVAL 13 39 60 12 7 64 7 13 49 32
ESCAMBIA 9 14 14 2 2 13 4 5 12 8
FLAGLER 1 1 1 0 1 2 0 0 0 0
FRANKLIN 0 0 0 0 0 0 0 0 0 1
GADSDEN 1 3 8 2 0 5 3 4 3 4
GILCHRIST 0 0 0 0 0 0 0 0 0 0
GLADES 0 0 0 0 0 0 0 0 0 0
GULF 0 0 0 0 0 0 0 0 0 0
HAMILTON 0 0 1 1 0 0 1 0 1 0
HARDEE 1 1 0 0 0 0 0 0 0 0
HENDRY 1 1 2 0 1 1 0 0 1 1
HERNANDO 0 2 1 0 1 0 0 1 1 1
HIGHLANDS 1 0 0 0 1 3 1 0 1 0
HILLSBOROUGH 7 30 24 5 4 32 9 9 30 30
HOLMES 0 0 0 0 0 0 0 0 0 0
INDIAN RIVER 0 0 0 0 1 2 0 0 2 3
JACKSON 0 1 4 0 1 1 0 2 2 0
JEFFERSON 0 1 2 0 0 1 1 2 0 1
LAFAYETTE 0 0 0 0 0 0 0 0 0 0
LAKE 1 2 6 2 0 1 0 0 3 1
LEE 2 2 4 4 1 12 1 1 2 9
LEON 3 11 9 2 4 13 2 2 5 4
LEVY 0 0 4 1 0 0 0 0 2 0
LIBERTY 0 0 0 0 0 0 0 0 0 0
MADISON 0 3 3 0 0 0 0 0 2 0
MANATEE 1 2 9 1 0 7 1 1 4 3
MARION 2 5 10 1 2 6 0 2 3 4
MARTIN 1 1 1 0 0 1 1 1 0 0
MONROE 0 0 1 0 0 0 0 0 0 0
NASSAU 0 3 1 0 0 0 0 0 1 1
OKALOOSA 0 1 1 0 0 2 1 0 2 5
OKEECHOBEE 0 1 0 0 0 0 0 0 0 0
ORANGE 7 30 19 2 4 44 4 15 28 37
OSCEOLA 5 2 1 0 1 2 1 1 4 4
PALM BEACH 8 17 17 6 5 51 7 6 11 12
PASCO 2 1 4 0 0 4 0 1 1 1
PINELLAS 8 17 11 1 5 10 4 5 3 11
POLK 5 17 9 3 4 17 4 0 13 9
PUTNAM 0 3 0 0 0 3 0 1 0 2
SAINT JOHNS 0 0 2 1 0 0 0 1 2 0
SAINT LUCIE 0 5 7 2 2 9 0 1 1 4
SANTA ROSA 0 1 0 0 0 1 0 0 0 1
SARASOTA 2 0 0 0 1 1 1 0 2 2
SEMINOLE 5 5 7 0 4 5 0 3 9 7
SUMTER 1 1 3 0 1 0 0 0 1 0
SUWANNEE 0 0 0 0 0 0 0 1 1 0
TAYLOR 1 0 0 0 0 1 0 0 0 0
UNION 0 1 0 0 0 0 0 0 0 0
VOLUSIA 6 5 7 0 0 9 3 1 6 2
WAKULLA 0 0 0 0 0 0 0 1 0 0
WALTON 0 0 1 0 0 0 0 0 2 1
WASHINGTON 0 1 0 1 0 0 0 1 0 0
*CLDC=Chronic Liver Disease & Cirrhosis
FLORIDA VITAL STATISTICS ANNUAL REPORT 2013 167

TABLE D-12 (Cont.): RESIDENT DEATHS FOR OTHERS BY SELECTED CAUSES, BY COUNTY, FLORIDA, 2013
ALL
CAUSES
CANCER
HEART
DISEASE
CLRD
STROKE
UNINTENT
INJURY
DIA-
BETES
ALZ-
HEIMERS
NEPHRITIS
SUICIDE
FLORIDA 3,184 757 660 196 179 126 61 80 123 54
ALACHUA 28 7 7 1 1 1 0 1 2 0
BAKER 2 0 0 1 0 1 0 0 0 0
BAY 34 8 5 1 3 1 0 1 2 1
BRADFORD 1 1 0 0 0 0 0 0 0 0
BREVARD 101 25 15 5 6 2 3 1 6 3
BROWARD 486 99 126 31 24 13 15 14 14 10
CALHOUN 2 0 2 0 0 0 0 0 0 0
CHARLOTTE 22 4 6 1 0 1 1 1 0 0
CITRUS 23 6 4 1 1 0 0 1 2 0
CLAY 43 14 6 3 3 3 2 1 2 1
COLLIER 33 8 3 1 3 3 2 0 2 0
COLUMBIA 7 0 2 0 2 0 0 0 0 0
MIAMI-DADE 316 78 83 11 9 14 4 3 11 6
DESOTO 1 0 0 0 0 0 0 0 0 0
DIXIE 2 2 0 0 0 0 0 0 0 0
DUVAL 183 45 34 15 14 9 1 2 11 3
ESCAMBIA 78 15 12 4 4 2 3 4 4 2
FLAGLER 18 3 4 2 2 0 0 0 0 0
FRANKLIN 1 0 0 0 0 0 0 0 0 0
GADSDEN 2 0 0 0 0 0 0 1 0 1
GILCHRIST 0 0 0 0 0 0 0 0 0 0
GLADES 6 2 1 0 0 1 0 0 0 0
GULF 3 1 0 0 0 1 0 0 1 0
HAMILTON 1 0 1 0 0 0 0 0 0 0
HARDEE 3 1 0 0 0 0 0 0 0 1
HENDRY 7 0 0 0 3 0 0 0 0 0
HERNANDO 35 15 3 1 2 0 0 1 3 1
HIGHLANDS 20 4 3 1 2 2 0 0 1 1
HILLSBOROUGH 245 60 44 7 17 11 5 10 12 3
HOLMES 3 0 2 0 0 0 0 0 0 0
INDIAN RIVER 16 5 4 0 0 1 0 0 0 0
JACKSON 5 0 2 1 0 0 0 0 0 0
JEFFERSON 0 0 0 0 0 0 0 0 0 0
LAFAYETTE 0 0 0 0 0 0 0 0 0 0
LAKE 43 12 10 1 1 5 1 2 2 0
LEE 56 8 15 2 6 2 2 0 1 0
LEON 36 6 9 0 1 1 0 3 0 1
LEVY 1 0 0 0 1 0 0 0 0 0
LIBERTY 0 0 0 0 0 0 0 0 0 0
MADISON 0 0 0 0 0 0 0 0 0 0
MANATEE 35 13 7 2 2 0 0 3 0 1
MARION 51 9 12 6 5 2 1 1 1 0
MARTIN 7 3 1 0 1 0 0 0 0 0
MONROE 4 1 0 0 1 0 0 0 1 0
NASSAU 6 1 1 0 0 0 0 0 1 0
OKALOOSA 56 16 11 2 3 0 0 3 2 0
OKEECHOBEE 5 3 1 0 0 0 0 0 0 0
ORANGE 273 58 59 21 13 13 4 6 10 3
OSCEOLA 65 15 16 2 3 3 2 2 1 3
PALM BEACH 235 59 49 19 11 8 3 9 7 3
PASCO 62 13 7 8 2 2 1 0 6 3
PINELLAS 159 38 29 17 5 6 1 5 4 3
POLK 66 17 16 7 3 5 1 1 2 0
PUTNAM 9 4 0 0 0 1 0 0 1 0
SAINT JOHNS 18 5 3 1 2 1 1 0 0 0
SAINT LUCIE 57 13 10 6 2 4 2 2 2 0
SANTA ROSA 15 5 3 1 1 0 0 0 2 0
SARASOTA 35 10 6 2 2 0 1 0 1 1
SEMINOLE 79 25 13 8 4 6 1 2 3 1
SUMTER 12 5 1 1 1 0 1 0 0 0
SUWANNEE 7 1 2 1 3 0 0 0 0 0
TAYLOR 3 1 0 0 0 0 1 0 0 0
UNION 1 1 0 0 0 0 0 0 0 0
VOLUSIA 52 11 8 2 8 1 2 0 3 1
WAKULLA 1 0 1 0 0 0 0 0 0 0
WALTON 8 1 1 0 2 0 0 0 0 1
WASHINGTON 0 0 0 0 0 0 0 0 0 0
168 FLORIDA VITAL STATISTICS ANNUAL REPORT 2013

TABLE D-12 (Cont.): RESIDENT DEATHS FOR OTHERS BY SELECTED CAUSES, BY COUNTY, FLORIDA, 2013
CLDC*
FLU/
PNEUMONIA
HYPER-
TENSION
SEPTI-
CEMIA
PARKIN-
SONS
BENIGN
NEOPLASMS
HOMI-
CIDE
PNEU-
MONITIS
PERI-
NATAL
CON-
GENITAL
FLORIDA 51 57 43 29 30 48 19 16 39 47
ALACHUA 0 0 0 0 0 0 0 1 0 1
BAKER 0 0 0 0 0 0 0 0 0 0
BAY 0 0 1 0 0 0 0 1 1 1
BRADFORD 0 0 0 0 0 0 0 0 0 0
BREVARD 2 2 1 3 4 0 1 0 0 2
BROWARD 5 8 7 6 4 6 2 2 10 6
CALHOUN 0 0 0 0 0 0 0 0 0 0
CHARLOTTE 0 0 0 0 0 0 1 0 0 0
CITRUS 1 0 1 1 1 0 0 0 0 0
CLAY 0 1 0 0 1 0 1 1 0 0
COLLIER 2 1 0 0 0 1 1 0 0 0
COLUMBIA 0 0 0 0 0 0 0 0 0 0
MIAMI-DADE 3 5 2 1 2 12 1 0 2 3
DESOTO 0 0 0 0 0 0 0 0 0 0
DIXIE 0 0 0 0 0 0 0 0 0 0
DUVAL 1 3 4 0 1 4 1 0 2 4
ESCAMBIA 2 1 1 1 1 1 0 0 1 2
FLAGLER 0 0 0 0 0 0 0 0 0 0
FRANKLIN 0 0 0 0 0 0 0 0 0 0
GADSDEN 0 0 0 0 0 0 0 0 0 0
GILCHRIST 0 0 0 0 0 0 0 0 0 0
GLADES 2 0 0 0 0 0 0 0 0 0
GULF 0 0 0 0 0 0 0 0 0 0
HAMILTON 0 0 0 0 0 0 0 0 0 0
HARDEE 0 0 0 0 0 0 0 0 0 0
HENDRY 0 0 0 0 0 0 0 0 0 1
HERNANDO 2 0 1 0 0 0 0 0 0 0
HIGHLANDS 0 0 1 0 0 0 0 0 1 1
HILLSBOROUGH 5 4 3 4 5 2 0 1 8 6
HOLMES 0 0 0 0 0 0 0 0 0 0
INDIAN RIVER 0 0 0 1 0 0 0 1 0 1
JACKSON 0 0 0 0 0 1 0 0 0 1
JEFFERSON 0 0 0 0 0 0 0 0 0 0
LAFAYETTE 0 0 0 0 0 0 0 0 0 0
LAKE 0 1 1 0 2 0 0 1 0 1
LEE 3 0 2 2 0 1 1 0 0 1
LEON 1 1 1 1 0 3 1 0 2 2
LEVY 0 0 0 0 0 0 0 0 0 0
LIBERTY 0 0 0 0 0 0 0 0 0 0
MADISON 0 0 0 0 0 0 0 0 0 0
MANATEE 0 0 0 0 0 0 0 1 1 1
MARION 4 1 1 0 0 1 0 0 0 0
MARTIN 0 0 0 0 0 0 0 0 0 0
MONROE 0 0 0 0 0 0 0 0 0 1
NASSAU 1 0 0 0 0 0 0 0 0 0
OKALOOSA 0 1 1 0 1 1 1 0 1 0
OKEECHOBEE 0 0 0 0 0 0 0 0 0 0
ORANGE 3 10 4 3 3 2 0 2 4 4
OSCEOLA 1 1 0 2 0 1 0 0 0 1
PALM BEACH 2 5 2 1 0 6 3 1 2 3
PASCO 2 2 0 0 1 0 0 1 1 0
PINELLAS 5 3 4 0 0 2 0 0 1 1
POLK 0 2 0 0 0 1 2 0 1 0
PUTNAM 0 0 0 0 0 0 0 0 0 1
SAINT JOHNS 0 1 0 0 0 0 1 0 0 1
SAINT LUCIE 1 0 3 0 1 1 0 0 0 0
SANTA ROSA 1 0 0 0 0 0 0 0 1 0
SARASOTA 1 1 1 1 1 1 0 0 0 0
SEMINOLE 0 3 1 1 1 0 0 0 0 1
SUMTER 1 0 0 0 0 0 0 1 0 0
SUWANNEE 0 0 0 0 0 0 0 0 0 0
TAYLOR 0 0 0 0 0 0 0 0 0 0
UNION 0 0 0 0 0 0 0 0 0 0
VOLUSIA 0 0 0 1 1 1 2 1 0 0
WAKULLA 0 0 0 0 0 0 0 0 0 0
WALTON 0 0 0 0 0 0 0 1 0 0
WASHINGTON 0 0 0 0 0 0 0 0 0 0
*CLDC=Chronic Liver Disease & Cirrhosis
FLORIDA VITAL STATISTICS ANNUAL REPORT 2013 169

DEAD
ON
ARRIVAL
ER/OUT-
PATIENT
UNK
STATUS UNK
OTHER
SPECIFIED
PLACE
NURSING
HOMEHOSPICE DECEDENT'S
HOMEINPATIENTTOTAL
HOSPITAL
TABLE D-13: RECORDED DEATHS BY TYPE OF PLACE OF DEATH, BY COUNTY, FLORIDA, 2013
182,965 50,315 11,192 307 617 46,679 39,062 21,777 2 13,014FLORIDA
ALACHUA 3,249 1,735 2 455 566 193 139 0 8 151
BAKER 141 10 0 58 0 46 9 0 0 18
BAY 2,012 486 6 572 423 252 151 0 9 113
BRADFORD 195 18 0 79 0 54 21 0 0 23
BREVARD 6,378 1,622 1 1,972 1,057 703 632 0 6 385
BROWARD 13,924 4,297 34 3,761 2,857 922 1,127 1 20 905
CALHOUN 122 18 0 46 0 36 7 0 1 14
CHARLOTTE 2,372 596 0 591 529 395 135 0 0 126
CITRUS 2,264 281 0 666 764 325 109 0 4 115
CLAY 1,624 399 3 377 333 306 83 0 40 83
COLLIER 3,063 638 2 553 1,038 267 336 0 0 229
COLUMBIA 905 214 2 162 337 88 42 0 3 57
MIAMI-DADE 19,188 7,789 32 4,936 1,847 1,554 1,463 0 283 1,284
DESOTO 240 43 5 66 89 10 17 0 0 10
DIXIE 111 0 0 61 1 25 24 0 0 0
DUVAL 8,658 2,733 29 1,661 2,287 945 388 0 22 593
ESCAMBIA 3,898 1,249 1 816 818 464 243 0 33 274
FLAGLER 1,041 163 4 335 269 102 87 0 0 81
FRANKLIN 95 4 1 41 0 23 17 0 0 9
GADSDEN 286 5 0 160 0 45 35 0 0 41
GILCHRIST 113 0 0 40 0 64 9 0 0 0
GLADES 43 0 0 32 0 0 11 0 0 0
GULF 110 5 0 56 0 30 15 0 0 4
HAMILTON 67 0 0 34 0 12 21 0 0 0
HARDEE 106 5 1 58 2 18 7 0 0 15
HENDRY 170 14 0 68 0 50 18 0 0 20
HERNANDO 2,413 396 3 617 846 172 229 0 2 148
HIGHLANDS 1,516 273 2 382 389 276 98 0 1 95
HILLSBOROUGH 10,461 3,793 7 2,542 1,758 939 673 0 40 709
HOLMES 196 18 0 102 0 44 18 0 0 14
INDIAN RIVER 1,870 555 3 407 433 242 103 0 3 124
JACKSON 495 116 0 177 0 141 20 0 1 40
JEFFERSON 93 0 0 44 0 41 8 0 0 0
LAFAYETTE 46 0 0 16 1 18 11 0 0 0
LAKE 3,143 715 2 855 665 454 213 0 1 238
LEE 6,328 1,286 3 1,409 2,246 658 435 0 7 284
LEON 2,382 869 2 516 381 304 138 0 14 158
LEVY 393 2 0 135 179 33 35 0 0 9
LIBERTY 20 0 0 17 0 0 3 0 0 0
MADISON 154 29 0 52 0 45 10 0 0 18
MANATEE 3,512 937 27 878 771 458 277 0 7 157
MARION 4,420 812 2 1,214 1,462 409 236 0 3 282
MARTIN 1,810 312 1 432 556 313 101 0 33 62
MONROE 540 83 11 250 1 60 64 0 0 71
NASSAU 455 67 3 232 3 98 26 0 0 26
OKALOOSA 1,578 493 3 504 6 311 120 0 1 140
OKEECHOBEE 376 74 0 116 107 29 22 0 1 27
ORANGE 7,911 2,814 8 2,095 769 1,043 571 0 2 609
OSCEOLA 1,834 594 3 590 8 276 127 0 1 235
PALM BEACH 14,100 2,627 55 3,205 4,964 1,389 1,024 0 20 816
PASCO 5,411 861 2 1,427 1,869 546 433 0 1 272
PINELLAS 12,122 3,557 0 2,474 2,758 2,009 765 0 20 539
POLK 5,749 1,821 3 1,719 609 955 334 0 2 306
PUTNAM 778 114 2 261 201 72 45 0 2 81
SAINT JOHNS 1,309 165 1 363 367 259 95 1 1 57
SAINT LUCIE 2,648 602 1 727 582 355 206 0 5 170
SANTA ROSA 847 134 1 400 6 148 97 0 1 60
SARASOTA 5,157 1,302 26 1,419 825 1,019 424 0 13 129
SEMINOLE 2,993 536 0 891 779 376 263 0 2 146
SUMTER 1,683 369 1 293 740 103 60 0 0 117
SUWANNEE 304 18 2 122 1 108 24 0 0 29
TAYLOR 153 21 1 72 0 19 19 0 0 21
UNION 143 98 0 21 0 0 20 0 0 4
VOLUSIA 6,410 1,388 8 1,667 1,562 951 449 0 4 381
WAKULLA 138 0 0 86 0 43 9 0 0 0
WALTON 491 101 1 203 1 89 44 0 0 52
WASHINGTON 208 39 0 91 0 43 19 0 0 16
170 FLORIDA VITAL STATISTICS ANNUAL REPORT 2013
Top Related