


Languages
Pages
Legal


Davenport SD #207
M&O Planning Info10-29-12
Topics
•Local Effort Assistance• Historical Review
•Levy Swap Summary

Local Effort Assistance (LEA)
•Local Effort Assistance is state money paid to eligible district to match voter approved excess General Fund levies.
•These payments help school districts that have above average tax rates due to low property valuations.

One example:
•Davenport tax rate in 2012 = $4.24/1,000• Collects $975,000
•Mercer Island tax rate in 2012 = $1.43/1,000▫Collects $11,548,943

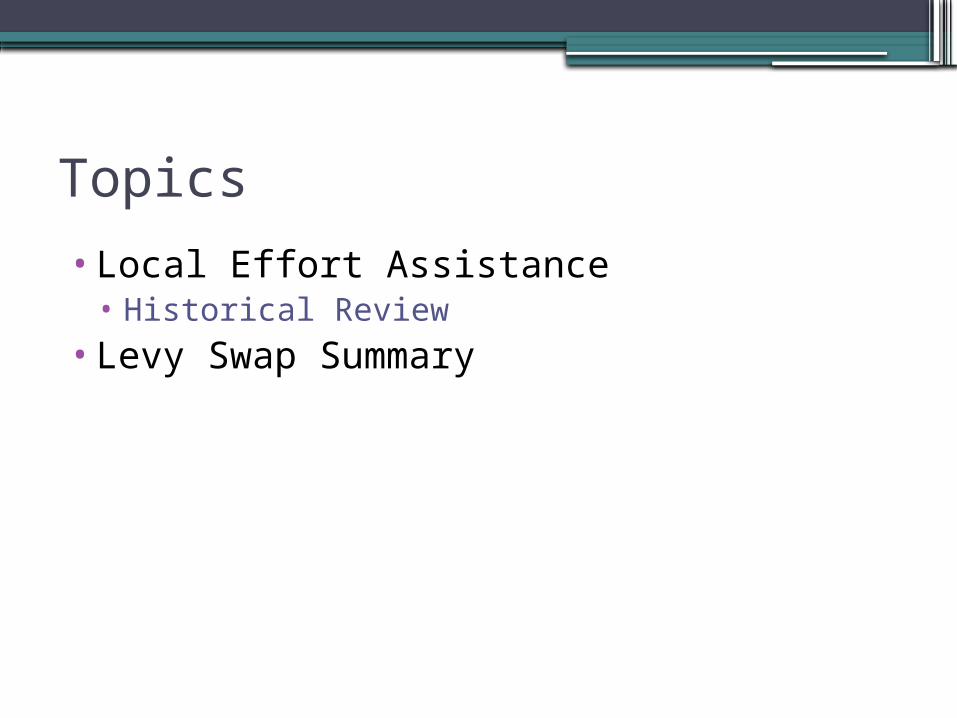
LEA – continued
•2011 = 4.23% of general fund revenues•Not protected by constitution•Davenport collected $413,898 last year•Davenport is scheduled to receive
$365,443 this year. •Approx. -$50,000

Kingcounty.gov
Headlines
•10/23/12 – “Seattle-area home values posted largest gain…” – Seattle PI
•9/15/12 – “Real Estate Rebound” –Seattle Times
•8/6/12 – “King County Home Prices up 7%...” – Seattle Times

2002 2003 2004 2005 2006 2007 2008 2009 2010 2011 2012 2013 $-
$50,000,000
$100,000,000
$150,000,000
$200,000,000
$250,000,000 Davenport SD Assessed Value Trend


2005 2006 2007 2008 2009 2010 2011 2012 2013 $-
$50,000.00
$100,000.00
$150,000.00
$200,000.00
$250,000.00
$300,000.00
$350,000.00
$400,000.00
$450,000.00
$500,000.00
Local Effort Assistance Funding

LEA cont.
•LEA Questions to Consider:▫Will the recent trend of decreasing LEA
continue?▫Will LEA funding be protected?

LEVY SWAP Summary
•Increase State School Tax by $1.17•Reduce Local Levy by $1.17•Fund collections through state
apportionment• Estimated $1 billion
•Allow districts to then collect more from local tax bases ($2,500? $3,000 per student?)

LEVY SWAP - cont.
•Davenport estimated impact:▫With no change to taxpayers
-additional $36,972 if no LEA•Additional proceeds coming from the
Bellevue/Mercer Island/Seattle/other districts▫These districts will have the ability to go
back to voters for higher levies under levy swap to create an incentive for them to ‘swap’.


LEVY SWAP - cont.
•Discussion points:▫Will it be harder to pass a levy?▫Will it extend the funding gap?▫Will this excuse funding of basic education?▫If LEA is preserved in the model?

Overview of F-196 (Annual Financial Statement

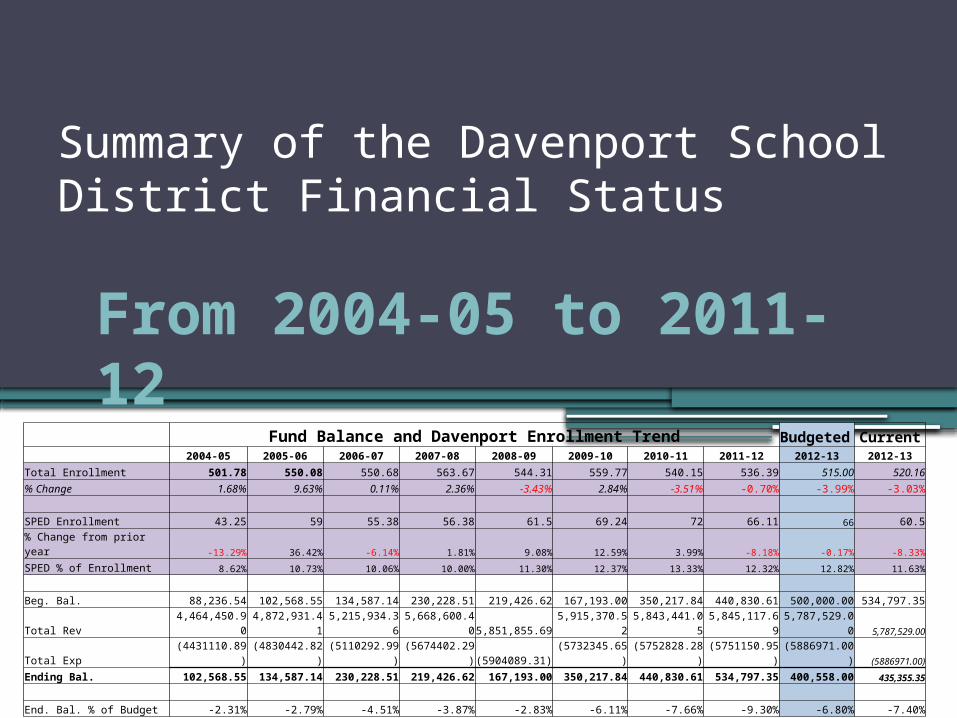
From 2004-05 to 2011-12
Summary of the Davenport School District Financial Status
Fund Balance and Davenport Enrollment Trend Budgeted Current 2004-05 2005-06 2006-07 2007-08 2008-09 2009-10 2010-11 2011-12 2012-13 2012-13
Total Enrollment 501.78 550.08 550.68 563.67 544.31 559.77 540.15 536.39 515.00 520.16
% Change 1.68% 9.63% 0.11% 2.36% -3.43% 2.84% -3.51% -0.70% -3.99% -3.03%
SPED Enrollment 43.25 59 55.38 56.38 61.5 69.24 72 66.11 66 60.5
% Change from prior year -13.29% 36.42% -6.14% 1.81% 9.08% 12.59% 3.99% -8.18% -0.17% -8.33%
SPED % of Enrollment 8.62% 10.73% 10.06% 10.00% 11.30% 12.37% 13.33% 12.32% 12.82% 11.63%
Beg. Bal. 88,236.54 102,568.55 134,587.14 230,228.51 219,426.62 167,193.00 350,217.84 440,830.61 500,000.00 534,797.35
Total Rev 4,464,450.90 4,872,931.41 5,215,934.36 5,668,600.40 5,851,855.69 5,915,370.52 5,843,441.05 5,845,117.69 5,787,529.00 5,787,529.00
Total Exp (4431110.89) (4830442.82) (5110292.99) (5674402.29) (5904089.31) (5732345.65) (5752828.28) (5751150.95) (5886971.00) (5886971.00)
Ending Bal. 102,568.55 134,587.14 230,228.51 219,426.62 167,193.00 350,217.84 440,830.61 534,797.35 400,558.00 435,355.35
End. Bal. % of Budget -2.31% -2.79% -4.51% -3.87% -2.83% -6.11% -7.66% -9.30% -6.80% -7.40%
*Estimates

School Levy97885417%
Local Effort Assistance
(LEA)$361,894
6%
Local Other1291002%
State395455768%
Federal3631246%
Davenport School District Estimated Revenues by Source
2012-13 Budget

Possible Reductions in Revenue
•Federal Funding – “Sequestration”▫9.1% cut = $ _$18,506_____Title 1Title 2Special EdOther? (SRSAP, Sped Medicaid, Fed. Food Service)

Possible Reductions in Revenue
•Enrollment ???▫Our initial forecasts are that our enrollment for 2013-14 will be slightly higher than this year…

2012-13 EnrollmentSeptember October 2013-14
Grade Budget Actual Actual EstimatedK 18 18.5 18.5 18.51 27 28 28 372 50 44 45 283 39 42 46 454 35 38 38 465 46 46 45 386 48 47 48 457 48 52 52 488 48 46 46 529 40 39.93 38.93 4610 40 40 42 38.9311 46 48.5 48.5 4212 30 28.69 25.76 48.5
Total 515 518.62 521.69 532.93
Even though it is really early to start projecting enrollment for 2013-14, by comparing our incoming first grade class and our outgoing senior class, we can estimate that enrollment could rise by approximately 11 FTE. This assumes that our kindergarten class for next year is of a similar size to this years class.

Possible Increases in Revenue
•Funding for Full-Day, Every Day K▫With the Supreme Court ruling, there may not be any cuts K-12 funding…

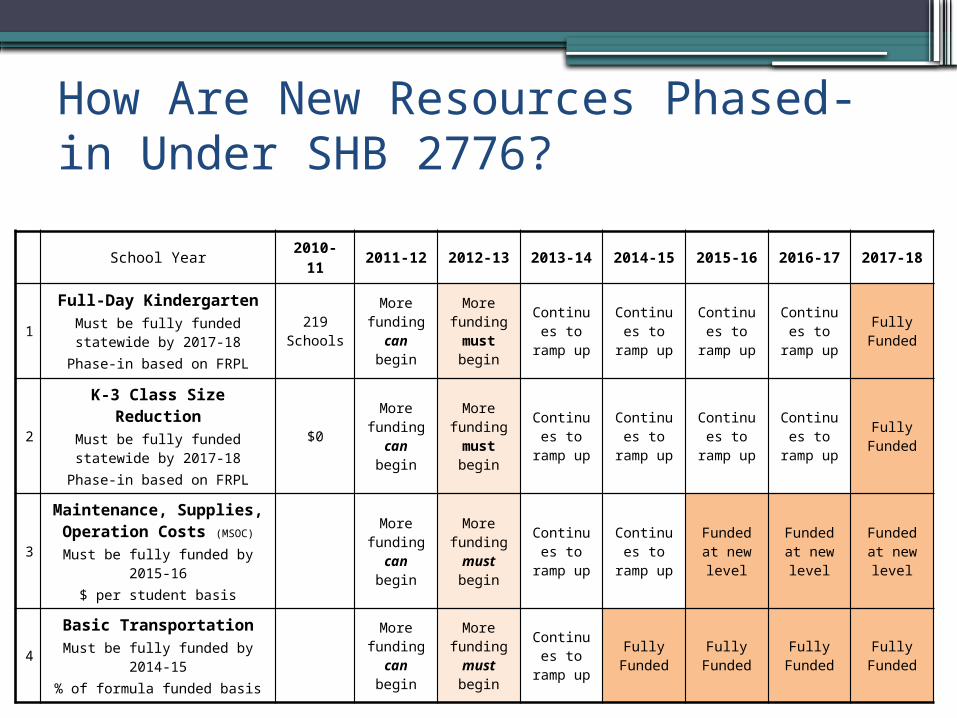
How Are New Resources Phased-in Under SHB 2776?
School Year 2010-11 2011-12 2012-13 2013-14 2014-15 2015-16 2016-17 2017-18
1
Full-Day KindergartenMust be fully funded statewide by
2017-18Phase-in based on FRPL
219 Schools
More funding can begin
More funding must begin
Continues to ramp
up
Continues to ramp
up
Continues to ramp
up
Continues to ramp
up
Fully Funded
2
K-3 Class Size ReductionMust be fully funded statewide by
2017-18Phase-in based on FRPL
$0More
funding can begin
More funding must begin
Continues to ramp
up
Continues to ramp
up
Continues to ramp
up
Continues to ramp
up
Fully Funded
3
Maintenance, Supplies, Operation Costs (MSOC)
Must be fully funded by 2015-16$ per student basis
More funding can begin
More funding must begin
Continues to ramp
up
Continues to ramp
up
Funded at new level
Funded at new level
Funded at new level
4Basic Transportation
Must be fully funded by 2014-15% of formula funded basis
More funding can begin
More funding must begin
Continues to ramp
up
Fully Funded
Fully Funded
Fully Funded
Fully Funded

Current FundingFor the 2012-13 school year, funding is available for 22% of the state’s Kindergarten students in 220 schools (Excel) (PDF). OSPI Memorandum No. 040-12 includes the 2012-13 requirements for state-funded Kindergarten. Future Phase-in (Projected)To reach the 2017-18 statewide target, the Legislature must increase funding 16% a year. Based on this expectation, it is projected that 38% of the state’s student in the 2013-14 school year and 53% in the 2014-15 school year will be eligible for full-day Kindergarten. In addition to finalizing the schools eligible in 2012-13, OSPI created a projection of the schools that would be eligible in 2013-14 and 2014-15 (PDF of Eligibility of rollout to 38 and 53 percent). This data is based on today’s school poverty rate calculation and is subject to change. The Legislature will need to increase funding for full-day Kindergarten in the 2013-15 biennium to reach these targets.


Good News!
•We have classroom space for two, all-day, every day kindergarten classes!

Options for Kindergarten
•Still planning on adding “every Wed.” beginning 2nd Semester
•The State may begin funding all day, every day in 2013-14 or 2015-16
•If not fully funded:▫2013-14: Add all day, every day?
Estimated cost: Minimum $50,000
▫2013-14: Add all day, 4 days a week Estimated cost: Minimum $30,000 (if we utilize current
teacher to teach one class Monday – Thursday and second class on Friday)

Levy Options – How many years
•Current Levy – 3 years•Levy before current one – 4 years
•1, 2, 3, or 4 years?•4 year Levy – pros and cons

Levy Options – Amount of Levy
•Keep tax rate “level”•Keep $ amount of levy “level”•Balancing the needs of the school district with the current economic environment…

Timelines
•Nov. 26 board mtg: continue discussions
•Dec. 19 board mtg.: final decision, resolution due to Auditor’s office by Dec. 28

Short Range & Long Range Staffing Plans…
“What challenges will we be facing in the near future?”
Top Related