


Languages
Pages
Legal


Data Mining andInformation Visualization
Yan Liu, PhDAssistant Professor
Department of Biomedical, Industrial and Human Factors Engineering Wright State University
2
Outline
Data Mining (DM) Definition and Usefulness DM Process DM Modeling Techniques
Information Visualization Definition and Usefulness Multivariate Data Visualization Techniques

3
Data Mining (DM): What and Why What Is DM
A synonym for knowledge discovery in databases (KDD) Nontrivial process of identifying valid, novel, potentially useful, and
ultimately understandable patterns in data (Fayyard et al., 1996) Lying at the interface of database management, machine learning, pattern
recognition, statistics and visualization
Why Is DM Useful Rapid development in information techniques produces vast amounts of
data Knowledge discovered from data can be use for competitive advantage
Classification, prediction, association, clustering, etc.

4
Data Mining Process
Problem Understanding
Data Understanding
ModelingEvaluation
DeploymentData
Preparation
Data
CRISP-DM(CRoss Industry Standard Process for DM) (Holsheimer,1999)

5
Problem Understanding Understand the objectives Define performance criteria
Objective or subjective Assess current situations of the organization
Background knowledge, data sources, resources, etc.
Data Understanding Collect data
From scratch or existing databases Describe data
Volume, identities of attributes, format, etc. Explore/survey data
Distributions of attributes, relations among a small number of attributes, results of simple aggregations, etc.
Statistical analyses, data visualization, database queries can be useful tools Verify data quality
Incomplete data, missing values, errors, etc.
Data Mining Process (Cont’d)

6
Data Preparation “Garbage in, garbage out” Select data
Based on relevance, technical constraints Clean data
remove errors, fill in missing data with default values or estimates by modeling Construct data
Generate new attributes (records), merge tables, transform data, etc. Reduce data
Obtain a dataset much smaller yet retaining enough important information
Data Mining Process (Cont’d)

7
Modeling Select appropriate modeling techniques Generate test design
Test models’ quality and validity Build models Assess models
According to domain knowledge, success criteria and test design
Evaluation Evaluate results
With respect to the project objectives Review process
Overlooked important factors or tasks
Deployment Plan deployment Plan monitoring and maintenance Produce final result
Data Mining Process (Cont’d)

Class Description Classes
e.g. Customers of a bank can be classified into those with “good Credit” and “bad credit”; Grades of students in a class include “A”, “B”, “C”, and “D”
Data Characterization Summarize the data in each class e.g. summarize the distributions of age, educational level, and household
income of customers that have “good credit” or “bad credit”
Data Discrimination Compare data in different classes e.g. compare customers with “good credit” and those with “bad credit” in their
distributions of o age, educational level, and household income
8
Mining Frequent Pattern, Associations, and Correlations
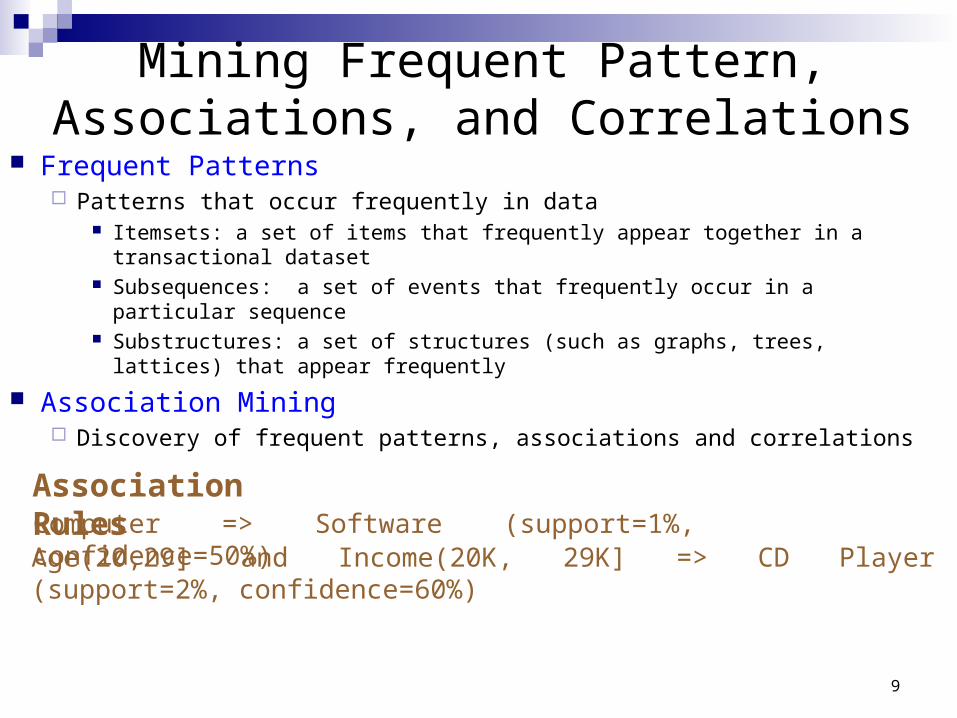
Frequent Patterns Patterns that occur frequently in data
Itemsets: a set of items that frequently appear together in a transactional dataset Subsequences: a set of events that frequently occur in a particular sequence Substructures: a set of structures (such as graphs, trees, lattices) that appear
frequently
Association Mining Discovery of frequent patterns, associations and correlations
9
Computer => Software (support=1%, confidence=50%)Age(20,29] and Income(20K, 29K] => CD Player (support=2%, confidence=60%)
Association Rules
Classification and Prediction
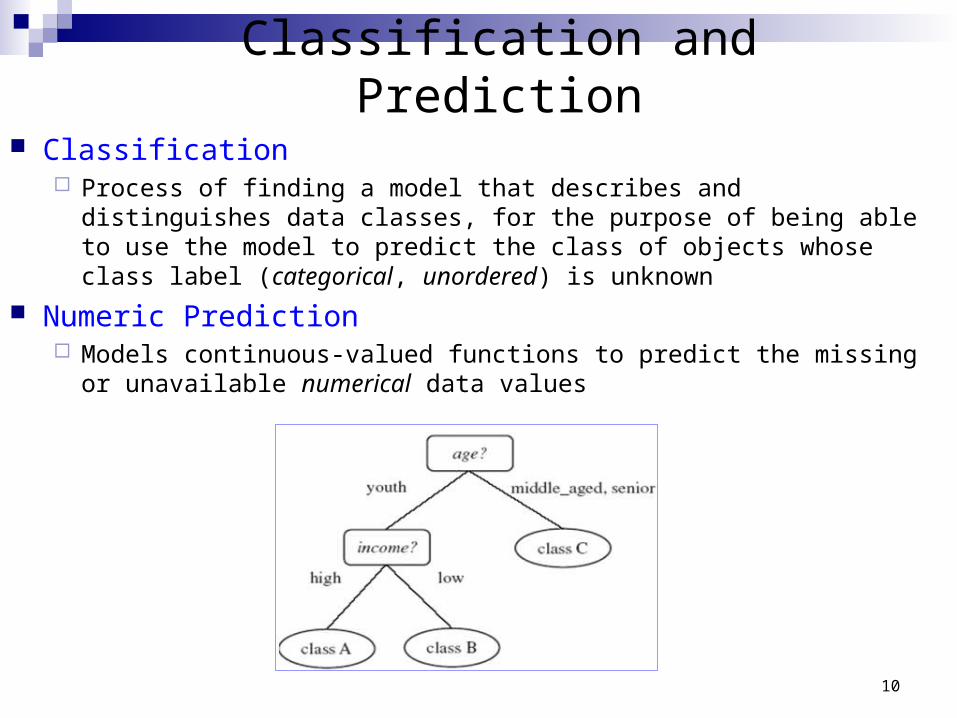
Classification Process of finding a model that describes and distinguishes data classes, for the
purpose of being able to use the model to predict the class of objects whose class label (categorical, unordered) is unknown
Numeric Prediction Models continuous-valued functions to predict the missing or unavailable
numerical data values
10

Cluster Analysis Functions
Analyze data without consulting a known class label Divide data into groups(clusters) so that objects within the same cluster are
similar while those belonging to different clusters differ much
11

Outlier Analysis Function
Identify objects that do not comply with the general pattern of the data
12
Outlier analysis may uncover fraudulent usage of credit cards by detecting purchases of extremely large amounts for a given account number in comparison to regular charges incurred by the same account

Evolution Analysis Function
Describes and models regularities or trends for objects whose behavior changes over time
13
Suppose you have the major stock market (time-series) data of the last several years available from the New York Stock Exchange and you would like to invest in shares of high-tech industrial companies. A data mining study of stock exchange data may identify stock evolution regularities for overall stocks and for the stocks of particular companies. Such regularities may help predict future trends in stock market prices, contributing to your decision making regarding stock investments
14
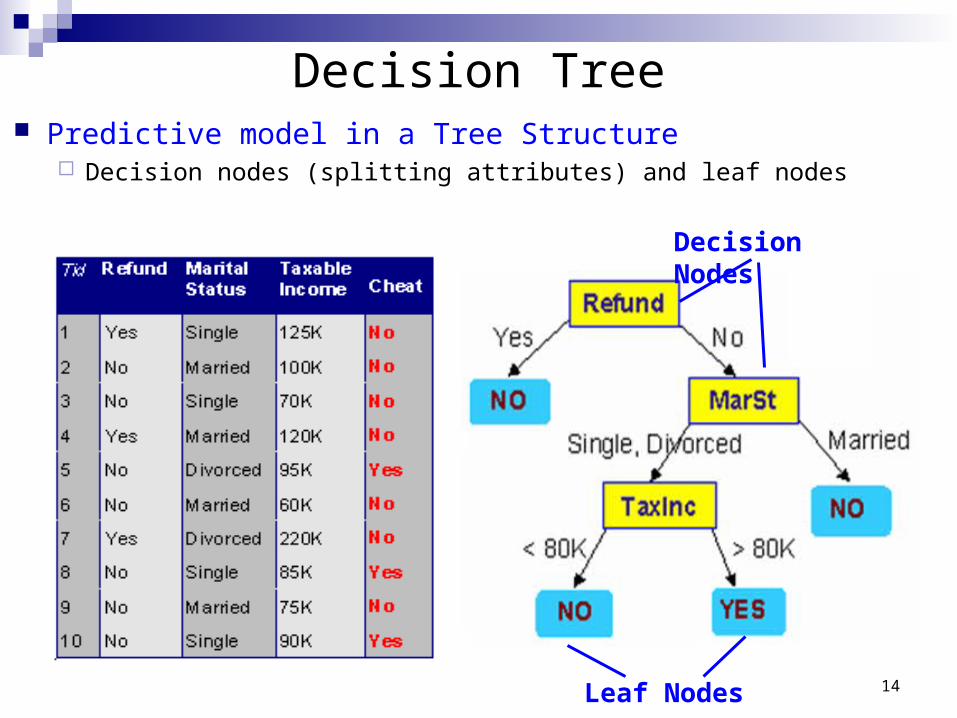
Decision Tree Predictive model in a Tree Structure
Decision nodes (splitting attributes) and leaf nodes
Leaf Nodes
Decision Nodes
15
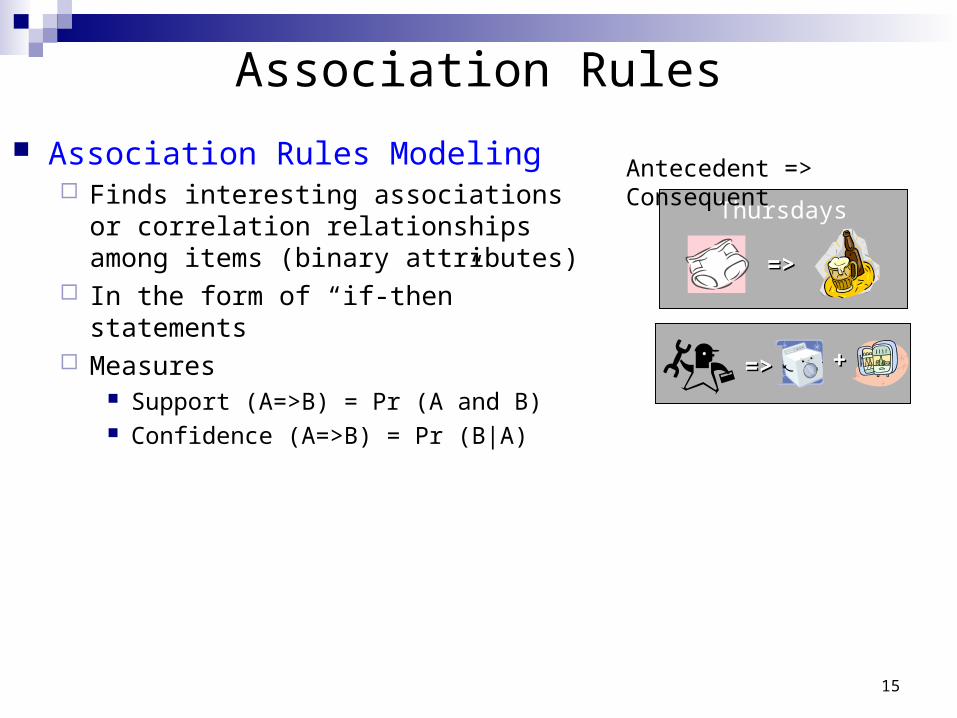
Association Rules
Association Rules Modeling Finds interesting associations or correlation
relationships among items (binary attributes) In the form of “if-then” statements Measures
Support (A=>B) = Pr (A and B) Confidence (A=>B) = Pr (B|A)
=>=>
Thursdays
Antecedent => Consequent
=>=> ++
16
Information Visualization: What and Why What Is Information Visualization
Use of computer-supported, interactive, visual representations of abstract data to amplify cognition (Card,1999)
Why Is Information Visualization Useful Take advantage of the powerful processing capacities of human visual
perception system Three Types of Usages
Exploratory analysis: searching for interesting phenomena in data Confirmatory analysis: validating some hypothetical features in data Presentation: demonstrating known information
17
Multivariate Data Visualization
Multivariate Data Visualization Methods Scatterplot matrix Trellis display Parallel coordinates Mosaic display …
18
Datasets Auto-Mpg Dataset
Retrieved from the UCI machine learning repository Attributes: “mpg(continuous)”, “cylinders(3/4/5/6/8)”, “horsepower(continuous)”,
“weight(continuous)”, “origin(American/European/Japanese)” 392 records
Titanic Survival Dataset Retrieved from Friendly (1994) Attributes: “booking class (first/second/third/crew)”, “gender (male/female)”,
“age (adult/child)”, “survival (yes/no)”
Mosaic

Scatterplot Matrix Organizes all the pairwise scatterplots in a matrix format Each display panel in the matrix is identified by its row and column
coordinates The panel at the ith row and jth column is a scatterplot of Xj versus Xi
Scatterplot matrix with three variables X, Y, and Z
• The panel at the 3rd row (the top row) and 1st column is a scatterplot of Z versus X• Panels that are symmetric with respect to the XYZ diagonal have the same variables as their coordinates, rotated 90°
•The redundancy is designed to improve visual linking• Patterns can be detected in both horizontal and vertical directions
• Can only visualize the correlation between two variables, without using retinal visual elements
19

20
Scatterplot Matrix of the Auto-Mpg Dataset
American European Japanese

21
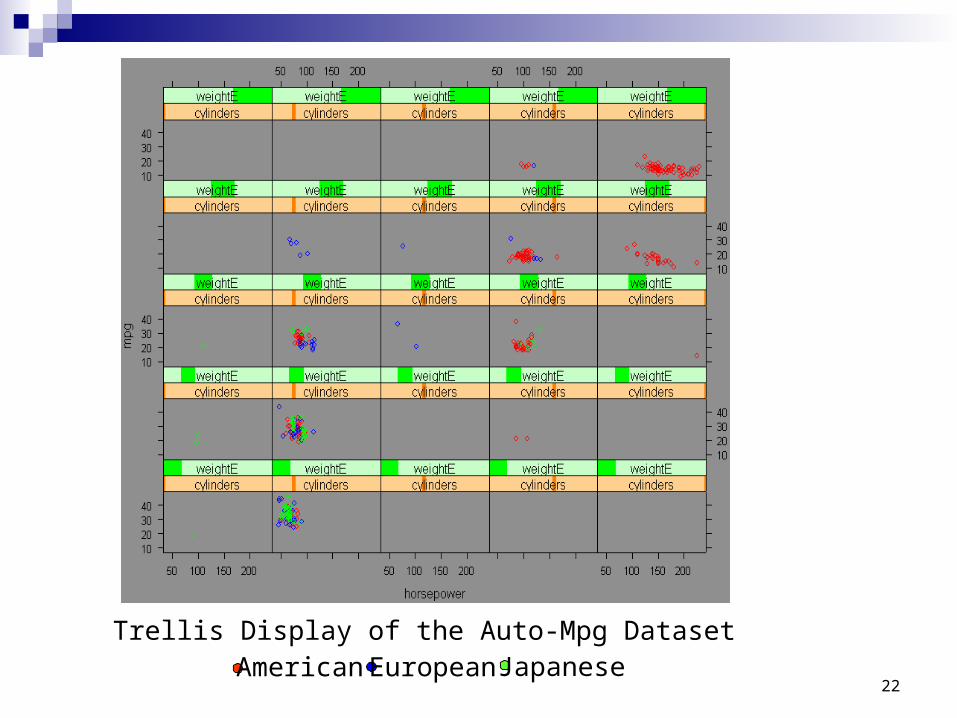
Trellis Display
Overview (Becker and Cleveland, 1996) Display any one of a large variety of 1-D, 2-D and 3-D plot types in an trellis
layout of panels, where each panel displays the select plot type for a level or interval on additional discrete or continuous conditioning variables
Panels are laid out into columns, rows and pages
Mapping of Variables and Data Records Axis variable
Mapped to one of the coordinates in the panels Conditioning variable
Mapped to a horizontal bar at the top of each panel, representing on of its levels (discrete variable) or interval (continuous variable)
Superpose variable Mapped to colors or symbols of points in the panels
22
Trellis Display of the Auto-Mpg DatasetAmerican European Japanese

23
Parallel Coordinates
Overview (Inselberg, 1985) Each variable is represented by a vertical axis and m variables are organized as
uniformly spaced vertical lines A data record in a m-D space is manifested as a connected set of points, one on
each axis
Mapping of Variables and Data Records Variable Xi is represented as ith vertical axis in a 2-D space
Values of Xi are scaled so that its maximum and minimum values correspond to the top and bottom points on its axis, respectively
A data record with m variables is represented as a set of m-1 connected line segments which connect to vertical lines at the corresponding variables’ values

24
Parallel Coordinates of the Auto-Mpg Dataset
American European Japanese
Cylinders mpg Horsepower WeightOrigin
25
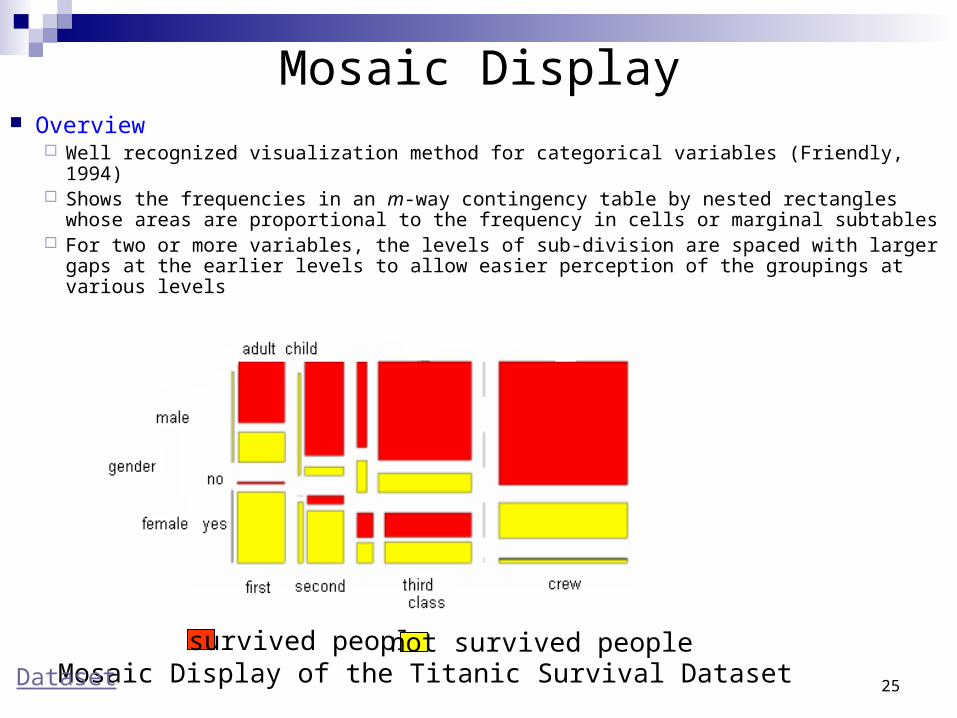
Mosaic Display Overview
Well recognized visualization method for categorical variables (Friendly, 1994) Shows the frequencies in an m-way contingency table by nested rectangles
whose areas are proportional to the frequency in cells or marginal subtables For two or more variables, the levels of sub-division are spaced with larger gaps
at the earlier levels to allow easier perception of the groupings at various levels
Mosaic Display of the Titanic Survival Datasetsurvived people not survived people
Dataset
Top Related