


Languages
Pages
Legal


Danish Property Federation
The Danish Property Market

www.ejendomsforeningen.dk
Building Stock 2014
Source: Statistics Denmark and Danish Property Federation
www.ejendomsforeningen.dk
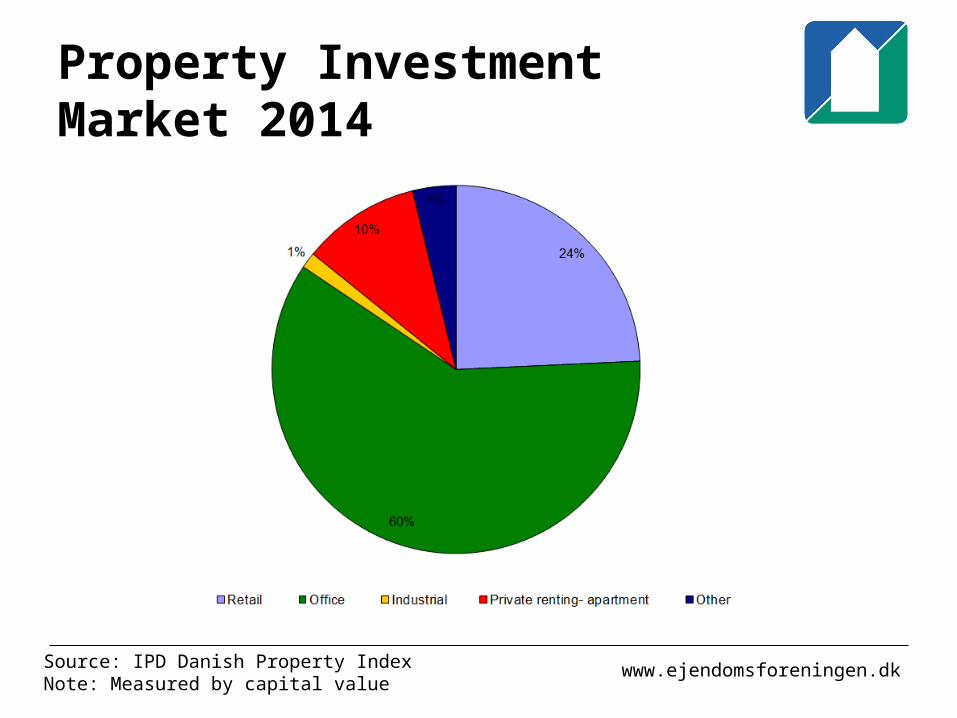
Property Investment Market 2014
Source: IPD Danish Property Index Note: Measured by capital value

www.ejendomsforeningen.dk
2015 2008
Average annualized percentage
change
Absolute change
Percent
Count in 1.000
Count in 1.000 Percent Count
Owner Occupied dwelling 50,4% 1.405 1.423 -0,2% -18.495
Housing society dwelling 7,3% 204 200 0,3% 4.477
Social rental housing 18,9% 528 516 0,3% 11.689 Private rental housing 19,1% 531 437 2,8% 93.907
- Small rental service 11,0% 308 218 5,0% 89.623 - Professional rental service 8,0% 223 219 0,3% 4.284
Public ownership 1,8% 51 53 -0,6 % -2.262
Unknown 2,4% 68 82 -2,7% -14.469
Total 100,0% 2.786 2.710 0,4% 75.847
Dwelling Stock divided into types of ownership in 2008 and 2015
Source: SAM-K, Statistics Denmark and own calculations
www.ejendomsforeningen.dk
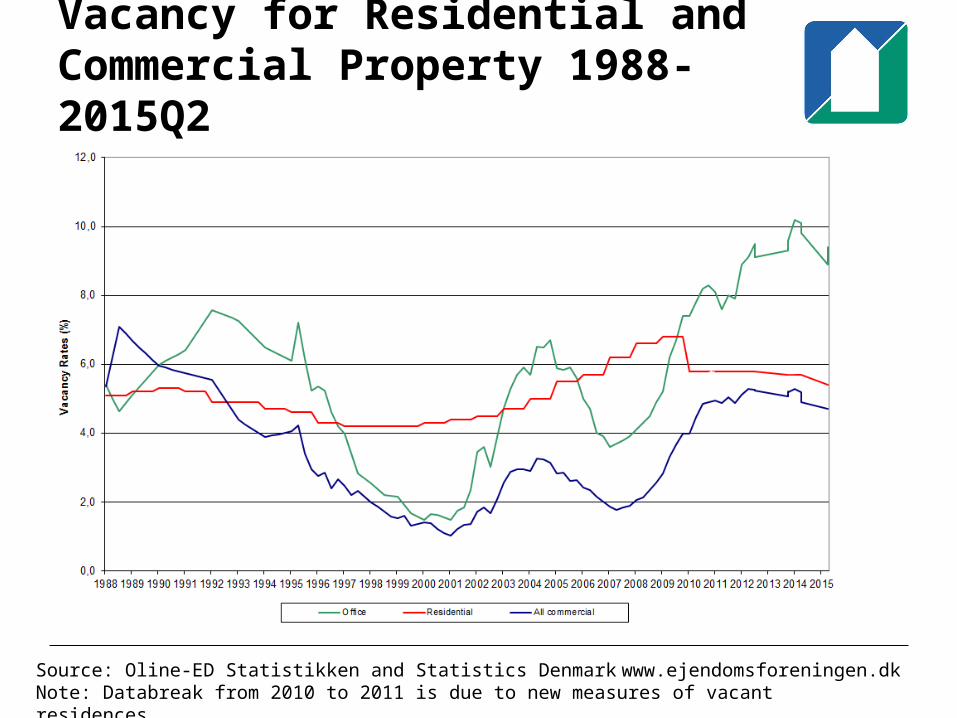
Vacancy for Residential and Commercial Property 1988-2015Q2
Source: Oline-ED Statistikken and Statistics Denmark Note: Databreak from 2010 to 2011 is due to new measures of vacant residences

www.ejendomsforeningen.dk
Dwellings without Person Registration 1981-2015
Source: Statistics Denmark

www.ejendomsforeningen.dk
Total Construction 1949-2014
Source: Statistics Denmark – statbank.dkNote: Measured as started construction

www.ejendomsforeningen.dk
Sold Investment Properties 1992-2014
Source: Statistics Denmark – statistikbanken.dk Note: Commercial: Excluding factories

www.ejendomsforeningen.dk
Prices on Investment Properties 1992-2015
Source: Statistics Denmark – statistikbanken.dkNote: Commercial: Excluding factories. The indices are based on nominal prices
www.ejendomsforeningen.dk
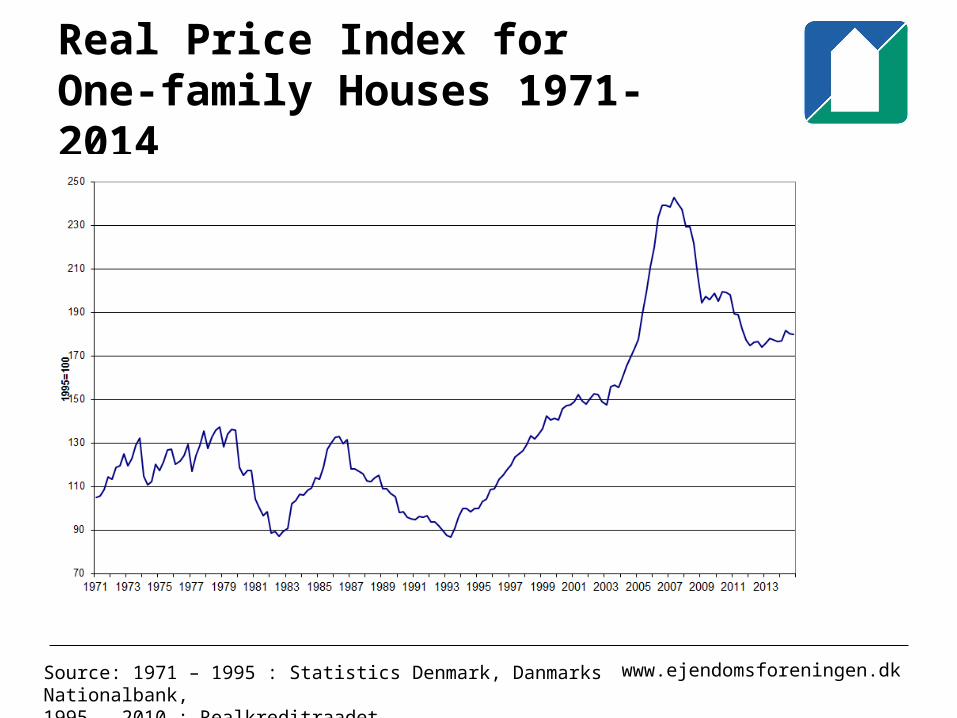
Real Price Index for One-family Houses 1971-2014
Source: 1971 – 1995 : Statistics Denmark, Danmarks Nationalbank,1995 – 2010 : Realkreditraadet
www.ejendomsforeningen.dk
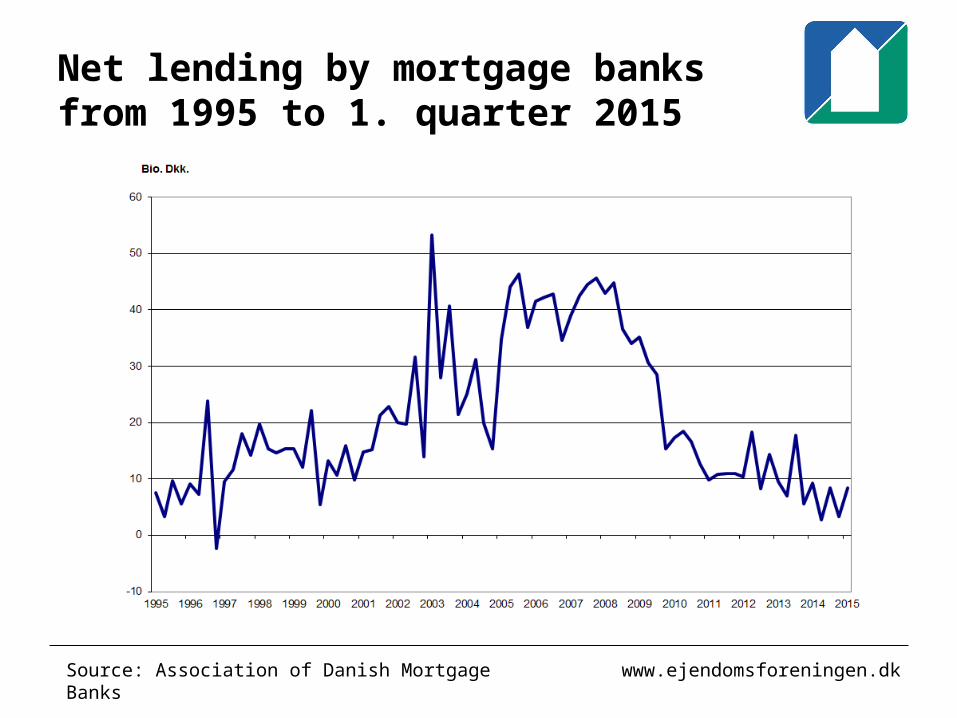
Net lending by mortgage banks from 1995 to 1. quarter 2015
Source: Association of Danish Mortgage Banks

www.ejendomsforeningen.dk
Rent and Residential Property Prices relative to the Wage Rate developments 1995-2013
Source: Realkreditrådet and Statistics Denmark

www.ejendomsforeningen.dk
Minimum Rent (euro/sq.m.)
Maximum Rent (euro/sq.m.)
Office
148
242
Retail
1.143 3.024
Industrial 44 77
Rent Levels for Commercial Property, Greater Copenhagen 2. Quarter 2015
Source: Sadolin & Albæk
Note: Dkr/Euro exchange rate is 744

www.ejendomsforeningen.dk
Vacancy and Rent Level for Offices in Copenhagen 1997-2015Q2
Source: Sadolin & Albæk and Oline-ED Statistikken

www.ejendomsforeningen.dk
Total office occupancy costs,
2010
Source: CBRE Global Office Rents
www.ejendomsforeningen.dk
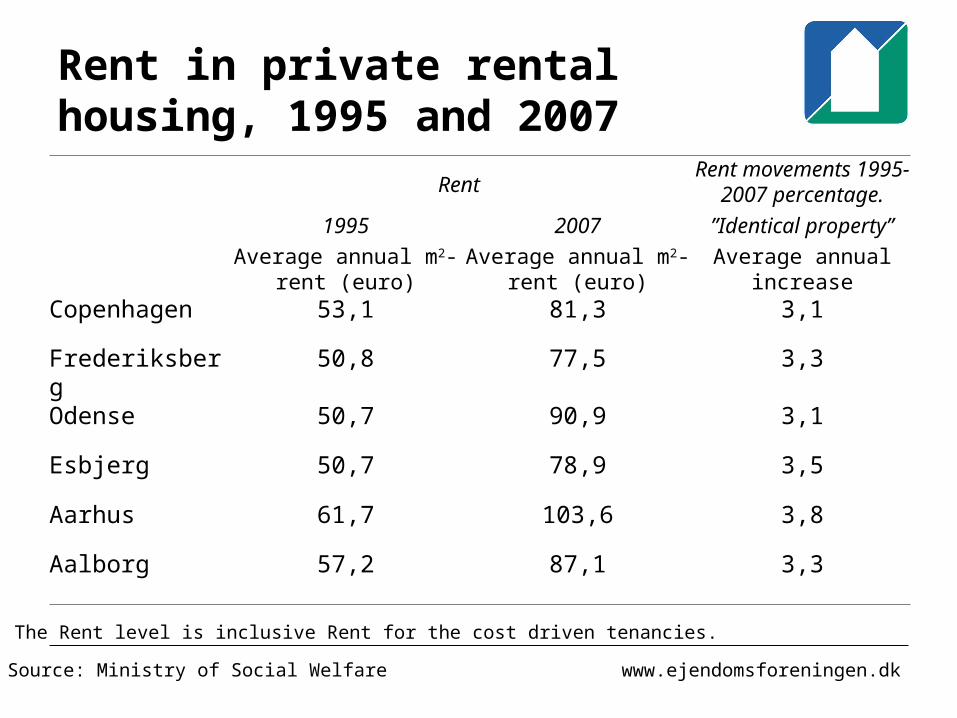
Rent in private rental housing, 1995 and 2007
Rent Rent movements 1995-
2007 percentage.
1995
Average annual m2-rent (euro)
2007
Average annual m2-rent (euro)
”Identical property”
Average annual increase
Copenhagen 53,1 81,3 3,1
Frederiksberg 50,8 77,5 3,3
Odense 50,7 90,9 3,1
Esbjerg 50,7 78,9 3,5
Aarhus 61,7 103,6 3,8
Aalborg 57,2 87,1 3,3
Source: Ministry of Social Welfare
Note: The Rent level is inclusive Rent for the cost driven tenancies.
www.ejendomsforeningen.dk
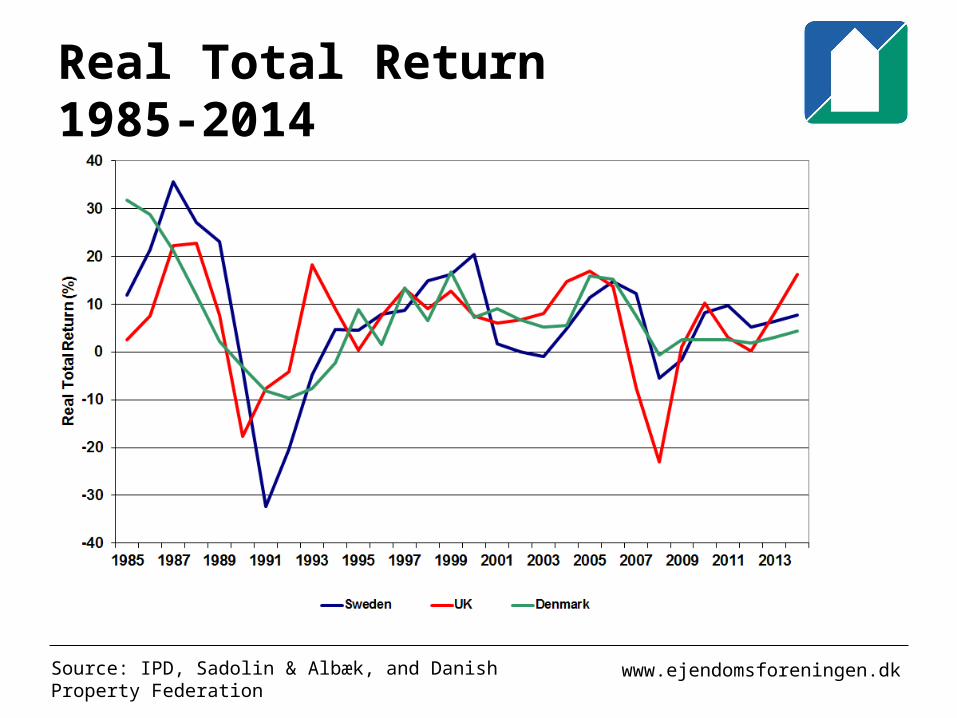
Real Total Return 1985-2014
Source: IPD, Sadolin & Albæk, and Danish Property Federation

www.ejendomsforeningen.dk
The Danish Property Federations Consensus Forecast 3. quarter 2015
Source: IPD Danish Property index and the Danish Property Federation
From 2000 to 2014 is shown the total return of IPD Danish Property index. 2015 to 2017 shows the average of the responses The Danish Property Federations Consensus Forecast. 50 % of the responses lies within the blue lines.
2015 2016 2017 2015-2019
Total return (%) 5,4 5,6 5,7 5,6
Change (quarterly) -0,1 0,0 0,1 0,1
Change (yearly) 0,0 0,0 New New
www.ejendomsforeningen.dk
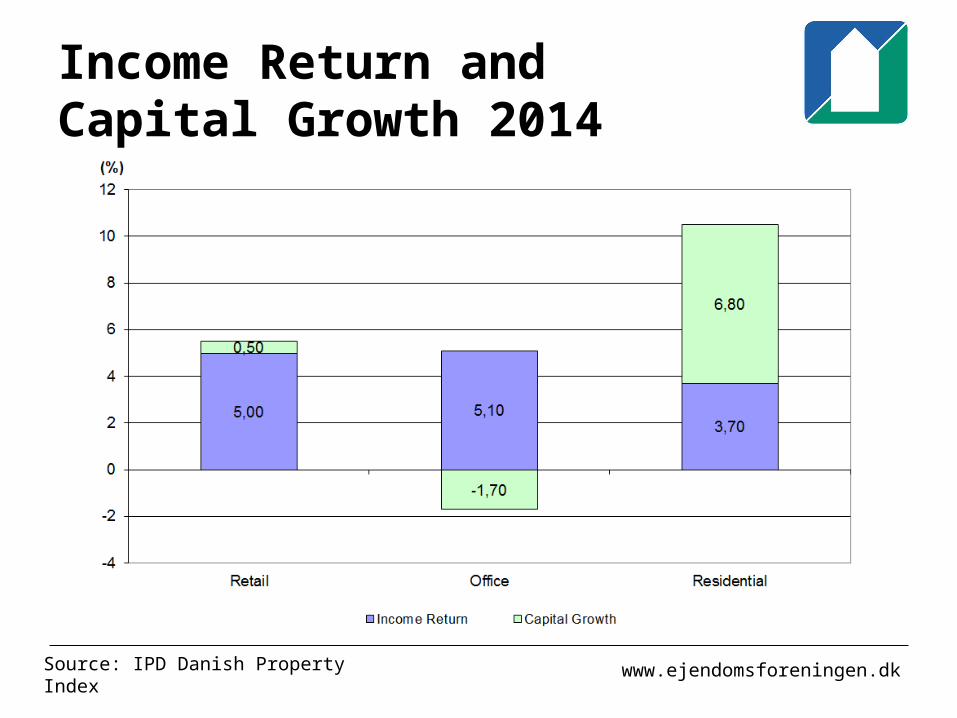
Income Return and Capital Growth 2014
Source: IPD Danish Property Index

www.ejendomsforeningen.dk
Reimbursement Duty rate in Danish municipalities 2015
Source: Statistics Denmark

www.ejendomsforeningen.dk
Municipalities where The Rent Control Act applies in 2015
Source: Grundejernes investeringsfond

www.ejendomsforeningen.dk
Telefon: 33 12 03 30
Ejendomsforeningen Danmark
Åboulevarden 22, 5. sal 8000 Aarhus C
Nørre Voldgade 21358 København K
Top Related