


Languages
Pages
Legal


DANGOTE SUGAR REFINERY PLC
CONSOLIDATED AND SEPARATE FINANCIAL STATEMENTS 31 DECEMBER 2014

DANGOTE SUGAR REFINERY PLC Consolidated and separate financial statements
For the year ended 31 December 2014
Table of contents Statement of Directors' responsibilities ................................................................................................................. i Report of the Independent Auditors ..................................................................................................................... 1 Consolidated and separate statement of profit or loss and other comprehensive income .................................. 1 Consolidated and separate statement of financial position ................................................................................. 3 Consolidated statement of changes in equity ...................................................................................................... 4 Separate statement of changes in equity ............................................................................................................. 4 Consolidated and separate statement of cash flows ........................................................................................... 5 Notes to the consolidated and separate financial statements ............................................................................. 6 Statement of value added .................................................................................................................................. 55 Five year financial summary .............................................................................................................................. 56

DANGOTE SUGAR REFINERY PLC Consolidated and separate financial statements
For the year ended 31 December 2014
i
STATEMENT OF DIRECTORS' RESPONSIBILITIES FOR THE PREPARATION AND APPROVAL OF THE FINANCIAL STATEMENTS The Directors of Dangote Sugar Refinery Plc are responsible for the preparation of the consolidated financial statements that give a true and fair view of the financial position of the Group and Company as at 31 December 2014, and the results of its operations, cash flows and changes in equity for the period ended, in compliance with International Financial Reporting Standards ("IFRS") and in the manner required by the Companies and Allied Matters Act of Nigeria, the Financial Reporting Council of Nigeria Act, 2011. In preparing the consolidated financial statements, the Directors are responsible for: • properly selecting and applying accounting policies; • presenting information, including accounting policies, in a manner that provides relevant, reliable,
comparable and understandable information; • providing additional disclosures when compliance with the specific requirements in IFRSs are
insufficient to enable users to understand the impact of particular transactions, other events and conditions on the Group and Company's financial position and financial performance; and
• making an assessment of the Group's ability to continue as a going concern. The Directors are responsible for: • designing, implementing and maintaining an effective and sound system of internal controls
throughout the Group and Company; • maintaining adequate accounting records that are sufficient to show and explain the Group's and
company's transactions and disclose with reasonable accuracy at any time the financial position of the Group and Company, and which enable them to ensure that the financial statements of the Group and Company comply with IFRS;
• maintaining statutory accounting records in compliance with the legislation of Nigeria and IFRS; • taking such steps as are reasonably available to them to safeguard the assets of the Group and
Company; and • preventing and detecting fraud and other irregularities. Going Concern: The Directors have made an assessment of the Group’s and Company’s ability to continue as a going concern and have no reason to believe the Group and Company will not remain a going concern in the year ahead. The consolidated financial statements of the Group and Company for the year ended 31 December 2014 were approved by directors on 31 March 2015. On behalf of the Directors of the Group _________________________ ________________________ Director Director

REPORT OF THE INDEPENDENT AUDITORS TO THE MEMBERS OF DANGOTE SUGAR PLC
Report on the Financial Statements We have audited the accompanying consolidated and separate financial statements of Dangote Sugar Plc (“the Company”) and its subsidiary (together referred to as “the Group”) which comprise the consolidated and separate
statements of financial position as at 31 December 2014, the consolidated and separate statements of profit or loss and other comprehensive income, consolidated and separate statements of changes in equity, consolidated and separate
statements of cash flows for the year then ended, a summary of significant accounting policies and other explanatory information.
Directors’ Responsibility for the Financial Statements
The Directors are responsible for the preparation and fair presentation of these consolidated and separate financial statements in accordance with the Companies and Allied Matters Act CAP C20 LFN 2004, the Financial Reporting Council of Nigeria Act, 2011, the International Financial Reporting Standards and for such internal control as the Directors determine is necessary to enable the preparation of consolidated and separate financial statements that are free from material misstatement, whether due to fraud or error.
Auditors’ Responsibility
Our responsibility is to express an opinion on these consolidated and separate financial statements based on our audit. We conducted our audit in accordance with International Standards on Auditing. Those standards require that we comply with ethical requirements and plan and perform the audit to obtain reasonable assurance about whether the financial statements are free from material misstatement.
An audit involves performing procedures to obtain audit evidence about the amounts and disclosures in the financial statements. The procedures selected depend on the auditors’ judgment, including the assessment of the risks of material misstatement of the financial statements, whether due to fraud or error. In making those risk assessments, the auditors consider internal controls relevant to the entity’s preparation and fair presentation of the financial statements in order to design audit procedures that are appropriate in the circumstances, but not for the purpose of expressing an opinion on the effectiveness of the entity’s internal control. An audit also includes evaluating the appropriateness of accounting policies used and the reasonableness of accounting estimates made by the Directors, as well as evaluating the overall presentation of the financial statements.
We believe that the audit evidence we have obtained is sufficient and appropriate to provide a basis for our audit opinion.
Opinion
In our opinion, the consolidated and separate financial statements give a true and fair view of the financial position of Dangote Sugar Plc and its Subsidiary as at 31 December 2014 and of its financial performance and cash flows for the
year then ended in accordance with the International Financial Reporting Standards, the Companies and Allied Matters Act CAP C20 LFN 2004 and the Financial Reporting Council of Nigeria Act, 2011.
Other reporting responsibilities
In accordance with the Sixth Schedule of Companies and Allied Matters Act CAP C20 LFN 2004 we expressly state that:
i) We have obtained all the information and explanation which to the best of our knowledge and belief were necessary for the purpose of our audit.
ii) The Group has kept proper books of account, so far as appears from our examination of those books.
iii) The consolidated and separate statements of financial position and the consolidated and separate statements of profit or loss and other comprehensive income are in agreement with the books of account.
Onwu Ijeoma – FRC/2013/ICAN/00000001364 For: Akintola Williams Deloitte Chartered Accountants Lagos, Nigeria 10 April, 2015.

DANGOTE SUGAR REFINERY PLC Consolidated and separate financial statements
For the year ended 31 December 2014
2
CONSOLIDATED AND SEPARATE STATEMENT OF PROFIT OR LOSS AND OTHER COMPREHENSIVE INCOME GROUP GROUP COMPANY COMPANY
Year ended
Year ended
Year ended
Year ended
Note
31/12/2014 N'000
31/12/2013 N'000
31/12/2014 N'000
31/12/2013 N'000
Continuing operations
Revenue
6
94,855,203
103,153,735
94,103,677
102,467,361 Cost of sales
7
(76,227,193)
(78,555,261)
(72,369,075)
(75,497,463)
Gross profit
18,628,010
24,598,474
21,734,602
26,969,898
Selling and distribution expense
7.1
(1,955,669)
(3,434,861)
(1,835,803)
(3,418,895) Administrative expenses
8
(6,644,389)
(8,710,872)
(4,955,453)
(7,201,142)
Investment income
9
285,594
1,491,638
285,594
1,491,637 Other income
10
5,066,049
2,387,944
2,289,193
2,258,019
Profit from operating activities
15,379,595
16,332,323
17,518,133
20,099,517
Finance costs
9.1
(106,443)
(67,164)
(45,292)
-
Profit before tax
15,273,152
16,265,159
17,472,841
20,099,517
Income tax expense
11
(3,637,373)
(5,419,227)
(5,564,151)
(6,561,905)
Profit for the year
12
11,635,779
10,845,932
11,908,690
13,537,612
Other comprehensive expenditure:
items that will not be reclassified subsequently to profit or loss:
-
-
-
-
Actuarial gain/ (loss) on gratuity scheme (net of tax) 27.5
-
10,741
-
10,741
Total other comprehensive income/(loss) for the year
-
10,741
-
10,741
Total comprehensive income for the year
11,635,779
10,856,673
11,908,690
13,548,353
Profit for the year attributable to: Owners of parent
11,649,425
10,980,516
11,908,690
13,537,612 Non-controlling interest
(13,646)
(134,584)
-
-
11,635,779
10,845,932
11,908,690
13,537,612
Total comprehensive income for the year attributable to:
Owners of parent
11,649,425
10,991,257
11,908,690
13,548,353 Non-controlling interest
(13,646)
(134,584)
-
-
11,635,779
10,856,673
11,908,690
13,548,353
Earnings per share Basic and diluted earnings per share
(Kobo) 13
97
90
99
113
The accompanying notes and IFRS statements on pages 6 to 54 form an integral part of these consolidated and separate financial statements.

DANGOTE SUGAR REFINERY PLC Consolidated and separate financial statements
As at 31 December 2014
3
CONSOLIDATED AND SEPARATE STATEMENT OF FINANCIAL POSITION
GROUP
GROUP
COMPANY
COMPANY
Assets
Note 31/12/2014
N'000
31/12/2013 N'000
31/12/2014 N'000
31/12/2013 N'000
Non-current assets
Property, plant and equipment
14 50,472,720
41,847,307
29,346,717
26,250,037 Intangible assets
15 263,885
301,711
203,752
256,912
Other assets
16 189,337
109,693
-
109,693 Biological assets
17 1,122,679
487,215
-
-
Investments
19 -
-
3,214,923
3,214,923 Deferred tax assets
11.4 2,488,822
555,465
-
-
Total non-current assets
54,537,443
43,301,391
32,765,392
29,831,565
Current assets
Inventories
20 15,098,890
11,826,595
14,047,767
11,097,891 Biological assets
17 675,686
12,124
-
-
Trade and other receivables
21 14,012,843
19,273,525
42,083,720
38,027,061 Other assets
16 1,409,315
290,877
1,409,315
290,877
Held for sale investment in subsidiary 18 864,647
-
864,647
- Cash and cash equivalents
22 6,202,478
8,455,366
6,116,963
7,864,788
Total current assets
38,263,859
39,858,487
64,522,412
57,280,617
Total assets
92,801,302
83,159,878
97,287,804
87,112,182
EQUITY Share capital
23 6,000,000
6,000,000
6,000,000
6,000,000 Share premium
24 6,320,524
6,320,524
6,320,524
6,320,524
Retained earnings
25 39,288,074
34,838,649
46,205,678
41,496,988
51,608,598
47,159,173
58,526,202
53,817,512
Non-controlling interest
25.1 (194,878)
(181,232)
-
-
51,413,720
46,977,941
58,526,202
53,817,512
LIABILITIES
Borrowings
26 -
385,052
-
- Deferred tax liability
11.4 4,611,315
4,741,717
4,229,514
4,359,916
Total non-current liabilities
4,611,315
5,126,769
4,229,514
4,359,916
Current tax liabilities
11.3 5,936,185
4,756,600
5,910,930
4,737,924
Retirement benefit obligation
27.4 1,527,748
1,356,067
1,311,654
1,356,067 Trade and other payables
28 25,226,985
23,073,810
23,609,260
21,508,166
Borrowings
26 2,385,052
536,094
2,000,000
- Other liabilities
29 1,700,297
1,332,597
1,700,244
1,332,597
Total current liabilities
36,776,267
31,055,168
34,532,088
28,934,754
Total liabilities
41,387,582
36,181,937
38,761,602
33,294,670
Total equity and liabilities
92,801,302
83,159,878
97,287,804
87,112,182
These financial statements were approved and authorised for issue by the Board of Directors on 31 March 2015 and were signed on its behalf by: ________________________ _______________________ ____________________ Abdullahi Sule Olakunle Alake Modupe Oguntade Deputy Chief Executive Officer Chief Operating Officer Chief Financial Officer FRC/2013/NSE/00000002065 FRC/2013/ICAN/00000002214 FRC/2013/ICAN/00000002246
The accompanying notes and non-IFRS statements on pages 6 to 54 form an integral part of these consolidated and separate financial statements.

DANGOTE SUGAR REFINERY PLC Consolidated and separate financial statements
For the year ended 31 December 2014
4
CONSOLIDATED STATEMENT OF CHANGES IN EQUITY
Share Capital
Share Premium
Retained Earnings
Attributable to equity
holders of the parent
Non-controlling
interests
Total Group N'000 N'000 N'000 N'000 N'000 N'000
Balance as at 1st January 2012
6,000,000 6,320,524
26,813,185
39,133,709
-
39,133,709
Profit for the year
10,796,416
10,796,416
-
21,592,832
Other comprehensive income (net of tax)
Actuarial loss on gratuity
- -
(60,966)
(60,966)
-
(121,932)
- -
(60,966)
(60,966)
-
(121,932)
Total comprehensive income for the year
- -
10,735,450
10,735,450
-
10,735,450
Dividend paid
- -
(3,600,000)
(3,600,000)
-
(3,600,000)
Balance as at 31 December, 2012
6,000,000 6,320,524
33,948,635
46,269,159
-
46,269,158 Profit for the year
10,980,516
10,980,516
(134,584)
10,845,932
Other comprehensive loss (net of tax)
Actuarial gain gratuity
- -
10,741
10,741
-
10,741
Total comprehensive income for the year
44,939,892
57,260,416
(134,584)
57,125,831
Effect of acquisition of subsidiaries under common control
- -
(4,101,243)
(4,101,243)
(46,648)
(4,147,891)
Dividend paid
- -
(6,000,000)
(6,000,000)
-
(6,000,000)
Balance as at 31 December, 2013 6,000,000 6,320,524
34,838,649
47,159,173
(181,232)
46,977,940
Profit for the year
11,649,425
11,649,425
(13,646)
11,635,780
Other comprehensive income for the
year - -
-
-
-
-
Dividend paid (Note 25)
- -
(7,200,000)
(7,200,000)
-
(7,200,000)
Balance as at 31 December, 2014
6,000,000 6,320,524
39,288,074
51,608,598
(194,878)
51,413,720
SEPARATE STATEMENT OF CHANGES IN EQUITY
Share Capital
Share Premium
Retained Earnings
Attributable to equity
holders of the parent
Total
N'000 N'000
N'000 N'000
N'000 Company
Balance as at 1st January 2012
6,000,000 6,320,524
26,813,185 39,133,709
39,133,709
Profit for the year
10,796,416 10,796,416
10,796,416
Other comprehensive income (net of tax)
Actuarial loss on gratuity
- -
(60,966) (60,966)
(60,966)
- -
(60,966) (60,966)
(60,966)
-
-
Total comprehensive income for the year
- -
10,735,450 10,735,450
10,735,450
Dividend paid
- -
(3,600,000) (3,600,000)
(3,600,000)
Balance as at Ist January 2013
6,000,000 6,320,524
33,948,635 46,269,159
46,269,159 Profit for the year
- -
13,537,613 13,537,613
13,537,613
Other comprehensive loss (net of tax)
Actuarial gain gratuity
- -
10,741 10,741
10,741
Total comprehensive income for the year
- -
13,548,354 13,548,354
13,548,354
Dividend paid
- -
(6,000,000) (6,000,000)
(6,000,000)
Balance as at 31 December, 2013 6,000,000 6,320,524
41,496,988 53,817,512
53,817,512
Profit for the year
- -
11,908,690 11,908,690
11,908,690
Dividend paid (Note 25)
- -
(7,200,000) (7,200,000)
(7,200,000)
Balance as at 31 December, 2014
6,000,000 6,320,524
46,205,678 58,526,202
58,526,202

DANGOTE SUGAR REFINERY PLC Consolidated and separate financial statements
For the year ended 31 December 2014
5
CONSOLIDATED AND SEPARATE STATEMENT OF CASH FLOWS
GROUP
GROUP
COMPANY
COMPANY
Note
31/12/2014 N'000
31/12/2013 N'000
31/12/2014 N'000
31/12/2013 N'000
Cash flows for operating activities Profit for the year
11,635,779
10,845,932
11,908,690
13,537,612 Adjustments for non-cash income and expenses:
Income tax expense recognised in profit and loss
11.1 3,637,373
5,419,227
5,564,151
6,561,905
Depreciation
14 3,572,263
2,885,292
2,685,729
1,725,252
Amortisation of intangible assets
15 115,705
-
85,638
- Impairment loss on property, plant and equipment
12 15,224
79,062
15,224
63,551
(Write back) /Impairment loss recognised on trade receivables
21 (1,033,748)
342,165
34,936
139,168
Impairment loss recognised on other receivables
21 75,629
155,725
14,421
342,166
Fair value adjustment on biological assets
17 (1,501,971)
373,915
-
-
Finance cost
9.1 106,443
67,164
45,292
54,781 Investment income
9 (285,594)
(1,491,638)
(285,595)
(1,491,637)
Transfer of asset
14 -
54,781
43,672
15,344
Disposal
14 7,506
-
7,506
- Actuarial gain on gratuity scheme
27.5 -
15,344
-
- Effect of acquisition under common control
-
(15,178,674)
-
-
Changes in operating assets and liabilities:
(Increase)/decrease in inventories
(3,272,296)
2,203,709
(2,949,877)
2,923,412
Increase in biological asset
202,948
(873,254)
-
- (Increase)/decrease in trade and other receivables
6,218,802
5,775,944
(4,106,014)
(12,884,872)
(Increase)/decrease in other assets
(1,198,082)
49,529
(1,008,745)
49,529 (Increase)/decrease in Held for sale investment in subsidiary
(864,647)
-
(864,647)
- Increase/(decrease) in trade and other payables
2,520,874
(2,611,105)
2,468,741
(4,176,748)
Increase/(decrease)in employee benefits
171,680
95,195
(44,413)
95,195
Cash generated from operations
20,123,888
8,208,313
13,614,709
6,954,658
Retirement benefits Interest Paid
(106,443)
-
(45,292)
- Tax paid in the year
11.3 (4,521,548)
(5,877,803)
(4,521,548)
(5,877,803)
Net cash from operating activities
15,495,897
2,330,510
9,047,869
1,076,855
Cash flows from investing activities Purchase of investment in subsidiary
company
-
-
-
(3,214,923) Purchase of Property, plant and equipment
14 (12,220,406)
(10,280,806)
(5,848,811)
(10,195,311)
Purchase of intangible asset
15 (77,879)
(301,711)
(32,478)
(256,912) Interest received
9 285,594
1,491,638
285,595
1,491,637
Non cash adjustment Payment in respect of acquisition under
common control
32.1 -
(3,214,923)
-
-
Net cash used in investing activities
(12,012,691)
(12,305,802)
(5,595,694)
(12,175,509)
Cash flows from financing activities Dividends paid
25 (7,200,000)
(6,000,000)
(7,200,000)
(6,000,000)
Loan obtained during the year
26 2,000,000
-
2,000,000
- Payment of loans
26 (536,094)
(532,784)
-
- Net cash used in financing activities
(5,736,094)
(6,532,784)
(5,200,000)
(6,000,000)
Net increase / (decrease) in cash and cash equivalents
(2,252,888)
(16,508,076)
(1,747,8245)
(17,098,654)
Cash and cash equivalents at beginning of year
22 8,455,366
24,963,442
7,864,788
24,963,442
Cash and cash equivalents at end of December 2014
22 6,202,478
8,455,366
6,116,963
7,864,788

6
NOTES TO THE CONSOLIDATED AND SEPARATE FINANCIAL STATEMENTS 1. General information
Dangote Sugar Refinery Plc (the Company) was incorporated as a public limited liability company on 4 January 2005 and commenced operations on 1 January 2006. The Group became quoted on the Nigerian Stock.
Exchange in March 2007 and its current shareholding is 68% by Dangote Industries Limited and 32% by the Nigerian public.
The ultimate controlling party is Dangote Industries Limited.
The registered address of the Group is located at GDNL Administrative Building, Terminal E, Shed 20 NPA Apapa Wharf Complex, Apapa, Lagos.
The consolidated financial statements of the Group for the year ended 31 December 2014 comprises the Group and its subsidiary - Savannah Sugar Company Limited.
1.1 The principal activity
The principal activity of the Group is the refining of raw sugar into edible sugar and the selling of refined sugar. The Group's products are sold through distributors across the country.
1.2 Going concern status
The Group has consistently been making profits. The Directors believe that there is no intention or threat from any party to curtail significantly its line of business in the foreseeable future. Thus, these financial statements are prepared on a going concern basis.
1.3 Operating environment
Emerging markets such as Nigeria are subject to different risks than more developed markets, including economic, political and social, and legal legislative risks. As has happened in the past, actual or perceived financial problems or an increase in the perceived risks associated with investing in emerging economies could adversely affect the investment climate in Nigeria and the country's economy in general. The global financial system continues to exhibit signs of deep stress and many economies around the world are experiencing lesser or no growth than in prior years. These conditions could slow or disrupt Nigeria's economy, adversely affecting the Group's access to capital and cost of capital for the Group and more generally, its business, results of operation, financial condition and prospects.
2 Financial period
These financial statements cover the financial year from 1 January 2014 to 31 December 2014, with restated comparative for year end 1 January 2013 to 31 December 2013.
3 Application of new and revised International Financial Reporting Standards (IFRSs) 3.1 New and revised IFRSs/IFRICs affecting amounts reported and/or disclosures in this financial
statements In the current year, the Group has applied a number of new and revised IFRSs issued by the International Accounting Standards Board (IASB) that are mandatorily effective for an accounting period that begins on or after 1 January 2014.
Amendments to IFRS 10, IFRS 12 and IAS 27 Investment Entities The Group has applied the amendments to IFRS 10, IFRS 12 and IAS 27 Investment Entities for the first time in the current year. The amendments to IFRS 10 define an investment entity and require a reporting entity that meets the definition of an investment entity not to consolidate its subsidiaries but instead to measure its subsidiaries at fair value through profit or loss in its consolidated and separate financial statements. To qualify as an investment entity, a reporting entity is required to: • obtain funds from one or more investors for the purpose of providing them with investment
management services;

7
NOTES TO THE CONSOLIDATED AND SEPARATE FINANCIAL STATEMENTS 3 Application of new and revised International Financial Reporting Standards (IFRSs)
(continued) 3.1 New and revised IFRSs/IFRICs affecting amounts reported and/or disclosures in this financial
statements (continued) • commit to its investor(s) that its business purpose is to invest funds solely for returns from capital
appreciation, investment income, or both; and • measure and evaluate performance of substantially all of its investments on a fair value basis.
Consequential amendments have been made to IFRS 12 and IAS 27 to introduce new disclosure requirements for investment entities.
As the Company is not an investment entity (assessed based on the criteria set out in IFRS 10 as at 1 January 2014), the application of the amendments has had no impact on the disclosures or the amounts recognised in the Group’s consolidated financial statements.
Amendments to IAS 32 Offsetting Financial Assets and Financial Liabilities The Group has applied the amendments to IAS 32 Offsetting Financial Assets and Financial Liabilities for the first time in the current year. The amendments to IAS 32 clarify the requirements relating to the offset of financial assets and financial liabilities. Specifically, the amendments clarify the meaning of ‘currently has a legally enforceable right of set-off’ and ‘simultaneous realisation and settlement’.
The amendments have been applied retrospectively. As the Group does not have any financial assets and financial liabilities that qualify for offset, the application of the amendments has had no impact on the disclosures or on the amounts recognised in the Group’s consolidated financial statements. The Group has assessed whether certain of its financial assets and financial liabilities qualify for offset based on the criteria set out in the amendments and concluded that the application of the amendments has had no impact on the amounts recognised in the Group’s consolidated financial statements.
Amendments to IAS 36 Recoverable Amount Disclosures for Non-Financial Assets The Group has applied the amendments to IAS 36 Recoverable Amount Disclosures for Non-Financial Assets for the first time in the current year. The amendments to IAS 36 remove the requirement to disclose the recoverable amount of a cash-generating unit (CGU) to which goodwill or other intangible assets with indefinite useful lives had been allocated when there has been no impairment or reversal of impairment of the related CGU. Furthermore, the amendments introduce additional disclosure requirements applicable to when the recoverable amount of an asset or a CGU is measured at fair value less costs of disposal. These new disclosures include the fair value hierarchy, key assumptions and valuation techniques used which are in line with the disclosure required by IFRS 13 Fair Value Measurements.
The application of these amendments has had no material impact on the disclosures in the Group’s consolidated financial statements.
Amendments to IAS 39 Novation of Derivatives and Continuation of Hedge Accounting The Group has applied the amendments to IAS 39 Novation of Derivatives and Continuation of Hedge Accounting for the first time in the current year. The amendments to IAS 39 provide relief from the requirement to discontinue hedge accounting when a derivative designated as a hedging instrument is notated under certain circumstances. The amendments also clarify that any change to the fair value of the derivative designated as a hedging instrument arising from the novation should be included in the assessment and measurement of hedge effectiveness
The amendments have been applied retrospectively. As the Group does not have any derivatives that are subject to novation, the application of these amendments has had no impact on the disclosures or on the amounts recognised in the Group’s consolidated financial statements.

8
NOTES TO THE CONSOLIDATED AND SEPARATE FINANCIAL STATEMENTS 3 Application of new and revised International Financial Reporting Standards (IFRSs)
(continued) 3.1 New and revised IFRSs/IFRICs affecting amounts reported and/or disclosures in this financial
statements (continued)
IFRIC 21 Levies The Group has applied IFRIC 21 Levies for the first time in the current year. IFRIC 21 addresses the issue as to when to recognise a liability to pay a levy imposed by a government. The Interpretation defines a levy, and specifies that the obligating event that gives rise to the liability is the activity that triggers the payment of the levy, as identified by legislation. The Interpretation provides guidance on how different levy arrangements should be accounted for, in particular, it clarifies that neither economic compulsion nor the going concern basis of financial statements preparation implies that an entity has a present obligation to pay a levy that will be triggered by operating in a future period.
IFRIC 21 has been applied retrospectively. The application of this Interpretation has had no material impact on the disclosures or on the amounts recognised in the Group’s consolidated financial statements.
3.2 New and revised IFRSs in issue but not yet effective
The Group has not applied the following new and revised IFRSs that have been issued but are not yet effective:
IFRS 9 IFRS 15 Amendments to IFRS 11 Amendments to IAS 16 and IAS 38 Amendments to IAS 16 and IAS 41 Amendments to IAS 19 Amendments to IFRSs Amendments to IFRSs
Financial Instruments 5 Revenue from Contracts with Customers 4 Accounting for Acquisitions of Interests in Joint Operations 3 Clarification of Acceptable Methods of Depreciation and Amortisation 3 Agriculture: Bearer Plants 3 Defined Benefit Plans: Employee Contributions 1 Annual Improvements to IFRSs 2010-2012 Cycle 2 Annual Improvements to IFRSs 2011-2013 Cycle 1
1 Effective for annual periods beginning on or after 1 July 2014, with earlier application permitted. 2 Effective for annual periods beginning on or after 1 July 2014, with limited exceptions. Earlier application is permitted. 3 Effective for annual periods beginning on or after 1 January 2016, with earlier application permitted. 4 Effective for annual periods beginning on or after 1 January 2017, with earlier application permitted. 5 Effective for annual periods beginning on or after 1 January 2018, with earlier application permitted.
IFRS 9 Financial Instruments IFRS 9 issued in November 2009 introduced new requirements for the classification and measurement of financial assets. IFRS 9 was subsequently amended in October 2010 to include requirements for the classification and measurement of financial liabilities and for derecognition, and in November 2013 to include the new requirements for general hedge accounting. Another revised version of IFRS 9 was issued in July 2014 mainly to include a) impairment requirements for financial assets and b) limited amendments to the classification and measurement requirements by introducing a ‘fair value through other comprehensive income’ (FVTOCI) measurement category for certain simple debt instruments.

9
NOTES TO THE CONSOLIDATED AND SEPARATE FINANCIAL STATEMENTS 3 Application of new and revised International Financial Reporting Standards (IFRSs)
(continued) Key requirements of IFRS 9:
All recognised financial assets that are within the scope of IAS 39 Financial Instruments: Recognition and Measurement are required to be subsequently measured at amortised cost or fair value. Specifically, debt investments that are held within a business model whose objective is to collect the contractual cash flows, and that have contractual cash flows that are solely payments of principal and interest on the principal outstanding are generally measured at amortised cost at the end of subsequent accounting periods. Debt instruments that are held within a business model whose objective is achieved both by collecting contractual cash flows and selling financial assets, and that have contractual terms of the financial asset give rise on specified dates to cash flows that are solely payments of principal and interest on the principal amount outstanding, are measured at FVTOCI. All other debt investments and equity investments are measured at their fair value at the end of subsequent accounting periods. In addition, under IFRS 9, entities may make an irrevocable election to present subsequent changes in the fair value of an equity investment (that is not held for trading) in other comprehensive income, with only dividend income generally recognised in profit or loss.
With regard to the measurement of financial liabilities designated as at fair value through profit or loss, IFRS 9 requires that the amount of change in the fair value of the financial liability that is attributable to changes in the credit risk of that liability is presented in other comprehensive income, unless the recognition of the effects of changes in the liability’s credit risk in other comprehensive income would create or enlarge an accounting mismatch in profit or loss. Changes in fair value attributable to a financial liability’s credit risk are not subsequently reclassified to profit or loss. Under IAS 39, the entire amount of the change in the fair value of the financial liability designated as fair value through profit or loss is presented in profit or loss.
In relation to the impairment of financial assets, IFRS 9 requires an expected credit loss model, as opposed to an incurred credit loss model under IAS 39. The expected credit loss model requires an entity to account for expected credit losses and changes in those expected credit losses at each reporting date to reflect changes in credit risk since initial recognition. In other words, it is no longer necessary for a credit event to have occurred before credit losses are recognised.
The new general hedge accounting requirements retain the three types of hedge accounting mechanisms currently available in IAS 39. Under IFRS 9, greater flexibility has been introduced to the types of transactions eligible for hedge accounting, specifically broadening the types of instruments that qualify for hedging instruments and the types of risk components of non-financial items that are eligible for hedge accounting. In addition, the effectiveness test has been overhauled and replaced with the principle of an ‘economic relationship’. Retrospective assessment of hedge effectiveness is also no longer required. Enhanced disclosure requirements about an entity’s risk management activities have also been introduced.
The directors anticipate that the application of IFRS 9 in the future may have a material impact on amounts reported in respect of the Group’s financial assets and financial liabilities. However, it is not practicable to provide a reasonable estimate of the effect of IFRS 9 until the Group undertakes a detailed review.
IFRS 15 Revenue from Contracts with Customers In May 2014, IFRS 15 was issued which establishes a single comprehensive model for entities to use in accounting for revenue arising from contracts with customers. IFRS 15 will supersede the current revenue recognition guidance including IAS 18 Revenue, IAS 11 Construction Contracts and the related Interpretations when it becomes effective.
The core principle of IFRS 15 is that an entity should recognise revenue to depict the transfer of promised goods or services to customers in an amount that reflects the consideration to which the entity expects to be entitled in exchange for those goods or services. Specifically, the Standard introduces a 5-step approach to revenue recognition:

10
NOTES TO THE CONSOLIDATED AND SEPARATE FINANCIAL STATEMENTS 3 Application of new and revised International Financial Reporting Standards (IFRSs)
(continued)
• Step 1: Identify the contract(s) with a customer. • Step 2: Identify the performance obligations in the contract. • Step 3: Determine the transaction price. • Step 4: Allocate the transaction price to the performance obligations in the contract. • Step 5: Recognise revenue when (or as) the entity satisfies a performance obligation.
Under IFRS 15, an entity recognises revenue when (or as) a performance obligation is satisfied, i.e. when ‘control’ of the goods or services underlying the particular performance obligation is transferred to the customer. Far more prescriptive guidance has been added in IFRS 15 to deal with specific scenarios. Furthermore, extensive disclosures are required by IFRS 15.
The directors do not anticipate that the application of IFRS 15 will have a material impact on the Group’s consolidated financial statements.
Amendments to IFRS 11 Accounting for Acquisitions of Interests in Joint Operations The amendments to IFRS 11 provide guidance on how to account for the acquisition of a joint operation that constitutes business as defined in IFRS 3 Business Combinations. Specifically, the amendments state that the relevant principles on accounting for business combinations in IFRS 3 and other standards (e.g. IAS 36 Impairment of Assets regarding impairment testing of a cash-generating unit to which goodwill on acquisition of a joint operation has been allocated) should be applied. The same requirements should be applied to the formation of a joint operation if and only if an existing business is contributed to the joint operation by one of the parties that participate in the joint operation.
A joint operator is also required to disclose the relevant information required by IFRS 3 and other standards for business combinations.
The amendments to IFRS 11 apply prospectively for annual periods beginning on or after 1 January 2016. The directors do not anticipate that the application of these amendments to IFRS 11 will have a material impact on the Group’s consolidated financial statements.
Amendments to IAS 16 and IAS 38 Clarification of Acceptable Methods of Depreciation and Amortisation
The amendments to IAS 16 prohibit entities from using a revenue-based depreciation method for items of property, plant and equipment. The amendments to IAS 38 introduce a rebuttable presumption that revenue is not an appropriate basis for amortisation of an intangible asset. This presumption can only be rebutted in the following two limited circumstances:
a) when the intangible asset is expressed as a measure of revenue; or b) when it can be demonstrated that revenue and consumption of the economic benefits of the
intangible asset are highly correlated.
The amendments apply prospectively for annual periods beginning on or after 1 January 2016. Currently, the Group uses the straight-line method for depreciation and amortisation for its property, plant and equipment, and intangible assets respectively. The directors believe that the straight-line method is the most appropriate method to reflect the consumption of economic benefits inherent in the respective assets and accordingly, the directors do not anticipate that the application of these amendments to IAS 16 and IAS 38 will have a material impact on the Group’s consolidated financial statements.

11
NOTES TO THE CONSOLIDATED AND SEPARATE FINANCIAL STATEMENTS 3 Application of new and revised International Financial Reporting Standards (IFRSs)
(continued)
Amendments to IAS 16 and IAS 41 Agriculture: Bearer Plants The amendments to IAS 16 and IAS 41 define a bearer plant and require biological assets that meet the definition ofa bearer plant to be accounted for as property, plant and equipment in accordance with IAS 16, instead of IAS 41. The produce growing on bearer plants continues to be accounted for in accordance with IAS 41.
The directors do not anticipate that the application of these amendments to IAS 16 and IAS 41 will have a material impact on the Group’s consolidated financial statements as the Group is not engaged in agricultural activities.
Amendments to IAS 19 Defined Benefit Plans: Employee Contributions The amendments to IAS 19 clarify how an entity should account for contributions made by employees or third parties to defined benefit plans, based on whether those contributions are dependent on the number of years of service provided by the employee.
For contributions that are independent of the number of years of service, the entity may either recognise the contributions as a reduction in the service cost in the period in which the related service is rendered, or to attribute them to the employees’ periods of service using the projected unit credit method; whereas for contributions that are dependent on the number of years of service, the entity is required to attribute them to the employees’ periods of service.
The directors do not anticipate that the application of these amendments to IAS 19 will have a significant impact on the Group’s consolidated financial statements.
Annual Improvements to IFRSs 2010-2012 Cycle. The Annual Improvements to IFRSs 2010-2012 Cycle include a number of amendments to various IFRSs, which are summarised below.
The amendments to IFRS 2 (i) change the definitions of ‘vesting condition’ and ‘market condition’; and (ii) add definitions for ‘performance condition’ and ‘service condition’ which were previously included within the definition of ‘vesting condition’. The amendments to IFRS 2 are effective for share-based payment transactions for which the grant date is on or after 1 July 2014.
The amendments to IFRS 3 clarify that contingent consideration that is classified as an asset or a liability should be measured at fair value at each reporting date, irrespective of whether the contingent consideration is a financial instrument within the scope of IFRS 9 or IAS 39 or a non-financial asset or liability. Changes in fair value (other than measurement period adjustments) should be recognised in profit or loss. The amendments to IFRS 3 are effective for business combinations for which the acquisition date is on or after 1 July 2014.
The amendments to IFRS 8 (i) require an entity to disclose the judgments made by management in applying the aggregation criteria to operating segments, including a description of the operating segments aggregated and the economic indicators assessed in determining whether the operating segments have ‘similar economic characteristics’; and (ii) clarify that a reconciliation of the total of the reportable segments’ assets to the entity’s assets should only be provided if the segment assets are regularly provided to the chief operating decision-maker.
The amendments to the basis for conclusions of IFRS 13 clarify that the issue of IFRS 13 and consequential amendments to IAS 39 and IFRS 9 did not remove the ability to measure short-term receivables and payables with no stated interest rate at their invoice amounts without discounting, if the effect of discounting is immaterial. As the amendments do not contain any effective date, they are considered to be immediately effective.

12
NOTES TO THE CONSOLIDATED AND SEPARATE FINANCIAL STATEMENTS 3 Application of new and revised International Financial Reporting Standards (IFRSs)
(continued) The amendments to IAS 16 and IAS 38 remove perceived inconsistencies in the accounting for accumulated depreciation/amortisation when an item of property, plant and equipment or an intangible asset is revalued. The amended standards clarify that the gross carrying amount is adjusted in a manner consistent with the revaluation of the carrying amount of the asset and that accumulated depreciation/amortisation is the difference between the gross carrying amount and the carrying amount after taking into account accumulated impairment losses.
The amendments to IAS 24 clarify that a management entity providing key management personnel services to a reporting entity is a related party of the reporting entity. Consequently, the reporting entity should disclose as related party transactions the amounts incurred for the service paid or payable to the management entity for the provision of key management personnel services. However, disclosure of the components of such compensation is not required.
The directors do not anticipate that the application of these amendments will have a significant impact on the Group’s consolidated financial statements.
Annual Improvements to IFRSs 2011-2013 Cycle The Annual Improvements to IFRSs 2011-2013 Cycle include a number of amendments to various IFRSs, which are summarised below.
The amendments to IFRS 3 clarify that the standard does not apply to the accounting for the formation of all types of joint arrangement in the financial statements of the joint arrangement itself.
The amendments to IFRS 13 clarify that the scope of the portfolio exception for measuring the fair value of a group of financial assets and financial liabilities on a net basis includes all contracts that are within the scope of, and accounted for in accordance with, IAS 39 or IFRS 9, even if those contracts do not meet the definitions of financial assets or financial liabilities within IAS 32.
The amendments to IAS 40 clarify that IAS 40 and IFRS 3 are not mutually exclusive and application of both standards may be required. Consequently, an entity acquiring investment property must determine whether:
(a) the property meets the definition of investment property in terms of IAS 40; and (b) the transaction meets the definition of a business combination under IFRS 3.
The directors do not anticipate that the application of these amendments will have a significant impact on the Group’s consolidated financial statements.
13
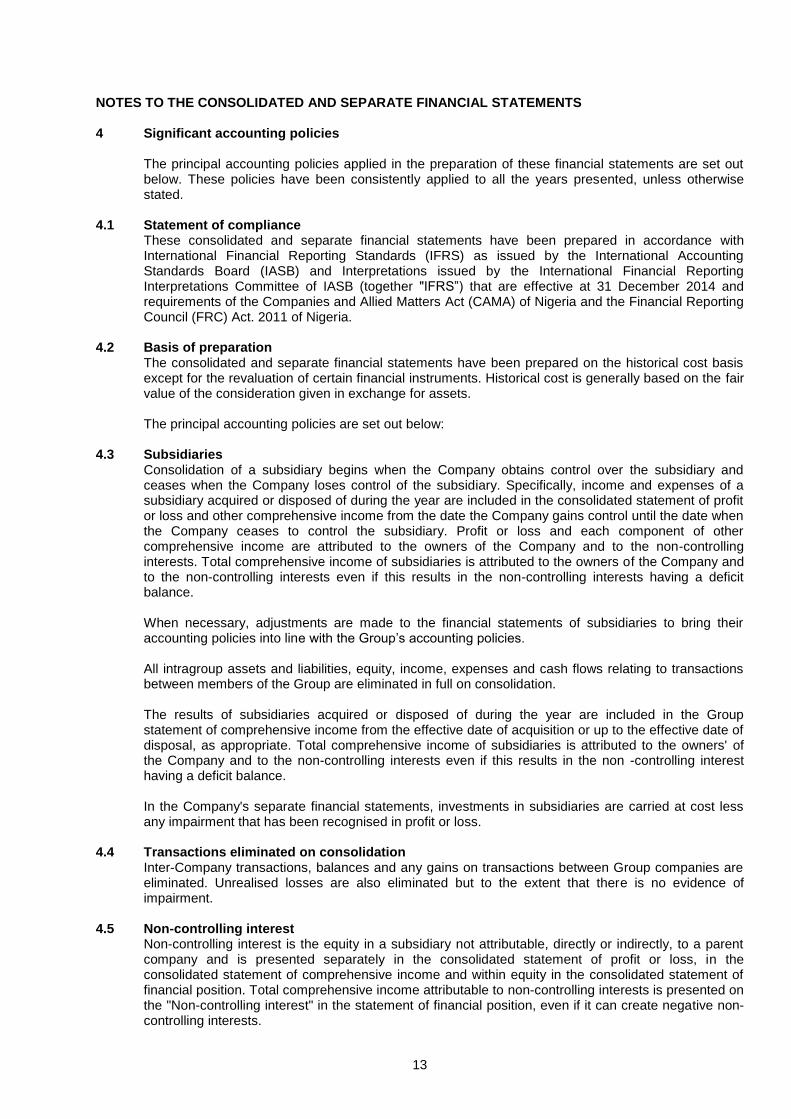
NOTES TO THE CONSOLIDATED AND SEPARATE FINANCIAL STATEMENTS 4 Significant accounting policies
The principal accounting policies applied in the preparation of these financial statements are set out below. These policies have been consistently applied to all the years presented, unless otherwise stated.
4.1 Statement of compliance
These consolidated and separate financial statements have been prepared in accordance with International Financial Reporting Standards (IFRS) as issued by the International Accounting Standards Board (IASB) and Interpretations issued by the International Financial Reporting Interpretations Committee of IASB (together "IFRS”) that are effective at 31 December 2014 and requirements of the Companies and Allied Matters Act (CAMA) of Nigeria and the Financial Reporting Council (FRC) Act. 2011 of Nigeria.
4.2 Basis of preparation
The consolidated and separate financial statements have been prepared on the historical cost basis except for the revaluation of certain financial instruments. Historical cost is generally based on the fair value of the consideration given in exchange for assets.
The principal accounting policies are set out below: 4.3 Subsidiaries
Consolidation of a subsidiary begins when the Company obtains control over the subsidiary and ceases when the Company loses control of the subsidiary. Specifically, income and expenses of a subsidiary acquired or disposed of during the year are included in the consolidated statement of profit or loss and other comprehensive income from the date the Company gains control until the date when the Company ceases to control the subsidiary. Profit or loss and each component of other comprehensive income are attributed to the owners of the Company and to the non-controlling interests. Total comprehensive income of subsidiaries is attributed to the owners of the Company and to the non-controlling interests even if this results in the non-controlling interests having a deficit balance. When necessary, adjustments are made to the financial statements of subsidiaries to bring their accounting policies into line with the Group’s accounting policies. All intragroup assets and liabilities, equity, income, expenses and cash flows relating to transactions between members of the Group are eliminated in full on consolidation.
The results of subsidiaries acquired or disposed of during the year are included in the Group statement of comprehensive income from the effective date of acquisition or up to the effective date of disposal, as appropriate. Total comprehensive income of subsidiaries is attributed to the owners' of the Company and to the non-controlling interests even if this results in the non -controlling interest having a deficit balance.
In the Company's separate financial statements, investments in subsidiaries are carried at cost less any impairment that has been recognised in profit or loss.
4.4 Transactions eliminated on consolidation
Inter-Company transactions, balances and any gains on transactions between Group companies are eliminated. Unrealised losses are also eliminated but to the extent that there is no evidence of impairment.
4.5 Non-controlling interest
Non-controlling interest is the equity in a subsidiary not attributable, directly or indirectly, to a parent company and is presented separately in the consolidated statement of profit or loss, in the consolidated statement of comprehensive income and within equity in the consolidated statement of financial position. Total comprehensive income attributable to non-controlling interests is presented on the "Non-controlling interest" in the statement of financial position, even if it can create negative non-controlling interests.

14
NOTES TO THE CONSOLIDATED AND SEPARATE FINANCIAL STATEMENTS 4 Significant accounting policies (continued)
Changes in the ownership interest of a subsidiary that do not result in loss of control are accounted for as an equity transaction. Consequently, if Company acquires or partially disposes of a non-controlling interest in a subsidiary, without losing control, any difference between the amount by which the non-controlling interest is adjusted and the fair value of the consideration paid or received is recognised directly in equity.
4.6 Acquisition of entities under common control
Business combinations arising from transfers of interests in entities that are under the control of the shareholder that controls the Group are accounted prospectively as of the date that transfer of interest was effected. The assets and liabilities acquired are recognised at the carrying amounts recognised previously in the Group controlling shareholder’s consolidated financial statements. The difference between the consideration paid and the net assets acquired is accounted for directly in equity.
4.7 Functional and presentation currency
These financial statements are presented in Naira, which is the Group's functional currency. All financial information presented in naira has been rounded to the nearest thousand.
4.8 Revenue recognition
Revenue is derived principally from the sale of goods and is measured at the fair value of consideration received or receivable, after deducting discounts, volume rebates, value added tax and any estimated customer returns. Sales are stated at their invoiced amount which is net of value added taxes and discounts.
Sale of goods Revenue from the sale of goods is recognised when all the following conditions are satisfied:
• the Group has transferred to the buyer the significant risks and rewards of ownership of the goods;
• the Group retains neither continuing managerial involvement to the degree usually associated with ownership nor effective control over the goods sold;
• the amount of revenue can be measured reliably; • it is probable that the economic benefits associated with the transaction will flow to the Group;
and • The costs incurred or to be incurred in respect of the transaction can be measured reliably. Specifically, revenue from the sale of goods is recognised when goods are delivered (or collected, if sold under self-collection terms) and legal title is passed. Amount relating to shipping and handling whether included as part of sales is billed separately is recorded as revenue and cost incurred for shipping and handling are classified under selling and distribution expenses.
4.9 Interest income
Interest income from a financial asset is recognised when it is probable that the economic benefits will flow to the Group and the amount of revenue can be measured reliably. Interest income is accrued on a time basis, by reference to the principal outstanding and at the effective interest rate applicable, which is the rate that exactly discounts estimated future cash receipts through the expected life of the financial asset to that asset's net carrying amount on initial recognition.
4.10 Pensions and other post-employment benefits
The Group operates a defined contribution based retirement benefit scheme for its staff, in accordance with the amended Pension Reform Act of 2004 with employee contributing 8% and the employer contributing 10% each of the employee’s relevant emoluments. Payments to defined contribution retirement benefit plans are recognised as an expense in statement of profit or loss when employees have rendered the service entitling them to the contributions.

15
NOTES TO THE CONSOLIDATED AND SEPARATE FINANCIAL STATEMENTS 4 Significant accounting policies (continued) 4.11 Taxation Income tax expense represents the sum of the tax currently payable and deferred tax. 4.11.1 Current tax
The tax currently payable is based on taxable profit for the year. Taxable profit differs from profit as reported in the statements of profit or loss and other comprehensive income because of items of income or expense that are taxable or deductible in other years and items that are never taxable or deductible.
The Group's liability for current tax is calculated using tax rates that have been enacted or substantively enacted by the end of the reporting period.
Current income tax is the expected amount of income tax payable on the taxable profit for the year determined in accordance with the Companies Income Tax Act (CITA) using statutory tax rates at the reporting date. Education tax is assessed at 2% of the assessable profits.
4.11.2 Deferred tax
Deferred tax is recognised on temporary differences between the carrying amounts of assets and liabilities in the financial statements and the corresponding tax bases used in the computation of taxable profit. Deferred tax liabilities are generally recognised for all taxable temporary differences.
Deferred tax assets are generally recognised for all deductible temporary differences to the extent that it is probable that taxable profits will be available against which those deductible temporary differences can be utilised. Such deferred tax assets and liabilities are not recognised if the temporary difference arises from goodwill or from the initial recognition (other than in a business combination) of other assets and liabilities in a transaction that affects neither the taxable profit nor the accounting profit.
The carrying amount of deferred tax assets is reviewed at the end of each reporting period and reduced to the extent that it is no longer probable that sufficient taxable profits will be available to allow all or part of the asset to be recovered.
Deferred tax assets and liabilities are measured at the tax rates that are expected to apply in the period in which the liability is settled or the asset realised, based on tax rates (and tax laws) that have been enacted or substantively enacted by the end of the reporting period. The measurement of deferred tax liabilities and assets reflects the tax consequences that would follow from the manner in which the Group expects, at the end of the reporting period, to recover or settle the carrying amount of its assets and liabilities.
Deferred tax assets and liabilities are offset when there is a legally enforceable right to set off current tax assets against current tax liabilities and when they relate to income taxes levied by the same taxation authority and the Group intends to settle its current tax assets and liabilities on a net Current and deferred tax are recognised in profit and loss, except when they relate to items that are recognised in other comprehensive income or directly in equity, in which case, the current and deferred tax are recognised in other comprehensive income or directly in equity respectively. Where current tax and deferred tax arises from the initial accounting for a business combination, the tax effect is included in the accounting for the business combination.

16
NOTES TO THE CONSOLIDATED AND SEPARATE FINANCIAL STATEMENTS 4.12 Property, plant and equipment
i. Recognition and measurement Items of property, plant and equipment are measured at cost less accumulated depreciation and accumulated impairment losses.
Cost includes expenditure that is directly attributable to the acquisition of the asset. Fixed assets under construction are disclosed as capital work-in-progress. The cost of construction recognised includes the cost of materials and direct labour, any other costs directly attributable to bringing the assets to a working condition for their intended use, the costs of dismantling and removing the items and restoring the site on which they are located, and borrowing costs on qualifying assets.
Purchased software that is integral to the functionality of the related equipment is capitalized as part of the equipment.
When parts of an item of property, plant and equipment have different useful lives, they are accounted for as separate items (major components) of property, plant and equipment.
Gains and losses on disposal of an item of property, plant and equipment are determined by comparing the proceeds from disposal with the carrying amount of property, plant and equipment, and are recognised in the statement of comprehensive income.
ii. Subsequent costs
The cost of replacing a part of an item of property, plant and equipment is recognized in the carrying amount of the item if it is probable that the future economic benefits embodied within the part will flow to the Group and its cost can be measured reliably. The carrying amount of the replaced part is derecognized. The costs of the day-to-day servicing of property, plant and equipment are recognized in profit or loss as incurred.
Depreciation is calculated on the depreciable amount, which is the cost of an asset, or other amount Working Draft substituted for cost, less its residual value.
Depreciation is recognized in profit or loss on a straight-line basis over the estimated useful lives of each part of an item of property, plant and equipment which reflects the expected pattern of consumption of the future economic benefits embodied in the asset. Leased assets are depreciated over the shorter of the lease term and their useful lives unless it is reasonably certain that the Group will obtain ownership by the end of the lease term in which case the assets are depreciated over the useful life.
The estimated useful lives for the current and comparative periods are as follows:
Buildings – 50 years Plant and Machinery – 15 years Motor Vehicles – 4 years Computer Equipment – 3 years Tools and Equipment – 4 years Furniture and Equipment – 5 years Freehold land is not depreciated.
Depreciation methods, useful lives and residual values are reviewed at each financial year end and adjusted if appropriate. Capital work-in-progress is not depreciated. The attributable cost of each asset is transferred to the relevant asset category immediately the asset is available for use and depreciated accordingly.
Properties in the course of construction for production, supply or administrative purposes, or for purposes not yet determined, are carried at cost, less any recognised impairment loss. Cost includes Group’s accounting policy. Depreciation of these assets, on the same basis as other property assets, commences when the assets are ready for their intended use.

17
NOTES TO THE CONSOLIDATED AND SEPARATE FINANCIAL STATEMENTS 4.12 Property, plant and equipment (continued)
Depreciation is recognised so as to write off the cost of assets (other than properties under construction) less their residual values over their useful lives, using the straight-line method. The estimated useful lives, residual values and depreciation method are reviewed at each year end, with the effect of any changes in estimate accounted for on a prospective basis.
Assets held under finance leases are depreciated over their expected useful lives on the same basis as owned assets or, where shorter, the term of the relevant lease.
4.13 Leases
Leases are classified as finance leases whenever the terms of the lease transfer substantially all the risks and rewards of ownership to the lessee. All other leases are classified as operating leases.
Operating lease payments are recognised as an expense on a straight line basis over the lease term, except where another systematic basis is more representative of the time pattern in which economic benefits from the leased assets are consumed. Contingent rentals arising under operating leases are recognised as an expense in the period in which they are incurred.
In the event that lease incentives are received to enter into operating leases, such incentives are recognised as a liability. The aggregate benefit of incentives is recognised as a reduction of rental expense on a straight line basis, except where another systematic basis is more representative of the time pattern in which economic benefits from the leased assets are consumed.
Where there are no agreed lease terms, rent payable is recognised as incurred. 4.14 Intangible assets
Intangible assets acquired separately Intangible assets with finite useful lives that are acquired separately are carried at cost less accumulated amortisation and accumulated impairment losses. Amortisation is recognised on a straight-line basis over their estimated useful lives. The estimated useful life and amortisation method are reviewed at the end of each annual reporting period, with the effect of any changes in estimate being accounted for on a prospective basis. Intangible assets with indefinite useful lives that are acquired separately are carried at cost less accumulated impairment losses.
Derecognition of intangible assets
An intangible asset is derecognised on disposal, or when no future economic benefits are expected from use or disposal. Gains or losses arising from derecognition of an intangible asset, measured as the difference between the net disposal proceeds and the carrying amount of the asset, and are recognised in profit or loss when the asset is derecognised.
4.15 Impairment of Tangible and Intangible assets other than Goodwill
At the end of each reporting period, the Group reviews the carrying amounts of its tangible and intangible assets to determine whether there is any indication that those assets have suffered an impairment loss. If any such indication exists, the recoverable amount of the asset is estimated in order to determine the extent of the impairment loss (if any). Where it is not possible to estimate the recoverable amount of an individual asset, the Group estimates the recoverable amount of the cash-generating unit to which the asset belongs. Where a reasonable and consistent basis of allocation can be identified, corporate assets are also allocated to individual cash-generating units, or otherwise they are allocated to the smallest group of cash-generating units for which a reasonable and consistent allocation basis can be identified.
Intangible assets with indefinite useful lives and intangible assets not yet available for use are tested for impairment at least annually, and whenever there is an indication that the asset may be impaired.
Recoverable amount is the higher of fair value less costs to sell and value in use. In assessing value in use, the estimated future cash flows are discounted to their present value using a pre-tax discount rate that reflects current market assessments of the time value of money and the risks specific to the asset for which the estimates of future cash flows have not been adjusted.

18
NOTES TO THE CONSOLIDATED AND SEPARATE FINANCIAL STATEMENTS 4.15 Impairment of Tangible and Intangible assets other than Goodwill (continued)
If the recoverable amount of an asset (or cash-generating unit) is estimated to be less than its carrying amount, the carrying amount of the asset (or cash-generating unit) is reduced to its recoverable amount. An impairment loss is recognised immediately in profit or loss.
Where an impairment loss subsequently reverses, the carrying amount of the asset (or cash-generating unit) is increased to the revised estimate of its recoverable amount, but so that the increased carrying amount does not exceed the carrying amount that would have been determined had no impairment loss been recognised for the asset (or cash-generating unit) in prior years. A reversal of an impairment loss is recognised immediately in profit or loss.
4.16 Inventories
Inventories are stated at the lower of cost and net realisable value. Cost of engineering spares and consumable stock is determined on a first in first out basis. Cost of other stock (Raw materials, packaging materials, work in progress and finished goods) is determined on the basis of standard costs adjusted for variances. Standard costs are periodically reviewed to approximate actual costs.
Goods in transit are valued at the invoice price. Cost of inventory includes purchase cost, conversion cost (materials, labour and overhead) and other costs incurred to bring inventory to its present location and condition. Finished goods, which include direct labour and factory overheads, are valued at standard cost adjusted at year-end on an actual cost basis.
Costs, including an appropriate portion of fixed and variable overhead expenses, are assigned to inventories by the method most appropriate to the particular class of inventory, with the majority being valued on an average cost basis. Net realisable value represents the estimated selling price for inventories less all estimated costs of completion and costs necessary to make the sale.
4.17 Provisions
Provisions are recognised when the Group has a present obligation (legal or constructive) as a result of a past event, it is probable that the Group will be required to settle the obligation, and a reliable estimate can be made of the amount of the obligation (when the time value of money is material).
The amount recognised as a provision is the best estimate of the consideration required to settle the present obligation at the end of the reporting period, taking into account the risks and uncertainties surrounding the obligation. Where a provision is measured using the cash flows estimated to settle the present obligation, its carrying amount is the present value of those cash flows.
When some or all of the economic benefits required to settle a provision are expected to be recovered from a third party, a receivable is recognised as an asset if it is virtually certain that reimbursement will be received and the amount of the receivable can be measured reliably.
4.17.1 Onerous contracts
Present obligations arising under onerous contracts are recognised and measured as provisions. An onerous contract is considered to exist where the Group has a contract under which the unavoidable costs of meeting the obligations under the contract exceed the economic benefits expected to be received from the contract
4.17.2 Environmental costs
Costs incurred that result in future economic benefits, such as extending useful lives, increasing capacity or safety, and those costs incurred to mitigate or prevent future environmental contamination are capitalized. When the Group’s management determine that it is probable that a liability for the future remediation cost is recorded as a provision without contingent insurance recoveries being offset (only virtually certain insurance recoveries are recognized as an asset on the statement of financial position). When we do not have a reliable reversal time schedule or when the effect of the passage of time is not significant, the provision is calculated based on undiscounted cash flows.
Environmental costs, which are not included above, are expensed as incurred.

19
NOTES TO THE CONSOLIDATED AND SEPARATE FINANCIAL STATEMENTS 4.18 Financial instruments
Financial assets and financial liabilities are recognised when the Group becomes a party to the contractual provisions of the instrument.
Financial assets and financial liabilities are initially measured at fair value. Transaction cost that are directly attributable to the acquisition or issue of the financial assets and financial liabilities (other than financial assets or financial liabilities at fair value through profit or loss) are added to or deducted from the fair value of the financial assets or financial liabilities, as appropriate, on initial recognition. Transaction costs directly attributable to the acquisition of financial assets or financial liabilities at fair value through profit or loss are recognised immediately in profit or loss.
Financial assets
Financial assets are classified into the following specified categories: financial assets „at fair value through profit or loss‟ (FVTPL), ‘held-to-maturity‟ investments, “available-for-sale‟ (AFS) financial assets and “loans and receivables‟. The classification depends on the nature and purpose of the financial assets and is determined at the time of initial recognition. All regular purchases or sales of financial assets are recognised and derecognized on a trade date basis. Regular purchases or sales are purchases or sales of financial assets that require delivery of assets within the time frame established by regulation or convention in the market place. The Group’s financial assets comprise other loans and receivables.
Effective interest method
The effective interest method is a method of calculating the amortised cost of a debt instrument and of allocating interest income over the relevant period. The effective interest rate is the rate that exactly discounts estimated future cash receipts (including all fees on points paid or received that form an integral part of the effective interest rate, transaction costs and other premiums or discounts) through the expected life of the debt instrument, or (where appropriate) a shorter period, to the net carrying amount on initial recognition.
Income is recognised on an effective interest basis for debt instruments other than those financial assets classified as at FVTPL.
Loans and receivables
Loans and receivables are non-derivative financial assets with fixed or determinable payments that are not quoted in an active market. Loans and receivables (including trade and other receivables) are measured at amortised cost using the effective interest method, less any impairment. Interest income is recognised by applying the effective interest rate, except for short-term receivables when the recognition of interest would be immaterial
Impairment of financial assets
Financial assets, other than those at FVTPL, are assessed for indicators of impairment at the end of Working Draft each reporting period. Financial assets are considered impaired when there is objective evidence that as a result of one or more events that occurred after the initial recognition of the financial asset, the estimated future cash flows of the investment have been affected.
For all categories of financial assets, objective evidence of impairment could include:
• significant financial difficulty of the issuer or counterparty, or
• breach of contract, such as a default or delinquency in interest or principal payments; or
• It is becoming probable that the owner will enter bankruptcy or financial re-organisation; or
• the disappearance of an active market for that financial asset because of financial difficulties.

20
NOTES TO THE CONSOLIDATED AND SEPARATE FINANCIAL STATEMENTS Impairment of financial assets (continued)
For certain categories of financial asset, such as trade receivables, assets that are assessed not to be impaired individually are, in addition, assessed for impairment on a collective basis. Objective evidence of impairment for a portfolio of receivables could include the Group‟s past experience of collecting payments, an increase in the number of delayed payments in the portfolio past the average credit period of 30 days, as well as observable changes in national or local economic conditions that correlate with default on receivables.
For financial assets carried at amortised cost, the amount of the impairment loss recognised is the difference between the asset’s carrying amount and the present value of estimated future cash flows, discounted at the financial asset’s original effective interest rate.
For financial assets carried at cost, the amount of the impairment loss is measured as the difference between the asset’s carrying amount and the present value of the estimated future cash flows discounted at the current market rate of return for a similar financial asset. Such impairment loss will not be reversed in subsequent periods.
The carrying amount of the financial asset is reduced by the impairment loss directly for all financial assets with the exception of trade receivables, where the carrying amount is reduced through the use of an allowance account. When a trade receivable is considered uncollectible, it is written off against the allowance account. Subsequent recoveries of amounts previously written off are credited against the allowance account. Changes in the carrying amount of the allowance account are recognised in profit or loss.
Derecognition of financial assets
The Group derecognises a financial asset only when the contractual rights to the cash flows from the asset expire, or when it transfers the financial asset and substantially all the risks and rewards of ownership of the asset to another entity. If the Group neither transfers nor retains substantially all the risks and rewards of ownership and continues to control the transferred asset, the Group recognises its retained interest in the asset and an associated liability for amounts it may have to pay.
If the Group retains substantially all the risks and rewards of ownership of a transferred financial asset, the Group continues to recognise the financial asset and also recognises a collateralised borrowing for the proceeds received.
On derecognition of a financial asset in its entirety, the difference between the asset’s carrying amount and the sum of the consideration received and receivable and the cumulative gain or loss that had been recognised in other comprehensive income and accumulated in equity is recognised in profit or loss.
4.19 Cash and cash equivalents
Cash and cash equivalents consist of cash, highly liquid investments and cash equivalents which are not subject to significant changes in value and with an original maturity date of generally less than three months from the time of purchase.
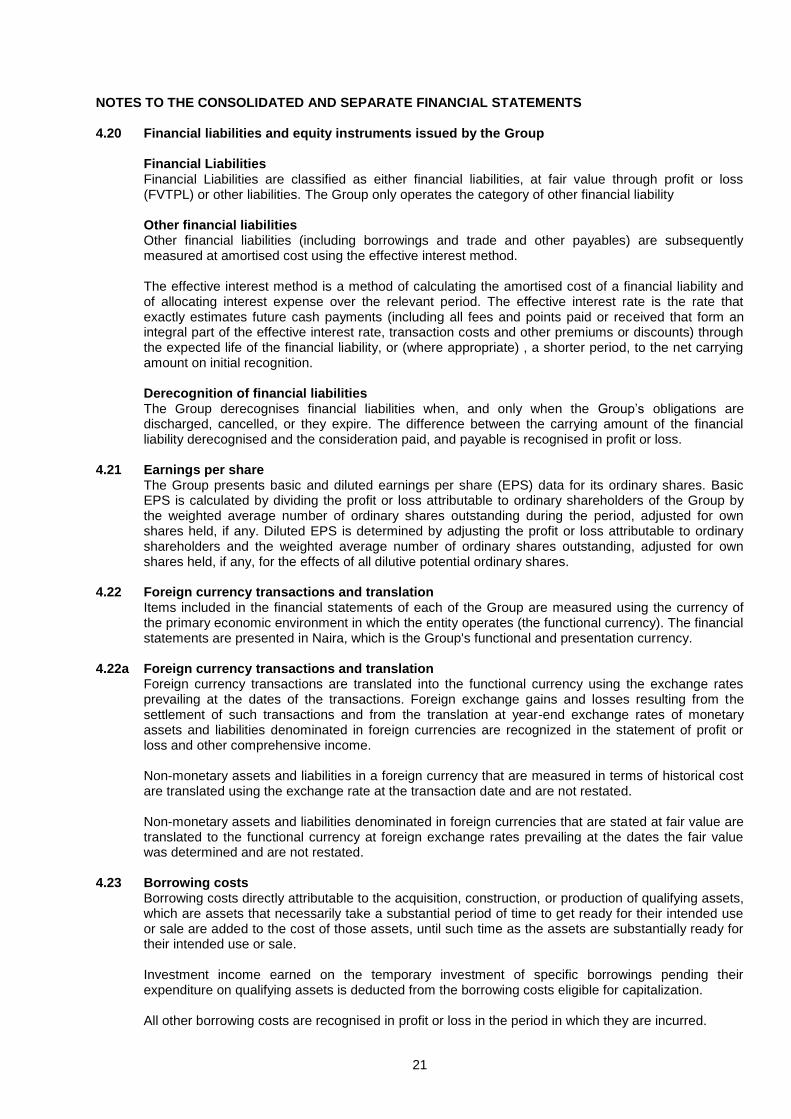
4.20 Financial liabilities and equity instruments issued by the Group Classification as debt or equity
Debts and equity instruments are classified as either financial liabilities or as equity in accordance with the substance of the contractual arrangements and the definitions of a financial liability and an equity instrument.
Equity instruments
An equity instrument is any contract that evidences a residual interest in the assets of an entity after deducting all of its liabilities. Equity instruments issued by the Group are recognised at the proceeds received, net of direct issue costs.
Incremental costs directly attributable to the issue of ordinary shares and share options are recognized as a deduction from equity, net of any tax effects.
21
NOTES TO THE CONSOLIDATED AND SEPARATE FINANCIAL STATEMENTS 4.20 Financial liabilities and equity instruments issued by the Group Financial Liabilities
Financial Liabilities are classified as either financial liabilities, at fair value through profit or loss (FVTPL) or other liabilities. The Group only operates the category of other financial liability
Other financial liabilities
Other financial liabilities (including borrowings and trade and other payables) are subsequently measured at amortised cost using the effective interest method.
The effective interest method is a method of calculating the amortised cost of a financial liability and of allocating interest expense over the relevant period. The effective interest rate is the rate that exactly estimates future cash payments (including all fees and points paid or received that form an integral part of the effective interest rate, transaction costs and other premiums or discounts) through the expected life of the financial liability, or (where appropriate) , a shorter period, to the net carrying amount on initial recognition.
Derecognition of financial liabilities
The Group derecognises financial liabilities when, and only when the Group’s obligations are discharged, cancelled, or they expire. The difference between the carrying amount of the financial liability derecognised and the consideration paid, and payable is recognised in profit or loss.
4.21 Earnings per share
The Group presents basic and diluted earnings per share (EPS) data for its ordinary shares. Basic EPS is calculated by dividing the profit or loss attributable to ordinary shareholders of the Group by the weighted average number of ordinary shares outstanding during the period, adjusted for own shares held, if any. Diluted EPS is determined by adjusting the profit or loss attributable to ordinary shareholders and the weighted average number of ordinary shares outstanding, adjusted for own shares held, if any, for the effects of all dilutive potential ordinary shares.
4.22 Foreign currency transactions and translation
Items included in the financial statements of each of the Group are measured using the currency of the primary economic environment in which the entity operates (the functional currency). The financial statements are presented in Naira, which is the Group's functional and presentation currency.
4.22a Foreign currency transactions and translation
Foreign currency transactions are translated into the functional currency using the exchange rates prevailing at the dates of the transactions. Foreign exchange gains and losses resulting from the settlement of such transactions and from the translation at year-end exchange rates of monetary assets and liabilities denominated in foreign currencies are recognized in the statement of profit or loss and other comprehensive income.
Non-monetary assets and liabilities in a foreign currency that are measured in terms of historical cost are translated using the exchange rate at the transaction date and are not restated.
Non-monetary assets and liabilities denominated in foreign currencies that are stated at fair value are translated to the functional currency at foreign exchange rates prevailing at the dates the fair value was determined and are not restated.
4.23 Borrowing costs
Borrowing costs directly attributable to the acquisition, construction, or production of qualifying assets, which are assets that necessarily take a substantial period of time to get ready for their intended use or sale are added to the cost of those assets, until such time as the assets are substantially ready for their intended use or sale.
Investment income earned on the temporary investment of specific borrowings pending their expenditure on qualifying assets is deducted from the borrowing costs eligible for capitalization.
All other borrowing costs are recognised in profit or loss in the period in which they are incurred.

22
NOTES TO THE CONSOLIDATED AND SEPARATE FINANCIAL STATEMENTS 4.25 Segment information
Information reported to the Chief Operating decision maker of the Group for the purposes of resource allocation and assessment of segment performance focuses on its sole product, refined sugar based on different geographical location. Segment reporting has been prepared based on the geographical information of the group
5 Critical accounting judgements and key sources of estimation uncertainty
In the application of the group’s significant accounting policies, described in note 4, the directors are required to make judgments, estimates and assumptions about the carrying amounts of assets and liabilities that are not readily apparent from other sources. The estimates and associated assumptions are based on historical experience and other factors that are considered to be relevant.
Actual results may differ from these estimates.
The estimates and underlying assumptions are reviewed on an ongoing basis. Revisions to accounting estimates are recognised in the period in which the estimate is revised if the revision affects only that period, or in the period of the revision and future periods if the revision affects both current and future periods.
5.1 Critical judgements in applying accounting policies
The following are the critical judgements, apart from those involving estimations (see note 5.2 below), that the directors have made in the process of applying the Group’s accounting policies and that have the most significant effect on the amounts recognised in the consolidated financial statements.
The key assumptions concerning the future, and other key sources of estimation uncertainty at the reporting date, that have a significant risk of causing a material adjustment to the carrying amounts of assets and liabilities within the next financial year, are discussed below.
5.1.0 Revenue Recognition In recognising revenue, critical judgement is made with respect to the mode of delivery. Where the customer opts to make personal arrangement to take delivery of goods by bringing his own truck, revenue is recognised as soon as the truck is loaded and a waybill is generated. However, where the customer opts for delivery to be made using DSR trucks, revenue is recognised only when the goods are delivered at the address provided and receipt of same is acknowledged on the waybill.
5.1.1 Allowance for credit losses
The Group periodically assesses its trade receivables for probability of credit losses. Management considers several factors including past credit record, current financial position and credibility of management, judgment is exercised in determining the allowances made for credit losses. Provisions are made for receivables that have been outstanding for 365 days, in respect of which there is no firm commitment to pay by the customer.
Furthermore all balances are reviewed for evidence of impairment and provided against once recovery is doubtful. These assessments are subjective and involve a significant element of judgment by management on the ultimate recoverability of amounts receivable.
5.1.2 Fair values of biological assets
The fair value of the biological asset is derived using a replacement cost approach. Management uses estimates for the costs to replace the biological asset by segmenting the assets into their various life circles less expected costs to produce and sell the sugar and molasses, which are determined by considering historical actual costs incurred on a per hector basis. The estimated selling price and costs are subject to fluctuations based on the timing of prevailing growing conditions economic and market conditions as obtained from the various units directly involved in the sales and biological transformation of the assets.

23
NOTES TO THE CONSOLIDATED AND SEPARATE FINANCIAL STATEMENTS 5.2 Key sources of estimation uncertainty
The following are the key assumptions concerning the future, and other key sources of estimation uncertainty at the end of the reporting period, that have a significant risk of causing a material adjustment to the carrying amounts of assets and liabilities within the next financial year.
5.2.1 Useful life of property, plant and equipment
The Group reviewed and revised the estimated useful lives of its property, plant and equipment on transition to IFRS on 1 January, 2011, and under IFRS, has reviewed them annually at each reporting date. Useful lives are estimated based on the engineer’s report, as at each reporting date. Some of the factors considered include the current service potential of the assets, potential cost of repairs and maintenance.
There is a degree of subjective judgment in such estimation which has a resultant impact on profit and total comprehensive income for the year.
5.2.2 Valuation of deferred tax
The recognition of deferred tax assets requires an assessment of future taxable profit. Deferred tax assets are only recognised to the extent that it is probable that taxable profits will be available against which deductible temporary differences can be utilised. The availability of future taxable profits depends on several factors including the group's future financial performance and if necessary, implementation of tax planning strategies.
GROUP
GROUP
COMPANY
COMPANY
31/12/2014 N'000
31/12/2013 N'000
31/12/2014 N'000
31/12/2013 N'000
6 Revenue
Sale of sugar - 50kg 90,549,360
100,381,353
89,811,404
99,732,874
Sale of sugar - Retail
1,234,714
557,729
1,234,714
557,729
Sale of molasses
58,390
120,927
44,820
83,032
Freight income
3,012,739
2,093,726
3,012,739
2,093,726
94,855,203
103,153,735
94,103,677
102,467,361
Revenue comprises of both domestic and export sales. 6.1 Segment information
Information reported to the chief operating decision maker (the Managing Director) for the purposes of resource allocation and assessment of segment performance is based on the entity as a whole as there is no other distinguishable component of the entity that engages in business activities from which it earns revenues and incurs expenses whose operating results are regularly reviewed by the Managing Director to make decisions about resources to be allocated to the segment and assess its performance and for which discrete financial information is available. Segment information is presented in respect of the group's reportable segments. For Management purposes, the Group is organised into business units by geographical areas in which the group operates and the locations that comprise such regions represent operating segments. The Group has 4 reportable segments based on location of the principal operations as follows:
Ghana, North Nigeria, South Nigeria, East Nigeria and Lagos.

DANGOTE SUGAR REFINERY PLC Consolidated and separate financial statements
For the year ended 31 December 2014
24
NOTES TO THE CONSOLIDATED AND SEPARATE FINANCIAL STATEMENTS 6.2 Geographical information The group's revenue from external customers by region of operations is listed below.
GROUP
GROUP
COMPANY
COMPANY
31/12/2014 N'000
31/12/2013 N'000
31/12/2014 N'000
31/12/2013 N'000
Ghana
-
1,794,738
-
1,794,738
Nigeria:
Lagos
26,504,641
56,097,204
26,504,640
56,097,204
North
38,296,462
30,065,627
37,544,935
29,379,253
West
25,987,415
11,143,855
25,987,415
11,143,854
East
4,066,685
4,052,311
4,066,687
4,052,312
94,855,203
103,153,735
94,103,677
102,467,361
GROUP
Segment Revenue
Segment Cost of Sales
Segment Profit
31/12/2014
31/12/2013
31/12/2014
31/12/2013
31/12/2014
31/12/2013
N'000
N'000
N'000
N'000
N'000
N'000 Ghana
-
1,794,738
-
1,322,354
-
472,384
Nigeria:
Lagos
26,504,641
56,097,204
19,136,869
41,332,152
7,367,772
14,765,052 North
38,296,462
30,065,627
28,784,332
24,704,294
9,512,130
5,361,333
West
25,987,415
11,143,855
25,369,765
8,210,738
617,650
2,933,117 East
4,066,685
4,052,311
2,936,227
2,985,723
1,130,458
1,066,588
94,855,203
103,153,735
76,227,193
78,555,261
18,628,010
24,598,474
COMPANY
Segment Revenue
Segment Cost of Sales
Segment Gross Profit
31/12/2014
31/12/2013
31/12/2014
31/12/2013
31/12/2014
31/12/2013
N'000
N'000
N'000
N'000
N'000
N'000
Ghana
-
1,794,738
-
1,322,354
-
472,384
Nigeria:
Lagos
26,504,640
56,097,204
19,136,870
41,332,152
7,367,770
14,765,052 North
37,544,935
29,379,253
27,108,178
21,646,494
10,436,757
7,732,759
West
25,987,415
11,143,854
23,187,800
8,210,740
2,799,615
2,933,114 East
4,066,687
4,052,312
2,936,227
2,985,723
1,130,460
1,066,589
94,103,677
102,467,361
72,369,075
75,497,463
21,734,602
26,969,898
GROUP
Total Segment Assets
Total Segment Liabilities
31/12/2014
31/12/2013
31/12/2014
31/12/2013
N'000
N'000
N'000
N'000 Ghana
-
-
-
- Lagos
92,801,302
83,159,878
41,387,582
36,181,937 North
-
-
-
- West
-
-
-
- East
- - - -
92,801,302 83,159,878 41,387,582 36,181,937
COMPANY
Total Segment Assets
Total Segment Liabilities
31/12/2014
31/12/2013
31/12/2014
31/12/2013
N'000
N'000
N'000
N'000
Ghana
-
-
-
-
Lagos
97,287,804
87,112,182
38,761,602
33,294,670
North
-
-
-
-
West
-
-
-
-
East
- - - -
97,287,804 87,112,182 38,761,602 33,294,670

DANGOTE SUGAR REFINERY PLC Consolidated and separate financial statements
For the year ended 31 December 2014
25
NOTES TO THE CONSOLIDATED AND SEPARATE FINANCIAL STATEMENTS 6.3 Information about major customers
There is a single customer who buys industrial Non- Fortified Sugar that represents more than 10% of total sales during the year.
6.3.1 Large Corporate/Industrial Users
These are leading blue chip companies in Nigeria, and they include manufacturers of confectioneries and soft drinks. This group typically accounts for 30% of the company's sales. They buy Non-Fortified sugar exclusively.
6.3.2 Distributors
The company sells unfortified sugar mainly to pharmaceutical, food and beverage manufacturers, while Vitamin A-fortified sugar is sold to distributors who sell to small wholesalers, confectioners and other smaller value-adding enterprises who provide the distribution network to the Nigerian retail market. The Company sells a small amount of sugar directly to retail customers. Retail packaging comes in various sizes of 250g, 500g, and 1kg under the brand name “Dangote Sugar”. Sales to Distributors account for 70% of the company's revenue.
6.3.3 The Company provides a delivery service to customers by transporting refined sugar to other
destinations. Freight income represents revenue earned in this respect during the year. The associated cost of providing this service is included in cost of sales.
GROUP
GROUP
COMPANY
COMPANY
7 Cost of sales 31/12/2014
N'000 31/12/2013
N'000 31/12/2014
N'000 31/12/2013
N'000
Raw material 60,018,765
65,567,707
59,619,604
63,801,527
Direct labour cost 3,122,304
608,065
1,522,499
539,917
Direct overheads 7,034,802
8,283,193
6,050,947
8,210,618
Other overheads 495,928
19,778
405,976
18,898
Depreciation 3,232,313
2,159,542
2,446,968
1,009,527
Fleet expenses 2,323,081
1,916,976
2,323,081
1,916,976
76,227,193
78,555,261
72,369,075
75,497,463
7.1 Selling and distribution expenses
Carriage expenses 1,012
2,008,962
720,090
1,992,996
Selling and marketing expenses 1,954,657
1,425,899
1,115,713
1,425,899
1,955,669
3,434,861
1,835,803
3,418,895

26
NOTES TO THE CONSOLIDATED AND SEPARATE FINANCIAL STATEMENTS
GROUP
GROUP
COMPANY
COMPANY
8 Administrative expenses 31/12/2014
N'000
31/12/2013 N'000
31/12/2014 N'000
31/12/2013 N'000
Salaries and related staff cost 2,117,611
2,976,528
1,581,724
2,175,547
Depreciation 425,723
725,748
324,399
715,723
Utilities 257,366
182,907
171,968
129,819
Rents 112,039
59,679
112,039
58,385
Audit fees 44,000
40,700
32,000
32,000
Management fee 605,529
2,007,544
590,462
2,007,544
Directors' remuneration 84,954
91,946
84,954
91,946
Impairment loss 294,442
576,953
225,680
544,885
Fair value adjustment on biological asset -
373,915
-
-
Legal and professional fees 217,038
180,591
163,939
160,359
Gratuity 216,094
-
-
-
Subscription and donations 23,725
284,969
23,724
281,199
Advertisements and promotions 1,877
63,404
1,877
63,404
Transport and travelling 118,403
131,620
118,403
98,365
Security expense 70,862
176,372
70,862
152,111
Insurance 86,582
87,433
86,582
51,017
Others 1,968,144
750,563
1,366,840
638,838
6,644,389
8,710,872
4,955,453
7,201,142
9
Investment income Interest income on bank deposits 285,594
1,491,638
285,594
1,491,637
285,594
1,491,638
285,594
1,491,637
Interest is earned on bank deposits at an average rate of 11.45 % p.a. on short term (30days) bank deposits.
9.1 Finance cost The average effective interest rate on funds borrowed generally is 10% per annum for the Group and Company (2013: 10% and 12% per annum respectively).
GROUP GROUP COMPANY COMPANY
10 Other income 31/12/2014
N'000
31/12/2013 N'000
31/12/2014 N'000
31/12/2013 N'000
Insurance claims 1,222,799
35,350
1,222,799
2,962
Insurance claims on burnt assets 47,223
1,879,269
-
1,879,269
Sales of scrap materials 1,435,877
238,011
208,215
140,474
Fleet Income 487,005
-
487,005
-
Electricity supply 73,856
-
73,856
-
Exchange Gain 285,775
-
285,775
-
Bad debt recovered 11,543
-
11,543
-
Export grant -
235,314
-
235,314
Fair value adjustment on Biological assets(Note 17) 1,501,971
-
-
5,066,049
2,387,944
2,289,193
2,258,019

27
NOTES TO THE CONSOLIDATED AND SEPARATE FINANCIAL STATEMENTS 11 Taxation GROUP
GROUP
COMPANY
COMPANY
31/12/2014 N'000
31/12/2013 N'000
31/12/2014 N'000
31/12/2013 N'000
11.1 Income tax recognized in profit or loss
Current Tax
Income tax based on profit for the year 5,302,009
4,352,695
5,295,430
4,346,197
Education tax expense 399,124
391,727
399,124
391,727
In respect of prior years -
469,237
-
469,237
5,701,133
5,213,659
5,694,554
5,207,161
Deferred tax
Deferred tax (income)/expense (2,063,760)
132,109
(130,403)
1,281,284
In respect of prior years -
73,459
-
73,460
3,637,373
5,419,227
5,564,151
6,561,905
The tax rates used in the above comparative figures are the corporate tax rate of 30% payable by corporate entities in Nigeria. Education tax rate of 2% is also payable.
11.2 The income tax expense for the year can be reconciled to the accounting profit as follows:
31/12/2014 N'000
31/12/2013 N'000
31/12/2014 N'000
31/12/2013 N'000
Profit before tax 15,273,152
16,265,159
17,472,841
20,099,517
Income tax expense calculated at 32 %( 2013:32%) 4,887,408
5,204,850
5,591,309
6,431,845
Effect of capital gains tax rolled over -
80,775
-
80,775
Effect of Investment allowance, not recognised in accounting 1,694
(98,602)
55,169
(98,602)
Effect of expenses which are not deductible in determining profits 55,169
23,017
-
21,884
Effect of concessions (research and development and other allowances) (1,324,150)
-
(49,007)
-
Effect of income items that are exempt from tax -
(406,430)
-
(406,430)
Effect of minimum tax adjustment 6,579
6,498
-
- Others 93,660
66,423
49,667 (10,263)
Education tax at 2% of assessable profits -
-
-
-
Effect of Capital gains tax rolled over 41,395
-
41,395
-
Capital gains on disposal of assets (subject to tax at different rates) (124,382)
-
(124,382)
-
Adjustments recognised in the current year in relation to the deferred tax of prior years -
73,459
-
73,459
Adjustments recognised in the current year in relation to the current tax of prior years -
469,237
-
469,237
Income tax expense recognised in profit or loss. 3,637,373
5,419,227
5,564,151
6,561,905

28
NOTES TO THE CONSOLIDATED AND SEPARATE FINANCIAL STATEMENTS GROUP GROUP COMPANY COMPANY
31/12/2014 N'000
31/12/2013 N'000
31/12/2014 N'000
31/12/2013 N'000
11.3 Current tax liabilities in the statement of
financial position
Balance, beginning of the year
4,756,600
5,408,566
4,737,924
5,408,566
Effect of acquisition of subsidiary under common control (Note 32.2) -
12,178
-
-
Charge for the year (Note 11.1)
5,701,133
5,213,659
5,694,554
5,207,161
payment made during the year
(4,521,548)
(5,877,803)
(4,521,548)
(5,877,803)
Balance end of the year
5,936,185
4,756,600
5,910,930
4,737,924
11.3.1 Current Tax Liabilities
Income tax
5,302,009
4,352,695
5,295,430
4,346,197
Education tax
399,124
391,727
399,124
391,727
Provision in respect of under accruals in earlier years -
469,237
-
469,237
5,701,133
5,213,659
5,694,554
5,207,161
11.4 Deferred tax balances
Deferred tax assets
2,488,822
555,465
-
-
Deferred tax liability
(4,611,315)
(4,741,717)
(4,229,514)
(4,359,916)
Net deferred tax assets/ (liabilities) (2,122,493)
(4,186,252)
(4,229,514)
(4,359,916)

29
NOTES TO THE CONSOLIDATED AND SEPARATE FINANCIAL STATEMENTS 11.4.1 Deferred tax Opening
balance Movements
Recognised
Closing balance
recognized
directly in
Group
equity
31/12/14 N'000
N'000
N'000
N'000
Deferred tax (liabilities)/assets in relation to:
Property, plant and equipment @ 30% (6,615,874)
(49,772)
1,273,449
(5,392,197)
Property, plant and equipment @ 10% (80,775)
(41,395)
-
(122,170)
Exchange difference (17,752)
772,274
-
754,522
Provisions 467,665
109,204
-
576,869
Unrelieved losses @ 30% 2,442,285
-
-
2,442,285
Capital gains tax on revaluation of land @ 10% (381,801)
-
-
(381,801)
(4,186,252)
790,311
1,273,449
(2,122,492)
Group Opening balance
Effect of acquisition of
subsidiary under
common control
Movements recognized in the year
by the company
Recognised directly
in equity
Recognised directly
in equity
N'000
N'000
N'000
N'000 N'000
31/12/13
Deferred tax (liabilities)/assets
in relation to:
Property, plant and equipment @
30% (3,401,406)
(2,277,753)
(936,714)
- (6,615,873) Property, plant and equipment @ 10% -
-
(80,775)
- (80,775)
Exchange difference -
-
(17,752)
- (17,752) provisions 400,838
356,171
(284,741)
(4,604) 467,664
Unrelieved losses @ 30% -
1,327,871
1,114,414
- 2,442,285 Capital gains tax on revaluation of land @ 10% -
(381,801)
-
- (381,801)
(3,000,568)
(975,512)
(205,568)
(4,604) (4,186,252)
Opening balance
Movements
recognized
in the year
Recognised
Company
by the company
directly in equity
Closing balance
N'000
N'000
N'000
N'000
31/12/14
Deferred tax (liabilities)/assets in relation to:
Property, plant and equipment @ 30% (4,726,291)
170,314
-
(4,555,977)
Property, plant and equipment @ 10% (80,775)
(41,395)
-
(122,170)
Exchange difference 17,752
-
-
17,752
Provisions 429,398
1,483
-
430,881
(4,359,916)
130,402
-
(4,229,514)
31/12/13
Deferred tax (liabilities)/assets in relation to:
Property, plant and equipment @ 30% (3,401,406)
(1,324,885)
-
(4,726,291)
Property, plant and equipment @ 10% -
(80,775)
-
(80,775)
Exchange difference -
17,752
-
17,752
Provisions 400,838
33,163
(4,603)
429,398
(3,000,568)
(1,354,745
(4,603)
(4,359,916)

30
NOTES TO THE CONSOLIDATED AND SEPARATE FINANCIAL STATEMENTS
GROUP
GROUP
COMPANY
COMPANY
12 Profit for the year is arrived at after charging:
31/12/2014 N'000
31/12/2013 N'000
31/12/2014 N'000
31/12/2013 N'000
Impairment of property, plant and equipment
-
79,062
-
63,551
Depreciation of property, plant and equipment
3,572,263
2,885,292
2,685,729
1,725,252
(Write back) /Impairment loss recognised on trade receivables (1,033,747)
342,165
34,936
139,168
Impairment loss recognised on other receivables
75,629
155,725
14,421
342,166
Defined contribution plans
161,554
191,622
117,531
93,392
Defined Benefit Plan
216,094
191,731
-
229,321
Auditors remuneration
40,700
32,000
32,000
32,000
Amortisation of Intangible assets
115,705
-
85,638
-
13 Earnings per share
The earnings weighted average number of ordinary
shares used in the calculation of basic earnings per share
are as follows:
Profit for the year
11,635,779
10,845,932
11,908,690
13,537,612
Earnings used in the calculation of basic earnings per share from continuing operations
11,635,779
10,845,932
11,908,690
13,537,612
Weighted average number of ordinary shares for the
purpose of basic and diluted earnings per share
12,000,000
12,000,000
12,000,000
12,000,000
Basic and diluted EPS (kobo)
97
90
99
113

DANGOTE SUGAR REFINERY PLC Consolidated and separate financial statements
For the year ended 31 December 2014
31
NOTES TO THE CONSOLIDATED AND SEPARATE FINANCIAL STATEMENTS 14 Property, Plant and Equipment Group
Freehold Land &Buildings
Plant & Machinery
Tools & Equipment
Motor Vehicles
Computer Equipment
Furniture & Fittings
Aircraft
Capital Work In Progress
Total
N'000
N'000 N'000
N'000
N'000
N'000
N'000
N'000
N'000
COST:
Balance as at 1/01/2013
4,929,330
12,151,252 319,442
3,521,981
23,047
44,882
-
4,487,381
25,477,315 Effect of acquisition of subsidiary under common control(Note 32)
9,576,069
6,021,310 1,996,164
1,447,208
5,161
48,051
-
-
19,093,963
-
Additions during the year
55,781
3,244,334 43,752
4,343,235
7,232
28,893
899,828
1,657,751
10,280,806 Disposal
-
- -
-
-
-
-
(54,781)
(54,781)
-
Balance, 31/12/2013
14,561,180
21,416,896 2,359,358
9,312,424
35,440
121,826
899,828
6,090,351
54,797,303
-
Additions during the year
2,681,206
153,059 117,001
656,296
117,249
117,749
-
7,238,847
11,081,407
Reclassifications
-
- -
-
-
-
-
1,138,999
1,138,999
Disposal
-
- -
(16,401)
-
-
-
-
(16,401)
Impairment
-
- -
(21,493)
-
-
-
-
(21,493)
Balance, 31/12/2014
17,242,386
21,569,955 2,476,359
9,930,826
152,689
239,575
899,828
14,468,197
66,979,815
ACCUMULATED DEPRECIATION AND IMPAIRMENT:
Balance as at 1/1/2013
669,599
4,283,453 30,105
2,556,469
17,479
21,900
-
-
7,579,005 Effect of acquisition of subsidiary under common control(Note 32)
405,890
358,651 898,274
723,604
364
19,854
-
-
2,406,637
-
Charge for the year
265,043
1,031,354 576,414
988,897
3,029
17,597
2,958
-
2,885,292
-
Impairment
-
- -
79,062
-
-
-
-
79,062
Balance, 31/12/2013
1,340,532
5,673,458 1,504,793
4,348,032
20,872
59,351
2,958
-
12,949,996
Charge for the year
241,570
1,564,509 164,279
1,523,442
12,110
30,360
35,993
-
3,572,263 Disposal -
- -
(8,895)
-
-
-
-
(8,895)
Impairment -
- -
(6,269)
-
-
-
-
(6,269)
Balance, 31/12/2014
1,582,102
7,237,967 1,669,072
5,856,310
32,982
89,711
38,951
-
16,507,095
NET BOOK VALUE:
Balance, 31 Dec. 2013
13,220,648
15,743,438 854,565
4,964,392
14,568
62,475
896,870
6,090,351
41,847,307
Balance, 31 Dec. 2014
15,660,284
14,331,988 807,287
4,074,516
119,707
149,864
860,877
14,468,197
50,472,720
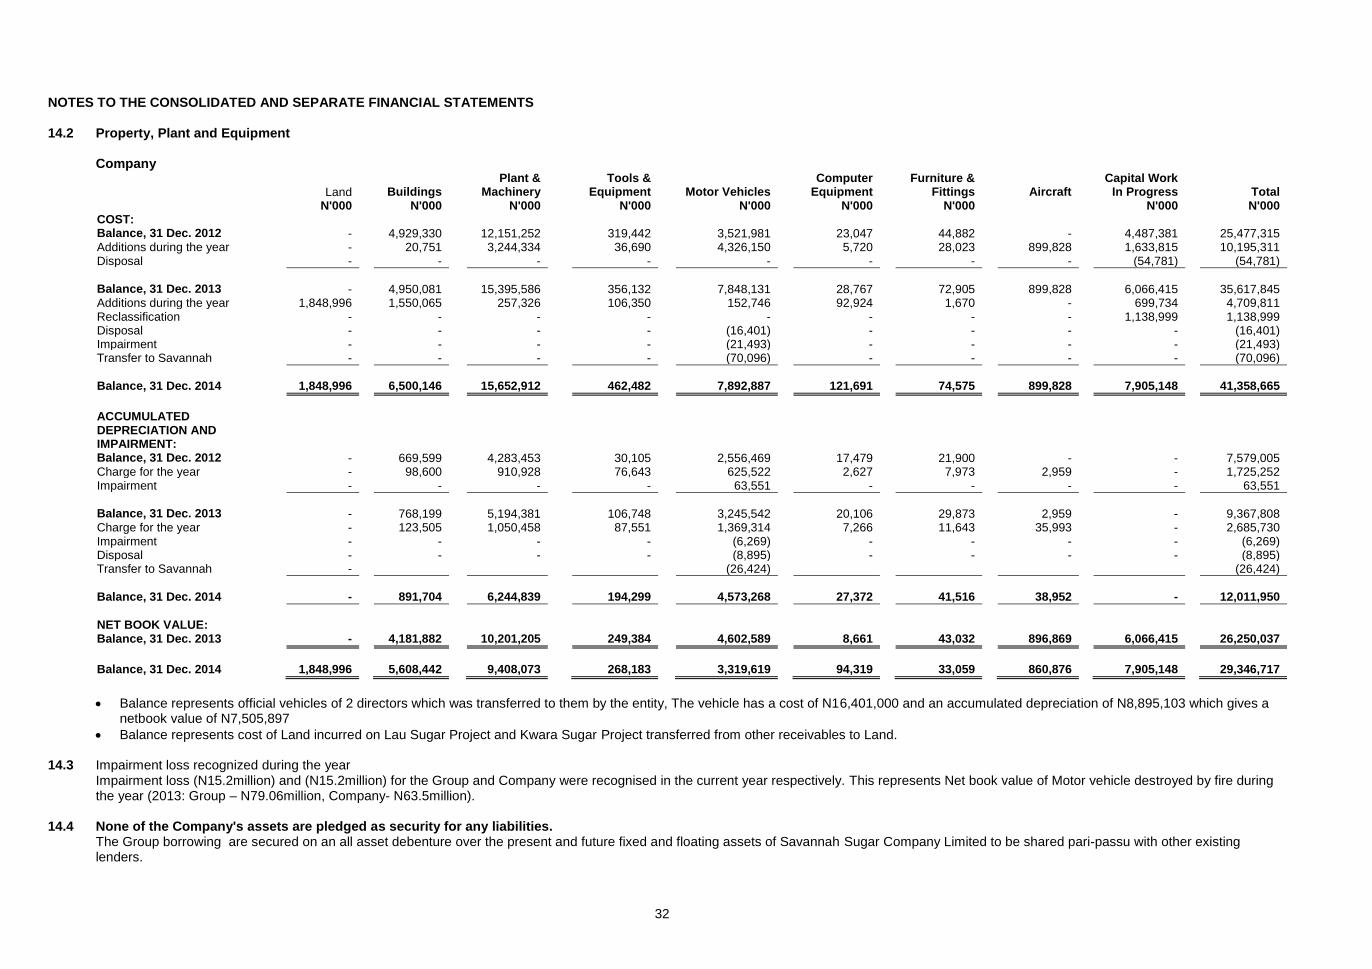
32
NOTES TO THE CONSOLIDATED AND SEPARATE FINANCIAL STATEMENTS 14.2 Property, Plant and Equipment
Company
Land Buildings
Plant & Machinery
Tools & Equipment
Motor Vehicles
Computer Equipment
Furniture & Fittings
Aircraft
Capital Work In Progress
Total
N'000 N'000
N'000
N'000
N'000 N'000
N'000
N'000
N'000 COST:
Balance, 31 Dec. 2012
- 4,929,330
12,151,252
319,442
3,521,981 23,047
44,882
-
4,487,381
25,477,315
Additions during the year
- 20,751
3,244,334
36,690
4,326,150 5,720
28,023
899,828
1,633,815
10,195,311 Disposal
- -
-
-
- -
-
-
(54,781)
(54,781)
Balance, 31 Dec. 2013
- 4,950,081
15,395,586
356,132
7,848,131 28,767
72,905
899,828
6,066,415
35,617,845
Additions during the year
1,848,996 1,550,065
257,326
106,350
152,746 92,924
1,670
-
699,734
4,709,811 Reclassification
- -
-
-
- -
-
-
1,138,999
1,138,999
Disposal
- -
-
-
(16,401) -
-
-
-
(16,401) Impairment
- -
-
-
(21,493) -
-
-
-
(21,493)
Transfer to Savannah
- -
-
-
(70,096) -
-
-
-
(70,096)
Balance, 31 Dec. 2014
1,848,996 6,500,146
15,652,912
462,482
7,892,887 121,691
74,575
899,828
7,905,148
41,358,665
ACCUMULATED DEPRECIATION AND IMPAIRMENT:
Balance, 31 Dec. 2012
- 669,599
4,283,453
30,105
2,556,469 17,479
21,900
-
-
7,579,005 Charge for the year
- 98,600
910,928
76,643
625,522 2,627
7,973
2,959
-
1,725,252
Impairment
- -
-
-
63,551 -
-
-
-
63,551
Balance, 31 Dec. 2013
- 768,199
5,194,381
106,748
3,245,542 20,106
29,873
2,959
-
9,367,808 Charge for the year
- 123,505
1,050,458
87,551
1,369,314 7,266
11,643
35,993
-
2,685,730
Impairment
- -
-
-
(6,269) -
-
-
-
(6,269) Disposal
- -
-
-
(8,895) -
-
-
-
(8,895)
Transfer to Savannah
-
(26,424)
(26,424)
Balance, 31 Dec. 2014
- 891,704
6,244,839
194,299
4,573,268 27,372
41,516
38,952
-
12,011,950
NET BOOK VALUE:
Balance, 31 Dec. 2013
- 4,181,882
10,201,205
249,384
4,602,589 8,661
43,032
896,869
6,066,415
26,250,037
Balance, 31 Dec. 2014
1,848,996 5,608,442
9,408,073
268,183
3,319,619 94,319
33,059
860,876
7,905,148
29,346,717
Balance represents official vehicles of 2 directors which was transferred to them by the entity, The vehicle has a cost of N16,401,000 and an accumulated depreciation of N8,895,103 which gives a netbook value of N7,505,897
Balance represents cost of Land incurred on Lau Sugar Project and Kwara Sugar Project transferred from other receivables to Land. 14.3 Impairment loss recognized during the year
Impairment loss (N15.2million) and (N15.2million) for the Group and Company were recognised in the current year respectively. This represents Net book value of Motor vehicle destroyed by fire during the year (2013: Group – N79.06million, Company- N63.5million).
14.4 None of the Company's assets are pledged as security for any liabilities.
The Group borrowing are secured on an all asset debenture over the present and future fixed and floating assets of Savannah Sugar Company Limited to be shared pari-passu with other existing lenders.

DANGOTE SUGAR REFINERY PLC Consolidated and separate financial statements
For the year ended 31 December 2014
33
NOTES TO THE CONSOLIDATED AND SEPARATE FINANCIAL STATEMENTS 15 Intangible assets
GROUP
COMPANY
Cost
Balance at 1 January 2013
301,711
256,912
Additions
-
-
Balance at 31 December 2013
301,711
256,912
Additions
77,879
32,478
Balance at 31 December 2014
379,590
289,390
Accumulated amortisation
Balance at 1 January 2013
-
-
Amortisation expense
-
-
Balance at 31 December 2013
-
-
Amortisation expense
115,705
85,638
Balance at 31 December 2014
115,705
85,638
Balance at 31 December 2013
301,711
256,912
Balance at 31 December 2014
263,885
203,752
This represents investment in respect of new SAP software with a useful life of 3years. This will be amortised on a straight line basis over the useful life of the software.
GROUP
GROUP
COMPANY
COMPANY
31/12/2014 N'000
31/12/2013 N'000
31/12/2014 N'000
31/12/2013 N'000
16 Other assets
Prepaid rent
282,908
362,452
282,908
362,452
Prepaid insurance
-
24,441
-
24,441
Prepaid Lease
147,060
13,677
92,834
13,677
Advance payment to Vendors
1,168,684
-
1,033,573
-
1,598,652
400,570
1,409,315
400,570
Current portion
1,409,315
290,877
1,409,315
290,877
Non-current portion
189,337
109,693
-
109,693
1,598,652
400,570
1,409,315
400,570

34
NOTES TO THE CONSOLIDATED AND SEPARATE FINANCIAL STATEMENTS
GROUP
GROUP
COMPANY
COMPANY
17 Biological Assets 31/12/2014
N'000
31/12/2013 N'000
31/12/2014 N'000
31/12/2013 N'000
Carrying value at the beginning of the year 499,339
609,454
-
-
(Usage)/Additions
(202,945)
263,800
-
-
Fair value adjustment
1,501,971
(373,915)
-
-
Carrying value as at year end
1,798,365
499,339
-
-
The carrying value comprises of:
Roots
1,122,679
487,215
-
-
Standing Cane
675,686
12,124
-
-
1,798,365
499,339
-
-
Reconciliation of changes in Biological assets
Carrying value as at 1 January
499,339
609,454
-
-
Gain or loss arising from changes in fair value less cost to sell
1,501,971
(373,915)
-
-
Increases arising from purchases
271,124
363,481
-
-
Decreases attributable to sales and biological assets classified as held for sale
(474,069)
(99,681)
-
-
Carrying Value as at 31 December 1,798,365
499,339
-
-
In terms of IAS 41: Agriculture, sugar cane growing crops are accounted for as biological assets and are measured and recognised at fair value.
GROUP
GROUP
COMPANY
COMPANY
31/12/2014 N'000
31/12/2013 N'000
31/12/2014 N'000
31/12/2013 N'000
18 Held for Sale Investment in Subsidiary 864,647
-
864,647
-
Amount represents investment made by the company in 2008 in Algeria for the intended purpose of expansion of the Company’s activities through an Algerian Company SPA Dangote Algeria. Subsequent to the payment for the Land, the Algerian Government, without revoking the Algerian company's title to the Land, refused the siting of the proposed Refinery at the Port citing that the site is not suitable for the intended purpose. The company lost control over this company in late 2010. The balance has been disclosed as a Held for Sale Investment in subsidiary in 2014 (2013: Other receivables) as Management has obtained ownership to the land and is committed to selling the Land within the next 12 months.

35
NOTES TO THE CONSOLIDATED AND SEPARATE FINANCIAL STATEMENTS
GROUP
GROUP
COMPANY
COMPANY
31/12/2014 N'000
31/12/2013 N'000
31/12/2014 N'000
31/12/2013 N'000
19 Investment in Subsidiary
Savannah Sugar Company Limited -
-
3,214,923
3,214,923
-
-
3,214,923
3,214,923
The Group owns 95% shareholding in Savannah Sugar Company Limited. The Principal activities of
Savannah Sugar Company Limited are Planting of Sugar cane, processing, packaging and selling of refined sugar and molasses and registered address is Km 81, Yola Gombe Road (Near Numan) Adamawa State.
19.1 There are no significant restrictions on the use of the subsidiary assets. 19.2 Dangote Sugar Refinery provides financial support to Savannah Sugar in terms of payment of salaries
and wages, purchase of assets and settlement of liabilities. GROUP
GROUP
COMPANY
COMPANY
20 Inventories 31/12/2014 N'000
31/12/2013 N'000
31/12/2014 N'000
31/12/2013 N'000
Raw materials 3,332,462
7,479,108
3,026,374
7,479,108
Packaging materials 117,806
37,595
111,145
37,594
Work-in-process 76,712
104,074
76,711
104,074
Finished goods 8,167,676
585,468
8,158,937
580,161
Chemicals and consumables 387,396
685,206
315,542
236,997
Spare parts 3,853,976
3,772,282
2,359,058
2,659,957
Allowance for obsolete inventory (837,138)
(837,138)
-
-
15,098,890 11,826,595 14,047,767 11,097,891
20.1 No inventory was pledged as security for any liability. 20.2 The cost of inventory recognised in profit or loss during the year is
GROUP
GROUP
COMPANY
COMPANY
31/12/2014
N'000
31/12/2013 N'000
31/12/2014 N'000
31/12/2013 N'000
60,018,765
65,567,707
59,619,604
63,801,527
20.3 There was no write down of inventories and neither was any there reversal of previously write down
during the period (2013: Nil) 20.4 There are no inventories that are expected to be recovered after more than 12 months. (2013: Nil)

36
NOTES TO THE CONSOLIDATED AND SEPARATE FINANCIAL STATEMENTS 21 Trade and other receivables GROUP
GROUP
COMPANY
COMPANY
31/12/2014 N'000
31/12/2013 N'000
31/12/2014 N'000
31/12/2013 N'000
Trade receivables 7,522,278
8,720,281
7,522,278
7,651,599
Allowance for doubtful debts (682,087)
(1,715,834)
(682,087)
(647,151)
6,840,191
7,004,447
6,840,191
7,004,448
Staff loans and advances 298,873
152,959
211,624
77,389
VAT receivable 1,032,679
248,279
1,023,273
248,279
Deposit for Land -
864,647
-
864,647
Insurance claim receivable in relation to burnt assets destroyed in fire 666,911
374,500
666,911
374,500
Negotiable Duty Credit Certificates 805,683
805,683
805,683
805,683
Other receivables 1,436,725
6,982,740
1,315,787
1,289,159
Refundable Sugar price differential -
2,019,466
-
2,019,466
Allowance for impaired other receivables (276,412)
(200,783)
(80,095)
(65,674)
Amount due from related parties -(Note 31.3) 3,208,193
1,021,587
31,300,346
25,409,164
7,172,652
12,269,078
35,243,529
31,022,613
14,012,843
19,273,525
42,083,720
38,027,061
21.1 Trade receivables
The average credit period on sales of goods is 30 days. Allowances for doubtful debts are recognised against trade receivables outstanding beyond 365 days based on estimated irrecoverable amounts. Previous experience has shown that receivables that are past due after 365 days are doubtful of recovery. Allowances for doubtful debts are recognised against trade receivables due over 180 days and below 365 days based on estimated irrecoverable amounts determined by reference to past default experience of the counterparty and an analysis of their current position.
Before accepting any new customer to buy on credit, the customer must have purchased goods on cash basis for a minimum period of six months in order to test the financial capability of the customer. Based on good credit rating by the credit committee of the Group, the customer may be allowed to migrate to credit purchases after the presentation of an acceptable bank guarantee which must be valid for one year.
Trade receivables disclosed above include amounts (see below for aged analysis) that are past due more than 30 days as at the reporting date for which the Group has not recognised an allowance for doubtful debts because there has not been a significant change in credit quality and the amounts are still considered recoverable.

37
NOTES TO THE CONSOLIDATED AND SEPARATE FINANCIAL STATEMENTS 21.2 Age analysis of trade receivables that are past due but not impaired
GROUP GROUP COMPANY COMPANY
31/12/2014
31/12/2013
31/12/2014
31/12/2013
N’000
N’000
N’000
N’000
0-30 days
3,555,159
3,555,159
3,555,159
1,625,398 30-60 days
1,669,754
1,669,754
1,669,754
1,763,534
61-90 days
1,419,689
1,419,689
1,419,689
2,873,547 91-180 days
195,589
359,845
195,589
741,969
Total
6,840,191
7,004,447
6,840,191
7,004,448
21.2 Age analysis of trade receivables that are past due and impaired
GROUP GROUP COMPANY COMPANY
31/12/2014
31/12/2013
31/12/2014
31/12/2013
N’000
N’000
N’000
N’000
Above 365 days
682,087
1,715,834
682,087
647,151 Allowance for credit losses
Balance brought forward
1,715,835
507,983
647,151
507,983 Effect of acquisition under common control -
1,052,127
-
-
Impairment losses recognised on receivables -
155,724
46,479
139,168
Amount written off during the year as uncollectible -
-
-
-
Amounts recovered during the year (1,033,748)
-
(11,543)
-
682,087
1,715,834
682,087
647,151
21.3 Concentration risk
About 32% of the trade receivables are due from a single customer. The Group evaluates the concentration of risk with respect to trade receivables as low, as the concentration is with a well- established local blue chip company. Its customers otherwise are diverse including both corporate entities and a large number of individual end users. The requirement for impairment is analysed at each reporting date on an individual basis for corporate and individual customers.
22 Cash and cash equivalent
For the purpose of the statement of cash flows, cash and cash equivalents include cash on hand and in banks and short term deposits with 30 days tenure. Cash and cash equivalents at the end of the reporting period as shown in the statement of cash flows can be reconciled to the related items in the statement of financial position as follows:
GROUP GROUP COMPANY COMPANY
31/12/2014
31/12/2013
31/12/2014
31/12/2013
N'000
N'000
N'000
N'000
Cash in hand
13,091
13,953
13,091
13,271
Bank balances
6,189,387
3,791,413
6,103,872
3,201,517 Short term deposits
-
4,650,000
-
4,650,000
6,202,478
8,455,366
6,116,963
7,864,788
The short term deposits are placed on call of 30 days tenure with interest ranging between 9% to 13%. All short term deposits have been liquidated as at end of 31 December 2014.

38
NOTES TO THE CONSOLIDATED AND SEPARATE FINANCIAL STATEMENTS 23 Share capital The balance in the share capital account was as follows:
GROUP
GROUP
COMPANY
COMPANY
31/12/2014 31/12/2013
31/12/2014 31/12/2013
N'000 N'000 N'000 N'000
Authorised: 12,000,000,000
Ordinary shares of 50k each 6,000,000
6,000,000
6,000,000
6,000,000
Allotted, called up issued and fully paid:
12,000,000,000 Ordinary shares of 50k each 6,000,000
6,000,000
6,000,000
6,000,000
24 Share premium
Authorised: 12,000,000,000 ordinary shares of 50k each issued at 52.67k premium 6,320,524
6,320,524
6,320,524
6,320,524
Share premium represents the excess of the shareholders' value over the nominal share capital at the point of the commencement of operations in January 2006.
GROUP GROUP COMPANY COMPANY
31/12/2014
31/12/2013
31/12/2014
31/12/2013
25 Retained earnings N'000
N'000
N'000
N'000
Balance at the beginning of the year 34,838,649
33,948,635
41,496,988
33,948,635
Profit for the year 11,649,425
10,980,516
11,908,690
13,537,612
Effect of acquisition of subsidiary under common control (Note 32). -
(4,101,243)
-
-
Re-measurement of defined benefit obligation -
10,741
-
10,741
Payment of dividend (Note 31.1). (7,200,000)
(6,000,000)
(7,200,000)
(6,000,000)
39,288,074
34,838,649
46,205,678
41,496,988
25.1 Non-controlling interest
Balance brought forward (181,232)
(46,648)
-
-
Share of loss for the year (13,646)
(134,584)
-
-
Balance at end of year (194,878)
(181,232)
-
-

39
NOTES TO THE CONSOLIDATED AND SEPARATE FINANCIAL STATEMENTS GROUP GROUP COMPANY COMPANY
31/12/2014
31/12/2013
31/12/2014
31/12/2013
26 Borrowings- N'000
N'000
N'000
N'000
Bank loans 385,052
921,146
-
-
Related party loan(Note 26.1) 2,000,000
-
2,000,000
-
2,385,052
921,146
2,000,000
-
Current 2,385,052
536,094
2,000,000
-
Non-current -
385,052
-
-
2,385,052
921,146
2,000,000
-
Balance on acquisition under common control -
1,453,930
-
Balance brought forward 921,146
-
-
-
Additions 2,000,000
-
2,000,000
-
Payments (536,094)
(532,784)
-
-
2,385,052
921,146
2,000,000
-
26.1 On 12 December 2014, the Group received an loan of N2 billion from a related party-Dangote
Industries Limited for Short term Working Capacity purpose over a period of 90days at the prevailing market interest rate of 13.5%. The loan is repayable in full at the end of the tenor plus interest on maturity. The Loan is not secured by assets of the company.
26.2 Group: Fixed interest rate agricultural loan with remaining maturity period not exceeding 3 years. The
loan is at an interest rate of 9%. 27 Retirement benefit obligation 27.1 Defined contribution plans
The Group operates a defined contribution retirement benefit plan for all qualifying employees. The assets of the plans are held separately from those of the Group in funds under the control of trustees.
The employees contribute 8% of their gross salary (basic, housing and transport) while the Group contributes 10% of gross salary on behalf of the employees to the same plan.
The obligation of the Group and Company to the employer with respect to the retirement benefit plan is recognised as an expense in the statement of profit or loss and amounts are N117.5 million.(2013:N93.3million) and N161.5million, (2013: N191million) respectively.
27.2 Defined benefit plans
The Group operated a defined benefit plans for all qualifying employees up till 30 September 2013 . Under the plan, the employees were entitled to retirement benefits which vary according to length of service. At the date of discontinuation, qualified staff as at this date are to be paid their retirement benefit at the point of exit hence the recognition as a current liability as it is payable on demand. The amounts stated in the financial statement as at 2013 are based on actuarial valuation carried out in 2013.
For the purpose of comparison the present value of the defined benefit obligation, and the related current service cost and past service cost stated in the books up till 30 September 2013 was measured using the Project Unit Credit Method. The present value of the defined benefit obligation, and the related current service cost and past service cost, were measured using the Project Unit Credit Method.

40
NOTES TO THE CONSOLIDATED AND SEPARATE FINANCIAL STATEMENTS 27.2 Defined benefit plans (continued)
The most recent Actuarial Valuation was carried out in 2014 using the staff payroll of 30 September 2013
In calculating the liabilities, the consultant took the following into recognition: ** length of service rendered by each member of staff at the review date ** discounting of the expected benefit payments.
Investment risk
The present value of the defined benefit plan liability is calculated using a discount rate determined by reference to high quality corporate bond yields; if the return on plan asset is below this rate, it will create a plan deficit. Currently the plan has a relatively balanced investment in equity securities, debt instruments and real estates. Due to the long-term nature of the plan liabilities, the board of the pension fund considers it appropriate that a reasonable portion of the plan assets should be invested in equity securities and in real estate to leverage the return generated by the fund.
Interest risk A decrease in the bond interest rate will increase the plan liability; however, this will be partially offset by an increase in the return on the plan’s debt investments.
Longevity risk
The present value of the defined benefit plan liability is calculated by reference to the best estimate of the mortality of plan participants both during and after their employment. An increase in the life expectancy of the plan participants will increase the plan’s liability.
Salary risk The present value of the defined benefit plan liability is calculated by reference to the future salaries of plan participants. As such, an increase in the salary of the plan participants will increase the plan’s liability.
27.2a Financial Assumptions The principal financial assumptions used for the purposes of the actuarial valuations were as follows:
Long term average discount rate (p.a)
Average pay increase (p.a)
Average rate of inflation (p.a) 27.3 Demographic assumptions Mortality in Service
The rates of mortality assumed for employees are the rates published in the A67/70 tables, published jointly by the institute and the Faculty of Actuaries in the UK
Sample age
25
30
35
40
45
Withdrawal from Service
Age band
Less than or equal to 30
31-39
40-44
45-50
51-60

41
NOTES TO THE CONSOLIDATED AND SEPARATE FINANCIAL STATEMENTS 27.4 Movement in gratuity
GROUP
GROUP
COMPANY
COMPANY
31/12/2014
31/12/2014
31/12/2014
31/12/2013
N'000
N'000
N'000
N'000
Balance as at 1 January 1,356,067
1,260,869
1,356,067
1,260,869
Current service charge 216,094
122,819
-
122,819 Finance cost -
121,845
-
121,845
Actuarial losses - change in assumption -
(145,277)
-
(145,277)
Actuarial losses - experience -
129,933
-
129,933 Benefits paid from plan (44,413)
(81,237)
(44,413)
(81,237)
Curtailments Gains/Losses -
(52,885)
-
(52,885)
1,527,748
1,356,067
1,311,654
1,356,067
As at the date of the valuation, no fund has been set up from which payments can be disbursed. Dangote Sugar Refinery expects to settle its obligations out of its existing reserves. The contribution into the gratuity scheme was discontinued in 2013. At the date of discontinuation, all qualified staff as at date are to be paid their entitlement at the point of exit which classifies the outstanding balance as a current liability as it is payable on demand.
27.5 Retirement benefit plans
The amount included in the other comprehensive income arising from the entity's obligation in respect of its defined benefit plans is as follows.
GROUP
GROUP
COMPANY
COMPANY
31/12/2014
31/12/2013
31/12/2014
31/12/2013
N'000
N'000
N'000
N'000
Actual (gain)/losses recognised in the year
-
(15,344)
-
(15,344)
Tax impact -
4,603
-
4,603
-
(10,741)
-
(10,741)
GROUP
GROUP
COMPANY
COMPANY
31/12/2014
31/12/2013
31/12/2014
31/12/2013
N'000
N'000
N'000
N'000
28 Trade and other payables
Trade payables 6,726,020
15,596,813
6,398,704
15,477,683
Accruals & sundry creditors 16,154,096
1,996,036
15,775,706
1,843,771
Other credit balances 369,340
2,993,535
142,285
2,778,671
Due to related entities (Note 31.4) 1,977,529
2,487,426
1,292,565
1,408,041
25,226,985
23,073,810
23,609,260
21,508,166
The average credit period on purchases of goods from suppliers is 90days. No interest is charged on the trade payables.

42
NOTES TO THE CONSOLIDATED AND SEPARATE FINANCIAL STATEMENTS
GROUP
GROUP
COMPANY
COMPANY
31/12/2014
31/12/2013
31/12/2014
31/12/2013
N'000
N'000
N'000
N'000
28.1 Other credit balances is made up of the following:
Other Suppliers' accounts -
2,200,118
-
2,200,118
VAT Payables 227,055
152,365
-
-
Contractors account -
155,742
-
422,812
Other creditors 142,285
485,310
142,285
155,741
369,340
2,993,535
142,285
2,778,671
29 Other liabilities
Advance payment for goods 1,700,297
1,332,597
1,700,244
1,332,597
This represents advance payment by customers for finished goods
30 Financial Instruments 30.1 The Group manages its capital to ensure that it will be able to continue as a going concern, while
maximising the return to stakeholders through the optimisation of its capital structure.
The capital structure of the Group is made up of equity comprising issued capital, share premium and retained earnings. The Group is not subject to any externally imposed capital requirements.
The Group’s risk management committee reviews the capital structure of the Group on an annual basis. As part of this review, the committee considers the cost of capital and the risks associated with each class of capital. The gearing ratio at 31 December 2014 of 10% (see below) was at the lower end of the target range.
Gearing ratio The gearing ratio at year end is as follows:
GROUP GROUP COMPANY COMPANY
31/12/2014
31/12/2014
31/12/2014
31/12/2013
N'000
N'000
N'000
N'000 Debt (i) 2,385,052
921,146
2,000,000
-
Cash and bank balances (including cash and bank balances in a disposal group held for sale) (6,202,478)
(8,455,366)
(6,116,963)
(7,864,788)
Net Debt (3,817,426)
(7,534,220)
(4,116,963)
(7,864,788)
Equity (ii) 51,608,598
47,159,173
58,526,203
53,817,512
Debt to equity ratio (%) (7%)
(16%)
(7%)
(15%)
i. Debt is defined as both current and non-current borrowings.
ii. Equity includes all capital and reserves of the Group that are managed as capital

43
NOTES TO THE CONSOLIDATED AND SEPARATE FINANCIAL STATEMENTS 30.2 Categories of financial instruments
GROUP
COMPANY 31/12/2014
31/12/2013
31/12/2014
31/12/2013
Loans and
Loans and
Loans and
Loans and Assets receivables
receivables
receivables
receivables
N’000
N’000
N’000 Trade and other receivables(Note 30.2.1) 9,242,700
14,514,646
9,034,512
8,745,496
Cash and cash equivalents 6,202,478
8,455,366
6,116,963
7,864,788
15,445,178
22,970,012
15,151,475
16,610,284
30.2.1 Defined as total trade and other receivables excluding prepayments, accrued income and amounts
relating to taxation.
Other
Other
Other
Other
Financial
Financial
Financial
Financial
Liabilities Liabilities
Liabilities
Liabilities
30.3 Liabilities
Borrowings 2,385,052
921,146
2,000,000
-
Trade and other payables 22,880,116
17,592,848
22,174,411
17,321,453
25,265,168
18,513,994
24,174,411
17,321,453
30.3.1 Defined as total trade and other payables excluding taxation and social security.
The borrowings disclosed above are classified as financial liabilities measured at amortised cost. The directors consider that the carrying amount of borrowings is approximately equal to their fair value.
30.4 Significant accounting policies
Details of the significant accounting policies and methods adopted (including the criteria for recognition, the basis of measurement and the bases for recognition of income and expenses) for each class of financial asset, financial liability and equity instrument are disclosed in note 4.
30.5 The Group is exposed to market risk, credit risk and liquidity risks. The Parent Company’s internal
audit and risk management team is responsible for monitoring its exposure to each of the mentioned risks. This policy provides guidance over all treasury and finance-related matters and is underpinned by delegated authority guidelines and detailed procedures. The main objectives of the policy are to ensure that sufficient liquidity exists to meet the operational needs of the business, to maintain the integrity and liquidity of the investment portfolio, and to manage the impact of foreign exchange and interest rate volatility on the company’s net income.
30.6 Market risk is the risk that the fair value of future cash flows of a financial instrument will fluctuate
because of changes in market prices. Market prices are affected by interest rate risk and foreign exchange currency risk. Financial instruments affected by market risk include cash and cash equivalents, trade and other receivables and trade and other payables. Market risk exposures are measured using sensitivity analysis.

44
NOTES TO THE CONSOLIDATED AND SEPARATE FINANCIAL STATEMENTS 30.6.1 Interest rate risk management
Interest rate risk is the risk that the fair value or future cash flows of a financial instrument will fluctuate because of changes in market interest rates. The Group is exposed to fluctuations in interest rates on its borrowings. The Group pays fixed/floating rate interest on its borrowings. The company actively monitors interest rate exposures on its investment portfolio and borrowings so as to minimise the effect of interest rate fluctuations on the income statement. The risk on borrowings is managed by the company by maintaining an appropriate mix between fixed and floating rate borrowings. All loans, cash and cash equivalent are fixed interest based and therefore the company does not have any exposure to the risk of changes in Market rates
30.6.2 Interest rate sensitivity
The sensitivity analysis below have been determined based on the exposure to interest rates for Related party loan at the prevailing market interest rate of 13.5% at the end of the reporting period. A 250 basis point increase or decrease is used when reporting interest rate risk internally to key management personnel and represents management's assessment of the reasonably possible change in interest rates. A 250 basis points reflects a N50million impact on finance cost. A positive number below indicates an increase in profit or equity for a 250 basis points change in the Finance cost .A negative number below indicates a decrease in profit or equity for a 250 basis points change in the Finance cost.
30.6.3 Foreign currency risk management
Foreign currency risk is the risk that the fair value or future cash flows of a financial instrument will fluctuate because of changes in foreign exchange rates. The Group's exposure to the risk of changes in foreign exchange rates is limited to foreign currency purchases of operating materials (e.g. finished equipment and other inventory items) and trade receivables that are denominated in foreign currencies. Foreign exchange exposure is monitored by the Group's treasury unit.
The Naira carrying amounts of the Group’s foreign currency denominated monetary assets and monetary liabilities at the reporting date are as follows:
Liabilities
Assets
31/03/2014
31/03/2013
31/03/2014
31/03/2013
USD DOLLARS N'000
N'000
N'000
N'000
Trade and other payable 14,038,557
15,475,912
-
-
Bank Balance -
-
5,019
442,994
Exchange rate of $1 = 170.18 Foreign currency sensitivity analysis The Group is mainly exposed to the US dollar.
30.6.4 Foreign currency risk management
The following table details the Group’s sensitivity to a 15% (2013: 3%) increase and decrease in the Naira against the US Dollar. 15% is the sensitivity rate used when reporting foreign currency risk internally to key management personnel and represents management's assessment of the reasonably possible change in foreign exchange rates. A positive number below indicates an increase in profit or equity for a 15% change in the exchange rates. A negative number below indicates a decrease in profit or equity for a 15% change in the exchange rates.
Liabilities
Assets
31/12/14
31/12/13
31/12/14
31/12/13
N’000
N’000
N’000
N’000
Effect on Profit or loss/Equity for a 15% (2013:3%) appreciation 2,105,783.51
464,277.36
(753)
(13,290)
Effect on Profit or loss/Equity for a 15% (2013:3%) depreciation (2,105,784)
(464,277)
753
13,290
This is mainly attributable to the exposure outstanding on US dollar receivables and payables at the end of the reporting period.

45
NOTES TO THE CONSOLIDATED AND SEPARATE FINANCIAL STATEMENTS 30.7 Credit risk management
Credit risk is the risk that a counterparty will not meet its obligations under a financial instrument or customer contract, leading to a financial loss.
The Group is exposed to credit risk from its operating activities (primarily for trade receivables) and from its investing activities, including deposits with banks and other financial institutions. The Group has a credit management committee that is responsible for carrying out preliminary credit checks, review and approval of bank guarantees to credit customers. A credit controller also monitors trade receivable balances and resolves credit related matters.
30.7.1 Trade receivables (see note 20) Concentration of risk
About 32% of the trade receivables are due from a single customer whose credit history is good. The Group evaluates the concentration of risk with respect to trade receivables as low, as its customers are otherwise diverse including both corporate entities and lots of individual end users. The requirement for impairment is analysed at each reporting date on an individual basis for corporate snf individual customers.
30.7.2 Deposits with banks and other financial institutions
Credit risk from balances with banks and financial institutions is managed by the Group’s treasury department in accordance with its corporate treasury policy that spells out counterparty limits, list of financial institutions that the Group deals with and the maximum tenure of fixed term funds. Surplus funds are spread amongst these institutions and funds must be within credit limits assigned to each counterparty. Counterparty credit limits are reviewed by the Corporate Treasurer periodically and may be updated throughout the year. The limits are set to minimise the concentration of risks and therefore mitigate financial loss through the potential counterparty’s failure.
30.7.3 Maximum exposure to credit risks The carrying value of the Group’s financial assets represents its maximum exposure to credit risk. The maximum exposure to credit risk at the reporting date was:
GROUP
GROUP
COMPANY
COMPANY
31/12/2014
31/12/2013
31/12/2014
31/12/2013 N'000
N'000
N'000
N'000
Trade receivables
Note 21 6,840,191
7,004,447
6,840,191
7,004,448
Other receivables
Note 21 3,964,459
11,247,491
3,943,186
5,613,450 Deposits with banks
Note 21 -
4,650,000
-
4,650,000
Amount due from related party
Note 31.3 3,208,193
1,021,587
31,300,946
25,409,164
14,012,843
23,923,525
42,084,323
42,677,062
30.8 Liquidity risk management
The Company monitors its risk to a shortage of funds by maintaining a balance between continuity of funding and by continuously monitoring forecast and actual cash flows and by matching the maturity profiles of financial assets and liabilities. To manage liquidity risk our allocation of letters of credit on raw sugar and spares/chemicals are spread over dedicated banks. Therefore, the establishment of these Letters of Credit which are commitments by the banks provides security to our funds placed on deposit accounts. In other words our funds placed are substantially tied to our obligations on raw sugar and spares.

46
NOTES TO THE CONSOLIDATED AND SEPARATE FINANCIAL STATEMENTS 30.8.1 Liquidity maturity table
The following table details the Group's and Company's remaining contractual maturity for its financial liabilities with agreed repayment periods. The tables have been drawn up based on the undiscounted cashflows of financial liabilities based on the earliest date on which the Group and the Company can be required to pay. The tables include both interest and principal cash flows.
GROUP
Carrying amount
Contractual amount
Less than one year
More than one year
Total
N'000
N'000
N'000
N'000
Financial liabilities at amortised cost
Non-interest bearing: Trade and other payables 25,226,985
25,226,985
-
25,226,985
Borrowings 2,385,052
2,385,052
-
2,385,052
27,612,037
27,612,037
-
27,612,037
COMPANY
Carrying amount
Contractual amount
Less than one year
More than one year
Total
N'000
N'000
N'000
N'000
Financial liabilities at amortised cost
Non-interest bearing: Trade and other payables 23,609,260
23,609,260
- 23,609,260
Borrowings 2,000,000
2,000,000
-
2,000,000
25,609,260
23,609,260
-
25,609,260
Financial liabilities that can be repaid at any time have been assigned to the earliest possible time period. It is not expected that the cash flows included in the maturity analysis could occur significantly earlier, or at significantly different amounts.

47
NOTES TO THE CONSOLIDATED AND SEPARATE FINANCIAL STATEMENTS 31 Related party information 31.1 Identity of related parties Related parties Nature of related party transactions
Dangote Transport Limited services prior to 2010.
Fellow subsidiary company that provided haulage services prior to 2010
Dangote Textile Industries Limited (LPFO)
Fellow subsidiary company that exchanges inventory of Automotive gas oil(AGO)and low pour fuel oil
Dansa Foods Limited An entity controlled by the Directors of the Company that has trading relationship with the Company.
National Salt Company of Nigeria (NASCON)
Fellow subsidiary from which the Company purchases raw salt as input in the production process
Dangote Nigeria Clearing Limited Fellow subsidiary Company which is a registered custom broker that provides clearing services
Savannah Sugar Company Plc Subsidiary- Exchange of spare parts
Dangote Industries Limited (see note 28.3)
Parent company that provides management support and receives 2% of turnover as management fees
Green view Development Company Limited
Fellow subsidiary - Property rentals, concessionaries of Lands were factory and office building are located
Dangote Cement Plc Related company - Supply of diesel and LPFO
Bluestar Investments U.K Provision of agency and logistics services
Dangote Flour Mills Plc Related company -Supplies of power
Dangote Pasta Limited Related company -Supply of AGO LPFO
Dangote Noodles Limited Related company- Supply of AGO LPFO
Dangote Agrosacks sacks Related company- Supplies empty bags for bagging of finished sugar
Key management personnel (see note 28.4)

48
NOTES TO THE CONSOLIDATED AND SEPARATE FINANCIAL STATEMENTS 31.2 Effective 30 September 2012, a majority shareholding in Dangote Flour Mills Plc, and its subsidiaries
Dangote Noodles Limited, Dangote Pasta Limited and Dangote Agrosacks was acquired by Tiger Brands, an unrelated South African Company. Alhaji Aliko Dangote retains 10% of the controlling interest in the Company, and sits on the Board of the new Companies as a Director, in his personal capacity. Thus, these companies still meet the definition of a related party as the Companies are under the significant influence of the ultimate controlling party of the Company.
During the year, group entities entered into the following trading transactions with related parties that are not members of
Group: Sales of goods & services Purchases of goods &
services
Year ended Year ended Year ended Year ended
31/12/14 31/12/13 31/12/14 31/12/13
N’000 N’000 N’000 N’000
NASCON PLC 1,754 - 166,089 225,852
DANGOTE AGROSACKS LTD 388 - 2,226,838 40,890
SAVANNAH SUGAR COMPANY LTD - - 5,353,580 24,164,773
DANGOTE NIGERIA LIMITED -CLEARING - - - 4,741
DANCOM TECHNOLOGIES - - 84,962 -
DANGOTE FOUNDATION 115,608 - - -
DANGOTE CEMENT 18874 - 92,715 -
DANGOTE INDUSTRIES LIMITED 7 - 590,462 2,997,544
GREENVIEW DEV. COY. LTD 31,807 33171 - -
BLUESTAR INVESTMENTS - - - -
DANGOTE FLOUR 53,915 51,155 - -
BLUESTAR SHIPPING 186,926 - - -
DANGOTE PORT OPERATIONS 2 - - -
DANGOTE NOODLES 22,950 - - -
Company: Sales of goods & services
Purchases of goods &
services
Year ended Year ended Year ended Year ended
31/12/14 31/12/13 31/12/14 31/12/13
N’000 N’000 N’000 N’000
NASCON PLC - - 166,089 225,852
DANGOTE AGROSACKS LTD - - 2,188,622 1,650,192

49
NOTES TO THE CONSOLIDATED AND SEPARATE FINANCIAL STATEMENTS 31.3 The following balances were outstanding from related parties at the end of the reporting period
Group
Group
COMPANY
COMPANY
Amount owed by related parties 31/03/2014
31/03/2013
31/03/2014
31/03/2013
Dangote Textile Industries Limited -
-
- Dansa Foods Limited 11,038
11,038
11,038
11,038
Dangote Nigeria Clearing Limited -
23,263
-
23,263 Dangote Flour Mills Plc 243,632
-
243,632
-
Savannah Sugar Company Plc -
-
28,092,152
24,342,055 Dangote Flour Mills Plc 246,535
198,529
246,535
198,529
DIL Strategic Supplies 216,709
216,709
216,709
216,709 Dangote Pasta Limited 56,153
21,535
56,153
56,153
Dangote Industries Limited 801,242
454,238
643,320
454,238 Dangote Noodles Limited 16,157
13,351
16,157
13,351
Dangote Group Transport Maintenance 2
30,037
2
30,037
National Salt Company of Nigeria Plc 54,015
52,266
54,015
52,266
Dangote Nigeria Limited 59
60
59
60 Dancom Technologies -
558
11,462
Dangote Cement Plc -
-
-
- Dangote Ports Operations -
3
-
3
Dangote Foundation -
-
-
- Dangote Agro sacks Limited 576,224
-
576,224
-
Dangote Cement Plc -
-
-
- Dangote Fertilizers 979,984
-
1,137,907
-
Dangote Industries Limited 6,443
-
6,443
-
3,208,193
1,021,587
31,300,346
25,409,164
31.4 The following balances were due to related parties at the end of the reporting period.
Amount owed to related Group
Group
COMPANY
COMPANY parties 31/03/2014
31/03/2013
31/03/2014
31/03/2013
Dangote Cement Plc 1,342,785
1,915,723
657,821
859,999 Greenview Development Company Limited 134,345
166,152
134,345
166,152
Dangote Agrosacks Nigeria Limited -
140,514
-
140,513
Bluestar Shipping 65,482
238,474
65,482
238,474 National Salt Company PLC -
-
-
-
Dangote Flour Mills Plc -
-
-
- Dangote Foundation -
2,903
-
2,903
Dancom Technologies 30,715
30,715
- Dangote Group Transport Maintenance -
23,660
-
-
DNL Clearing 28,932
-
28,932
- MHF Property 1,922
-
1,922
-
Dangote Ports Operation 11
-
11
- Dangote Intraplant -
-
-
-
Bluestar Investments U.K 238,474
-
238,474
- Obajana Transport 134,863
-
134,863
-
1,977,529
2,487,426
1,292,565
1,408,041

50
NOTES TO THE CONSOLIDATED AND SEPARATE FINANCIAL STATEMENTS 31.5 Sales of goods to related parties were made at the company's usual market price without any
discount to reflect the quantity of goods sold to related parties. Purchases were made at market price and there was no discount on all purchases.
The amounts outstanding are unsecured and will be settled in cash. No guarantees have been given or received.
Dangote Industries Limited (D.I.L) in recognition of the requirement of Transfer Pricing Regulations that all transactions between connected taxable persons shall be carried out in a manner that is consistent with arm’s length principle has come up with basis of computing its Management fees and Royalty taking into cognizance certain principles. Therefore Dangote Sugar Refinery Plc shall pay management fee to Dangote Industries Limited (D.I.L) based on DIL’s reimbursable expenses plus service charges at 7.5% of such expenses with effect from 1st January, 2014. Royalty payment shall be made in addition to Management Fees payable, from 1st January, 2015 at the rate of 0.5% of the total revenue.
The amount due from the holding company represents current account balances 31.6 Loans to and from related parties
On 12 December 2014, the Company received an loan of N2 billion from a related party -Dangote Industries Limited for Short term Working Capacity purpose over a period of 90days at the prevailing market interest rate of 13.5%. The loan is repayable in full at the end of the tenor plus interest on maturity. The Loan is not secured by an assets of the company.
31.7 Key Management personnel
LIST OF DIRECTORS OF DSR
1 ALH. ALIKO DANGOTE (GCON) CHAIRMAN
2 MR. GRAHAM CLARK GROUP MANAGING DIRECTOR
3 ENGR. ABDULLAHI SULE DEPUTY GROUP MANAGING DIRECTOR
4 ALH. SANI DANGOTE BOARD MEMBER
5 MR. OLAKUNLE ALAKE "
6 MR. UZOMA NWANKWO "
7 MS. BENNEDIKTER MOLOKWU "
8 DR. KONYINSOLA AJAYI (SAN) "
9 ALH. ABDU DANTATA "
LIST OF KEY MANAGEMENT STAFF
1 MR. GRAHAM CLARK GROUP MANAGING DIRECTOR/CEO
2 ENGR. ABDULLAHI SULE DEPUTY GROUP MANAGING DIRECTOR
3 MR. MARTIN WELCH GROUP TECHNICAL MANAGER 4 MR. MAYROUD EL-SUNNI ED - ENGR. & OPRS
5 ENGR. BRAIMAH OGUNWALE
GENERAL MANAGER, REFINERY
6 MR. ABDULSALAM WAYA HEAD, SALES/MARKETING
7 MR. MURTALA ZUBAIR DGM, HR/ADMIN
8 MR. CHRIS OKOH PROCESS MANAGER
9 MRS .MODUPE OGUNTADE CHIEF FINANCIAL OFFICER

51
NOTES TO THE CONSOLIDATED AND SEPARATE FINANCIAL STATEMENTS 31.8 Directors and key management personnel
The Remuneration of directors and other members of key management personnel during the year comprised short term benefits of N200.670 million (2013:N152.661 million)
31/12/2014 31/12/2013
N'000 N'000
Short-term benefits 200,670 152,661 Post-employment benefits - - Other long-term benefits - - Share-based payments - - Termination benefits - -
Total 200,670 152,661
Directors Group
Company
31/12/2014
31/12/2013
31/12/2014
31/12/2013
N'000
N'000
N'000
N'000
Directors' emoluments comprise:
Fees
18,500
18,500
16,500
18,500 salaries
240,670
60,716
240,670
60,716
others
69,585
73,445
68,133
73,445
328,755
152,661
325,303
152,661
Emoluments of the highest paid Director were 200,670
31,144
200,670
31,144
The number of Directors excluding the Chairman with gross emoluments within the bands stated below were:
Group
Group
Company
Company
31/12/2014
31/12/2013
31/12/2014
31/12/2013
N'000 N'000
N'000
N'000
N'000
0-19,000 8
8
8
8
20,000-25,000 -
-
-
-
26,000-31,000 -
2
-
2
38,000-43,000 2
-
2
-
Employees Average number of persons
employed during the year: Management 63
40
53
26
Senior staff 318
332
213
229 Junior staff 982
930
401
396
1,363
1,302
667
651
Aggregate payroll costs: Wages, salaries, allowances
and other benefits 4,628,064
3,272,472
3,239,315
2,430,450 Provision for gratuity 214,258
191,622
-
191,622
Pension cost 170,619
120,499
126,181
93,392
5,012,941
3,584,593
3,365,496
2,715,464

52
NOTES TO THE CONSOLIDATED AND SEPARATE FINANCIAL STATEMENTS 31.8 Directors and key management personnel (continued)
The number of employees with gross emoluments within the bands stated below are:
Group
Group
Company
Company
31/12/2014
31/12/2013
31/12/2014
31/12/2013
N'000
Number
Number
Number
Number 401-600
13
305
5
8
601-800
140
186
45
81 801-1,000
168
246
88
73
1,001-2,000 593
341
293
279 2,001-Above 449
224
236
210
1,363
1,302
667
651
32 Subsidiary acquired
Year
Principal activity Date of acquisition
Proportion of voting equity interests acquired
Consideration transferred(N'000)
2013
Savannah Sugar Company Limited
Growing of cane and production of sugar 01/01/2013 95% 3,214,923
Savannah was acquired to facilitate the Group's backward integration plan.
32.1 Consideration transferred
The consideration was cash of N3.214 billion paid to Dangote Industries Limited. 32.2 Assets acquired and liabilities recognised at the date of acquisition
2013
N'000
Current assets Inventories
1,505,539
Trade and other receivables
75,582
Cash and bank balances
134,775
Non-current assets Property, plant and equipment
16,687,326
Biological asset
609,454
Deferred tax
-
Current liabilities Trade and other payables
(16,396,432)
Current tax liabilities
(12,178)
Non-current tax liabilities Borrowings
(1,453,930)
Intercompany loans
(1,107,592)
Deferred tax
(975,513)
(932,969)

53
NOTES TO THE CONSOLIDATED AND SEPARATE FINANCIAL STATEMENTS 32.3 Non-controlling Interest
The Non-controlling interest (5% ownership interest in Savannah Company Limited recognised at the acquisition date was measured by the proportionate share of net assets method at N46.648million.
32.4 Net cash outflow on acquisition of subsidiaries
2013
N'000
Consideration paid in cash
3,214,923
Less: cash and cash equivalent balances acquired
(134,775)
3,080,148
32.5 Effect of acquisition of subsidiary under common control
The group has opted for merger accounting in accounting for subsidiary acquired
2013
N'000
Purchase consideration
3,214,923
Parent Company's share of Net Assets acquired (95% in Savannah)
886,320
Effect of acquisition of subsidiary under common control
4,101,243
33 Contingent liabilities
The Company is subject to additional assessed tax liability to the tune of N7.2 million, N17million and N75.99million based on the tax audit carried by Lagos State Inland Revenue Service for Tax year 2011, 2012 and 2013 respectively.
The total of N4,312,736,234.98 was assessed by FIRS based on the Nationwide VAT and WHT verification exercise for the period from 2008 - 2013. This includes the withholding tax of N2, 529,600,000 paid on dividend for the period under review which was remitted to FIRS through our Registrars, Veritas Registrars. Letter of objection to the liabilities assessed against the company with all required documents have been acknowledged by FIRS without any response. No provision has been made for this assessment based on the evidences provided by the company against the claims for which responses were yet to be received as at the year end.
The Company is subject to disputes and claims that arise in the normal course of business. As at 31 December 2014 the entity was subject to claims and disputed amounts of NGN31 million (2013 :NGN244million) We have made adequate provisions for these contingencies for the current year based on advice from the Company's legal experts that this is the estimated likely liability payable by the Company.
Contingent assets None 34 Capital commitments
As at 31 December 2014, there were capital commitments in respect of the Lagos factory expansion which amounted to N716.million (2013:N475.8million).

54
NOTES TO THE CONSOLIDATED AND SEPARATE FINANCIAL STATEMENTS 35 Event after the reporting period
At the board meeting held on 31st March 2015, the Board recommended a dividend of 40 kobo per ordinary share to be paid to shareholders (total value N4, 800,000,000) for the year ended 31 December 2014. This is subject to approval at the Annual General Meeting of the group."

DANGOTE SUGAR REFINERY PLC Consolidated and separate financial statements
For the year ended 31 December 2014
55
NON IFRS STATEMENT STATEMENT OF VALUE ADDED
GROUP
COMPANY
31/12/2014
31/12/2013
31/12/2014
31/12/2013
N'000
% N'000
%
N'000
%
N'000
%
Revenue
94,855,203
103,153,735
94,103,677
102,467,361
Other income
5,351,644
3,879,582
2,574,787
3,749,656
100,206,847
107,033,317
96,678,464
106,217,017 Less: Bought in materials
and services:
- Imported
(76,074,068)
(81,499,773)
(71,940,643)
(78,917,721)
- Local
(3,169,753)
(3,395,824)
(2,997,527)
(3,288,238)
Value Added
20,963,026
100 22,137,720
100
21,740,294
100
24,011,058
100
Applied as follows
To pay employees
Salaries, wages and other benefits
2,117,610
10 2,976,528
13
1,581,723
7
2,175,547
11
To pay government
Taxes
5,701,133
28 5,213,659
24
5,694,554
27
5,207,161
20
growth and payment of dividend
Deferred taxation
(2,063,760)
(9) 205,568
1
(130,402)
(2)
1,354,744
6 Depreciation
3,572,263
17 2885292
13
2,685,729
12
1,725,252
7
Profit for the year
11,635,780
54 10,845,932
49
11,908690
56
13,537,612
56 Other comprehensive income/(loss) for the year
-
- 10741
-
-
-
10,741
0
20,963,026
100 22,137,720
100
21,740,294
100
24,011,057
100
Value added represents the additional wealth the Group has been able to create by its own and its employees' efforts. This statement shows the allocation of that wealth among employees, capital providers, government and that retained for future creation of more wealth. This report is not prepared under IFRS. Instead, it has been prepared in compliance with the Company and Allied Matters Act (CAMA) requirement

DANGOTE SUGAR REFINERY PLC Consolidated and separate financial statements
For the year ended 31 December 2014
56
NON IFRS STATEMENT FINANCIAL SUMMARY
GROUP GROUP
December 2014
December 2013
N'000
N'000
Property, plant and equipment 50,472,720
41,847,307 Intangible assets 263,886
301,711
Investments -
- Other assets 189,337
109,693
Biological assets 1,122,679
487,215 Held for sales investment in subsidiary 864,647
-
Biological assets -
- Deferred taxation assets 1,991,324
555,467
Net current assets 2,061,905
10,159,385
56,966,498
53,460,778
Borrowings -
(385,052) Deferred taxation liabilities (4,259,509)
(4,741,717)
Gratuity provision (1,527,748)
(1,356,067)
51,179,241
46,977,941
CAPITAL AND RESERVES
Share capital 6,000,000
6,000,000 Share premium 6,320,524
6,320,524
Retained earnings 39,078,470
34,838,649 Non-controlling interest (219,753)
(181,232)
51,179,241
46,977,941
REVENUE AND PROFIT
Revenue 94,855,203
103,153,735
Profit before taxation 15,273,151
16,265,159
Profit after taxation 11,401,300
10,845,932
Per share data- (Kobo)
Earnings per share (Kobo) - Basic 97
90 Earnings per share (Kobo) - Annualised 97
90
Earnings per share (Kobo) - Net assets 426
391
Earnings per share are based on profit after taxation and the weighted average number of issued and fully paid ordinary shares at the end of each financial year. This report is not prepared under IFRS. Instead, it has been prepared in compliance with the Company and Allied Matters Act (CAMA) requirement

57
NON IFRS STATEMENT FIVE YEAR FINANCIAL SUMMARY
COMPANY
Dec 2014
Dec 2013
Dec 2012
Dec 2011
Dec 2010
IFRS
IFRS
IFRS
IFRS
NGAAP
N'000
N'000
N'000
N'000
N'000
Property, plant and equipment 29,346,717
26,250,037
17,898,310
16,283,504
15,509,562 Intangible assets 203,752
256,912
Investments 3,214,923
3,214,923
864,647
864,647
972,337 Other assets -
109,693
7,904
35,745
2,651
Held for sales investment in subsidiary 864,647
-
-
-
-
Biological assets -
-
-
-
- Net current assets 30,348,545
29,701,930
31,759,739
25,702,743
26,167,048
63,978,584
59,533,495
50,530,600
42,886,639
42,651,598
Deferred taxation liabilities (3,877,709)
(4,359,916)
(3,000,568)
(2,837,360)
(91,468) Gratuity provision (1,311,654)
(1,356,067)
(1,260,873)
(915,570)
(585,533)
58,789,221
53,817,512
46,269,159
39,133,709
41,974,597
CAPITAL AND RESERVES
Share capital 6,000,000
6,000,000
6,000,000
6,000,000
6,000,000 Share premium 6,320,524
6,320,524
6,320,524
6,320,524
6,320,524
Retained earnings 46,468,697
41,496,988
33,948,635
26,813,185
26769129
58,789,221
53,817,512
46,269,159
39,133,709
39,089,653
REVENUE AND PROFIT
Revenue 94,103,677
102,467,361
106,888,054
107,218,642
89,980,499
Profit before taxation 17,472,841
20,099,517
16,331,679
10,921,229
16,146,930 Profit after taxation 12,171,708
13,537,612
10,796,416
7,403,597
11,282,240
Per share data- (Kobo)
Earnings per share (Kobo) - Basic 99
113
90
62
94 Earnings per share (Kobo) -
Annualised 99
113
180
62
94
Earnings per share (Kobo) - Net assets 490
448
386
326
326
This report is not prepared under IFRS. Instead, it has been prepared in compliance with the requirement of the Companies and Allied Matters Act (CAMA). Earnings per share are based on profit after taxation and the weighted average number of issued and fully paid ordinary shares at the end of each financial year.
Top Related