


Languages
Pages
Legal


SLIDE1
Damage Investigation Following Hurricane Irma in Florida
David O. Prevatt, Ph.D.Kurtis R. Gurley, Ph.D.
Chris Ferraro
9 October 2017Tallahassee, FL

SLIDE2
Outline of Presentation
• Hurricane Irma Description & Florida Impact • UF’s Damage Survey Protocol & Participants• Irma’s Peak Winds & FBC Design Wind Speed • Preliminary Damage Observations (Exterior)• Summary and Next Steps


Hurricane Irma’s Impact in Florida
• Landfall in Two landfalls on Florida:– Cudjoe Key, FL à 106 mph gust wind speed at Big Pine Key (9/10/17)– Marco Island à 130 mph (9/10/17: 3:35 pm) at Police Department
• Affected Florida from 10 – 12 Sept. 2017– 116,000 persons in 530 shelters– 11 fatalities (including 8 elderly persons in nursing home AC accident)– Power loss affects ~ 3 million customers– Storm surge and flooding in Miami, the Keys, Everglade City and Naples

SLIDE5
3-sec gust wind speed contour Map (Applied Research Assoc.)

SLIDE6
180
170
160
150
130
140
State of Florida’s Design Wind Speed
Category II (3-sec. gust)

UF Damage Assessment Survey • Objective: To Investigate structures in regions experiencing hurricane force
(Cat 3 wind speeds) • Focus à mainly single family houses, some multi-family
– Wind damage– Water intrusion– Storm Surge effects
• Approach:– Ground survey used smartphone app: Fulcrum (www.fulcrum.com)– Aerial survey of specific areas– Conducted in 5 days – 9/12 – 9/17
• Collaborated with National Science Foundation RAPID survey – Led by Notre Dame University– Researchers from FIU (Miami) and FIT (Melbourne), Auburn University– International: James Cook University (Australia), Western University (Canada)
• Coverage: 1,100 structures – 5,000 photographs of exterior building damage– 3D Point Clouds and information on structures

SLIDE8
Data Collection Methodology• Modified Applied Technology Council ATC-20 survey form on smartphone app• All data collected and stored in central server • Photographs and data uploaded once app is synced• GPS location automatically established and address autofilled

SLIDE9
Sample Fulcrum Database

SLIDE10
Wind Speed Estimates & FBC Design Wind

SLIDE11
Jacksonville &St Augustine
Miami
Marco Island
Islamorada to Key West
Naples
Fort Myers
Everglades City and Chokoloskee
Preliminary Surveys

SLIDE12
Jacksonville &St Augustine
Miami
Marco Island
Islamorada to Key West
Naples
Fort Myers
Everglades City and Chokoloskee
180
170
160
150
130
140
State of Florida’s Design Wind Speed
Category II (3-sec. gust)

SLIDE13
Damage Observations

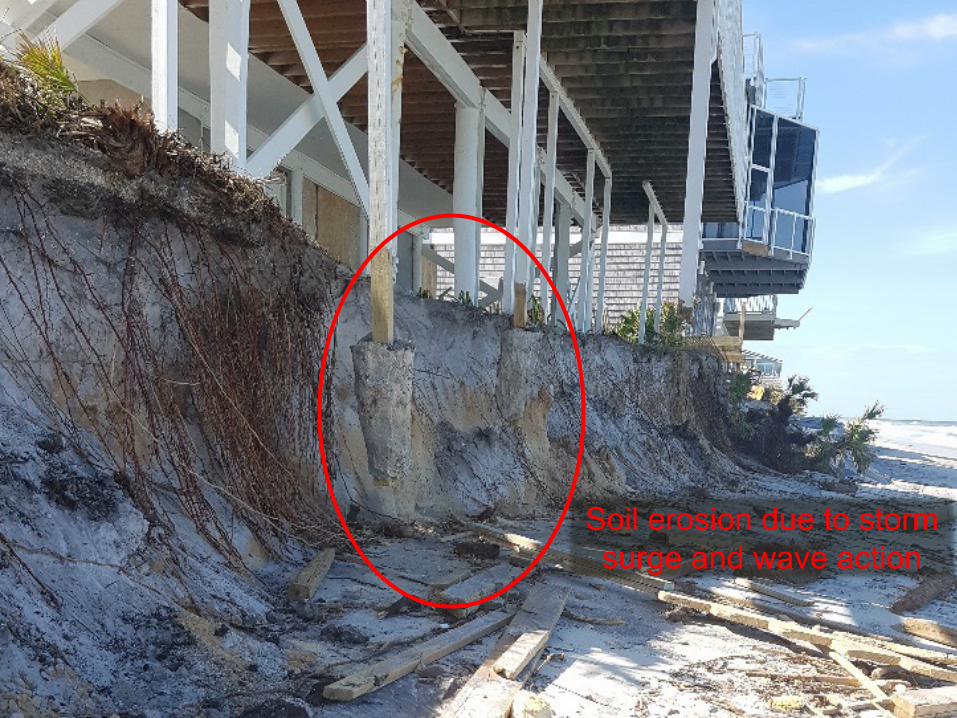
Jacksonville, St. Augustine: • Tornado touchdown – wind speed 130 mph• Coastal erosion along AIA highway• 46 structures surveyed• Most damage moderate
House #1Yr Built: 1982

SLIDE15
Extensive roof structure damage (from 130 mph tornado)

SLIDE16
SLIDE17
Soil erosion due to storm surge and wave action

SLIDE18
Underpinning

SLIDE19
Miami:• Estimated wind speed: 83 mph• Generally minor roofing damage • Failed ridge caps on clay tile roofs • 19 structures surveyed

SLIDE20
House #2 Yr Built: 1968 (Ridge Cap Damage)
SLIDE21
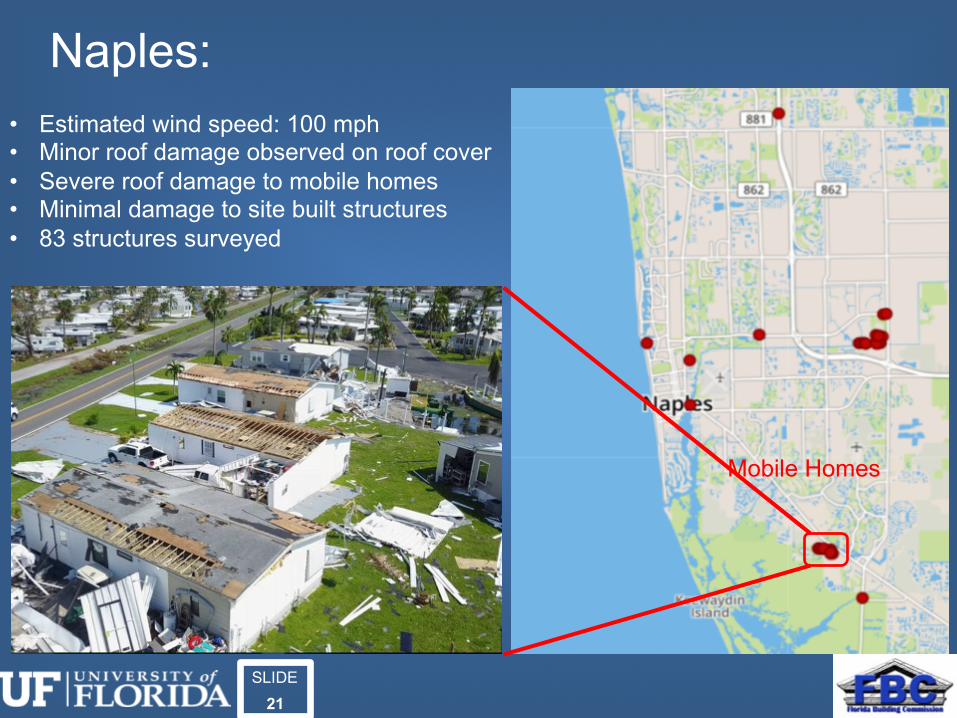
Naples:• Estimated wind speed: 100 mph• Minor roof damage observed on roof cover• Severe roof damage to mobile homes• Minimal damage to site built structures• 83 structures surveyed
Mobile Homes

SLIDE22
Damage to Structures in Naples, FL
Stick Built Homes
Mobile Homes
Site Built Houses

SLIDE23
House #3, 4 & 5Yr built: 1984
SLIDE24
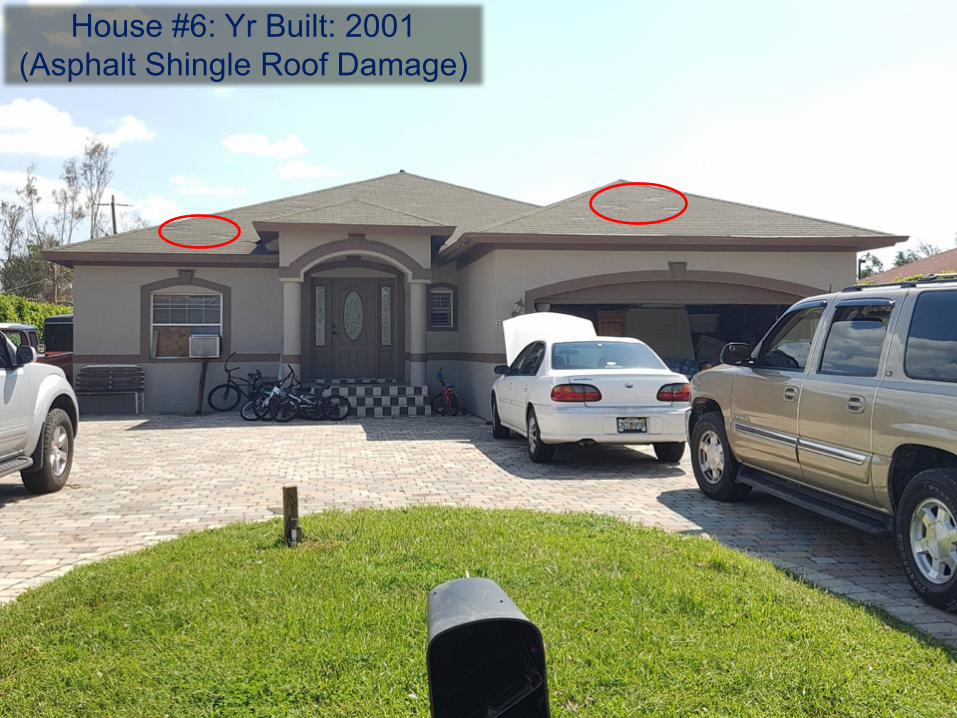
House #6: Yr Built: 2001(Asphalt Shingle Roof Damage)

SLIDE25
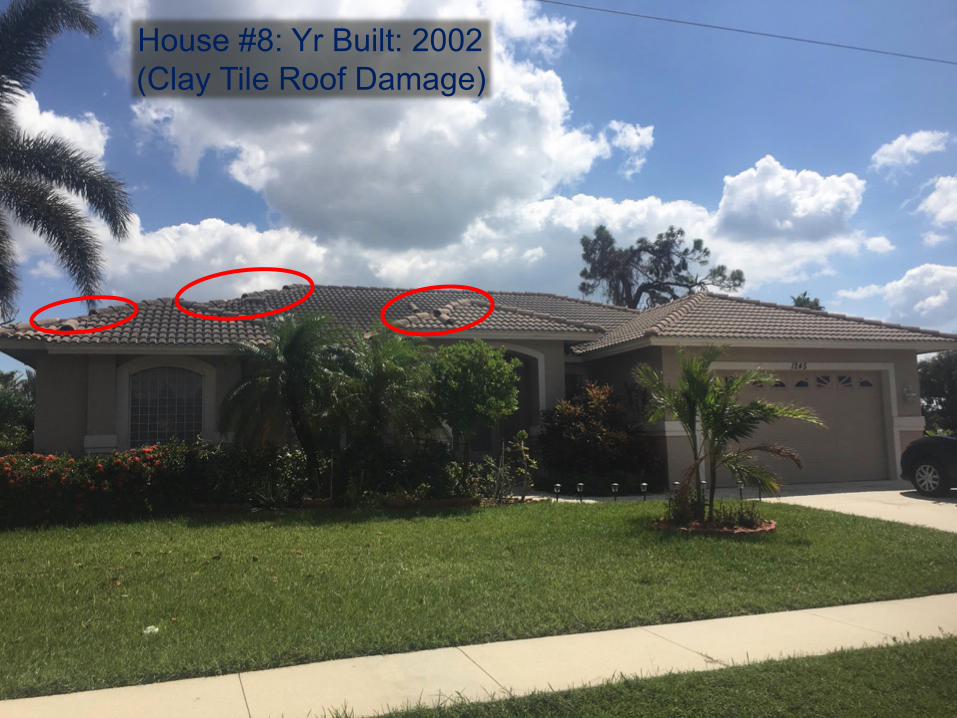
Marco Island:
• Estimated wind speed: 108 mph• Minor roof damage observed on roof cover• Houses have high quality.• 215 structures surveyed

SLIDE26
House #7: Yr Built: 1970(Asphalt Shingle Roofing Damage)
SLIDE27
House #8: Yr Built: 2002(Clay Tile Roof Damage)

SLIDE28
Value of Aerial Surveys

SLIDE29
Damaged clay tile roof on 10-story condominium, Marco Island

Wind Damage Assessment: Example ApplicationsHurricane Irma 2017: Gr0und and aerial

SLIDE31

SLIDE32
Storm Surge Damage

SLIDE33
Everglades City:• Estimated wind speed: 110 mph• severe storm surge • minor wind damage on roof cover• 83 structures surveyed

SLIDE34
House #10(Minimal exterior damage
Severe storm surge damage)

SLIDE35
House #10(Interior photo showing
damage from storm surge)

SLIDE36
House #11(Failed masonry piers)

SLIDE37
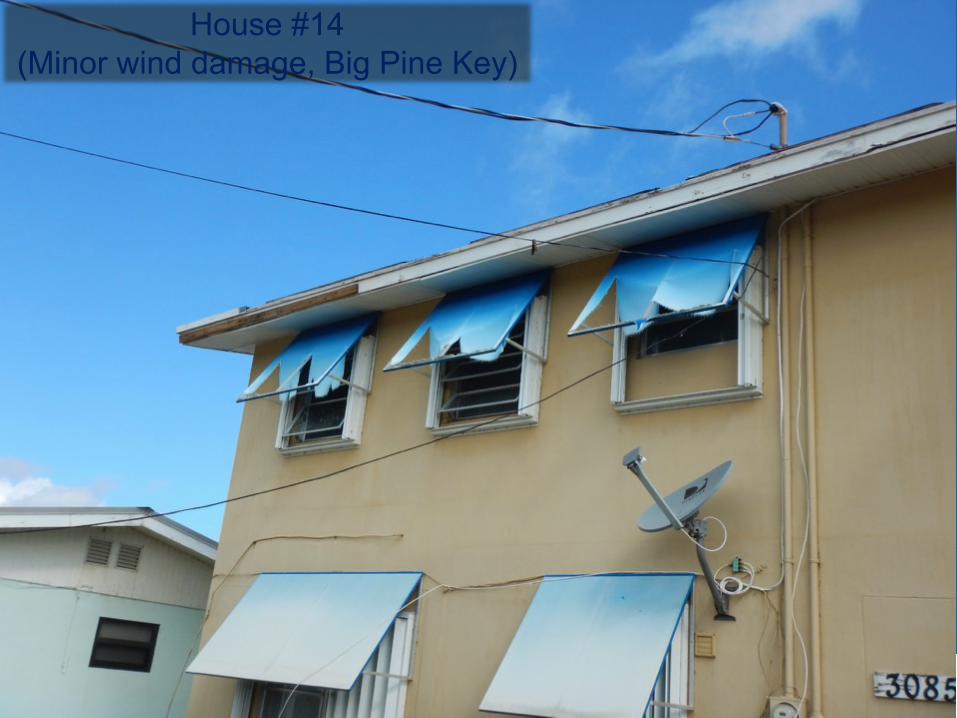
Chokoloskee:• Estimated wind speed: 110 mph• severe storm surge • minor roof cover and wall cladding damage• 40 structures surveyed
SLIDE38
House #14(Minor wind damage, Big Pine Key)

SLIDE39
House #14(Interior photo for
house in Big Pine Key)

SLIDE40
House #14(storm surge inside)

SLIDE41
House #12(Vinyl siding damage)

SLIDE42
Islamorada to Key West:• Estimated wind speed: 116 mph• Wide spread roof cover damage• Also storm surge damage widespread• by FIU and FIT researchers • 513 structures surveyed

SLIDE43
House #13: Yr Built: 2007(Vinyl siding & asphalt shingle roof damage)

SLIDE44
Analysis

SLIDE45
1. WindLoad ∝ WindSpeed /(𝑖𝑠 𝑝𝑟𝑜𝑝𝑜𝑟𝑡𝑖𝑜𝑛𝑎𝑙 𝑡𝑜)
DEFINITION: Windloadratio =ActualWindLoad𝐷𝑒𝑠𝑖𝑔𝑛𝑊𝑖𝑛𝑑𝐿𝑜𝑎𝑑
3. WindLoadRatio = QRSTUVWXYZ[\]]Z^_`abcdacefg__e
/×100%
• Next Slide à Comparing Actual Load vs. Design Load(approximately based on wind speed)
Structural Damage to Wind Speed Relationship

SLIDE46
180
170
160
150
130
140
State of Florida’s Design Wind Speed
Category II (3-sec. gust)

Surveyed RegionExample House
NumberZip Code of
HousesDegree of Damage Year built
Actual Wind Speed(3-sec peak gust )
Design Wind Speed
(Category II)
Wind Load
Ratio (%)
Jacksonville and St Augustine 1 FL 32080 Severe
(Tornado) 1982 130 (EF2 Tornado) 132 97
Miami 2 FL 33135 Minor 1968 83 168 24
Naples3, 4 and 5 FL 34113 Severe
(Mobile Homes) 1984 100 166 36
6 FL 34113 Minor 2001 100 166 36
Marco Island7 FL 34145 Minor 1970 108 169 41
8 FL 34145 Minor 2002 108 169 41
Everglades City
9 FL 34139 Moderate — 110 163 46
10 FL 34139 Severe(surge) — 110 163 46
11 FL 34139 Moderate(surge) — 110 163 46
Chokoloskee 12 FL 34141 Moderate — 110 164 45
Islamorada to Key West
13 FL 33042 Moderate(wind & surge) 1998 116 180 42
14 FL 33043 Moderate(surge) — 116 180 42
Wind Load Ratios & Damage at Survey Sites

Summary & Next Steps• Hurricane Irma was not a design level wind event
• Wind loads ranged from 25% to 97% of design levels• More vulnerable structures in North-Central Florida (lower design wind speeds)
• The question: Should any structures have failed?• Florida structures generally performed okay • The more severe damage more likely in older structures
• However, our preliminary survey à exterior damage only• Storm surge damage & costs high in low-lying areas• Future Work Proposal:
• Conduct interview with home owners to:• Capture & quantify distribution and extent of interior damage• Estimate of repair costs & time and evacuation
• Assess homeowner opinions on retrofit & strengthening home• Capture effects of water intrusion & storm surge

SLIDE49
AcknowledgementWe gratefully acknowledge financial support of the Florida Building Commission
We wish to acknowledge the National Science Foundation RAPID Award through Notre Dame University
Researchers and Student Participation: • Florida International University (Miami, FL)• Florida Institute of Technology (Melbourne, FL)• University of Western Ontario (Canada)• James Cook University (Australia)• Auburn University

SLIDE50
Thank You and Questions?
David O. Prevatt@davidprevatt2
Top Related