


Languages
Pages
Legal


Report on KPI values
Delivery date
28-02 -2014
Submission date
18-03-2014
Dissemination Level
PU- Public
Revision History
Date Partner
2014-02-11 Preliminary draft uploaded on the sharepoint 2014-02-28 Final draft
2014-03-18 Final version after second round of comments from partners responsible of the demonstrators
Project Acronym: CELSIUS
Project Title: Combined Efficiency Large Scale Integrated Urban Systems Grant Agreement No.: 314441Starting date: 01-04-2013 Funding scheme: Collaborative Project duration: 48 months
D 4.1
Report on KPI values
Task leader
D’Appolonia
Prepared by:
D’Appolonia
Partners
SP Sveriges Tekniska Forskningsinstitut, Goteborg Energy AB, Interactive Institute Swedish ICT AB, Fachhochschule Koln, Genova Reti Gas srl, UK Power Network, London Bourough of Islington, Warmtebedrijf Infra Nv, Rheinenergie
Preliminary draft uploaded on the sharepoint (new demonstrators)Final draft including the existing demonstrators Final version after second round of comments from partners responsible
demonstrators
Combined Efficiency Large Scale Integrated Urban
314441
Collaborative project
SP Sveriges Tekniska Forskningsinstitut, Goteborg Energy AB, Interactive Institute Swedish ICT AB, Fachhochschule Koln, Genova Reti Gas srl, UK Power Network, London Bourough of Islington, Warmtebedrijf Infra Nv, Rheinenergie
Ver.
(new demonstrators) 1 2
Final version after second round of comments from partners responsible 3
1. Introduction ................................2. Methodology ................................3. Specific key performance indicators
3.1 Genoa demonstrator (GEN1)3.1.1 Objective of the demonstrator and baseline situation3.1.2 List of specific KPIs
3.2 Gothenburg demonstrator (GO1)3.2.1 Objective of the demonstrator and baseline situation3.2.2 List of specific KPIs
3.3 Gothenburg demonstrator (GO2)3.3.1 Objective of the demonstrator and baseline si3.3.2 List of specific KPIs
3.4 Gothenburg demonstrator (GO3)3.4.1 Objective of the demonstrator and baseline situation3.4.2 List of specific KPIs
3.5 Cologne demonstrator (CO1)3.5.1 Objective of the demonstrator and baseline situation3.5.2 List of specific KPIs
3.6 London demonstrator (LO1)3.6.1 Objective of the demonstrator and baseline situation3.6.2 List of specific KPIs
3.7 London demonstrators (LO2+LO3)3.7.1 Objective of the demonstrator and baseline situation3.7.2 List of specific KPIs
3.8 Rotterdam demonstrator: RO13.8.1 Objective of the demonstrator and baseline situation3.8.2 List of specific KPIs
3.9 Rotterdam demonstrator: RO23.9.1 Objective of the demonstrator and baseline situ3.9.2 List of specific KPIs
4. Specific key-performance indicators: existing demonstrators4.1 Gothenburg Demonstrator (9GOe)
4.1.1 Objective of the demonstrator and baseline situation4.1.2 List of specific KPIs
4.2 Gothenburg Demonstrator (29GOe)4.2.1 Objective of the demonstrator and baseline situation4.2.2 List of specific KPIs
4.3 Gothenburg Demonstrator (19GOe)4.3.1 Objective of the demonstrator and baseline situation4.3.2 List of specific KPIs
4.4 Gothenburg Demonstrator (11GOe)4.4.1 Objective of the demonstrator and baseline 4.4.2 List of specific KPIs
4.5 Gothenburg Demonstrator (20GOe)4.5.1 Objective of the demonstrator and baseline situation4.5.2 List of specific KPIs
4.6 Gothenburg Demonstrator (8GOe)4.6.1 Objective of the demonstrator and baseline situation4.6.2 List of specific KPIs
4.7 Gothenburg Demonstrator (7GOe)4.7.1 Objective of the demonstrator and baseline situation4.7.2 List of specific KPIs
4.8 Gothenburg Demonstrator (36GOe)
................................................................................................................................................................................................................................................................
Specific key performance indicators - new demonstrators ................................r (GEN1) ................................................................................................
Objective of the demonstrator and baseline situation ................................List of specific KPIs ................................................................................................
Gothenburg demonstrator (GO1) ................................................................Objective of the demonstrator and baseline situation ................................List of specific KPIs ................................................................................................
Gothenburg demonstrator (GO2) ................................................................Objective of the demonstrator and baseline situation ................................List of specific KPIs ................................................................................................
Gothenburg demonstrator (GO3) ................................................................Objective of the demonstrator and baseline situation ................................List of specific KPIs ................................................................................................
Cologne demonstrator (CO1) ................................................................................................Objective of the demonstrator and baseline situation ................................List of specific KPIs ................................................................................................
London demonstrator (LO1) ................................................................................................Objective of the demonstrator and baseline situation ................................List of specific KPIs ................................................................................................
London demonstrators (LO2+LO3) ................................................................Objective of the demonstrator and baseline situation ................................List of specific KPIs ................................................................................................
Rotterdam demonstrator: RO1 ................................................................................................Objective of the demonstrator and baseline situation ................................List of specific KPIs ................................................................................................
Rotterdam demonstrator: RO2 ................................................................................................Objective of the demonstrator and baseline situation ................................List of specific KPIs ................................................................................................
performance indicators: existing demonstrators ................................Gothenburg Demonstrator (9GOe) ................................................................
Objective of the demonstrator and baseline situation ................................List of specific KPIs ................................................................................................
Gothenburg Demonstrator (29GOe) ................................................................Objective of the demonstrator and baseline situation ................................List of specific KPIs ................................................................................................
Gothenburg Demonstrator (19GOe) ................................................................Objective of the demonstrator and baseline situation ................................List of specific KPIs ................................................................................................
Gothenburg Demonstrator (11GOe) ................................................................Objective of the demonstrator and baseline situation ................................List of specific KPIs ................................................................................................
Gothenburg Demonstrator (20GOe) ................................................................Objective of the demonstrator and baseline situation ................................List of specific KPIs ................................................................................................
Gothenburg Demonstrator (8GOe) ................................................................Objective of the demonstrator and baseline situation ................................List of specific KPIs ................................................................................................
Gothenburg Demonstrator (7GOe) ................................................................Objective of the demonstrator and baseline situation ................................List of specific KPIs ................................................................................................
Gothenburg Demonstrator (36GOe) ................................................................2
.......................................... 4 ........................................ 6
................................................................... 8 ............................................ 9
................................................................ 9 ................................................ 11
.................................................................... 16 .............................................................. 16
................................................ 17 .................................................................... 19
.............................................................. 19 ................................................ 21
.................................................................... 25 .............................................................. 25
................................................ 27 .......................................... 30
.............................................................. 30 ................................................ 32
........................................... 36 .............................................................. 36
................................................ 39 ................................................................ 42 .............................................................. 42
................................................ 44 ........................................ 48
.............................................................. 48 ................................................ 50
........................................ 52 .............................................................. 52
................................................ 54 ............................................................ 55
................................................................. 56 .............................................................. 56
................................................ 56 ............................................................... 58 .............................................................. 58
................................................ 58 ............................................................... 60 .............................................................. 60
................................................ 60 ............................................................... 63 .............................................................. 63
................................................ 63 ............................................................... 66 .............................................................. 66
................................................ 66 ................................................................. 67
.............................................................. 67 ................................................ 67
................................................................. 68 .............................................................. 68
................................................ 68 ............................................................... 69
4.8.1 Objective of the demonstrator and baseline situation4.8.2 List of specific KPIs
4.9 Cologne Demonstrator (12COe)4.9.1 List of specific KPIs
4.10 Cologne Demonstrator (6COe)4.10.1 List of specific KPIs
5. General KPIs ................................5.1 Energy indicators ................................5.2 Environmental indicators5.3 Economic indicators ................................5.4 Social indicators ................................
6. Conclusions ................................
Objective of the demonstrator and baseline situation ................................List of specific KPIs ................................................................................................
Cologne Demonstrator (12COe) ................................................................List of specific KPIs ................................................................................................
Cologne Demonstrator (6COe) ................................................................List of specific KPIs ................................................................................................
................................................................................................................................................................................................................................
Environmental indicators ................................................................................................................................................................................................
................................................................................................................................................................................................................................
3
.............................................................. 69 ................................................ 69
..................................................................... 72 ................................................ 72
................................................................... 74 ............................................. 74
...................................... 75 ............................................................ 75
................................................ 76 ....................................................... 77
.............................................................. 77 ........................................ 82

1. Introduction The Celsius project aims at developing, optimizing and promoting efficient decentralized heating and cooling systems in cities of primary energy consumption.The project involves five different cities (Gothenburg, Cologne, Genoa, London and Rotterdam) and foresees the realization and monitoring of 10 new demonstrators covering different efficient technologies, systems and practices: development of ICT tools for the optimization of the energy management, innovative solutions for storage and load control, development of smart grids to increase the use of waste heatapproaches for integrating energy centres to the grid, expansion of existing district heating/cooling networks. Besides the new demonstrators that will be realized and operated during the Celsius project, operational existing demonstrators in the five wide range of state-of-the-art demonstrators belonging to different categories for increasing the potential of replicability of the most efficient smart solutions in suitable contexts.A list of new and existing demis reported in the tables below:
Demo ID. City
GO1 Gothenburg
GO2 Gothenburg
GO3 Gothenburg
RO1 Rotterdam
RO2 Rotterdam
LO1 London
LO2 London
LO3 London
CO1 Cologne
GE1 Genoa
Table
The Celsius project aims at developing, optimizing and promoting efficient decentralized heating and cooling systems in cities thus consistently contributing to the reduction of COof primary energy consumption. The project involves five different cities (Gothenburg, Cologne, Genoa, London and Rotterdam) and foresees the realization and monitoring of 10 new demonstrators covering different efficient
s and practices: development of ICT tools for the optimization of the energy management, innovative solutions for storage and load control, development of smart grids to
heat and renewable energy sources, development of innovativeapproaches for integrating energy centres to the grid, expansion of existing district heating/cooling
Besides the new demonstrators that will be realized and operated during the Celsius project, operational existing demonstrators in the five cities are also part of the project aimed at covering a
art demonstrators belonging to different categories for increasing the potential of replicability of the most efficient smart solutions in suitable contexts.
nd existing demonstrators with the specific identification code is reported in the tables below:
Demonstrator's Short Description
Short term Storage
District heating to white goods
District heating to ships
The heat hub
Industrial ecology
Active network management and demand response
Capture of identified sources and waste heat andintegration of thermal store
Extension of Bunhill “seed” heating system
Heat recovery from sewage water (school buildings)
Energy recovery from the natural gas distribution network
Table 1 - New demonstrators in the Celsius project
4
The Celsius project aims at developing, optimizing and promoting efficient decentralized heating consistently contributing to the reduction of CO2 emission and
The project involves five different cities (Gothenburg, Cologne, Genoa, London and Rotterdam) and foresees the realization and monitoring of 10 new demonstrators covering different efficient
s and practices: development of ICT tools for the optimization of the energy management, innovative solutions for storage and load control, development of smart grids to
and renewable energy sources, development of innovative approaches for integrating energy centres to the grid, expansion of existing district heating/cooling
Besides the new demonstrators that will be realized and operated during the Celsius project, cities are also part of the project aimed at covering a
art demonstrators belonging to different categories for increasing the potential of replicability of the most efficient smart solutions in suitable contexts.
code in the Celsius project
Demonstrator's Short Description
District heating to white goods
Active network management and demand response
Capture of identified sources and waste heat and integration of thermal store
Extension of Bunhill “seed” heating system
Heat recovery from sewage water (school buildings)
Energy recovery from the natural gas distribution network
Demo ID City
12COe Cologne
28COe Cologne
6COe Cologne
36GOe Gothenburg
19GOe Gothenburg
29GOe Gothenburg
11GOe Gothenburg
7GOe Gothenburg
2GOe Gothenburg
8GOe Gothenburg
9GOe Gothenburg
20GOe Gothenburg
17ROe Rotterdam
5ROe, 14ROe Rotterdam
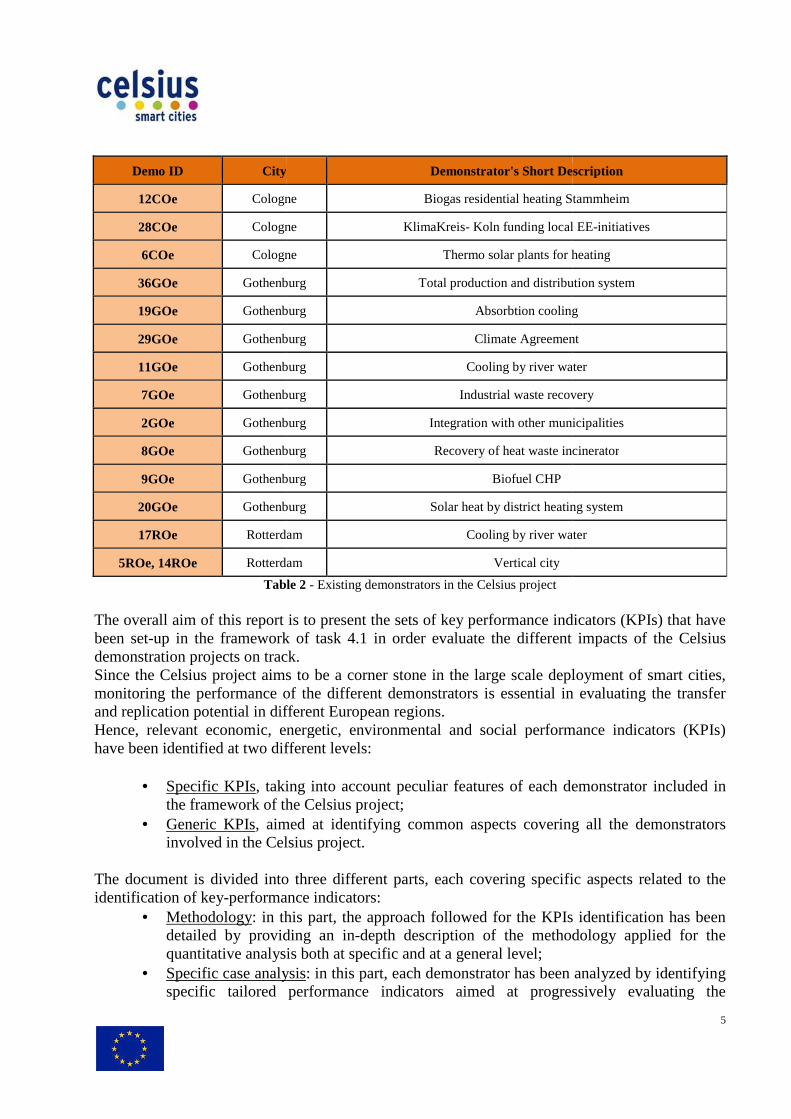
Table The overall aim of this report is to present the sets of key performance indicators (KPIbeen set-up in the framework of task 4.1 in order evaluatedemonstration projects on track.Since the Celsius project aims to be a corner stone in the large scale deployment of smart cities, monitoring the performance of the different demonstratorsand replication potential in different European regions. Hence, relevant economic, energetic, environmental and socialhave been identified at two different levels:
• Specific KPIs, taking into account peculiar features of each demonstratorthe framework of the Celsius pr
• Generic KPIs, aimedinvolved in the Celsius project
The document is divided into three different parts, each identification of key-performance
• Methodology: in this part, thedetailed by providing an inquantitative analysis both at specific and at a general level
• Specific case analysisspecific tailored performance indicators aimed
City Demonstrator's Short Description
Cologne Biogas residential heating S
Cologne KlimaKreis- Koln funding local EE
Cologne Thermo solar plants for heating
Gothenburg Total production and distribution system
Gothenburg Absorbtion cooling
Gothenburg Climate Agreement
Gothenburg Cooling by river water
Gothenburg Industrial waste recovery
Gothenburg Integration with other municipalities
Gothenburg Recovery of heat waste incinerator
Gothenburg Biofuel CHP
Gothenburg Solar heat by district heating
Rotterdam Cooling by river water
Rotterdam Vertical city
Table 2 - Existing demonstrators in the Celsius project
The overall aim of this report is to present the sets of key performance indicators (KPIup in the framework of task 4.1 in order evaluate the different
on track. project aims to be a corner stone in the large scale deployment of smart cities,
the performance of the different demonstrators is essential in evaluating the transfer and replication potential in different European regions.
economic, energetic, environmental and social performance indicators (KPIs) have been identified at two different levels:
, taking into account peculiar features of each demonstratorthe framework of the Celsius project;
, aimed at identifying common aspects covering all the demonstrators involved in the Celsius project.
The document is divided into three different parts, each covering specific aspects related to the performance indicators:
: in this part, the approach followed for the KPIs identificationby providing an in-depth description of the methodology
quantitative analysis both at specific and at a general level; analysis: in this part, each demonstrator has been analyzed by identifying ed performance indicators aimed at progressively evaluating the
5
Demonstrator's Short Description
Biogas residential heating Stammheim
Koln funding local EE-initiatives
olar plants for heating
and distribution system
Absorbtion cooling
Climate Agreement
Cooling by river water
Industrial waste recovery
Integration with other municipalities
Recovery of heat waste incinerator
Solar heat by district heating system
Cooling by river water
The overall aim of this report is to present the sets of key performance indicators (KPIs) that have the different impacts of the Celsius
project aims to be a corner stone in the large scale deployment of smart cities, is essential in evaluating the transfer
performance indicators (KPIs)
, taking into account peculiar features of each demonstrator included in
common aspects covering all the demonstrators
overing specific aspects related to the
for the KPIs identification has been dology applied for the
demonstrator has been analyzed by identifying at progressively evaluating the
technical, environmental, economic and social identified business
• Identification of common featuresaspects of Celsius for the evaluation of
2. Methodology The set-up of tailored key performance imeasurement of the performance of the Celsius demonstrators
• guarantee transparency• evaluate the achievement of the
strategies for improvement• compare the application of the
as usual situations; • compare different technical solutions among them;• communicate in a simple and understandable way the achievements related to the
operation of each demonstratorand people benefitting of the aawareness and acceptance contexts.
The identification of KPIs has required the setin the framework of the Celsius project, consisting of dif
• Analysis of the concept of each demonstratorpartner has been interviewed demonstrator, on the specific smart technology applied for reaching the objective, on the integration of the process with possible existing facilities, on the expected impact and on the relative reference context
• Identification of the baselinefor each demonstrator, aimedsituation after the implementation of the innovative smart solution developed and operated in the framework of the Celsius project. Baseline situation correspondsprosecution in the future of the situation prior to the implementation of the demonstrator and it will be inferred by collecting data from energy demand and use from the same sitebefore the installation and operation of the demonstrators or by similar contexts where the heating/cooling demand i
• Definition of a list of specific KPIsand social KPIs has been identified and shared with each demoin order to ensure the convergence of the elaborated list to the real implemented project and to the specific context
• Definition of common conventions and methodology forcommon nomenclature scheme has been setthe identification of the
technical, environmental, economic and social performances inidentified business as usual situation; Identification of common features: the last part of the document
of Celsius demonstrators by providing a set of general KPIs that will be used the evaluation of the global impact of the Celsius project.
ey performance indicators is a useful approach to providemeasurement of the performance of the Celsius demonstrators during their operation
transparency and consistency of monitoring procedures; achievement of the prefixed targets by identifying possible deviations and
strategies for improvement; the application of the innovative developed concepts with
technical solutions among them; in a simple and understandable way the achievements related to the
operation of each demonstrator to the involved stakeholders, public authorities,and people benefitting of the application of the new technologies
and acceptance at different levels and potential of replicability in similar
he identification of KPIs has required the set-up of a proper methodology that has been followed framework of the Celsius project, consisting of different working phases described
Analysis of the concept of each demonstrator: in particular, each demohas been interviewed in order to collect information on the object
demonstrator, on the specific smart technology applied for reaching the objective, on the integration of the process with possible existing facilities, on the expected impact and on the relative reference context; Identification of the baseline situation: the business as usual situation has been identified
or, aimed at defining a reference scenario towardsituation after the implementation of the innovative smart solution developed and operated
mework of the Celsius project. Baseline situation correspondsprosecution in the future of the situation prior to the implementation of the demonstrator
be inferred by collecting data from energy demand and use from the same sitebefore the installation and operation of the demonstrators or by similar contexts where the heating/cooling demand is managed in a conventional way; Definition of a list of specific KPIs: a list of specific technical, environmenta
been identified and shared with each demonstratorin order to ensure the convergence of the elaborated list to the real implemented project and to the specific context;
n conventions and methodology for calculationcommon nomenclature scheme has been set-up for the defined KPIs in order to harmonize
the specific KPIs. In particular, an ID code has been
6
in comparison with the
st part of the document analyzes the common demonstrators by providing a set of general KPIs that will be used
is a useful approach to provide a quantitative during their operation in order to:
by identifying possible deviations and
with the respective business
in a simple and understandable way the achievements related to the public authorities, end-users
tion of the new technologies, increasing public and potential of replicability in similar
up of a proper methodology that has been followed ferent working phases described below:
demonstrator responsible in order to collect information on the objectives of the
demonstrator, on the specific smart technology applied for reaching the objective, on the integration of the process with possible existing facilities, on the expected impact and on
: the business as usual situation has been identified ward which to compare the
situation after the implementation of the innovative smart solution developed and operated mework of the Celsius project. Baseline situation corresponds to the natural
prosecution in the future of the situation prior to the implementation of the demonstrator be inferred by collecting data from energy demand and use from the same site
before the installation and operation of the demonstrators or by similar contexts where the
a list of specific technical, environmental, economic nstrator responsible partner
in order to ensure the convergence of the elaborated list to the real implemented project
calculation of specific KPIs: a up for the defined KPIs in order to harmonize
an ID code has been provided to each
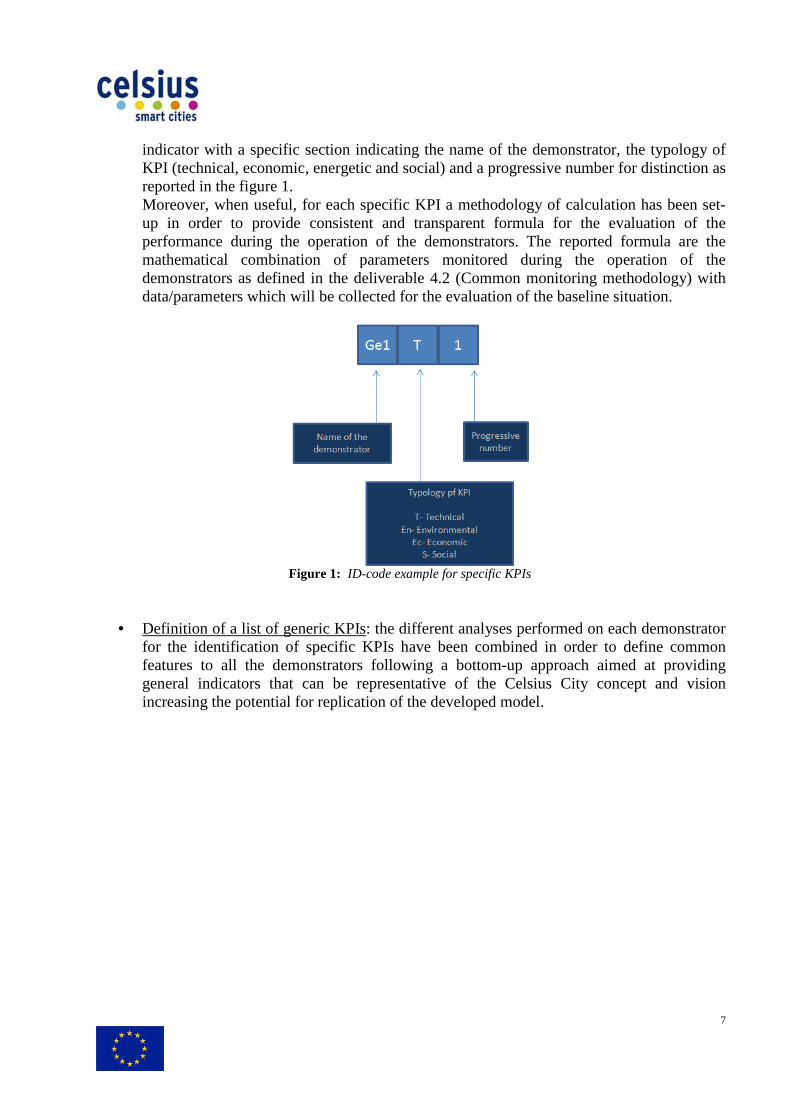
indicator with a specific section indicatingKPI (technical, economic, energetic and social) and a progressive number for distinction as reported in the figure 1.Moreover, when useful,up in order to provide performance during the operation of the demonstrators. The reported formula mathematical combination of parameters monitored during the operation of the demonstrators as defined in the deliverable 4.2 (Common monitoring methodology)data/parameters which will be collected for
• Definition of a list of generic KPIsfor the identification of features to all the demonstrators general indicators that can be representative of the Celsius increasing the potential
indicator with a specific section indicating the name of the demonstrator, the typology of technical, economic, energetic and social) and a progressive number for distinction as
1. when useful, for each specific KPI a methodology of calculation has be
up in order to provide consistent and transparent formula for the evaluation of the during the operation of the demonstrators. The reported formula
combination of parameters monitored during the operation of the defined in the deliverable 4.2 (Common monitoring methodology)
data/parameters which will be collected for the evaluation of the baseline situation.
Figure 1: ID-code example for specific KPIs
a list of generic KPIs: the different analyses performed on each demonstrator identification of specific KPIs have been combined in order to define common to all the demonstrators following a bottom-up approach
general indicators that can be representative of the Celsius City concept and vision the potential for replication of the developed model.
7
demonstrator, the typology of technical, economic, energetic and social) and a progressive number for distinction as
for each specific KPI a methodology of calculation has been set-formula for the evaluation of the
during the operation of the demonstrators. The reported formula are the combination of parameters monitored during the operation of the
defined in the deliverable 4.2 (Common monitoring methodology) with baseline situation.
s performed on each demonstrator have been combined in order to define common
up approach aimed at providing City concept and vision

3. Specific key performance Following the specific analysis performed on each demonstrator, a list of specific KPIs haset-up in order to evaluate the performance and the impact of each demonstrator from the technical, economic, social and envirodemonstrator responsible partner in order to verify the suitability of the identified indicators to the specific context in which the demonstrator is applied.An iterative working approach has been partners, collecting their feedback on the preliminary provided lists and progressively implementing updated information in order to ensure the convergence of the elaborated listthe real implemented technical solution and toConsidering the different degreemoment, the list of suggested KPIs can be subject to future in accordance with the definitive design and real implementation solution. Specific KPIs calculation will be based on the measurements which will be collected as described in the deliverable 4.2. The results from the analysis will be progressive deliverables 4.3 “Reports detailing progress and achievements on each demonstrator and analyzing causes for deviation”In the sub-paragraphs below, the analysis of each new demonstratorthe framework of the Celsius project is reported by including a description of the implemented technology and of the correspondent baseline situation, a simplifisolution, the list of relevant specific KPIs and a summary table including, when necessary, the respective formulas for calculation. For each demonstrator four categories of
• Technical indicators, aimduring the operation;
• Economic indicators, providing the evaluation of the economic impact for the involved stakeholders and main end
• Environmental indicatorsfrom the implementation of the demonstrator;
• Social indicators, aimedapplication of the technology
performance indicators - new demonstrators
analysis performed on each demonstrator, a list of specific KPIs haup in order to evaluate the performance and the impact of each demonstrator from the
technical, economic, social and environmental point of view. KPIs have been shared with each responsible partner in order to verify the suitability of the identified indicators to the
specific context in which the demonstrator is applied. working approach has been followed, by establishing periodical contacts with project
partners, collecting their feedback on the preliminary provided lists and progressively implementing updated information in order to ensure the convergence of the elaborated list
mplemented technical solution and to the specific context. Considering the different degrees of implementation of the various demonstrator
, the list of suggested KPIs can be subject to possible modificationsre in accordance with the definitive design and real implementation of each
Specific KPIs calculation will be based on the results of monitored parameters measurements which will be collected every six months during the operation of the demonstrator as described in the deliverable 4.2. The results from the analysis will be
deliverables 4.3 “Reports detailing progress and achievements on each demonstrator and analyzing causes for deviation”.
paragraphs below, the analysis of each new demonstrator to be realized and operated in the framework of the Celsius project is reported by including a description of the implemented technology and of the correspondent baseline situation, a simplified layout of the technical solution, the list of relevant specific KPIs and a summary table including, when necessary, the respective formulas for calculation.
For each demonstrator four categories of specific indicators have been identified
, aimed at evaluating the energy efficiency of the
, providing the evaluation of the economic impact for the involved stakeholders and main end-users; Environmental indicators, providing estimations of the environmental impact deriving
lementation of the demonstrator; aimed at estimating the main measurable social benefits due to the
application of the technology.
8
new demonstrators
analysis performed on each demonstrator, a list of specific KPIs has been up in order to evaluate the performance and the impact of each demonstrator from the
nmental point of view. KPIs have been shared with each responsible partner in order to verify the suitability of the identified indicators to the
followed, by establishing periodical contacts with project partners, collecting their feedback on the preliminary provided lists and progressively implementing updated information in order to ensure the convergence of the elaborated list both to
demonstrators at the present modifications/integrations in the
of each applied technical of monitored parameters
operation of the demonstrator as described in the deliverable 4.2. The results from the analysis will be included in the
deliverables 4.3 “Reports detailing progress and achievements on each demonstrator
realized and operated in the framework of the Celsius project is reported by including a description of the implemented
ed layout of the technical solution, the list of relevant specific KPIs and a summary table including, when necessary, the
have been identified:
at evaluating the energy efficiency of the demonstrators
, providing the evaluation of the economic impact for the involved
environmental impact deriving
the main measurable social benefits due to the

3.1 Genoa demonstrator
3.1.1 Objective of the demonstratorAlong with energy saving and efficiency improvement actions, a more widespread use of distributed generation and district heating/cooling is planned by Genoa City administration. Distributed generation is being in fact considered as a keyenergy supply mix, and one of the promising potentials on which the city administration plans to intervene in order to achieve the intended targets for 2020. A more widespregeneration would allow shifting from the actual widespread use of low efficiency independent heating systems to higher efficiency solutions, thus reducing significantly overall fuel consumptions and CO2 emissions. Thus, in order to inarea of the city of Genoa, the Val Bisagno area, the development of a local energy system integrating the industrial area is currently being planned.In this specific context, the objective associated to Genoa’sthe natural gas distribution network” (GE1) is to increase the overall energy efficiency associated to the gas distribution activity. In order to achieve the objective, the installation of an expansion turbine interfaced to a gas fired CHP plant is foreseen. Thus, it will be possible to recover both the mechanical energy from the gas expansion process and heat from coheating network that will supply several buildings inside and outside the idistrict). The industrial area where the demonstrator will be built hosts the natural gas distribution facilities, where the gas pressure is reduced from 24 bars ofthe 5 bar of the local distribution. The actual plan foresees the installation of a turboto recover the mechanical energy inherent in the pressurized natural gas (currently wasted within a standard lamination process) directly produce electric energyneeds heat to compensate temperature drop of gas, thus heat is needed. Heat will be provided by a gas-fired CHP. The CHP plant will also serve a smalinside the industrial park as well as the firefighter’s station outside of it.The baseline situation identified for the specific GE1 case is referred to a standard lamination process where mechanical energy ifinal end-users is supplied by means of independent gassituation can be detailed by referring to the two main implemented equipmeand CHP):
• without the realization of the expansion turbine, mechanical energy inherent in the pressurized natural is wasted within a standard lamination process; thus, electricity required by the district is generated by the traditional
• without the gas fired CHP plant and the related heating network foreseen for the surrounding Gavette district, heat from the gas expansion process is wasted and heat is supplied by means of independent gas
A simplified layout of the process is reported in the figure below
Genoa demonstrator (GEN1)
Objective of the demonstrator and baseline situation Along with energy saving and efficiency improvement actions, a more widespread use of distributed generation and district heating/cooling is planned by Genoa City administration.
ration is being in fact considered as a key-element for the diversification of the energy supply mix, and one of the promising potentials on which the city administration plans to intervene in order to achieve the intended targets for 2020. A more widespregeneration would allow shifting from the actual widespread use of low efficiency independent heating systems to higher efficiency solutions, thus reducing significantly overall fuel
emissions. Thus, in order to increase energy efficiency within an important area of the city of Genoa, the Val Bisagno area, the development of a local energy system integrating the industrial area is currently being planned. In this specific context, the objective associated to Genoa’s demonstrator “Energy Recovery from the natural gas distribution network” (GE1) is to increase the overall energy efficiency associated to the gas distribution activity. In order to achieve the objective, the installation of an expansion
to a gas fired CHP plant is foreseen. Thus, it will be possible to recover both the mechanical energy from the gas expansion process and heat from co-generation, servicing a small heating network that will supply several buildings inside and outside the idistrict). The industrial area where the demonstrator will be built hosts the natural gas distribution
ssure is reduced from 24 bars of the national tranution. The actual plan foresees the installation of a turbo
to recover the mechanical energy inherent in the pressurized natural gas (currently wasted within a standard lamination process) in order to generate electric energy. The expansion directly produce electric energy. Expansion with mechanical energy recovery is a process that needs heat to compensate temperature drop of gas, thus heat is needed. Heat will be provided by a
fired CHP. The CHP plant will also serve a small heating network, providing heat to buildings inside the industrial park as well as the firefighter’s station outside of it.
identified for the specific GE1 case is referred to a standard lamination process where mechanical energy inherent in the pressurized gas (24 bar) is wasted and heat to the
users is supplied by means of independent gas-fired boilers. situation can be detailed by referring to the two main implemented equipme
ithout the realization of the expansion turbine, mechanical energy inherent in the pressurized natural is wasted within a standard lamination process; thus, electricity required by the district is generated by the traditional mix of Italian el
ithout the gas fired CHP plant and the related heating network foreseen for the surrounding Gavette district, heat from the gas expansion process is wasted and heat is
independent gas-fired boilers.
A simplified layout of the process is reported in the figure below.
9
Along with energy saving and efficiency improvement actions, a more widespread use of distributed generation and district heating/cooling is planned by Genoa City administration.
element for the diversification of the energy supply mix, and one of the promising potentials on which the city administration plans to intervene in order to achieve the intended targets for 2020. A more widespread use of distributed generation would allow shifting from the actual widespread use of low efficiency independent heating systems to higher efficiency solutions, thus reducing significantly overall fuel
crease energy efficiency within an important area of the city of Genoa, the Val Bisagno area, the development of a local energy system
demonstrator “Energy Recovery from the natural gas distribution network” (GE1) is to increase the overall energy efficiency associated to the gas distribution activity. In order to achieve the objective, the installation of an expansion
to a gas fired CHP plant is foreseen. Thus, it will be possible to recover both the generation, servicing a small
heating network that will supply several buildings inside and outside the industrial park (Gavette district). The industrial area where the demonstrator will be built hosts the natural gas distribution
the national transmission network to ution. The actual plan foresees the installation of a turbo-expander able
to recover the mechanical energy inherent in the pressurized natural gas (currently wasted within a . The expansion turbine will
. Expansion with mechanical energy recovery is a process that needs heat to compensate temperature drop of gas, thus heat is needed. Heat will be provided by a
l heating network, providing heat to buildings
identified for the specific GE1 case is referred to a standard lamination is wasted and heat to the
fired boilers. In particular, baseline situation can be detailed by referring to the two main implemented equipments (expansion turbine
ithout the realization of the expansion turbine, mechanical energy inherent in the pressurized natural is wasted within a standard lamination process; thus, electricity
mix of Italian electric grid;
ithout the gas fired CHP plant and the related heating network foreseen for the surrounding Gavette district, heat from the gas expansion process is wasted and heat is

Figure 2: GE1 simplified layout
10

3.1.2 List of specific KPIs Technical KPIs
• Ratio between the gas flow rate through the turbothe lamination valve;
• Yearly amount of net electric energy produced by the turbo• Yearly amount of net electric energy produced by the CHP system• Yearly produced net electric energy• Amount of thermal energy produced by• Amount of thermal energy provid• Ratio between the yearly amount of thermal energy used for gas heating and the yearly
amount of thermal energy produced by• Ratio between the yearly amount of thermal energy used in the district heating network
and the yearly amount of produced thermal energyEnvironmental KPIs
• Variation of emissions for the main considered pollutants connected to the electric energy production compared with the baseline situation (kg/year of saved PMSOx, CO, CO2);
• Variation of emissions for the main considered pollutants connected to the thermal energy production compared with the baseline situation (kg/year or kg/kWTSP, NOx, SOx, CO, CO
• Yearly GHG savings (kg/year of saved CO2eEconomic KPIs
• Yearly savings generated bsituation- €/year;
• Yearly savings arising from the implementation of district heatingto baseline situation- €/year
• Yearly cost of gas burnt in the CHP• Yearly cost of gas burnt in the boilers• Cost of maintenance of the turbo
€/year; • Cost of maintenance of the CHP per each kWh of net produced electric energy• Yearly cost of maintenance of the entire system• The reduction in the bill for
Social KPIs • Number of working
hours/year; • Number of working hours
hours/year; • Number and type of possible complaints (e.g. for noise) by the citizens living in the
neighbourhood.
atio between the gas flow rate through the turbo-expander and the gas flow rate through
electric energy produced by the turbo-expanderearly amount of net electric energy produced by the CHP system-
electric energy- MWhe/year; mount of thermal energy produced by the CHP – MWht/year;
of thermal energy provided by the district heating- MWht/yearatio between the yearly amount of thermal energy used for gas heating and the yearly
amount of thermal energy produced by the CHP; atio between the yearly amount of thermal energy used in the district heating network
and the yearly amount of produced thermal energy;
Variation of emissions for the main considered pollutants connected to the electric energy duction compared with the baseline situation (kg/year of saved PM
Variation of emissions for the main considered pollutants connected to the thermal energy production compared with the baseline situation (kg/year or kg/kW
, CO, CO2); kg/year of saved CO2e and % of reduction).
early savings generated by self-production of electric energy with reference to baseline
ng from the implementation of district heating €/year;
early cost of gas burnt in the CHP- €/year; early cost of gas burnt in the boilers- €/year;
of maintenance of the turbo-expander per each kWh of net produced electric energy
of maintenance of the CHP per each kWh of net produced electric energyearly cost of maintenance of the entire system- €/year;
reduction in the bill for end-users €/kWht.
umber of working hours used for running and maintaining the TE
hours used for running and maintaining the district heating
type of possible complaints (e.g. for noise) by the citizens living in the
11
the gas flow rate through
expander- MWhe/year; MWhe/year;
MWht/year; atio between the yearly amount of thermal energy used for gas heating and the yearly
atio between the yearly amount of thermal energy used in the district heating network
Variation of emissions for the main considered pollutants connected to the electric energy duction compared with the baseline situation (kg/year of saved PM10, PM2.5, TSP, NOx,
Variation of emissions for the main considered pollutants connected to the thermal energy production compared with the baseline situation (kg/year or kg/kWh of saved PM10, PM2.5,
with reference to baseline
network with reference
expander per each kWh of net produced electric energy-
of maintenance of the CHP per each kWh of net produced electric energy- €/kWhe;
used for running and maintaining the TE-CHP system-
r running and maintaining the district heating system-
type of possible complaints (e.g. for noise) by the citizens living in the
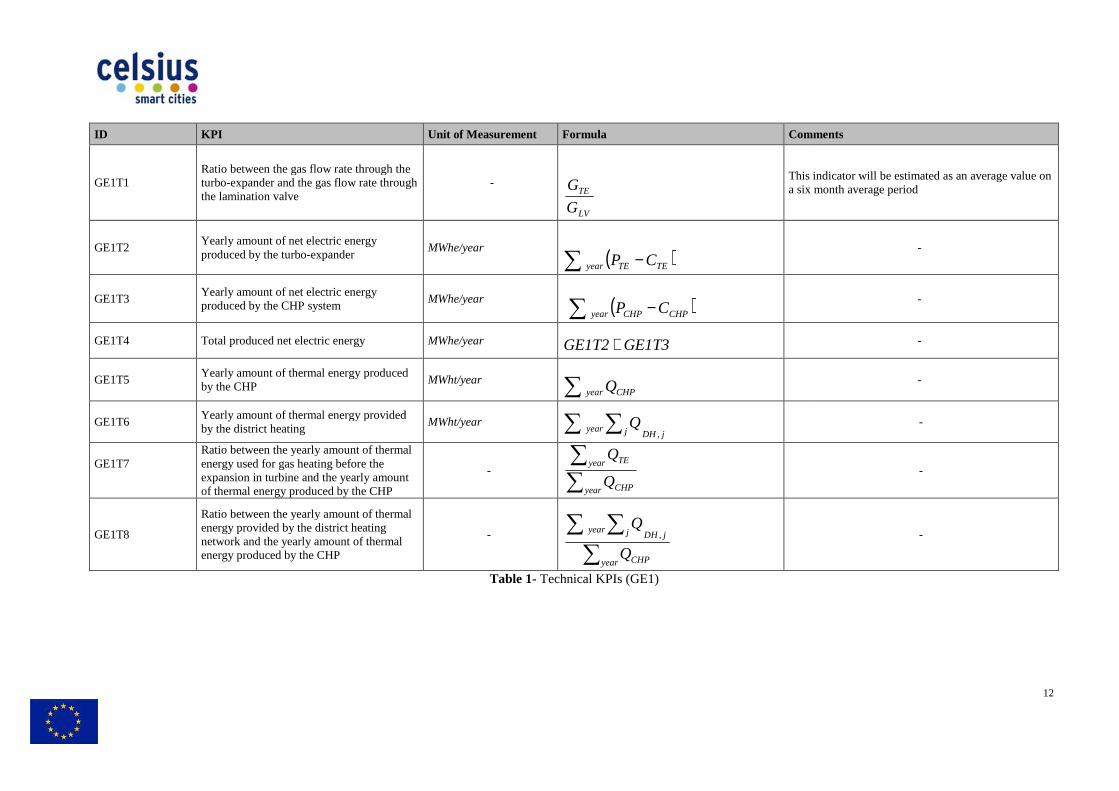
ID KPI
GE1T1 Ratio between the gas flow rate through the turbo-expander and the gas flow rate through the lamination valve
GE1T2 Yearly amount of net electric energy produced by the turbo-expander
GE1T3 Yearly amount of net electric energy produced by the CHP system
GE1T4 Total produced net electric energy
GE1T5 Yearly amount of thermal energy produced by the CHP
GE1T6 Yearly amount of thermal energy provided by the district heating
GE1T7
Ratio between the yearly amount of thermalenergy used for gas heating before the expansion in turbine and the yearly amount of thermal energy produced by the CHP
GE1T8
Ratio between the yearly amount of thermal energy provided by the district heating network and the yearly amount of thermal energy produced by the CHP
Unit of Measurement Formula Comments
atio between the gas flow rate through the expander and the gas flow rate through -
This indicator will be estimated as an average value on a six month average period
MWhe/year
MWhe/year
MWhe/year
mount of thermal energy produced MWht/year
mount of thermal energy provided MWht/year
atio between the yearly amount of thermal
expansion in turbine and the yearly amount -
atio between the yearly amount of thermal
thermal -
Table 1- Technical KPIs (GE1)
LV
TE
G
G
( )∑ − TETEyear CP
( )∑ − CHPCHPyear CP
∑ CHPyearQ
∑ ∑jDHjyear Q
,
∑
∑ ∑
year CHP
jDHjyear
Q
Q,
∑
∑
year CHP
year TE
Q
Q
GE1T3GE1T2+
12
Comments
This indicator will be estimated as an average value on a six month average period
-
-
-
-
-
-
-
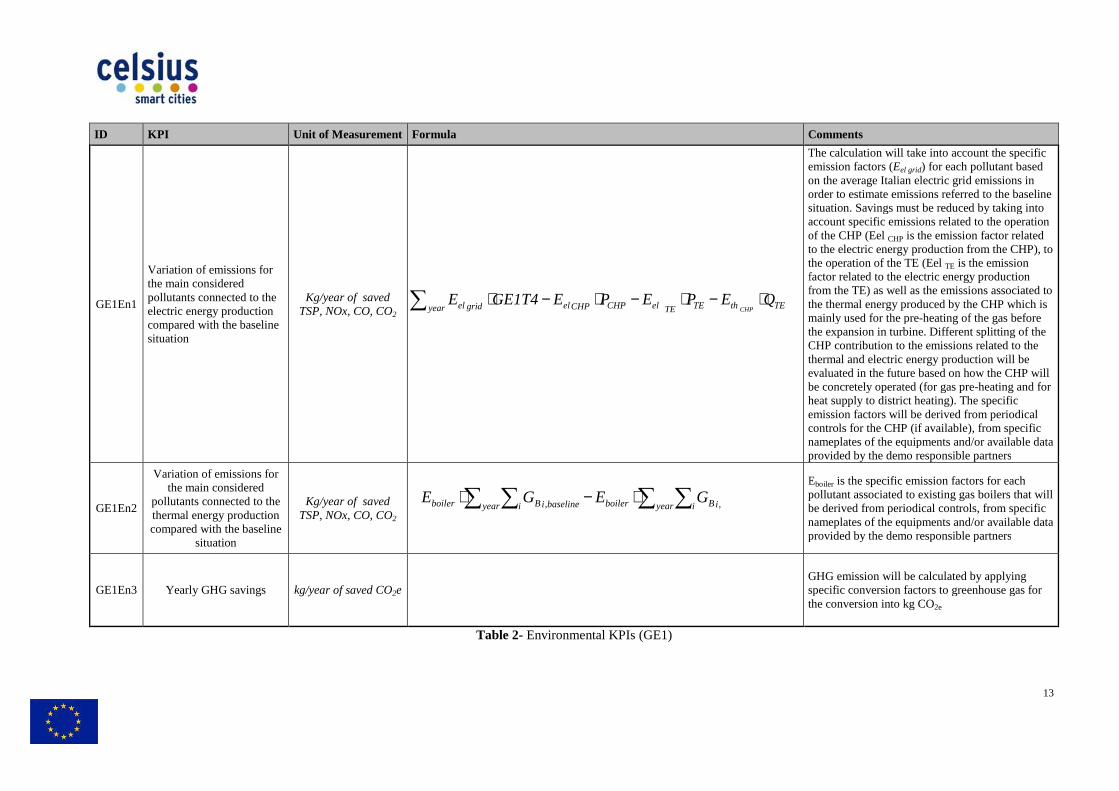
ID KPI Unit of Measurement
GE1En1
Variation of emissions for the main considered pollutants connected to the electric energy production compared with the baseline situation
Kg/year of saved TSP, NOx, CO, CO2
GE1En2
Variation of emissions for the main considered
pollutants connected to the thermal energy production compared with the baseline
situation
Kg/year of saved TSP, NOx, CO, CO2
GE1En3 Yearly GHG savings kg/year of saved CO2e
Formula Comments
The calculation will take into account the specific emission factors (on order to estimate emissions referred to the baseline situation. Savings must be reduced by taking into account specific emissions relatof the CHP to the elethe operation of the TE (Eel factor related to the elefrom the TE) as well as the emissions associated to the thermal energy produced by the CHP which is mainly used for the pretheCHP thermal evaluated in the future based on how the CHP will be concretely operated (for gas preheat emission factors will be derived from periodical controls for the CHP (if available), from specific nameplates of the equipments and/or available data provided by the demo responsible partners
Epollutant associated to be derived from periodical controls, from specific nameplates of the equipments and/or available data provided by the demo responsible partners
GHG emission will be calculated by specific conversion factors to greenhouse gas for the conversion into kg CO
Table 2- Environmental KPIs (GE1)
∑ ∑∑ ∑ ⋅−⋅year i iBboileryear i baselineiBboiler GEGE ,,
∑ ⋅−⋅−⋅−⋅year TEthTETEelCHPCHPelgridel QEPEPEGE1T4E
CHP
13
Comments
The calculation will take into account the specific emission factors (Eel grid) for each pollutant based on the average Italian electric grid emissions in order to estimate emissions referred to the baseline situation. Savings must be reduced by taking into account specific emissions related to the operation of the CHP (Eel CHP is the emission factor related to the electric energy production from the CHP), to the operation of the TE (Eel TE is the emission factor related to the electric energy production from the TE) as well as the emissions associated to the thermal energy produced by the CHP which is mainly used for the pre-heating of the gas before the expansion in turbine. Different splitting of the CHP contribution to the emissions related to the thermal and electric energy production will be evaluated in the future based on how the CHP will be concretely operated (for gas pre-heating and for heat supply to district heating). The specific emission factors will be derived from periodical controls for the CHP (if available), from specific nameplates of the equipments and/or available data provided by the demo responsible partners
Eboiler is the specific emission factors for each pollutant associated to existing gas boilers that will be derived from periodical controls, from specific nameplates of the equipments and/or available data provided by the demo responsible partners
GHG emission will be calculated by applying specific conversion factors to greenhouse gas for the conversion into kg CO2e
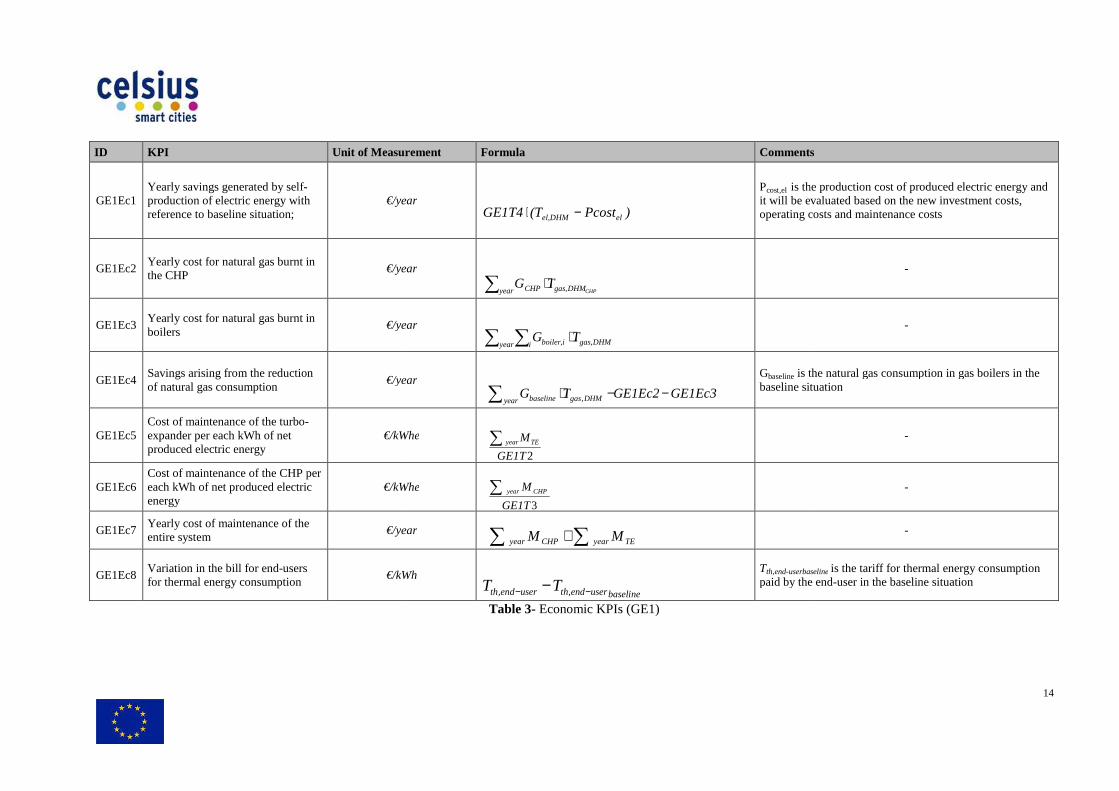
ID KPI Unit of Measurement
GE1Ec1 Yearly savings generated by self-production of electric energy with reference to baseline situation;
€/year
GE1Ec2 Yearly cost for natural gas burnt in the CHP
€/year
GE1Ec3 Yearly cost for natural gas burnt in boilers
€/year
GE1Ec4 Savings arising from the reduction of natural gas consumption
€/year
GE1Ec5 Cost of maintenance of the turbo-expander per each kWh of net produced electric energy
€/kWhe
GE1Ec6 Cost of maintenance of the CHP per each kWh of net produced electric energy
€/kWhe
GE1Ec7 Yearly cost of maintenance of the entire system
€/year
GE1Ec8 Variation in the bill for end-users for thermal energy consumption
€/kWh
Unit of Measurement Formula Comments
€/year
Pcost,el is the productit will be evaluated based on the new investment costs, operating costs and maintenance costs
€/year
€/year
€/year
Gbaseline is the natural gas consumption in gas boilers in the baseline situation
€/kWhe
€/kWhe
€/year
€/kWh
baselineuserendthuserendth TT −− − ,,
Tth,end-userbaseline
paid by the
Table 3- Economic KPIs (GE1)
∑∑ + TEyearCHPyear MM
CHPDHMgasyear CHP TG ,⋅∑
DHMgasyear i iboiler TG ,, ⋅∑ ∑
)Pcost(TGE1T4 elel,DHM −⋅
GE1Ec3GE1Ec2TGyear DHMgasbaseline −−⋅∑ ,
2GE1T
MTEyear∑
3GE1T
M CHPyear∑
14
Comments
is the production cost of produced electric energy and it will be evaluated based on the new investment costs, operating costs and maintenance costs
-
-
is the natural gas consumption in gas boilers in the baseline situation
-
-
-
userbaseline is the tariff for thermal energy consumption paid by the end-user in the baseline situation
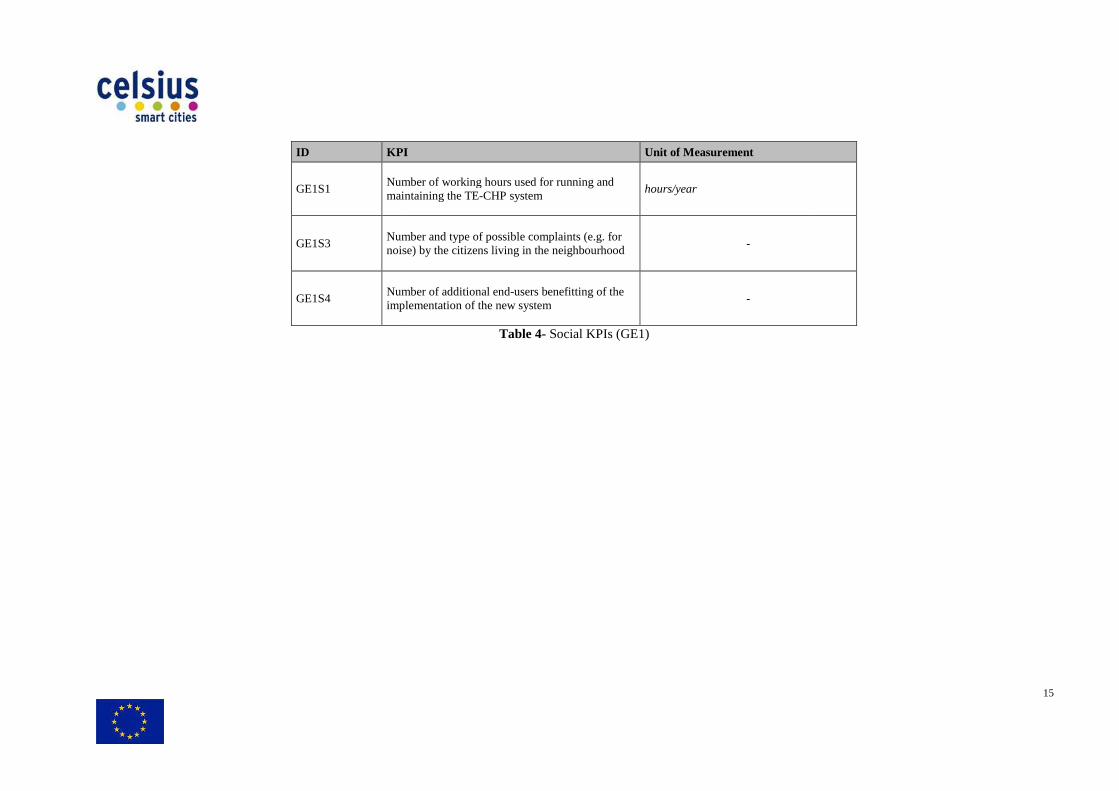
ID KPI
GE1S1 Number of working maintaining the TE
GE1S3 Number and type of possible complaints (e.g. for noise) by the citizens living in the
GE1S4 Number of additional endimplementation of the new system
KPI Unit of Measurement
umber of working hours used for running and maintaining the TE-CHP system
hours/year
umber and type of possible complaints (e.g. for noise) by the citizens living in the neighbourhood
-
umber of additional end-users benefitting of the implementation of the new system
-
Table 4- Social KPIs (GE1)
15
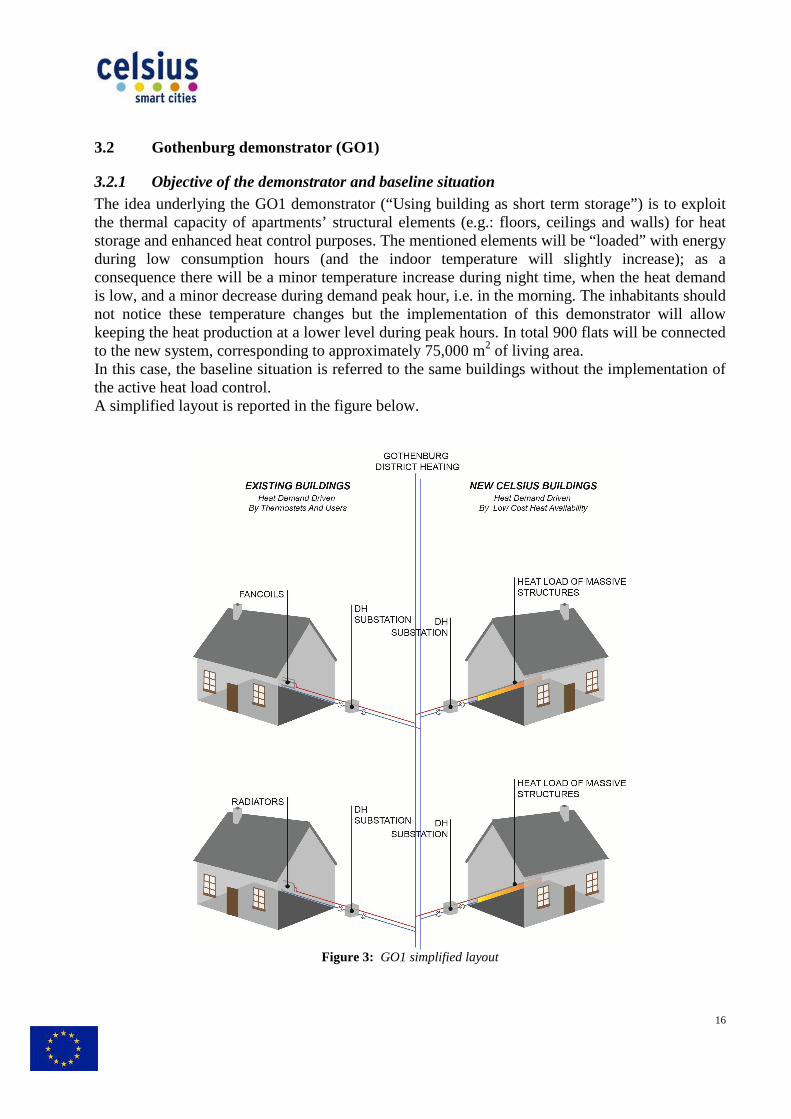
3.2 Gothenburg demonstrator
3.2.1 Objective of the demonstrator and baseline situationThe idea underlying the GO1 dthe thermal capacity of apartments’ structural elements (e.g.: floors, ceilings and walls) for heat storage and enhanced heat control purposes. The mentioned elements will be “loaded” with during low consumption hoursconsequence there will be a minor temperature increase during night time, when the heat demand is low, and a minor decrease during demand peak hour, i.e. in the mnot notice these temperature changes keeping the heat production at a lower level during peak to the new system, correspondingIn this case, the baseline situation is referred to the same buildings without thethe active heat load control. A simplified layout is reported in the figure below
demonstrator (GO1)
Objective of the demonstrator and baseline situation The idea underlying the GO1 demonstrator (“Using building as short term storage”) is to exploit the thermal capacity of apartments’ structural elements (e.g.: floors, ceilings and walls) for heat storage and enhanced heat control purposes. The mentioned elements will be “loaded” with
hours (and the indoor temperature will slightly consequence there will be a minor temperature increase during night time, when the heat demand is low, and a minor decrease during demand peak hour, i.e. in the morning. The inhabitants should not notice these temperature changes but the implementation of this dkeeping the heat production at a lower level during peak hours. In total 900 flats will be connected
rresponding to approximately 75,000 m2 of living area.In this case, the baseline situation is referred to the same buildings without the
A simplified layout is reported in the figure below.
Figure 3: GO1 simplified layout
16
emonstrator (“Using building as short term storage”) is to exploit the thermal capacity of apartments’ structural elements (e.g.: floors, ceilings and walls) for heat storage and enhanced heat control purposes. The mentioned elements will be “loaded” with energy
door temperature will slightly increase); as a consequence there will be a minor temperature increase during night time, when the heat demand
orning. The inhabitants should but the implementation of this demonstrator will allow
. In total 900 flats will be connected of living area.
In this case, the baseline situation is referred to the same buildings without the implementation of

3.2.2 List of specific KPIs Technical KPIs
• Yearly heat demand• Change in yearly heat d• Peak load reduction• Average indoor temperature (seasonal average)• Change of average indoor temperature with reference to baseline situation• Variation of indoor temperature• Change of variation of indoor temperature in comparison with baseline situation• Average outdoor temperature
Concerning economic, social and environmental KPIs, generic KPIs defined in chapter 5 considered sufficient for summarizing GO1 achievements.
emand- kWh/m2; heat demand in comparison with baseline situation
Peak load reduction- kW; Average indoor temperature (seasonal average)- °C; Change of average indoor temperature with reference to baseline situationVariation of indoor temperature- °C ; Change of variation of indoor temperature in comparison with baseline situationAverage outdoor temperature- °C.
Concerning economic, social and environmental KPIs, generic KPIs defined in chapter 5 considered sufficient for summarizing GO1 achievements.
17
emand in comparison with baseline situation- kWh/m2;
Change of average indoor temperature with reference to baseline situation- °C;
Change of variation of indoor temperature in comparison with baseline situation- °C;
Concerning economic, social and environmental KPIs, generic KPIs defined in chapter 5 will be
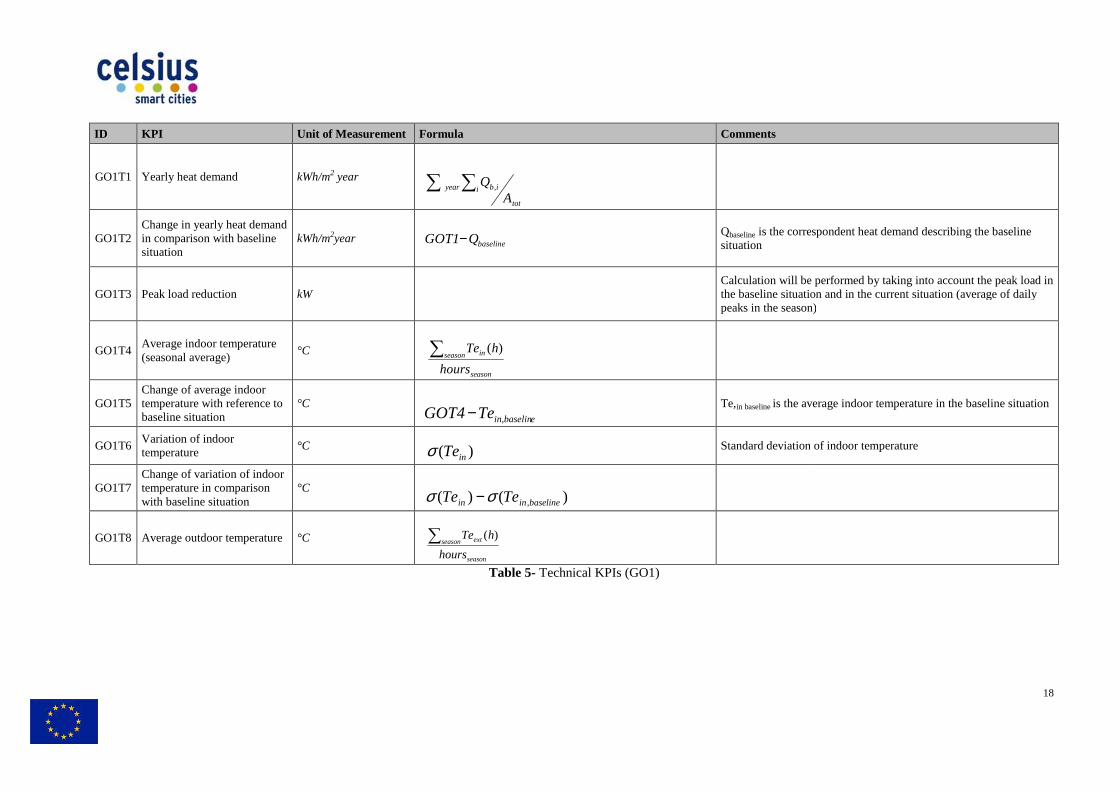
ID KPI Unit of Measurement
GO1T1 Yearly heat demand kWh/m2 year
GO1T2 Change in yearly heat demand in comparison with baseline situation
kWh/m2year
GO1T3 Peak load reduction kW
GO1T4 Average indoor temperature (seasonal average)
°C
GO1T5 Change of average indoor temperature with reference to baseline situation
°C
GO1T6 Variation of indoor temperature
°C
GO1T7 Change of variation of indoor temperature in comparison with baseline situation
°C
GO1T8 Average outdoor temperature °C
Unit of Measurement Formula Comments
Qbaseline is the correspondent heat demand describing the baseline situation
Calculation will be the baseline situation and in the current situation (average of daily peaks in the season)
Te,in baseline is the average indoor temperature in the baseline situation
Standard deviation of indoor temperature
Table 5- Technical KPIs (GO1)
tot
i ibyear
AQ∑ ∑ ,
season
season in
hours
hTe∑ )(
)()( ,baselineinin TeTe σσ −
)( inTeσ
season
season ext
hours
hTe∑ )(
baselineQGOT1−
ein,baselinTeGOT4−
18
is the correspondent heat demand describing the baseline
Calculation will be performed by taking into account the peak load in the baseline situation and in the current situation (average of daily peaks in the season)
is the average indoor temperature in the baseline situation
Standard deviation of indoor temperature
3.3 Gothenburg demonstrator
3.3.1 Objective of the demonstrator and baseline situationThe overall objective of thisdishwashers, washing machines and dryers) using lowreplacing conventional machines typically using highmoving parts and for heating purposes.The machines are connected towater supply and their installation is planned in laundry rooms of residential multibuildings as well as in other typology of buildings (i.e., The machines have been developed by ASKO CLINDA and were recently introduced on the market. Preliminary tests have been performed on the new machines (washing machines and dryers) in order to evaluate the performance from the energetic point of view, showing a high rate of replacement of electric energyenergy has been replaced by district heating hot water). Nevertheless, a higher number of machines, differentiated on the basis of different type of buildings and of installed white goods is necessary to assesfrom the energetic, environmental, economiAs baseline situation, the same type of laundry rooms with standard only electric energy (also for heating purposes) will be taken into account in order to evaluate the efficiency of the new machines inA simplified layout of this demonstrator is reported in the figure below.
demonstrator (GO2)
Objective of the demonstrator and baseline situation this demonstrator is to install 300 innovative white goods (i.e.
machines and dryers) using low-grade energy (district heating hot waterreplacing conventional machines typically using high-grade electric energymoving parts and for heating purposes.
to district heating supply, independently fromwater supply and their installation is planned in laundry rooms of residential multi
dings as well as in other typology of buildings (i.e., sport facilities). The machines have been developed by ASKO CLINDA and were recently introduced on the market. Preliminary tests have been performed on the new machines (washing machines and
n order to evaluate the performance from the energetic point of view, showing a high rate lectric energy compared with conventional machines (about 75% of electric
energy has been replaced by district heating hot water). Nevertheless, a long term monitoring onumber of machines, differentiated on the basis of different type of buildings and of
installed white goods is necessary to assess results on performances of the applied technology from the energetic, environmental, economic and social point of view. As baseline situation, the same type of laundry rooms with standard and
(also for heating purposes) will be taken into account in order to evaluate the efficiency of the new machines in comparison with conventional systems. A simplified layout of this demonstrator is reported in the figure below.
19
demonstrator is to install 300 innovative white goods (i.e. district heating hot water),
rgy both for running the
from heat and domestic hot water supply and their installation is planned in laundry rooms of residential multi-family
The machines have been developed by ASKO CLINDA and were recently introduced on the market. Preliminary tests have been performed on the new machines (washing machines and
n order to evaluate the performance from the energetic point of view, showing a high rate with conventional machines (about 75% of electric
long term monitoring of a number of machines, differentiated on the basis of different type of buildings and of
results on performances of the applied technology
and new white goods using (also for heating purposes) will be taken into account in order to evaluate the

Figure 4: GO2 simplified layout
20
3.3.2 List of specific KPIs Technical KPIs
• Yearly heat demand per laundry room• Yearly electric energy• Percentage of substituted• Heat demand per washing cycle• Electric energy savings per washing cycle
Environmental KPIs • Yearly pollutant emissions and GHG savings due to the reduction of electric energy
consumption in comparison with the baseline si• Pollutant emissions and GHG savings per wash due to the reduction of electric energy
consumption in comparison with the baseline situationEconomic KPIs
• Economic savings per washing cycle• Economic savings per year• Payback of the extra investment
Social KPIs • Time savings per wash• Number of residents/users benefitting of the new investment
emand per laundry room- kWht/year laundry roomelectric energy savings per laundry room- kWhe/year laundry room
substituted electric energy with reference to the baseline situationemand per washing cycle- kWht/washing cycle;
savings per washing cycle- kWhe/washing cycle
Yearly pollutant emissions and GHG savings due to the reduction of electric energy consumption in comparison with the baseline situation- kg/year;Pollutant emissions and GHG savings per wash due to the reduction of electric energy consumption in comparison with the baseline situation- kg/wash
Economic savings per washing cycle- €/washing cycle; Economic savings per year- €/year; Payback of the extra investment- years.
Time savings per wash- minutes; Number of residents/users benefitting of the new investment.
21
kWht/year laundry room; laundry room; baseline situation- %;
kWhe/washing cycle.
Yearly pollutant emissions and GHG savings due to the reduction of electric energy ;
Pollutant emissions and GHG savings per wash due to the reduction of electric energy kg/wash.

ID KPI Unit of Measurement
GO2T1 Yearly heat demand per laundry room kWht/year room
GO2T2 Yearly electric energy savings per laundry room
kWhe/year room
GO2T3 Percentage of substituted electric energy with reference to baseline situation
%
GO2T4 Heat demand per washing cycle kWht/wash
GO2T5 Electric energy savings per washing cycle kWhe/wash
Unit of Measurement Formula Comments
laundry
laundry
Average values of machines will be consideredCwg,i-baseline is the electric energy consumption of the traditional machine in similar laundry rooms (baseline situation).
kWht/wash
Each typology of white good will be considered (washing machines, dryers, dish washers).Ni is the number of yearly washing cycles per typology of white good and per laundry room
kWhe/wash
Each typology of white good will be considered (washing machines, dryers, dish washers)
Table 6- Technical KPIs (GO2)
∑ ∑i iwgyear Q ,
baselineiwg
iwgbaselineiwg
C
CC
−
− −
,
,,
∑ ∑∑ ∑ −−i baselineiwgyeari iwgyear CC ,,
∑ ∑year i iN
GO2T1
∑ ∑year i iN
TGO 22
22
-
-
values of electric consumption for the different machines will be considered.
is the electric energy consumption of the traditional machine in similar laundry rooms (baseline situation).
Each typology of white good will be considered (washing achines, dryers, dish washers).
number of yearly washing cycles per typology of white good and per laundry room.
Each typology of white good will be considered (washing machines, dryers, dish washers).

ID KPI Unit of Measurement
GO2En1
Yearly pollutant emissions and GHG savings due to the reduction of electric energy consumption in comparison with the baseline situation
kg/year of saved COlaundry room
GO2En2
Pollutant emissions and GHG savings per wash due to the reduction of electric energy consumption in comparison with the baseline situation
kg of saved CO
ID KPI Unit of Measurement
GO2Ec1 Economic savings per washing cycle €/wash
GO2Ec2 Economic savings per year €/year
GO2Ec3 Payback of the extra investment Years
Unit of Measurement Formula Comments
kg/year of saved CO2e laundry room
Emissions account the savings deriving fromelectric energyThe calculation will take into account the specific emission factors (Eaverage electricity grid in emission factor for each pollutant (Eto the district heating mix electric energybe calculated by applying specific conversion factors to greenhouse gas emission for their conversion into kg CO2e
kg of saved CO2e/wash
Table 7- Environmental KPIs (GO2)
Unit of Measurement Formula Comments
userendthuserendel TTGOTTGO −− ⋅−⋅ ,, 4252
userendthiwgyearuserendeliwgyear TQTQ −− ⋅−⋅ ∑∑ ,,,,
- Based on investment costs for the extra investment, operating costs and estimated
Table 8- Economic KPIs (GO2)
GO2T1EGO2T2E DHmixel grid⋅−⋅
GO2T1EGO2T5E DHmixel grid⋅−⋅
23
Comments
Emissions savings will be calculated by taking into account the savings deriving from the substitution of electric energy with low temperature district heating. The calculation will take into account the specific emission factors (Eel grid) for each pollutant based on average electricity grid in Sweden as well as the emission factor for each pollutant (EDHmix) associated
the district heating mix replacing the use of electric energy in the machines. GHG emission will be calculated by applying specific conversion factors to greenhouse gas emission for their conversion into kg CO2e
of
Comments
-
-
Based on investment costs for the extra investment, operating costs and estimated economic savings
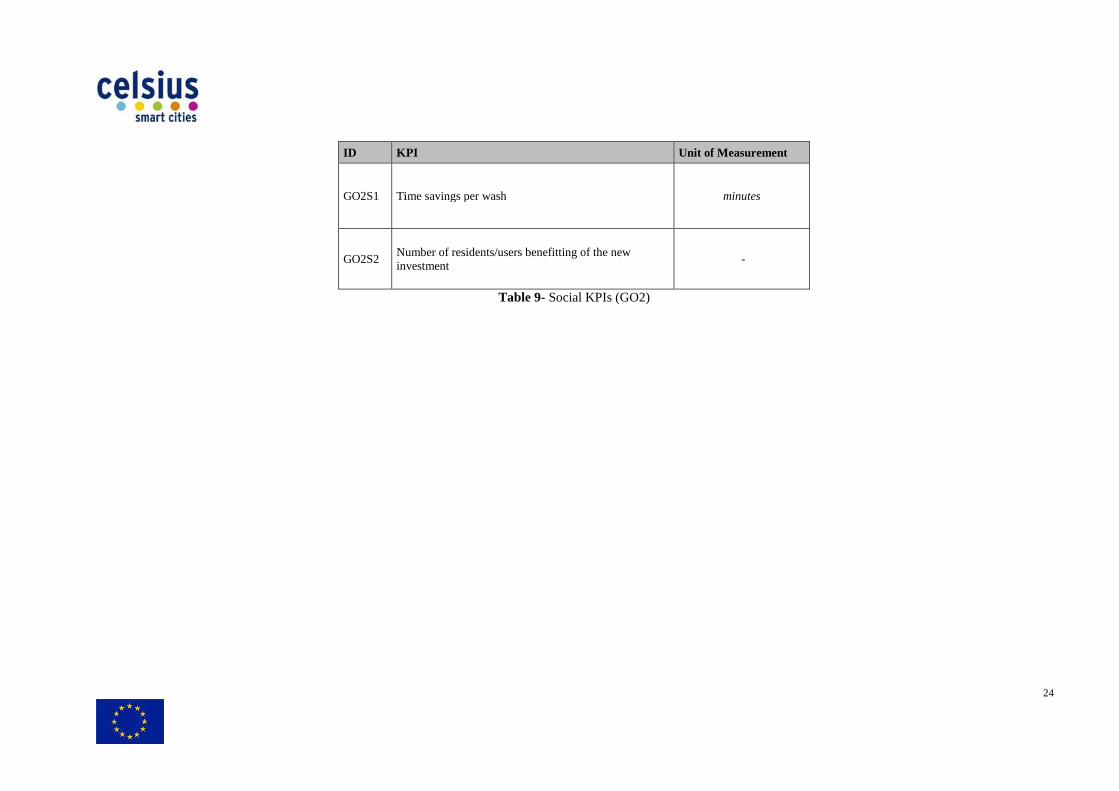
ID KPI
GO2S1 Time savings per wash
GO2S2 Number of residents/users benefitting of the new investment
KPI Unit of Measurement
Time savings per wash minutes
Number of residents/users benefitting of the new investment
-
Table 9- Social KPIs (GO2)
24

3.4 Gothenburg demonstrator
3.4.1 Objective of the demonstrator and baseline situationTraditionally, when a ship is at quay, electrical generators and heating equipments are needed to be run, usually consuming bunker oil.ships at quay to the electrical grid while heating equipments on board, i.e. oil fired boilers, still need to be used. The objective of the to the district heating in order to reduce the consumption of bunker oils, bydecreasing the emissions level and contributing to the improvement of air quality in the city.In this demonstrator, one ship will be connected to the district heat
• The adaptation of ship • The installation and connection of a f
heating hot water. As baseline situation, the same shiwill be considered in order to evaluate the impact of the demonstrator in comparison with the conventional situation. A simplified layout of this demonstrator is reported in the figure
Gothenburg demonstrator (GO3)
Objective of the demonstrator and baseline situation Traditionally, when a ship is at quay, electrical generators and heating equipments are needed to be run, usually consuming bunker oil. In Gothenburg there are already possibilities to connect ships at quay to the electrical grid while heating equipments on board, i.e. oil fired boilers, still
The objective of the GO3 demonstrator is to connect ships at quayto the district heating in order to reduce the consumption of bunker oils, bydecreasing the emissions level and contributing to the improvement of air quality in the city.
demonstrator, one ship will be connected to the district heating network through: to receive district heating (connections, heat exchangers etc.)
The installation and connection of a flexible connection at quay, for the supply of district
As baseline situation, the same ship, using standard oil fired boilers for heating purposes at quay, will be considered in order to evaluate the impact of the demonstrator in comparison with the
A simplified layout of this demonstrator is reported in the figure below.
25
Traditionally, when a ship is at quay, electrical generators and heating equipments are needed to In Gothenburg there are already possibilities to connect
ships at quay to the electrical grid while heating equipments on board, i.e. oil fired boilers, still demonstrator is to connect ships at quay in Gothenburg
to the district heating in order to reduce the consumption of bunker oils, by consequently decreasing the emissions level and contributing to the improvement of air quality in the city.
ing network through: to receive district heating (connections, heat exchangers etc.);
at quay, for the supply of district
p, using standard oil fired boilers for heating purposes at quay, will be considered in order to evaluate the impact of the demonstrator in comparison with the

Figure 5: GO3 simplified layout
26
3.4.2 List of specific KPIs Technical KPIs
• Yearly thermal energy• Change in yearly use of oil at quay in comparison with the baseline situation
Environmental KPIs • Savings of PM10, PM2.5, TSP, NOx, SOx, CO, CO
emission- kg/year; • GHG savings connected to the reduction of oil use with reference to
situation (kg/year of saved COemissions).
Economic KPIs • Economic savings per year due to reduction of oil consumption• Payback of the extra investment
Social KPIs • Reduction of complaints for noise with reference to baseline situation• The number of working
hours/year.
thermal energy delivered to ship in harbour- MWht/year;use of oil at quay in comparison with the baseline situation
PM10, PM2.5, TSP, NOx, SOx, CO, CO2 with reference to the baseline
GHG savings connected to the reduction of oil use with reference tokg/year of saved CO2e and ratio between the reduction and the baseline
Economic savings per year due to reduction of oil consumption-Payback of the extra investment- years.
of complaints for noise with reference to baseline situationThe number of working hours used for running and maintaining the system
27
; use of oil at quay in comparison with the baseline situation- lt/year.
with reference to the baseline
GHG savings connected to the reduction of oil use with reference to the baseline and ratio between the reduction and the baseline
- €/year;
of complaints for noise with reference to baseline situation; used for running and maintaining the system-

ID KPI Unit of Measurement
GO3T1 Yearly thermal energy delivered to ship in harbour
MWht/year
GO3T2 Change in yearly use of oil at quay in comparison with the baseline situation
lt/year
ID KPI Unit of Measurement
GO3Ec1 Economic savings per year due to reduction of oil consumption
€/year
GO3Ec2 Payback of the extra investment years
ID KPI Unit of Measurement
GO3En1 kg/year of saved PM10, PM2.5, TSP, NOx, SOx, CO, CO2 with reference to the baseline situation
kg/year
GO3En2
GHG savings connected to the reduction of oil use with reference to the baseline situation (kg/year of saved CO2e and ratio between the reduction and the baseline emissions)
kg/year
Unit of Measurement Formula Comments
MWht/year
-
lt/year
Voil baseline
baseline situation
Table 10- Technical KPIs (GO3)
Unit of Measurement Formula
€/year
( ) userendthoiloilbaselineoilyear TTGOTVV −⋅−⋅−∑ ,, 13
years
Table 11- Economic KPIs (GO3)
Unit of Measurement Formula
kg/year
kg/year -
Table 12- Environmental KPIs (GO3)
∑ shyearQ
( )∑
∑ −
year baselineoil
oilbaselineoilyear
V
VV
,
,
( ) DHmixboileroiloilbaselineoilyear ETGOEVV ⋅−⋅− −∑ 13,
28
Comments
oil baseline is the oil consumption in boilers in the baseline situation
Comments
user Calculation will be performed based on investment costs for the extra investment, operating costs, maintenance costs and estimated economic savings
Comments Eoil-boiler is the emission factor for each pollutant associated to the consumption of bunker oil in the boilers. EDHmix is the estimated emission factor for each pollutant associated to the district heating mix replacing the use of bunker oil in boilers.
GHG emission will be calculated by applying specific conversion factors in order to convert greenhouse gas emissions into kg of CO2 equivalent
DHmix
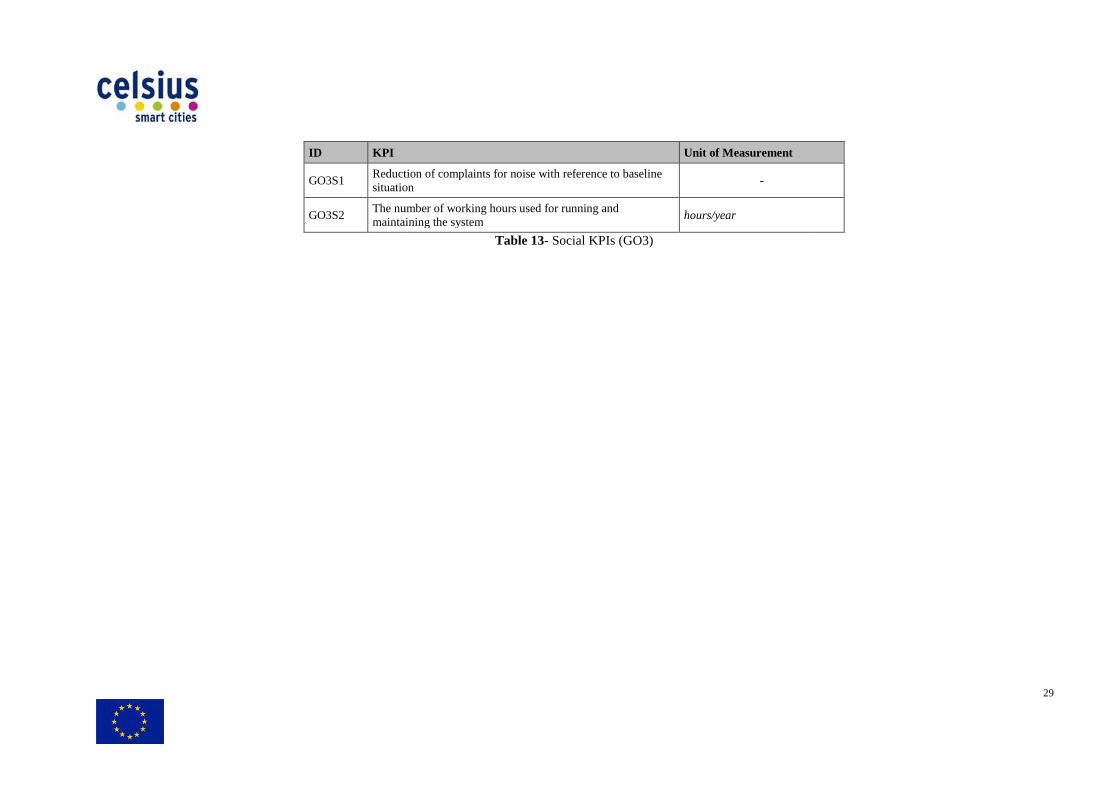
ID KPI
GO3S1 Reduction of complaints for noise with reference to baseline situation
GO3S2 The number of working maintaining the system
Unit of Measurement
Reduction of complaints for noise with reference to baseline situation
-
The number of working hours used for running and maintaining the system
hours/year
Table 13- Social KPIs (GO3)
29

3.5 Cologne demonstrator
3.5.1 Objective of the demonstrator and baseline situationThe main objective of this demonstrator is to overcome technical and economic barriers to recover heat from sewage network and use it local school buildings. The demonstrator different spots of the city, with different conditions of the supply side on one hand end-users (school buildings) on the other handIn particular:
• Nippes: three different schools are located close to a pumping station of the sewage network. Part of the sewage at the station will be byexchanger. From there, heat will be transferred to a heat pump syste160 kW each) situated in the central boiler room in the Edithsupply to the three schools. Three new gas fired condensing boilers will bload;
• Mülheim: the Hölderlin Gymnasium is located closeThe shape of the sewage pipe differs to the one in Porz/ Wahn. The heat exchanger will be installed on the bottom of the pipe and tthe cellar of the Hölderlin Gymnasi
• Porz/ Wahn: 2 schools are located close to each other, beside a main pipe of the sewage network. The heat exchanger will be installed on the bottom of the pipe. The water heated through this heat exchaOtto-Lilienthal Realschule. The heat pump will supply base load heating and a condensing gas boiler will be used for peak load.
The baseline situation that will be taken into account condensing boilers as the sole equipment for supplying heat to thelayout of the demonstrator is reported in the figure below.
Cologne demonstrator (CO1)
Objective of the demonstrator and baseline situation demonstrator is to overcome technical and economic barriers to recover
heat from sewage network and use it in decentralized local heating network by The demonstrator foresees the application of this technology in three
different spots of the city, with different conditions of the supply side on one hand users (school buildings) on the other hand.
: three different schools are located close to a pumping station of the sewage network. Part of the sewage at the station will be by-passed, and then fed to a heat exchanger. From there, heat will be transferred to a heat pump syste160 kW each) situated in the central boiler room in the Edith-Realschule for the base load supply to the three schools. Three new gas fired condensing boilers will b
: the Hölderlin Gymnasium is located close to a main pipe of the sewage network. he shape of the sewage pipe differs to the one in Porz/ Wahn. The heat exchanger will be
lled on the bottom of the pipe and the heat pump will be placed in the heating room in the cellar of the Hölderlin Gymnasium. The peak demand will be supplied by a gas boiler.
: 2 schools are located close to each other, beside a main pipe of the sewage network. The heat exchanger will be installed on the bottom of the pipe. The water heated through this heat exchanger will flow to the heat pump in the central boiler room in the
Lilienthal Realschule. The heat pump will supply base load heating and a condensing iler will be used for peak load.
that will be taken into account is referred to the utilization of gas fired as the sole equipment for supplying heat to the same schools.
is reported in the figure below.
30
demonstrator is to overcome technical and economic barriers to recover in decentralized local heating network by supplying heat to
the application of this technology in three different spots of the city, with different conditions of the supply side on one hand and similar
: three different schools are located close to a pumping station of the sewage passed, and then fed to a heat
exchanger. From there, heat will be transferred to a heat pump systems (3 heat pumps of Realschule for the base load
supply to the three schools. Three new gas fired condensing boilers will be used for peak
in pipe of the sewage network. he shape of the sewage pipe differs to the one in Porz/ Wahn. The heat exchanger will be
he heat pump will be placed in the heating room in um. The peak demand will be supplied by a gas boiler.
: 2 schools are located close to each other, beside a main pipe of the sewage network. The heat exchanger will be installed on the bottom of the pipe. The water heated
nger will flow to the heat pump in the central boiler room in the Lilienthal Realschule. The heat pump will supply base load heating and a condensing
referred to the utilization of gas fired same schools. A simplified
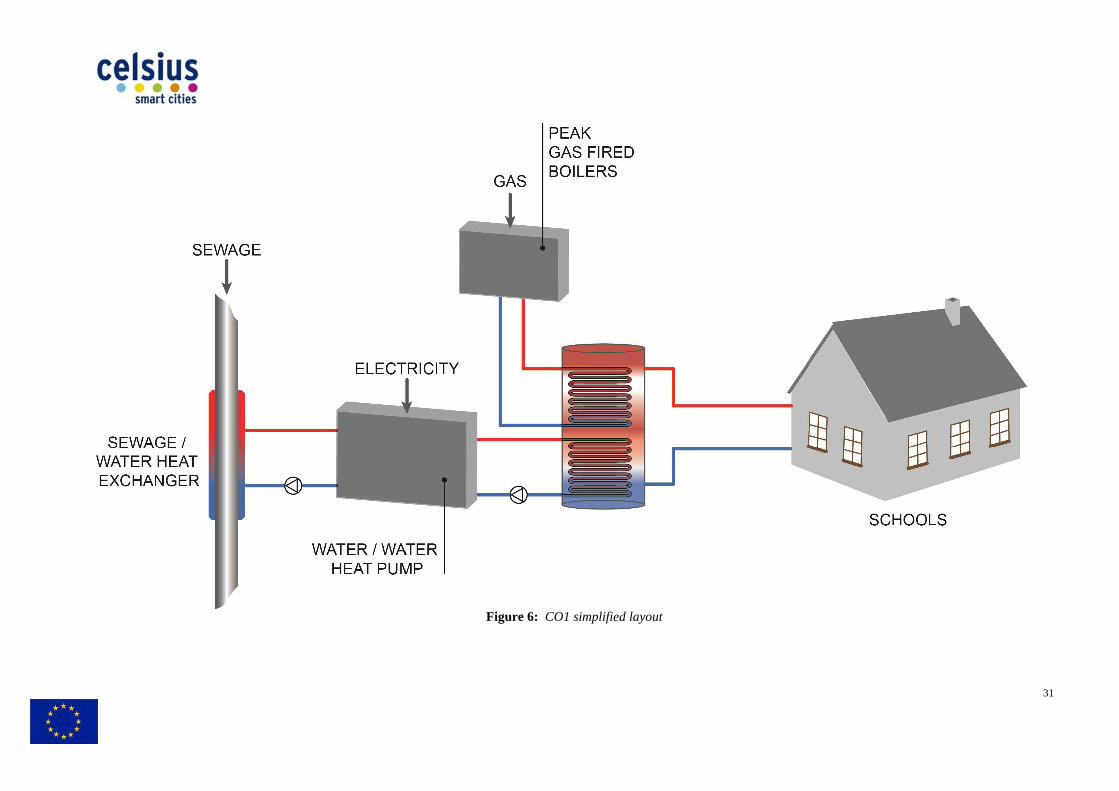
Figure 6: CO1 simplified layout
31

3.5.2 List of specific KPIs Technical KPIs
• Energy efficiency at each spotand primary energy consumption;
• Seasonal COP for each heat pump system• Variation of primary energy in comparison with the baseline situation at each spot• Energy efficiency variation in comparison with the baseline situation at each spot
Environmental KPIs • Variation of pollutant emissions with reference to baseline situation at each spot
(kg/year of saved PM• Yearly GHG savings
CO2e and % of variationEconomic KPIs
• Yearly operational cost per kWh of thermal energy suppliedcompared with operational costs per kWh of the baseline technology
• Yearly fixed costs (depreciationeach spot compared with fixed costs per kWh of the baseline technology
• Yearly total costs per kWh costs per kWh of the baseline technology
• Total cost (operating costs and yearly depreciation rates) per saved ton of COspot- €/ton CO2e.
Social KPIs • Number of working • Number and type of possible complaints (e.g. smells during maintenance or in case of
system failure) by students, employees and citizens living in the neighbourhood at each spot;
• Internal floor area served by the new system at each spot• Number of end-users benefitting of the new system at each spot
Energy efficiency at each spot, defined as the ratio between heat produced at each spot and primary energy consumption;
easonal COP for each heat pump system; primary energy in comparison with the baseline situation at each spot
Energy efficiency variation in comparison with the baseline situation at each spot
Variation of pollutant emissions with reference to baseline situation at each spotof saved PM10, PM2.5, TSP, NOx, SOx, CO, CO2);
Yearly GHG savings at each spot with reference to baseline situationand % of variation.
onal cost per kWh of thermal energy suppliedcompared with operational costs per kWh of the baseline technologyYearly fixed costs (depreciation + overheads) per kWh of thermal energy suppliedeach spot compared with fixed costs per kWh of the baseline technologyYearly total costs per kWh of thermal energy supplied at each spotcosts per kWh of the baseline technology Total cost (operating costs and yearly depreciation rates) per saved ton of CO
working hours used for running and maintaining the system at each spotumber and type of possible complaints (e.g. smells during maintenance or in case of
system failure) by students, employees and citizens living in the neighbourhood at each
rnal floor area served by the new system at each spot- m2; users benefitting of the new system at each spot
32
, defined as the ratio between heat produced at each spot
primary energy in comparison with the baseline situation at each spot; Energy efficiency variation in comparison with the baseline situation at each spot.
Variation of pollutant emissions with reference to baseline situation at each spot
with reference to baseline situation- kg/year of saved
onal cost per kWh of thermal energy supplied at each spot-€/kWh compared with operational costs per kWh of the baseline technology
of thermal energy supplied at each spot compared with fixed costs per kWh of the baseline technology;
of thermal energy supplied at each spot compared with total
Total cost (operating costs and yearly depreciation rates) per saved ton of CO2e at each
used for running and maintaining the system at each spot; umber and type of possible complaints (e.g. smells during maintenance or in case of
system failure) by students, employees and citizens living in the neighbourhood at each
users benefitting of the new system at each spot.
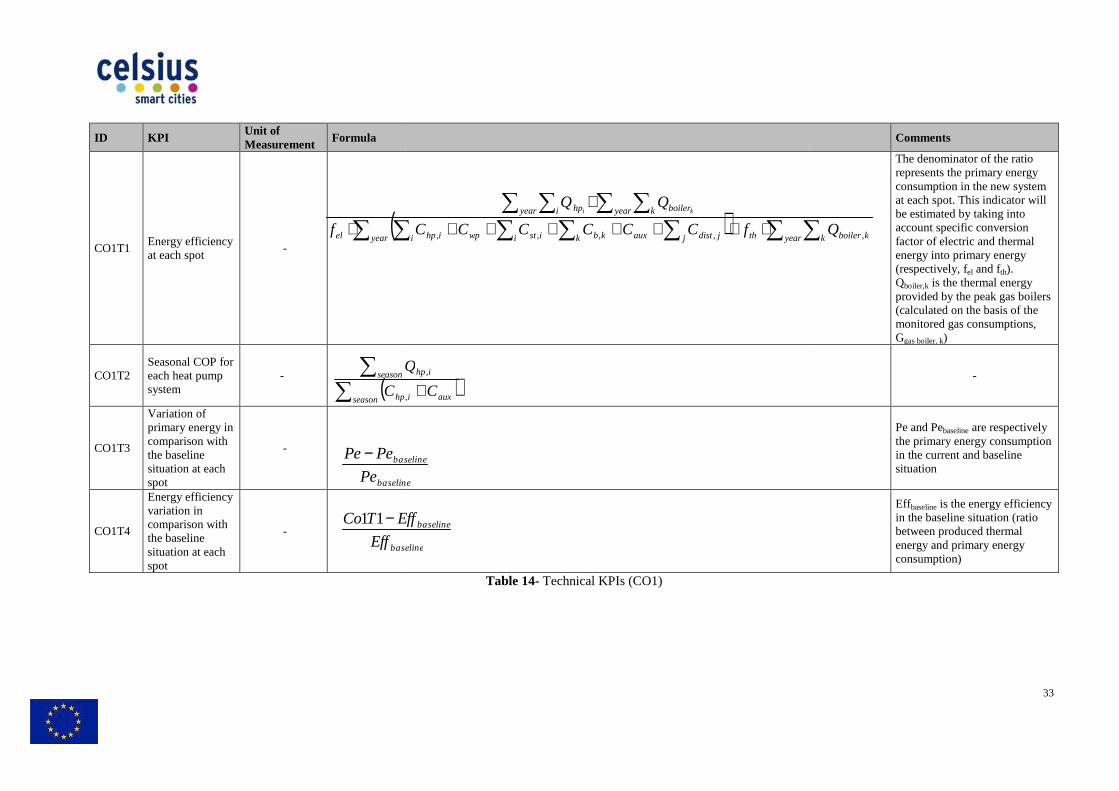
ID KPI Unit of Measurement Formula
CO1T1 Energy efficiency at each spot
-
CO1T2 Seasonal COP for each heat pump system
-
CO1T3
Variation of primary energy in comparison with the baseline situation at each spot
-
CO1T4
Energy efficiency variation in comparison with the baseline situation at each spot
-
(∑
∑
season hp
season
C
Q
baselineEff
EffTCo −11
baseline
baseline
Pe
PePe−
(∑ ∑⋅yearelf
Table 14- Technical KPIs (CO1)
)+ auxi
ihp
C
Q
,
,
baseline
baselineEff
baseline
baseline
) ∑ ∑∑ ∑ ∑ ∑
∑ ∑ ∑ ∑⋅++++++
+
yearthi i k j jdistauxkbistwpihp
year i year k boilerhp
fCCCCCC
QQki
,,,,
33
Comments
The denominator of the ratio represents the primary energy consumption in the new system at each spot. This indicator will be estimated by taking into account specific conversion factor of electric and thermal energy into primary energy (respectively, fel and fth). Qboiler,k is the thermal energy provided by the peak gas boilers (calculated on the basis of the monitored gas consumptions, Ggas boiler, k)
-
Pe and Pebaseline are respectively the primary energy consumption in the current and baseline situation
Effbaseline is the energy efficiency in the baseline situation (ratio between produced thermal energy and primary energy consumption)
∑k kboilerQ ,
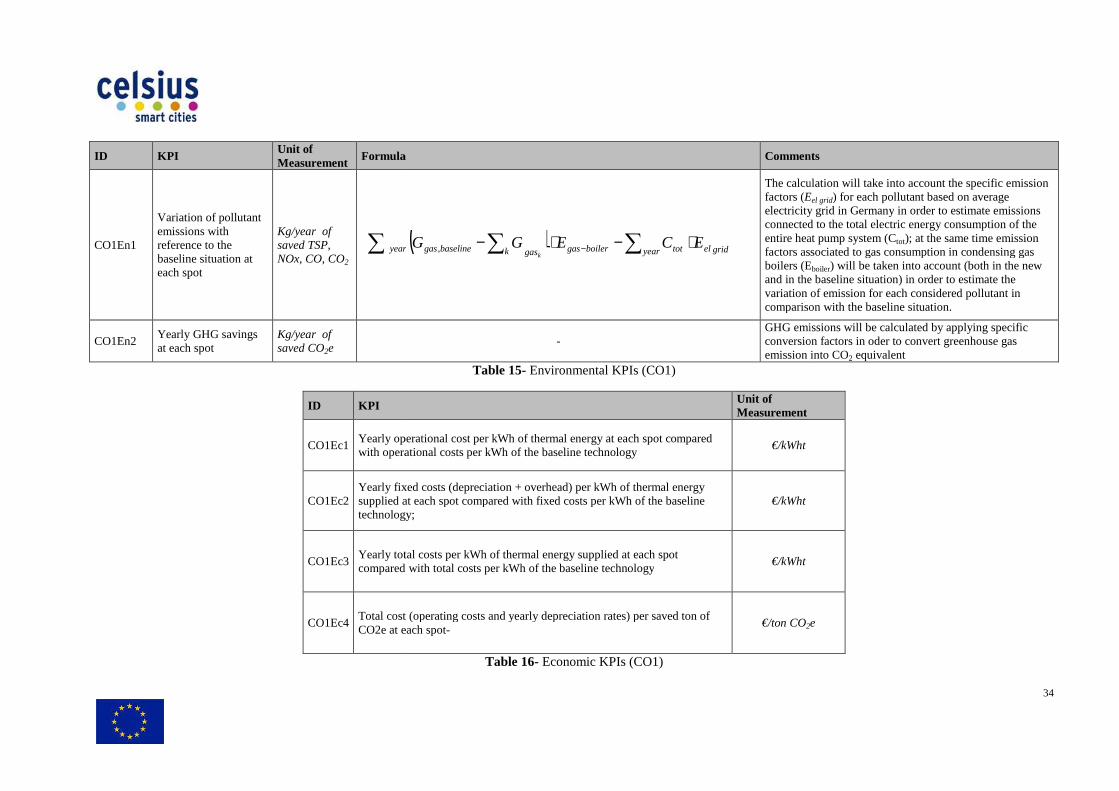
ID KPI Unit of Measurement Formula
CO1En1
Variation of pollutant emissions with reference to the baseline situation at each spot
Kg/year of saved TSP, NOx, CO, CO2
CO1En2 Yearly GHG savings at each spot
Kg/year of saved CO2e
ID KPI
CO1Ec1 Yearly operational cost per kWh of with operational costs per kWh of the baseline technology
CO1Ec2 Yearly fixed costs (depresupplied at each spot compared with fixed costs per kWh of the baseline technology;
CO1Ec3 Yearly total costs per kWh of thermal energy supplied at each spotcompared with total costs per kWh of the baseline technology
CO1Ec4 Total cost (operating costs and yearly depreciation rates) per saved ton of CO2e at each spot
∑ year
Formula Comments
The calculation will take into account the specific emission factors (Eelectricity grid in Germanyconnected to the total electric energy consumption of the entire heat pumpfactors associated to gas consumption in condensing gas boilers (Eand in the baseline situation) in order to estimate the variation of emission for each considered pollutant in comparison with the baseline situation
- GHG emissionconversion factors in oder to convert greenhouse gas emission into CO
Table 15- Environmental KPIs (CO1)
Unit of Measurement
Yearly operational cost per kWh of thermal energy at each spot compared with operational costs per kWh of the baseline technology
€/kWht
Yearly fixed costs (depreciation + overhead) per kWh of thermal energy at each spot compared with fixed costs per kWh of the baseline
technology; €/kWht
Yearly total costs per kWh of thermal energy supplied at each spot compared with total costs per kWh of the baseline technology
€/kWht
Total cost (operating costs and yearly depreciation rates) per saved ton of CO2e at each spot-
€/ton CO2
Table 16- Economic KPIs (CO1)
( ) ∑∑ ⋅−⋅− − year grideltotboilergasgaskbaselinegasyear ECEGGk
,
34
Comments
The calculation will take into account the specific emission Eel grid) for each pollutant based on average
electricity grid in Germany in order to estimate emissions connected to the total electric energy consumption of the
heat pump system (Ctot); at the same time emission factors associated to gas consumption in condensing gas boilers (Eboiler) will be taken into account (both in the new and in the baseline situation) in order to estimate the variation of emission for each considered pollutant in comparison with the baseline situation.
GHG emissions will be calculated by applying specific conversion factors in oder to convert greenhouse gas emission into CO2 equivalent
e
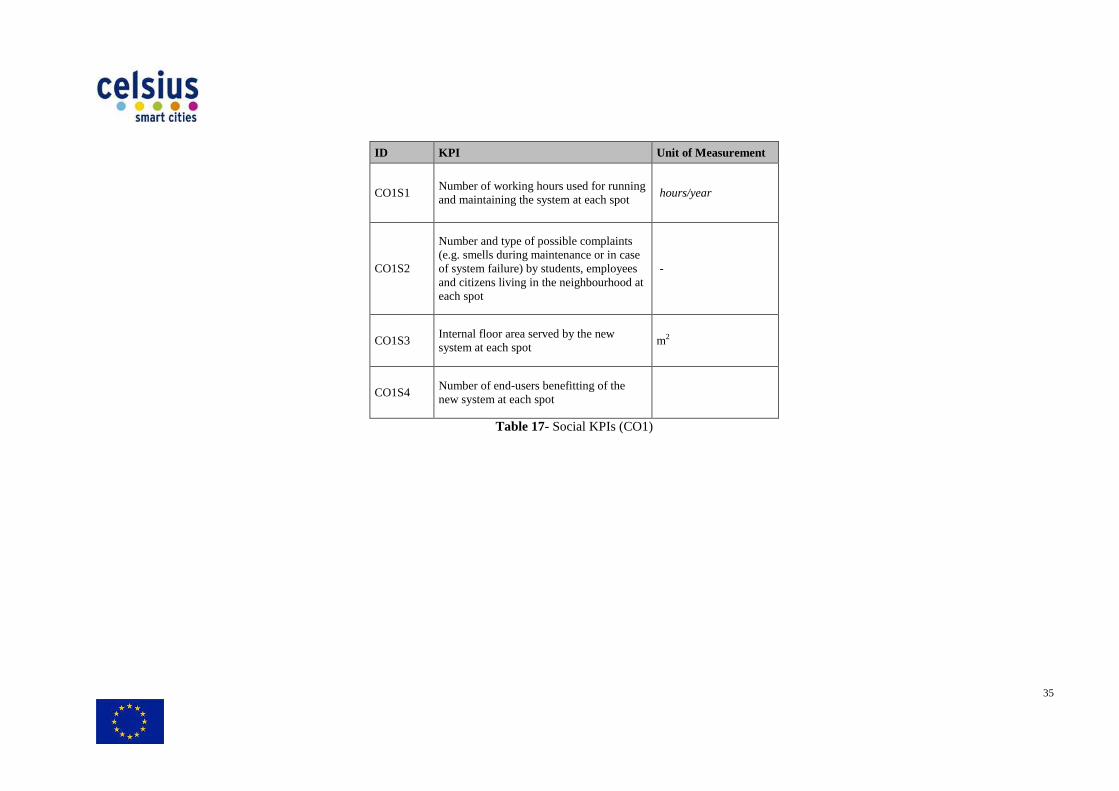
ID
CO1S1
CO1S2
CO1S3
CO1S4
KPI Unit of Measurement
CO1S1 Number of working hours used for running and maintaining the system at each spot
hours/year
CO1S2
Number and type of possible complaints (e.g. smells during maintenance or in case of system failure) by students, employees and citizens living in the neighbourhood at each spot
-
CO1S3 Internal floor area served by the new system at each spot
m2
CO1S4 Number of end-users benefitting of the new system at each spot
Table 17- Social KPIs (CO1)
35
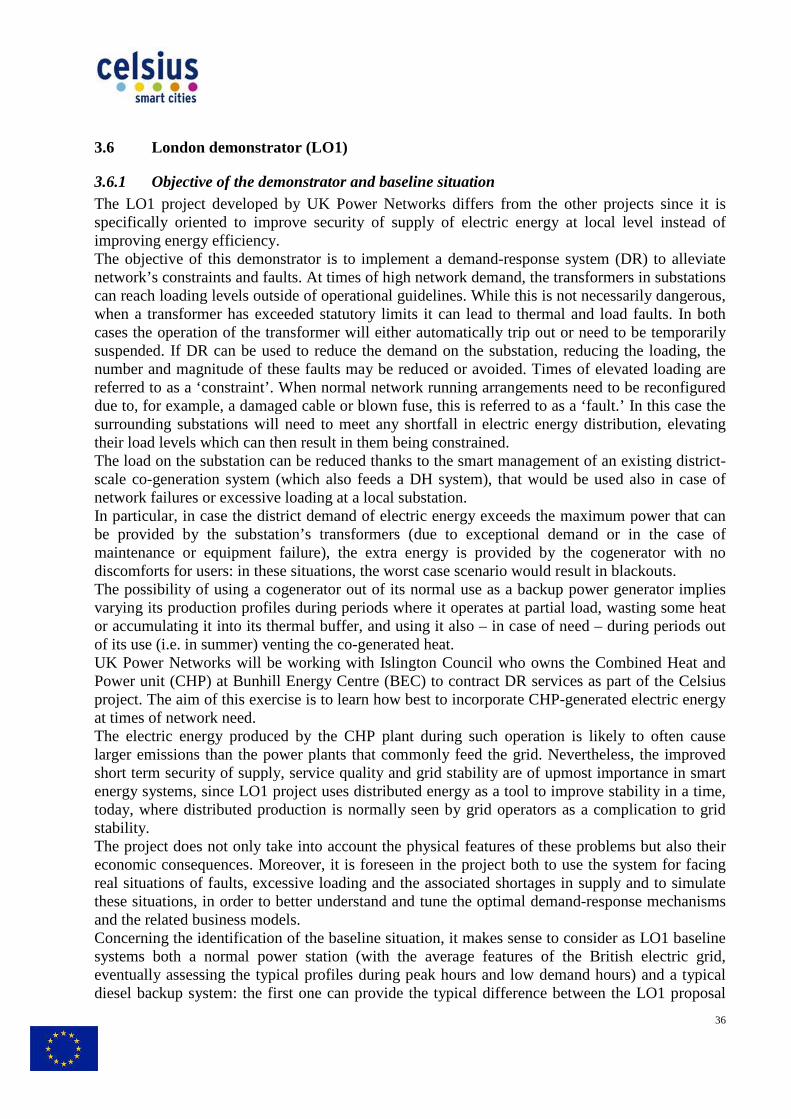
3.6 London demonstrator
3.6.1 Objective of the demonstrator and baseline situationThe LO1 project developed by UK Power Networks specifically oriented to improveimproving energy efficiency. The objective of this demonstrator isnetwork’s constraints and faults. At times of high network demand, the transformers in substations can reach loading levels outside of operational guidelines. While this is not necessarily dangerous, when a transformer has exceeded statutory limits it can lead to thermal and load faults. In both cases the operation of the transformer will either automatically suspended. If DR can be used to reduce the demand on the substation, reducing the loading, the number and magnitude of these faults may be reduced or avoided. Times of elevated loading areferred to as a ‘constraint’. Wdue to, for example, a damaged cable or blown fuse, this is referred to as a ‘fault.’ In this case the surrounding substations will need to mtheir load levels which can then result in them being constrainedThe load on the substation can be reducedscale co-generation system (whichnetwork failures or excessive loading at a localIn particular, in case the district demandbe provided by the substation’s transformers (due to exceptional demand or in the casemaintenance or equipment failure)discomforts for users: in these situations, the worst case scenario would result in blackouts.The possibility of using a cogenerator out of its normal use as a backup power generator implies varying its production profiles during periods where it operates at partial load, wasting some heat or accumulating it into its thermal buffer, and using it also of its use (i.e. in summer) venting the coUK Power Networks will be working with Islington Council who ownPower unit (CHP) at Bunhill Energy Centre (BEC) to contract DR services as part of the Celsius project. The aim of this exercise is to learn how best to incorat times of network need. The electric energy producedlarger emissions than the power plashort term security of supply, service quality and grid stability are of upmost importance in smart energy systems, since LO1 project uses distributed energy as a tool today, where distributed production is stability. The project does not only take into account the physical features of these problems but also their economic consequences. Moreover, it is foresereal situations of faults, excessive loading and the associated shortages in supply and to simulate these situations, in order to better understand and tune the optimal demandand the related business models.Concerning the identification of the baseline situation,systems both a normal power station (eventually assessing the typical profidiesel backup system: the first one can provide the typical difference between the LO1 proposal
London demonstrator (LO1)
Objective of the demonstrator and baseline situation developed by UK Power Networks differs from the other projects since it is
ecifically oriented to improve security of supply of electric energy at local level instead of
demonstrator is to implement a demand-response systemconstraints and faults. At times of high network demand, the transformers in substations
ch loading levels outside of operational guidelines. While this is not necessarily dangerous, when a transformer has exceeded statutory limits it can lead to thermal and load faults. In both cases the operation of the transformer will either automatically trip out or need to be temporarily suspended. If DR can be used to reduce the demand on the substation, reducing the loading, the number and magnitude of these faults may be reduced or avoided. Times of elevated loading a
When normal network running arrangements need to be reconfigured due to, for example, a damaged cable or blown fuse, this is referred to as a ‘fault.’ In this case the surrounding substations will need to meet any shortfall in electric energytheir load levels which can then result in them being constrained.
load on the substation can be reduced thanks to the smart management of an existing districtwhich also feeds a DH system), that would be used also
network failures or excessive loading at a local substation. in case the district demand of electric energy exceeds the maximum power that can
be provided by the substation’s transformers (due to exceptional demand or in the casemaintenance or equipment failure), the extra energy is provided by the codiscomforts for users: in these situations, the worst case scenario would result in blackouts.
generator out of its normal use as a backup power generator implies varying its production profiles during periods where it operates at partial load, wasting some heat or accumulating it into its thermal buffer, and using it also – in case of need of its use (i.e. in summer) venting the co-generated heat. UK Power Networks will be working with Islington Council who owns the Combined Heat and Power unit (CHP) at Bunhill Energy Centre (BEC) to contract DR services as part of the Celsius project. The aim of this exercise is to learn how best to incorporate CHP-generated electric energy
produced by the CHP plant during such operation is likely to often cause larger emissions than the power plants that commonly feed the grid. Nevertheless, the short term security of supply, service quality and grid stability are of upmost importance in smart energy systems, since LO1 project uses distributed energy as a tool to improve stability in a ti
where distributed production is normally seen by grid operators as a
The project does not only take into account the physical features of these problems but also their economic consequences. Moreover, it is foreseen in the project both to use the system for facing real situations of faults, excessive loading and the associated shortages in supply and to simulate these situations, in order to better understand and tune the optimal demand
related business models. Concerning the identification of the baseline situation, it makes sense to consider as LO
both a normal power station (with the average features of the British electric grid, eventually assessing the typical profiles during peak hours and low demand diesel backup system: the first one can provide the typical difference between the LO1 proposal
36
differs from the other projects since it is at local level instead of
system (DR) to alleviate constraints and faults. At times of high network demand, the transformers in substations
ch loading levels outside of operational guidelines. While this is not necessarily dangerous, when a transformer has exceeded statutory limits it can lead to thermal and load faults. In both
trip out or need to be temporarily suspended. If DR can be used to reduce the demand on the substation, reducing the loading, the number and magnitude of these faults may be reduced or avoided. Times of elevated loading are
hen normal network running arrangements need to be reconfigured due to, for example, a damaged cable or blown fuse, this is referred to as a ‘fault.’ In this case the
eet any shortfall in electric energy distribution, elevating
thanks to the smart management of an existing district-), that would be used also in case of
exceeds the maximum power that can be provided by the substation’s transformers (due to exceptional demand or in the case of
ra energy is provided by the cogenerator with no discomforts for users: in these situations, the worst case scenario would result in blackouts.
generator out of its normal use as a backup power generator implies varying its production profiles during periods where it operates at partial load, wasting some heat
in case of need – during periods out
the Combined Heat and Power unit (CHP) at Bunhill Energy Centre (BEC) to contract DR services as part of the Celsius
generated electric energy
during such operation is likely to often cause Nevertheless, the improved
short term security of supply, service quality and grid stability are of upmost importance in smart to improve stability in a time,
s a complication to grid
The project does not only take into account the physical features of these problems but also their en in the project both to use the system for facing
real situations of faults, excessive loading and the associated shortages in supply and to simulate these situations, in order to better understand and tune the optimal demand-response mechanisms
it makes sense to consider as LO1 baseline the average features of the British electric grid,
and low demand hours) and a typical diesel backup system: the first one can provide the typical difference between the LO1 proposal

and an alternative solution considering an empowerment of the local substation; the secondprovides the baseline typical situation where security of supply is an indispensable solution (e.g. a hospital). A simplified layout of the implementation solution in the demonstrator LO1 figure below.
and an alternative solution considering an empowerment of the local substation; the secondthe baseline typical situation where security of supply is an indispensable solution (e.g. a
A simplified layout of the implementation solution in the demonstrator LO1
37
and an alternative solution considering an empowerment of the local substation; the second one the baseline typical situation where security of supply is an indispensable solution (e.g. a
A simplified layout of the implementation solution in the demonstrator LO1 is reported in the
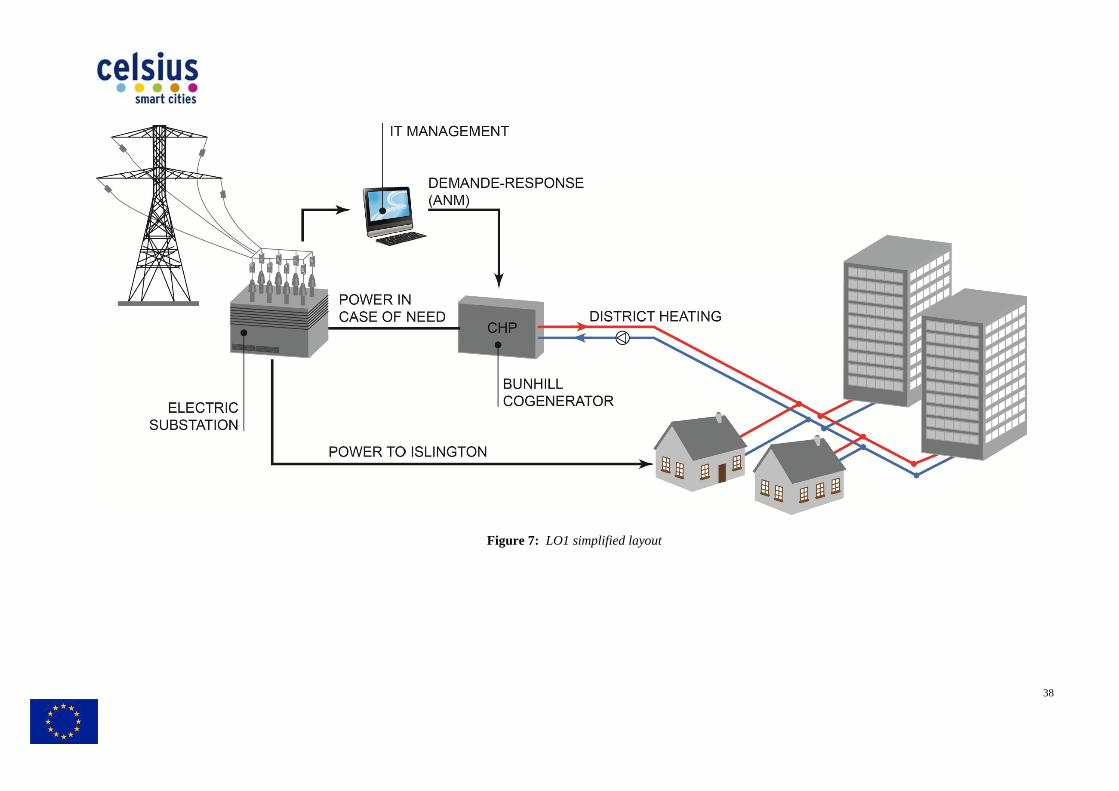
Figure 7: LO1 simplified layout
38

3.6.2 List of specific KPIs Technical KPIs In the following list both security of supply and energetic
• Number of power interruptions avoided in a year• Number of power quality issues avoided in a year• Number of power interruptions not avoided in a year• Number of power quality issues not avoided in a year• Number of fines avoided in a year• Yearly amount of natural gas used by the co
Nm3/year; • Yearly amount of electric energy
substation- MWhe/year• Additional thermal losses due to the shift between production and consumption during
the heating season-Environmental KPIs
• Variation of emissions with reference to baseline situationof PM10, PM 2.5, TSP, NO
• Yearly GHG variationEconomic KPIs
• Operation and maintenance costspaid by BEC, considering boththat sustained for the actually used service
• Extra-cost for gas consumption used in assistance of the€/year;
• Total earnings for BEC d• Total amount of fines a
per each typo of fault backed by the cosimulated- €/year per typology of faults
• Extra fee paid by UKPN to BEC per eachamong those truly occurred and those simulated
• Extra cost sustained by BEC per eachthose truly occurred and those simulated
Social KPIs • Number of residents/users benefitting of the new project• Reduction/increase of complaints due to the implementation of new
comparison with baseline situation• Working hours per
In the following list both security of supply and energetic aspects are included.Number of power interruptions avoided in a year;
power quality issues avoided in a year; Number of power interruptions not avoided in a year; Number of power quality issues not avoided in a year; Number of fines avoided in a year;
t of natural gas used by the cogenerator for assisting the substation
early amount of electric energy produced by the cogeneratMWhe/year;
dditional thermal losses due to the shift between production and consumption during - MWht/year.
Variation of emissions with reference to baseline situation- % of variation and kg/year , TSP, NOx, SOx, CO, CO2;
variation- % of variation and kg/year of CO2e.
Operation and maintenance costs of the cogenerator used in assistance of thepaid by BEC, considering both the part sustained to ensure the system availability and that sustained for the actually used service- €/year;
cost for gas consumption used in assistance of the substation paid by BEC
Total earnings for BEC due to the service given to UKPN- €/yearTotal amount of fines avoided by UKPN thanks to the cogenerator assistance,
typo of fault backed by the cogenerator, among those truly occurr€/year per typology of faults;
Extra fee paid by UKPN to BEC per each type of fault backed by the coly occurred and those simulated- €/year per typology of faults
Extra cost sustained by BEC per each type of fault backed by the cothose truly occurred and those simulated- €/year per typology of faults
Number of residents/users benefitting of the new project; Reduction/increase of complaints due to the implementation of new comparison with baseline situation;
per year for operation and maintenance of the new system
39
are included.
or for assisting the substation-
generator for assisting the
dditional thermal losses due to the shift between production and consumption during
% of variation and kg/year
generator used in assistance of the substation the part sustained to ensure the system availability and
substation paid by BEC-
€/year; generator assistance, divided
generator, among those truly occurred and those
type of fault backed by the cogenerator, €/year per typology of faults;
of fault backed by the cogenerator, among €/year per typology of faults.
Reduction/increase of complaints due to the implementation of new system in
of the new system- hours/year.
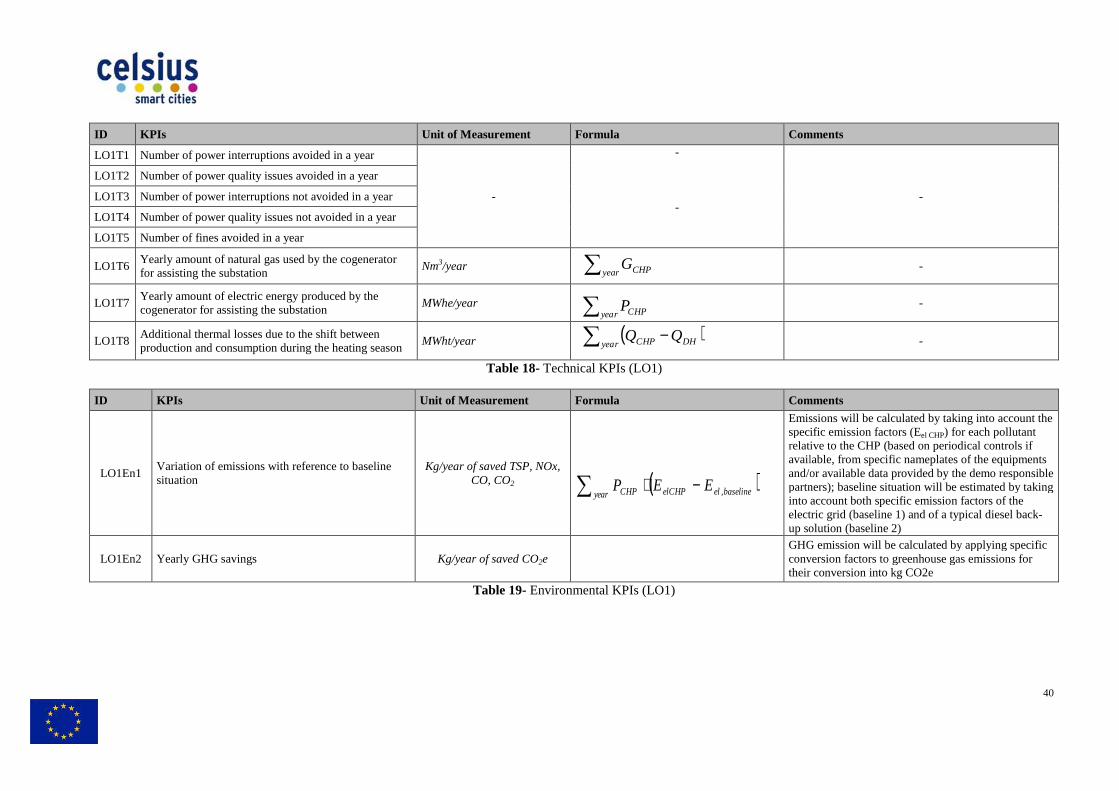
ID KPIs
LO1T1 Number of power interruptions avoided in a year
LO1T2 Number of power quality issues avoided in a year
LO1T3 Number of power interruptions not avoided in a year
LO1T4 Number of power quality issues not avoided in a year
LO1T5 Number of fines avoided in a year
LO1T6 Yearly amount of natural gas used by the cogenerator for assisting the substation
LO1T7 Yearly amount of electric energy produced by the cogenerator for assisting the substation
LO1T8 Additional thermal losses due to the shift between production and consumption during the heating season
ID KPIs
LO1En1 Variation of emissions with reference to baseline situation
LO1En2 Yearly GHG savings
Unit of Measurement Formula Comments
-
- -
Nm3/year
MWhe/year
MWht/year
Table 18- Technical KPIs (LO1)
Unit of Measurement Formula Comments
Kg/year of saved TSP, NOx, CO, CO2
Emissions will be calculated specific emission factors (Erelative to the CHP (based on periodical controls if available, from specific nameplates of the equipments and/or available data provided by thepartners); baseline situation will be estimated by taking into account both specific emission factors of the electric grid (baseline 1) and of a typical diesel backup solution (baseline 2)
Kg/year of saved CO2e GHG emission will be calculated by applying specific conversion factors to greenhouse gas emissions for their conversion into kg CO2e
Table 19- Environmental KPIs (LO1)
∑year CHPP
( )∑ −year DHCHP QQ
( )baselineelelCHPyear CHP EEP ,−⋅∑
∑year CHPG
40
Comments
-
-
-
-
Comments
Emissions will be calculated by taking into account the specific emission factors (Eel CHP) for each pollutant relative to the CHP (based on periodical controls if available, from specific nameplates of the equipments and/or available data provided by the demo responsible partners); baseline situation will be estimated by taking into account both specific emission factors of the electric grid (baseline 1) and of a typical diesel back-up solution (baseline 2) GHG emission will be calculated by applying specific conversion factors to greenhouse gas emissions for their conversion into kg CO2e

ID KPIs
LO1Ec1
Cost for O&M of the cogenerator used in assistance of the substation paid by BEC, divided between the part sustained to ensure the system availability and that sustained for the actually used service
LO1Ec2 Extra-cost for gas consumption used in assistance of the substation paid by BEC
LO1Ec3 Total earnings for BEC due to the service given to UKPN
LO1Ec4
Total amount of fines avoided by UKPN thanks to the cogenerator assistance, divided per each typo of fault backed by the cogenerator, among those truly occurred and those simulated
LO1Ec5 Extra fee paid by UKPN to BEC per each type of fault backed by the cogenerator, among those truly occurred and those simulated
LO1Ec6 Extra cost sustained by BEC per each type of fault backed by the cogenerator, among those truly occurred and those simulated
ID KPIs
LO1S1 Number of residents/users benefitting of the new project
LO1S2 Reduction/increase of complaints due to the comparison with baseline situation
LO1S3 Working hours per year for O&M of the new system
Unit of Measurement Formula Comments
generator used in assistance of between the part
€/year
consumption used in assistance of the €/year
€/year
Total amount of fines avoided by UKPN thanks to the
generator, among those truly occurred €/year per typology of faults
This indicator is derived by the number of fines avoided in a year
type of fault generator, among those truly occurred €/year per typology of faults
generator, among those truly occurred €/year per typology of faults
Table 20- Economic KPIs (LO1)
Unit of Measurement
Number of residents/users benefitting of the new project -
Reduction/increase of complaints due to the implementation of new system in comparison with baseline situation
-
per year for O&M of the new system- hours/yearTable 21-Social KPIs (LO1)
∑year CHPM
CHPmanagergasTTLO ,61 ⋅
∑year CHPF
41
-
-
-
his indicator is derived by the number of fines avoided in a year
-
-
/year
3.7 London demonstrators
3.7.1 Objective of the demonstrator and baseline situationLondon Borough of Islington Council recently completed the first phase of Bunhill Heat and Power, a 1km heat network served by a 2MWe gas CHP engine. The second phase which will be developed in the framework of the Celsius project (LO2 & 3) intends to recover waslarge electric energy substation and a London Underground midpump technology. It also aims to provide heating to an additional 620 caround 1,000 new build homes, 5,The plans include a hydraulic connection to the first phase’s heat network, which currently serves 880 residential council homes and two leisure centres. Within this district heating project, the Celsius demonstrators include the increase of thermal power supply of the district heating (LO2) and the increase of the number of buildings served by the district heating (LO3). The first waste heat source is a transformers during their normal activity as a result of losses incurred during voltage conversion. At UK Power Network Ltd.’s (UKPN) City Road substation the transformers are cooled using aoil system and heat is currently lost to the envLondon Underground mid-tunnel ventilation shaft ventilates the tube through the use of mechanical ventilation exhausting warm air into the environment.captured using heat exchangers and heat pump systems. The heat pump COP’s achievable are estimated to be approximately 3 for the ventilation shaft to approximately 5.5 for the electrical transformer at peak operating temperature. TheMW) is expected to meet the base load for the connected propertiesIslington Council plans to incorporate a thermal store to even out demand if necessary. be implemented through increased temperature differential across the store.One more general baseline situation (baseline 1) for LO2mix of heating systems used in London, consisting of natural gas fired boilers, oil fired boilers, electric heaters and electric heat pumps. The reference and typical features of these systems be a census of heating systems at city level or, better, at district levelon the new loads to be connected to the district heatingA more specific baseline situation (baseline 2) will alternative heating system for each of the connections heating system and for new buildings the alternative meet planning requirements and Building Regulations. A simplified layout both of LO2 and Lreported in the figure 8 may require to be amended in accordance to actual implementation of the demonstrator).
London demonstrators (LO2+LO3)
Objective of the demonstrator and baseline situation London Borough of Islington Council recently completed the first phase of Bunhill Heat and Power, a 1km heat network served by a 2MWe gas CHP engine. The second phase which will be
work of the Celsius project (LO2 & 3) intends to recover wassubstation and a London Underground mid-tunnel ventilation shaft using heat
pump technology. It also aims to provide heating to an additional 620 council ownedhomes, 5,000m2 commercial space, student and hotel accommodation.
The plans include a hydraulic connection to the first phase’s heat network, which currently serves 880 residential council homes and two leisure centres. Within this district heating project, the Celsius demonstrators include the increase of thermal power supply of the district heating (LO2) and the increase of the number of buildings served by
The first waste heat source is a large electric substation where heat is generated from electrical transformers during their normal activity as a result of losses incurred during voltage conversion. At UK Power Network Ltd.’s (UKPN) City Road substation the transformers are cooled using aoil system and heat is currently lost to the environment. Separate from the sub
tunnel ventilation shaft ventilates the tube through the use of mechanical ventilation exhausting warm air into the environment. In bocaptured using heat exchangers and heat pump systems. The heat pump COP’s achievable are estimated to be approximately 3 for the ventilation shaft to approximately 5.5 for the electrical transformer at peak operating temperature. The peak thermal output available (approximately 1.16 MW) is expected to meet the base load for the connected properties.
to incorporate a thermal store close to the electrical substation heat pump to even out demand if necessary. However, a better use of the existing 115 mbe implemented through increased temperature differential across the store.One more general baseline situation (baseline 1) for LO2-3 project will be referred to the common
ystems used in London, consisting of natural gas fired boilers, oil fired boilers, electric heaters and electric heat pumps. The reference and typical features of these systems be a census of heating systems at city level or, better, at district level or, even better, a study done
loads to be connected to the district heating system during LO3 expansion.more specific baseline situation (baseline 2) will also be taken into account
for each of the connections – i.e. for existing buildings the current heating system and for new buildings the alternative heating system that would be required to meet planning requirements and Building Regulations. A simplified layout both of LO2 and LO3 projects is reported in the figurereported in the figure 8 may require to be amended in accordance to actual implementation of the
42
London Borough of Islington Council recently completed the first phase of Bunhill Heat and Power, a 1km heat network served by a 2MWe gas CHP engine. The second phase which will be
work of the Celsius project (LO2 & 3) intends to recover waste heat from a tunnel ventilation shaft using heat
ouncil owned homes and commercial space, student and hotel accommodation.
The plans include a hydraulic connection to the first phase’s heat network, which currently serves
Within this district heating project, the Celsius demonstrators include the increase of thermal power supply of the district heating (LO2) and the increase of the number of buildings served by
eat is generated from electrical transformers during their normal activity as a result of losses incurred during voltage conversion. At UK Power Network Ltd.’s (UKPN) City Road substation the transformers are cooled using an
ironment. Separate from the substation, a nearby tunnel ventilation shaft ventilates the tube through the use of
In both cases, heat will be captured using heat exchangers and heat pump systems. The heat pump COP’s achievable are estimated to be approximately 3 for the ventilation shaft to approximately 5.5 for the electrical
peak thermal output available (approximately 1.16
to the electrical substation heat pump However, a better use of the existing 115 m3 thermal storage will
be implemented through increased temperature differential across the store. 3 project will be referred to the common
ystems used in London, consisting of natural gas fired boilers, oil fired boilers, electric heaters and electric heat pumps. The reference and typical features of these systems will
or, even better, a study done 3 expansion.
into account by considering the i.e. for existing buildings the current
that would be required to
reported in the figures below (temperatures reported in the figure 8 may require to be amended in accordance to actual implementation of the
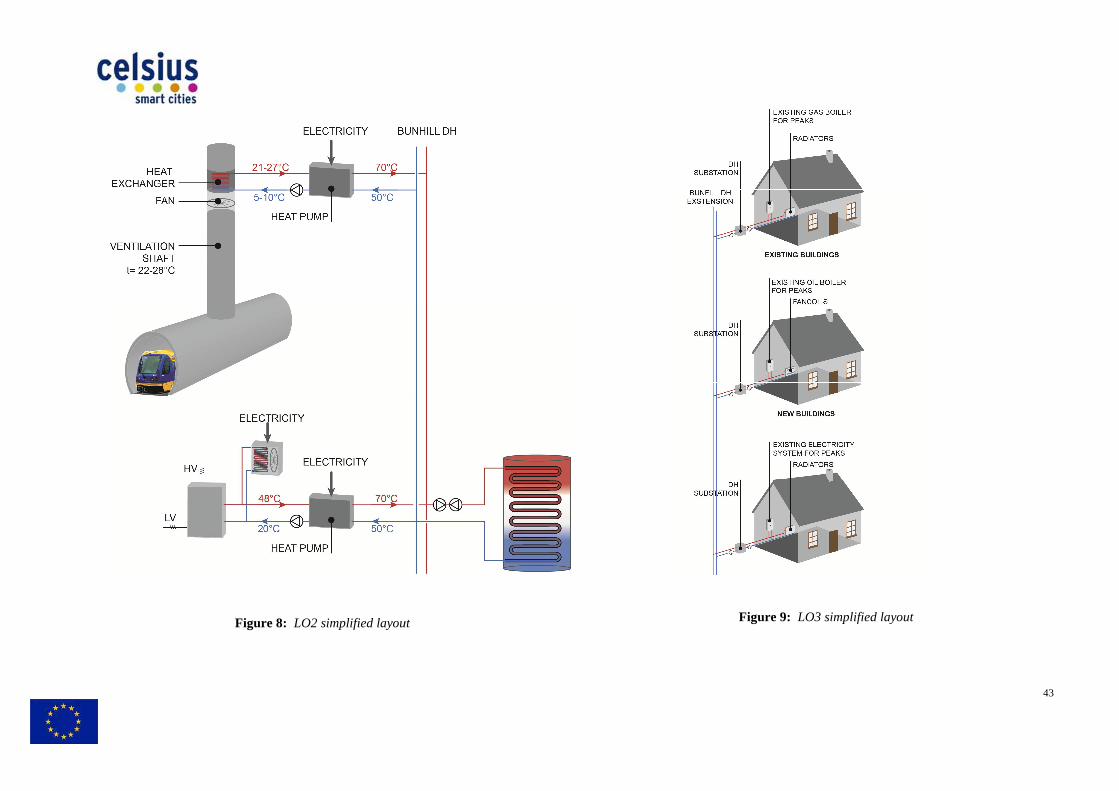
Figure 8: LO2 simplified layout
LO2 simplified layout
Figure 9: LO3 simplified layou
43
LO3 simplified layout

3.7.2 List of specific KPIs Technical KPIs
• Yearly amount of electric energy used by the installed heat pump system at ventilation shaft (A), transformer (B) and thermal storage (C)
• Seasonal COP of the heating p• Yearly amount of thermal
transformer (B) and thermal storage (C)• Thermal energy delivered to the
the expansion of the networkEnvironmental KPIs
• Variation of emissions with reference to baseline situationTSP, NOx, SOx, CO, CO
• Yearly GHG variationEconomic KPIs
• Yearly cost for electric energy consumption at ventilation shaft (A), transformer (B) and thermal storage(C)
• Maintenance costs at ventilation shaft (A), transformer (B) and thermal storage (C)€/year;
• Yearly savings for the endSocial KPIs
• Additional buildings connected to the district heating• Internal surface served by the new system• Number of resident• Number of workplaces benefitting of the new system
early amount of electric energy used by the installed heat pump system at ventilation shaft (A), transformer (B) and thermal storage (C)- MWhe/year;
easonal COP of the heating pump system at ventilation shaft andearly amount of thermal energy recovered/provided by
transformer (B) and thermal storage (C) - MWht/year; delivered to the buildings connected to the district heating
the expansion of the network- MWht/year;
Variation of emissions with reference to baseline situation- kg/year of PM, CO, CO2 and % of variation;
Yearly GHG variation- % of variation and kg/year of CO2e.
cost for electric energy consumption at ventilation shaft (A), transformer (B) and thermal storage(C)- €/year; Maintenance costs at ventilation shaft (A), transformer (B) and thermal storage (C)
for the end-user-€/year per end-user.
al buildings connected to the district heating system; nternal surface served by the new system- m2; umber of residents benefitting of the new system; umber of workplaces benefitting of the new system.
44
early amount of electric energy used by the installed heat pump system at ventilation ;
ump system at ventilation shaft and transformer; ventilation shaft (A),
buildings connected to the district heating system in
kg/year of PM10, PM2.5,
cost for electric energy consumption at ventilation shaft (A), transformer (B)
Maintenance costs at ventilation shaft (A), transformer (B) and thermal storage (C)-

ID KPIs Unit of Measurement
LO2-3T1
Yearly amount of electric energy used by the installed heat pump system at ventilation shaft (A), transformer (B) and thermal storage (C)
MWhe/year
LO2-3T2 Seasonal COP of the heating pump systems at ventilation shaft (A) and transformer (B)
LO2-3T3 Yearly amount of thermal energy recovered/provided by A, B and C
MWht/year
LO2-3T4 Thermal energy delivered to the buildings connected to the district heating system in the expansion of the network
MWht/year
Unit of Measurement Formula
MWhe/year
-
MWht/year
MWht/year
Table 22- Technical KPIs (LO2-3)
∑ AhpyearC ,
∑ BhpyearC ,
∑ CyearC
∑ AhpyearQ ,
∑ BhpyearQ ,
outCyearQ∑
∑ ∑i buildyear iQ
∑∑
Ahpyear
Ahpyear
C
Q
,
,
∑∑
Bhpyear
Bhpyear
C
Q
,
,
45

ID KPIs Unit of Measurement
LO2-3En1 Variation of emissions with reference to baseline situation
Kg/year of saved TSP, NOx, CO, CO2
LO2-3En2 Yearly GHG savings Kg/year of saved CO2e
Unit of Measurement Formula Comments
saved TSP,
The calculation will take into account the specific emission factors (average electricity grid in order to estimate emissions connected to the total electric energy consumption of thesystem A+B+C (Cfactors associated totypology of fuel in(common mix used in London)account (Eaccording to the specific efficiency, equipment using the fuel of each equipment which is representative of the baseline situation
- GHG emission will be calculated by applying specific conversion factors in ogreenhouse gas emissions into kg of CO
Table 23- Environmental KPIs (LO2-3)
∑∑ ⋅−⋅year grideltotfuel,i i
i
i ECwη
E3TLO2 4,
46
Comments
The calculation will take into account the specific emission factors (Eel grid) for each pollutant based on average electricity grid in the United Kingdom in order to estimate emissions connected to the total electric energy consumption of the new entire system A+B+C (Ctot); at the same time emission factors associated to the consumption of each typology of fuel in the different heating systems (common mix used in London) will be taken into account (Ei). This factor must be corrected according to the specific efficiency, ŋi, of each equipment using the fuel i and the relative weight wi of each equipment on the identified mix distribution which is representative of the baseline situation
GHG emission will be calculated by applying specific conversion factors in order to convert greenhouse gas emissions into kg of CO2 equivalent

ID KPIs Unit of Measurement
LO2-3Ec1
Yearly cost for electric energy consumption at ventilation shaft (A), transformer (B) and thermal storage (C)
€/year
LO2-3Ec2
Maintenance costs at ventilation shaft (A), transformer (B) and thermal storage (C)
€/year
LO2-3Ec3 Yearly savings for the end-user
€/year end-user
ID
LO2-3S1
LO2-3S2
LO2-3S3
LO2-3S4
Formula Comments
userend
baselinebaselineuserendth
N
TQTTLO
−
− −⋅ ,43,2
Telectric energysituation in accordance to the mix of sources used for heating purposesQthe baseline situation.
Table 24- Economic KPIs (LO2-3)
KPIs Unit of Measurement
3S1 Additional buildings connected to the district
heating system -
3S2 Internal surface served by the new system m2
3S3 Number of residents benefitting of the new
system; -
3S4 Number of workplaces benefitting of the
new system -
Table 25- Social KPIs (LO2-3
DHMelTTLO ,13,2 ⋅
∑ AyearM
∑ Byear M
∑ CyearM
47
Comments
-
-
T baseline is calculated from the cost of fuels and electric energy used for space heating in the baseline situation in accordance to the mix of sources used for heating purposes. Qbaseline is the thermal energy provided to buildings in the baseline situation.
3.8 Rotterdam demonstrator: RO1
3.8.1 Objective of the demonstrator and baseline situationThe district heating system of Rotterdam was established in two E.ON-owned CHP’s and several local gasmainly situated in the city centre and in 2003 an investigation into a major expansion of the district heating system was startOne of the major steps taken by Warmtebedrijf Rotterdam (Heating Transport Company) has consisted in the establishment of a network to transport residual heat from the AVRincinerator in the port area to residential areas in the southern anRotterdam. Warmtebedrijf Rotterdam has realised a 26 km transport infrastructure with a thermal capacity of 105 MW. RO1 demonstrator (The Heat Hub) focuses on increasing the effectiveness of the waste heat transportation network of Warmtebedrijf Rotterdam with buffering, heat balancing, smart ICT and forecasting. It allows for an increase in total heat delivery of the waste heat network without any additional investments in a new transport infrastructure or by means of additiThe heat hub will be constituted of three different parts:• A distribution station for the connection of the existing district heating systems to the south
and north of Rotterdam; • A well-insulated buffering tank
capacity of 30MWth. By placing the tank in the middle of the distribution network, instead of at the traditional location in the vicinity of the production facilities, Warmtebedrijf Rotterdam increases the effectiveness of the buffering capacity, because the buffered heat is closer to the end-consumer. There is also a positive effect on the local air quality because there are less gasfired boilers needed for peak load;
• A smart ICT-system for improving focrucial element in further optimization of heat sources, buffers, new connections and pumping stations in the waste heat transportation infrastructure of Warmtebedrijf Rotterdam and the entire district heating system.
Therefore, the use of the heat hub itself will result in additional substitution of heat produced by fossil fuels by that produced from recovered industrial waste heat, reducing the correspondent emission levels. The smart ICT system will cocapacity and the heat demand in the city of Rotterdam through the use of the heat buffer.The baseline situation will be referred to the common mix of heating systems used in Rotterdam, consisting of natural gas fired boilers, oil fired boilers, electric heaters and electric heat pumps. The reference and typical features of these systems might be a census of heating systems at city level or, better, at district level or, even better, a study done on the nthe district heating system A simplified scheme of the Heat Hub is represented in the figure below
Rotterdam demonstrator: RO1
Objective of the demonstrator and baseline situation The district heating system of Rotterdam was established in 1948 and it is currently sourced by
owned CHP’s and several local gas-fired peak plants. The district heating system is mainly situated in the city centre and in 2003 an investigation into a major expansion of the district heating system was started. One of the major steps taken by Warmtebedrijf Rotterdam (Heating Transport Company) has consisted in the establishment of a network to transport residual heat from the AVRincinerator in the port area to residential areas in the southern and northern parts of the city of Rotterdam. Warmtebedrijf Rotterdam has realised a 26 km transport infrastructure with a thermal
RO1 demonstrator (The Heat Hub) focuses on increasing the effectiveness of the waste heat work of Warmtebedrijf Rotterdam with buffering, heat balancing, smart ICT and
forecasting. It allows for an increase in total heat delivery of the waste heat network without any additional investments in a new transport infrastructure or by means of additiThe heat hub will be constituted of three different parts:
for the connection of the existing district heating systems to the south
insulated buffering tank with a buffering capacity of 185MWh and a discharge capacity of 30MWth. By placing the tank in the middle of the distribution network, instead of at the traditional location in the vicinity of the production facilities, Warmtebedrijf Rotterdam
he effectiveness of the buffering capacity, because the buffered heat is closer to the consumer. There is also a positive effect on the local air quality because there are less gas
fired boilers needed for peak load; for improving forecasting and heat balancing. This ICT system is a
crucial element in further optimization of heat sources, buffers, new connections and pumping stations in the waste heat transportation infrastructure of Warmtebedrijf Rotterdam and the
ting system.
Therefore, the use of the heat hub itself will result in additional substitution of heat produced by fossil fuels by that produced from recovered industrial waste heat, reducing the correspondent emission levels. The smart ICT system will contribute in this sense by optimized matching of heat capacity and the heat demand in the city of Rotterdam through the use of the heat buffer.The baseline situation will be referred to the common mix of heating systems used in Rotterdam,
ural gas fired boilers, oil fired boilers, electric heaters and electric heat pumps. The reference and typical features of these systems might be a census of heating systems at city level or, better, at district level or, even better, a study done on the new loads to be connected to
A simplified scheme of the Heat Hub is represented in the figure below
48
1948 and it is currently sourced by fired peak plants. The district heating system is
mainly situated in the city centre and in 2003 an investigation into a major expansion of the
One of the major steps taken by Warmtebedrijf Rotterdam (Heating Transport Company) has consisted in the establishment of a network to transport residual heat from the AVR-owned waste
d northern parts of the city of Rotterdam. Warmtebedrijf Rotterdam has realised a 26 km transport infrastructure with a thermal
RO1 demonstrator (The Heat Hub) focuses on increasing the effectiveness of the waste heat work of Warmtebedrijf Rotterdam with buffering, heat balancing, smart ICT and
forecasting. It allows for an increase in total heat delivery of the waste heat network without any additional investments in a new transport infrastructure or by means of additional heat sources.
for the connection of the existing district heating systems to the south
with a buffering capacity of 185MWh and a discharge capacity of 30MWth. By placing the tank in the middle of the distribution network, instead of at the traditional location in the vicinity of the production facilities, Warmtebedrijf Rotterdam
he effectiveness of the buffering capacity, because the buffered heat is closer to the consumer. There is also a positive effect on the local air quality because there are less gas-
recasting and heat balancing. This ICT system is a crucial element in further optimization of heat sources, buffers, new connections and pumping stations in the waste heat transportation infrastructure of Warmtebedrijf Rotterdam and the
Therefore, the use of the heat hub itself will result in additional substitution of heat produced by fossil fuels by that produced from recovered industrial waste heat, reducing the correspondent
ntribute in this sense by optimized matching of heat capacity and the heat demand in the city of Rotterdam through the use of the heat buffer. The baseline situation will be referred to the common mix of heating systems used in Rotterdam,
ural gas fired boilers, oil fired boilers, electric heaters and electric heat pumps. The reference and typical features of these systems might be a census of heating systems at city
ew loads to be connected to

Figure 10: RO1 simplified layout
49

3.8.2 List of specific KPIs The following list of monitoring parameters is a preliminary list and cannot be considered as the definitive one. Therefore, the provided list can be subject to possible modifications/updates in the next future according to feedback provided by plant Technical KPIs
• Yearly amount of waste energy recovered by the heat hub• Yearly electric energy consumption of the buffer pump versus the yearly thermal
energy loading and unloading buffer tank• Maximizing capacity of heat exchanger by utilizing the buffer
Environmental KPIs • Yearly savings of CO• Yearly savings of NO
The following list of monitoring parameters is a preliminary list and cannot be considered as the definitive one. Therefore, the provided list can be subject to possible modifications/updates in the next future according to feedback provided by plant managers.
Yearly amount of waste energy recovered by the heat hub- MWht/yearYearly electric energy consumption of the buffer pump versus the yearly thermal energy loading and unloading buffer tank- MWhe/year and MWh/year.
acity of heat exchanger by utilizing the buffer- % per year
Yearly savings of CO2- metric ton/year Yearly savings of NOx- metric ton/year
50
The following list of monitoring parameters is a preliminary list and cannot be considered as the definitive one. Therefore, the provided list can be subject to possible modifications/updates in the
MWht/year ; Yearly electric energy consumption of the buffer pump versus the yearly thermal
MWhe/year and MWh/year. % per year
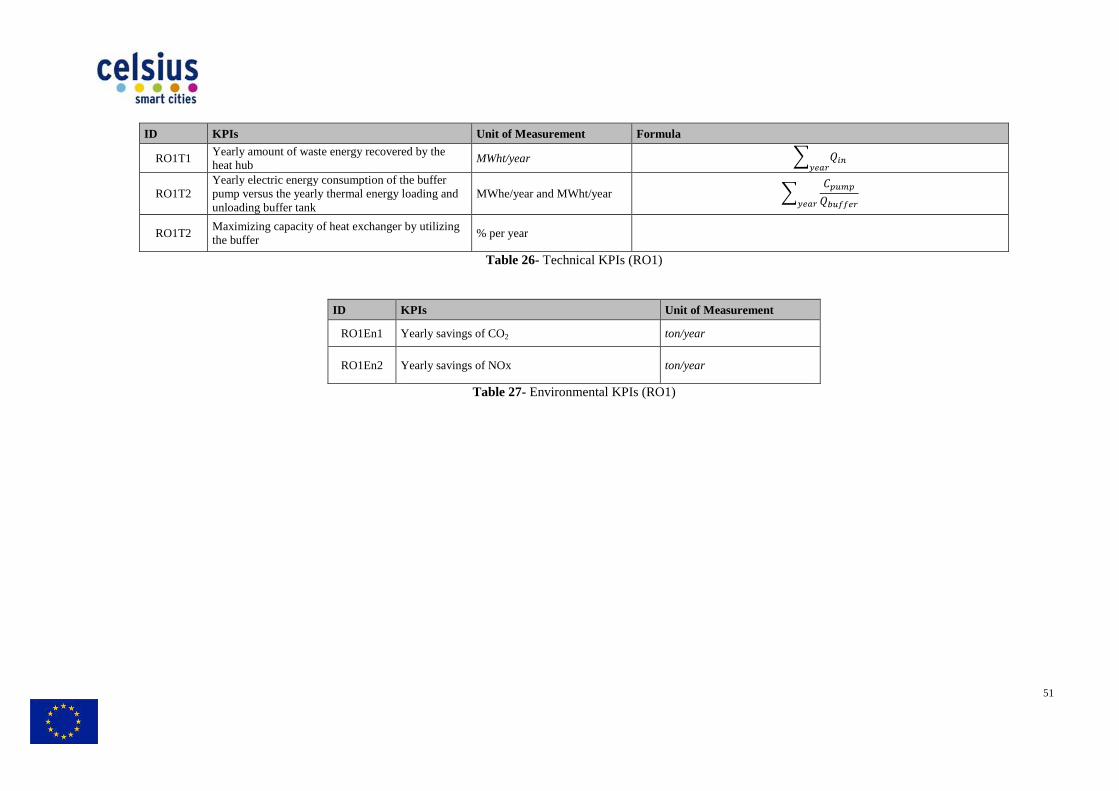
ID KPIs
RO1T1 Yearly amount of waste energy recovered by the heat hub
RO1T2 Yearly electric energy consumption of the buffer pump versus the yearly thermal energy loading and unloading buffer tank
RO1T2 Maximizing capacity of heat exchanger by utilizing the buffer
ID KPIs
RO1En1 Yearly
RO1En2 Yearly savings of NOx
Unit of Measurement Formula
recovered by the MWht/year �
����Yearly electric energy consumption of the buffer pump versus the yearly thermal energy loading and MWhe/year and MWht/year �
����
capacity of heat exchanger by utilizing % per year
Table 26- Technical KPIs (RO1)
KPIs Unit of Measurement
Yearly savings of CO2 ton/year
Yearly savings of NOx ton/year
Table 27- Environmental KPIs (RO1)
51
�������
��� ���������
3.9 Rotterdam demonstrator: RO2
3.9.1 Objective of the demonstrator and baseline situationRO2 Industrial Ecology consists of the integration of existing industrial sites with the heat hub developed by Warmtebedrijf Rotterdam (RO1). The two industrial sites involved in RO2 demonstrator are Meneba, a grain processing plant, and RWZI Dokhaven, a wplant. Both Meneba and the wastewater treatment plant are located near the heat hub of Warmtebedrijf Rotterdam. Currently the total heat demand of Meneba is supplied by a steam boiler, including the heat demand of activities with loweruse district heating for lower temperature requirements instead of steam. The total demand for waste heat is between 20,000 GJ and 40,000 GJ per year.At RWZI Dokhaven plant, the sludge of wabiogas which is then fed as a fuel to a CHP for the coproduction of electric energy and thermal energy. Heat produced largely exceeds the needs of the plant and is mostly wasted. The existing CHP is at the end of its life cycle and needs to be substituted. The objective of the demonstrator is to feed the heat from the new CHP into the waste heat transportation infrastructure of Warmtebedrijf Rotterdam, by developing a connection between the CHP and the waste heat transport infrastructure of Warmtebedrijf Rotterdam to the heat hub. The heat hub acts as a distribution station to the southern and northern parts of Rotterdam.For feasible integration of existing industrial sources with the waste heat transpornew business models need to be developed. For this specific case, the baseline situation will be referred to the situation prior to the implementation of the technical solution, where thermal energy from biogas cogeneration is only partially exploited for heating the anaerobic digester at RWZI Dokhaven plant and heat at Meneba grain processing plant is provided by conventional steam boilers also for low temperature requirements. A simplified layout of the process is represented in the
Rotterdam demonstrator: RO2
Objective of the demonstrator and baseline situation RO2 Industrial Ecology consists of the integration of existing industrial sites with the heat hub developed by Warmtebedrijf Rotterdam (RO1). The two industrial sites involved in RO2 demonstrator are Meneba, a grain processing plant, and RWZI Dokhaven, a wplant. Both Meneba and the wastewater treatment plant are located near the heat hub of
Currently the total heat demand of Meneba is supplied by a steam boiler, including the heat demand of activities with lower temperature requirements. The aim of the RO2 demonstrator is to use district heating for lower temperature requirements instead of steam. The total demand for waste heat is between 20,000 GJ and 40,000 GJ per year. At RWZI Dokhaven plant, the sludge of wastewater is converted by anaerobic fermentation into biogas which is then fed as a fuel to a CHP for the coproduction of electric energy and thermal energy. Heat produced largely exceeds the needs of the plant and is mostly wasted. The existing
he end of its life cycle and needs to be substituted. The objective of the demonstrator is to feed the heat from the new CHP into the waste heat transportation infrastructure of Warmtebedrijf Rotterdam, by developing a connection between the
aste heat transport infrastructure of Warmtebedrijf Rotterdam to the heat hub. The heat hub acts as a distribution station to the southern and northern parts of Rotterdam.For feasible integration of existing industrial sources with the waste heat transpornew business models need to be developed. For this specific case, the baseline situation will be referred to the situation prior to the implementation of the technical solution, where thermal energy from biogas cogeneration is only
ally exploited for heating the anaerobic digester at RWZI Dokhaven plant and heat at Meneba grain processing plant is provided by conventional steam boilers also for low temperature
A simplified layout of the process is represented in the figure below:
52
RO2 Industrial Ecology consists of the integration of existing industrial sites with the heat hub developed by Warmtebedrijf Rotterdam (RO1). The two industrial sites involved in RO2 demonstrator are Meneba, a grain processing plant, and RWZI Dokhaven, a wastewater treatment plant. Both Meneba and the wastewater treatment plant are located near the heat hub of
Currently the total heat demand of Meneba is supplied by a steam boiler, including the heat temperature requirements. The aim of the RO2 demonstrator is to
use district heating for lower temperature requirements instead of steam. The total demand for
stewater is converted by anaerobic fermentation into biogas which is then fed as a fuel to a CHP for the coproduction of electric energy and thermal energy. Heat produced largely exceeds the needs of the plant and is mostly wasted. The existing
The objective of the demonstrator is to feed the heat from the new CHP into the waste heat transportation infrastructure of Warmtebedrijf Rotterdam, by developing a connection between the
aste heat transport infrastructure of Warmtebedrijf Rotterdam to the heat hub. The heat hub acts as a distribution station to the southern and northern parts of Rotterdam. For feasible integration of existing industrial sources with the waste heat transportation structure,
For this specific case, the baseline situation will be referred to the situation prior to the implementation of the technical solution, where thermal energy from biogas cogeneration is only
ally exploited for heating the anaerobic digester at RWZI Dokhaven plant and heat at Meneba grain processing plant is provided by conventional steam boilers also for low temperature

Figure 11: RO2 simplified layout
53

3.9.2 List of specific KPIs The following list of monitoring parameters is a preliminary list and cannot be considered as the definitive one. Therefore, the provided list can be subject to possible modifications/updates in the next future according to feedback provided by plant managers. Wastewater treatment plantTechnical KPIs
• Rate of waste energy recovery and comparison with the baselinEnvironmental KPIs
• Yearly savings of CO• Yearly savings of NO
Social KPIs • Estimation of the n• Estimation of new job opportunities
demonstrator. Meneba Technical KPIs
• Rate of waste energy recovery and comparison with the baseline situationEnvironmental KPIs
• Yearly savings of CO• Yearly savings of NO
Social KPIs • Estimation of number of services and persons benefitting of the intervention
measurable); • Estimation of new job opportunities created thanks to the implementation of the
demonstrator (if measurable) ID KPIs Unit of Measurement
RO2T1
Rate of waste energy recovery and comparison with the baseline situation at WWTP
MWht/year
RO2T2
Rate of waste energy recovery and comparison with the baseline situation at Meneba
MWht/year
ID
RO2En
RO2En2
RO2En3
RO2En4
The following list of monitoring parameters is a preliminary list and cannot be considered as the
one. Therefore, the provided list can be subject to possible modifications/updates in the next future according to feedback provided by plant managers.
Wastewater treatment plant
Rate of waste energy recovery and comparison with the baseline situation
Yearly savings of CO2- metric ton/year Yearly savings of NOx- metric ton/year
Estimation of the number of services and persons benefitting of the intervention;ew job opportunities created thanks to the implementation of the
Rate of waste energy recovery and comparison with the baseline situation
Yearly savings of CO2- metric ton/year Yearly savings of NOx- metric ton/year
umber of services and persons benefitting of the intervention
ew job opportunities created thanks to the implementation of the (if measurable).
Unit of Measurement Formula
MWht/year � ����,�������,��������
MWht/year � ����,�����������,����
Table 28- Technical KPIs (RO2)
KPIs Unit of Measurement
RO2En1 Yearly savings of CO2 at WWTP
ton/year
RO2En2 Yearly savings of NOx at WWTP
ton/year
RO2En3 Yearly savings of CO2 at Meneba
ton/year
RO2En4 Yearly savings of NOx at Meneba
ton/year
Table 29- Environmental KPIs (RO1)
54
The following list of monitoring parameters is a preliminary list and cannot be considered as the one. Therefore, the provided list can be subject to possible modifications/updates in the
e situation- MWh/year;
umber of services and persons benefitting of the intervention; created thanks to the implementation of the
Rate of waste energy recovery and comparison with the baseline situation- MWh/year;
umber of services and persons benefitting of the intervention (if
ew job opportunities created thanks to the implementation of the
Comments
4. Specific key-performance indicators: existing demonstrators As already mentioned in the introductionalready existing and operational demonstrators which will be added to the analysis of the performance in order to cover a wider range of technologies, enlarging the Celsius City concept and providing useful results for the set up of the technical toolbox which will be developed in the future years of the project for enabling upscaleThe methodology followed for settingdemonstrators has been substantially the same The existing demonstrators have been built in previous years answering to specific needs of the correspondent cities in which they have been conceived and appliedA Celsius-oriented approach has been followed the efforts on the identification of a subthe purposes of the project in terms of potential of replicexplicitly mentioned, general KPIs (chapter each demonstrator. Moreover, considering that in most cases the existing demonstrators are in operation since many years and thus they can be considered as steadygeneric KPIs will be performed oncereference period. In the sub-paragraphs below, the analysis of each exiCelsius project is reported by including a short description of the implemented technology and of the correspondent baseline situation, the list of relevantreporting, when necessary, the respective formulas for calculation.
performance indicators: existing demonstrators
mentioned in the introduction to the present document, the Celsius project already existing and operational demonstrators which will be added to the analysis of the performance in order to cover a wider range of technologies, enlarging the Celsius City concept
eful results for the set up of the technical toolbox which will be developed in the for enabling upscale and roll-out of all the demonstrators.
followed for setting-up the key-performance indicators has been substantially the same followed for the new demonstrators.
existing demonstrators have been built in previous years answering to specific needs of the in which they have been conceived and applied.
oriented approach has been followed for setting-up a list of specific KPIs the efforts on the identification of a sub-set of specific indicators which are really meaningful for
ct in terms of potential of replicability of the technology, general KPIs (chapter 5) will be sufficient for describing the performance of
in most cases the existing demonstrators are in operation since many s and thus they can be considered as steady-state plants, the calculation
KPIs will be performed once during the project duration covering an entire year a
paragraphs below, the analysis of each existing demonstrator Celsius project is reported by including a short description of the implemented technology and of the correspondent baseline situation, the list of relevant specific KPIs and a summary table
, the respective formulas for calculation.
55
performance indicators: existing demonstrators
the present document, the Celsius project includes 14 already existing and operational demonstrators which will be added to the analysis of the performance in order to cover a wider range of technologies, enlarging the Celsius City concept
eful results for the set up of the technical toolbox which will be developed in the out of all the demonstrators. performance indicators for the existing
the new demonstrators. existing demonstrators have been built in previous years answering to specific needs of the
up a list of specific KPIs by focusing set of specific indicators which are really meaningful for
ability of the technology. Where not will be sufficient for describing the performance of
in most cases the existing demonstrators are in operation since many calculation of the specific and
covering an entire year as
sting demonstrator which is part of the Celsius project is reported by including a short description of the implemented technology and of
KPIs and a summary table
4.1 Gothenburg Demonstrator (9GOe)
4.1.1 Objective of the demonstrator and baseline situationThis demonstrator consists of aand electric energy from renewable sources, i.e. wood chips. The plant was originally built in 1985 as a coal boiler used for heating purposes; later, in 2004 the converted into a renewable biomass system was implemented in order to produce also electric energyThe original use of coal boiler is assumed as the baseline situation of the demonstrator.
4.1.2 List of specific KPIs Technical KPIs
• Yearly thermal energy• Change in yearly thermal energy
MWht and % of variation• Yearly electric energy• Share of thermal energy
heating mix - %; • District heating supply temperature (
average)- °C; • District heating return temperature (
average) -°C • Power-to-heat ratio
For the economic, environmental and social aspects, the general KPIs as defined in the chapter 5 will be sufficient for the evaluation of the performance of this demonstrator.
Gothenburg Demonstrator (9GOe)
Objective of the demonstrator and baseline situation consists of a combined heat and power plant which aims at producing
from renewable sources, i.e. wood chips. The plant was originally built in for heating purposes; later, in 2004 the previous
converted into a renewable biomass plant for thermal energy production and then, rder to produce also electric energy.
boiler is assumed as the baseline situation for estimating
thermal energy production- MWht/year; thermal energy production in comparison with the baseline situation
and % of variation; electric energy production- MWhe/year;
Share of thermal energy provided by this demonstrator to the
District heating supply temperature (yearly average, summer average and winter
District heating return temperature (yearly average, summer average and winter
heat ratio (ratio between electric and thermal energy production)
environmental and social aspects, the general KPIs as defined in the chapter 5 will be sufficient for the evaluation of the performance of this demonstrator.
56
plant which aims at producing thermal from renewable sources, i.e. wood chips. The plant was originally built in
previous coal boiler was and then, in 2010 a CHP
for estimating the performance
production in comparison with the baseline situation-
provided by this demonstrator to the Gothenburg district
average, summer average and winter
average, summer average and winter
n electric and thermal energy production)
environmental and social aspects, the general KPIs as defined in the chapter 5 will be sufficient for the evaluation of the performance of this demonstrator.

ID KPI
9GOeT1 Yearly thermal energy production
9GOeT2 Change in yearly thermal energy production in comparison with the baseline situation
9GOeT3 Yearly electric energy production
9GOeT4 Share of thermal energy provided by this demonstrator to the Gothenburg district heating mix
9GOeT5 District heating supply temperature(yearly average, summer average and winter average)
9GOeT6 District heating return temperature (yearly average, summer average and winter average)
9GOeT7 Power-to-heat ratio (ratio between electric and thermal energy production)
Unit of Measurement Formula
roduction MWht/year ∑year CHPQ
production in comparison with the % ( )∑
∑ −
year baseline
year baselineCHP
Q
MWhe/year ∑year CHPP
Share of thermal energy provided by this demonstrator to the Gothenburg district %
∑
∑
year DH
year CHP
Q
Q
supply temperature average, summer average and °C
period
Teperiod s,DH∑
ure average, summer average and °C
period
Teperiod r,DH∑
(ratio between electric and thermal energy production) dimensionless
9GOeT1
9GOeT3
Table 30- Technical KPIs (9GOe)
57
4.2 Gothenburg Demonstrator (29GOe)
4.2.1 Objective of the demonstrator and baseline The overall aim of this demonstrator is to offer the customers a non(“Climate Agreement”) by providing a set indoor temperature (e.g. 21 °C) at a fixed cost, instead of a certain quantity of energy (kWh). The proposyears duration and by now has been undersigned by customers within different areas for a total extension of 3.6 million square meters. The energy company (GOTE) takes responsibility of the building energy system and by the agreement gets incentives to save energy as well as continuously maintain the system, providing also information to customers about their energy consumptions. The same buildings with standard energy contracts before signing the Climate Aconsidered as the baseline situation.
4.2.2 List of specific KPIs Technical KPIs
• Yearly thermal energy consumption in buildings with MWht/year-;
• Yearly thermal energy consumption per square meter of heated area in buildings with “climate agreement
• Yearly reduction of- MWht/year and %
Economic KPIs • Yearly savings for
Social KPIs • Average indoor air • Standard deviation of indoor air temperature in a building with climate agreement • Share of customers appreciating the situati
Gothenburg Demonstrator (29GOe)
Objective of the demonstrator and baseline situation The overall aim of this demonstrator is to offer the customers a non-conventional energy contract (“Climate Agreement”) by providing a set indoor temperature (e.g. 21 °C) at a fixed cost, instead of a certain quantity of energy (kWh). The proposed agreement is offered either for a five or three years duration and by now has been undersigned by customers within different areas for a total extension of 3.6 million square meters. The energy company (GOTE) takes responsibility of the
system and by the agreement gets incentives to save energy as well as continuously maintain the system, providing also information to customers about their energy
The same buildings with standard energy contracts before signing the Climate Aconsidered as the baseline situation.
Yearly thermal energy consumption in buildings with “
Yearly thermal energy consumption per square meter of heated area in buildings with climate agreement” - MWht/m2year;
Yearly reduction of thermal energy consumption in comparison with baseline situation MWht/year and %.
Yearly savings for the end-user - €/year.
air temperature-°C; Standard deviation of indoor air temperature in a building with climate agreement Share of customers appreciating the situation with the “climate agreement”
58
conventional energy contract (“Climate Agreement”) by providing a set indoor temperature (e.g. 21 °C) at a fixed cost, instead
ed agreement is offered either for a five or three years duration and by now has been undersigned by customers within different areas for a total extension of 3.6 million square meters. The energy company (GOTE) takes responsibility of the
system and by the agreement gets incentives to save energy as well as continuously maintain the system, providing also information to customers about their energy
The same buildings with standard energy contracts before signing the Climate Agreement will be
“climate agreement” -
Yearly thermal energy consumption per square meter of heated area in buildings with
thermal energy consumption in comparison with baseline situation
Standard deviation of indoor air temperature in a building with climate agreement -°C; on with the “climate agreement”- %.

ID KPI Unit of Measurement
29GOeT1 Yearly thermal energy consumption in buildings with “climate agreement”
MWht/year
29GOeT2
Yearly thermal energy consumption per square meter of heated area in buildings with “climate agreement”
kWht/m2
29GOeT3 Yearly reduction in thermal energy consumption in comparison with baseline situation
MWh/yearbaseline situation
ID KPI Unit of Measurement
29GOeEc1 Yearly savings for the end-user €/year
ID KPI
29GOeS1 Average i(yearly average, summer average, winter average
29GOeS2 Standard deviation of indoor air temperature in a building with climate agreement
29GOeS3 Share of customers appreciating the situation agreement”
Unit of Measurement Formula
MWht/year ∑ year agreemQ
2year
temp
year agreem
A
Q∑
MWh/year and % with reference to baseline situation
( )∑
∑ −
year baseline
year baselineagreem
Q
Table 31- Technical KPIs (29GOe)
Unit of Measurement Formula
∑ ∑−− −year userendthbaselinebaselineuserendth TQT ,,,
Table 32- Economic KPIs (29GOe)
Unit of Measurement Comments
Average indoor air temperature, average, summer average,
winter average) °C -
Standard deviation of indoor air temperature in a building with climate agreement
°C
Share of customers appreciating the situation with the “climate agreement”
-
Table 33- Social KPIs (29GOe)
59
Comments
-
-
-
Comments
yrear agreemQ -

4.3 Gothenburg Demonstrator (19GOe)
4.3.1 Objective of the demonstrator and baseline situationThe aim of this demonstrator, “Absorption cooling”, is to network by means of absorption chillers. The thermodynamic cycle of the absorption chillers is driven by a heat source and, considering this demonstrator, theused as heat source. Total installed capacity is 30 MW and 45 GWh yearly, corresponding to 37 % of the total district cooling production in Gothenburg.Electric chillers used for cooling this specific case.
4.3.2 List of specific KPIs Technical KPIs
• Share of district cooling produced from absorption chillers • Period of the year when absorption chillers are used in district coo• Seasonal performance factor;• Use of thermal energy from district heating (• Yearly electric energy consumption• District cooling supply temperature (
average) -°C; • District cooling return temperature (• District heating supply temperature (
average) -°C; • District heating return temperature (
average) -°C; Economic KPIs
• Pay-back time for energy company • Pay-back time for end
Environmental KPIs • Reduced consumption of refrigerants
Gothenburg Demonstrator (19GOe)
Objective of the demonstrator and baseline situation The aim of this demonstrator, “Absorption cooling”, is to produce energynetwork by means of absorption chillers. The thermodynamic cycle of the absorption chillers is driven by a heat source and, considering this demonstrator, thermal energy from district heating is used as heat source. Total installed capacity is 30 MW and 45 GWh of cooling
, corresponding to 37 % of the total district cooling production in Gothenburg.cooling individual buildings are considered as the baseline situation
Share of district cooling produced from absorption chillers - %; Period of the year when absorption chillers are used in district cooSeasonal performance factor; Use of thermal energy from district heating (yearly average)- MWht/MWht
rly electric energy consumption - MWht/MWht cold; District cooling supply temperature (yearly average, summer average and winter
District cooling return temperature (yearly average) -°C; District heating supply temperature (yearly average, summer average and winter
District heating return temperature (yearly average, summer average and winter
back time for energy company – years; back time for end-users – years.
Reduced consumption of refrigerants- kg/year.
60
produce energy for the district cooling network by means of absorption chillers. The thermodynamic cycle of the absorption chillers is
rmal energy from district heating is cooling energy is produced
, corresponding to 37 % of the total district cooling production in Gothenburg. as the baseline situation of
Period of the year when absorption chillers are used in district cooling;
MWht/MWht cold;
average, summer average and winter
average, summer average and winter
average, summer average and winter

ID KPI
19GOeT1 Share of district cooling produced by absorption chillers
19GOeT2 Period of the year when absorption chillers are used in district cooling
19GOeT3 Seasonal performance factor
19GOeT4 Use of thermal energy from district heating (yearly average)
19GOeT5 Yearly electric energy consumption
19GOeT6 District cooling supply temperature (yearly average, summer average and winter average)
19GOeT7 District cooling return temperature (yearly average)
19GOeT8 District heating supply temperature (yearly average, summer average and winter average)
19GOeT9 District heating return temperature (yearly average, summer average and winter average)
Unit of Measurement Formula
% ∑
∑
year DC
year DCC
Q
Q ,
Period of the year when absorption chillers Date-date
- ∑
∑
season c
season DCC
C
Q ,
thermal energy from district heating MWht cold/MWht
∑
∑
year DHmix
year DCC
Q
Q
,
,
MWhe/year ∑ ∑ ∑++year year yearDCC CC
°C
period
Teperiod s,DC∑
°C period
Teperiod r,DC∑
°C
period
Teperiod s,DH∑
°C period
Teperiod r,DH∑
Table 34- Technical KPIs (19GOe)
61
year DHC

ID KPI Unit of Measurement
19GOeEc1 Pay-back time for energy company
years
19GOeEc2 Pay-back time for end-user years
ID KPI Unit of Measurement
19GOeEn1 Reduced consumption of refrigerants
kg/year
Unit of Measurement Formula
Table 35- Economic KPIs (19GOe)
Unit of Measurement Formula
kg/year
Table 36- Environmental KPIs (19GOe)
62
Comments
Based on investment costs for absorption chillers and district
cooling network, operating costs, maintenance costs and revenues from sold energy
Based on investment costs for the extra investment, operating costs and estimated economic
savings
Comments
-

4.4 Gothenburg Demonstrator (11GOe)
4.4.1 Objective of the demonstrator and baseline situationThe aim of this demonstrator, “Cooling by river water”, is to produce coolingdistrict cooling network by means of using river water in heat exchangersfree cooling. Total installed capacity is 15 MW and 43 GWh are produced to 35 % of the total district cooling Electric chillers used for cooling individual buildings are considered as the baseline situation of this specific case.
4.4.2 List of specific KPIs Technical KPIs
• Share of district cooling produced as free cooling by river water • Period of the year when river water can be used directly in district cooling;• Seasonal performance factor;• Yearly electric energy consumption • District cooling supply temperature (
average) -°C; • District cooling return temperature (• Temperature of river water to heat exchanger (
winter average) -°C• Temperature of water from heat exchanger bac
Economic KPIs • Pay-back time for energy company • Pay-back time for end
Environmental KPIs • Reduced consumption of refrigerants
Gothenburg Demonstrator (11GOe)
Objective of the demonstrator and baseline situation The aim of this demonstrator, “Cooling by river water”, is to produce coolingdistrict cooling network by means of using river water in heat exchangers
. Total installed capacity is 15 MW and 43 GWh are produced to 35 % of the total district cooling production in Gothenburg. Electric chillers used for cooling individual buildings are considered as the baseline situation of
Share of district cooling produced as free cooling by river water Period of the year when river water can be used directly in district cooling;Seasonal performance factor; Yearly electric energy consumption – MWhe/year; District cooling supply temperature (yearly average, summer average and winter
cooling return temperature (yearly average) -°C; f river water to heat exchanger (yearly average, summer average and
°C; Temperature of water from heat exchanger back to the river (yearly
time for energy company – years; back time for end-user – years.
Reduced consumption of refrigerants- kg/year.
63
The aim of this demonstrator, “Cooling by river water”, is to produce cooling energy for the district cooling network by means of using river water in heat exchangers used to cool water, i.e.
. Total installed capacity is 15 MW and 43 GWh are produced yearly, corresponding
Electric chillers used for cooling individual buildings are considered as the baseline situation of
Share of district cooling produced as free cooling by river water - %; Period of the year when river water can be used directly in district cooling;
average, summer average and winter
average, summer average and
yearly average) -°C;
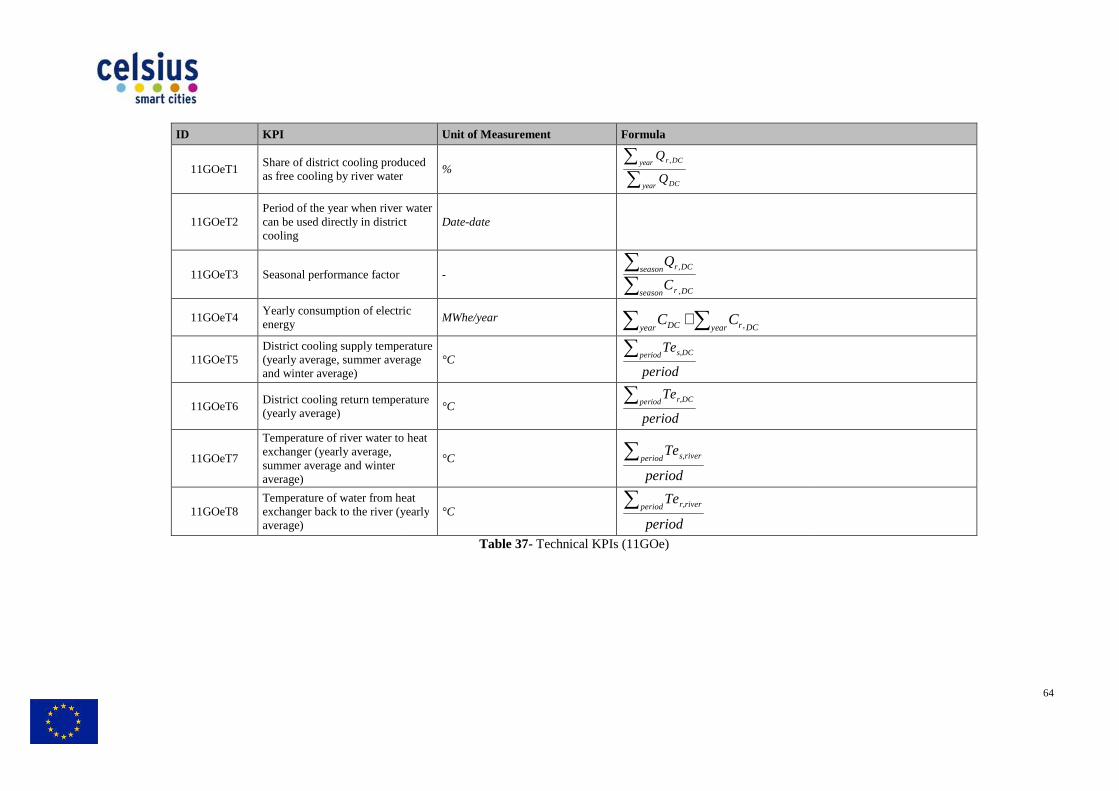
ID KPI
11GOeT1 Share of district cooling produced as free cooling by river water
11GOeT2 Period of the year when river water can be used directly in district cooling
11GOeT3 Seasonal performance factor
11GOeT4 Yearly consumption of electric energy
11GOeT5 District cooling supply temperature (yearly average, summer average and winter average)
11GOeT6 District cooling return temperature (yearly average)
11GOeT7
Temperature of river water to heat exchanger (yearly average, summer average and winter average)
11GOeT8 Temperature of water from heat exchanger back to the river (yearlyaverage)
Unit of Measurement Formula
Share of district cooling produced
% ∑
∑
year DC
year DCr
Q
Q ,
Period of the year when river water can be used directly in district Date-date
- ∑
∑
season DCr
season DCr
C
Q
,
,
Yearly consumption of electric MWhe/year ∑ ∑+
year year DCrDC CC ,
District cooling supply temperature average, summer average °C
period
Teperiod s,DC∑
District cooling return temperature °C
period
Teperiod r,DC∑
river water to heat
°C
period
Teperiod s,river∑
Temperature of water from heat yearly °C
period
Teperiod r,river∑
Table 37- Technical KPIs (11GOe)
64
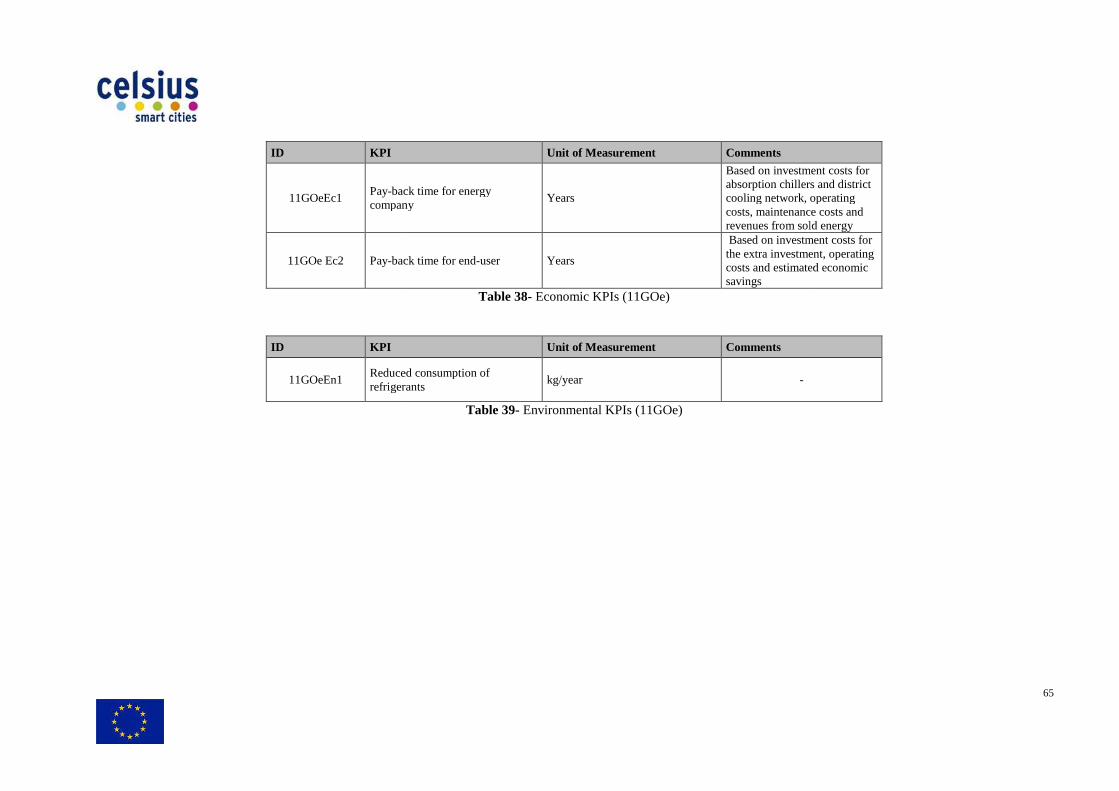
ID KPI
11GOeEc1 Pay-back time for energy company
11GOe Ec2 Pay-back time for end
ID KPI
11GOeEn1 Reduced consumption of refrigerants
Unit of Measurement Comments
back time for energy company
Years
Based on investment costs for absorption chillers and district cooling network, operating costs, maintenance costs and revenues from sold
back time for end-user Years
Based on investment costs for the extra investment, operating costs and estimated economic savings
Table 38- Economic KPIs (11GOe)
Unit of Measurement Comments
Reduced consumption of refrigerants
kg/year -
Table 39- Environmental KPIs (11GOe)
65
Based on investment costs for absorption chillers and district cooling network, operating costs, maintenance costs and revenues from sold energy Based on investment costs for the extra investment, operating costs and estimated economic
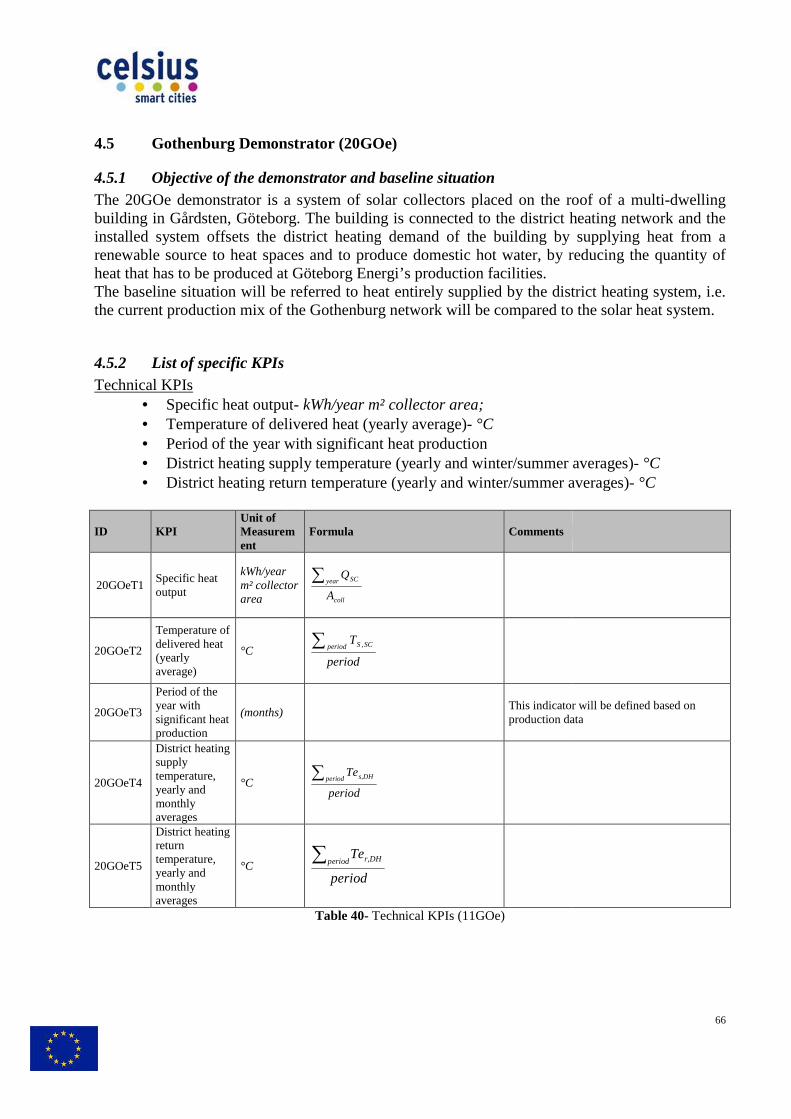
4.5 Gothenburg Demonstrator (20
4.5.1 Objective of the demonstrator and baseline situationThe 20GOe demonstrator is a system of solar collectors placed on the roof of a multibuilding in Gårdsten, Göteborg. The building is connected to the districinstalled system offsets the district heatingrenewable source to heat spaces heat that has to be produced at Göteborg Energi’s production facilities.The baseline situation will be referredthe current production mix of the Gothenburg network will be compared to the solar heat system.
4.5.2 List of specific KPIs Technical KPIs
• Specific heat output• Temperature of delivered heat (• Period of the year with significant heat production• District heating supply temperature (• District heating return temperature (
ID KPI Unit of Measurement
20GOeT1 Specific heat output
kWh/year m² collector area
20GOeT2
Temperature of delivered heat (yearly average)
°C
20GOeT3
Period of the year with significant heat production
(months)
20GOeT4
District heating supply temperature, yearly and monthly averages
°C
20GOeT5
District heating return temperature, yearly and monthly averages
°C
Gothenburg Demonstrator (20GOe)
Objective of the demonstrator and baseline situation The 20GOe demonstrator is a system of solar collectors placed on the roof of a multibuilding in Gårdsten, Göteborg. The building is connected to the district heating networkinstalled system offsets the district heating demand of the building by supplying renewable source to heat spaces and to produce domestic hot water, by reducing the quantity of heat that has to be produced at Göteborg Energi’s production facilities. The baseline situation will be referred to heat entirely supplied by the district heating system, i.e. the current production mix of the Gothenburg network will be compared to the solar heat system.
Specific heat output- kWh/year m² collector area; Temperature of delivered heat (yearly average)- °C Period of the year with significant heat production District heating supply temperature (yearly and winter/summer averages)District heating return temperature (yearly and winter/summer averages)
Measurem Formula Comments
year m² collector
coll
year SC
A
Q∑
period
Tperiod SCS∑ ,
This indicator wproduction data
period
Teperiod s,DH∑
period
Teperiod r,DH∑
Table 40- Technical KPIs (11GOe)
66
The 20GOe demonstrator is a system of solar collectors placed on the roof of a multi-dwelling t heating network and the
demand of the building by supplying heat from a and to produce domestic hot water, by reducing the quantity of
to heat entirely supplied by the district heating system, i.e. the current production mix of the Gothenburg network will be compared to the solar heat system.
and winter/summer averages)- °C and winter/summer averages)- °C
This indicator will be defined based on production data

4.6 Gothenburg Demonstrator (8GOe)
4.6.1 Objective of the demonstrator and baseline situationThe 8GOe demonstrator aims at recovering the waste heat from an incineration plant in Gothenburg, operated by Renova (a waste management and recycling company). The demonstrator consists of a combined heat and power plant that produces both energy. The walls in the combustion chamber of the incinerator are covered with tubes containing water which is evaporated into saturated steam before being expanded in a turbine that is connected to a generator producing electricity. After the water and the transferred heat is delivered to the network. Flue gascooled down by providing additional The baseline situation will be referred to the case of consequent increase of the production at the Rya natural gas CHP facility.
4.6.2 List of specific KPIs Technical KPIs
• Percentage of Gothenburg district heating produced by this• Yearly net electric energy production• Power-to-heat ratio (ratio between electric and thermal energy production)• Yearly amount of incinerated
ID KPI
8GOeT1
Percentage of Gothenburg district heating produced by this demonstrator
8GOeT2 Yearly net electric energy production
8GOeT3
Power(ratio between electric and thermal energy production)
8GOeT4 Amount of incinerated waste (tons)
Gothenburg Demonstrator (8GOe)
Objective of the demonstrator and baseline situation The 8GOe demonstrator aims at recovering the waste heat from an incineration plant in Gothenburg, operated by Renova (a waste management and recycling company). The demonstrator consists of a combined heat and power plant that produces both
The walls in the combustion chamber of the incinerator are covered with tubes containing water which is evaporated into saturated steam before being expanded in a turbine that is connected to a generator
After the expansion in the turbine, the hot steam is cooled with district heating water and the transferred heat is delivered to the network. Flue gas from the combustion chamber is
additional heat to the district heating network. will be referred to the case of no waste heat recover
the production at the Rya natural gas CHP facility.
Percentage of Gothenburg district heating produced by this demonstratorYearly net electric energy production- MWhe/year;
(ratio between electric and thermal energy production)incinerated waste (tons/year).
KPI Unit of Measurement Formula
Percentage of Gothenburg district heating produced by this demonstrator
% ∑
∑
year mixDH
year inc
Q
Q
,
Yearly net electric energy production
MWh ∑ ∑−year yearincP
Power-to-heat ratio (ratio between electric and thermal energy production)
(dimensionless) ∑year incQ
GOeT28
Amount of incinerated waste (tons)
tons/year ∑ year wasteV
Table 41- Technical KPIs (8GOe)
67
The 8GOe demonstrator aims at recovering the waste heat from an incineration plant in Gothenburg, operated by Renova (a waste management and recycling company). The demonstrator consists of a combined heat and power plant that produces both electric and thermal
The walls in the combustion chamber of the incinerator are covered with tubes containing water which is evaporated into saturated steam before being expanded in a turbine that is connected to a generator
hot steam is cooled with district heating from the combustion chamber is
no waste heat recovery, resulting in a
demonstrator- %;
(ratio between electric and thermal energy production);
year incC

4.7 Gothenburg Demonstrator (7GOe)
4.7.1 Objective of the demonstrator and baseline The demonstrator includes two waste heat recovery facilities that are part of the Gothenburg district heating system. Waste heat from two oil refineries (Preem and Shell) are recovered and delivered to the district heating grid. Thanks to the impwould otherwise be lost to the environment is used to heat homes and produce domestic hot water. As a result, primary energy consumption at Göteborg Energi’s own facilities can be consequently reduced. The baseline situation will be referred to the case of no waste heat recovering, consequently increasing the production at the Rya natural gas CHP facility.
4.7.2 List of specific KPIs
• Waste heat temperature, • Share of Gothenburg district heating • District heating supply temperature • District heating return temperature • Electric energy consumptions needed for recovering waste heat
ID KPI Unit of Measurement
7GOeT1 Waste heat temperature, yearly average
°C
7GOeT2
Share of Gothenburg district heating produced by this demonstrator
%
7GOeT3
District heating supply temperature (yearly , monthly and seasonal averages)
°C
7GOeT4
District heating return temperature (yearly, monthly and seasonal averages)
°C
7GOeT5
Electric energy consumption needed for recovering waste heat
MWhe/year
Gothenburg Demonstrator (7GOe)
Objective of the demonstrator and baseline situation The demonstrator includes two waste heat recovery facilities that are part of the Gothenburg district heating system. Waste heat from two oil refineries (Preem and Shell) are recovered and delivered to the district heating grid. Thanks to the implementation of this demonstrator, heat that would otherwise be lost to the environment is used to heat homes and produce domestic hot water. As a result, primary energy consumption at Göteborg Energi’s own facilities can be consequently
ne situation will be referred to the case of no waste heat recovering, consequently increasing the production at the Rya natural gas CHP facility.
Waste heat temperature, yearly average -°C; Share of Gothenburg district heating produced by this demonstrator District heating supply temperature - °C; District heating return temperature - °C; Electric energy consumptions needed for recovering waste heat
Unit of Measurement Formula
�������,�������
∑ ����,������∑ ���!,������
∑ ���,�����"#
$�%&'(
∑ ���,�����"#
$�%&'(
MWhe/year � �"�����
Table 42- Technical KPIs (7GOe)
68
The demonstrator includes two waste heat recovery facilities that are part of the Gothenburg district heating system. Waste heat from two oil refineries (Preem and Shell) are recovered and
lementation of this demonstrator, heat that would otherwise be lost to the environment is used to heat homes and produce domestic hot water. As a result, primary energy consumption at Göteborg Energi’s own facilities can be consequently
ne situation will be referred to the case of no waste heat recovering, consequently
produced by this demonstrator -%;
Electric energy consumptions needed for recovering waste heat - MWhe/year.
Comments
Values provided for each waste heat recovery site
-
Values provided for each waste heat recovery site
4.8 Gothenburg Demonstrator (36GOe)
4.8.1 Objective of the demonstrator and baseline situationThe demonstrator encompasses the entire district heating system and is intended to give an overview of an existing, mature district heatingheating has been developed in Gothenterms of the geographical size of the network, number of customers connected and number of production facilities. Over the course of the decades, the sources of heat have changed radically, through the conversion of existing production plants to other fuels as well as through the addition of new heat production plants and technologies.
4.8.2 List of specific KPIs Technical KPIs
• Yearly delivered heat to customers per market sector • Yearly production mix • District heating supply temperature • District heating return temperature • Relative distribution losses • Yearly electric energy consumptions • Linear heat density
Social KPIs • Number of users/customers per market sector;• Market share in different sectors • Number of people employed directly and indirectly as a result of the district heating
operation
Gothenburg Demonstrator (36GOe)
demonstrator and baseline situation The demonstrator encompasses the entire district heating system and is intended to give an
mature district heating system in operation in Gothenburg. District heating has been developed in Gothenburg since 1953. The system has gradually expanded in terms of the geographical size of the network, number of customers connected and number of production facilities. Over the course of the decades, the sources of heat have changed radically,
conversion of existing production plants to other fuels as well as through the addition of new heat production plants and technologies.
delivered heat to customers per market sector - MWht/year per market sectorproduction mix - % for each type of heat input;
District heating supply temperature - °C; District heating return temperature - °C Relative distribution losses - %;
electric energy consumptions - MWhe/year; Linear heat density - kWht/m;
Number of users/customers per market sector; Market share in different sectors - % of total number of customersNumber of people employed directly and indirectly as a result of the district heating
69
The demonstrator encompasses the entire district heating system and is intended to give an system in operation in Gothenburg. District
burg since 1953. The system has gradually expanded in terms of the geographical size of the network, number of customers connected and number of production facilities. Over the course of the decades, the sources of heat have changed radically,
conversion of existing production plants to other fuels as well as through the addition
MWht/year per market sector;
% of total number of customers; Number of people employed directly and indirectly as a result of the district heating
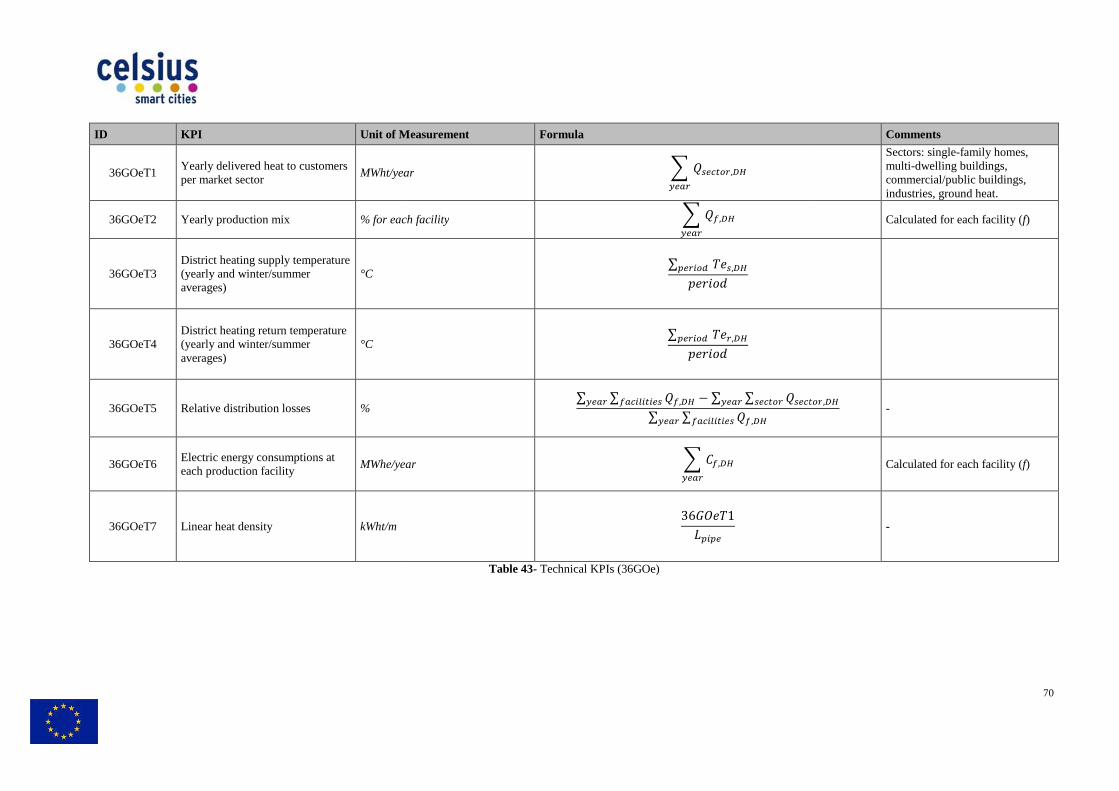
ID KPI Unit of Measurement
36GOeT1 Yearly delivered heat to customers per market sector
MWht/year
36GOeT2 Yearly production mix % for each facility
36GOeT3 District heating supply temperature (yearly and winter/summer averages)
°C
36GOeT4 District heating return temperature (yearly and winter/summer averages)
°C
36GOeT5 Relative distribution losses %
36GOeT6 Electric energy consumptions at each production facility
MWhe/year
36GOeT7 Linear heat density kWht/m
Measurement Formula
MWht/year � �����"�,������
% for each facility � ��,������
∑ ���,�����"#$�%&'(
∑ ���,�����"#$�%&'(
∑ ∑ ��,�� ) ∑ ∑ �����"�����"���������*���������∑ ∑ ��,������*���������
MWhe/year � �,������
36-.��10��
Table 43- Technical KPIs (36GOe)
70
Comments
Sectors: single-family homes, multi-dwelling buildings, commercial/public buildings, industries, ground heat.
Calculated for each facility (f)
����"�,�� -
Calculated for each facility (f)
-
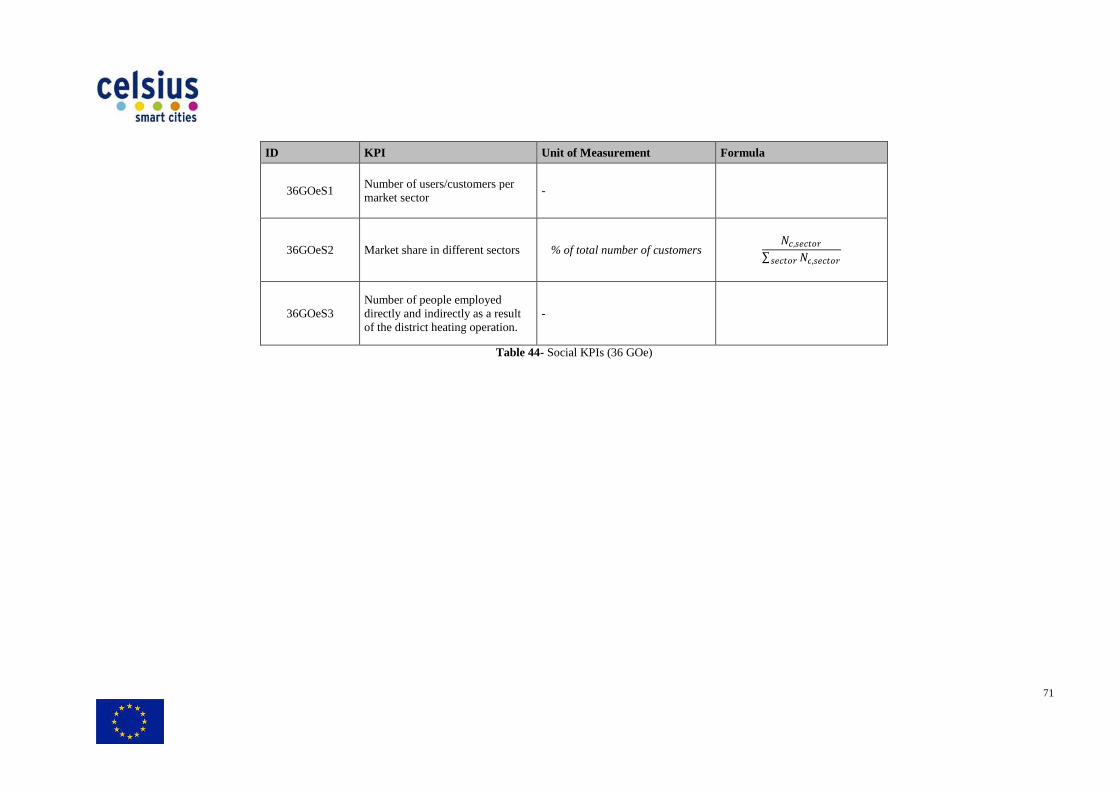
ID KPI
36GOeS1 Number of users/customers per market sector
36GOeS2 Market share in different sectors
36GOeS3 Number of people employed directly and of the district heating
Unit of Measurement Formula
Number of users/customers per market sector
-
Market share in different sectors % of total number of customers 1�,����"�
∑ 1�����"�
Number of people employed directly and indirectly as a result of the district heating operation.
-
Table 44- Social KPIs (36 GOe)
71
����"��,����"�

4.9 Cologne Demonstrator (12COe) The residential area Köln-Stammheimassociation GAG Immobilien AG owns 1.700 apartments and 100 houses there. From 2005 to 2007 GAG modernized 633 apartments and 87 houses. The yearly thermal energy required for heating these buildings is about 10 GWh. One of the largest sewage treatment plants in Germany (Großklärwerk Stammheim) is located one kilometre away from the residential area. In 2010 the municipal water company (Stadtentwässerungsbetriebe StEB), GAG Immobilien AG and RheinEnergie AG started a joint project to exploit biogas produced by the digester for supplying heat to the residential area in Stammheim. For this purpose, StEB invested about 11.5 million € in an existing CHP to improve the electrical efficiency and the use of thRheinEnergie AG built a peak and backup boiler to compensate the seasonal variations due to the fluctuation of biogas production and a one kilometer connecting pipe from the sewage plant to the residential area. For allocation to the houses RheinEnfive-kilometres pipeline network in Stammheim. Globally, RheinEnergie invested 4.7 million On average, the required heat is supplied at 80 % by the biogas fired CHP. The rest is generated by natural gas. The new, innovative concept has lead to an estimating saving of 4,100 tonnes of CO2 per year and a cost reduction for the residents by 17 %.A possible baseline situation that will be considered for the following demonstrator will be referred to a previous oil boiler systemdistrict heating system.
4.9.1 List of specific KPIs
• Yearly thermal energy production• Change in yearly thermal energy production with reference to baseline situation• Yearly electric energy production
Other relevant energetic, environmental,specific case are included in the table of general KPIs (table 45)
Cologne Demonstrator (12COe)
Stammheim is located in the north of Cologne. The local housing association GAG Immobilien AG owns 1.700 apartments and 100 houses there. From 2005 to 2007 GAG modernized 633 apartments and 87 houses. The yearly thermal energy required for
s about 10 GWh. One of the largest sewage treatment plants in Germany (Großklärwerk Stammheim) is located one kilometre away from the residential area. In 2010 the municipal water company (Stadtentwässerungsbetriebe StEB), GAG Immobilien AG
ie AG started a joint project to exploit biogas produced by the digester for supplying heat to the residential area in Stammheim. For this purpose, StEB invested about 11.5
€ in an existing CHP to improve the electrical efficiency and the use of thRheinEnergie AG built a peak and backup boiler to compensate the seasonal variations due to the fluctuation of biogas production and a one kilometer connecting pipe from the sewage plant to the residential area. For allocation to the houses RheinEnergie bought and refurbished the existing
kilometres pipeline network in Stammheim. Globally, RheinEnergie invested 4.7 million On average, the required heat is supplied at 80 % by the biogas fired CHP. The rest is generated
, innovative concept has lead to an estimating saving of 4,100 tonnes of per year and a cost reduction for the residents by 17 %.
situation that will be considered for the following demonstrator will be iler system (no CHP), providing the same heat provided by the new
Yearly thermal energy production- MWht/year; Change in yearly thermal energy production with reference to baseline situation
electric energy production- MWhe/year.
Other relevant energetic, environmental, economic and social KPIs that will be calculated specific case are included in the table of general KPIs (table 45).
72
is located in the north of Cologne. The local housing association GAG Immobilien AG owns 1.700 apartments and 100 houses there. From 2005 to 2007 GAG modernized 633 apartments and 87 houses. The yearly thermal energy required for
s about 10 GWh. One of the largest sewage treatment plants in Germany (Großklärwerk Stammheim) is located one kilometre away from the residential area. In 2010 the municipal water company (Stadtentwässerungsbetriebe StEB), GAG Immobilien AG
ie AG started a joint project to exploit biogas produced by the digester for supplying heat to the residential area in Stammheim. For this purpose, StEB invested about 11.5
€ in an existing CHP to improve the electrical efficiency and the use of the heat. RheinEnergie AG built a peak and backup boiler to compensate the seasonal variations due to the fluctuation of biogas production and a one kilometer connecting pipe from the sewage plant to the
ergie bought and refurbished the existing kilometres pipeline network in Stammheim. Globally, RheinEnergie invested 4.7 million €.
On average, the required heat is supplied at 80 % by the biogas fired CHP. The rest is generated , innovative concept has lead to an estimating saving of 4,100 tonnes of
situation that will be considered for the following demonstrator will be , providing the same heat provided by the new
Change in yearly thermal energy production with reference to baseline situation- %;
that will be calculated for this
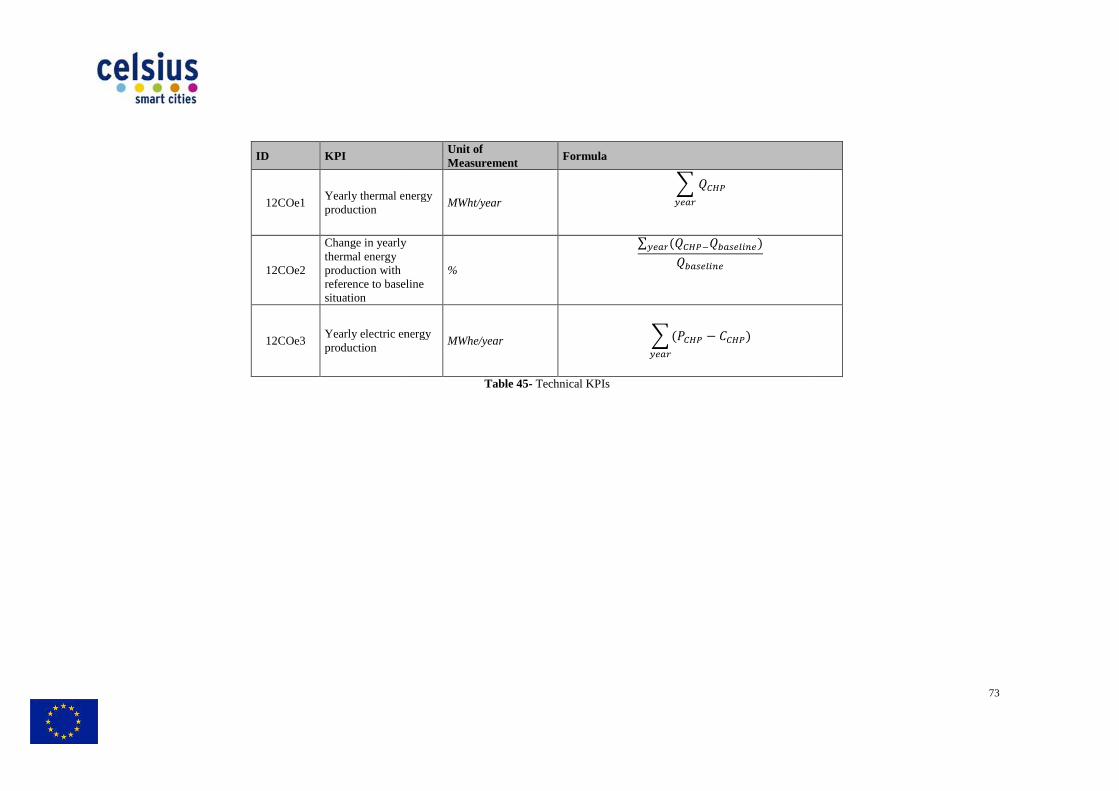
ID KPI
12COe1 Yearly thermal energy production
12COe2
Change in yearly thermal energy production with reference to baseline situation
12COe3 Yearly electric energy production
Unit of Measurement Formula
Yearly thermal energy MWht/year
� ��������
yearly
reference to baseline %
∑ �����2� ���*��������� ���*���
Yearly electric energy MWhe/year � �3��� ) ����
����
Table 45- Technical KPIs
73
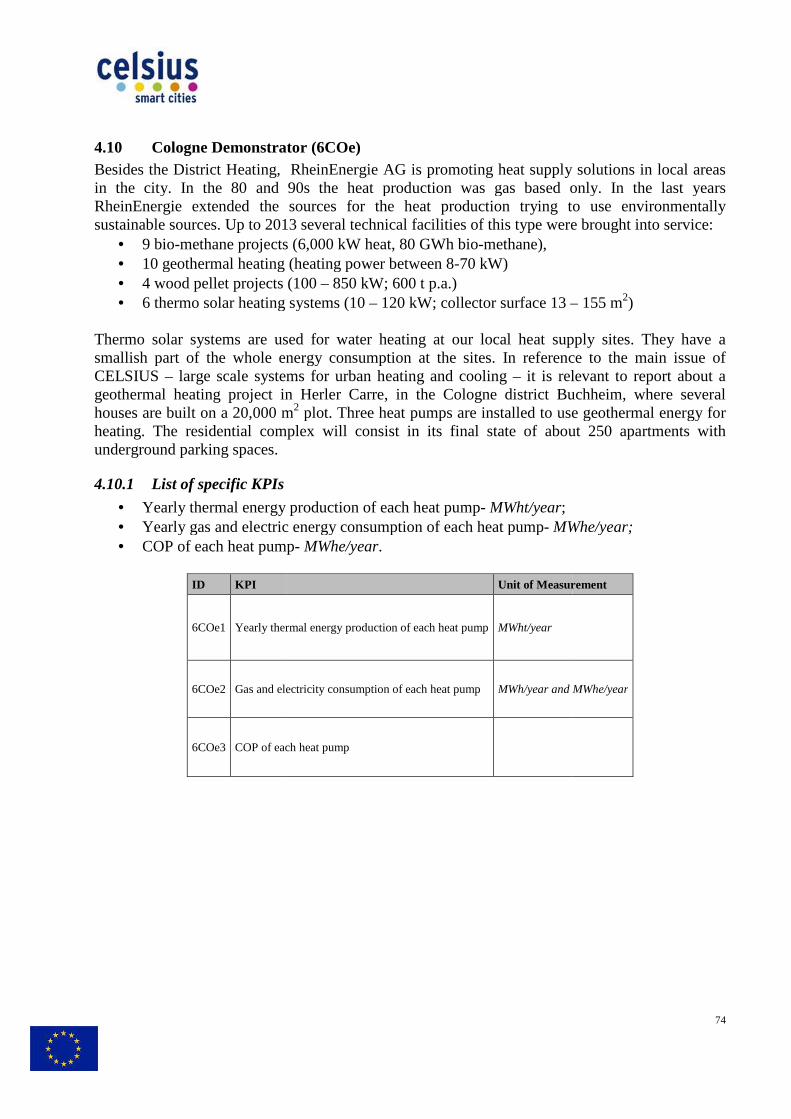
4.10 Cologne Demonstrator (Besides the District Heating, in the city. In the 80 and 90RheinEnergie extended the sources for the heat productsustainable sources. Up to 2013 several technical facilities of this type were brought into service:
• 9 bio-methane projects (6,000 kW heat, 80 GWh bio• 10 geothermal heating (heating power between 8• 4 wood pellet projects (100 • 6 thermo solar heating systems (10
Thermo solar systems are used for water heating at our local heat supply sites. They have a smallish part of the whole energy consumption at the sites. In reference to the main issue of CELSIUS – large scale systems for urban heating and cooling geothermal heating project in Herler Carre, in the Cologne district houses are built on a 20,000 mheating. The residential complex will conunderground parking spaces.
4.10.1 List of specific KPIs
• Yearly thermal energy production• Yearly gas and electric energy consumption of each heat pump• COP of each heat pump
ID KPI
6COe1 Yearly thermal energy production of each heat pump
6COe2 Gas and electricity consumption of each heat pump
6COe3 COP of each heat pump
Cologne Demonstrator (6COe) RheinEnergie AG is promoting heat supply solutions in
the city. In the 80 and 90s the heat production was gas based only. In the last years RheinEnergie extended the sources for the heat production trying to use environmentally
o 2013 several technical facilities of this type were brought into service:methane projects (6,000 kW heat, 80 GWh bio-methane),
10 geothermal heating (heating power between 8-70 kW) 4 wood pellet projects (100 – 850 kW; 600 t p.a.)
heating systems (10 – 120 kW; collector surface 13 –
Thermo solar systems are used for water heating at our local heat supply sites. They have a smallish part of the whole energy consumption at the sites. In reference to the main issue of
large scale systems for urban heating and cooling – it is relevant to report abogeothermal heating project in Herler Carre, in the Cologne district Buchheim
on a 20,000 m2 plot. Three heat pumps are installed to use geothermal energy for heating. The residential complex will consist in its final state of about 250 apartments with
Yearly thermal energy production of each heat pump- MWht/year; Yearly gas and electric energy consumption of each heat pump- MWhe/year
pump- MWhe/year.
Unit of Measurement
Yearly thermal energy production of each heat pump MWht/year
Gas and electricity consumption of each heat pump MWh/year and MWhe/year
COP of each heat pump
74
AG is promoting heat supply solutions in local areas the heat production was gas based only. In the last years
ion trying to use environmentally o 2013 several technical facilities of this type were brought into service:
– 155 m2)
Thermo solar systems are used for water heating at our local heat supply sites. They have a smallish part of the whole energy consumption at the sites. In reference to the main issue of
levant to report about a Buchheim, where several
plot. Three heat pumps are installed to use geothermal energy for sist in its final state of about 250 apartments with
MWhe/year;
Unit of Measurement
MWh/year and MWhe/year

5. General KPIs General KPIs are of relevant importance in order to define common indicators which can summarize in a clear, measurable and communicable way the most important achievements of the Celsius project under the technical, economic, environmental and social poinAs reported in the previous paragraphs, the new demonstrators developed in the framework of the Celsius projects have their own specificities and objectives in relation to the specific backgrounds in which they have been conceived and implementeThe demonstrators cover different aspects related to the development of innovative large scale heating and cooling systems:
- Recovery of waste/renewable11GOe, 19GOe, 20GOe
- Storage and load control (GO1, LO2, RO1)- Development of ICT tools for the optimization of the energy management (RO1, GE1,
LO1) - New applications of the district heating for end- Expansion of the existing district heating network (LO3, RO1
Beyond the specific aspects analyzed for each implemented smart solution, all the demonstrators developed in the 5 cities of the project aim to significantly reduce COdecentralized energy and district heating and cooling networks anway. Therefore, a common strategy for evaluating impactthe learning from a diverse range of situations, that will be able to support other EU cities in the integration of smart and sustainabcooling systems in relation to the achievement of thereplication of the Celsius City Concept in other similar contexts.To achieve this objective, generic KPIs have been properly identified by following a bottomapproach, starting from the analysis of each specific demonstrator and then performing a comparative analysis aimed at highlighting common features of the different cases identified macro-categories of interest (energetic, environmental, economic and social).Once the new demonstrators will be in operation, generic KPIs will be calculated for each demonstrator based on the measurements from monitoring. 5.1 Energy indicators
• Yearly amount of thermal energy produced/provided by the new system; this indicator is aimed at providingdeveloped in the framework of the Celsius project. This parameter is orelevance especially for the economic evaluations, stated that economic are strictly connected to the
• Saved primary energy in comparison with baseline situationproviding an evaluation of business as usual situation;
• Energy efficiency of the projectthe yearly amount of thermal energy produced/provided by the demonstprimary energy used for the energy production;
General KPIs are of relevant importance in order to define common indicators which can summarize in a clear, measurable and communicable way the most important achievements of the
under the technical, economic, environmental and social poinAs reported in the previous paragraphs, the new demonstrators developed in the framework of the Celsius projects have their own specificities and objectives in relation to the specific backgrounds in which they have been conceived and implemented. The demonstrators cover different aspects related to the development of innovative large scale
/renewable energy (CO1, LO2, RO1, RO2, GE111GOe, 19GOe, 20GOe, 12COe, 6COe)
d control (GO1, LO2, RO1) Development of ICT tools for the optimization of the energy management (RO1, GE1,
New applications of the district heating for end-users (GO2, GO3, 29GOeExpansion of the existing district heating network (LO3, RO1, 36GOe
Beyond the specific aspects analyzed for each implemented smart solution, all the demonstrators developed in the 5 cities of the project aim to significantly reduce CO2decentralized energy and district heating and cooling networks and utilizing energy in an efficient
Therefore, a common strategy for evaluating impacts at project level is needed in order to enable the learning from a diverse range of situations, supporting the tracing of a Celsius City Roadmap
support other EU cities in the integration of smart and sustainabcooling systems in relation to the achievement of the EU targets, increasing the potential for replication of the Celsius City Concept in other similar contexts.
is objective, generic KPIs have been properly identified by following a bottomapproach, starting from the analysis of each specific demonstrator and then performing a comparative analysis aimed at highlighting common features of the different cases
categories of interest (energetic, environmental, economic and social).demonstrators will be in operation, generic KPIs will be calculated for each
he measurements from monitoring.
thermal energy produced/provided by the new system; this indicator at providing the size of the different projects, considering the
developed in the framework of the Celsius project. This parameter is orelevance especially for the economic evaluations, stated that economic are strictly connected to the size of the different projects; Saved primary energy in comparison with baseline situation; this indicator aims
evaluation of the effectiveness of the project business as usual situation; Energy efficiency of the project: this indicator will be calculated as the ratio between the yearly amount of thermal energy produced/provided by the demonst
used for the energy production; 75
General KPIs are of relevant importance in order to define common indicators which can summarize in a clear, measurable and communicable way the most important achievements of the
under the technical, economic, environmental and social point of view. As reported in the previous paragraphs, the new demonstrators developed in the framework of the Celsius projects have their own specificities and objectives in relation to the specific backgrounds
The demonstrators cover different aspects related to the development of innovative large scale
energy (CO1, LO2, RO1, RO2, GE1, 7GOe, 8GOe, 9GOe,
Development of ICT tools for the optimization of the energy management (RO1, GE1,
, 29GOe) , 36GOe)
Beyond the specific aspects analyzed for each implemented smart solution, all the demonstrators 2 emissions, developing
d utilizing energy in an efficient
at project level is needed in order to enable a Celsius City Roadmap
support other EU cities in the integration of smart and sustainable heating and EU targets, increasing the potential for
is objective, generic KPIs have been properly identified by following a bottom-up approach, starting from the analysis of each specific demonstrator and then performing a comparative analysis aimed at highlighting common features of the different cases under the
categories of interest (energetic, environmental, economic and social). demonstrators will be in operation, generic KPIs will be calculated for each
thermal energy produced/provided by the new system; this indicator the size of the different projects, considering the variety of cases
developed in the framework of the Celsius project. This parameter is of significant relevance especially for the economic evaluations, stated that economic performances
; this indicator aims at with reference to the
: this indicator will be calculated as the ratio between the yearly amount of thermal energy produced/provided by the demonstrator and the
• Share of waste/renewabledemonstrators recovering waste heat sources (heat from ventilation shaft and transformers at power pressurized natural gas, heat from the sewage networkcogeneration from wood chips, solar heat to district heating
5.2 Environmental indicators• Yearly GHG savings in comparison with the baseline situation• Yearly GHG emissions related to the project• Yearly reduction of pollutants• Yearly pollutants emission• Ecological and carbon
Footprints are aggregated indicators, aimed at quantifying with a single number the impact of a given product or service on the environment, considering its whole life cycle or part of it, in a way similar to what life cyclindicators have been selected as CELSIUS indicators: carbon footprint and footprint.
o Carbon footprintreleased to the atmosphere by an organization, a product or a person. As for the ecological footprint and LCA, some simplifications are needed. Carbon footprint is calculated as the relevant 100between carbon footprint and the other indicators proposed for assessing greenhouse emissions stays in the consideration (although in a simplified way) of indirect emiss(GHGs) can be emitted through transport, land clearance, and the production and consumption of food, fuels, manufactured goods, materials, wood, roads, buildings, and services.
o Ecological footprintor service) on Earth’s ecosystems in terms of biologically productive land and sea area necessary to feed (or to produce or to provide) it. footprint analysis compares a given system, product or service nature’s services with the biosphere's ability to regenerate resources and provide services. For a given service, it does this by assessing the biologically productive land and marine area required to build the machines needed to provide it in thabsorb the corresponding waste, using prevailing technology. Footprint values at the end of a survey are categorized for carbon, food, housing, and goods and services. capacities to produce and provide goods and services around the globe, an average value of productivity of the earth is considered and the “weight” of the given system, (gha). The rstandard, available on
Therefore, footprints will be calculated fwith particular care to the use of high impact materials (e.g. refrigerants) assessing country specific conversion factors.
/renewable energy: this indicator is particularly significant for all the demonstrators recovering waste heat sources (heat from ventilation shaft and transformers at power substation, heat from the urban waste incinerator, enthalpy in the pressurized natural gas, heat from the sewage network, cooling from river water, cogeneration from wood chips, solar heat to district heating, geothermal heating
Environmental indicators Yearly GHG savings in comparison with the baseline situation; Yearly GHG emissions related to the project; Yearly reduction of pollutants emission in comparison with baseline
s emission related to the project; Ecological and carbon footprint. Footprints are aggregated indicators, aimed at quantifying with a single number the impact of a given product or service on the environment, considering its whole life cycle or part of it, in a way similar to what life cycle analysis does. Tindicators have been selected as CELSIUS indicators: carbon footprint and
Carbon footprint measures the amount of greenhouse gases emissions released to the atmosphere by an organization, a product or a person. As for the ecological footprint and LCA, some simplifications are needed. Carbon footprint is calculated as the carbon dioxide equivalenrelevant 100-year global warming potential (GWP100). The difference between carbon footprint and the other indicators proposed for assessing greenhouse emissions stays in the consideration (although in a simplified way) of indirect emissions in providing the service: greenhouse gases (GHGs) can be emitted through transport, land clearance, and the production and consumption of food, fuels, manufactured goods, materials, wood, roads, buildings, and services. Ecological footprint, measuring the impact of a given system (or product or service) on Earth’s ecosystems in terms of biologically productive land and sea area necessary to feed (or to produce or to provide) it. footprint analysis compares a given system, product or service nature’s services with the biosphere's ability to regenerate resources and provide services. For a given service, it does this by assessing the biologically productive land and marine area required to build the machines needed to provide it in their life cycle, to provide the service itself and to absorb the corresponding waste, using prevailing technology. Footprint values at the end of a survey are categorized for carbon, food, housing, and goods and services. Since terrestrial and marine ecosyscapacities to produce and provide goods and services around the globe, an average value of productivity of the earth is considered and the “weight” of the given system, product or service is measured into “global hectares”
. The reference standard source of conversion factors will be the 2009 standard, available on www.footprintstandards.org
, footprints will be calculated for all the demonstrators, as regards their operation and with particular care to the use of high impact materials (e.g. refrigerants)
try specific conversion factors. 76
is particularly significant for all the demonstrators recovering waste heat sources (heat from ventilation shaft and
substation, heat from the urban waste incinerator, enthalpy in the , cooling from river water, , geothermal heating).
baseline situation;
Footprints are aggregated indicators, aimed at quantifying with a single number the impact of a given product or service on the environment, considering its whole life
e analysis does. Two of these indicators have been selected as CELSIUS indicators: carbon footprint and ecological
measures the amount of greenhouse gases emissions released to the atmosphere by an organization, a product or a person. As for the ecological footprint and LCA, some simplifications are needed. Carbon
carbon dioxide equivalent (CO2e) using the (GWP100). The difference
between carbon footprint and the other indicators proposed for assessing greenhouse emissions stays in the consideration (although in a simplified
ions in providing the service: greenhouse gases (GHGs) can be emitted through transport, land clearance, and the production and consumption of food, fuels, manufactured goods, materials,
the impact of a given system (or product or service) on Earth’s ecosystems in terms of biologically productive land and sea area necessary to feed (or to produce or to provide) it. Ecological footprint analysis compares a given system, product or service demand of nature’s services with the biosphere's ability to regenerate resources and provide services. For a given service, it does this by assessing the biologically productive land and marine area required to build the machines
eir life cycle, to provide the service itself and to absorb the corresponding waste, using prevailing technology. Footprint values at the end of a survey are categorized for carbon, food, housing, and
Since terrestrial and marine ecosystems have different capacities to produce and provide goods and services around the globe, an average value of productivity of the earth is considered and the “weight” of
product or service is measured into “global hectares” eference standard source of conversion factors will be the 2009
ors, as regards their operation and with particular care to the use of high impact materials (e.g. refrigerants) and where possible,
5.3 Economic indicatorsThe evaluation of the economic indicators will be perforby the demo responsible partners on the following cost category: intime, operating costs, maintenance costs, savings/revenues deriving from the operation of the demonstrator.
• Internal rate of return (IRR)• Net present value (NPV);• Yearly depreciation rate per kWh of saved primary energy• Yearly depreciation rate per ton of saved CO2e• Total cost (yearly depreciation rate + operating costs
energy; • Total cost (yearly depreciation + operating costs
All indicators shall be assessed both in presence and absence 5.4 Social indicators
• Number of residents/users benefitting of the new project• Reduction/increase of complaints due to the implementation of new system in
comparison with baseline situation• Variation of working
baseline situation; • Internal floor area served by the new syste
A table summarizing the identified general KPIs on energetic, environmental, economic and social aspects and the relative specific cases for which they are relevant is reported below
Economic indicators economic indicators will be performed based on the economic data provided
by the demo responsible partners on the following cost category: investment cost, depreciation time, operating costs, maintenance costs, savings/revenues deriving from the operation of the
e of return (IRR) of the new investment; (NPV);
Yearly depreciation rate per kWh of saved primary energy; Yearly depreciation rate per ton of saved CO2e;
(yearly depreciation rate + operating costs) per kWh of saved primary
cost (yearly depreciation + operating costs) per ton of saved CO2e
assessed both in presence and absence of the EU contribution.
Number of residents/users benefitting of the new project; Reduction/increase of complaints due to the implementation of new system in comparison with baseline situation; Variation of working hours per year for O&M of the new system in comparison with
nternal floor area served by the new system.
A table summarizing the identified general KPIs on energetic, environmental, economic and social aspects and the relative specific cases for which they are relevant is reported below
77
med based on the economic data provided vestment cost, depreciation
time, operating costs, maintenance costs, savings/revenues deriving from the operation of the
) per kWh of saved primary
) per ton of saved CO2e.
of the EU contribution.
Reduction/increase of complaints due to the implementation of new system in
per year for O&M of the new system in comparison with
A table summarizing the identified general KPIs on energetic, environmental, economic and social aspects and the relative specific cases for which they are relevant is reported below.
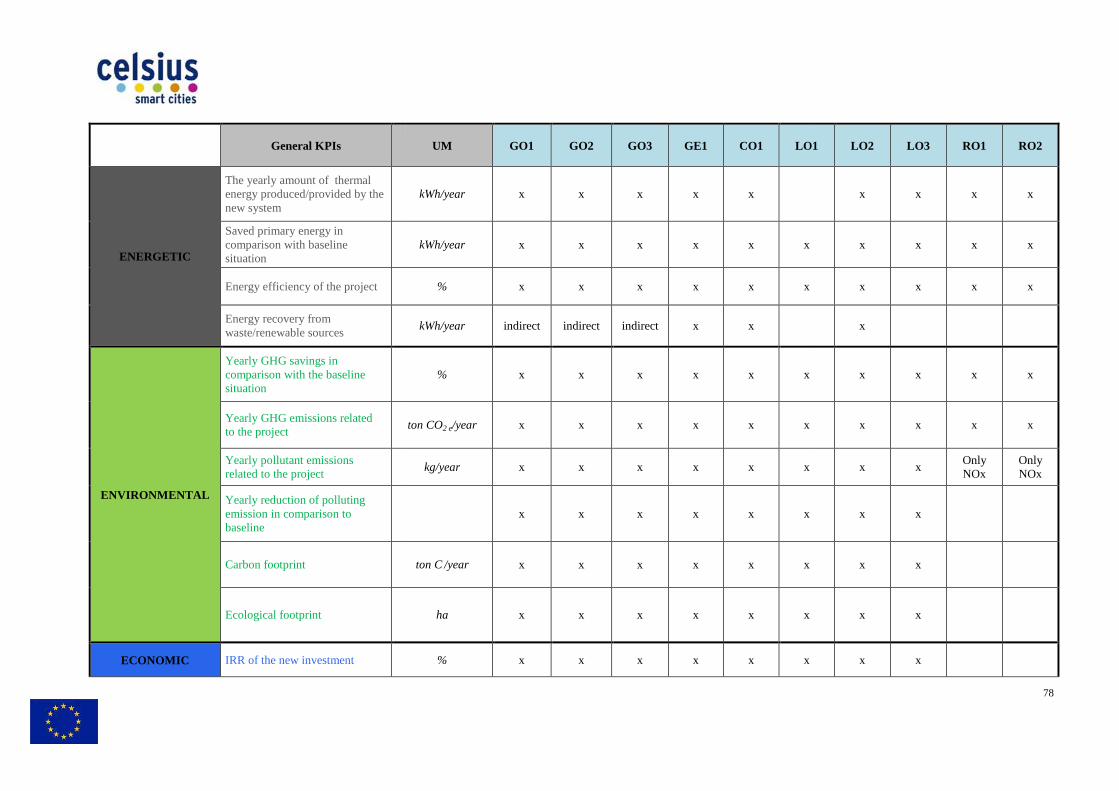
General KPIs
ENERGETIC
The yearly amount of thermal energy produced/provided by the new system
Saved primary energy in comparison with baseline situation
Energy efficiency of the project
Energy recovery from waste/renewable sources
ENVIRONMENTAL
Yearly GHG savings in comparison with the baseline situation
Yearly GHG emissions related to the project
Yearly pollutant emissions related to the project
Yearly reduction of polluting emission in comparison to baseline
Carbon footprint
Ecological footprint
ECONOMIC IRR of the new investment
UM GO1 GO2 GO3 GE1 CO1 LO1
kWh/year x x x x x
kWh/year x x x x x x
% x x x x x x
kWh/year indirect indirect indirect x x
% x x x x x x
ton CO2 e/year x x x x x x
kg/year x x x x x x
x x x x x x
ton C /year x x x x x x
ha x x x x x x
% x x x x x x
78
LO1 LO2 LO3 RO1 RO2
x x x x
x x x x
x x x x
x
x x x x
x x x x
x x Only NOx
Only NOx
x x
x x
x x
x x

Net present value
Yearly depreciation rate per kWh of saved primary energy
Yearly depreciation rate per ton of saved CO2e
Total cost (yearly depreciation rate + OPEX) per kWh of saved primary energy
Total cost (yearly depreciation + OPEX) per ton of saved CO2e
SOCIAL
Number of residents/users benefitting of the new project
Reduction/increase of complaints due to the implementation of new system in comparison with baseline situation
Variation of working hours per year for O&M of the new system in comparison with baseline situation
The internal floor area served by the new system
€ x x x x x x
€/kWh x x x x x x
€/t CO2e x x x x x x
€/kWh x x x x x x
€/t CO2e x x x x x x
x x x x x
x x x x x x
hours/year x x x x
m2 x x x x
Table 46- General KPIs for the Celsius project: new demonstrators
79
x x
x x
x x
x x
x x
x x
x x
x x
x x

General KPIs
ENERGETIC
The yearly amount of thermal energy produced/provided by the new system
Saved primary energy in comparison with baseline situation
Energy efficiency of the project
Energy recovery from waste/renewable sources
ENVIRONMENTAL
Yearly GHG savings in comparison with the baseline situation
Yearly GHG emissions related to the project
Yearly pollutant emissions related to the project
Yearly reduction of polluting emission in comparison to baseline
Carbon footprint ton C
Ecological footprint
ECONOMIC IRR of the new investment
UM 9GOe 29GOe 19GOe 11GOe 20GOe 8GOe
kWh/year x x x x x x
kWh/year x x x x x x
% x x x x x
kWh/year x x x x x x
% x x x x x x
ton CO2
e/year x x x x x x
kg/year x x x x x x
x x x x x x
ton C /year x x x x x x
ha x x x x x x
% x x x x x x
80
8GOe 7GOe 36GOe 12COe 6COe
x x x x x
x x x x x
x x x x x
x x x x x
x x x x x
x x x
x x x
x x x
x x x x x
x x x x x
x x x
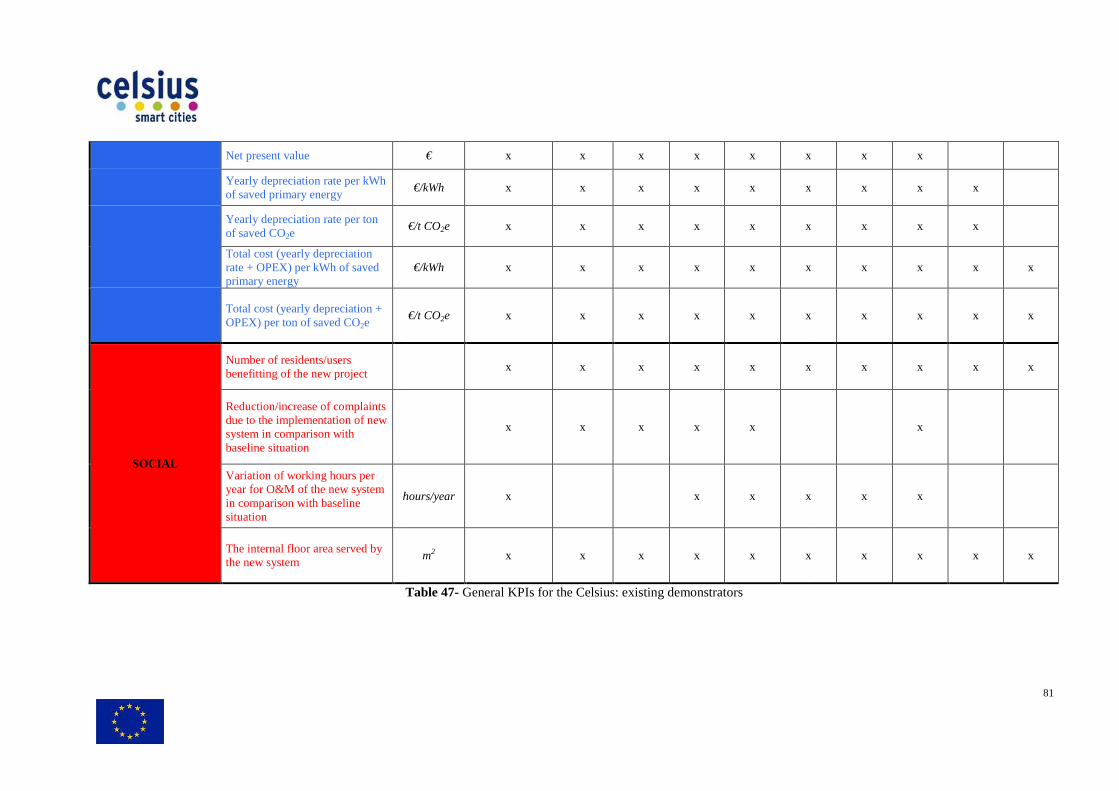
Net present value
Yearly depreciation rate per kWh of saved primary energy
Yearly depreciation rate per ton of saved CO2e
Total cost (yearly depreciation rate + OPEX) per kWh of saved primary energy
Total cost (yearly depreciation + OPEX) per ton of saved CO2e
SOCIAL
Number of residents/users benefitting of the new project
Reduction/increase of complaints due to the implementation of new system in comparison with baseline situation
Variation of working hours per year for O&M of the new system in comparison with baseline situation
hours/year
The internal floor area served by the new system
€ x x x x x x
€/kWh x x x x x x
€/t CO2e x x x x x x
€/kWh x x x x x x
€/t CO2e x x x x x x
x x x x x x
x x x x x
hours/year x x x x
m2 x x x x x x
Table 47- General KPIs for the Celsius: existing demonstrators
81
x x x
x x x x
x x x x
x x x x x
x x x x x
x x x x x
x
x x x
x x x x x
6. Conclusions The Celsius project aims at developing,cooling networks in cities by consistently contributing to the reduction of COprimary energy consumption. The project involves five different cities (Gothenburg, Cologne, Genoa, Loand foresees the realization and monitoring of 10 new demonstrators covering different aspects of energy efficient technologies, systems and practices.realized and operated during the Celsius included in the project, aimed at covering a wide range of statesolutions. Since the Celsius project aims to be a corner stone in the large scale deployment of smart cimonitoring the performance of the different demonstrators is essential in evaluating the transfer and replication potential of the most In this sense, the set-up of summarize the main achievements of the different demonstrators and communicate them to stakeholders, customers and public authorities in the most effective way. In the present document, the cKPIs has been defined and then applied to each specific case. In particular, the technical solutions implemented in each demonstrator have been analyzed in order to highlight the main ielements of concern, by identifying the correspondent business as usual situation.The application of the defined methodology has allowed the identification of environmental, economic and social KPIs Moreover, common generic KPIs have been properly identified by following a bottomapproach, aimed at highlighting the common features of a strategy for providing a quantitative evaluation of the impthe Celsius project.
The Celsius project aims at developing, optimizing and promoting smart decentralized heating and cooling networks in cities by consistently contributing to the reduction of CO
The project involves five different cities (Gothenburg, Cologne, Genoa, Loand foresees the realization and monitoring of 10 new demonstrators covering different aspects of energy efficient technologies, systems and practices. Besides the new demonstrators that will be
ing the Celsius project, existing energy efficient demonstrators are also included in the project, aimed at covering a wide range of state-of-the
Since the Celsius project aims to be a corner stone in the large scale deployment of smart cimonitoring the performance of the different demonstrators is essential in evaluating the transfer and replication potential of the most promising solutions in different European regions.
up of key-performance indicators is of crucial importance in order to summarize the main achievements of the different demonstrators and communicate them to stakeholders, customers and public authorities in the most effective way.
the common working methodology followed for the definition of the KPIs has been defined and then applied to each specific case. In particular, the technical solutions implemented in each demonstrator have been analyzed in order to highlight the main ielements of concern, by identifying the correspondent business as usual situation.The application of the defined methodology has allowed the identification of environmental, economic and social KPIs for each demonstrator included in th
generic KPIs have been properly identified by following a bottomapproach, aimed at highlighting the common features of all the different demonstrators
providing a quantitative evaluation of the impacts related to the implementation of
82
optimizing and promoting smart decentralized heating and cooling networks in cities by consistently contributing to the reduction of CO2 emission and of
The project involves five different cities (Gothenburg, Cologne, Genoa, London and Rotterdam) and foresees the realization and monitoring of 10 new demonstrators covering different aspects of
Besides the new demonstrators that will be energy efficient demonstrators are also
the-art energy efficient
Since the Celsius project aims to be a corner stone in the large scale deployment of smart cities, monitoring the performance of the different demonstrators is essential in evaluating the transfer
solutions in different European regions. performance indicators is of crucial importance in order to
summarize the main achievements of the different demonstrators and communicate them to
ommon working methodology followed for the definition of the KPIs has been defined and then applied to each specific case. In particular, the technical solutions implemented in each demonstrator have been analyzed in order to highlight the main innovative elements of concern, by identifying the correspondent business as usual situation. The application of the defined methodology has allowed the identification of specific energetic,
for each demonstrator included in the project. generic KPIs have been properly identified by following a bottom-up
demonstrators, setting-up acts related to the implementation of

Appendix List of acronyms B: Boiler BS: Building Substation CHP: Combined Heat and Power cogeneratorDH: District Heating DHM: District Heating Manager DR: Demand Response HH: Heat Hub IC: Incineration Company LV: Lamination Valves R: Room TE: Turbo Expander
List of symbols GE1 GB,i: Natural gas flow at each boiler, [NmGCHP: Natural gas flow at the cogenerator, [NmGTE: Natural gas flow at the turbo-expander, [NmGLV: Natural gas flow at the lamination valves, [NmQB,i: Heat flow at each boiler, [kWht] QCHP: Heat flow at the cogenerator, [kWht]QTE: Heat flow at the turbo expander, [kWht]QLV: Heat flow at the lamination valves, [kWht]QDH,j: Heat flow at the district heating, [kWht]QBS, k: Heat flow at the building substation, [kWht]QR, h: Heat flow at each room, [kWht] TeCHP: Stack temperature at CHP, [°C] TeB,i: Stack temperature at boilers, [°C] Text: External ambient temperature, [°C]PTE: Gross electric active (and apparent) power at turboPCHP: Gross electric active (and apparent) power at coCBS,k: Electric active (and apparent) energy for selfCTE: Electric active (and apparent) energy for selfCCHP: Electric active (and apparent) power selfT gas, DHM: Tariff for natural gas consumption paid by the network manT el, DHM: Tariff for the electricity consumption paid by the network manager, [T gas, end-users: Tariff for natural gas consumption paid by the final endT el, end-user: Selling price of electricity produced by the Tth, end-user: Tariff for thermal energy consumption paid by endMCHP: Maintenance cost of the CHP for the district heating network manager, MTE: Maintenance cost of the TE for the district heating network manager, [Eel grid: Emission factor for each considered pollutant based on the average Italian electric grid emission; [Kg/kWhe]EelCHP: : Emission factor for each considered EelTE: Emission factor for each considered pollutant related to electric energy produced by the turboEthCHP: Emission factor for each considered pollutant related to thermEboiler: Emission factor for each considered pollutant associate to existing gas fired boilers [kg/NmGb,i baseline: Gas consumption in existing boilers (i) the baseline situation [Nm GO1 Qmix, DH: District heating production mix, [MWh and % composition]Qloss, DH: Heat loss in the network, [kWht]CDH: Electricity consumption in distribution network pumps, [kWhe]Tein, 1: Internal temperature, [°C] Tein, 2: Internal temperature, [°C] Tein, 3: Internal temperature, [°C] Tein, 4: Internal temperature, [°C] Qb,i: Heat flow delivered to the building, [kWht]C,i: Electric energy consumption of control equipment, [kWhe]Te, ext: External temperature, [°C]
CHP: Combined Heat and Power cogenerator
: Natural gas flow at each boiler, [Nm3/h] Natural gas flow at the cogenerator, [Nm3/h]
expander, [Nm3/h] Natural gas flow at the lamination valves, [Nm3/h]
: Heat flow at the cogenerator, [kWht] : Heat flow at the turbo expander, [kWht] : Heat flow at the lamination valves, [kWht]
district heating, [kWht] : Heat flow at the building substation, [kWht]
Text: External ambient temperature, [°C]
active (and apparent) power at turbo-expander, [kWhe (kVArh)] : Gross electric active (and apparent) power at co-generator, [kWhe (kVArh)] : Electric active (and apparent) energy for self-consumption at the substations, [kWhe (kVAhr)]
ic active (and apparent) energy for self-consumption at the turbo-expander, [kWhe (kVAhr)]: Electric active (and apparent) power self-consumption at the cogenerator, [kWhe (kVAhr)]
: Tariff for natural gas consumption paid by the network manager, [€/Nm3] : Tariff for the electricity consumption paid by the network manager, [€/kWhe]
: Tariff for natural gas consumption paid by the final end-user, [€/Nm3] : Selling price of electricity produced by the network manager and sold to new end-users (if any), [: Tariff for thermal energy consumption paid by end-users connected to the new heating system, [
: Maintenance cost of the CHP for the district heating network manager, [€] : Maintenance cost of the TE for the district heating network manager, [€]
mission factor for each considered pollutant based on the average Italian electric grid emission; [Kg/kWhe]mission factor for each considered pollutant related to electric energy produced by CHP; [Kg/kWhe]
mission factor for each considered pollutant related to electric energy produced by the turbo-mission factor for each considered pollutant related to thermal energy produced by CHP: [kg/kWht]mission factor for each considered pollutant associate to existing gas fired boilers [kg/Nm
as consumption in existing boilers (i) the baseline situation [Nm3/year]
heating production mix, [MWh and % composition] : Heat loss in the network, [kWht]
: Electricity consumption in distribution network pumps, [kWhe]
: Heat flow delivered to the building, [kWht] : Electric energy consumption of control equipment, [kWhe]
83
consumption at the substations, [kWhe (kVAhr)] expander, [kWhe (kVAhr)]
users (if any), [€/kWhe] users connected to the new heating system, [€/kWht]
mission factor for each considered pollutant based on the average Italian electric grid emission; [Kg/kWhe] pollutant related to electric energy produced by CHP; [Kg/kWhe]
-expander; [kg/kWhe] al energy produced by CHP: [kg/kWht]
mission factor for each considered pollutant associate to existing gas fired boilers [kg/Nm3]
Tth, end-user: Tariff for thermal energy consumption paid by Tel, DHM: Tariff for the electricity consumption paid by the heat network manager, [Qbaseline: Thermal energy consumption in the baseline situation, [kWh/mTe,in baseline: average indoor temperature in the baseline situation, [°C] GO2 Qwg,i: Heat delivered to white goods, [kWht]Tein,j: Supply temperature, [°C] Teout,j: Return temperature, [°C] Cwg, j: Electricity use of white goods, [kWhe]Qmix, DH: District heating production mix, [MWhQloss, DH: Heat loss in the network, [%] CDH: Electricity use in the distribution network pumps, [kWhe]Nw, j: Number of washes, [-] tw: Time for a washing cycle, [Minutes]td: Time for a drying cycle, [Minutes] Tel, end-user: Tariff for electric energy consumption paid by the endTth, end-user: Tariff for thermal energy consumption paid by endEel grid: Emission factor for each considered pollutant based on the average SwedishEDHmix: Emission factor for each considered pollutant associated to the district heating mix; [kg/kWht]Cwg,i-baseline: electric energy consumption for machines (i) in the baseline situation GO3 Qsh: Heat delivered to ship from the district heating system, [kWht]Voil: Oil consumption in harbour for heating purposes, [lt]Voil,baseline: Oil consumption in the baseline situation, [lt]Te,ext: Outdoor temperature, [°C] Qmix, DH: District heating production mix, [MWht] and % compositionQloss, DH: Heat loss in the network, [%] CDH: Electricity use in the distribution network pumps, [kWhe]EDHmix: Emission factor for each considered pollutant associated to the district heating mix; [kg/kWht]Tel, DHM: Tariff for the electricity consumption paid by the district heating network manager, [Tth, end-user: Tariff for thermal energy consumption paid by the endM: Cost of maintenance of the new system, [Toil: Cost of bunker oil for ship, [€/lt] CO1 Chp, i: Electric energy consumption of the heat pumping system, [kWhe]C wp: Electric energy consumption of the wastewater pumping system, [kWhe]Vw: Wastewater flow rate through the heat exchanger, [NmTew in: Inlet wastewater temperature, [°C]Tew, out: Outlet wastewater temperature, [°C]Qhp, i: Heat flow at the heat pump, [kWht]Qst-dist, j: Heat flow between the storage system and the distribution mine, [kWht]Qdist, m: Heat flow at the distribution mine, [kWht]Ggas, k: Gas consumption, [Nm3/h] Lref: Refrigerant losses, [lt/year] Tth, end-user: Tariff for thermal energy consumption paid by civil end[€/kWht] Tgas, end-user: Tariff for natural gas consumptTgas, DHM: Tariff for natural gas consumption paid by the heat network manager, [Tel, DHM: Tariff for the electricity consumption paid by the network manager, [M: Maintenance cost for the network manGemission, k: Exhausted gas flow rate (Nmmg/Nm3) by the peak load boilers serving the Celsius sub LO1 GCHP: Use of natural gas, [Nm3/h] PCHP: Produced electricity during the event, [kWhe]QCHP: Thermal energy produced during the event, [kWht]QDH: Thermal energy used by the DH system during the event, [kWht]QLoss :Thermal losses during the event, [kWht]CCHP: Electricity used by the CHP out of
: Tariff for thermal energy consumption paid by civil end-users connected to the new system: Tariff for the electricity consumption paid by the heat network manager, [€/kWhe] : Thermal energy consumption in the baseline situation, [kWh/m2 year]
temperature in the baseline situation, [°C]
: Heat delivered to white goods, [kWht]
: Electricity use of white goods, [kWhe] : District heating production mix, [MWh and % distribution of each thermal source]
: Electricity use in the distribution network pumps, [kWhe]
tw: Time for a washing cycle, [Minutes]
: Tariff for electric energy consumption paid by the end-users, [€/kWhe] : Tariff for thermal energy consumption paid by end-users, [€/kWht]
: Emission factor for each considered pollutant based on the average Swedish electric grid emission; [Kg/kWhe]: Emission factor for each considered pollutant associated to the district heating mix; [kg/kWht]
: electric energy consumption for machines (i) in the baseline situation- kWhe
delivered to ship from the district heating system, [kWht] : Oil consumption in harbour for heating purposes, [lt]
: Oil consumption in the baseline situation, [lt]
x, [MWht] and % composition
: Electricity use in the distribution network pumps, [kWhe] : Emission factor for each considered pollutant associated to the district heating mix; [kg/kWht]
the electricity consumption paid by the district heating network manager, [€/kWhe]: Tariff for thermal energy consumption paid by the end-users connected to the new system, [
M: Cost of maintenance of the new system, [€]
: Electric energy consumption of the heat pumping system, [kWhe] : Electric energy consumption of the wastewater pumping system, [kWhe]
: Wastewater flow rate through the heat exchanger, [Nm3/h] wastewater temperature, [°C]
, out: Outlet wastewater temperature, [°C] : Heat flow at the heat pump, [kWht]
: Heat flow between the storage system and the distribution mine, [kWht] : Heat flow at the distribution mine, [kWht]
: Tariff for thermal energy consumption paid by civil end-users (schools, swimming pool) connected to the new
: Tariff for natural gas consumption paid by the final end-user, [€/Nm3] : Tariff for natural gas consumption paid by the heat network manager, [€/Nm3]
: Tariff for the electricity consumption paid by the network manager, [€/kWhe] M: Maintenance cost for the network manager, [€]
3/h) and polluting emission concentrations (CO2, CO, NOx, SO) by the peak load boilers serving the Celsius sub-project, [Nm3/h]
Produced electricity during the event, [kWhe] : Thermal energy produced during the event, [kWht]
: Thermal energy used by the DH system during the event, [kWht] :Thermal losses during the event, [kWht] : Electricity used by the CHP out of the DH normal system, [kWhe]
84
users connected to the new system, [€/kWht]
electric grid emission; [Kg/kWhe] : Emission factor for each considered pollutant associated to the district heating mix; [kg/kWht]
: Emission factor for each considered pollutant associated to the district heating mix; [kg/kWht] €/kWhe]
users connected to the new system, [€/kWht]
ing pool) connected to the new system,
, SOx, PM, PM10, PM2.5-
Preal,s: Real Power, [kW] Preal,s max: Max Real Power, [kW] Preal,s set: Real Power Point Set-Point, [kW]Preac, s: Reactive Power, [kVAr] Preac, s set: Reactive Power Set-Point, [kVAr]Vs: Voltage, [Volt] PFs: Power Factor, [Varying from -1 to 1]PFs max +: Max Positive Power Factor, [Varying from 0 to1]PFs max -: Max negative Power Factor, [Varying from I s: Current, [A] Fault,s: Major fault indications, [I/O] DR: DR availability, [kW] PrCHP: Real Power, [kW] VCHP: Voltage, [Volt] I CHP: Current, [A] PFCHP: Power Factor, [Varying from -1 to 1]Preac,CHP: Reactive Power, [kVar] FCHP: The fee guaranteed by the Distribution Network Operator (UKPN) to the co[€/each event] Fines: The fines paid by UKPN, [€] MCHP: The maintenance and operation extra LO2-LO3 Chp, A: Electric energy consumption of the heating pump system at the ventilation shaft, [kWhe]Peakhp, A: Peak demand, [kW] Cex, A: Electric energy consumption of the subway extraction system, [kWhe]Peakex, A: Peak demand, [kW] Teair,IN: Inlet air temperature at the heat exchanger, [°C]Teair,OUT: Outlet air temperature at the heat exchanger, [°C]Qhp, A: Heat flow at the heat pump system, [kWht]Qhe, A: Heat flow at the external heat exchanger, [kWht]Chp, B: Electric energy consumption of the heating pump system at the transformer, [kWhe]Peakhp, B: Peak demand, [kW] Tehp, IN: Oil inlet temperature at the heat pump exchanger, [°C]Tehp, OUT: Oil outlet temperature at the heat pump exchanger, [°C]Tecool, IN: Oil inlet temperature at cooling system, [°CTecool, OUT: Oil outlet temperature at cooling system, [°C]Voil,hp, B: Oil flow rate through the heat pump exchanger, [lt/sec]Voil,cool, B: Oil flow rate through the conventional cooler, [lt/sec]Q,hp B: Heat flow at the heat pump system, [kWht]Tth, end-user: Tariff for thermal energy consumption paid by the endMA: Maintenance cost for the ventilation shaft heating pump system, [MB: Maintenance cost for the transformer heating pump system, [MC: Maintenance cost for the thermal storage system, [Tel, DHM: Tariff for the electricity consumptio RO1 Qin: Incoming thermal energy, [kWht / GJ]Qout: Outcoming thermal energy, [kWht / GJ]Cpump: Electric energy consumption of buffer pump, [kWhe]Qbuffer: Thermal energy in and out of the buffer, [MWh] RO2 QWWTP,HH/QWWTP,WWTP: Thermal energy supplied by the heat hub to the WWTP, [kWht]QCHP,HH/QCHP,CHP: Thermal energy provided by the biogasQMen,HH / QMen,Men: Thermal energy provided by the heat hub to the 9GOe QCHP: Heat produced and delivered to the district heating, [MWht]PCHP: Electricity produced and delivered to the grid, [MWhe]CCHP: Electricity consumed internally, [MWhe]Vbiomass: Fuel (wood chips) consumed, [kg or MWh]
Point, [kW]
Point, [kVAr]
1 to 1] : Max Positive Power Factor, [Varying from 0 to1] : Max negative Power Factor, [Varying from -1 to 0]
1 to 1]
: The fee guaranteed by the Distribution Network Operator (UKPN) to the co-generator manager (BEC) during the event,
: The maintenance and operation extra-costs (paid by BEC) for the co-generator manager, [€/each event]
: Electric energy consumption of the heating pump system at the ventilation shaft, [kWhe]
: Electric energy consumption of the subway extraction system, [kWhe]
: Inlet air temperature at the heat exchanger, [°C] : Outlet air temperature at the heat exchanger, [°C]
Heat flow at the heat pump system, [kWht] : Heat flow at the external heat exchanger, [kWht] : Electric energy consumption of the heating pump system at the transformer, [kWhe]
he heat pump exchanger, [°C] : Oil outlet temperature at the heat pump exchanger, [°C] : Oil inlet temperature at cooling system, [°C
: Oil outlet temperature at cooling system, [°C] pump exchanger, [lt/sec]
: Oil flow rate through the conventional cooler, [lt/sec] : Heat flow at the heat pump system, [kWht]
: Tariff for thermal energy consumption paid by the end-user in buildings connected to the DH sys: Maintenance cost for the ventilation shaft heating pump system, [€] : Maintenance cost for the transformer heating pump system, [€] : Maintenance cost for the thermal storage system, [€]
: Tariff for the electricity consumption paid by the network manager (DHM), [€/kWhe]
: Incoming thermal energy, [kWht / GJ] : Outcoming thermal energy, [kWht / GJ]
: Electric energy consumption of buffer pump, [kWhe] : Thermal energy in and out of the buffer, [MWh]
: Thermal energy supplied by the heat hub to the WWTP, [kWht] : Thermal energy provided by the biogas-cofired cogenerator to the heat hub, [kWht]: Thermal energy provided by the heat hub to the Meneba grain processing plant, [kWht]
Heat produced and delivered to the district heating, [MWht]
Electricity produced and delivered to the grid, [MWhe] Electricity consumed internally, [MWhe]
Fuel (wood chips) consumed, [kg or MWh]
85
generator manager (BEC) during the event,
€/each event]
user in buildings connected to the DH system, [€/kWht]
[kWht] Meneba grain processing plant, [kWht]

Hbiomass: Energy content in fuel (wood chips), [MWh/kg]Te s, DH: Temperature of district heating supply [°C]Te r, DH: Temperature of district heating return [°C]Q baseline: Heat produced in coal boiler and deliveC baseline: Coal consumed before reconstruction, [ kg or MWh]H baseline: Energy content in fuel (coal), [MWh/kg]Qmix,DH: District heating production mix,I biofuel: Investment cost for the conversion of old coal plant into biofuel plant in 2004, [td, biofuel: Depreciation time of reconstruction/conversion equipment in 2004I CHP: Investment cost of combined heat and power equipment installed in 2010, [td, CHP: Depreciation time of CHP equipment in 2010, [years]Twood, DHM: Wood chips price, [€/kg or €/MWh]Tcoal, DHM: Coal price, during the same year considered for the wood chips price (e.g., 2013) [Sel, DHM: Selling price of produced electricitySth, DHM: Selling price of produced heat, [Oc: Operation costs, [€/year] M: Maintenance costs, [€/year] 29GOe Q agreem: Total thermal energy delivered by the district heating to buildings with agreementsQ agreem, ref-i: Thermal energy delivered to representative buildings with agreementsQ baseline, ref-i: District heating delivered to buildings before having signed the agreementsTe indoor, ref-i: Indoor temperatures, [°C] Qmix,DH: District heating production mix, [MWh and % composition]Nc: Number of customers, [Number] Atemp: Total floor area of buildings benefitting of the climate agreementsAtemp,ref: Floor area of five representative buildings benefitting of the climate agreements , [mI: Investment cost of equipment necessary for control in five representative buildings, [M: Operation and maintenance costs in five representative buildings, [td,ref: Depreciation time in five representative buildings , [years]Sv ref : Yearly savings for energy company in five representative buildings , [Tth, end-user: Tariff for thermal energy with climate agreements in five representative buildings, [Tth, end-user, baseline: Tariff for thermal energy (delivered to customer)agreements, [€/kWht] 19GOe Qc, DC: Cooling energy delivered by absorption chillers to district cooling networkTes, DC :District cooling network supply temperatureTer, DC: District cooling network return temperatureTes, DH: District heating supply temperatureTer, DH: District heating return temperature,Cc: Chillers’ electric energy consumptionQ DC: Total cooling energy produced at production facilitiesQ’ DC: Total cooling energy delivered at customers substationCDC: Electric energy consumption of the district cooling distribution networkR: Amount of refrigerants/chemicals usedQ mix, DH: District heating production mixQloss,DH: Heat loss in the district heating networkCDH:Electric energy consumption of the district heating distribution networkN: Number of customers connected to the cooling systemADC: Total floor area of buildings connected to the district Ic: Investment cost for absorption chillerstp,c: Depreciation time,[Years] Tel, DCM: Tariff paid by the district cooling network manager (DCM)for electric energy used forTth, DCM: Tariff paid by the district cooling network manager (DCM) for thermal energy consumption from district heatabsorption chillers, [€/MWht] M: Operation and maintenance costs, [€]IDC: Investment cost of district cooling networtp,DC: Depreciation time of district cooling networkM: Operation and maintenance cost of district cooling networkTDC, end user: Selling price of produced cold (to customer, average)
Energy content in fuel (wood chips), [MWh/kg]
Temperature of district heating supply [°C]
Temperature of district heating return [°C] Heat produced in coal boiler and delivered to the district heating before reconstruction [MWht]Coal consumed before reconstruction, [ kg or MWh] Energy content in fuel (coal), [MWh/kg]
District heating production mix, [MWh and % composition] : Investment cost for the conversion of old coal plant into biofuel plant in 2004, [€] : Depreciation time of reconstruction/conversion equipment in 2004- years
: Investment cost of combined heat and power equipment installed in 2010, [€] : Depreciation time of CHP equipment in 2010, [years]
€/kg or €/MWh] : Coal price, during the same year considered for the wood chips price (e.g., 2013) [€/kg or €/MWh]
tricity- [€/MWhe] : Selling price of produced heat, [€/MWht]
: Total thermal energy delivered by the district heating to buildings with agreements, [MWht]Thermal energy delivered to representative buildings with agreements, [MWht]
: District heating delivered to buildings before having signed the agreements, [MWht]
, [MWh and % composition]
benefitting of the climate agreements, [m2] : Floor area of five representative buildings benefitting of the climate agreements , [m2]
Investment cost of equipment necessary for control in five representative buildings, [€] M: Operation and maintenance costs in five representative buildings, [€/year]
: Depreciation time in five representative buildings , [years] Yearly savings for energy company in five representative buildings , [€]
: Tariff for thermal energy with climate agreements in five representative buildings, [€/kWht]Tariff for thermal energy (delivered to customer) in five representative buildings before having climate
: Cooling energy delivered by absorption chillers to district cooling network,[MWht] :District cooling network supply temperature, [°C]
cooling network return temperature, [°C] : District heating supply temperature, [°C] District heating return temperature, [°C]
: Chillers’ electric energy consumption, [MWhe] : Total cooling energy produced at production facilities, [MWht] : Total cooling energy delivered at customers substation, [MWht]
: Electric energy consumption of the district cooling distribution network, [MWhe] : Amount of refrigerants/chemicals used, [kg]
: District heating production mix, [MWht and % composition] : Heat loss in the district heating network, [%]
:Electric energy consumption of the district heating distribution network, [MWhe] : Number of customers connected to the cooling system, [Number]
ings connected to the district cooling network, [m2] : Investment cost for absorption chillers, [€]
Tariff paid by the district cooling network manager (DCM)for electric energy used for absorption chillersTariff paid by the district cooling network manager (DCM) for thermal energy consumption from district heat
€] : Investment cost of district cooling network, [€] : Depreciation time of district cooling network, [Years]
: Operation and maintenance cost of district cooling network, [€] : Selling price of produced cold (to customer, average), [€/MWht]
86
red to the district heating before reconstruction [MWht]
€/kg or €/MWh]
, [MWht]
€/kWht] in five representative buildings before having climate
absorption chillers, [€/MWhe] Tariff paid by the district cooling network manager (DCM) for thermal energy consumption from district heating used in

11GOe Q r,DC: Cooling energy delivered from river water to district cooling networkTe s, DC: District cooling network supply temperatureTe r, DC: District cooling network return temperatureTe s,river: Inlet temperature of river water in the heat exchangersTe r,river: Outlet temperature of river water from the heat exchangers,C r,DC: Electric energy consumption for pumping systems for the heat exchangersQ DC: Total cooling energy produced at production facilitiesQ’ DC: Total cooling energy delivered at customers substationsC DC: Electric energy consumption of the district cooling distribution networkN: Number of customers connected to district coolingA DC: Total cooled area of buildings connected to I f: Investment cost for river water district cooling facilities tp,c: Depreciation time, [years] Tel, DCM: Tariff paid for the electric energy consumptions by the district cooling network manager (DCM),M f: Operation and maintenance cost of river water district cooling facilities,IDC: Investment cost of district cooling network tp,DC: Depreciation time of district cooling networkMDC: Operation and maintenance cost of district cooling networkTth, end user:Selling price of produced cold (to customer, average) 20GOe Ts,SC: Supply temperature of hot water, QSC: Heat production, [MWht] TS,DH: DH supply temperature, [°C] TR,DH: DH return temperature, [°C] Acoll: Collector area, [m²] Dir: Direction, [(point of compass)] Deg: Tilt angle, [°] C: Electric energy consumption, [MWhe]I: Investment costs, [€] M: Maintenance costs, [€] Oc: Operating costs, [€/year] Tth,end-user: Tariff for heat consumption paid by the end 8GOe Qinc: Heat produced at the waste incinerator plant, [MWht]Qmix, DH: Total heat produced by the DH system, [MWht]Pinc: Electric energy production, [MWhe]Cinc: Internal consumption of electric energy, [MWhe]Vwaste: Amount of waste incinerated, [tonHwaste: Energy content of waste, [MWh/kg]I: Investment costs, [€] M: Maintenance costs, [€] Oc: Operating costs (including costs/revenue for waste), [Tth,end-user: Tariff for thermal energy consumption paid by the end 7GOe Q rec,DH: Amount of waste heat recovered at each site, [MWht]Twaste: Waste heat temperature, [°C] Q mix,DH: Total heat production of district heating system, [MWht]Tes,DH: District heating supply temperature, [°C]Ter,DH: District heating return temperaturL pipe: Pipe length, [m] I: Investment costs, [€] M: Maintenance costs, [€] Oc: Operating costs (including costs/revenue for waste), [Fth, DHM: Fee paid by the district heating manager (DHM) for waste heat recovery, [Tth,end-user: Tariff for thermal energy consumption paid by the end 36GOe Qf, DH: Thermal energy production at each facility, [MWht]Q sector, DH: Thermal energy delivered to customers, per
from river water to district cooling network, [MWht] : District cooling network supply temperature, [°C] : District cooling network return temperature, [°C] : Inlet temperature of river water in the heat exchangers, [°C] Outlet temperature of river water from the heat exchangers, [°C]
: Electric energy consumption for pumping systems for the heat exchangers, [MWhe] : Total cooling energy produced at production facilities, [MWht] : Total cooling energy delivered at customers substations, [MWht]
: Electric energy consumption of the district cooling distribution network, [MWhe] : Number of customers connected to district cooling
: Total cooled area of buildings connected to district cooling, [m2] : Investment cost for river water district cooling facilities , [€]
Tariff paid for the electric energy consumptions by the district cooling network manager (DCM),and maintenance cost of river water district cooling facilities, [€]
: Investment cost of district cooling network , [€] : Depreciation time of district cooling network, [years] : Operation and maintenance cost of district cooling network, [€]
:Selling price of produced cold (to customer, average), [€/MWht]
upply temperature of hot water, [°C]
C: Electric energy consumption, [MWhe]
: Tariff for heat consumption paid by the end-users, [€/kWht]
: Heat produced at the waste incinerator plant, [MWht] : Total heat produced by the DH system, [MWht]
: Electric energy production, [MWhe] : Internal consumption of electric energy, [MWhe]
: Amount of waste incinerated, [tons] : Energy content of waste, [MWh/kg]
Oc: Operating costs (including costs/revenue for waste), [€/year] : Tariff for thermal energy consumption paid by the end-users, [€/kWht]
: Amount of waste heat recovered at each site, [MWht]
: Total heat production of district heating system, [MWht] : District heating supply temperature, [°C] : District heating return temperature, [°C] Chp:Electric energy consumptions of the heat pumps, [MWhe]
Oc: Operating costs (including costs/revenue for waste), [€/year] manager (DHM) for waste heat recovery, [€/MWht]
: Tariff for thermal energy consumption paid by the end-users, [€/kWht]
: Thermal energy production at each facility, [MWht] : Thermal energy delivered to customers, per sector, [MWht]
87
Tariff paid for the electric energy consumptions by the district cooling network manager (DCM), [€/MWhe]
:Electric energy consumptions of the heat pumps, [MWhe]

QCHP, i: Electric energy production at each CHP facility, [MWhe]Te ext: Outdoor temperature, [°C] Q primary, DH: Primary energy input at each production facility, [MWh (or other relevant unit depending on type of energy)]Tes,DH: District heating supply temperature, [°C]Ter,DH: District heating return temperature, [°C]Cf, DH: Electric energy consumption, [MWheL pipe: Pipe length, [km] Tth, end-user: Tariff for heat consumption paid by the M: Maintenance costs, [€] O c: Operating costs, [€] Rth: Revenues from sold thermal energy for the district heating network manager, [I yearly: Yearly investment, [€] Nc: Number of users/customers in different sectors, [ 12 COe QCHP: Thermal energy produced by the CHP; [MWht]PCHP Electric energy produced by the CHP and delivered to the grid; [MWhe]CCHP: Electric energy consumed by the CHO; [MWhe];Vgas : Biogas/gas consumption Oc: Operating costs; [€] Dc: Depreciation costs [€]
6COe- Energetic parameters Qhp,i: Thermal energy produced by each heat pump; [Vgas,i: Gas consumption of each heat pump; [Chp,i: Electric energy consumption of each heat pump; [Oc: Operating costs; [€] Dc: Depreciation costs [€]
: Electric energy production at each CHP facility, [MWhe]
: Primary energy input at each production facility, [MWh (or other relevant unit depending on type of energy)]heating supply temperature, [°C]
: District heating return temperature, [°C] MWhe]
r heat consumption paid by the end-users, [€/kWht]
: Revenues from sold thermal energy for the district heating network manager, [€]
: Number of users/customers in different sectors, [-]
: Thermal energy produced by the CHP; [MWht] Electric energy produced by the CHP and delivered to the grid; [MWhe]
: Electric energy consumed by the CHO; [MWhe];
rgy produced by each heat pump; [MWht] s consumption of each heat pump; [MWh]
consumption of each heat pump; [MWhe]
88
: Primary energy input at each production facility, [MWh (or other relevant unit depending on type of energy)]
Top Related