


Languages
Pages
Legal


FINAL REPORT
Current understanding of the impact of CDR approaches in LAC | 1
Current understanding of the potential impacts of Carbon Dioxide Removal approaches on the SDGs in selected countries in Latin America and the
Caribbean
Final Report Joseluis Samaniego Kai-Uwe Schmidt Hernán Carlino Luciano Caratori Micaela Carlino Agustín Gogorza Alfonso Rodríguez Vagaría Gabriel Vázquez Amábile

ECLACPublications
Thank you for your interest in
this ECLAC publication
Please register if you would like to receive information on our editorial
products and activities. When you register, you may specify your particular
areas of interest and you will gain access to our products in other formats.
www.cepal.org/en/publications
Publicaciones www.cepal.org/apps

FINAL REPORT
Current understanding of the impact of CDR approaches in LAC | 2
Current understanding of the potential impact of Carbon Dioxide Removal approaches on SDGs in selected countries in Latin America and the Caribbean. Final Report.
This document was produced under the coordination of Joseluis Samianego, of the Economic Commission for Latin America and the Caribbean (ECLAC) and Kai-Uwe Schmidt, of the Carnegie Climate Governance Initiative (C2G). Hernán Carlino, Luciano Caratori, Micaela Carlino, Agustín Gogorza, Alfonso Rodríguez Vagaría and Gabriel Vázquez Amábile, from the Torcuato Di Tella Foundation participated in its elaboration. The authors thank the following people for their comments, suggestions, revisions and contributions to the document: Estefani Rondón, José Javier Gómez and Jimy Ferrer, from ECLAC, Nicholas Harrison, Alia Hassan and Michael Thompson, from C2G. This report was funded by C2G, an initiative of the Carnegie Council for Ethics and International Affairs and produced in collaboration with ECLAC and the Euroclima+ Program.
Disclaimer
The views expressed in this document, which has been reproduced without formal editing, are those of the authors and do not necessarily reflect the views of ECLAC or C2G. The boundaries and names shown on the maps included in this publication do not imply official acceptance or endorsement by the United Nations. This publication may be reproduced in whole or in part and in any form for education or non-profit
purposes without special permission from C2G or ECLAC, provided acknowledgement or proper referencing of the source is made.
Copyright © CCEIA/C2G and United Nations, 2021 ECLAC symbol: LC/TS.2021/83
Citation Samaniego, Schmidt, Carlino and others, “Current understanding of the potential impact of Carbon Dioxide Removal approaches on the SDGs in selected countries in Latin America and the Caribbean.
Final Report”, Carnegie Climate Governance Initative (C2G)/ Economic Commission for Latin America and the Caribbean (ECLAC), March 2021.

FINAL REPORT
Table of contents
Current understanding of the impact of CDR approaches in LAC | 3
Table of contents
—
List of tables 7
List of Figures 9
List of Acronyms 11
PART I – OVERVIEW 12
I. Introduction 12
II. Methodological approach 18
III. Key Findings of the study 20
IV. Limitations of the analysis 48
V. Recommendations 50
1. Background ................................................................... 12
2. Categories of CDR approaches ..................................... 13
3. Selected Countries in LAC............................................. 16
4. Activities undertaken ................................................... 17
1. Context ......................................................................... 20
2. Assessment of knowledge, planning and implementation gaps.............................................................. 23
3. Impact Analysis of CDR Implementation ...................... 37

FINAL REPORT
Table of contents
Current understanding of the impact of CDR approaches in LAC | 4
PART II – ANALYSIS 56
I. Current status of knowledge and development 56
Afforestation and reforestation 63
Bioenergy with carbon capture and storage (BECCS) 75
Enhancing soil carbon content and Enhancing soil carbon content with biochar 100
Enhanced weathering or ocean alkalinisation 106
Direct air carbon dioxide capture and storage 110
Ocean fertilization 111
Other initiatives related to bioenergy generation that may provide a basis for further BECCS development 112
Afforestation and reforestation 123
Bioenergy with carbon capture and storage (BECCS) 143
Enhancing soil carbon content and Enhancing soil carbon content with biochar 156
Enhanced weathering or ocean alkalinization 162
Direct air carbon dioxide capture and storage 165
Ocean fertilization 166
Other CDR approaches in Colombia 166
Other initiatives related to bioenergy generation that may provide a basis for further BECCS development 167
Afforestation and reforestation 172
Bioenergy with carbon capture and storage (BECCS) 175
1. Argentina .......................................................................57
2. Colombia .....................................................................116
3. Latin American and Caribbean Countries ...................172

FINAL REPORT
Table of contents
Current understanding of the impact of CDR approaches in LAC | 5
Enhancing soil carbon content (ESCC) and Enhancing soil carbon content with biochar 178
Enhanced weathering or ocean alkalinization 188
Direct air carbon dioxide capture and storage 188
Other CDR approaches 189
II. Impact Analysis 190
Afforestation and reforestation 194
Bioenergy with carbon capture and storage (BECCS) 202
Enhancing soil carbon content with biochar 215
Afforestation and reforestation 220
Bioenergy with carbon capture and storage (BECCS) 232
Enhancing soil carbon content with biochar 245
Afforestation and reforestation 250
Bioenergy with carbon capture and storage (BECCS) 251
Enhancing soil carbon content with biochar 252
III. References 254
Annex: BECCS - Cost estimation 270
Bioenergy with carbon capture and storage (BECCS) - Cost Estimation - Argentina 270
1. Methodology for Impact Analysis .............................. 190
2. Argentina .................................................................... 194
3. Colombia .....................................................................220
4. Potential Impacts in LAC countries .............................250
5. Limitations of the analysis...........................................253

FINAL REPORT
Table of contents
Current understanding of the impact of CDR approaches in LAC | 6
Bioenergy with carbon capture and storage (BECCS) - Cost Estimation - Colombia 272

FINAL REPORT
Table of contents
Current understanding of the impact of CDR approaches in LAC | 7
List of tables Table 1: CDR Approaches covered by IPCC ........................................................................................................ 15 Table 2: Scales by assessment dimension .......................................................................................................... 27 Table 3: Argentina - Current Status of Knowledge and Development -Scoring Methodology .......................... 28 Table 4: Colombia - Current Status of Knowledge and Development -Scoring Methodology........................... 29 Table 5: Impact of CDR deployment on key variables – Argentina .................................................................... 39 Table 6: Impact of CDR deployment on key variables – Colombia .................................................................... 40 Table 7: Potential Impacts on SDGs in LAC countries* ...................................................................................... 43 Table 8: Potential Constraints, impacts and risks of CDR approaches in LAC countries * ................................. 45 Table 9: Argentina - Current Status of Knowledge and Development -Scoring Methodology .......................... 59 Table 10: Renovar Biomass Projects awarded ................................................................................................... 82 Table 11: Renovar Biogas Projects awarded ...................................................................................................... 83 Table 12: Renovar Biogas landfill projects awarded .......................................................................................... 85 Table 13: Current biogas and biomass power plants, September 2020 ............................................................ 90 Table 14: Programmed new biomass and biogas power plants, September 2020 ........................................... 91 Table 15: Largest Bioethanol plants in Argentina (not exhaustive) ................................................................. 114 Table 16: Largest Biodiesel plants in Argentina ............................................................................................... 115 Table 17: Colombia - Current Status of Knowledge and Development -Scoring Methodology ...................... 119 Table 18: Mangrove area in Colombia by deopartment .................................................................................. 135 Table 19: Energy potential of crop residues..................................................................................................... 148 Table 20: Energy potential of cattle residues ................................................................................................... 149 Table 21: Energy potential of other residues ................................................................................................... 149 Table 22: Current bioenergy combined heat and power capacity, September 2020 ...................................... 152 Table 23: Registered biomass project in UPME (as for Week 24 of 2020) ...................................................... 153 Table 24: Soil final assessment, after a 45-day incubation period................................................................... 158 Table 25: Maize assessment, after 90 days of sowing ..................................................................................... 158 Table 26: Effects for different biochar doses ................................................................................................... 161 Table 27: Biodiesel plants in Colombia - Installed Capacity ............................................................................. 169 Table 28: Bioethanol plants in Colombia - Installed Capacity .......................................................................... 171 Table 29: Comparison of growth rates by Scenario - Cultivated Forest Area - Argentina ............................... 199 Table 30: Investment by scenario for Afforestation in Argentina.................................................................... 199 Table 31: Density values and annual growth rates by species for Argentina .................................................. 200 Table 32: Impact analysis of Afforestation in Argentina .................................................................................. 202 Table 33: Configuration of BECCS Scenarios for Argentina .............................................................................. 204 Table 34: Comparison of growth rates by Scenario - Bionergy Installed Capacity - Argentina ....................... 209 Table 35: Key BECCS scenario metrics for Argentina ....................................................................................... 210 Table 36: Investment by scenario for BECCS in Argentina ............................................................................... 211 Table 37: Summary of key BECCS emission scenario results in Argentina....................................................... 212 Table 38: Impact analysis of BECCS deployment in Argentina ......................................................................... 214 Table 39: Share per type of crop - Year 2018 - Argentina ................................................................................ 215 Table 40: Investment by scenario for Biochar in Argentina ............................................................................. 218 Table 41: Impact analysis of Biochar deployment in Argentina ....................................................................... 219 Table 42: Comparison of growth rates by Scenario - Cultivated Forest Area - Colombia ............................... 225 Table 43: CAPEX and OPEX - Cultivated Forest Area - Colombia - Year 2018 .................................................. 226

FINAL REPORT
Table of contents
Current understanding of the impact of CDR approaches in LAC | 8
Table 44: Investment by scenario for Afforestation in Colombia .................................................................... 226 Table 45: Impact analysis of Afforestation in Colombia................................................................................... 228 Table 46: Investment by scenario for Mangrove Restoration in Colombia ..................................................... 230 Table 47: Above Ground Biomass (AGB) growth rates for Mangrove Restoration in Colombia ..................... 231 Table 48: Impact analysis of Mangrove restoration in Colombia .................................................................... 232 Table 49: Configuration of BECCS Scenarios for Colombia .............................................................................. 234 Table 50: Comparison of growth rates by Scenario - Bioenergy Installed Capacity - Colombia ...................... 239 Table 51: Key BECCS scenario metrics for Colombia ........................................................................................ 240 Table 52: Investment by scenario for BECCS in Colombia ............................................................................... 241 Table 53: Summary of key BECCS emission scenario results in Colombia ....................................................... 242 Table 54: Impact analysis of BE/BECCS deployment in Colombia .................................................................... 244 Table 55: Investment by scenario for Biochar in Colombia ............................................................................. 248 Table 56: Impact analysis of Biochar deployment in Colombia ....................................................................... 249 Table 57: Key potential impacts of Afforestation in LAC countries ................................................................. 250 Table 58: Key potential impacts of BECCS in LAC countries ............................................................................. 251 Table 59: Key potential impacts of Biochar in LAC countries ........................................................................... 252 Table 60: Key BECCS LCOE calculation inputs and results for Argentina ......................................................... 270 Table 61: Summary of Carbon Avoidance Costs associated with BECCS in Argentina - Full LCOE .................. 271 Table 62: Summary of Carbon Avoidance Costs associated with BECCS in Argentina - Only CAPEX LCOE ..... 271 Table 63: Key BECCS LCOE calculation inputs and results for Colombia .......................................................... 272 Table 64: Summary of Carbon Avoidance Costs associated with BECCS in Colombia - Full LCOE ................... 272 Table 65: Summary of Carbon Avoidance Costs associated with BECCS in Colombia - Only CAPEX LCOE ...... 273

FINAL REPORT
Table of contents
Current understanding of the impact of CDR approaches in LAC | 9
List of Figures Figure 1: Chronology of pieces of knowledge identified in Argentina (2010-2020 period)............................... 36 Figure 2: Chronology of pieces of knowledge identified in Colombia (2010-2020 period) ............................... 36 Figure 3: Suggested Phasing of CDR Large-Scale Deployment in LAC countries ................................................ 51 Figure 3: Afforestation and reforestation related regulations, plans and programmes implemented in Argentina - Timeline ........................................................................................................................................... 63 Figure 4: "Wood and Furniture" and "Wood Construction" axes of ForestAr 2030 plan .................................. 67 Figure 5: BECCS related regulations, plans and programmes implemented in Argentina - Timeline ............... 75 Figure 6: Renovar PPA prices by technology ...................................................................................................... 82 Figure 7: Installed capacity by source, 2015- September 2020 ......................................................................... 86 Figure 8: Detail of installed capacity from bioenergy sources, 2015- September 2020 .................................... 87 Figure 9: Power generation by source, 2015- September 2020 ........................................................................ 88 Figure 10: Detail of Power generation from bioenergy sources, 2015- September 2020 ................................. 89 Figure 11: Most recent auction prices for Biomass PPAs (2017-2018). ............................................................. 93 Figure 12: Most recent auction prices for Biogas PPAs (2017-2018). ................................................................ 93 Figure 13: Other biomass resources CDR approaches related to regulations, plans and programmes implemented in Argentina - Timeline ................................................................................................................ 94 Figure 14: Annual change in biochar carbon stock in mineral soils receiving biochar .................................... 101 Figure 15: Diagram of the main sources of emission in Argentina (arrows up, pink colour) and capture or sink of CO2 (light blue colour), according to their origins, in Tg (1012 g) carbon. .................................................. 107 Figure 16: Afforestation and reforestation related regulations, plans and programmes implemented in Colombia - Timeline .......................................................................................................................................... 123 Figure 17: Causes of deterioration identified in the mangroves of Colombia at the departmental level ....... 136 Figure 18: Latest mangrove zoning in Colombia, according to INVEMAR (2014) and to the central Government...................................................................................................................................................... 137 Figure 19: Map of Location of mangrove coverage and Population density ................................................... 138 Figure 20: Bio mass C growth curve of mangrove trees and mangrove shrub scrub. ..................................... 139 Figure 21: Average potential CO2e removal rate (t CO2e y-1)) from mangrove restoration in Colombia ...... 139 Figure 22: Above-ground biomass (Agb), below-ground biomass (Bgb), height (H), and basal area (BA) of mangrove forests at several locations in the tropical zone ............................................................................. 141 Figure 23: BECCS related regulations, plans and programmes implemented in Colombia - Timeline ............ 143 Figure 24: Installed capacity by source, 2015- September 2020 ..................................................................... 150 Figure 25: Detail of installed capacity from bioenergy sources, 2015- September 2020 ................................ 150 Figure 26: Power generation by source, 2015- September 2020 .................................................................... 151 Figure 27: Detail of Power generation from bioenergy sources, 2015 - September 2020 .............................. 152 Figure 28: Biochar effects on germination and root length ............................................................................. 159 Figure 29: Map of biodiesel production plants ................................................................................................ 170 Figure 30: Map of biodiesel production plants ................................................................................................ 171 Figure 31: Status and trends in mangrove area – South America (1980–2005) .............................................. 174 Figure 32: Mangrove species composition in South American countries ........................................................ 175 Figure 33: Land use change study location ...................................................................................................... 180 Figure 34: Tillage study sites ............................................................................................................................ 181 Figure 35: Effect on SOC study sites ................................................................................................................. 185 Figure 36: Sites analyzed by Abdallah et al., 2018 ........................................................................................... 187

FINAL REPORT
Table of contents
Current understanding of the impact of CDR approaches in LAC | 10
Figure 37: Main Regions of Native Forest in Argentina ................................................................................... 195 Figure 38: Historical cultivated forest area in Argentina ................................................................................. 196 Figure 39: Characterization of Cultivated forest area in Argentina ................................................................. 196 Figure 40: Historical wood value chain employment in Argentina .................................................................. 197 Figure 41: Scenarios of cultivated forest area in Argentina (2020-2050) ........................................................ 198 Figure 42: Balance of CO2 by Scenarios of cultivated forest area in Argentina (2020-2050) .......................... 201 Figure 43: Historical Power Installed Capacity (MW) and Power Generation (GWh) in Argentina ................. 202 Figure 44: Historical power generation employment in Argentina ................................................................. 203 Figure 45: Power generation by source for 2020, 2030 and 2050 under the described scenarios. Argentina 207 Figure 46: Scenarios of bionergy installed capacity in Argentina (2020-2050)................................................ 208 Figure 47: Scenarios of Biochar application area in Argentina (2020-2050) ................................................... 216 Figure 48: Scenarios of forecasted C Sequestration - Biochar (2020-2050) .................................................... 219 Figure 49: Historical cultivated forest area in Colombia .................................................................................. 221 Figure 50: Characterization of cultivated forest area in Colombia (Year 2019)............................................... 222 Figure 51: Map of Zones with Aptitude for Forest Plantations with Commercial Purposes ........................... 223 Figure 52: Historical forestry employment in Colombia .................................................................................. 224 Figure 53: Scenarios of forecasted cultivated forest area in Colombia (2020-2050) ...................................... 225 Figure 54: Balance of CO2 by Scenarios of cultivated forest area in Colombia (2020-2050) .......................... 227 Figure 55: Mangrove distribution in the Pacific (left) and Caribbean coasts (right) of Colombia ................... 229 Figure 56: Scenarios of forecasted Mangrove Restoration area in Colombia (2020-2050) ............................. 230 Figure 57: Scenarios of C Sequestration - Mangrove Restoration - Colombia (2020-2050) ............................ 231 Figure 58: Historical Power Installed Capacity (MW) and Power Generation (GWh) in Colombia ................. 233 Figure 59: Power generation by source for 2020, 2030 and 2050 under the described scenarios. Colombia 237 Figure 60: Scenarios of Bioenergy Installed Capacity in Colombia (2020-2050).............................................. 238 Figure 61: Historical Fruit Tree Planted Area in Colombia ............................................................................... 245 Figure 62: Historical Vegetables, Legumes and Tubers Planted Area in Colombia ......................................... 246 Figure 63: Scenarios of forecasted Biochar application area in Colombia (2020-2050) .................................. 247 Figure 64: Scenarios of C Sequestration - Biochar (2020-2050)....................................................................... 249

FINAL REPORT
Acronyms
Current understanding of the impact of CDR approaches in LAC | 11
List of Acronyms
AFOLU: Agriculture, Forestry and Other Land Use
AR: Afforestation and Reforestation
BAU: Business as Usual
BE: Bioenergy
BECCS: Bioenergy with Carbon Capture and Storage
C2G: Carnegie Climate Governance Initiative
CAGR: Compound Annual Growth Rate
CAPEX: Capital Expenditures
CBD: Convention on Biological Diversity
CCS: Carbon Capture and Storage
CDR: Carbon Dioxide Removal
CO2: Carbon Dioxide
DACCS: Direct Air Carbon Dioxide Capture and Storage 1
ECLAC: Economic Commission for Latin America and the Caribbean
EW: Enhanced Weathering
GDP: Gross Domestic Product
GHG: Greenhouse Gases
GW: GigaWatts
GWh: GigaWatts hours
ha: hectares
IPCC: Intergovernmental Panel on Climate Change
LAC: Latin American and the Caribbean
LCOE: Levelized Cost of Energy
LUC: Land Use Change
LULUCF: Land use, land-use change, and forestry
MM: Millions
B: Billion
MW: MegaWatts
MSW: Municipal Solid Waste
NDC: Nationally Determined Contributions
NET: Negative Emissions Technologies
OPEX: Operational Expenditures
O&M: Operation and Maintenance
SDG: Sustainable Development Goals
t: tons
tCO2eq: tons of carbon dioxide equivalent
TORs: Terms of Reference
TWh: TeraWatts hours
UN: United Nations
UNEP: United Nations Environment Programme
1 Also known as direct air capture and storage (DACS)

FINAL REPORT
I. Introduction
Current understanding of the impact of CDR approaches in LAC | 12
PART I – OVERVIEW
I. Introduction
1. Background
This is the final report of the study “Current understanding of the potential impact of Carbon
Dioxide Removal (CDR) approaches on Sustainable Development Goals (SDGs) in selected
countries in Latin America and the Caribbean”.
The objective of this study is to identify and select four Carbon Dioxide Removal (CDR)
approaches that may be the most relevant to the LAC region/context, and conduct, when
possible, an analysis on the potential economic, social and environmental impacts (positive
and/or negative) that the introduction of those CDR approaches could have, in terms of a set of
key indicators: Employment; GDP (Gross Domestic Product); costs; greenhouse gases (GHG)
emissions removal; and, the achievement of specific SDGs.
The analysis is focused primarily in two selected LAC countries: Argentina and Colombia;
however, references to the broader Latin America and Caribbean perspective and opportunities
are made in a number of cases.
This analysis aims to help identify knowledge gaps and where possible formulate generic
recommendations/options for consideration by governments in the region to eventually
incentivize and effectively govern the incorporation of relevant CDR approaches in national
climate change strategies that aim to contribute to the achievement of the SDGs, implement the
Nationally Determined Contributions (NDCs) and, additionally, inform green recovery plans, when
applicable.
The results of this study could be used to help showcase the need to undertake further research
efforts in order to reduce potential knowledge gaps, as well as making a contribution to support
governments in the region taking informed decisions on assigning resources to further explore
and inquire about these options and subsequently assess the convenience of the adoption of these
approaches and gauge their potential in adding up to long-term climate mitigation efforts and
sustainable development national strategies and plans, in the context of the national long-term
strategies and climate policies.
In line with the above-mentioned objectives, the study comprises three main phases; the
outcomes of each of those phases are being presented in this report:

FINAL REPORT
I. Introduction
Current understanding of the impact of CDR approaches in LAC | 13
I. Current status of knowledge and development – A deep dive review:
Firstly, identify and characterize the current status of knowledge on a set of Carbon
Dioxide Removal (CDR) approaches and on the range of their impacts, indicating the
level of availability of scientific and technical knowledge and information at the
country level, potentially ranging from “not-known / not understood” to indicating
increasing levels of qualitative and/or quantitative information, as well as of progress
made in the discussion, planning and initial pilot implementation of those more
relevant options.
II. Carbon Dioxide Removal (CDR) analysis:
Analyze and compare the application of each relevant CDR approach in order to assess
its sequestration capacity (mitigation potential2) and the resulting impact factors of
the adoption of these technologies in the selected countries.
III. Analysis on the potential economic, social and environmental implications of the
adoption of the technologies under consideration:
A comparative analysis on the potential economic, social and environmental impacts
(positive and/or negative) that these CDR approaches could have, in particular on a
set of key indicators including: employment, GDP (Gross Domestic Product), costs,
greenhouse gases (GHG) emissions with respect to their BAU scenarios in the selected
countries and, in addition, assess these approaches against the SDGs.
According to the TORs, the analysis is to be focused in the selected CDR approaches and the
selected countries within the Latin America and the Caribbean region.
A brief analysis of the background for the adoption of these technologies in the context of the
international climate regime is included in order to acknowledge potential implications of the
overall understanding of the limitations that these technologies may contend with, in conjunction
with the contributions that may be yielded through its implementation.
2. Categories of CDR approaches
In the analysis undertaken, the definitions for each CDR technology adopted was initially based
on those employed in the report “Carbon Removal and Solar Geoengineering: Potential
implications for delivery of the Sustainable Development Goals” (C2G Report, 2018)3, complying
2 According to the IPCC SR15 Glossary, “Carbon Dioxide Removal methods refer to processes that remove CO2 from the atmosphere by either increasing biological sinks of CO2 or using chemical processes to directly bind CO2. CDR is classified as a special type of mitigation.” https://www.ipcc.ch/sr15/chapter/glossary/ 3 C2G (2018). Honegger, M.; Derwent, H.; Harrison, N.; Michaelowa, A. and Schäfer, S. Carbon Removal and Solar Geoengineering: Potential implications for delivery of the Sustainable Development Goals. C2G2 Report. May 2018.

FINAL REPORT
I. Introduction
Current understanding of the impact of CDR approaches in LAC | 14
with the specifications included in the ToRs. In this regard, the aim is aligning the analysis with
previous research activities undertaken by the Carnegie Climate Governance Initiative (C2G), as
well as with thematically related initiatives lead by ECLAC.
The IPCC SR15 has indicated that the efficacy and feasibility of many existing Carbon Removal
technologies remains highly uncertain and different concerns have been raised that large-scale
deployment could result in significant physical, socio-economic or political consequences. Hence
this report aims to assess the knowledge gap in the selected countries, by making a first attempt
towards an in-depth review of the existing body of knowledge on large-scale CDR technologies at
the national level and then identifying potential implications that Carbon Removal could have in
terms of mitigation potential and economic and social impacts against the SDGs.
For the purpose of the study, then, the same classification, description and structure, for the
CDR approaches as C2G applied in its 2018 report was followed:
Afforestation and reforestation: Planting of forests and reforestation that result in
long-term storage of carbon in above- and below-ground biomass.
Bioenergy with carbon capture and storage (BECCS): Burning biomass for energy
generation and capturing and permanently storing the resulting CO2
Enhancing soil carbon content with biochar: Biomass burning under low-oxygen
conditions (pyrolysis) yields charcoal “biochar” which is then added to the soil to
enhance soil carbon levels.
Enhanced weathering or ocean alkalinisation: Enhancing natural weathering of rocks
by extracting, grinding and dispersing carbon binding minerals on land or by adding
alkaline minerals to the ocean to enhance oceanic carbon uptake.
Direct air carbon dioxide capture and storage: Chemical process by which CO2 is
captured directly from the ambient air, with subsequent storage
Ocean fertilization: Fertilizing ocean ecosystems with nutrients to accelerate
phytoplankton growth, which partly sinks to the seabed thus moving carbon from the
atmosphere to the seabed.
While the analysis done is in conformity with the definitions adopted, we also have considered
the terms included in the Glossary of the IPCC Global Warming of 1.5◦C report, that asserts that
the notion of Carbon Dioxide Removal methods refers to processes that remove CO2 from the
atmosphere by either increasing biological sinks of CO2 or using chemical processes to directly
bind CO2. The definition specifically states that “Anthropogenic activities removing CO2 from
the atmosphere and durably storing it in geological, terrestrial, or ocean reservoirs, or in
products. It includes existing and potential anthropogenic enhancement of biological or
geochemical sinks and direct air capture and storage,but excludes natural CO2 uptake not
directly caused by human activities” (IPCC, 2018: Annex I: Glossary).
We thus considered on the one hand the categories of land-based CDR approaches covered by
the IPCC (see Table 1), to verify the compatibility of both categorizations, including in addition

FINAL REPORT
I. Introduction
Current understanding of the impact of CDR approaches in LAC | 15
DACCS and ocean fertilization in the set of technological options that were to be examined, given
the sustained interest in this last category and included in the C2G report (2018).
Table 1: CDR Approaches covered by IPCC
Source: IPCC SR 1.5oC, Chapter 3, pag. 270.
a: assessed ranges by Fuss et al. (2018), see Figures in Section 4.3.7 for full literature range;
b: based on the 2100 estimate for mean potentials by Smith et al. (2015). Note that biophysical impacts of land-
based CDR options besides albedo changes (ex:, through changes in evapotranspiration related to irrigation or
land cover/use type) are not displayed.
In turn, the Convention on Biological Diversity (CBD) defined carbon sequestration as “the
process of increasing the carbon content of a reservoir/pool other than the atmosphere”.4 The
CBD classifies the CDR techniques and examines their additional impacts relevant to
biodiversity, including ocean fertilization; enhanced weathering (ocean and land); terrestrial
ecosystem management; biomass; direct air capture and carbon storage (ocean and
subsurface). To avoid ambiguities, the CBD sustains that it is advisable to recognize that carbon
sequestration necessarily involves two steps (CBD, 2012):
4 Provisionally defined at the tenth meeting of the Conference of the Parties to the CBD. See Footnote to CBD decision X/33, paragraph 8(w).

FINAL REPORT
I. Introduction
Current understanding of the impact of CDR approaches in LAC | 16
i) removal of CO2 from the atmosphere; and
ii) long-term storage of the captured carbon, taking it out of circulation for a
climatically-significant period.
Other UN agencies, such as the United Nations Environment Programme (UNEP), typify the
diverse techniques and technology options for carbon elimination according to the following
scheme:
Natural (afforestation and reforestation; biochar; soil carbon sequestration; and other
land use and wetlands).
Combined (bioenergy with carbon capture and storage).
Technological (accelerated weathering; direct air capture; ocean alkalinity
enhancement; CO2 to durable carbon).
Ecosystem-based approaches such as afforestation, reforestation or the enhancement of soil
carbon are already utilized as climate change mitigation activities, and are, certainly at the
current scales, not regarded as CDR approaches.
A range of other methods may also be included as greenhouse gas removal methods, in
particular some related to the use of particular building materials and transformation of existing
industrial processes. These methods or techniques, however, are not being considered in this
analysis.
3. Selected Countries in LAC
This report comprises the current information and understanding of the impact and implications
of CDR approaches on Argentina and Colombia. The initial decision on the two countries to be
analysed was based on different elements:
the overall national circumstances,
the fact that both countries have a persistent and still strong deforestation and forest
degradation process ongoing, even if in each case due to different conditions and even
in spite of the efforts made to revert those processes,
the significant emphasis placed in both cases in developing extractive policies,
including the production and consumption of coal in one case and shale gas in the
other, as well as continual or increasing mining activities,
the relevance of agriculture and livestock production with its concomitant GHG
emissions, and,
more generally, the difficulties in avoiding trends towards a reinforced reliance on
primary production and commoditization of exports.
Conversely, the actual national resource endowment and natural capital assests available vis a
vis increasingly astringent carbon budgets, water scarcity and revalorization of ecosystem

FINAL REPORT
I. Introduction
Current understanding of the impact of CDR approaches in LAC | 17
services, unlocks multiple opportunities for climate mitigation, carbon sequestration and
restoration of degraded ecosystems as well as ecosystem services supply.5
In addition to the exploratory exhaustive review being made in Argentina and Colombia, an
abbreviated literature review in other Latin American and the Caribbean countries is also
included in this report, with a focus in those areas and countries where research and knowledge
on CDR technologies seems to be most developed or, in some cases, experimental initiatives have
already been attempted. The purpose of this complementary analysis is to provide a broader
landscape on the status and trends in long-term CDR options in the region.
4. Activities undertaken
Activities undertaken throughout the study included:
Extensive review of the body of research in selected countries and, summarily, at the
regional level.
Desk review of documentary evidence on governmental visions, strategies, plans,
programmes considering these technology options and of initiatives or projects aiming
at the introduction of CDR technologies
Assessment and grading of current status of knowledge, planning and implementation
gaps in selected countries
Technical and economic modeling for the estimation of scenarios-based impacts
according to historic trends and governmental policies and plans
Environmental and economic impact analysis of the implementation of selected CDR
approaches
Preliminary recommendations for policy makers on the potential benefits and
implications of the introduction of CDR approaches and eventually of large-scale
deployment
5 Also, as established in the Terms of Reference of the present study.

FINAL REPORT
II. Methodological approach
Current understanding of the impact of CDR approaches in LAC | 18
II. Methodological approach
In the first phase, the methodology to review documentary evidence and the available body of
research for this study comprised three steps:
i. Information search:
Identifying knowledge and technical pieces (peer-reviewed online academic journals
and books, conference papers, theses and dissertations, preprints, abstracts, technical
reports, and other scholarly literature, like court opinions and patents) by searching
through the web search engine Google Scholar. The search engine indexes articles from
most of the recognized database sources like Elsevier, Scielo, Wiley, NCBI, Science,
Nature, MDPI, Springer, Research Gate, among others.
Academic research was also broadened by reviewing the "cited by/citing articles"
feature and "recommended articles" feature in the databases and references of the
most relevant articles found related to CDR approaches in Latin America and the
Caribbean.
Reviewing other databases from local research entities like institutional repository
"Conicet Digital" of CONICET from Argentina and of local universities like the
institutional digital repository of the University of Buenos Aires (UBA) as well as the
National University of Colombia (UNAL), among others similar sites.
Defining keywords as input for the search engines. Those keywords included the titles
of the CDR approaches plus the name of the different countries of Latin America and
the Caribbean.
Reviewing and syntethizing main conclusions of knowledge and technical pieces
identified through the search.
Reviewing official journals of the Government of Argentina and Colombia (Boletin
Oficial and Diario Oficial respectively) that encompass the laws, decrees, acts, and
most pertinent documents and public announcements of the Executive Power,
Congress, and government agencies of such countries.
Reviewing plans and programmes on the websites of the relevant Ministries (i.e.
Ministry of Environment or Ministry of Agriculture, Foreign Affairs) and their
dependences for the different countries of Latin America and the Caribbean
ii. Analysis of collated material:
Analysing all the identified laws, plans, programmes, academic pieces of knowledge
and initiatives and projects and obtaining key findings for each CDR approach for each
selected country

FINAL REPORT
II. Methodological approach
Current understanding of the impact of CDR approaches in LAC | 19
iii. Metrics
Defining a grading methodology developed during the study to establish the current
status of knowledge, development and commitment under certain assessment
dimensions and scales
In the second and third phases, the impact analysis comprised four main steps:
i. Compilation of historical statistics for macro and CDR specific variables
Identifying key macroeconomic variables for Argentina and Colombia and gathering
historical statistics
Identifying specific key variables in terms of CDR implementation for Argentina and
Colombia and compiling historical statistics
ii. Scenario definition and impacts linkages
For each CDR approach selected, according to results of the assessment of knowledge,
planning and implementation gaps, 3 scenarios were defined:
o baseline scenario based on BAU trends
o scenario 1 including CDR technology in a moderate manner
o scenario 2 including CDR technology in an ambitous manner
Identification of main linkages between macroeconomic and specific variables for CDR
impact assessment
iii. Assessment of impacts
Running simulations among macro and intrasectorial variables for each scenario of each
CDR approachbeing examined
Estimating high level long-term impacts of CDR deployment on key chosen variables
(Grenhouse emissions, GDP, Employment, others)
Estimating costs and investments needed for the different CDR deployment scenarios
Analyze and compare the application of each relevant CDR approach in order to assess
its mitigation potential and impact economic factors for the application of these
technologies on the selected countries.
iv. Elucidation of key findings
Contribution to the achievement of the SDGs
Recommendations for policy makers on the potential benefits and implications of the
introduction of CDR approaches and eventually of large-scale deployment

FINAL REPORT
III. Key Findings of the study
Current understanding of the impact of CDR approaches in LAC | 20
III. Key Findings of the study
As an outcome of the assessment done throughout the study, key findings in this report are
organized as follows:
1. Context
2. Assessment of knowledge, planning and implementation gaps and selection of CDR
approaches for impact analysis
3. Impact analysis of CDR approaches on key variables
4. Recommendations for potential research and deployment based on impacts on SDGs
1. Context
These references to the context in which the outcomes of the report should be broadly considered
provide a very succinct characterization of major contextual elements from a scientific
perspective which might define the border conditions for the integration of those outcomes into
a climate policy stance.
The study recalls that, from a global perspective:
The Paris Agreement specifies that the long-term temperature goal should be
achieved by means of reaching a balance between anthropogenic emissions of
greenhouse gases by sources and removals by sinks, in the second half of this
century.
Further, there is a growing agreement in the recent body of literature and research
that most scenarios to meet the Paris Agreement include negative emissions
technologies. Notwithstanding that, higher near-term emission reductions should
decrease the need for a high scale of deployment of those negative emissions
technology options, reinforcing the rationale for a global imperative for urgent and
deep decarbonization in order to minimize future reliance on CDR options and their
potential associated risks.
In the IPCC AR5 it was stated that CDR plays a major role in many mitigation
scenarios while underscoring that delay in additional mitigation action to 2030 will
imply a larger reliance on CDR in the long-term. Furthermore, the IPCC indicated
that “most terrestrial CDR techniques would require large-scale land-use changes
and could involve local and regional risks, while maritime CDR may involve
significant transboundary risks for ocean ecosystems." 6
In addition, the IPCC further asserts that “CDR plays a major role in many mitigation
scenarios” and “several CDR techniques could potentially reduce atmospheric
6 IPCC (2014a). Technical Summary, page 60.

FINAL REPORT
III. Key Findings of the study
Current understanding of the impact of CDR approaches in LAC | 21
greenhouse gas (GHG) levels. However, there are biogeochemical, technical and
societal limitations that to, varying degrees, make it difficult to provide
quantitative estimates of the potential for CDR.” 7
More specifically, the IPCC AR5 had already made an introduction to carbon dioxide
removal methods and discussed the potential effects of those methods on the Carbon
Cycle (IPCC, 2013). The non-exhaustive list of methods then included: enhanced
biological production and storage on land, enhanced biological production and storage
in ocean, accelerated weathering and others of a chemical nature (direct air-capture
with storage).8
According to research done at the global level, CDR options can generate positive
and negative local and regional impacts on various SDGs, via physical, social,
economic, and political channels.
Hence, it is necessary to assess the possible environmental, economic, and societal
impacts of technological innovations that might be aiming for public support and
funding in research, development, and market implementation and ensure that the
objectives of the SDGs are safeguarded in the possible implementation of those
technologies.
Since those previous findings made by the IPCC, research has steadily advanced.
Protracted climate action and persistent increase in GHG emissions led to diverse
initiatives to consider -from a scientific and technical perspective- carbon dioxide
removal technologies with an increasing level of interest.
The adoption of the Paris Agreement and its entry into force, as well as the
intensified exploration of plausible scenarios related to zero carbon futures
increased the interest in CDR approaches.
The IPCC Special Report on Global Warming of 1.5 ºC provided scientific basis to
the examination of CDR technological options -being part of a possible additional
menu of negative emission technologies- and exploring the potential for expansion of
already widely examined mitigation actions, primarily as a set of nature based -and
technical- approaches to be applied.
In this context, CDR options may, a priori, be looked at as complementary means
to achieve the goals embraced in the Paris Agreement and securing the SDGs. Those
emission pathways consistent with a 1.5 ºC limit require reduced emissions at global
scale in addition to near-term carbon dioxide removal.
Lingering political aversion to the large-scale utilization of CDR approaches would be
assuaged by heightened ambition in the elaboration and subsequent concrete
implementation of NDCs demonstrating that effective mitigation action is taking place,
as well by increased perception of the need to exhaust the understanding of the
diversity of technical options and their possibilities.
7 IPCC (2014b). AR5 Synthesis Report, page 89. 8 IPCC (2013). See Chapter 6.5, pp. 546-555.

FINAL REPORT
III. Key Findings of the study
Current understanding of the impact of CDR approaches in LAC | 22
Hence, to minimize future CDR reliance, the imperative for rapid and deep
decarbonization remains a pillar of the international climate regime global mandate.
In the 1.5 ºC report, the SPM underscores that “All pathways that limit global warming
to 1.5°C with limited or no overshoot project the use of carbon dioxide removal (CDR)
on the order of 100–1000 GtCO2 over the 21st century. CDR would be used to
compensate for residual emissions and, in most cases, achieve net negative emissions
to return global warming to 1.5°C following a peak.”9
The SPM then highlights that “The longer the delay in reducing CO2 emissions towards
zero, the larger the likelihood of exceeding 1.5°C, and the heavier the implied reliance
on net negative emissions after mid-century to return warming to 1.5°C” making the
need for exploring the CDR options more inexorable.
In addition, the IPCC warns that most current and potential CDR measures could have
significant impacts on land, energy, water or nutrients if deployed at large scale.10
Hence, it is necessary to ensure that the potential environmental, economic, and
societal impacts of those technological innovations aiming for public support and
funding in research, development, and market implementation are aligned with the
respective objectives of the SDGs and have been carefully assessed in order to
determine the technical, economic and environmental feasibility of each of the
different options.
Some of the approaches being categorized as CDR are also commonly understood as
part of Nature based options. Hence the boundaries -semantic, conceptual, operative,
and in particular, political- between absorption and mitigation reckoning may be a
source of contention in the political arena, or merely a controversial issue, when these
options are being introduced as part of planned climate action implementation efforts.
There is a growing understanding that the implications of the social, environmental
and economic implications of utilizing these CDR technology options would primarily
be contingent on the quality of a governance regime, including issues related to
legitimacy, capacity and relevance, in the context of the international climate
architecture.
However, the IPCC also acknowledges that the existing governance mechanisms to
address an array of complex issues (governance, constraints, accounting, monitoring)
are still scarce or insufficient (IPCC, 2018).
A number of views and interpretations suggest that the need to start deployment of
CDR in the 2020s in order to meet the global climate targets, comprising in particular
the 2ºC and 1.5ºC thresholds, might imply the admission of a partial failure of present
policy approaches at the national level and, more importantly, the inability of the
international climate regime to achieve the agreed Paris Agreement global goals. It is
possible to progressively demonstrate that this is not the case and that CDR approaches
9 IPCC (2018). SPM, page 17. 10 IPCC (2018). SPM, page 17.

FINAL REPORT
III. Key Findings of the study
Current understanding of the impact of CDR approaches in LAC | 23
are valid, efficient -in a case specific context- and consistent with current mitigation
objectives.
2. Assessment of knowledge, planning and implementation gaps
As the different technological options to be explored are at different stages of development (in
some cases at the theoretical or merely experimental stage) and a number of LAC countries
typically face a climate finance and budgetary gap, the decision on the potential development
of those options would require accurate abatement costs information and careful consideration
of implementation risks in order to avoid misallocation of scarce resources and negative impacts
on the Sustainable Development Goals.
LAC countries efforts on climate change mitigation are appropriately primarily focused on
emissions reduction and complete replacement of fossil fuels consumption, and only in a largely
incipient manner carbon removal efforts are being considered, with diverse degrees of
theoretical and practical advance, in scientific knowledge, planning and ensuing implementation
of those technological options.
In general, and with rare exemptions, a significant knowledge and empirical development gap
has been identified in relation with the appraisal of the feasibility and convenience of the
implementation of CDR approaches in LAC countries.
The body of research on the effectiveness and potential implications of some of the CDR options
is a new and, in many cases, nascent exploratory field.
The broader implications of CDR technologies in contributing to delivering or hindering
sustainable development efforts are so far insufficiently explored and understood, predominantly
from a planning perspective.
Significant gaps in knowledge mean that a comprehensive research and technical development
effort for each technology should be undertaken, if it is decided that these options -or some of
them- should be part of the national climate policy.
Deployment of large-scale CDR approaches assessed in this study would be expected to have
physical side-effects and socio-economic or governance implications, affecting in different ways
the delivery of SDGs; effects can either reinforce accomplishment of or hinder achieving the
SDGs.
Physical side-effects identified in particular relate to: land-use alternative uses and food
security; water quality and availability; health; energy; economic productivity; infrastructure
needs; and biodiversity. Socio-economic or political implications include: economic and cultural
impacts; opportunity costs; significant financial requirements; and political consistency among
sectors.

FINAL REPORT
III. Key Findings of the study
Current understanding of the impact of CDR approaches in LAC | 24
Afforestation and reforestation and enhancing soil carbon content with biochar are the most
explored CDR approaches in the scientific and academic field in LAC.
Afforestation and reforestation, in addition, is supported by an array of laws, regulations and
national plans and programmes both in Argentina and Colombia as in the other LAC countries.
Furthermore, several large-scale projects have been identified for Afforestation and
reforestation in Argentina and Colombia and other LAC countries. For example, large scale forest
restoration plans are being planned and implemented, among others.
A number of countries, including Argentina have developed policies and plans promoting the use
of wood from sustainably managed forests for industry and construction (which represent long-
term carbon storage alternatives) and their other related projects. Brazil and Chile have been
traditionally active in this field.
Argentina and Colombia are countries with intensive use of land for agriculture. Even though a
nascent field of research in LAC countries, enhancing soils carbon content and technologies that
include the use of biochar as soil enhancer as well as enhanced weathering should be worth
analyzing deeper in order to quantify its potential impacts and risks.
There is a good basis of research and initiatives/projects on the bioenergy side of the BECCS
equation, however there is no integral research on BECCS, per se. Incipient but rapidly increasing
installed capacity of biomass and biogas power generation plants and biofuels production plants
is being observed. Nonetheless, the focus is primarily on the BE side.11
Biofuels applied to power generation in non-grid connected areas (distributed generation) could
have a potential for BECCS development in LAC countries, although there are no relevant
knowledge, commitment nor implementation efforts identified to the date of the elaboration of
this report.
Brazil leads CCS research capabilities in Latin American and Caribbean, mainly focusing in
geological storage in salt caverns in ultra-deep water.
According to the IPCC 1.5 special report, given the DACCS technology’s early stage of
development (see also McLaren, 2012; NRC, 2015a; Nemet et al., 2018) and a limited number of
empirical demonstrations (Holmes et al., 2013; Rau et al., 2013; Agee et al., 2016), deploying
the technology at scale seems to still be a considerable challenge, though both optimistic
(Lackner et al., 2012) and pessimistic outlooks co-exist (Pritchard et al., 2015).
Worlwide there are several DACCS plants (mainly pilot plants) with a combined capacity of less
than 10,000 tons of CO2 per year. Locations include Europe, US and Canada, but none of them is
11 BE refers to BioEnergy only, not including CCS phases of BECCS

FINAL REPORT
III. Key Findings of the study
Current understanding of the impact of CDR approaches in LAC | 25
located in Latin America. The first large-scale DACCS plant (1 million-ton CO2/ year capacity) is
expected to start the construction phase in US Permian basin although not before 2022.
In a transition to net-zero emissions, the CO2 resulting from producing synthetic fuels would
increasingly need to be captured through bioenergy sources or from the atmosphere to avoid
delayed emissions from fossil-based CO2, when the fuel is combusted. Direct air capture is one
of a short number of technological options available to remove CO2 directly from the
atmosphere. Carbon removal is expected to play a key role in the transition to a net-zero energy
system in which the amount of CO2 released into the atmosphere is equivalent to the amount
being removed. According to European Commission, DACCS cost needs to drop by at least an
order of magnitude with respect to its value today for this option to become financially and
economically feasible.
As the technology has yet to be demonstrated at large scale and in different locations, the
expected cost of direct air capture is uncertain. For this reason, direct air capture needs to be
demonstrated at a relevant scale, to reduce uncertainties regarding future deployment potential
and costs, and to ensure that these technologies can be available to support the transition to
net-zero emissions and beyond.
Regarding ocean fertilization, only small-scale field experiments and theoretical modelling have
been conducted (ex:, McLaren, 2012). Fuss et al. (2018) consider the potential to be extremely
limited given the available evidence and existing barriers. The greatest theoretical potential for
this practice is the Southern Ocean, posing challenges for monitoring and governance (Robinson
et al.,2014).
Carbon removal options include nature-based solutions (ex: afforestation, reforestation,
restoration of costal and marine habitats), measures to enhance naturally occurring processes
(ex: land management approaches to increase the carbon content in soil, biochar) and other
technology-based solutions such as bioenergy with carbon capture and storage (BECCS).
In the near term, large-scale demonstration of CDR technologies such as DACCS and ocean
fertilization will require targeted government support, including through grants, tax credits and
subsidies and public procurement of CO2 offsets. The CDR potentials that can be realized are
constrained by the lack or insufficiency of policy portfolios incentivising large-scale CDR (Peters
and Geden, 2017). Near-term opportunities could be supported through modifying a number of
existing policy mechanisms (Lomax et al., 2015). Social impacts of large-scale CDR deployment
(Buck, 2016) require policies taking these effects into account and alleviating the negative
effects that may result from the planned interventions.

FINAL REPORT
III. Key Findings of the study
Current understanding of the impact of CDR approaches in LAC | 26
Assessment of knowledge, planning and implementation gaps in Argentina and
Colombia
The review of knowledge, planning and implementation gaps is undertaken with the ultimate aim
of assessing the CDR technologies against the SDGs and contribute to enable the discussion on
whether the CDR technologies can be instrumental to delivering the SDGs by 2030.
To that end, our own methodological approach was applied, building upon the C2G methodology
[Honegger, et al 2018], and considering three different dimensions: i) scientific and technical
knowledge, ii) mainstreaming in government planning, and iii) advances in implementation, to
determine the current status of knowledge, adoption in planning and empirical application of the
selected CDR approaches in the chosen countries.
For each of those assessment dimensions, a scale was created reflecting increasing degrees of
knowledge, planning and implementation. To facilitate graphic perception, a colour was assigned
to those different degrees in the scales:

FINAL REPORT
III. Key Findings of the study
Current understanding of the impact of CDR approaches in LAC | 27
The following table depict the scoring for each CDR approach and each of the assessment dimensions
for Argentina and Colombia respectively, with its supportive summarized evidence for such scoring,
based on the detailed review of the current status of knowledge, planning and implementation (collated
in the following sections)12.
12 For further detail and references on the knowledge pieces please proceed to section “III. Current status of knowledge and development – A detailed review”

FINAL REPORT
III. Key Findings of the study
Current understanding of the impact of CDR approaches in LAC | 28
FINAL REPORT Current understanding of the impact of CDR approaches in LAC | 28

FINAL REPORT
III. Key Findings of the study
Current understanding of the impact of CDR approaches in LAC | 29
Source: Own elaboration on the basis of review
FINAL REPORT Current understanding of the impact of CDR approaches in LAC | 29

FINAL REPORT
III. Key Findings of the study
Current understanding of the impact of CDR approaches in LAC | 30
FINAL REPORT Current understanding of the impact of CDR approaches in LAC | 30

FINAL REPORT
III. Key Findings of the study
Current understanding of the impact of CDR approaches in LAC | 31
Source: own elaboration on the basis of review of information and rating
FINAL REPORT Current understanding of the impact of CDR approaches in LAC | 31

FINAL REPORT
III. Key Findings of the study
Current understanding of the impact of CDR approaches in LAC | 32
FINAL REPORT Current understanding of the impact of CDR approaches in LAC | 32

FINAL REPORT
III. Key Findings of the study
Current understanding of the impact of CDR approaches in LAC | 33
FINAL REPORT Current understanding of the impact of CDR approaches in LAC | 33

FINAL REPORT
III. Key Findings of the study
Current understanding of the impact of CDR approaches in LAC | 34
FINAL REPORT Current understanding of the impact of CDR approaches in LAC | 34

FINAL REPORT
III. Key Findings of the study
Current understanding of the impact of CDR approaches in LAC | 35
Source: own elaboration on the basis of review of information and rating
FINAL REPORT Current understanding of the impact of CDR approaches in LAC | 35

FINAL REPORT
III. Key Findings of the study
Current understanding of the impact of CDR approaches in LAC | 36
Additionally, an analysis on the chronology of the pieces of knowledge or articles identified for each
CDR approach was performed. In the last three years (2018-2020 period) the highest number of
academic articles was developed when considering the entire 2010-2020 period for both Argentina and
Colombia.
Figure 1: Chronology of pieces of knowledge identified in Argentina (2010-2020 period)
Note: * Only BE but no integral BECCS research identified. ** Indirect academic research on oceans behaviour and characterization and CO2 dynamics, but no specific article on Ocean alkalinization or Ocean fertilization. Source: Own elaboration
Figure 2: Chronology of pieces of knowledge identified in Colombia (2010-2020 period)
Note: * Only BE but no integral BECCS research identified. ** Indirect academic research on oceans behaviour and characterization and CO2 dynamics, but no specific article on Ocean alkalinization or Ocean fertilization. Afforestation includes 10 relevant knowledge pieces of Mangroves in Colombia during the 2010-2020 period. Source: Own elaboration

FINAL REPORT
III. Key Findings of the study
Current understanding of the impact of CDR approaches in LAC | 37
Based on the analysis on the current status of knowledge, planning and implementation of CDR
approaches in LAC countries and, specifically, in Argentina and Colombia, the following four CDR
approaches were selected to further deep-dive in terms of impact analysis:
Afforestation and reforestation
Bioenergy with carbon capture and storage (BECCS)
Enhancing soil carbon content with biochar
Enhanced weathering (land)
3. Impact Analysis of CDR Implementation
For each country and CDR approach, technical scenarios estimates were completed according to
the following definitions:
Afforestation and reforestation
o Baseline scenario according to historic trends
o Scenario 1 (Sc1) resulting from the annual increase of commercial forest
plantations according to the countries’ NDCs and plans
o Scenario 2 (Sc2) of Maximum potential area suitable for forestlands in Argentina
and Colombia, based if possible, on “site quality” criteria (soil, topography and
climate), regardless of any economic benefit associated with afforestation and
reforestation activities
Mangroves
o Baseline scenario of null or marginal incremental mangrove restoration in
Colombia
o Sc.1 resulting from a mangrove restoration plan of 0.2% of total mangrove area
annually (16,000 total restored hectares by year 2050)
o Sc.2 resulting from a mangrove restoration plan of 0.7% of mangrove area
annually (58,000 total restored hectares by year 2050) (Maximum mangrove
restoration area according to Bernal et al 2017)
BECCS
o Baseline scenario, based on official Energy Scenarios in Argentina (SGE, 2019)
for the period 2019-2030, extended to 2050 / Plan Energético Nacional
Colombia 2020- 2050 (UPME, 2019).
o Sc1, an enhanced biomass/biogas power generation scenario, with low CCS
adoption
o Sc2, an enhanced biomass/biogas power generation scenario, with high CCS
adoption
Enhancing soil carbon content and enhancing soil carbon content with biochar
o Baseline scenario: no biochar applied
o Sc1, an enhanced soil carbon content scenario, with low biochar applied
o Sc2, an enhanced soil carbon content scenario, with high biochar applied

FINAL REPORT
III. Key Findings of the study
Current understanding of the impact of CDR approaches in LAC | 38
Uncertainties surrounding enhanced weathering (land) are still large. The broader implications
of Enhanced weathering (land) technologies for delivering sustainable development are
insufficiently understood at this time and thus, was not feasible to perform the impact analysis
done for the rest of CDR technologies in Argentina and Colombia. The technology is untested at
scale, not exhibiting enough quantitative and qualitative information, presenting a limitation for
impact analysis.
Impact analysis - Argentina and Colombia
This section summarizes the estimation of the impacts of the large-scale deployment for the
selected CDR approaches in Argentina and Colombia, according to the scenarios determined for
each of them.
Several linkages among macro and intrasectorial variables for each CDR approach and country
were identified, estimating long-term impacts of CDR deployment on key variables contributing
to the achievement of the SDGs (Grenhouse emissions, GDP, Employment, others), based on the
technical scenario forecasting the aforementioned. Costs and investments needed for the
different CDR deployment scenarios were also quantified.
Argentina impacts
Adopting a deep decarbonization pathway in Argentina requires deepening efforts in
key sectors by launching transitions primarily but not only in the energy, transport and
the Agriculture Forestry and Other Land Use (AFOLU) sectors. In this context,
afforestation and reforestation constitutes a core mitigation strategy to reduce net
emissions and ensure removal at a large scale. It is estimated that afforestation could
remove an average of over 15 Mega tons of CO2e per year during the 2020-2050 period
in a plausible scenario of a maximum of 80 thousand hectares planted per year. The
consideration and implementation of the Afforestation and Reforestation option is
consistent with decarbonization pathways envisaged by national climate policies.
Afforestation and reforestation present the lowest cost per ton sequestred (about 6
USD per ton CO2e) and the largest emissions removal for Argentina, and should be
prioritized in the near term. Despite its low cost per ton of CO2e, the Afforestation
scenarios elaborated estimate investments in the 60-100 million dollars per year and
provide a significant source of direct primary employment. Larger investments and
effects in employment and GDP than estimated might be possible if the wood industrial
value chain is significantly developed downstream
Changes in livestock production practices, in particular those related to increasing soil
carbon stocks can provide additional means to increasing mitigation ambition in the
short to medium term.
Similarly, changes in current but evolving agricultural practices (and thus technically
and culturally feasible) can contribute to incremental emission reductions.

FINAL REPORT
III. Key Findings of the study
Current understanding of the impact of CDR approaches in LAC | 39
The application of biochar on soils could sequester up to 2.5 Mega tons of CO2e per
year by 2050, only considering fruit trees. Further expansion to other intensive crops
and later to extensive crops might be an upside to explore with further research efforts
and pilot projects. Moreover, biochar deployment exhibits the second lowest cost per
ton sequestered after Afforestation.
There is uncertainty about the feasibility of timely upscaling of BECCS. CCS is largely
absent from the Argentinean Nationally Determined Contributions and lowly ranked in
investment priorities. It is estimated that BECCS could sequester up to 2.0 Mega tons
of CO2e per year by 2050 with over 1,300 MW of additional installed capacity
BECCS deployment in the mid-term implies large investments in capital intensive
industrial facilities, and therefore exhibits high multiplier in terms of GDP and
employment. However, BECCS is still an inmature technology in Argentina with the
largest cost per ton sequestered (240 to 260 USD/ ton CO2e)
Table 2: Impact of CDR deployment on key variables – Argentina
Potential GHG
emissions
(sequestered)
Avg Investment
requirements
Cost Net changes in
employment
created
Contribution to
GDP
Mega t CO2 /yr MM USD/yr USD / t CO2 # jobs created/
Mega t CO2 seq
∆ MMUSD GDP /
Mega t CO2 seq
Afforestation Baseline
5.6 (avg)
7.7 (2050) 29 (avg) 5.1
73 direct
117 indirect 22
Sc1 10.3 (avg)
11.3 (2050) 59 (avg) 5.6
80 direct
127 indirect 24
Sc2 15.9 (avg)
14.4 (2050) 100 (avg) 6.1
85 direct
136 indirect 26
BECCS Baseline No CCS adoption in baseline scenario, only bioenergy
Sc1 0.1 (avg)
0.3 (2050) 35 (avg) 256.5
733 permanent
258 constr. 1,075
Sc2 0.7 (avg)
2.0 (2050) 163 (avg) 239
1,037 permanent
360 constr. 1,000
Biochar Baseline No biochar deployment in baseline scenario
Sc1 0.1 (avg)
0.2 (2050) 3 (avg) 25.4 102 industrial 110
Sc2 1.5 (avg)
2.5 (2050) 30 (avg) 19.3 77 industrial 84
Source: Own elaboration
Colombia impacts
In Colombia, controlling deforestation is key for lowering its emissions. Further, given
the need to produce additional food and biomass by intensifying agriculture and cattle
production, halting deforestation emerges as an imperative to facilitate the adoption
of a deep decarbonization and long-term sustainable food production.

FINAL REPORT
III. Key Findings of the study
Current understanding of the impact of CDR approaches in LAC | 40
Afforestation also presents in Colombia the largest GHG emissions potential, with an
average of over 13 Mega ton of CO2e per year in the 2020-2050 period
Colombia is one of the world's top 20 countries in terms of mangrove covered area,
with nearly 300,000 ha of mangrove trees in both the Pacific and Caribbean Coasts.
Mangroves are well known for its high capacity to capture carbon stock per unit of land
compared with terrestrial forests. It is expected that mangrove restoration at an 0.7%
annual rate (equivalent to 58 thousand ha restored in the next 30 years) could
sequester up to 3 Mega ton of CO2e per year, with relatively low investments and costs
per ton of CO2
Effects in employment and GDP contribution of afforestation and mangrove restoration
interventions might be underestimated if other indirect economic activities derived
from its value chain and ecosystem respectively were also considered (not included in
the figures below) beyond primary plantations activities.
Only considering deployment in fruit tree plantations, Biochar application on
Colombian soil could sequester up to 5 Mega tons of CO2e per year by 2050. As
mentioned in Argentina, further expansion to other intensive crops and later to
extensive crops might be an upside to explore with further research and pilots in
Colombia. Although higher than Afforestation and Mangrove restoration, Biochar
application cost per ton is expected to remain below 25 USD/ton CO2e
Over 1,100 MW of BECCS installed capacity are forecasted for Colombia by 2050 in a
high adoption scenario, potentially sequestering nearly 5 Mega tons of CO2e per year.
BECCS is constrained by sustainable bioenergy potentials and availability of safe
storage for CO2. Similar to Argentina, in Colombia there is also uncertainty about the
feasibility of timely upscaling of BECCS. CCS is largely absent from the Colombian
Nationally Determined Contributions and lowly ranked in investment priorities. BECCS
competes with other land-based CDR approaches and mitigation measures for resources
Larger investments requirements like capital intensive BECCS deployment and Biochar
production plants generate larger effects in employment craetion and GDP
contribution. Although significantly lower than in Argentina, BECCS present the highest
CDR cost per ton sequested in Colombia at an estimate of about 70 USD per ton CO2e
Table 3: Impact of CDR deployment on key variables – Colombia
Potential GHG
emissions
(sequestered)
Avg Investment
requirements
Cost Net changes in
employment
created
Contribution to
GDP
Mega t CO2 / yr MM USD/yr USD /
t CO2
# jobs created /
Mega t CO2 seq
∆ MMUSD GDP /
Mega t CO2 seq
Afforestation Baseline
4.7 (avg)
6.3 (2050) 48 (avg) 9.7
76 direct
122 indirect 62
Sc1 7.5 (avg)
8.1 (2050) 78 (avg) 10.1
74 direct
118 indirect 65
Sc2 13.4 (avg)
12.0 (2050) 144 (avg) 10.5
66 direct
106 indirect 67
Baseline Null or marginal mangrove restoration in Colombia

FINAL REPORT
III. Key Findings of the study
Current understanding of the impact of CDR approaches in LAC | 41
Mangrove
restoration
Sc1 0.4 (avg)
0.8 (2050) 5 (avg) 11.1 65 direct 69
Sc2 1.4 (avg)
2.9 (2050) 15 (avg) 10.9 69 direct 68
BECCS Baseline No CCS adoption in baseline scenario, only bioenergy
Sc1 0.1 (avg)
0.4 (2050) 12 (avg) 72.9
271 permanent
104 construction 453
Sc2 2.1 (avg)
4.7 (2050) 146 (avg) 69.2
259 permanent
101 construction 429
Biochar Baseline No biochar deployment in baseline scenario
Sc1 0.3 (avg)
0.4 (2050) 7 (avg) 25.0 100 industrial 161
Sc2 3.1 (avg)
4.8 (2050) 58 (avg) 18.0 72 industrial 116
Source: Own elaboration
Contribution to the achievement of the SDGs
The review of knowledge, planning and implementation gaps and impact estimates were
undertaken with the ultimate aim of assessing the CDR approaches against the SDGs. In this
chapter we summarise the potential implications that deployment of CDR technologies could
have for reaching each of the seventeen SDGs.
The body of research on the effectiveness and potential implications of some of the CDR
approaches is a new and, in many cases, exploratory field. The broader implications of CDR
technologies for delivering sustainable development are insufficiently understood, particularly
in LAC countries. Nevertheless, an initial effort was done to elucidate the impact of Carbon
Dioxide Removal (CDR) approaches on the SDGs in selected countries in Latin America and the
Caribbean (LAC).
The potential implications identified for the SDGs are likely to differ strongly depending on the
assumed scale of intervention, as well as the main hypothesis considered in terms of scenarios
and contexts in which they would be deployed.
As stated earlier, it is important to note that while this report endeavours to present a balanced,
impartial and evidence-based view of potential implications, significant gaps in knowledge mean
that even if a comprehensive research for each technology is undertaken, in some cases those
implications may not be gauged with optimal accuracy.
The technologies assessed in LAC are untested at scale and substantially more expensive than
ongoing efforts to reduce CO2 emissions. However, positive effects for non-climate related SDG
delivery beyond climate action are also likely. Achieving beneficial outcomes and avoiding social
and environmental harm requires more research and policy-specific impact assessments that take
local conditions into account.

FINAL REPORT
III. Key Findings of the study
Current understanding of the impact of CDR approaches in LAC | 42
Implmentation of large-scale CDR approaches assessed in this study would be expected to have
physical side-effects and socio-economic or political implications eventually affecting the
delivery of SDGs.
Physical side-effects in particular relate to: land-use alternative uses and food security; water
quality and availability; health; energy; economic productivity; infrastructure needs; and
biodiversity. Socio-economic or political implications include: economic and cultural impacts;
opportunity costs; significant financial requirements; political consistency among sectors.
According to the assessment performed throughout the study, it is expected that in LAC countries
large scale deployment of CDR approaches would affect the delivery of SDGs in the following
manner:
Afforestation could positively affect delivery of more than half of all SDGs (at least 10 out of 17 SDGs). The estimates identify potential direct positive impacts regarding delivery of SDG 8 (Decent work and economic growth), SDG 9 (Industry, innovation and infrastructure) and SDG 13 (Climate action) and potential indirect positive impacts
regarding SDG 1 (No poverty), SDG 3 (Good health and well-being), SDG 4 (Quality education), SDG 5 (Gender equality), SDG 7 (Affordable and clean energy), SDG 12 (Responsible production and consumption) and SDG 15 (Life on land). On the other hand, there are a number of risks in particular those associated with the delivery of SDG 6 (Clean water and sanitation). Further risks are also identified for other SDGs including SDG 2 (Zero hunger), SDG 3 (Good health and well-being), and SDG 15 (Life on land).
BECCS could positively affect delivery of more than one third of all SDGs (at least 7 out of 17 SDGs). The estimates identify potential direct positive impacts regarding delivery of SDG 7 (Affordable and clean energy), SDG 8 (Decent work and economic growth), SDG 9 (Industry, innovation and infrastructure) and SDG 13 (Climate action)
and potential indirect positive impacts regarding SDG 3 (Good health and well- being), SDG 4 (Quality education) and SDG 11 (Sustainable cities and communities). On the other hand, there are some indirect risks in particular regarding delivery of SDG 1 (No poverty), SDG 2 (Zero hunger), SDG 3 (Good health and well-being), SDG 4 (Quality education), SDG 6 Clean water and sanitation). SDG 13 (Climate action) and SDG 15 (Life on land).
Enhancing soil content with biochar could positively affect the delivery of almost two thirds of all SDGs (at least 11 out of 17 SDGs). The estimates identify potential direct positive impacts regarding delivery of SDG 2 (Zero hunger), SDG 8 (Decent work and economic growth), SDG 9 (Industry, innovation and infrastructure), SDG 12 (Responsible production and consumption) and SDG 13 (Climate action) and potential
indirect positive impacts regarding SDG 1 (No poverty), SDG 3 (Good health and well-being), SDG 4 (Quality education), SDG 6 Clean water and sanitation). SDG 7 (Affordable and clean energy), and SDG 15 (Life on land). On the other hand, there are some indirect risks in particular regarding delivery of SDG 13 (Climate action).

FINAL REPORT
III. Key Findings of the study
Current understanding of the impact of CDR approaches in LAC | 43
Table 4: Potential Impacts on SDGs in LAC countries*
Afforestation
Direct
positive
Indirect
positive
Direct
negative
Indirect
negative
BECCS
Direct
positive
Indirect
positive
Direct
negative
Indirect
negative
FINAL REPORT Current understanding of the impact of CDR approaches in LAC | 43

FINAL REPORT
III. Key Findings of the study
Current understanding of the impact of CDR approaches in LAC | 44
Source: Own elaboration
* This analysis on potential impacts of CDR deployment on SDGs is applicable for LAC countries in general and does not distinghish any
particular country
The above assessment of impact of large-scale deployment of CDR technologies in LAC towards the achievement of SDGs is
based on the positive and negative impacts, constraints and risks of each CDR approach, as a result of the detailed analysis
undertaken (Part II of the study) that is summarized in the following table:
Enhancing
soil
Direct
positive
Indirect
positive
Direct
negative
Indirect
negative
FINAL REPORT Current understanding of the impact of CDR approaches in LAC | 44

FINAL REPORT
III. Key Findings of the study
Current understanding of the impact of CDR approaches in LAC | 45
Table 5: Potential Constraints, impacts and risks of CDR approaches in LAC countries *
Afforestation BECCS Biochar
Key
constraints
• Land competition with other purposes
(ex: crop planted area for food
production)
• Water and nutrients requirements
• Lack of financing for long-term
investments
• Development of the value chain
downstream: wood manufacturing and
pulp and paper industry are CAPEX
intensive activities
• Land availability/ competition
• Biomass feedstock availability
• CO2 storage availability (technical
feasibility) and CO2 storage
infrastructure investment (economic
feasibility)
• CO2 transportation infrastructure
• Poor knowledge and development of
CCS phase (and therefore related
technological challenges)
• Availability of biomass for biochar
production (competition with other
uses of biomass)
• Logistic constrains: Trade-off distance
from raw material (biomass) vs
distance to plantations where to be
applied
• Technological challenges for the
development, construction and
operation of biochar plants in
Argentina
• Lack of long-term financing
alternatives for biochar plant
CAPEX
FINAL REPORT Current understanding of the impact of CDR approaches in LAC | 45

FINAL REPORT
III. Key Findings of the study
Current understanding of the impact of CDR approaches in LAC | 46
Key positive
impacts
• Proven and known technology /
practices (for implantation and
maintenance), and know how
developed along the years in the
country makes it feasible with higher
probability than other undeveloped
CDR approaches, that will be extended
in the following years
• Women are critical to ensuring the
sustainability of forests and forestry
(full contributions of women to
forestry have not been realized yet)
• Reduction of poverty levels due to job
creation, economic development and
health improvement
• Economic development and growth
• Direct and indirects jobs for forestry
and wood extraction
• Potential direct and indirect jobs in
wood manufacturing and pulp and
paper industries
• Potential development of wood
related industries: construction and
furniture (value-added products and
responsible production and
consumption )
• Affordable and clean energy provision
taking advantage of forestry residues
• Clean energy supply that increases
power autonomy and security in the
energy supply
• Direct and permanent jobs generated
in BECCS plants operation.
• Jobs created for BECCS plants
constructions and Indirects jobs
related
• Health improvement related to clean
energy and forestry requirements
• Know how and technical capabilities to
be developed
• Potential development of related
industries
• Enhanced soil properties and therefore
increasing yields (responsible
production and consumption).
Potential increase in fruit tree yields
(to be confirmed by further research),
expanding food supply
• Technological know how for the
development, construction and
operation of biochar plants
• Long-term C sequestration in soil
• Lower N2O and CH4 emmisions
• Higher soil water balance
• Potential expansion for biochar
application on other crops beyond
intensive crops as fruit trees (ex:
vegetables, legumes and tubers)
• Biochar pyrolysis is an exotermic
process which can be utilized for
power generation
• Other valuable co-products including
wood flavoring and adhesives can also
be obtained as a byproduct of biochar
(Czernik and Bridgwater, 2004)
• Direct and permanent jobs generated
in biochar plants operation.
• Jobs created for biochar plants
constructions.
• Jobs created for biochar application in
plantations. Indirects jobs related
FINAL REPORT Current understanding of the impact of CDR approaches in LAC | 46

FINAL REPORT
III. Key Findings of the study
Current understanding of the impact of CDR approaches in LAC | 47
Source: Own elaboration
* This analysis on potential constraints, impacts and risks of CDR deployment is applicable for LAC countries in general and does not
differentiate any particular country
Key negative
impacts and
risks
• Impacts on food supply and land
tenure
• Bioversity (depending on the species
to be planted)
• NOX emissions from nitrogen fertilizers
• Changes in evapotranspiration, albedo
and cloud cover
• Water scarcity
• Supply chain and land-use change
(LUC) emissions
• Water scarcity
• Soil depletion
• Pollution due to fertiliser use
• Risk of CO2 leaks during transportation
and/or storage
• Impacts on food supply and land
tenure
• In case of wood biomass, lost C
sequestration of harvested forest
• Impact on country's power generation
cost curve (in case of large-scale
adoption and significant share in the
power generation matrix due to higher
costs per MWh than other sources - ex:
hydro-)
• Logistics costs and environmental
impacts of raw material and biochar
transportation
• Lower albedo and radiative forcing
FINAL REPORT Current understanding of the impact of CDR approaches in LAC | 47

FINAL REPORT
IV. Limitations of the analysis
Current understanding of the impact of CDR approaches in LAC | 48
IV. Limitations of the analysis
The impact analysis faces certain challenges that might have effectslevel of confidence in terms
of its accuracy and level of confidence:
Large-scale CDR deployments are a novel field of research and project implementation in
Argentina, Colombia and the other Latin America countries (and, to certain extent,
globally).
Despite some knowledge gained in the technical aspects of CDR approaches, the
understanding of their large-scale deployment impacts in the economy and at the societal
level is at least scarce; moreover, the quantification of the magnitude of those impacts is
still largely incipient.
In the case of DACCS and Ocean fertilization, the knowledge gap was deemed so significant
that it was preferred not to model the potential impacts given the scarce basis of
information available or its incipient condition.
Impact analysis is estimated based on
o historical statistics with their level of accuracy depending on data collection (not
always on an annual basis) and levels of informality in the Argentine and Colombian
economies
o long-term scenario definitions that inherently present uncertainties
Over the long-term, new breakthrough technologies not yet fully developed today would
significantly impact scenarios conceived for this study.
Investment and operating costs may see significant decreases, as each technology is
massively deployed.
Comparison between countries can be affected by differences in statistical bases.
Accurate assessment of relative risk between different technologies is not yet possible, but
should also be weighed against the risks that alternative options, including following
current trajectories, would pose to successfully delivering the SDG.
The relative level of potential effects identified may also be a function of the current
extent or level of maturity of the literature available, plans and projects assessed
throughout the report.
There are large uncertainties resulting from knowledge gaps, from the complexity of the
ecosystems involved and due to interactions between different combinations of options
implemented.
Some CDR approaches covered in this study (like DACCS, Enhanced weathering, Ocean
Alkalinization and Ocean Fertilization) were not examined in terms of deep-dive impact analysis
due to lack of information for accurate modelling.
In the near term, large-scale demonstration of such CDR technologies will require targeted
government support. In conclusion, the CDR potentials that can be realized are constrained by
the lack or insufficiency of policy portfolios incentivising large-scale CDR (Peters and Geden,

FINAL REPORT
IV. Limitations of the analysis
Current understanding of the impact of CDR approaches in LAC | 49
2017), acknowledging that to elaborate those policies the rationale for these policies need to be
clear and accepted. Near-term opportunities could be supported through modifying existing
policy mechanisms (Lomax et al., 2015)

FINAL REPORT
V. Recommendations
Current understanding of the impact of CDR approaches in LAC | 50
V. Recommendations
The following recommendations aim to enable better informed decision-making on the potential
deployment of applicable large-scale CDR approaches in Latin America and the Caribbean.
Given the complexities and remaining uncertainties associated with some of the CDR
approaches analyzed, progress is required at least in:
o elaboration of integrated assessment models at the national and sectoral level
o cost-benefit analysis
o risk analysis
o intensification of ongoing scientific and technical research
o multiple pilot projects
LAC countries might face a persistent finance gap (accentuated by the pandemics). The
decision on the potential CDR development would require accurate abatement costs
information and careful consideration and assessment of implementation risks.
Overall assessment of the technical and economic feasibility of the CDR approaches
should be embedded in the framework to be provided by long-term strategies elaborated
by LAC countries, including next generation of NDCs.
Collaborative platforms and programmes of work and a common requirement for
additional international climate finance to address the need for additional resources.
The potential for coalescing robust finance flows in the context of Article 6 might
contribute to finance the required long-term transitions in LAC countries.
More transdisciplinary and geographically diverse research is required on the linkages
of large scale CDR deployment and the delivery of the Sustainable Development Goals,
which may include development of common assessment principles or metrics.
Integrated policy impact assessments are needed to understand potential policy designs
to mobilize CDR and what implications they would have for delivery of the SDGs.
Afforestation and reforestation present the largest potential of carbon dioxide removal
and the current lowest abatement cost in selected LAC countries and therefore should
be prioritized in large-scale CDR deployment in the near and mid-term.
Mangrove restoration also present a large carbon sequestration potential that could be
achieved in the near and mid-term in several countries: Brazil, Colombia, Venezuela,
Ecuador, Surinam, Guyana, French Guiana and Peru.
Argentina and Colombia are countries with intensive use of land for agriculture and
relevant activities in this area; further assessment might allow to improve knowledge on
how CDR options reinforce synergies with existing efforts to mitigate climate change
and enhance sustainable agricultural practices.
Eventhough a nascent field of research in LAC countries, enhancing soils carbon content
and technologies that include the use of biochar as a soil enhancer, as well as enhanced
weathering, could be worth analyzing deeper in a site and activity-specific manner in
order to quantify its potential impacts and risks at the field level.

FINAL REPORT
V. Recommendations
Current understanding of the impact of CDR approaches in LAC | 51
There is a good basis of research and initiatives/projects on the bioenergy side of the
BECCS equation, however there is no integral research on BECCS, per se. Incipient but
rapidly increasing installed capacity of biomass and biogas power generation plants and
biofuels production plants is being observed. Nonetheless, the focus is primarily on BE.
Biofuels applied to power generation in non-grid connected areas (distributed
generation) could have a potential for BECCS development in LAC countries, although
relevant knowledge, stakeholder commitment and implementation efforts -identified at
this point in time- are scarce.
Efforts on large-scale CDR deployment options in the short, medium and long terms
should be prioritized according to maturity and costs efficiencies.
Research and demonstration pilots (ex: DACCS, BECCS and other CDR approaches)
should start well before the suggested large-scale deployment phase in order to achieve
technology development and cost reduction. In the near term, large-scale
demonstration of such CDR approaches will require targeted government support.
Latin American and Caribbean governments could play an active role in the shaping, and
guiding of the research, development and deployment of DACCS, BECCS and other CDR
approaches, nationally, regionally and internationally.
Figure 3: Suggested Phasing of CDR Large-Scale Deployment in LAC countries
Source: Own elaboration

FINAL REPORT
IV. Recommendations
Current understanding of the impact of CDR approaches in LAC | 52
We also suggest further research for particularly ambiguous consequences of the six CDR
approaches deployment (assessed in the research, planning and implementation gap section):
Afforestation and restoration
o Updated forest inventory by province/department and by species
o Analysis of potential impact on biodiversity arising from increased afforestation
and restoration deployment
o Analysis of potential impact on land use change arising from increased
afforestation and restoration deployment
o Analysis of water requirements arising from increased afforestation and
restoration deployment
o Long-term Wood Industrialization development plan for potential value-added
realization from increased afforestation and restoration deployment
o Innovation and Technology Transfer strategies and policies in biorefineries and
nanotechnology topics
o Promotion of wood construction and its impact on the traditional construction
sector
o International insertion of SMEs related to the wood and furniture value chain
o Further analysis on bioenergy technologies for power generation from municipal
solid waste (MSW), industrial and agriculture effluents, such as poultry and
cattle residues
o Gender equality in forestry chain employment
o Schemes for long-term financing of afforestation/restoration projects
o Quantification of effectiveness of incentives and tax-exemptions for
development of afforestation/restoration projects
BECCS
o Analysis and prioritization of potential locations for new BECCS plants
o Screening and analysis of relevant technologies and processes for BECCS plants
o Determination of optimal scale of BECCS plants
o Further analysis on externalities of bioenergy projects with dry biomass and
biogas
o Analysis of potential impact on land use change arising from large-scale BECCS
deployment
o Analysis of potential impact on biodiversity arising from large-scale BECCS
deployment
o Analysis of long-term impact in electricity prices resulting from changes in
power generation matrix in scenarios of large-scale BECCS deployment
o Plans and schemes for jobs retention from outplacement of thermal and coal
plants
o Risk assessment study and risk mitigation plan for large-scale BECCS
deployment (particular focus on captured CO2 transportation and storage
phases)

FINAL REPORT
IV. Recommendations
Current understanding of the impact of CDR approaches in LAC | 53
o Analysis of materials and technologies preventing CO2 leaks
o Schemes for long-term financing of BECCS projects
o Quantification of effectiveness of incentives and tax-exemptions for
development of BECCS projects
o Innovative strategies for oriented bidding rounds for BECCS projects awarding
Biochar
o Analysis and prioritization of potential locations for biochar plants
o Screening and Analysis of relevant technologies and process for biochar
production
o Determination of optimal scale of biochar plants and analysis on its
modularization
o Analysis and prioritization of potential areas for biochar application per crop
and region (including both intensive and extensive crops)
o Determination of optimal dose and composition of biochar pellets for each crop
type and each region where to be applied
o Analysis of logistics requirements and logistics costs of biochar deployment
o Analysis of potential power generation from biochar plants (from exothermic
pyrolysis process) and industrial micro grids
o Procedures for safety production and handling of biochar
o Procedures for correct biochar application on soil
o Analysis of impact on employment and local communities related to biochar
application on plantations
o Analysis of impact on crops yields from biochar application by main crops and
regions
o Analysis of impact on soil nutrients, PH and other relevant soil properties from
biochar application by main crops and regions
o Analysis of other potential uses of biochar beyond agriculture (e.g remediation
of effluents, remediation of contaminated soils etc)
o Schemes for long-term financing of biochar projects
o Quantification of effectiveness of incentives and tax-exemptions for
development of biochar projects
Enhanced weathering land
o Analysis and prioritization of potential areas for enhanced weathering (land)
application per crop and region (including both intensive and extensive crops)
o Analysis of availability of silicate minerals for enhanced weathering deployment
o Analysis of processes and technologies for mining, grinding and spreading rocks
on a large-scale
o Determination of optimal dose, composition and size of grains of powder of
silicate minerals for each crop type and each region where to be applied
o Analysis of logistics requirements and logistics costs of silicate minerals for
deployment
o Procedures for correct silicate minerals application on soil

FINAL REPORT
IV. Recommendations
Current understanding of the impact of CDR approaches in LAC | 54
o Analysis of impact on employment and local communities related to enhanced
weathering on plantations
o Analysis of impact on crops yields from enhanced weathering by main crops and
regions
o Analysis of impact on soil nutrients, PH and other relevant soil properties from
enhanced weathering by main crops and regions
o Analysis of impact on fertilizers offset
o Schemes for long-term financing of enhanced weathering projects
o Quantification of effectiveness of incentives and tax-exemptions for
development of enhanced weathering projects
DACCS
o Screening, analysis and prioritization of processes and technologies for DACCS
facilities
o Determination of optimal scale of DACCS plants and analysis on feasibility of its
modularization
o Techno-economic feasibility analysis of DACCS plants adapted to local country
conditions
o Analysis of requirements, availability and supply chain of key materials (like
sorbents) for large-scale DACCS deployment
o Technical research on optimal sorbent composition and properties
o Analysis of requirements and availability of energy (power) for large-scale
DACCS deployment
o Analysis and prioritization of potential locations for DACCS plants
o Risk assessment study and risk mitigation plan for large-scale DACCS
deployment (particular focus on captured CO2 transportation and storage
phases)
o Analysis of materials and technologies preventing CO2 leaks
o Schemes for long-term financing of DACCS projects
o Quantification of effectiveness of incentives and tax-exemptions for
development of DACCS projects
Ocean fertilization
o Analysis and prioritization of potential areas for Ocean fertilization
o Technical research on optimal silicate mineral composition and properties
o Assessment of impacts from increased mining industry value chain activity
o Determination of optimal silicate mineral dose per km2
o Analysis of logistics requirements and logistics costs for Ocean fertilization
o Analysis and selection of optimal techniques for adding fertilization to the
ocean
o Quantification of carbon sequestration adapted to local conditions / selected
ocean areas from large-scale Ocean fertilization deployment
o Impact assessment on marine ecosystem and risk mitigation plan (ex: possible
biogeochemical side effects; seafloor ecosystems effects)

FINAL REPORT
IV. Recommendations
Current understanding of the impact of CDR approaches in LAC | 55
o Monitoring schemes of any large-scale fertilization activity
o Schemes for long-term financing of Ocean fertilization projects
o Quantification of effectiveness of incentives and tax-exemptions for
development of Ocean fertilization projects
Ocean alkalinization
o Schemes for long-term financing of Ocean alkalinization projects
o Analysis and prioritization of potential areas for Ocean alkalinization
o Technical research on optimal alkaline substances composition and properties
o Assessment of impacts from increased mining industry value chain activity
o Determination of optimal alkaline substances dose per km2
o Analysis of logistics requirements and logistics costs for Ocean alkalinization
o Analysis and selection of optimal techniques for adding alkalinity to the ocean
(ex: spreading finely ground alkaline substances over the open ocean,
depositing alkaline sand or gravel on beaches or coastal seabeds, and reacting
seawater with alkaline minerals inside specialized fuel cells before releasing it
back into the ocean; others)
o Quantification of carbon sequestration adapted to local conditions / selected
ocean areas from large-scale Ocean alkalinization deployment
o Explore feasibility of Co-production of hydrogen
o Monitoring schemes of any large-scale alkalinization activity
o Impact assessment on marine ecosystem and risk mitigation plan (ex: possible
biogeochemical side effects; seafloor ecosystems effects; surface pH; trace
heavy metals)
o Schemes for long-term financing of Ocean alkalinization projects
o Quantification of effectiveness of incentives and tax-exemptions for
development of Ocean alkalinization projects

FINAL REPORT
I. Current status of knowledge and development
Current understanding of the impact of CDR approaches in LAC | 56
PART II – ANALYSIS
I. Current status of knowledge and development
This section aims to assess in detail the current status of knowledge and development for the six
CDR approaches in Argentina and Colombia and succinctly identifies developments related to
those same approaches in other Latin American and Caribbean countries.
For each selected country, there is an introduction of national commitments germane to climate
change mitigation, according to the specifications contained in the Nationally Determined
Contributions (NDCs) and pursuant to the sustainable development goals achievement, including
the results described in each country’s Voluntary National Reports.
For each CDR approach, the analysis is performed considering three main thematic axes to
evaluate the degree of progress of the technologies in the countries under assessment:
Alignment with Government Vision and Commitment: regulatory assessment, including
ministerial resolutions, national plans, specific programmes, incentives, tax
exemptions and any other policies and policy instruments that reflect government´s
vision, commitment and priorities related to adoption of CDR approaches.
Degree of Scientific Development / Academic Literature Review: Analysis of the most
relevant research and academic documents related to the CDR approaches in the
country, including a brief description of the purpose of the research, methodology,
results, impacts and risks and conclusions (when applicable and / or available).
Initiatives and Development of Projects: Identification and analysis of initiatives and
projects adopting any of the CDR approaches in the country under study, with focus in
large scale projects
The review of knowledge, planning and implementation gaps is undertaken with the ultimate aim
of assessing the CDR technologies against the SDGs and contribute to enable the discussion on
whether the CDR technologies can be instrumental to delivering the SDGs by 2030.
To that end, our own methodological approach was applied, building upon the C2G methodology
[Honegger, et al 2018], and considering the three different dimensions to determine the current
status of knowledge, adoption in planning and empirical application of the selected CDR
approaches in the chosen countries.

FINAL REPORT
I. Current status of knowledge and development
Current understanding of the impact of CDR approaches in LAC | 57
1. Argentina
Argentina submitted its Nationally Determined Contribution (NDC), against which the country will
report its progress under the UN Framework Convention on Climate Change (UNFCCC) and the
Paris Agreement.
Argentina has presented its first Nationally Determined Contribution (NDC) in October 2015. As
from the achievements reached during the twenty first session of the Conference of the Parties
(COP 21), the Paris Agreement, the country decided to make a first effort of revision of its NDC,
submitting the ratification document in September 2016.
According to the NDC, Argentina shall not exceed a net emission of 483 million tons of carbon
dioxide equivalent (tCO2eq) by 2030. The goal shall be achieved through several means of
implementation throughout the economy, focusing on energy, agriculture, forests, transport,
industry and the waste sector. As a result of the NDC revision submitted in 2016, Argentina
improved its contribution by planning unconditional mitigation measures that manage to lower
their target from 570 to 483 million tCO2eq in 2030. The difference of 87 million tCO2eq-
between the original contribution and the reviewed one results from two main aspects. Firstly,
the change to the 2006 IPCC methodology allows for the improvement of the inventory quality
by avoiding the overestimation of the agricultural emissions, giving a difference of 79 million
tCO2eq. Secondly, the revision of more than 50 unconditional measures and the incorporation of
new ambitious measures to the national contribution imply 8 million tCO2eq of additional
reduction. Argentina has also calculated the impact of conditional measures, which if jointly
implemented could bring emissions to 369 million tCO2eq by 2030.
The share of Argentina in GHG global emissions in 2014 was 0.7%, while Argentina’s reviewed
mitigation contribution accounts for 2.8% over the total amount of unconditional reductions
informed by the UNFCCC Parties, showing a strong commitment towards the emission reduction
goal.
The Argentinean National Climate Change Cabinet (GNCC, for its Spanish acronym), created by
Presidential Decree in 2016, is chaired and coordinated at a high political level by the head of
the ministerial cabinet, and brings together representatives of approximately 12 ministries and
government secretariats.
The National Adaptation and Climate Change Mitigation Plan was published and approved
recently in November 2019, by the Resolution 447/2019 of the Secretariat of Government for the
Environment and Sustainable Development. The Plan included at least three main mitigation
measures related to the CDR approaches reviewed in this study:
Increase in afforestation: Proposes a growth from 1.4 million forested hectares to 2.0
million hectares within a decade. This would reduce emissions by 18.1 million tons.

FINAL REPORT
I. Current status of knowledge and development
Current understanding of the impact of CDR approaches in LAC | 58
Crop rotation: It points to an increase in the area cultivated with cereals (wheat, corn),
and a reduction in the area occupied with oilseeds (soybeans, sunflower), starting in 2020.
The estimate is that this would make it possible to cut emissions by 4.3 million tons.
Bioenergy: The objective is to foster biomass for energy generation, both thermal and not
connected to the grid. Emissions would be lowered by 3.4 million tons.
According to the Voluntary National Report (2020) on SDGs, “Argentina assumes the 2030 Agenda
after a sustained commitment to the provisions of the Millennium Summit. In 2003, President
Kirchner resumed the Millennium Development Goals (MDGs) as part of his government agenda,
establishing the National Council for the Coordination of Social Policies (CNCPS) as a focal point,
having participated since 2013 in dialogues and consultations on the post 2015 Agenda and the
Sustainable Development Goals (SDGs). In September 2015, during Cristina Fernández's
presidency, Argentina made a commitment to the 2030 Agenda. In December 2015, the Macri
Government continued with the CNCPS as the governing and coordinating body.”
In 2016, Argentina formed the National Inter-institutional Commission for the Implementation
and Follow-up of the SDGs, led by the CNCPS. The former, established a progress monitoring
matrix, which includes indicators, public policies and budgetary investment linked to the SDG
goals.
In 2020, the political, economic and social context differs from that of the presentation of the
first National Voluntary Report. In 2017, Argentina had started a political cycle of neoliberal
reinstatement. In December 2019, a new government assumed with focus on state leadership,
and social justice, but in a scenario of social vulnerabilities and economic weaknesses
conditioned by unsustainable external debt. The new government reaffirmed its adherence to
the 2030 Agenda by focusing on the Argentina Against Hunger Program. To which was added the
combat to the pandemic of COVID-19.
Argentina implemented early mandatory preventive social isolation measures to prevent the
spread of COVID19; construction of 12 Modular Emergency Hospitals began and a special fund was
created to acquire equipment and supplies from laboratories and hospitals. It provided support
for workers and the real economy. In the post-pandemic world, Argentina must strengthen its
productive apparatus and continue eliminating inherited and aggravated social inequalities by
COVID-19. Getting Argentina back on its feet will require restoring priorities so that, starting
with the inequities, it reaches everyone. Achieving the objectives set by the 2030 Agenda remains
a challenge and a horizon for the country.
The following tables depict the scoring for each CDR approach and each of the assessment
dimensions for Argentina, with its supportive summarized evidence for such scoring, based on
the detailed review of the current status of knowledge, planning and implementation.

FINAL REPORT
I. Current status of knowledge and development
Current understanding of the impact of CDR approaches in LAC | 59
Table 6: Argentina - Current Status of Knowledge and Development -Scoring Methodology
CDR approach Assessment dimensions Scoring Evidence for Scoring
Afforestation
and
reforestation
Scientific and Technical
Knowledge • Fourteen pieces of knowledge identified that evaluate the impact of
reforestation on fauna, soil nutrients and the ecosystem
Mainstreaming in
Government planning • Extensive track record of legal frameworks related to forestry
development and conservation (Laws 12,103/1934; 13,273/1947;
24,688/1996; 25,080/1998; 26,331/2017)
• Relevant national plans identified: 2017's National Action Plan for
Forests and Climate Change, 2018's National Plan for the Restoration
of Native Forests (18,000 ha), and ForestAr 2030 plan (2 million ha)
• Deforestation rate still at 150,000 ha per year levels (reduced from
600,000 ha per year)
Implementation of
initiatives and projects
• Ongoing large projects identified: Santo Domingo sustainability project
(since 2007 seeks to capture 600,000 CO2 tons by 2020 in 3,400 ha),
Las Yungas (REDD+ project 1.85 million-ton CO2 in 10 years in 62,000
ha) and 23 reforestation projects approved under the ForestAr 2030
plan, which will restore 1,720 hectares of native forests (and targets
to increase to 20,000 ha by 2023)
• Even though there are plans and programs in execution, the incentives
and promotion actions (i.e. financing, subsidies) are insufficient for
broader implementation
FINAL REPORT Current understanding of the impact of CDR approaches in LAC | 59

FINAL REPORT
I. Current status of knowledge and development
Current understanding of the impact of CDR approaches in LAC | 60
Bioenergy with
carbon capture
and storage
(BECCS)
Scientific and Technical
Knowledge • Nine articles have been identified analysing the potential of biomass
power generation in Argentina and feasibility of specific biofuels and
biogas plants
• Eight pieces of academic literature have been identified related to
power generation from MSW and industrial / agriculture effluents in
Argentina, assessing technology/process challenges, environmental
impacts and economic feasibility
• No academic article was identified approaching BECCS integrally in
Argentina
Mainstreaming in
Government planning • Committed to renewable energy and biofuels through legislation,
incentives and national programs (Renovar, Probiomasa) including a
minimum blend of 7% for biodiesel in diesel oil for power generation,
• 2005's National Strategy for Urban Solid Waste Management (ENGIRSU)
and 2016's PROBIOGAS program
• There is no specific Government plan or program promoting BECCS as
an integral CDR approach
Implementation of
initiatives and projects • All identified projects are focused on BE, but none of them has
reported a CCS phase, therefore there are no integral BECCS projects
planned, under construction nor in operation in Argentina
• Nearly 240 MW of installed capacity have been awarded among 69
biomass, biogas and biogas landfill projects in Renovar auctions
• Small scale biogas projects are being developed (Renovar projects,
CEAMSE project, RyVERI project and PROBIOGAS projects)
Enhancing soil
carbon content
with biochar
Scientific and Technical
Knowledge • Academic research on "biochar as soil enhancer" subject is still
incipient in Argentina.
Mainstreaming in
Government planning • No explicit mention to biochar as soil enhancer was identified in
Argentinean policies and development plans. However, there are some
incipient efforts to evaluate the direct effect of biochar on soil
carbon.
FINAL REPORT Current understanding of the impact of CDR approaches in LAC | 60

FINAL REPORT
I. Current status of knowledge and development
Current understanding of the impact of CDR approaches in LAC | 61
Implementation of
initiatives and projects • No specific initiatives or small / large-scale projects identified but
some interest shown by private actors to migrate to biochar
production.
Enhanced
weathering or
Ocean
alkalinization
Scientific and Technical
Knowledge • Multiple scientific entities (including CONICET, Naval Hydrography
Service, Argentine Institute of Oceanography, Institute of Marine and
Coastal Research, Institute of Coastal Geology) and universities are
actively conducting various investigations on oceans behaviour and
characterization in Argentine waters. Most relevant academic
literature cover the dynamics of CO2 in South Atlantic seas and the
effects of ocean acidification in the ocean ecosystems
• However, no specific academic literature was identified related to
Enhanced weathering or Ocean alkalinization
Mainstreaming in
Government planning • Creation of the National System of Marine Protected
• There are no specific national plans or programmes related to
Enhanced weathering or Ocean alkalinization
Implementation of
initiatives and projects • No specific initiatives or small / large-scale projects identified
Direct air carbon
dioxide capture
and storage
Scientific and Technical
Knowledge • No academic literature was identified related to DACCS
• However, some articles were identified analysing the CO2 capture
properties of Li4SiO4 and CO2 reactivity with Mg2NiH4, but with no
specific mention to DACCS
• A workshop on the DACCS topic was held by the National University of
Cuyo in Mendoza, Argentina in October 2018
Mainstreaming in
Government planning • No specific legislation, government plans / programmes nor academic
literature was identified in Argentina
Implementation of
initiatives and projects • In 2018 a DACCS project was announced in Mendoza province with
technology from US-based company Global Thermostat and an
estimated investment of 4 million dollars. However, as for October
2020, no progress has been reported
FINAL REPORT Current understanding of the impact of CDR approaches in LAC | 61

FINAL REPORT
I. Current status of knowledge and development
Current understanding of the impact of CDR approaches in LAC | 62
Source: Own elaboration on the basis of review of information and rating
Ocean
fertilization
Scientific and Technical
Knowledge • Idem Ocean Alkalinization. There are no specific national plans or
programs related to ocean fertilization.
Mainstreaming in
Government planning • Idem Ocean Alkalinization. Indirect academic research on oceans
behaviour and characterization and CO2 dynamics, but no specific
article on Ocean fertilization
Implementation of
initiatives and projects • Idem Ocean Alkalinization. No specific initiatives or small / large-scale
projects identified
FINAL REPORT Current understanding of the impact of CDR approaches in LAC | 62

FINAL REPORT
I. Current status of knowledge and development
Current understanding of the impact of CDR approaches in LAC | 63
Afforestation and reforestation
The following figure summarizes in a timeline, regulations, plans and programmes related to
afforestation and forest restoration CDR approaches implemented in Argentina, that are
developed in a detailed manner in the following sections.
Figure 4: Afforestation and reforestation related regulations, plans and programmes implemented in
Argentina - Timeline
Source: own elaboration
Alignment with Government Vision and Commitment
Argentina has an extensive track record of legal frameworks related to forestry, which shows its
long-term commitment with afforestation and forest restoration.
National Parks Law (N° 12.103), sanctioned in 1934, created the Directorate of National Parks
and created the Nahuel Huapi and Iguazu National Parks. This law seeks to ensure the attention

FINAL REPORT
I. Current status of knowledge and development
Current understanding of the impact of CDR approaches in LAC | 64
and conservation of forests, and in general for the existing and future development of forest
wealth in parks and reserves. Law N° 13.273, from 1948, fosters the defence, improvement and
expansion of forests. It also created a fund for afforestation and reforestation, among other
expenditures. In 1996 the Law N° 24.688 declared of national interest the preservation and
conservation of Andean-Patagonian native forests and their reforestation with the same species.
In 1998, Law N° 25.080 was enacted, establishing a regime for the promotion of investments in
new forestry enterprises and in the extensions of existing forests. In December 2018, the
mentioned Law was modified, creating the National Fund for Cultivated Forests.
More recently, Law N° 26.331 of "Minimum Budgets for the Environmental Protection of Native
Forests", or "Native Forest Law" was sanctioned in 2007, in order to regulate and manage native
forests use. Its objectives are to reduce deforestation in Argentina, the conservation of native
forests, the regulation and responsible management of forest use, and the promotion of
sustainable forest management. The law determines categories of conservation of the forests,
creates a trust fund for the conservation and promotion of forests responsible management under
a model ecosystem services payment, and establishes enforcement authorities whose mandate is
to prepare data to monitor the state of conservation of native forests, in coordination with the
provinces.
The Ministry of Environment and Sustainable Development was created in year 2015, and is in
charge of coordinating national government policies on environmental matters, establishing
strategic planning of policies and programs. Is responsible of the promotion, dissemination, and
development of activities to contribute in its scope, integrating with various state agencies, as
well as compliance with the right to a healthy environment guaranteed by the Argentine
Constitution. The Ministry is organized in secretariats: Secretariat of Environmental Control and
Monitoring, Secretariat of Climate Change, Sustainable Development and Innovation, Secretariat
of Environmental Policy in Natural Resources and Administration of National Parks.
With the aim of reinforcing the leadership position, proactivity and commitment to climate
change, during 2017, the country began developing action plans on climate change to organize
the implementation of the NDC. The most relevant national plans regarding afforestation and
forests restoration are the following:
2017's National Action Plan for Forests and Climate Change,
2018's National Plan for the Restoration of Native Forests, and
ForestAr2030 plan.
The National Action Plan for Forests and Climate Change is a public policy instrument and an
operational management tool whose general objective is to reduce emissions and increase GHG
capture in the sector, through the strengthening of the sustainable management of native
forests. The Plan has been developed and prepared by the Ministry of the Environment and
Sustainable Development (MAyDS) through the National Directorate of Climate Change (DNCC),

FINAL REPORT
I. Current status of knowledge and development
Current understanding of the impact of CDR approaches in LAC | 65
in conjunction with the National Directorate of Forests (DNB), and with the support of the United
Nations Programme on Reducing Emissions from Deforestation and Forest Degradation (UNREDD)
Argentina. Seven native forest areas are defined: Selva Misionera, Yungas (Tucumano-Bolivian
jungle), Chaqueño Park, Andean Patagonian Forest, Espinal, Monte y Delta, and Islands of the
Parana River.
Then National Action Plan comprises ten strategic axes, covered of five structural strategic axes:
1) governance strengthening, 2) strengthening of local communities, 3) management
strengthening, 4) control and monitoring capacities, 5) recognition of the importance of native
forests for society and knowledge management; and 5 strategic operational axes (actions that
represent direct interventions on native forests and that, therefore, allow quantifying the
reductions of GHG): 6) land use planning, 7) forests sustainable management, 8) productive
landscapes conservation, 9) restoration and recovery and 10) forest fire prevention.
In particular, the restoration and recovery axes seek to promote the restoration of degraded
forests and the recovery of deforested areas, through intervention actions coordinated with the
different local actors, to reduce the vulnerability to climate change of local communities that
depend on them and for the recovery of productive capacity and ecosystem services. The related
mitigation measure, which accounts for the reduction of emissions (operational axes), is the
restoration and recovery of native forests. For example, in the Parque Chaqueño region, the
objectives are the restoration and / or forest recovery of 63,000 ha and recover the degraded
forest structure in silvopastoral systems and / or restore degraded forests around cattle ranches.
The recovery of degraded forests within a 5 km radius of a cattle ranch allows the capture of
0.005 MtCO2 eq / year, while the recovery of the forest structure to reach a MBGI system is
equivalent to 0.00009 MtCO2eq / ha. It aims to restore degraded forests and areas without native
forests.
The National Plan for the Restoration of Native Forests proposes a series of activities to directly
and indirectly promote the restoration of degraded native forests and thus, simultaneously,
undertake the recovery of biodiversity and in some cases the ecosystem productive capacity, and
proceed to recapture carbon emissions caused by degradation processes. The Plan also proposes
to develop a program for a first six-year period (2018-2023) in order to reach the goal of 18,000
hectares of restored native forest by 2023. It establishes six priority areas for restoration:
Yungas and piedmont forest: Province of Jujuy, 2,734,437 ha.
Yungas-Dry Chaco Corridor: Province of Salta, 6,175,698 ha.
Sali-Dulce Basin: Provinces of Tucumán, Catamarca and Santiago del Estero, 2,922,289
ha.
Monte y Espinal: Provinces of Mendoza, San Luis, Córdoba and La Pampa, 5,000,000 ha.
Andean-Patagonian Forest: Provinces of Neuquén, Rio Negro, Chubut, Santa Cruz and
Tierra del Fuego, 6,486,075 ha.
Missionary Forest: Province of Misiones, 825,958 ha.

FINAL REPORT
I. Current status of knowledge and development
Current understanding of the impact of CDR approaches in LAC | 66
The ForestAr 2030 plan is a multisector platform that aims to conserve and expand the Argentine
forest heritage and the activation of a forest economy that promotes social, economic and
environmental development. Led by the Government Secretariat for the Environment and
Sustainable Development, it is also promoted by the Ministry of Agriculture, Livestock and
Fisheries and the Ministries of Production and Labour, Health and Social Development, Education,
Culture and Science and Technology, with the collaboration of The Nature Conservancy Argentina
(TNC). Private and non-governmental organizations also join this initiative. The plan is based on
the ability of native and cultivated forests to provide natural solutions to mitigate climate
change. The platform will facilitate Argentina's compliance with the national commitments
undertaken under the Paris Agreement and with the Sustainable Development Goals of the 2030
Agenda, through the value chains linked to forests. The expected aim for 2030 is to increase the
planted forest area to 2 million hectares; attract 7 million dollars in investments that will allow
industrialization of different regions of the country; create 187 thousand quality jobs; value
native forests by expanding sustainable management and recognition of the ecosystem services
they provide to communities; increase the value added to the forestry-industrial chain relying on
permanent policies of research, development and innovation; contribute to the adaptation and
mitigation of climate change, contribute significantly to the fulfilment of the unconditional
objective of the NDC not to exceed the net emissions of 483 MtCO2eq in 2030, through the
reduction of emissions and increased HGH capture due to sustainable management of native
forests, forestation and the entire associated value chain.
The plan has seven thematic axes: 1) Native Forests, 2) Forestation, 3) Pulp and Paper, 4) Wood
and Furniture, 5) Wood Construction, 6) Thermal Energy, and 7) Innovation.
Within the Native Forests axis (1), the objectives for 2030 are to sustainably manage the native
forests of Argentina, so that they become a source of development for the related communities,
incorporating themselves in the productive value chains in a competitive way. Thus, their
vulnerability to climate change and that of the communities that depend on the forest
ecosystems will be reduced. Also pursues the reduction of deforestation and forest degradation
by increasing the restoration and recovery of native forests (and with it associated GHG). Through
a set of additional measures, a total reduction of 81 MtCO2 eq could be achieved by 2030. It Is
expected to formalize employment correlated with forestry production with the socioeconomic
benefits that this entails for the entire community. This axis is coordinated by the Government
Secretariat for the Environment and Sustainable Development (SGAyDS) and The Nature
Conservancy (TNC).
The Forestation axis (2) aims to increase forested area, providing forest bio economy value chains
with competitive, environmentally sustainable and socially responsible goods, while also
providing environmental services, in particular, in mitigation and adaptation to climate change.
The goals are to increase the forested area up to 2 million hectares (50% growth) and to mitigate
climate change. It is expected that 64,000 direct annual forest jobs will be created with
investments over 150 million dollars annually in reforesting, management and protection (1,500
million dollars in 10 years).

FINAL REPORT
I. Current status of knowledge and development
Current understanding of the impact of CDR approaches in LAC | 67
ForestAr 2030 plan also covers the "Wood and Furniture" and "Wood Construction" axes. Wood
furniture and wood construction are relevant as both value-added products and long-term carbon
storage alternatives. The following figure summarizes the objectives, goals, impacts and critical
factors of these two axes.
Figure 5: "Wood and Furniture" and "Wood Construction" axes of ForestAr 2030 plan
Source: ForestAr 2030 plan.

FINAL REPORT
I. Current status of knowledge and development
Current understanding of the impact of CDR approaches in LAC | 68
Also related to wood construction, the Government -through several of its Ministries- signed an
Agreement in year 2017 to promote the construction of social houses with wood. The agreement,
a 10 years term, was also signed by representatives of the construction and wood industry unions;
real estate chambers, logging federations and banking associations. In addition, it establishes
that at least 10% of social housing financed by the State through the Undersecretariat of Housing
and Urban Development will be built with wood and also provides training in this type of
construction to the provincial housing institutes.
Another relevant legislation was the Resolution E-3/2018 of the Undersecretariat of Housing, in
which the wood construction system was established as traditional construction, and therefore
the Certificate of Technical Aptitude (CAT) is no longer required for presentation in social housing
plans.
Degree of Scientific Development / Academic Literature Review
An exhaustive search was undergone in order to identify scientific articles on the subject, Main
relevant papers are summarized with their main findings:
Ianni, E., et al. 2010. Applying the Ecosystem Approach to Select Priority Areas for
Forest Landscape Restoration in the Yungas, Northwestern Argentina. Environmental
Management 46, 748–760.
This paper proposes a method to select forest restoration priority areas consistently with the key
principles of the Ecosystem Approach (EA) and the Forest Landscape Restoration (FLR)
framework. This study represented the first attempt to apply EA principles to forest restoration
at landscape scale in the Yungas region. The benefits obtained by the application of the method
were twofold: on one hand, researchers and local actors were forced to conceive the Yungas as
a complex net of rights rather than as a sum of personal interests. On the other hand, the
participatory multicriteria approach provided a structured process for collective decision-making
in an area where it has never been implemented.
Falasca S. et al. 2011. Forestations with paradise (Melia Azedarach L.) as a mitigating
climate change species in Argentina. III International Congress on climate change and
sustainable development. CONICET.
The objective of the work was to zoning the Argentine agroclimatic aptitude, in order to reforest
degraded areas and contribute to carbon sequestration and obtaining oil (biodiesel and
bioinsecticide). Since its potential as an invasive weed was proven, it is not recommended
afforestation in the traditional agriculture zone, unless it is land to be restored. Under humid
climate conditions, afforestation is recommended in those lands that need restoration (perennial
species), as cultural work is reduced and contributes to soil improvement, and at the same time
produces industrial oil for biodiesel and / or bioinsecticid.
FINAL REPORT
I. Current status of knowledge and development
Current understanding of the impact of CDR approaches in LAC | 69
Falasca S. et al. 2011. The introduction of the cultivation of oil carob (Pngamia pinnata)
promising species to deal with climate change. III International Congress on climate
change and sustainable development. CONICET.
The species Pongamia pinnata, known as oil carob, a legume native which can sequester 2-3 t
CO2 / ha in 2 years life. By virtue of the aforementioned qualities and its resistance to drought,
it is emerging as an alternative crop for Argentina, which could even replace soybeans as a
biodiesel input in some sectors of the country. The objective of this work was to delimit the area
suitable for the cultivation of this species, emphasizing marginal lands. The superposition of the
layers containing information on the spatial variability of the agroclimatic indices allowed to
obtain the agroclimatic aptitude map for its possible introduction in the country.
Lopez Lauenstein D. et al. 2012. Differences in drought responses of seedlings of
Prosopis chilensis, P. flexuosa and interspecific hybrids: implications for reforestation
in arid zones. Ecología Austral 22:43-52.
The objectives of this study were (1) to determine the differential response in growth and survival
of seedlings of P. flexuosa, P. chilensis and interspecific hybrids under controlled water stress
conditions, and (2) to determine the influence of an imposed treatment of drought hardening in
the greenhouse on the plant’s performance in the field. In controlled water stress conditions, P.
flexuosa showed less growth under control treatment (no stress), however under stress treatment
was the least affected by water strain. By contrast, P. chilensis was the most susceptible to
drought stress, response that could be enhanced by hardening treatment before planting. The
hybrid was similar to P. chilensis (under stress treatment and control treatment), but showed
grate survival rate, similar to P. flexuosa. Both P. chilensis and hybrids showed a positive effect
of hardening, but in P. flexuosa only this effect was observed at the driest site.
Berthrong, S T et al. “Soil C and N changes with afforestation of grasslands across
gradients of precipitation and plantation age”; Ecological Applications 22(1), 2012.
The purpose of this study was to test how labile and bulk pools of soil organic carbon (SOC) and
total soil nitrogen (TN) is modified with afforestation across a rainfall gradient of 600–1500 mm
in the Rio de la Plata grasslands of Argentina and Uruguay. The sites were all former grasslands
implanted with Eucalyptus spp. Overall, it found that afforestation increased (up to 1012 kg
Cha1yr1) or decreased (as much as 1294 kg Cha1yr1) SOC pools in this region and that these
changes were significantly related to mean annual precipitation (MAP). Drier sites gained, and
wetter sites lost, SOC and TN (r21⁄40.59, P1⁄40.003; and r2 1⁄40.57, P1⁄40.004, respectively).
Labile C and N in microbial biomass and extractable soil pools followed similar patterns to bulk
SOC and TN. Interestingly, drier sites gained more SOC and TN as vegetation species aged, while
losses reversed as vegetation species aged in wet sites, suggesting that, in addition to
precipitation, the age of trees is a critical driver of changes in soil organic matter with
afforestation. This new evidence implies that longer intervals between harvests for plantations
could improve SOC storage, ameliorating the negative trends found in humid sites. The results

FINAL REPORT
I. Current status of knowledge and development
Current understanding of the impact of CDR approaches in LAC | 70
suggest that the value of afforestation as a carbon sequestration tool should be considered in the
context of precipitation and age of the forest.
Garay Schiebelbein, M M. “Carbon sequestering and vertical pattern of chemical
properties in forested molisols with Pinus radiata”; Doctoral thesis in Agronomy,
Universidad Nacional del Sur, 2015.
Afforestation on grassland lands could significantly alter the properties of soils, degrading them.
The objective of the work was to explain the magnitude of the modifications occurred in the soil
as a result of the replacement of natural vegetation by conifers, and evaluate both the CO2
sequestration capacity and the potential risk of environmental pollution derived from the
implementation of this practice in the Ventania area (Province of Buenos Aires). Treatments
included six mature Pinus radiata (TB) stands and adjacent areas with natural vegetation
(baseline; TP). The study concluded that the change in land use created conflicting
environmental effects, incompatible with the principles of sustainability. The adoption of a
recommended practice to reduce the concentration of atmospheric CO2, through afforestation,
showed high efficiency for this purpose. However, afforestation with P. radiata in grassland lands
drastically affected the quality of the soils and even generated a potential risk of pollution of
biological origin capable of transcending the limits of the stands.
Barrionuevo S. A. et al. 2015. Estimating the CO2 fixed by a stand of Pinus halepensis
(Miller) in Santiago del Estero, Argentina. Foresta Veracruzana 17(1):27-32.
In this paper the importance of forest plantations as alternatives for mitigation is introduced.
The CO2 fixed by the aerial biomass of an approximately forty-year old stand of Pinus halepensis
was estimated. Extracting methods in situ together with allometric equations allowed to
determine that the stand fixed 5 tons of CO2 per ha.
Arzuaga S. A. 2016. Carbon and Nitrogen stocks and stratification ratios in oxisols under
forest systems. Ciencia y Suelo (ARGENTINA) 34(1): 13-20.
The objective of this study was to assess the effect of deforestation and subsequent conifer
reforestation on carbon stocks and nitrogen stock, and their stratification ratios in Oxisols. Lower
values for soil organic carbon and total nitrogen content, as well as their respective stock decline,
were indicative of soil degradation in the pine plantation. The carbon stratification ratios were
higher in the subtropical rainforest (>2) which indicated enhanced soil quality. Carbon
accumulation rate in the forest soil was - 0.86 Mg C ha-1 year-1, which revealed soil carbon loss.
Removal of the subtropical rainforest and subsequent conifer reforestation reduced SC and SN by
28% and 51%, respectively
De Paz, M et al. “Review of revegetation experiences for the purpose of restoration
in forests of Argentina”; Ecología Austral, 29:194-207; August 2019.

FINAL REPORT
I. Current status of knowledge and development
Current understanding of the impact of CDR approaches in LAC | 71
A bibliographic review was carried out in order to ascertain the current status of revegetation
interventions for restoration purposes and the most used techniques in the different forests of
Argentina´s ecoregions. It was concluded that of 137 projects, which cover the period 1957-
2015, little published information is recorded (50% of the experiences). At the regional level,
the largest intervened area was in the Dry Chaco, the Andean-Patagonian Forest and the Jungle.
The most used source of financing was the State (83%), followed by NGOs (12.1%), private (9.6%)
and, lastly, international funds (7%). Most of the revegetation experiences were carried out
through planting native species (89.9%) and with closures against herbivores (50%). The two
techniques that generated a positive effect on the survival of the seedlings were the use of
irrigation and exclosures against herbivores.
Araujo, P I et al, “A shady business: pine afforestation alters the primary controls on
litter decomposition along a precipitation gradient in Patagonia". Argentina Journal of
Ecology, 103, 1408–1420, 2015.
Researchers concluded that concurrent changes in plant cover in natural vegetation NV with
increasing mean annual precipitation (MAP) resulted in reduced incident solar radiation at the
soil surface and decreased the relative importance of photodegradation as a control on surface
mass loss. These changes eclipsed direct effects of water availability, litter quality and soil
nutrients. In contrast, increased shade and recalcitrant litter with afforestation in PP sites
combined such that photodegradation was entirely eliminated as a control and biotic
decomposition was much reduced. While afforestation projects are promoted as a strategy to
mitigate increased atmospheric carbon dioxide due to human activity, the results highlight that
primary controls of litter decomposition were substantially altered with unexpected
consequences for the C balance of these ecosystems.
Hess, L J T et al. “Pine afforestation alters rhizosphere effects and soil nutrient
turnover across a precipitation gradient in Patagonia, Argentina”; Springer
International Publishing Switzerland 2017.
Researchers investigated the effects of exotic planting of Pinus ponderosa on Carbon (C) and
Nitrogen (N) cycling in the rhizosphere along a precipitation gradient in Patagonia, Argentina.
They measured C mineralization, microbial biomass-C, and soil enzyme activity in rhizosphere
and bulk soil collected from pine plantations and native vegetation. Rhizosphere effects were
calculated as the percent difference between paired rhizosphere and bulk soil samples. In
afforested sites, they found enhanced rhizosphere effects for C mineralization and microbial
biomass relative to native vegetation, but not for enzymatic activity. The absolute values of all
evaluated variables were significantly reduced in pine plantations compared to native
vegetation. We also observed strong correlations between enzymatic activity, and soil organic
matter and microbial biomass. For both pine and native trees species, rhizosphere effects for N-
degrading enzymes were positively correlated with precipitation. They concluded that Pine
afforestation reduced overall N turn over and microbial activity in these ecosystems. Data suggest
that these reductions may be driven by reductions in soil organic C pools. Additionally, ecosystem

FINAL REPORT
I. Current status of knowledge and development
Current understanding of the impact of CDR approaches in LAC | 72
water availability may directly or indirectly regulate the magnitude of rhizosphere effects on N
cycling independent of plant species. The negative impacts of afforestation on N cycling should
be considered in evaluating the long-term potential for C sequestration in these human modified
ecosystems.
Sione S M, et al. “Carbon fraction in the biomass of Prosopis Affinis sprengel (fabaceae)
in a native espinal forest Argentina”. Rev. Facultad de Agronomía UBA, 39 (1): 6-15,
2019
The aim of this study was to determine the C fraction in the biomass components of the
ñandubay tree (Prosopis affinis), and its variation by diameter class, in a native forest of Espinal
(Entre Ríos, Argentina). The results obtained provide precision to the estimation of C and CO2
emissions stored from deforestation and degradation of the Espinal native forests. The C
fraction was analysed in the components of the above-ground biomass (trunks, T; large
branches, LB; and small branches+leaves+flowers+fruits, SBLFF), on 30 types of five different
diameter classes. The mean value of the C fraction was 0.474 ± 0,023. Considering the biomass
partitioned by component, and the C fraction of each, the weighted average C fraction was
0,472 ± 0,013. The C fraction of T showed significant statistical differences (p<0,05) between
diameter classes; the highest values were found in individuals with trunk diameters larger than
20 cm. The values obtained in this study are lower than the default value suggested by the
Intergovernmental Panel on Climate Change (IPCC) (0,50).
Marquez, J A et al. “Stream macroinvertebrate communities change with grassland
afforestation in central Argentina”; Limnologica 53, 17-25, 2015.
The aim of this study was to analyse the effect of pine plantations on benthic invertebrate
communities in mountain grassland streams. Additionally, researchers assessed if the
hydrological period modifies the effect of afforestation on stream invertebrates. Changes in light
intensity, hydrology and coarse organic matter inputs produced by afforestation alter fluvial
habitats and consequently the composition and trophic structure of invertebrate communities in
grassland streams of Córdoba mountains. Three headwater streams draining grasslands
(reference streams) and three draining plantations of Pinus elliottii were selected in a mountain
watershed of Córdoba province. Hydrologic and physicochemical variables were registered and
benthic invertebrate samples were collected in each stream at two different hydrological
periods. Total invertebrate abundance, richness and diversity were reduced in afforested streams
as well as the number of indicator taxa. In addition, invertebrate functional structure (i.e.
taxonomic richness and total and relative abundance of functional feeding groups, FFG) showed
differences between streams with different riparian vegetation and between hydrological
periods. Total abundance of all FFGs was lower in afforested streams and scrapers’ relative
abundance was higher in grassland streams at the low water period. In addition, in most FFGs
richness was diminished in afforested streams.

FINAL REPORT
I. Current status of knowledge and development
Current understanding of the impact of CDR approaches in LAC | 73
Vargas G. G. 2020. Effects of reforestation with species from genus Prosopis in the
biodiversity of Epigeal arthropods: Comparison of environments with different
conditions natural and anthropic recovery for the Monte Central, Mendoza. Thesis to
qualify for the degree of Resource Engineer Natural Renewable. Faculty of Agricultural
Sciences, Universidad Nacional de Cuyo.
The objective of this Thesis was to determine if reforestation with specimens Arboreal Prosopis,
influences the diversity and composition of arthropods that live on the ground locally, under
the canopy and intercanopy and on a regional scale comparing it with other communities
present in the ecoregion, among them Larrea divaricata, fields that have been burned and
Prosopis forests preserved. The results suggest that the reestablishment of environments by
reforestation with Prosopis flexuosa and Prosopis chilensis plays an important role in the
composition or structuring of soil-dwelling arthropod communities, although the same results
have not been obtained for the numerical variables of biodiversity.
Another relevant articles from earlier than the recent ten-year period defined are the following:
Nuñez, M A et al. “Afforestation causes changes in post-fire regeneration in native
shrubland communities of north-western Patagonia, Argentina”. Journal of Vegetation
Science 18: 827-834, 2007.
The article surveyed four sites in Chall–Huaco valley, located in northwest Patagonia. Each site
was a vegetation mosaic composed of an unburned Pinus ponderosa plantation, a plantation
burned in 1996, and an unburned matorral and a matorral burned by the same fire. This study
shows that plantations of exotic conifers affect native vegetation even after they have been
removed, as in this case by fire. The cover of all vascular plant species was recorded. Researchers
found that fire had different effects on native matorral and pine plantations. Five years after
fire, plantations came to be dominated by herbs and exotic species, showing differences in
floristic composition. In contrast, matorral communities remained very similar to unburned
matorral in terms of species richness, proportion of woody species, and herb species and
proportion of exotics. Also, pine plantations were primarily colonized by seedlings, while
matorrals were primarily colonized by re-sprouting. In conclusion matorrals are highly fire
resilient communities, and the practice of establishing plantations on matorrals produces a strong
reduction in the capacity of matorral to return to its original state. The elimination of shrubs
owing to the effect of plantations can hinder regeneration of native ecosystems. Burned
plantations may slowly develop into ecosystems similar to the native ones, or they may produce
a new ecosystem dominated by exotic herbs.
Initiatives and Projects Development
In Argentina, numerous projects are being conducted, some of them are developed by the
government and others by non-governmental organizations and private funds.

FINAL REPORT
I. Current status of knowledge and development
Current understanding of the impact of CDR approaches in LAC | 74
Since 2007, Novartis Argentina in association with GMF Latin America has carried out the “Santo
Domingo” sustainability project. With an initial investment of 16 million dollars, it is a unique
project due to its triple economic, social and environmental impact. It is located on a 3,400-
hectare property located in Ituzaingó, Corrientes province, 24% of that surface is covered by
reserves of native forests, grasslands, riparian corridors and natural water springs. Since 2007,
more than 3.5 million trees of 20 different species have been planted. As part of its initial
objectives, it seeks to capture 600 thousand tons of carbon by 2020 and four billion tons by 2040.
Regarding the socioeconomic impact, the benefits are observed in local communities, since it
generates, indirectly, the creation of employment. This project in terms of sustainability is
positioned as a sustainable development plan in accordance with the objectives established by
the United Nations Global Compact.
Another project, carried out by Latin American GMF, targets the reduction of emissions resulting
from deforestation and forest degradation in the native forest of Las Yungas in north-western
Argentina. With an investment of 8.3 million dollars, it comprises an area of 62,000 hectares in
the provinces of Jujuy and Salta. With an expected duration of 20 years, an initial investment
phase of 10 years, it seeks to mitigate 1.85M tn CO2 in 10 years (3.3 tn CO2 / ha / year). In terms
of the Sustainable Development Goals of the United Nations, this project seeks to meet at least
10 of the 17 goals: life and land, climate action, responsible consumption and production, clean
water and sanitation, no poverty, gender equality, decent work and economic growth,
partnerships for de goals, reduced inequalities and sustainable cities and communities.
Tree nation is carrying out a reforestation project in the Yungas jungle in the province of
Tucuman. This project started in 2002, with an environmental and social strategy. The aim was
to conserve and restore the forest in order to recover the richness of the ecosystem. Since the
beginning of the project they have planted approximately 100 000 trees of which 70 000 are
concentrated in an area of 300 hectares. The aims of the project are: recover the upper layer of
the forest, improving the quality of the ecosystem services, enhance the value of the native
forest; quantify and maximize the carbon sequestration of the native forest; identify the richness
of the present biodiversity, in particular of endemic and endangered species; involve the local
community promoting social development.
Under the umbrella of ForestAr 2030 plan, 23 reforestation projects were approved, which will
handle 1,720 hectares of native forests in northern and southern parts of the country, as part of
the plan to recover 20 thousand hectares up to the year 2023. The winners of the 23 projects
were located in three places: the Salí Dulce Basin (Tucumán, Catamarca, Santiago del Estero),
Monte and Espinal (Mendoza and San Luis) and Andean Forest Patagonian (Neuquén, Río Negro,
Chubut, Santa Cruz, Tierra del Fuego), which are added to the eight experiences of restoration
that are in force in Chaco, Jujuy, Mendoza, Misiones, San Luis, Santiago del Estero, Buenos Aires
and Chubut. The initiative, which estimates to create 5 thousand jobs in the coming years, has
an investment over 30 million Argentinean pesos from the Program National Forest of Native
Forests, managed together with the United Nations Program for the Development (UNDP). What

FINAL REPORT
I. Current status of knowledge and development
Current understanding of the impact of CDR approaches in LAC | 75
follows is a new call, for the second half of the year, destined to the Northwest and Northeast
of the country.
Regarding the wood construction based on sustainable managed forests, in June 2019, a new
industrialized wooden-housing factory was inaugurated in the Posadas Industrial Park. It was
materialized through the creation of a partnership between seven SMEs nucleated under the
Association of Forest Producers and Industries of Misiones and NE of Corrientes (APICOFOM) with
a 10 million dollars investment. The factory is equipped with German technology by the
technological provider Weinmann, and will be capable of producing up to 8,000 houses annually,
increasing the total national capacity of industrialized wood-housing from 3,000/4,000 to 12,000
houses per year.
Bioenergy with carbon capture and storage (BECCS)
The following figure summarizes in a timeline, regulations, plans and programmes related to
BECCS CDR approaches implemented in Argentina, that are developed in a detailed manner in
the following sections.
Figure 6: BECCS related regulations, plans and programmes implemented in Argentina - Timeline
Source: own elaboration

FINAL REPORT
I. Current status of knowledge and development
Current understanding of the impact of CDR approaches in LAC | 76
Alignment with Government Vision and Commitment
The country has set a legal framework that regulates and promotes bioenergy as a renewable
energy source according to the following laws and programmes.
The biofuels Law N° 26,093 passed in 2006, states that biofuels are bioethanol, biodiesel and
biogas, which are produced from raw materials of agricultural, agro-industrial or organic waste
origin, and determines that quality requirements will be established by the enforcement
authority. The law aims to promote and control sustainable production and use of biofuels, as it
establishes the requirements and conditions necessary for the authorization of the biofuel
production and mixing plants and the requirements and selection criteria for the presentation of
projects.
In 2006, the Law N° 26,190 "Legal Regulations on National Promotion for the Use of Sources of
Renewable Energy to Generate Electric Power" was sanctioned. It declared of public interest the
generation of electric power from renewable energy sources, in order to supply the electricity
public service and to conduct research, develop technology and manufacture equipment.
Established sources of renewable energy are non-fossil sources of renewable energy suitable to
be used in a sustainable way in the short-, medium- and long- term: wind energy, solar thermal
energy, solar photovoltaic energy, geothermic energy, tidal energy, energy from ocean currents,
hydraulic energy, biomass, landfill gas, treatment plant gas, biogas and biofuels.
In 2015, the previous law was modified by Law N° 27,191 "Legal Regulations on National
Promotion for the Use of Sources of Renewable Energy – Electric Power Generation". Established
the creation of the Trust Fund for the Development of Renewable Energies (FODER). Promoted
incentives and benefits for those who generate energy from renewable sources. Sets a goal to
reach a contribution of renewable energy sources equal to 20 % of total national consumption of
electric power by end of 2025.
In 2016 the Renovar plan was launched. The objective of the RenovAr program is to reach 10,000
MW by 2025. The Program is designed to achieve several objectives simultaneously: assign
contracts in a transparent and competitive way; minimize the long-term cost to be paid by
consumers; respect the legal mandate of technological and geographic diversification; and,
establish incentives for the development of the national industry of renewable generation
equipment. It is carried out through periodic public tenders. There have been 3 award rounds.
Round 1: 29 projects with 1,142 MW total capacity were awarded (mainly solar and
wind power projects), out of which 15 MW correspond to biomass and 9 MW to biogas.
The reduction of CO2 emissions is expected to reach 2 million tons CO2 / year.
Round 1.5: 30 projects with 1,281 MW total capacity were awarded (mainly solar and
wind power projects). There were no projects awarded related to biomass or biogas.

FINAL REPORT
I. Current status of knowledge and development
Current understanding of the impact of CDR approaches in LAC | 77
Round 2: 88 projects with 2,043 MW total capacity were awarded (mainly solar and
wind power projects), out of which 143 MW to biomass, 56 MW to biogas and 13 MW to
landfill biogas.
Round 3: 38 projects with 259 MW total capacity were awarded (mainly solar and wind
power projects), out of which 8.5 for biomass, 13 MW for biogas, 5 MW biogas from
landfill.
The Ministry of Agriculture has a program called Probiomasa to encourage energy production with
biogas and biomass through renewable energy tenders. This program ended in June 2020 but
discussions are ongoing for an extension that would focus on agricultural and agro industrial
waste. Its objectives are to convert a total of 1,889,153 tons of waste per year (estimated in
2016), reaching a total of 12,515,637 tons of waste by 2030, into useful by-products for power
generation; mobilize investments, estimated at 3,216 million to install 200 electric MW and 200
thermal MW in 2016 and approximately 25.7 billion pesos to install 1,325 electric MW and 1,325
thermal MW in 2030. The estimated emission reductions would reach: 1.2 million tCO2e / year
in 2016 and 8.3 million tCO2e / year in 2030.
In conclusion, there are some regulatory precedents to mandating fuel and energy resources that
have resulted in current and planned installed capacity of thermoelectric generation from
bioenergy sources that could include CCS in the future. Although not focused on CCUS —as in the
case of other government programmes referred in this document— PROBIOMASA serves both as a
regulatory precedent to be considered for future regulations potentially promoting BECCS. The
programme is also relevant as one of the initiatives that catalysed the addition of Bioenergy-
powered generation both on-grid and off-grid in Argentina. Additionally, PROBIOMASA results
serve as a basis for bioenergy power generation potential assessment for the scenarios to be
included in next phases, and thus, for the appraisal of BECCS potential.
Degree of Scientific Development / Academic Literature Review
The research performed shows that the academic activity in Argentina only covers the BioEnergy
(BE) part of BECCS and that no integral BECCS literature was identified.
The most relevant academic literature identified and reviewed related to Bioenergy in Argentina
is summarized in this section.
Pieragostini, C. "Optimal design and planning of bioethanol production from corn in
Argentina including life cycle analysis ". Doctor on Chemical Technology thesis.
Universidad Nacional del Litoral, Faculty of Chemical Engineering. 2014.
The life cycle analysis of bioethanol production was carried out from corn. Three technologies
for ethanol production were evaluated: conventional (T1), with electricity (T2) and natural gas
obtained from the network (T3), a cogeneration system powered by natural gas and corn stubble.
The last two technologies practically did not require electricity from the grid but instead sell the

FINAL REPORT
I. Current status of knowledge and development
Current understanding of the impact of CDR approaches in LAC | 78
excess to the grid. From the comparison between the production technologies considered, T3
technology, which includes cogeneration with stubble, has energy advantages compared to the
other two, even without considering the by-product generated. In contrast, T2 technology, which
includes natural gas cogeneration has a more unfavourable energy balance or equal to the T1
conventional technology.
Manrique S. et al. "Agricultura; crops and their role as reservoirs of carbon and energy
sources". Avances en Energías Renovables y Medio Ambiente; Vol. 16, 2012.
The objective of this work was to analyse the mitigation potential of agricultural residual biomass
generated from main productions of the municipality of Coronel Moldes, province of Salta (chili,
Criollo tobacco and Virginia tobacco). Two general mitigation strategies were considered: i) as a
carbon reservoir (C) and ii) as a renewable energy source neutral in C emissions, which would
partially replace the fossil fuels used. The use biomass would avoid around 500 tCO2/ year with
economic and environmental benefits.
Chalco Vera, J. E. "Greenhouse gas emissions in sugar cane in Tucumán, Argentina:
incidence of the burning of the stubble and nitrogen fertilization". Doctoral thesis
Biological Sciences, Faculty of Agronomy and Zootechnics Universidad Nacional de
Tucuman. 2018.
This study quantified GHG emissions from green-cane harvested sugarcane with and without post-
harvest burning in Tucumán (Argentina). Treatments were: (a) harvest without sugarcane burning
(neither before nor after), and (b) harvest with trash burnt after harvest. There were significant
emission rates of CO2 and N2O during the sugarcane cycle in Tucumán, but no evidence of CH4
emissions or uptakes. N2O and CO2 emission rates were higher in the no-burning treatment than
in the burnt option, but only partially of the crop cycle. The former is apparently associated with
the application of nitrogen fertiliser, while the higher CO2 emissions seem to be associated with
trash retention. There were no significant correlations between environmental factors and
emission rates. Although these results seem pessimistic, in the context of an entire crop GHG
balance (including the emissions due to burning before or after harvest) green-cane harvesting
without burning could effectively lead to a reduction of total GHG emissions during the crop
cycle.
Manrique, S. et al. "Native Forests: Bioenergy or Carbon Sequestering?". Avances en
energias renovables y medio ambiente, Vol 16. 2012
The objective of this research was to analyse the alternative uses of native forests of the
municipality of Coronel Moldes, La Viña department, Salta province, in order to maximize GHG
mitigation considering two main strategies: i) their potential as carbon reservoirs and ii) their
potential as a renewable fuel source. Despite seeming two contradictory proposals, the present
work concludes that both can be adequately combined, allowing to obtain concrete results in

FINAL REPORT
I. Current status of knowledge and development
Current understanding of the impact of CDR approaches in LAC | 79
GHG mitigation, and also achieve extra benefits in the provision of goods and services generated
by forests from their natural ecosystem functions.
S. Montico. Bioenergy production capacity in the province of Santa Fe, Argentina. Cien.
Inv. Agr. 36(32):465-474. 2009.
The objective of this work was to value the capacity of this province for bioenergy production
from grains transformation into biofuels and the biomass energy from crop straw, and considers
the impact on soils from removed crop residues. Crop residues of the ten most important grain
and oilseed crops (15.2x10⁶ Mg year-1) and bioethanol and biodiesel from soybeans and corn,
would deliver 295,383 TJ. The residues would provide potentially 72.1% (32.4x10⁶ DB, 282.9 PJ
or 45.6x10¹² kcal) and biofuels 27.9%. The removal of residues for this purpose would have risky
consequences for the sustainability of agricultural productivity, particularly on soil conservation
and stability of production systems.
van Dam, J. et al. "Large-scale bioenergy production from soybeans and switchgrass in
Argentina Part B. Environmental and socio-economic impacts on a regional level".
Renewable and Sustainable Energy Reviews 13 (2009) 1679–1709.
The impacts for two bioenergy chains (soybeans and switchgrass) are assessed for a set of defined
land use scenarios in La Pampa province. The carbon stock change for switchgrass ranges from
0.2 to 1.2 ton C/ha/year and for soybean from 1.2 to 0 ton C/ha/year, depending on the scenario.
The GHG emission reduction ranges from 88% to 133% for the switchgrass bioenergy chain
(replacing coal or natural gas) and from 16% to 94% for the soybean bioenergy chain (replacing
fossil fuel) for various lifetime periods. The annual soil loss, compared to the reference land use
system is 2–10 ton/ha for the soybean bioenergy chain and 1–2 ton/ha for the switchgrass
bioenergy chain. It is concluded that the scenario approach enables to understand the complexity
of the bioenergy chain and the underlying factors influencing the sustainability principles. It is
difficult to give ex ante a final conclusion whether a bioenergy chain is sustainable or not as this
depends on the previous land use system but also on other factors as the selection of the
bioenergy crop, the agroecological zone and the agricultural management system applied.
Roberts, J. J, et al. "Assessment of dry residual biomass potential for use as alternative
energy source in the party of General Pueyrredón, Argentina." Renewable and
Sustainable Energy Reviews Volume 41,568-583. January 2015.
The article assesses the residual biomass availability and its energy potential in the Party of
General Pueyrredón, a region located southeast of the Buenos Aires province. These were
considered herbaceous and vegetable residues derived from the agricultural activity developed
in the region, and forest residues resulting from the pruning of urban trees and garden
maintenance. The calculations resulted in an availability of residual biomass of 204,536 t/year,
implying an energy potential of 2605 TJ/year. The authors concluded that the residual biomass
energy potential is significant in the studied region, but a more detailed study must be conducted

FINAL REPORT
I. Current status of knowledge and development
Current understanding of the impact of CDR approaches in LAC | 80
to assess the techno-economic feasibility of using the available residual biomass as alternative
energy source.
Chemes, E. D. "Generation of bioenergy from residual biomass in feedlot." Final
Integrative Project to qualify for the Higher Academic Degree of Bioenergetic
Engineering Specialist. Universidad Tecnológica Nacional, Facultad Regional Tucuman.
2019.
The possibility of generating bioenergy from the residual biomass of a feedlot is studied.
Specifically, the pre-feasibility of treating organic waste or manure generated in a feedlot is
analysed through the application of bio-digestion technology and the possibility of generating
electricity from the obtained biogas, with the option to deliver to the distribution network the
excess energy. The study shows that it is only feasible for large productive establishments,
greater than 10,000 stocks or head of cattle. Specifically, a feedlot of 15,000 heads (assuming
one hundred percent occupancy) has a biogas production potential of 7,150.1 m³ / day, which
translates into an electrical energy production of 14.30 MW / day, barely exceeding the minimum
power of 0.5 MW established by the RenovAr 2 program.
A. Fernandez, et al. 2016. Kinetic study of regional agro-industrial wastes pyrolysis
using non-isothermal TGA analysis
This study focused on the pyrolytic behaviour at different heating rates of six kinds of
lignocellulosic biomasses: peach, plum and olive pits from canneries and jam -industries, marc
and stalk from wineries, and sawdust from the timber industry. All these industries are located
in the San Juan province. The Cuyo Region, particularly San Juan Province, contains readily
available biomass waste materials that can be used as feedstock to produce fuels and chemicals,
thus improving the economy of the area and contributing to the technological development of
renewable energy sources. In order to use these agro-industrial solid wastes for energy
production, the thermal decomposition under different environment must be studied. The
research is key to evaluate other thermal process as waste combustion and gasification.
Manrique S.M., et al. 2020. Panorama de tecnologías de bioenergía en Argentina.
INENCO
The panorama of bioenergy in Argentina, and its thermal and electrical applications, is surveyed
in this study. Advances in solid biomass conditioning experiences in the form of pellets, chips and
coal are analysed. Some of the most notable energy uses of the country are mentioned, which
account for the diversity of resources, but still point out technical, technological and logistical
aspects that must be resolved. Particularly, technology imports are required, and national
production is scarce.
FAO, 2020. Valorization of externalities of projects with dry biomass and biogas.
Collections of technicals reports nr 12. Buenos Aires.

FINAL REPORT
I. Current status of knowledge and development
Current understanding of the impact of CDR approaches in LAC | 81
https://doi.org/10.4060/ca8761es
The objective of this document was to economically value the positive externalities of biogas
and dry biomass projects in regard to wind and solar projects, since the latter have the lowest
price of electricity generation and the highest power awarded in the rounds of the RenovAr
program. More than 60% of the externalities value corresponds to socio-economic aspects that
are an indirect and induced consequence of investment, employment and taxes, and reach up to
75% in the case of biogas. The rest of the externalities are related to the electricity sector (firm
power) and environmental benefits.
Initiatives and Projects Development
By September 2020, Argentina’s interconnected system’s (MEM) installed capacity reached
41.164 MW, showing a compound annual growth rate of 4.6% between 2015 and today.
Argentina’s installed capacity has been recently enhanced (2016- to date) due to a set of
measures based in the “electricity emergency state” enacted by decree 134/2015, which
launched several auction processes for increasing thermal installed capacity through power
purchase agreements (PPAs).
Complementarily, as described in the government alignment section, Law 27,191 (2015) had
previously set renewable energy targets for the interconnected grid, establishing a mandatory
pathway to reach a renewable (excluding large hydro) share of the supply equivalent to 20% of
power demand by 2025. Based on Law 27,191, several rounds of renewable energy actions were
set in the framework of the RenovAR programme.
In the context of the RenovAr plan, a total of 185 projects were awarded, 20 of which correspond
to biomass, 43 to biogas and 5 biogas from landfill.
RenovAr has been a successful programme in terms of catalysing the development of renewable
power generation projects in Argentina and even promoted —by the introduction of specific
clauses setting quotas for encouraging diversity of sources— the addition of cost-competitive
technologies in the power grid. These elements, along with certain guarantees and fiscal
instruments included in the programme, constitute certain precedents for encouraging BECCS in
the long term.
The quick turnover of biomass and biogas projects, when compared to wind and solar PV projects
resulted in an earlier connection (in terms of quantity, but due to scale factors not in terms of
installed capacity) of these technologies into the grid, due to comparatively lower CAPEX
requirements that resulted in relatively less exertions regarding financial requirements for these
projects compared to their large-scale counterparts.

FINAL REPORT
I. Current status of knowledge and development
Current understanding of the impact of CDR approaches in LAC | 82
However, the higher prices of bioenergy projects when compared to other renewable sources
(116.5 USD/MWh for biomass or 159.7 USD/MWh for biogas, vs. 50.35 USD/MWh solar PV, 50.07
USS/MWh wind, 101,0 USD/MWh small hydro, or vs. an average system cost of 59.5 USD/MWh)
sparked controversies in the context of increasing domestic costs and subsidies13 and introduce
some uncertainties regarding future rounds and even regarding Argentina’s compliance with the
renewable targets set by Law 27,191.
Figure 7: Renovar PPA prices by technology
Source: Secretariat of Energy
In conclusion, there are some regulatory precedents to mandating fuel and energy resources as
current and planned installed capacity of thermoelectric generation from these sources that
could include CCS. Nonetheless, the impact of those operating plants is questioning (in the
context of Argentine in terms of total cost of the system) the continuity in the short term of this
type of new capacity (ex: PPPs and renewable auctions).
Table 7: Renovar Biomass Projects awarded
13 Currently, Argentina’s power sector subsidies constitute nearly 70% of the subsidies for the energy sector and users pay on average 61% of the generation and transmission costs.
Tecnología ID Región Provincia Oferent e Nombredelproyect o Pot encia[MW] Precioadj.[USD/MWh]
Biogás BG-01 Cent ro Córdoba BIOMASCROP C.T.RíoCuart o1
BG-02 Cent ro Córdoba BIOMASCROP C.T.RíoCuart o2
BG-03 Cent ro SanLuis ACA/FERSI C.T.Yanquet ruz
BG-04 Lit oral Sant aFe ADECOAGRO C.T.SanPedroVerde
BG-05 Cent ro Córdoba FECOFE/COOP.HUINCAR.. C.T.HuincaRenancó
BG-06 Lit oral Sant aFe MARTÍNNACARATO/OTR.. C.T.BiogásRicardone
BG-500 Lit oral Sant aFe TANONIHNOSS.A. C.T.BombalBiogas
BG-501 BSAS BuenosAires ARREBEEFS.A. C.T.ArrebeefEnergia
BG-502 Cent ro Córdoba POLLOSSANMATEOS.A. C.T.PollosSanMat eo
BG-503 Cent ro Córdoba ACZIABIOGAS,S.L. C.T.JamesCraik
BG-504 Lit oral Sant aFe ACZIABIOGAS,S.L. C.T.Recreo
BG-505 Cent ro Córdoba ACZIABIOGAS,S.L. C.T.SanFrancisco
BG-506 Lit oral Sant aFe ACZIABIOGAS,S.L. C.T.BellaIt alia
BG-507 BSAS BuenosAires PACUCAS.A. C.T.PacucaBioEnergia
BG-508 Comahue LaPampa ABAGROS.A. C.T.AbEnergia
160,002,00
160,001,20
160,001,20
158,921,42
160,001,62
118,001,20
165,001,20
150,001,50
156,002,40
156,002,40
156,002,40
156,002,40
156,002,40
171,851,00
156,852,00
PreciosadjudicadosdelProgramaRenovAr
USD/ MWh
@Renovables_ARSubsecretaríadeEnergíasRenovablesSecretaríadeEnergíaEléctrica
@DatosMINEM.VisualizacióndesarrolladaporelCentrodeInformaciónEnergética.
SubsecretaríadeEscenariosyEvaluacióndeProyectos.SecretaríadePlaneamientoEnergéticoEstratégico.
0 20 40 60 80 100
Capacity [MW]
50
100
150P
PA
US
D/
MW
h
Solar Wind Small hydro Biomass Biogas Biogas W
50
100
150
PP
A U
SD
/M
Wh
Round 1 Round 1.5 Round 2
50
100
150
Technology Round
Weighted average: 54.72
Round
Round 1 Round 1.5 Round 2
Technology
Solar Wind Small hydro Biomass Biogas Biogas W
Solar Eól ica Peq.Hidro Biomasa Biogás BiogásRS
©2020Mapbox©OpenStreetMap
Project Name Company Province Round Capacity
MW
Price
USD/MWh
C.T. Generación
Biomasa Santa Rosa
PAPELERA MEDITERRÁNEA
/ LUCENA
Corrientes Round 1 12.5 110
C.T. Pincó Eco PINDÓ Misiones Round 1 2.0 110
C.T. Rojas GLOBAL DOMINION ACCES Buenos Aires Round 2 7.0 126

FINAL REPORT
I. Current status of knowledge and development
Current understanding of the impact of CDR approaches in LAC | 83
Source: Ministry of Energy and Mining
Table 8: Renovar Biogas Projects awarded
C.T. Capitan
Sarmiento
GRANJA TRES ARROYOS
S.A.C.A.F.I.
Buenos Aires Round 2 7.2 130
C.T. Generación Las
Junturas
EMERALD RESOURCES SRL Córdoba Round 2 0.5 141
C.T. Ticino Biomasa
S.A.
LORENZATI, RUETSCH Y
CIA. S.A.
Córdoba Round 2 3.0 143
C.T. Prodeman
Bioenergia
PRODEMAN S.A. Córdoba Round 2 9.0 127
C.T. Venado Tuerto GLOBAL DOMINION ACCES Santa Fe Round 2 7.0 107
C.T. La Escondida INDUNOR S.A. Chaco Round 2 10.0 121
C.T. Biomasa Unitan UNITAN S.A.I.C.A. Chaco Round 2 6.6 115
C.T. Generacion
Virasoro
FORESTADORA TAPEBICUA
S.A.
Corrientes Round 2 3.0 141
C.T. San Alonso FUENTES RENOVABLES DE
ENERGIA S.A.
Corrientes Round 2 37.0 108
C.T. Kuera Santo
Tome
SANTO TOME KUERA S.A. Corrientes Round 2 12.9 111
C.T. Las Lomitas BIOTERMICA LAS LOMITAS
S.A.
Formosa Round 2 10.0 124
C.T. Fermosa S.A. PEGNI SOLUTIONS S.A. Formosa Round 2 6.0 130
C.T. Bm Mm
Bioenergia
MOLINO MATILDE S.A. Misiones Round 2 3.0 143
C.T. Cogeneración
Ingenio Leales
COMPAÑÍA INVERSORA
INDUSTRIAL S.A.
Tucumán Round 2 2.0 146
C.T. Biomasa La
Florida
GENNEIA S.A. Tucumán Round 2 19.0 107
CT GAS DE BIOMASA
FERMOSA
FERMOSA BIOSIDERURGIA
SA
FORMOSA Round 3 3.5 107
CT ROSARIO DE LA
FRONTERA
ELECTRUM RF SA SALTA Round 3 5.0 106
Project Name Company Province Round Capacity
MW
Price
USD/MWh
C.T. Río Cuarto 1 BIOMAS CROP Córdoba Round 1 2.0 160
C.T. Río Cuarto 2 BIOMAS CROP Córdoba Round 1 1.2 160
C.T. Huinca Renancó FECOFE / COOP. HUINCA
RENANCÓ
Córdoba Round 1 1.6 160
C.T. Yanquetruz ACA / FERSI San Luis Round 1 1.2 160
C.T. San Pedro Verde ADECO AGRO Santa Fe Round 1 1.4 159

FINAL REPORT
I. Current status of knowledge and development
Current understanding of the impact of CDR approaches in LAC | 84
C.T. Biogás Ricardone MARTÍN NACARATO /
OTROS
Santa Fe Round 1 1.2 118
C.T. Arrebeef Energia ARREBEEF S.A. Buenos Aires Round 2 1.5 150
C.T. El Mangrullo CARNES DE LA
PATAGONIA NEUQUINA
S.A.
Buenos Aires Round 2 2.0 157
C.T. General Alvear CARNES DE LA
PATAGONIA NEUQUINA
S.A.
Buenos Aires Round 2 1.0 172
C.T. Resener I INMADE S.A. Buenos Aires Round 2 0.7 176
C.T. General Villegas MARÍA ELENA S.A Buenos Aires Round 2 1.2 169
C.T. Pacuca Bio
Energia
PACUCA S.A. Buenos Aires Round 2 1.0 172
C.T. Pergamino SEEDS ENERGY Buenos Aires Round 2 2.4 157
C.T. James Craik ACZIA BIOGAS, S.L. Córdoba Round 2 2.4 156
C.T. San Francisco ACZIA BIOGAS, S.L. Córdoba Round 2 2.4 156
C.T. El Alegre Bio ANTIGUAS ESTANCIAS
DON ROBERTO S.A.
Córdoba Round 2 1.0 175
Ampliacion
Bioelectrica Dos
BIOELECTRICA DOS S.A. Córdoba Round 2 1.2 169
C.T. Biogeneradora
Santa Catalina
BIOGENERADORA CENTRO
S.A
Córdoba Round 2 2.0 157
Ampliacion 2 Central
Bioelectrica
BIOMASS CROP S.A. Córdoba Round 2 1.2 169
C.T. Enreco CECILIA DEBENEDETTI Córdoba Round 2 2.0 157
C.T. Jigena I CLEANERGY RENOVABLES
S.A.
Córdoba Round 2 1.0 171
C.T. Villa del Rosario CLEANERGY RENOVABLES
S.A.
Córdoba Round 2 1.0 175
C.T. Pollos San Mateo POLLOS SAN MATEO S.A. Córdoba Round 2 2.4 156
C.T. Don Roberto Bio ANTIGUAS ESTANCIAS
DON ROBERTO S.A.
San Luis Round 2 1.0 175
C.T. Yanquetruz Ii BIO ENERGIA
YANQUETRUZ
San Luis Round 2 0.8 178
C.T. Bio Justo Daract BIOMASS CROP S.A. San Luis Round 2 1.0 175
C.T. Ab Energia AB AGRO S.A. La Pampa Round 2 2.0 157
C.T. Bella Italia ACZIA BIOGAS, S.L. Santa Fe Round 2 2.4 156
C.T. Recreo ACZIA BIOGAS, S.L. Santa Fe Round 2 2.4 156
C.T. Avellaneda INDUSTRIAS JUAN F.
SECCO S.A.
Santa Fe Round 2 6.0 160
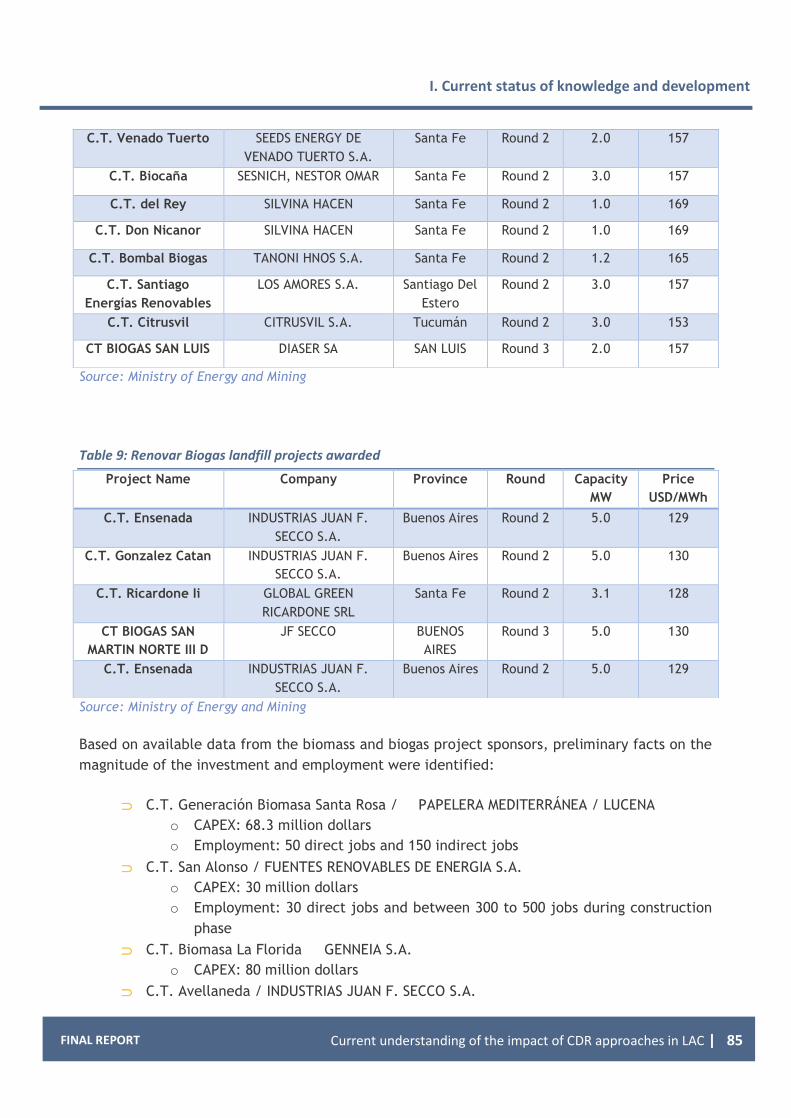
FINAL REPORT
I. Current status of knowledge and development
Current understanding of the impact of CDR approaches in LAC | 85
Source: Ministry of Energy and Mining
Table 9: Renovar Biogas landfill projects awarded
Source: Ministry of Energy and Mining
Based on available data from the biomass and biogas project sponsors, preliminary facts on the
magnitude of the investment and employment were identified:
C.T. Generación Biomasa Santa Rosa / PAPELERA MEDITERRÁNEA / LUCENA
o CAPEX: 68.3 million dollars
o Employment: 50 direct jobs and 150 indirect jobs
C.T. San Alonso / FUENTES RENOVABLES DE ENERGIA S.A.
o CAPEX: 30 million dollars
o Employment: 30 direct jobs and between 300 to 500 jobs during construction
phase
C.T. Biomasa La Florida GENNEIA S.A.
o CAPEX: 80 million dollars
C.T. Avellaneda / INDUSTRIAS JUAN F. SECCO S.A.
C.T. Venado Tuerto SEEDS ENERGY DE
VENADO TUERTO S.A.
Santa Fe Round 2 2.0 157
C.T. Biocaña SESNICH, NESTOR OMAR Santa Fe Round 2 3.0 157
C.T. del Rey SILVINA HACEN Santa Fe Round 2 1.0 169
C.T. Don Nicanor SILVINA HACEN Santa Fe Round 2 1.0 169
C.T. Bombal Biogas TANONI HNOS S.A. Santa Fe Round 2 1.2 165
C.T. Santiago
Energías Renovables
LOS AMORES S.A. Santiago Del
Estero
Round 2 3.0 157
C.T. Citrusvil CITRUSVIL S.A. Tucumán Round 2 3.0 153
CT BIOGAS SAN LUIS DIASER SA SAN LUIS Round 3 2.0 157
Project Name Company Province Round Capacity
MW
Price
USD/MWh
C.T. Ensenada INDUSTRIAS JUAN F.
SECCO S.A.
Buenos Aires Round 2 5.0 129
C.T. Gonzalez Catan INDUSTRIAS JUAN F.
SECCO S.A.
Buenos Aires Round 2 5.0 130
C.T. Ricardone Ii GLOBAL GREEN
RICARDONE SRL
Santa Fe Round 2 3.1 128
CT BIOGAS SAN
MARTIN NORTE III D
JF SECCO BUENOS
AIRES
Round 3 5.0 130
C.T. Ensenada INDUSTRIAS JUAN F.
SECCO S.A.
Buenos Aires Round 2 5.0 129
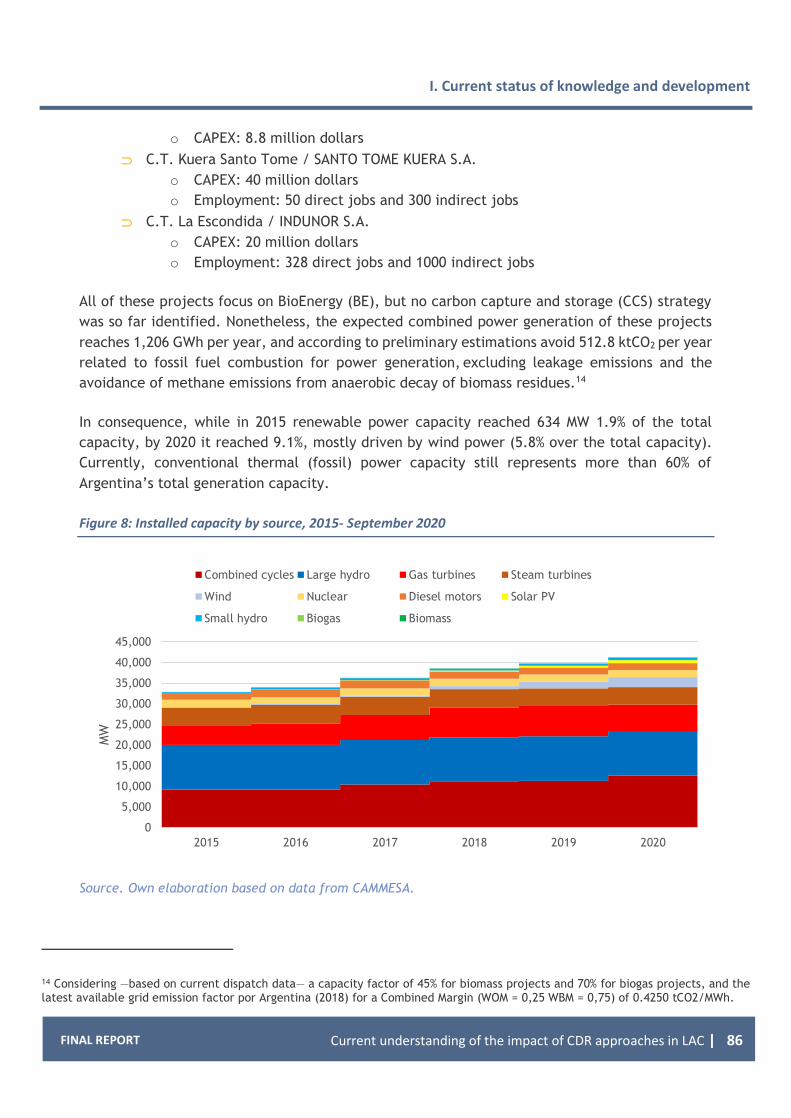
FINAL REPORT
I. Current status of knowledge and development
Current understanding of the impact of CDR approaches in LAC | 86
o CAPEX: 8.8 million dollars
C.T. Kuera Santo Tome / SANTO TOME KUERA S.A.
o CAPEX: 40 million dollars
o Employment: 50 direct jobs and 300 indirect jobs
C.T. La Escondida / INDUNOR S.A.
o CAPEX: 20 million dollars
o Employment: 328 direct jobs and 1000 indirect jobs
All of these projects focus on BioEnergy (BE), but no carbon capture and storage (CCS) strategy
was so far identified. Nonetheless, the expected combined power generation of these projects
reaches 1,206 GWh per year, and according to preliminary estimations avoid 512.8 ktCO2 per year
related to fossil fuel combustion for power generation, excluding leakage emissions and the
avoidance of methane emissions from anaerobic decay of biomass residues.14
In consequence, while in 2015 renewable power capacity reached 634 MW 1.9% of the total
capacity, by 2020 it reached 9.1%, mostly driven by wind power (5.8% over the total capacity).
Currently, conventional thermal (fossil) power capacity still represents more than 60% of
Argentina’s total generation capacity.
Figure 8: Installed capacity by source, 2015- September 2020
Source. Own elaboration based on data from CAMMESA.
14 Considering —based on current dispatch data— a capacity factor of 45% for biomass projects and 70% for biogas projects, and the latest available grid emission factor por Argentina (2018) for a Combined Margin (WOM = 0,25 WBM = 0,75) of 0.4250 tCO2/MWh.
0
5,000
10,000
15,000
20,000
25,000
30,000
35,000
40,000
45,000
2015 2016 2017 2018 2019 2020
MW
Combined cycles Large hydro Gas turbines Steam turbines
Wind Nuclear Diesel motors Solar PV
Small hydro Biogas Biomass

FINAL REPORT
I. Current status of knowledge and development
Current understanding of the impact of CDR approaches in LAC | 87
Even after these increases in the total installed capacity, bioenergy based still shows a modest
share over Argentina’s capacity mix, of only 0.5%. While biomass capacity grew 41% during the
period (7.1% CAGR), biogas capacity (nearly inexistent previously in Argentina), increased more
than two-fold in the context of these auctions.
Figure 9: Detail of installed capacity from bioenergy sources, 2015- September 2020
Source: Own elaboration based on data from CAMMESA.
Argentina’s power emergency decree was sanctioned in the context of an expected demand
growth, which finally showed to be optimistic in terms of activity. In contrast, power generation
and capacity demand stalled during the last years, showing a stable level of 10,600 GWh per
month during the last two years, consistently below 2016 levels (11.000 GWh per moth).
0
50
100
150
200
250
2015 2016 2017 2018 2019 2020
MW
Biomass Biogas

FINAL REPORT
I. Current status of knowledge and development
Current understanding of the impact of CDR approaches in LAC | 88
Figure 10: Power generation by source, 2015- September 2020
Source: Own elaboration based on data from CAMMESA.
As a result of RenovAR programme`s conditions, which established that contracts granted under
the framework would have dispatch priority, Argentina’s renewable generation reached an
average of 8.6% over total during the last months, in contrast to 1.4% during 2015.
Particularly, biomass and biogas power generation (the first of these strongly tied to agricultural
and especially sugarcane cycles), doubled when compared to 2015.
0
2,000
4,000
6,000
8,000
10,000
12,000
14,000
1 3 5 7 9 11 1 3 5 7 9 11 1 3 5 7 9 11 1 3 5 7 9 11 1 3 5 7 9 11 1 3 5 7 9
2015 2016 2017 2018 2019 2020
GW
h
Combined cycles Large hydro Nuclear Wind Gas turbines Solar PV
Small hydro Steam turbines Diesel motors Biomass Biogas

FINAL REPORT
I. Current status of knowledge and development
Current understanding of the impact of CDR approaches in LAC | 89
Figure 11: Detail of Power generation from bioenergy sources, 2015- September 2020
Source: Own elaboration based on data from CAMMESA.
The following table shows the current installed capacity of biogas and biomass-fired power
generation in Argentina, by region, province and entry date into the interconnected system.
0
10
20
30
40
50
60
70
80
90
1 3 5 7 9 11 1 3 5 7 9 11 1 3 5 7 9 11 1 3 5 7 9 11 1 3 5 7 9 11 1 3 5 7 9
2015 2016 2017 2018 2019 2020
GW
h
Biomass Biogas

FINAL REPORT
I. Current status of knowledge and development
Current understanding of the impact of CDR approaches in LAC | 90
Table 10: Current biogas and biomass power plants, September 2020
Station ID
Agent Region Province Source Capacity
(MW) Date
SMAN C.T.SAN MARTIN NORTE 3- ENARSA GRAN BS.AS. BUENOS AIRES Biogas 5.1 05/19/2012
SMIG CT SAN MIGUEL NORTE III-ENARSA GRAN BS.AS. BUENOS AIRES Biogas 11.5 10/04/2012
BRC1 CENTRAL BIOELECTRICA R.CUARTO1 CENTRO CORDOBA Biogas 2 07/22/2017
YANQ BIO ENERGÍA YANQUETRUZ S.A. CENTRO SAN LUIS Biogas 1.5 08/09/2017
SPEV ENERGIA AGRO S.A.U LITORAL SANTA FE Biogas 1.4 11/03/2017
BRC2 C.BIOELECT.R.CUARTO2 REN1 CENTRO CORDOBA Biogas 1.2 09/21/2018
BRC2 C.BIOELECT.R.CUARTO2 REN2 CENTRO CORDOBA Biogas 1.2 01/17/2019
AVEL BIOGAS CT AVELLANEDA SECCO LITORAL SANTA FE Biogas 6.3 03/16/2019
ENRS BIOGAS RS CT ENSENADA SECCO GRAN BS.AS. BUENOS AIRES Biogas 5.3 03/22/2019
BRC1 C.BIOELECT.R.CUARTO1 REN2 CENTRO CORDOBA Biogas 1.6 08/10/2019
CITR BIOGAS CTBG CITRUSVIL-ALCOVIL NOROESTE TUCUMAN Biogas 3 09/06/2019
GIG1 BIOGAS CTBG GIGENA I CENTRO CORDOBA Biogas 1.2 12/11/2019
PERG BIOGAS CTBG PERGAMINO BUENOS AIRES
BUENOS AIRES Biogas 2.4 12/21/2019
JDAR BIOGAS CTBG JUSTO DARACT CENTRO SAN LUIS Biogas 1 01/14/2020
TIGO BIOGAS CTBG TIGONBU CENTRO SAN LUIS Biogas 2 03/11/2020
VROS BIOGAS CTBG VILLA DEL ROS. CGY CENTRO CORDOBA Biogas 1 05/08/2020
PACU BIOGAS CTBG PACUCA BIO ENERGÍA BUENOS AIRES
BUENOS AIRES Biogas 1 08/13/2020
GALV CTBG GENERAL ALVEAR BUENOS AIRES
BUENOS AIRES Biogas 1 09/01/2020
VTBG BIOGAS CTBG VENADO TUERTO LITORAL SANTA FE Biogas 2.1 09/05/2020
Total biogas 51.8
NIDE NIDERA SAFORCADA-Junin BUENOS AIRES
BUENOS AIRES Biomass 7 11/01/1997
PUPI ALTO PARANA-PTO.PIRAY NORESTE MISIONES Biomass 38 08/15/2009
ISBA AZUCARERA JUAN M.TERAN SA NOROESTE TUCUMAN Biomass 16.2 07/06/2010
TABA Ingenio y Ref.S.Martin Tabacal NOROESTE SALTA Biomass 40 11/08/2011
PROV ARCOR ING.LA PROVIDENCIA NOROESTE TUCUMAN Biomass 9 10/01/2014
PESP ECO-ENERGIA S.A.BIOMASA NORESTE MISIONES Biomass 2 08/25/2017
PROD CT PRODEMAN BIOENERGÍA CENTRO CORDOBA Biomass 10 05/29/2018
LEAL CTBM INGENIO LEALES NOROESTE TUCUMAN Biomass 2 08/21/2019
JUNT CTBM. GENERACIÓN LAS JUNTURAS CENTRO CORDOBA Biomass 0.6 01/22/2020
GARR CT BIOMASA GARRUCHOS NORESTE CORRIENTES Biomass 32 08/31/2020
Total Biomass 156.8
Total 208.6
Source: Own elaboration based on data from CAMMESA.

FINAL REPORT
I. Current status of knowledge and development
Current understanding of the impact of CDR approaches in LAC | 91
Argentina’s ISO (independent system operator, CAMMESA) presents quarterly to the market
agents a list of planned new entries under the season programming. The following table shows
the expected new entries for the period 2020-2022, as well as several new power plants which
have not yet determined an expected connection date, and still show some uncertainty regarding
the companies’ ability to completely finance these expected projects under several uncertainty
conditions currently being faced by the country.
Table 11: Programmed new biomass and biogas power plants, September 2020
Station
ID Agent Province Source
Capacity (MW)
Date (expected)
ABEF C.T. ARREBEEF ENERGIA Buenos Aires Biogas 1.5 Oct-2020
RES1 C.T. RESENER I Buenos Aires Biogas 0.72 Oct-2020
GUAT C.T. ENRECO. GUATIMOZIN. CORDOBA Córdoba Biogas 2 Oct-2020
ABBG C.T. AB ENERGIA. 25 DE MAYO . LA PAMPA La Pampa Biogas 2 Oct-2020
YAN2 C.T. YANQUETRUZ II San Luis Biogas 0.8 Oct-2020
PSMA C.T. POLLOS SAN MATEO Córdoba Biogas 2.4 Oct-2020
SCAB C.T. BIOGENERADORA SANTA CATALINA. CORDOBA
Córdoba Biogas 2 Nov-2020
LAMO C.T. SANTIAGO ENERGÍAS RENOVABLES. LOS AMORES S.A.
Santiago del Estero Biogas 3 Feb-2021
GCRS C.T. GONZALEZ CATAN. BRS Buenos Aires Biogas (SWD)
5 Feb-2021
VCAN C.T. BIOCAÑA. VILLA CAÑAS. SANTA FE Santa Fe Biogas 3 Dec-2022
Total biogas dated 22.42
GRA3 C.T. CAP. SARM. GRANJA TRES ARROYOS S.A.C.A.F.I.
Buenos Aires Biogas 7.2
MANG C.T. EL MANGRULLO. SALADILLO. BSAS Buenos Aires Biogas 2
VGAB C.T. GENERAL VILLEGAS. BG. Buenos Aires Biogas 1.2
HREN BIOGÁS HUINCA RENANCO Córdoba Biogas 1.62
JCRA C.T. JAMES CRAIK Córdoba Biogas 2.4
SFRB C.T. SAN FRANCISCO BIOGAS Córdoba Biogas 2.4
RICA Biog. Ricardone Santa Fe Biogas 1.2
BITA C.T. BELLA ITALIA Santa Fe Biogas 2.4
BOMB C.T. BOMBAL BIOGAS Santa Fe Biogas 1.2
REYB C.T. DEL REY Santa Fe Biogas 1.2
DONI C.T. DON NICANOR. RECONQUISTA. SANTA FE Santa Fe Biogas 1.2
RECB C.T. RECREO Santa Fe Biogas 2.4
RIC2 C.T. RICARDONE II Santa Fe Biogas 3.12
Total biogas not dated 29.54
Total Biogas 51.96

FINAL REPORT
I. Current status of knowledge and development
Current understanding of the impact of CDR approaches in LAC | 92
Station ID
Agent Province Source Capacity
(MW) Date
BSRO Biomasa Santa Rosa La Pampa Biomass 15 Oct-2020
TIRO C.T. BIOMASA UNITAN. Puerto Tirol Chaco Biomass 6.6 Oct-2020
ESCO C.T. LA ESCONDIDA. INDUNOR S.A. Chaco Biomass 10 Nov-2020
CAZU C.T. BM MM BIOENERGIA. Cerro Azul. Misiones Biomass 3 Dec-2020
VTBM C.T. VENADO TUERTO. BM. GLOBAL DOMINION ACCES
Santa Fe Biomass 7 Mar-2021
ALON C.T. SAN ALONSO Corrientes Biomass 37 Mar-2021
BMLO C.T. BIOTERMICA LAS LOMITAS Formosa Biomass 10 Aug-2021
LFLO Central Biomásica La Florida Tucumán Biomass 62 Aug-2022
FERM C.T. FERMOSA S.A. San Luis Biomass 6 Dec-2022
Total biomass dated 156.6
ROJA C.T. ROJAS Buenos Aires Biomass 7
KUER C.T. KUERA SANTO TOME Corrientes Biomass 12.92
TAPE C.T. VIRASORO. FORESTADORA TAPEBICUA S.A.
Corrientes Biomass 3
BIOMASA ALEM
BIOMASA ALEM Misiones Biomass 6
BIOMASA POSADAS
BIOMASA POSADAS Misiones Biomass 2
LFL2 C.T. BIOMASA LA FLORIDA. GENNEIA Tucumán Biomass 19
Total biomass not dated 49.92
Total Biomass 206.52
Source: Own elaboration based on data from CAMMESA.
If the above-mentioned projects are completed, RenovAR programme’s guarantee conditions
grant 20-year PPAs at the prices shown in the figures presented below for each technology and
source.

FINAL REPORT
I. Current status of knowledge and development
Current understanding of the impact of CDR approaches in LAC | 93
Figure 12: Most recent auction prices for Biomass PPAs (2017-2018).
Source: Own elaboration based on Secretariat of Energy visuals.
Figure 13: Most recent auction prices for Biogas PPAs (2017-2018).
Source: Own elaboration based on Secretariat of Energy visuals.
Finally, it was identified that in 2013 an interdisciplinary team of researchers from the Institute
of Sciences of the General Sarmiento National University and the Faculty of Engineering of the
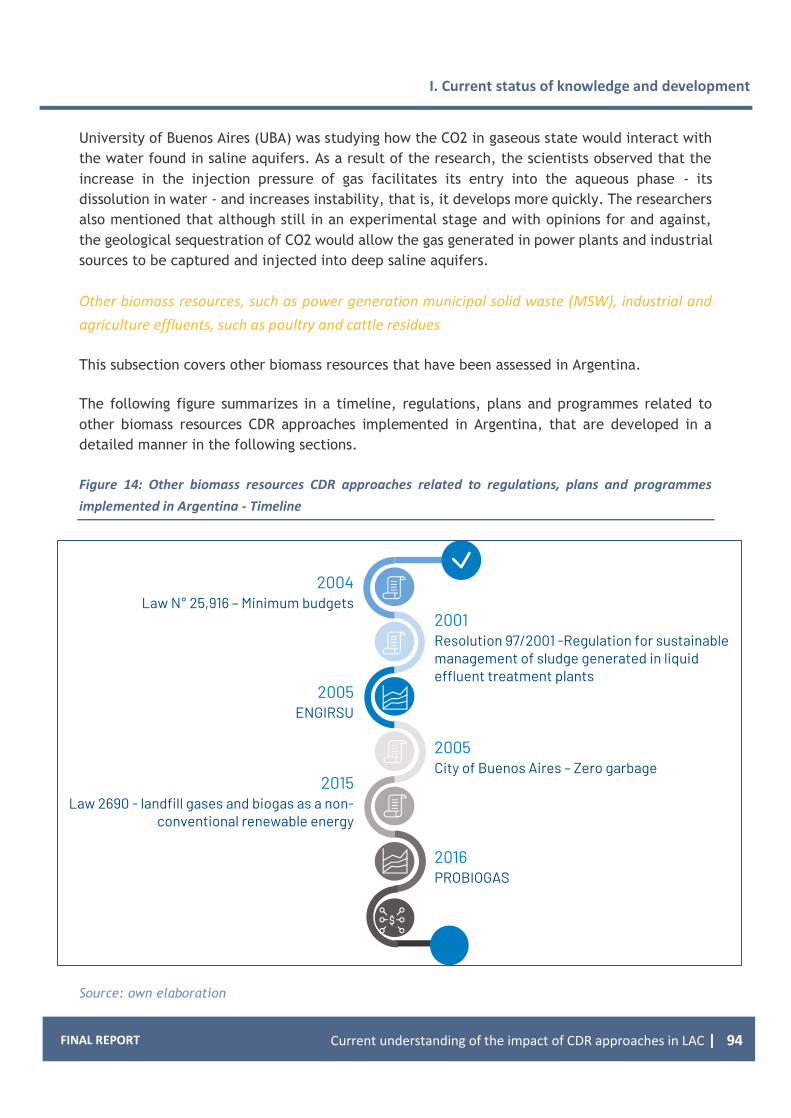
FINAL REPORT
I. Current status of knowledge and development
Current understanding of the impact of CDR approaches in LAC | 94
University of Buenos Aires (UBA) was studying how the CO2 in gaseous state would interact with
the water found in saline aquifers. As a result of the research, the scientists observed that the
increase in the injection pressure of gas facilitates its entry into the aqueous phase - its
dissolution in water - and increases instability, that is, it develops more quickly. The researchers
also mentioned that although still in an experimental stage and with opinions for and against,
the geological sequestration of CO2 would allow the gas generated in power plants and industrial
sources to be captured and injected into deep saline aquifers.
Other biomass resources, such as power generation municipal solid waste (MSW), industrial and
agriculture effluents, such as poultry and cattle residues
This subsection covers other biomass resources that have been assessed in Argentina.
The following figure summarizes in a timeline, regulations, plans and programmes related to
other biomass resources CDR approaches implemented in Argentina, that are developed in a
detailed manner in the following sections.
Figure 14: Other biomass resources CDR approaches related to regulations, plans and programmes
implemented in Argentina - Timeline
Source: own elaboration

FINAL REPORT
I. Current status of knowledge and development
Current understanding of the impact of CDR approaches in LAC | 95
Alignment with Government Vision and Commitment
The Urban Solid Waste Management in Argentina is regulated by the Law of Minimum Budgets N°
25,916 promulgated in 2004, which assigns to the enforcement authority the obligation to
prepare an annual report including data provided by the provinces and the City of Buenos Aires,
specifying the type and quantity of household waste that is collected, and identify those that
have potential for their recovery in each of the jurisdictions (art. 24 B). Within this framework,
the Ministry of the Environment and Sustainable Development is in charge of defining strategies
and actions with the objective of raising awareness among citizens and providing information on
waste management throughout the nation.
Argentina has specific programs ENGIRSU and PROBIOGAS) and two institutions (INTA and INTI)
pursuing the development of biogas technology. Biogas was included in the RenovAr programme
(2016), with a small share (15 MW over 1000 MW), contributing to a favourable tariff in terms of
renewable energy-based electricity production (Morero, 2017).
Argentina developed the National Strategy for Urban Solid Waste Management (ENGIRSU) in 2005.
The ENGIRSU strategy is based on the comprehensiveness principle (Reduction at source, Home
Classification, Collection and transport, transfer and regionalization), processing (recycling of
inorganic, composting of organic and others) and Final Disposal Centres (CDF).
The PROBIOGAS programme, launched in 2016, with a USD 2.7 million donation from the Global
Environment Facility (GEF), plans to demonstrate the potential of energy generation from
municipal waste in medium-sized urban centres in Argentina. It aims to implement pilot
initiatives in selected municipalities, generating energy for self-supply and the sale of surplus
energy to the distribution network, demonstrate the effectiveness of biogas production for heat
generation (including cogeneration) and biomethane.
Other relevant legislation documents related to solid and industrial waste in Argentina are:
Resolution 97/2001, Ministry of Social Development and Environment: Regulation for
sustainable management of sludge generated in liquid effluent treatment plants
Law 1854/2005, City of Buenos Aires. (“Zero Garbage”) established a new form of
urban solid waste management aimed at gradual abandonment landfills. Under this
new framework, recyclers’ cooperatives acquired a key role with regard to recyclables
classification and commercialization centre (named “green centres”). This was a
progress toward consolidating the position of the recycling organizations in the urban
sanitation system while maintaining the previous recognition of them as environmental
policy workers.
Law 2690/2015 which defines landfill gases and biogas as a non-conventional
renewable energy

FINAL REPORT
I. Current status of knowledge and development
Current understanding of the impact of CDR approaches in LAC | 96
Degree of Scientific Development / Academic Literature Review
Several articles were identified related to other biomass resources in Argentina:
Betzabet, M., et al. 2017. Waste Energy: Assessment of biogas production in Argentina
from co-digestion of sludge and municipal solid waste. Universidad Nacional del Litoral-
CONICET
In Argentina, there is an important potential to utilize organic waste to generate bioenergy. This
work analyses the environmental impacts and the energetic and economic requirements of the
biogas produced by digesting the sewage sludge produced in a wastewater treatment plant. This
one is co-digested with the organic fraction of municipal solid waste, and the basis of this study
is the life cycle assessment. The co-digestion was improved with glycerol, and biogas generation
was estimated using the GPS-X software. For biogas end use two alternatives were considered:
combined heat and power and biomethane generation. The environmental, energetic and
economic assessments showed that the co-digestion has great potential for reducing the
environmental impacts and increasing the economic and energetic value of the substances via
the production of biomethane, electricity and, potentially, fertilizer. The energy balance was
highly positive, with energy use for the overall process (Feedstock collection and transport,
Biogas Production Plant, Digestate Management and Biogas Treatment Plant) between 30 and 39%
of the energy generated.
Betzabet, M., et al. 2020. Renewable Energy: Optimal process design for integrated
municipal waste management with energy recovery in Argentina. INTEC (UNL-
CONICET).
This work presents a comprehensive mathematical model for the optimal selection of municipal
waste treatment alternatives, accounting for co-digestion of sludge and municipal solid waste.
The superstructure of alternatives includes anaerobic digestion under mesophilic or thermophilic
conditions, composting, recycling, and final disposal in a landfill. Anaerobic digesters are fed
with different mixing ratios of sewage sludge and the organic fraction of municipal solid waste.
A mixed-integer mathematical programming formulation is proposed to find the optimal process
design. In all cases, co-digestion of the full stream leads to an integrated waste-to-energy process
that maximizes the economic value and reduces environmental impacts of waste by producing
electricity, heat and fertilizer.
ONGIRSU, National Observatory for the Integral Management of Solid Urban Waste,
Statistical data on waste generation in municipalities, 2016 accessed 17.09.18,
http://observatoriorsu.ambiente.gob.ar/estadisticas.htm.
On average, the generation of MSW per capita in Argentina is about 1 kg per day, and the
composition of the MSW is categorized as 50% organic (Qof), 38% recyclable (QR), and 12% others,
non-recyclable (QOT)

FINAL REPORT
I. Current status of knowledge and development
Current understanding of the impact of CDR approaches in LAC | 97
Castelao Caruana, M. E. 2019. Organizational and economic modelling of an anaerobic
digestion system to treat cattle manure and produce electrical energy in Argentina's
feedlot sector
This study identifies the main factors that affect the economic and organizational viability of a
representative power generation project that applies an anaerobic digestion technology and uses
cattle manure from feedlots as feedstock. The results demonstrate that the viability of bioenergy
systems depends heavily on the infrastructure installed along the whole supply chain and on the
organizational changes applied in the collection and transportation stages of manure. They also
highlight three important aspects to assess the economic viability of such projects: a) feedlots'
production, scale and efficiency; b) organizational routines; c) the impact of the project itself
on the overall performance of the production unit. These are crucial factors for the use of manure
for generating energy, and they question the idea of anaerobic digestion as a cost-effective
technology for manure management and energy generation, in farms of different sizes and which
produce different type of livestock in Argentina.
Goicoa, V., 2016. Technical Report: ‘‘Relevamiento nacional de plantas de biogás” 15°
Curso Internacional de agricultura y ganadería de precisión con agregado de valor en
origen. INTA: <http://inta.gob.ar/documentos/relevamiento-nacionalde-plantas-de-
biogas> (accessed 21.11.16).
Biogas technical capacity is well developed in Argentina. An inventory of biogas plants in
Argentina list 105 anaerobic digesters in 16 provinces belonging to the public sector, the private
sector, production cooperatives and non-governmental organizations. A survey of 61 of those
biogas plants indicates that a large number of plants belong to the private sector (53.1%) with
the objective to treat effluents and only a small portion to obtain energy (6%). There are
important differences between public and private. The biogas plants in the public sector are
mainly used to treat effluents and 33% are used for research and teaching. Several plants
belonging to municipalities present operational and management problems. The private sector
has larger plants built in rural areas using USAB, cover lagoons and continuous-flow stirred tank
reactors with imported technology and materials. A common ground in both sectors is the lack
of heating and mixing of the digesters indicating that the plant is not working in the optimum
biological condition. The more common substrates are industrial and agro wastes (86%). The rest
is organic municipal wastes with a small contribution from crops. Almost half of the plants (42.6%)
do not use the biogas, 44.3% use the biogas for heating and only 12% have some sort of electrical
use.
Venier, F., et al. 2015. Analysis of the Energy Sector in Argentina: Exploring the
Potential of Biogas Production.
Since 2001, Argentina has experienced continuous economic growth that has driven a rapid
increase in electricity demand, especially from natural gas based thermal plants. There are two
main challenges. First, the Argentinian production of natural gas cannot meet the demand for

FINAL REPORT
I. Current status of knowledge and development
Current understanding of the impact of CDR approaches in LAC | 98
electricity generation. Also, fossil fuel power generation emits air pollutants that can harm
health, affecting the ecosystem and also the emission of greenhouse gases that contribute to
global warming. This research introduces an alternative approach to meet this increasing demand
in a sustainable way by exploring the potential of biogas production for electricity generation in
the largest province of the country, Buenos Aires. The study area was selected due to its strong
livestock industry, and the potential for biogas generation from cattle manure. In addition, since
Buenos Aires has the capital and largest city of Argentina, this could be also a good opportunity
to promote biogas generation from solid waste management.
Oliveira, M.O., et al. 2012. Biomass Electricity Generation Using Industry Poultry
Waste. UNaM, National University of Misiones
Even though this article is focused in Southern Brazil, the main researcher is an Argentinean from
a university of the Northeast of Argentina. This work presents study details of a biomass-based
electricity generation project. The biomass used was industrial poultry litter. The objective of
the work is to contribute to the research of poultry waste use in real life applications. The case
study is an aviary industry region of southern Brazil, where is evaluated the technical and
economic characteristics of power generation using biomass obtained from poultry litter. Still, it
is highlighted the large energy potential and the high poultry litter production in the region,
which translates into an important source of raw material for electricity generation, currently
not highly explored in Brazil.
Morero, Betzabet & Campanella, Enrique. (2012). Simulation of the Chemical
Absorption Process with Amine Solutions for Biogas Purification. Información
tecnológica. 24. 25-32. 10.4067/S0718-07642013000100004
The influence of some key operating parameters and of different types of amines in biogas
purification is analyzed. For this a conventional single-loop absorber-stripper process
configuration was simulated using four types of amines (monoethanolamine, diethanolamine,
diglycolamine and methyldiethanolamine) and two mixtures of them. The variation in the amount
of CO2 absorbed at different temperatures by different types of amines or amine mixtures were
also analyzed. The simulation results showed good levels of purification in all cases with best
results for diglycolamine (97.3% de CH4) which also has the lowest reboiler energy consumption.
Delgado Gomez, E. et al. 2016. Development of adsorbent to capture CO2 from an
agroindustrial waste. Acta de la XXXIX Reunión de Trabajo de la Asociación Argentina
de Energías Renovables y Medio Ambiente Vol. 4, pp. 09.19-09.28.
Activated carbons (CAs) were developed from yerba mate sticks through the chemical activation
process using KOH as an activator agent. The ACs obtained were suitable for the removal of CO2
from gaseous streams, mimicking post-combustion condition, and their high effectiveness being
linked to the limited distribution of micropore diameters (<2nm) that characterize their porous
structures.

FINAL REPORT
I. Current status of knowledge and development
Current understanding of the impact of CDR approaches in LAC | 99
Asensio Cenice, et al. 2019. Installation of a plant for the production of electrical
energy from biogas from sanitary landfill. ITBA
A pre-feasibility study for the installation of a power plant that uses energy derived from gas
produced from waste at sanitary landfills. The landfill is located at the ¨Complejo Ambiental
Norte III¨, more specifically from the module D, which belongs to CEAMSE.
Initiatives and Projects Development
Forty-three biogas projects and 5 biogas from landfill projects were awarded in RenovAr plan as
detailed before. All of those projects have / will have installed capacities no larger than 5MW.
On other hand, the Ministry of Science and Technology, in conjunction with the University of San
Martin and the company RECYCOMB, are working in a research project called Recycling and
Energy Assessment of Industrial Waste (RyVERI) that aims to develop a new innovative
technological package that allows energy recovery from industrial waste that is assimilated to
urban solid waste obtaining a standardized solid fuel suitable for cement kilns.
In Argentina, the state-owned CEAMSE takes care of the integral management of urban solid
waste of the metropolitan area of Buenos Aires, with process and standards that aim to decrease
the environmental impact of the sanitary landfills. CEAMSE has a power generation plant based
on biogas from waste from landfills that generates enough renewable electricity to supply
100,000 people or 25,000 homes and is injected into the national interconnected network.
Finally, the first projects of the mentioned ProBiogas program started in 2017 in the
municipalities of Las Heras, Mendoza; Rafaela, from Santa Fe and Tapalqué and Olavarría, from
Buenos Aires.
Only one initiative was identified to capture and transform CO2 from syngas streams, with
potential application to biomass power generation. In 2018, a group of scientists from the
Argentinan CONICET and Spanish National Research Council (CSIS) have developed a catalyst to
reuse and transform CO2 and methane, and obtain synthesis gas (syngas). Syngas, is a gas
consisting mainly of hydrogen and carbon monoxide, which can be obtained from substances with
a high carbon content. Syngas is used as a raw material for the synthesis of multiple chemicals
and fuels. In the first case, the material was continuously active for at least 100 hours, obtaining
the maximum conversion of CO2 (at thermodynamic equilibrium) with a 100% selectivity to
carbon monoxide. In the second case, the partial oxidation of methane reaction, maximum
methane conversions to syngas were also obtained. The goal is to apply these processes in
thermal power stations or in biomass gasification facilities to transform waste in chemical
resources and energy sources. The scientists will test the catalyst at pilot plant scale. As the CSIC
scientists Consuelo Alvarez Galván and José Antonio Alonso explain, the goal is to apply these
processes in thermal power stations or in biomass gasification facilities to transform waste in
chemical resources and energy sources.
FINAL REPORT
I. Current status of knowledge and development
Current understanding of the impact of CDR approaches in LAC | 100
Enhancing soil carbon content and Enhancing soil carbon content with biochar
Alignment with Government Vision and Commitment
No explicit mention to biochar as soil enhancer was identified in Argentinean policies and
development plans, neither there are specific programs on the subject. In fact, the use of Biochar
has been not considered into the list of mitigation actions or technologies for the AFOLU sector
in Argentina. As matter of fact, biochar was recently included into the IPCC guidelines (IPCC 2019
methodology report) to provide guidance for inventory compilers. This technology would be
considered as Carbon Capture and Storage strategy.
However, there are soil carbon sequestration programmes in cropland and grazing lands:
INTA-Minagro- Soils Observatory (“Observatorio Nacional de Suelos”)
(https://www.magyp.gob.ar/sitio/areas/plan_suelos/onsa/).
One of the main actions of the Soils observatory is the monitoring of the carbon content of
agricultural soils, through a sampling methodology that considers the different agroecological
regions and productive systems, through the network of Delegations available to the Ministry of
Agriculture, Livestock and Fishing.
With this information, Argentina prepares and periodically updates the national carbon stock
map, complying with the demands of the international agenda related to sustainable
development goals. This survey is also part of the the SISINTA program
(http://sisinta.inta.gob.ar/)
INTA -MInagro. Partner in the FAO initiatives SISLAC and GSOCmap
SISLAC (“Sistema de Información de Suelos de Latinoamerica”) is a regional initiative promoted
and sponsored by the Global Soil Partnership, which involves CIAT, EMBRAPA and 20 national
institutes in Argentina, Bolivia, Brazil, Chile, Colombia, Costa Rica, Cuba, Ecuador, El Salvador,
Guatemala, Honduras, Mexico, Nicaragua, Panama, Paraguay, Peru, dominican Republic,
Surinam, Uruguay and Venezuela. The system will be developed through state-of-the-art methods
and tools of Digital Soil Mapping. The first phase, under CIAT leadership, involves the rescue,
harmonization and storage of historical soil profiles in a regional database, which currently
contains 6100 profiles, as well as the development of a regional 1:1,000,000 scale soil
classification map using the national soil maps and the WRB soil classification system. The second
phase, implemented by EMBRAPA in collaboration with INTA, involves capacity building and
formal training in digital soil mapping and the development of soil property maps at national and
regional level. Key to achieving this deliverable is the participation and leadership of the 20
countries involved in SISLAC.The SISLAC web site is currently not open to the general public: for
data access user registration and use objectives statement are required.

FINAL REPORT
I. Current status of knowledge and development
Current understanding of the impact of CDR approaches in LAC | 101
http://www.fao.org/land-water/land/land-governance/land-resources-planning-
toolbox/category/details/en/c/1197582/
GSOC map: Soils Institute of INTA is a contributor of the Global Soil Organic Carbon Map providing
data and information. This project is part of the Global Soil Partnership.
http://www.fao.org/global-soil-partnership/pillars-action/4-information-and-data-new/global-
soil-organic-carbon-gsoc-map/en/
Degree of Scientific Development / Academic Literature Review
Academic research on "biochar as soil enhancer" subject is still incipient in Argentina, and only a
limited number of articles were identified. This practice is being studied and tested in
experimental applications in Argentina. Local results come from a few studies published in the
last years. The discussion is focused especially in the livestock sector, but still analysing in which
areas and methodologies is feasible to obtain a significant mitigation response by reducing
emissions or by capturing C in soils. In addition to technical studies about the effect biochar on
soil properties, economic studies are also necessary in order to evaluate the potential extension
of this practice to farmers.
IPCC defines Biochar as a “solid carbonized product from thermochemical conversion through
pyrolysis (heating with limited air). The term biochar is used herein only to refer to materials
that have been produced under process conditions in which relatively easily mineralizable organic
materials are converted to more persistent forms by heating to above 350 °C with limited air
through a gasification or pyrolysis process. This guidance does not deal with pyrolytic organic
materials that result from wildfires or open fires and is only applicable for biochar added to
mineral soils”.
The biochar C balance and its emission factors are depicted in equation 2.25 A, recently added
into the Chapter 2 “Generic Methods”, volume 4 of the “2019 Refinement to the 2006 IPCC
Guidelines”. Also, in Chapter 2, there is an appendix that provides additional information about
Biochar estimating methods: “Appendix 4: Method for Estimating the Change in Mineral Soil
Organic Carbon Stocks from Biochar Amendments: Basis for Future Methodological Development”.
Figure 15: Annual change in biochar carbon stock in mineral soils receiving biochar
Source: Refinement to the 2006 IPCC Guidelines for national GHG inventories (IPCC, 2019)

FINAL REPORT
I. Current status of knowledge and development
Current understanding of the impact of CDR approaches in LAC | 102
Private sectors and NGOs are progressing in terms of Studies and Decision Support systems
oriented to reduce carbon emissions and estimating Soil Carbon Changes in Agriculture.
AACREA” Sistemas de indicadores CREA” (https://www.crea.org.ar/sistema-de-
indicadores/).
The Sustainability Indicator System CREA is the result of a long working process framed within
the specific objective of generating technical information and indicators for decision making. It
is tool that supports decision making that allows the user to take a first step in dimensioning
environmental and economic parameters of agricultural field and rotations crops using a simple
and fast mechanism.
Includes 8 indicators: contribution of carbon to the soil, nutrient balance, emissions of
greenhouse gases, toxicological Load (DLef ), use of agrochemicals for Toxicological class (color
label) , energy efficiency, Energy Balance and Gross Margin . The results are displayed through
graphs and tables.
Plataforma PUMA (https://plataformapuma.com/).
This system, designed for farmers and advisors, makes possible to compute the carbon footprint
using farmer’s field crops database. It allows quickly, at the end of the crop season, to obtain a
Carbon Balance in order to identify and quantify CO2 emissions and captures, and evaluate what
can be modified in the next agricultural season to reduce carbon footprint.
Agreement AACREA -FVSA (Fundación Vida Silvestre Argentina) –
Grazing lands Convenio CREA-FVSA (Fundacion Vida Silvestre Argentina)- Study of soil Carbon and
emissions from livestock and grasslands in agricultural systems. This study intends to also develop
a DSS based con soil C models and other tools, to evaluate management practices under different
soil and climate conditions in Argentina.
INTA research on direct effect of biochar on soil C
Regarding Biochar considered as Carbon Capture and Storage strategy some researchers form
INTA have started to evaluate the direct effect of biochar on soil C. Nevertheless, there is some
relevant information about biomass available stock at national level for biochar production, as
well as some private projects interested on this business.
Final Report WISDOM Argentina (INTA-FAO agreement).
In 2009, INTA and FAO presented the final report providing valuable information about energy
balance and availability of biomass for energy use
(https://inta.gob.ar/sites/default/files/script-tmp-i0900s00_analisis_balance_energia.pdf).

FINAL REPORT
I. Current status of knowledge and development
Current understanding of the impact of CDR approaches in LAC | 103
The main objective of that study was promoting the energy use of biomass in the Argentina by
quantifying the availability of biomass for energy use in priority areas and the institutionalization
of the use of the WISDOM methodology as a tool for development of sustainable bioenergy systems
in the country. The WISDOM (Woodfuels Integrated Supply / Demand Overview Mapping)
methodology was developed by FAO, in cooperation with the Institute of Ecology of the National
University of Mexico (UNAM), as a method to spatially visualize the areas priorities or "hot spots"
for wood fuels. Even though this survey provides information to biofuels production, it can also
be used by biochar production.
Milesi Delaye, L. A., et al. 2020. Biochar application in a degraded soil under sweet-
potato production. Effect on edaphic properties.
The authors analyzed the effect of biochar on a degraded soil in NE of Buenos Aires. In general,
soils under horticultural/floricultural production systems present high soil degradation. Biochar
application is mentioned as an alternative to mitigate soil degradation. In Argentina its study and
use are incipient. In a Vertic Argiudoll, in a sweet potato production system under an
agroecological management, the objectives of this work were to evaluate: a) the cumulative
effect, two and a half years after its last application, of three annual biochar applications, of 30
Mg ha-1 in total, between 2013 and 2015 (from Aspidosperma quebracho-blanco feedstock), over
soil properties, and b) the net change, for the 2012-2018 period, in soil properties with and
without biochar applications. The authors concluded that “Biochar application increased the soil
organic carbon reserves (SOC) and pH of the 0-30 cm soil thickness, (…), but “leaving aside its
direct effect on the SOC increase and the superficial bulk density reduction, the interactions
biochar-soil still require study.” It decreased the soil organic nitrogen reserves (SON) and
increased the C/N ratio of the 0-20 cm soil thickness. Besides, it slightly increased the electrical
conductivity of the 0-5 cm soil thickness and did not change the cationic exchange capacity. It
also did not affect the water infiltration and the water holding capacity of the 0-30 cm soil
thickness. However, a very marked increase in the moisture content and in the current water
availability of the 10-20 and 5-10 cm soil thicknesses, respectively, were observed. When the
absolute change was analysed, the same effect was observed for SOC and ph. For physical
variables, edaphoclimatic conditions at sampling moment (lower moisture content in 2018) had
a greater effect than the biochar. Apart from its direct effect on the SOC increase and the
superficial bulk density reduction, the interactions biochar-soil still require detailed analysis.
Dominchin, M. F., et al. 2019. Effect of poultry biochar on chemical and microbiological
properties in a typical haplustol soil under different land-use intensities
The aim of the study was to evaluate the impact of different rates of poultry biochar on soil
chemical and microbiological properties under a land-use intensity gradient. Three sites were
selected: a pristine forest soil (SP), an agricultural soil under sustainable management (MS), and
an agricultural soil under conventional tillage (LI). In general, biochar tended to increase Gram-
negative bacteria compared to control. The study also showed an increase of total phospholipids
fatty acids (PLFAs) in SP and LI, indicating that biochar can increase total microbial biomass. For

FINAL REPORT
I. Current status of knowledge and development
Current understanding of the impact of CDR approaches in LAC | 104
this reason, the application of biochar could be of greater utility in the remediation of soils with
a high level of edaphic degradation.
Berger, M. 2020. Impact of the application of biochar on microbial communities in
agricultural soil subject to different levels of nitrogen fertilization. Thesis. Universidad
Nacional de Cordoba.
This thesis proposes the combined application of organic amendments with mineral fertilizers as
a management alternative. This study evaluated the impact of the application of different doses
of biochar made from peanut shells together with a nitrogen mineral fertilizer (urea), on the
physical-chemical properties of the soil and on the structure and functionality of edaphic
microbial communities in land for agricultural use subject to different types of management.
The aim of this study was to assess the impact of the application of different doses of biochar
made from peanut shells together with a mineral nitrogen fertilizer (urea) on the physical-
chemical properties of the soil and on the structure and functionality of the soil microbial
communities in agricultural land subject to different management types. The collected soil
belonged to the same textural type and included three types of management: pristine, under
direct sowing, with 10 years of 2:1 rotation (soybeans/Maize), and under intensive tillage,
without crop rotation and with conventional tillage. The results show that the application of
biochar together with a mineral nitrogen fertilizer (urea) is capable of modifying the physical-
chemical and microbiological characteristics of the soil, with emphasis on intensive tillage.
However, although the application of biochar and urea produces important increases in pH, TOC,
NT and enzymatic activity, similar trends can be observed when applying biochar without the
mineral fertilizer in all the types of management analysed. Moreover, only biochar seems to
affect the structure of microbial communities. Therefore, the role of biochar, on changes
produced in the physicochemical and microbiological properties of the soil, seems to be more
determinant than that of urea
Rodriguez Ortiz L., et al. 2020. Influence of pyrolysis temperature and bio-waste
composition on biochar characteristics. Renewable Energy, 2020, vol. 155, issue C,
837-847
The aim of this paper was to analyse the influence of the pyrolysis temperature and feedstock
composition on biochar yield and physicochemical properties. The raw materials to be pyrolyzed
were characterized, and an experimental design was applied to carry out a statistical study.
Three operating temperatures (673, 773 and 873 K) and two bio-wastes (nut and almond shells),
from San Juan Province (Cuyo Region), were used. The biochar’s presented H/C and O/C ratios
and higher heating values similar to those of bituminous coal, confirming their potential as solid
biofuels. They also presented high K and Ca contents. The obtained values for the aromaticity
factor, stable C mass fraction and recalcitrance potential, indicated that the biochar’s could also
be used for soil amendments, especially as acidic or basic compounds, according to their pH
values.

FINAL REPORT
I. Current status of knowledge and development
Current understanding of the impact of CDR approaches in LAC | 105
Milesi Delave, L.A., et al. Miscanthus x giganteus and Aspidosperma quebracho-blanco
as feedstock sources for biochar production in Argentina. ENCONTRO BRASILEIRO DE
SUBSTÂNCIAS HÚMICAS, 11., 2015, São Carlos.
Argentina is considering using new biomass sources for biofuel industry. Miscanthus and
quebracho are two possible options and evaluated both feedstock to biochar production, since
this material is always related to bioenergy production. As an energy feedstock, quebracho seems
to have better value (higher C content). As biochar, quebracho showed higher stability, although
both materials have use potential, depending on the main soil function that is wanted to be
improved.
Fermanelli, C. S. 2018. Waste recovery treatments from the agri-food industry in the
Middle North Pampean Region. Universidad Tecnologica Nacional
A study of lignocellulosic biomass residues from the agri-food industry of the Middle North
Pampean Region and the alternatives for their treatment and valorisation is presented. The
objective was to valorise biomass residues of the agro-alimentary industry of the Middle North
Pampean Region through physical and chemical treatments and to evaluate their potential to
generate energy and / or products. Possible treatments of these residues were evaluated, as
much for the production of energy, as for generating products of greater added value. Physical
and thermochemical processes were studied among the alternatives available to produce
bioenergy. Pelletizing and briquetting were described for the former and combustion, co-
combustion, roasting, pyrolysis and gasification, for the latter. Among the options to generate
higher value-added products, the production of activated carbon and agglomerated panels were
analysed. Of the options studied, the pyrolysis of biomass was found to be a simple thermal
process with great potential to be applied in the region.
Another relevant articles from earlier than the recent ten-year period defined are the following:
Bonelli P. R., et al. 2006. Potentialities of the Biochar Generated from Raw and Acid
Pre-Treated Sugarcane Agricultural Wastes. University of Buenos Aires
Chemical, thermal, and textural characteristics of the biochar generated from pyrolysis of
sugarcane agricultural wastes at 600 ºC and 800 ºC have been ascertained in an attempt to
examine specific end-uses for this abundant biomass. Pre-dried agricultural wastes from
sugarcane (Saccharum officinarum), composed of leaves and tops, were supplied by a sugar mill
located in Northwestern Argentine. According to the results, biochar produced at both
temperatures is potentially suited as bio-fuel for domestic use, whereas the one resulting of 800
ºC could also be used for briquettes manufacture and in the steel sector as well as a low-cost,
rough adsorbent, and/or soil amender. Besides, pyrolysis of pre-treated waste with a phosphoric
acid solution at the lower temperature leads to enhance the biochar yield (41%) and to a highly
developed porous structure with textural properties (BET area ~ 750 m2 /g and total pore volume
of about 1 cm3 /g), comparable to those of some commercially available activated carbons.

FINAL REPORT
I. Current status of knowledge and development
Current understanding of the impact of CDR approaches in LAC | 106
Noticeable changes induced by the acid pre-treatment seem to be due to the catalytic action of
the acid on the pyrolytic behaviour of the wastes, promoting degradation at lower temperatures
compared to pyrolysis of the untreated ones. The biochar from the acid-pre-treated sugarcane
agricultural wastes is found potentially appropriate as a substitute of conventional activated
carbons extensively used in the sugar mills and related industries.
Initiatives and Projects Development
No large-scale projects have been identified related to biochar as soil enhancer in Argentina.
However, , there is a company located in Concordia, Entre Rios province, Argentina, (LERA S.A
https://www.vanmander.com/) that produces bio pellets (wood chips) and is strongly interested
on migrating to Biochar production, depending on the Carbon market price in Argentina and
Annex I countries in Europe.
Enhanced weathering or ocean alkalinisation
Alignment with Government Vision and Commitment
The preservation of the oceans is national priority, framed within the 2030 Agenda for Sustainable
Development. The creation of the National System of Marine Protected Areas, scientific
cooperation with the United States and participation in the "Our Oceans" Conference are some
of the recent actions that reinforce Argentina's commitment to the preservation of the oceans
and environmental protection. In compliance with international agreements, Argentina created
the National System of Marine Protected Areas, through which it undertakes to allocate 10% of
maritime spaces for protected areas. The equitable and sustainable use of the oceans is essential
in a country like Argentina with a maritime coastline of more than 4,700 km.
Multiple scientific entities are conducting various investigations on oceans behaviour. The
entities that carry out these investigations are: National Council for Scientific and Technical
Research (CONICET), Naval Hydrography Service, Argentine Institute of Oceanography, Institute
of Marine and Coastal Research, Institute of Coastal Geology, various national universities such
as the National University of Buenos Aires, National University of Mar del Plata.
Degree of Scientific Development / Academic Literature Review
Even though there is scarce research, projects, legislation or investments in technologies related
to carbon sequestration in oceans, there are entities including CONICET, INTA and Naval
Hydrography Service examining the Argentine oceanic platform.
Bianchi, A. A et al. Trapping CO2 in the Patagonian sea. Ciencia Hoy, Vol. 20 núm. 119
oct - nov 2010.

FINAL REPORT
I. Current status of knowledge and development
Current understanding of the impact of CDR approaches in LAC | 107
The flow of CO2 between the atmosphere and the ocean in the Patagonian Sea is studied. On a
global scale, the net oceanic absorption of CO2 is leading to an increase in the concentration of
CO2 and its inorganic derivatives, such as carbonic acid, reducing the pH and causing the
acidification of the ocean. Acidification represents a threat to certain forms of marine life, for
example the bleaching and deterioration of corals that would be associated, in part, with the
increase in CO2.
Figure 16: Diagram of the main sources of emission in Argentina (arrows up, pink colour) and capture or
sink of CO2 (light blue colour), according to their origins, in Tg (1012 g) carbon.
.
Source: Bianchi, A. A et al. Trapping CO2 in the Patagonian sea. Ciencia Hoy, Vol 20 núm 119 oct - nov
2010
In the absence of other sources or sinks, net capture of CO2 through the surface observed over a
period of seven years in the Patagonian Sea could lead to an increase in the concentration of the
gas in the water. Assessments concluded that the Patagonian Sea sequesters, in terms of its
annual balance, four times more CO2 than the average of the global ocean, which makes it one
of the regions with the highest CO2 capture on the planet.
Kahl, Lucía Carolina. "Dinámica del CO2 en el Océano Atlántico Sudoccidental". Tesis
Doctoral, Universidad de Buenos Aires. Facultad de Ciencias Exactas y Naturales, 2018.
This thesis studies the dynamics of marine carbonate system in the Southwestern Atlantic Ocean,
using a wide set of in-situ data. The results show that the total alkalinity is conservative
throughout the study region. In contrast, the dissolved inorganic carbon in the Patagonian Sea is

FINAL REPORT
I. Current status of knowledge and development
Current understanding of the impact of CDR approaches in LAC | 108
strongly non-conservative. It was observed that the action of the biological pump results in a net
sequestration of CO2 in PS. North of 38 °S, there is a close relationship between the DIC and the
different water masses, showing predominance of physical processes. Additionally, the current
status of pH and the saturation states of calcite and aragonite (ΩCa and ΩAr) were analyzed,
establishing a baseline for the study of ocean acidification.
Osiroff A, et al. Distributions of alkalinity and dissolved inorganic carbon in the atlantic
ocean southwest. Naval Hydrography Service
Explore distribution spatial alkalinity (AT) and dissolved inorganic carbon (DEC), in the Atlantic
Southwest, in particular on the Argentine platform, continental slope and on an oceanic transect
at 34.5 ° S. It is foreseen in the immediate future to relate the data of the carbon system with
the local dynamics, especially with the subtropical front of platform and slope front. Starting in
2016, a pH measurement program will begin in the Southwest Atlantic, which added to new
measurements of alkalinity and dissolved inorganic carbon, making possible to measure ocean
acidification.
Piola, A. R. et al. Argau Project measurement of CO2 and physical-chemical and
biological parameters associates, In the South Atlantic, Austral Ocean and Antarctica.
Naval Hydrography Service, IV-number 1, 2001.
The main goal of the project is to determine the influence of the dynamics and of the biological
processes in the CO2 balance of the South Atlantic and the Southern Ocean. The project is an
important progress towards understanding the resources of the regional environment and for
other studies related to global warming.
Cabrerizo, M. J. et al. Increased nutrients from aeolian‐dust and riverine origin
decrease the CO2‐sink capacity of coastal South Atlantic waters under UVR exposure.
Limnology and Oceanography, Vol 63 Issue 3; 1191-1203. 2018.
Increases in ultraviolet radiation (UVR) levels due to the ongoing stratification of water bodies
and higher nutrient concentrations either through riverine or aeolian‐dust‐inputs are expected in
the near future in coastal surface waters. This study combines remote‐sensing data of particulate
organic carbon (POC; 1997–2016 period), observational data of solar radiation (1999–2015
period), and a mid‐term experimental approach with coastal plankton communities from South
Atlantic Ocean (SAO) to test how the interaction between increased nutrients by riverine and
aeolian‐dust inputs and high UVR may alter the community dynamics and the CO2 sink capacity
of these ecosystems in the future. The results show a decline ∼ 27% in the sink capacity of the
coastal ecosystems regardless of the nutrient source considered and under high UVR levels. This
decreased CO2 uptake was coupled with a high dynamic photo-inhibition and dark recovery of
photosystem II and shifts in the community structure towards the dominance by nano‐flagellates.
Moreover, remote‐sensing data also evidences an incipient tipping point with decreasing POC
values in this area over the annual planktonic succession. Therefore, authors propose that to

FINAL REPORT
I. Current status of knowledge and development
Current understanding of the impact of CDR approaches in LAC | 109
continue this climate and human‐mediated pressure, these metabolic responses could be
strengthened and extended to other productive coastal areas.
Villafañe, V., et al. 2018. Dual role of DOM in a scenario of global change on
photosynthesis and structure of coastal phytoplankton from the South Atlantic Ocean.
CONICET
This study evaluated the dual role of DOM (i.e., as a source of inorganic nutrients and as an
absorber of solar radiation) on a phytoplankton community of the western South Atlantic Ocean.
Using a combination of microcosms and a cluster approach, authors simulated the future
conditions of some variables that are highly influenced by global change in the region. The
knowledge of the relative importance of both roles of DOM is especially important for coastal
areas that are expected to receive higher inputs and will be more acidified in the future.
Villafañe, V., et al. 2020. Anthropogenic pollution of aquatic ecosystems: Emerging
problems with global implications. CONICET
In this paper authors discuss five sources of anthropogenic pollution that affect marine and
freshwater ecosystems: sewage, nutrients and terrigenous materials, crude oil, heavy metals and
plastics. Using specific locations as examples, the study shows that land-based anthropogenic
activities have repercussions in freshwater and marine environments, and details the direct and
indirect effects that these pollutants have on a range of aquatic organisms, even when the
pollutant source is distant from the sink. All these issues are in dire need of stricter
environmental policies and legislations particularly for pollution at industrial levels, as well as
solutions to mitigate the effects of anthropogenic pollutants and restore the important services
provided by aquatic ecosystems for future generations.
Regarding enhanced weathering, no specific academic literature was identified in Argentina.
Initiatives and Projects Development
No specific initiative or project related to ocean alkalinisation was identified in Argentina.
However, in 2014, the Pampa Azul project has been launched with the aim of articulating the
actions promoted by the different areas in the field of scientific research, technological
development and innovation at sea. Pampa Azul aims to promote scientific knowledge,
technological development and sustainable innovation in the South Atlantic, in order to create a
culture of sea in society, promote the sustainable use of natural marine assets and strengthen
the growth of the associated national industry. This project does not cover specifically ocean
alkalinisation neither ocean fertilization. The Coordinating Committee is in charge of the design
and implementation of a strategic plan structured around three main axes: Promotes the
generation of interdisciplinary scientific knowledge that serves as a foundation for the
preservation and sustainable management of marine natural assets; Targets technological

FINAL REPORT
I. Current status of knowledge and development
Current understanding of the impact of CDR approaches in LAC | 110
innovations that contribute to the strengthening of industries linked to the sea and the economic
development of the Argentine maritime regions; Promotes greater awareness in Argentine society
about its maritime heritage and the responsible use of its resources. The initiative focuses on
five priority geographic areas in terms of research efforts: Burdwood Bank / Namuncurá
Protected Area; the Blue Hole / Continental Slope; San Jorge Gulf; the Subantarctic Islands
(Georgia and the South Sandwich); and the Fluvial-Marine System of the River Plate. Among the
institutions that participate in Pampa Azul are CONICET, national universities, and science and
technology institutions.
Regarding enhanced weathering, neither were initiatives or large projects identified in
Argentina.
Direct air carbon dioxide capture and storage
Alignment with Government Vision and Commitment
There are no specific laws, national plans nor programs in Argentina covering direct air carbon
dioxide capture and storage.
Degree of Scientific Development / Academic Literature Review
A workshop on the DAC topic was held by the National University of Cuyo in Mendoza, Argentina
in October 2018. The workshop was presented by the PhD. Fernando Mestre Sanchís, from the
University of Zaragoza, Spain. It was mainly aimed at researchers with projects that address lines
on CO2.
No academic literature was identified in Argentina covering direct air carbon dioxide capture and
storage.
However, some articles were identified analysing the CO2 capture properties of Li4SiO4 and CO2
reactivity with Mg2NiH4, but with no specific mention to DACCS.
Grasso, M. L. 2020. CO2 capture properties of Li4SiO4 after aging in air at room
temperature. Journal of CO2 utilization. 38 232-240.
In this study, the physicochemical stability of lithium orthosilicate (Li4SiO4) powders after aging
in air was evaluated. Thermogravimetric (TG) analysis in CO2 flow evidences that as-milled
Li4SiO4 stored in a closed plastic container in air at Room Temperature (RT) suffers a time
progressive CO2 absorption. These phases enhance the reaction with CO2 from the air to form
Li2CO3 at RT before the first carbonation cycle. As a consequence, the CO2 capture capacity of
Li4SiO4 in the first carbonation cycle was smaller than the one of Li4SiO4 without water vapor
exposure. In opposition, negligible CO2 absorption occurred at RT under CO2 atmosphere. The
original properties of Li4SiO4 powders with high specific surface area could be regenerated by

FINAL REPORT
I. Current status of knowledge and development
Current understanding of the impact of CDR approaches in LAC | 111
heating at 700 °C. Consequently, the storage conditions of Li4SiO4 powders should be considered
for their use in different applications.
Grasso, M. L. 2020. CO2 reactivity with Mg2NiH4 synthesized by in situ monitoring of
mechanical milling. Physical chemistry chemical physics: PCCP
Authors mentioned that CO2 capture and conversion are a key research field for the transition
towards an economy only based on renewable energy sources. In this regard, hydride materials
are a potential option for CO2 methanation since they can provide hydrogen and act as a catalytic
species. In this work, Mg2NiH4 complex hydride is synthesized by in situ monitoring of mechanical
milling under a hydrogen atmosphere from a 2MgH2:Ni stoichiometric mixture. The as-milled
Mg2NiH4 shows high reactivity for CO2 conversion into CH4. Under static conditions at 400 °C for
5 hours, the interactions between as-milled Mg2NiH4 and CO2 result in total CO2 consumption
and in the formation of the catalytic system Ni-MgNi2-Mg2Ni/MgO. Experimental evidence and
thermodynamic equilibrium calculations suggest that the global methanation mechanism takes
place through the adsorption of C and the direct solid gasification towards CH4 formation.
Initiatives and Projects Development
A team made up of Doctors Fernando Mestre-Sanchís, María L. Feijóo and Mario X. Ruiz-González
decided in 2018 to take the first step to apply a DAC technology by promoting the creation of a
trust to install a capture plant in the province of Mendoza. The DAC technology is to be provided
by the US-based company Global Thermostat (GT), whose CEO is an Argentinean scientist PhD
Graciela Chichilnisky. The promoters of the Trust, which bears the name of Mallín I, have the
technical support of the company expressed in an agreement for the development of the
technology in Argentina. The planned investment is about 4 million dollars and the project
duration till start-up was estimated in 18 months. Once completed it would be the first DAC plant
in Argentina and South America. As for October 2020, no progress in the project has been
reported.
Ocean fertilization
Alignment with Government Vision and Commitment
See ocean alkalinisation. There are no specific national plans or programs related to ocean
fertilization.
Degree of Scientific Development / Academic Literature Review
No specific academic literature related to ocean fertilization was identified in Argentina.
Same documents reviewed in ocean alkalinisation are relevant to ocean fertilization, as they
characterize and cover the effects of climate change in Argentine oceans.

FINAL REPORT
I. Current status of knowledge and development
Current understanding of the impact of CDR approaches in LAC | 112
Initiatives and Projects Development
No specific initiative or project related to ocean fertilization was identified in Argentina.
Other initiatives related to bioenergy generation that may provide a basis for further BECCS
development
Alignment with Government Vision and Commitment
In January 2010, Argentina implemented a mandate of 5 percent bioethanol in gasoline and 5
percent biodiesel in diesel. This mandate was increased to nine percent in January 2014 and ten
percent in February 2014. A ten percent biodiesel blend requirement was added for power
generation plants technically able to use a biodiesel blend but it was never enforced and virtually
none is used in the sector. Resolution 37 in April 2016 raised the minimum blends to 12 percent
bioethanol and 10 percent biodiesel. In the case of bioethanol, the additional 2 percentage points
had to be supplied by the sugar industry.
Law N° 26,093, as well as establishing minimum blends for biodiesel to be used in transport,
established a minimum blend of 5% for biodiesel in diesel oil for power generation, focused on
certain power plants, which was increased to 7% by the end of 2010.
The maximum share of biodiesel in diesel oil blends por power generation in Argentina was
reached in 2012, at 4.35%, accounting for 65,517 tons, equivalent to 7.5% of the total domestic
sales for that year.
Furthermore, in December 2013, by Resolution 1125/2013 the Secretariat of Energy increased
the share of biodiesel in blends for power generation for each power plant in which it is
«technically possible15».
Nonetheless, several quality problems related to blended biodiesel or pure biodiesel (B100)
where faced during the first years of implementation of these measures, and the blend declined
from 2012 onwards.
Based on resolution 1125/2013, the Secretariat of Energy instructed Argentina’s Independent
System Operator (CAMMESA) to acquire B100 for power generation setting a price equivalent to
the price fixed for “big companies” destined for transportation plus the recognition for logistics
costs (transportation and storage), and in turn CAMMESA made several tenders procuring the
acquisition of this fuel.
15 Article 2, Resolution 1125/2013.

FINAL REPORT
I. Current status of knowledge and development
Current understanding of the impact of CDR approaches in LAC | 113
As a result of these tenders, an apparent mismatch of the fuel specifications16 and the sanctioned
prices resulted in virtually no offers and thus, the withdrawal of biodiesel for domestic power
generation in the interconnected system, with small volumes being currently sold to small off-
grid generators.
Still, Argentina’s 1,665 MW of installed capacity in reciprocating (diesel) engines currently
installed in the interconnected system represent the biggest potential for switching diesel oil
with B100 in power generation, in contrast to the 208.6 MW current installed capacity for biogas
and biomass power plants. In 2019 these diesel engines generated 1,892 GWh, 3.4 times the
biogas + biomass generation, and in consequence this installed capacity is relevant in terms of
this study, when compared to the initial biogas and biomass installed capacity.
Thus, for further analysis, the current grid-connected diesel engines installed capacity will be
considered for the baseline scenario as susceptible to be modelled with post-combustion carbon
capture technologies. Additionally, a partial switch from diesel oil to biodiesel will be modelled
for certain gas turbines, up to B20, according to their technology conditions, and considering
new treatments currently applied by domestic companies, including their costs.
Degree of Scientific Development / Academic Literature Review
Falasca, S. et al. "Agroclimatic aptitude of the arid and semi-arid areas in Argentina
for the cultivation with prickly pear (Opuntia ficus indica) as bioetanol source".
Quebracho, Vol 19(1,2):66-74. 2011.
The objective of the paper was to evaluate the agroclimatic aptitude of Argentina to plant
Opuntia ficus indica in marginal areas for the double purpose to produce tuna as edible fruit and
to use the cladodes to produce bioethanol. As a conclusion, the Argentine agroclimatic aptitude
was delimited for Opuntia ficus indica plantations that may be used for dual purposes: for fruit
production and as an energy crop. More than half of the surface of Argentina has appropriate
aptitude for the cultivation of the Opuntia, including optimal and marginal aptitudes with
irrigation.
Initiatives and Projects Development
Regarding biofuels, Argentina is one of the largest producers and exporters of bioethanol and
biodiesel, with several large-scale plants installed in the last 10 to 15 years. Argentina has 22
bioethanol plants with an estimated production capacity of 1.3 million m3 (not all active in
16 DIN EN 14214 (former DIN 51606) Automotive Fuels FAME specification, but lowering limits for Sodium and Potasium from 5 ppm (parts per million) to less than 0.5 ppm and a kinematic viscosity of less than 6 cSt (centistokes).

FINAL REPORT
I. Current status of knowledge and development
Current understanding of the impact of CDR approaches in LAC | 114
production). Main raw materials of bioethanol plants are sugarcane and maize. Largest plants are
located in Cordoba province. Total national production was over 1.1 million m3 in 2018.
Table 12: Largest Bioethanol plants in Argentina (not exhaustive)
Source: INTA; BCR
Regarding biodiesel, there are 38 biodiesel plants with a total production capacity of 4.4 million
m3 per year, but only 12 of them have capacity larger than 100,000 m3 per year. Most of largest
plants are located in Santa Fe province, accounting for 80% of Argentina's production.
Plant / Company Location Installed
Capacity
MM litres/y
Start-up CAPEX
MMUSD
Raw Material
ProMaize (JV AGD y Bunge) Córdoba 180 2013 200 Maize
Aca-Bio (ACA Bio Coop.
Ltda.)
Córdoba 180 2014 150 Maize
Cía. Bionenergética La
Florida SA
Tucumán 150 2010 3.5 Sugarcane
Tabacal (Alconoa SRL) Salta 150 2009 40 Sugarcane
Vicentín SAIC Santa Fe 110 2012 nd Maize y Sorgum
Bioledesma (Ledesma) Jujuy 100 2011 15 Sugarcane
BIO 4 (Porta Hnos.
Alfa Laval)
Córdoba 90 2012 35 Maize
Diaser San Luis 82 2014 40 Maize
Biomadero Chaco 50 2011 nd Sugarcane
Agroctanos Córdoba 50 2013 40 Maize y Sweet
potato
Maiz Energia SA San Luis, Sgo
Estero,
Cordoba
32 2017 Nd Maize
Cía Bioenergía Santa Rosa SA Tucumán 30 2010 Sugarcane
Bioenergía La Corona SA Tucumán 30 2009 nd Sugarcane
Santa Barbara (Energías
Ecológicas de Tucumán SA)
Tucumán 25 2010 nd Sugarcane
Biotrinidad SA Tucumán 22 2010 nd Sugarcane
Río Grande Energía Jujuy 12 2010 2 Sugarcane
Bio San Isidro SA Salta 6 2010 nd Sugarcane

FINAL REPORT
I. Current status of knowledge and development
Current understanding of the impact of CDR approaches in LAC | 115
Table 13: Largest Biodiesel plants in Argentina
Company Location Province Annual production capacity (tn)
LDC Argentina Gral. Lagos Santa Fe 610.000
Renova San Lorenzo Santa Fe 480.000
Patagonia Bioenergía San Lorenzo Santa Fe 480.000
T6 industrial Puerto Gral. San Martín Santa Fe 480.000
COFCO Argentina Puerto Gral. San Martín Santa Fe 240.000
Cargill Villa Gdor Galvez Santa Fe 240.000
Unitec Bio Puerto Gral. San Martín Santa Fe 240.000
Viluco Frías Sgo del Estero 200.000
Vicentin Avellaneda Santa Fe 120.000
Molinos Río de la Plata Rosario Santa Fe 120.000
Explora Puerto Gral. San Martín Santa Fe 120.000
El Albardón Puerto Gral. San Martín Santa Fe 100.000
Diaser Parque Ind. S. Luis San Luis 96.000
Aripar Daireaux Buenos Aires 50.000
Cremer Argentina Arroyo Seco Santa Fe 50.000
Bio Bahía Bahía Blanca Buenos Aires 50.000
Pampa Bio General Pico La Pampa 50.000
Rosario Bioenergy Roldán Santa Fe 50.000
Bio Ramallo Ramallo Buenos Aires 50.000
Bio Bin Junín Buenos Aires 50.000
Bio Nogoyá Nogoyá Entre Ríos 50.000
Latin Bio Arroyo Seco Santa Fe 50.000
Bio Corba Ramallo Buenos Aires 50.000
Refinar Bio Ramallo Buenos Aires 50.000
Bio Sal Ramallo Buenos Aires 50.000
Energías Renovables Catriló La Pampa 50.000
Advanced Organic Materials Parque Ind. Pilar Buenos Aires 48.000

FINAL REPORT
I. Current status of knowledge and development
Current understanding of the impact of CDR approaches in LAC | 116
Source: BCR, Energy Secretariat
2. Colombia
Colombia is committed to fighting climate change, to the success of the UNFCCC negotiations
and, particularly, to the adoption in December 2015, of a new legally binding agreement that
will include commitments for all Parties during the COP 21.
According to the country´s First Biennial Update Report and the Third National Communication
on Climate Change, in 2010 the country produced estimated greenhouse gas emissions (GHG) of
224 Mton of CO2eq, which represents just 0.46% of total global emissions for 2010. Nevertheless,
the country is highly exposed and sensitive to the impacts of climate change, given its diverse
geography and economy, which is highly dependent on the climatic conditions and the use of
natural resources.
Colombia presented in 2015 its first NDC, which comprises the following objectives:
a greenhouse gas emissions reduction target of 20% below the business-as-usual (BAU)
emissions scenario by 2030 (reduction of 66.5 million tCO2eq)
o 30% below the BAU scenario conditional to international support (reduction of
99.7 million tCO2eq)
a set of climate change adaptation milestones covering ecosystems, land use planning
and vulnerable populations
proposed means of implementation such as research and innovation programmes and
financial mechanisms
Diferoil General Alvear Santa Fe 48.000
Energías Renovables Argentinas
Piamonte Santa Fe 24.000
Colalao del Valle Los Polvorines Buenos Aires 18.000
Soy Energy Villa Astolfi Buenos Aires 18.000
Hector Bolsan Aldea María Luisa Entre Ríos 14.400
Prochem Bio Ramallo Buenos Aires 12.000
New Fuel Villaguay Entre Ríos 10.800
BH Biocombustibles Calchaquí Santa Fe 10.800
Doble L Bioenergias Esperanza Santa Fe 10.800
Agro M&G Saladillo Buenos Aires 8.000
Total production capacity Argentina (ton/year)
4.398.800

FINAL REPORT
I. Current status of knowledge and development
Current understanding of the impact of CDR approaches in LAC | 117
Colombia’s NDC includes Mitigation, Adaptation, and Means of Implementation. The most
important sectors for mitigation are agriculture, forestry, and other land use (AFOLU) (46 percent
of Colombia’s total emissions) and energy (42 percent). Each of the major emitting sectors in
Colombia are covered by at least one strategic target that is directly related to the national
emissions reduction goal. In the energy sector, the participation of non-conventional renewables
in the energy matrix is set to increase from 22.4 megawatts (MW) to 1,500 MW, and the energy
intensity of production will decrease by about 7% as a result of energy efficiency initiatives. In
the transport sector, a combined approach of alternatives to road transport, improved logistics
and a less polluting vehicle fleet has been proposed. About 1,000 companies in the country’s
main industrial corridors should be under cleaner production programmes. Through a circular
economy strategy, the national recycling rate should rise from 8.7% to 12% by 2022.
Specifically, in the AFOLU sector, the Government of Colombia has chosen to focus its efforts on
three goals:
i. halting the accelerated growth of deforestation;
ii. a commitment to enhance greenhouse gas removals by expanding agroforestry,
sustainable management of natural forests, silvopastoral systems, and other forms of
productive land restoration in over 700,000 hectares; and,
iii. implementing best practices in Colombia’s agricultural lands by applying less fertilization.
Under the Ministry of agriculture and rural development selected measures comprise:
Rational pasturing
Manure management in livestock (including increased usage of silvo-pastoral systems)
Increase in permanent crops, forest plantations and tree fruits (palm oil, mango,
avocado, rubber and cocoa)
Implementation of the AMTEC system (mass adoption of technology)
Further on, sustainable intensification in the agriculture sector is integrated in to the strategies
to implement emission reductions in that sector.
Significantly, efforts to reduce deforestation by 39% compared to baseline emissions are a cross-
cutting responsibility shared by all ministries.
These measures are conceived also taking into consideration that major agroecosystems in the
country are vulnerable to increased aridity, soil erosion, desertification, and changes in the
hydrological system.
The National Development Plan established a goal to limit deforestation rates while the
government launched the Amazon Vision Program under the Strategy for REDD+ and a payment
for results scheme was agreed to reduce deforestation nationwide. Colombia has a vast carbon

FINAL REPORT
I. Current status of knowledge and development
Current understanding of the impact of CDR approaches in LAC | 118
sequestration potential in terms of development and improvement of soil and biomass
sequestration of carbon.
Colombia played a leading role in the development of the 2030 Agenda and the SDGs. It was one
of the first countries to incorporate the SDGs into the National Development Plan and one of the
22 countries that voluntarily disclosed results in 2016 for the first time.
In 2015, the Colombian government created the inter-institutional commission for SDGs with the
mission of leading and coordinating the achievement of the SDGs. Colombia also adopted a
strategy for SDG implementation based on four policy guidelines: monitoring and reporting;
strengthening statistical capacities; creating territorial strategies; and building partnerships and
promoting dialogue with non-governmental actors. With help from the Swedish government,
Colombia developed a virtual platform (https://www.ods.gov.co/) to capture and communicate
SDG related developments in the country. Users can follow the 2030 Agenda for Colombia, learn
how the goals have been adapted to the Colombian context, and find out more about
measurement and follow up of each one.
The SDG Commission in Colombia also examined the degree of alignment between the SDGs and
their targets and the country’s other priority agendas, including: The National Development Plan;
accession to the Organisation for Economic Co-operation and Development (OECD); the Green
Growth Strategy; and the Peace Agreement.
In 2018, representatives from the public and private sectors developed a report about the
business contributions to the SDGs in Colombia, titled “United for the SDGs: The contribution of
our companies” (“United for the SDGs: The contribution of our companies”.). In this first edition,
19 leading companies released information about their management practices across 34
indicators that reflect their direct influence on 13 SDGs and indirectly on three SDGs over the
last three years. the same year, the National Department of Planning published the
document CONPES 3918 (CONPES 3918) where the goals and strategies for the compliance with
the 2030 Agenda were established for the country.
The following table depict the scoring for each CDR approach and each of the assessment
dimensions for Colombia, with its supportive summarized evidence for such scoring, based on the
detailed review of the current status of knowledge, planning and implementation.

FINAL REPORT
I. Current status of knowledge and development
Current understanding of the impact of CDR approaches in LAC | 119
Table 14: Colombia - Current Status of Knowledge and Development -Scoring Methodology
CDR approach Assessment dimensions Scoring Evidence for Scoring
Afforestation
and
reforestation
Scientific and Technical
Knowledge • Fifteen pieces of knowledge identified covering the territory
assessment with information on deforested / reforested areas and
carbon capture analysis by different species of trees, among other
topics
Mainstreaming in
Government planning • As part of the government's commitment to climate change, various
national plans were developed: 2000's National Forest Development
Plan (restoration of 245,000 ha, establishment of 271,000 ha
protective forests and 332,000 ha protective/producing forests);
2004's Support Program for the National Environmental System
(20,472 ha) and 2015's National Plan for Ecological Restoration,
Rehabilitation, Restoration and Recovery of Disturbed Areas.
• Colombia has set ambitious goals to curb deforestation, including
reducing the annual loss of natural forests to 155,000 ha or less by
2022 and 100,000 ha or less by 2025 (from current levels of 220,000
ha per year).
Implementation of
initiatives and projects • Various programs and projects are being carried out, including Celsia
from Grupo Argos with the aim of planting 10 million trees in 10
years; two projects (Tumacoco and La Pedregoza) from Tree Nation
platform that already offset more than 400,000 tons of CO2; and the
Biocarbono Fund in strategic collaboration with the World Bank
Bioenergy with
carbon capture
Scientific and Technical
Knowledge • Eleven academic articles have been identified covering biomass
power generation and biofuel production in Colombia
FINAL REPORT Current understanding of the impact of CDR approaches in LAC | 119

FINAL REPORT
I. Current status of knowledge and development
Current understanding of the impact of CDR approaches in LAC | 120
and storage
(BECCS)
• Four pieces of knowledge were identified regarding other biomass
power generation covering the following topics: energy potential of
agriculture, agroindustry, livestock, and slaughterhouse biomass
wastes; government incentives for waste energy; comparison of
operating annual cost under some types of biogas produced from
poultry, bovine and porcine manure, and solid urban organic waste;
municipal solid waste as a source of electric power generation.
• None academic articles were identified approaching BECCS integrally
in Colombia
Mainstreaming in
Government planning • Laws N° 1,715/2014 and N° 1,955/2019, regulated the integration of
non-conventional renewable energy to the national energy system;
promoted investigation on the subject; granted fiscal incentives and
approved a national plan that included a goal to produce 8 to 10% of
Colombia’s energy from renewable energy sources
• "National Policy for Comprehensive Solid Waste Management by 2030"
(2016)
• No specific Government plan or program promoting BECCS as an
integral CDR approach was identified in Colombia
Implementation of
initiatives and projects • All identified projects are focused on BE, but none of them has
reported a CCS phase, therefore there are no integral BECCS projects
planned, under construction nor in operation in Colombia
• Biomass-fed power generation installed capacity is mostly
represented by bagasse CHP17 and currently represents 0.8% over
Colombia’s installed capacity (140 MW), after an increase of 50 MW
(+54%, at a CAGR18 of 9%) between 2015 and 2020.
17 Bagasse as a Fuel for Combined Heat and Power (CHP) 18 Compound Annual Growth Rate
FINAL REPORT Current understanding of the impact of CDR approaches in LAC | 120

FINAL REPORT
I. Current status of knowledge and development
Current understanding of the impact of CDR approaches in LAC | 121
• Despite no bioenergy project was awarded in Colombia's first two
renewable energy auctions, there are a few small-scale biomass
projects under study
Enhancing soil
carbon content
with biochar
Scientific and Technical
Knowledge • Nine academic articles and research initiatives have been identified
related to biochar as soil carbon content enhancer in Colombia. All
of them mentioned positive preliminary results for biochar on small
scale (laboratory) tests.
Mainstreaming in
Government planning • Even though not mentioning biochar explicitly, there is a national
program launched in 2015 called "Colombia Siembra" which main goal
was to expand by one million the hectares sown in the country,
aiming to increase the area and the yields destined to the production
and strengthen technological development
Implementation of
initiatives and projects • No large-scale projects have been identified related to biochar as
soil enhancer in Colombia.
• However, many experimental / laboratory projects and test were
performed, as detailed in the literature review
Enhanced
weathering or
Ocean
alkalinization
Scientific and Technical
Knowledge • Four academic articles have been identified in Colombia related to
ocean characterization and effects of climate change on it. However,
no specific academic literature was identified related to Enhanced
weathering or Ocean alkalinization
Mainstreaming in
Government planning • Since beginning of 2000 decade, Colombia has instrumented its
National Policy of the Ocean and Coastal Spaces and the Colombian
Ocean Commission (CCO).
• There are no specific national plans or programs related to
Enhanced weathering or Ocean alkalinization
Implementation of
initiatives and projects • No specific initiatives or small / large-scale projects identified
FINAL REPORT Current understanding of the impact of CDR approaches in LAC | 121
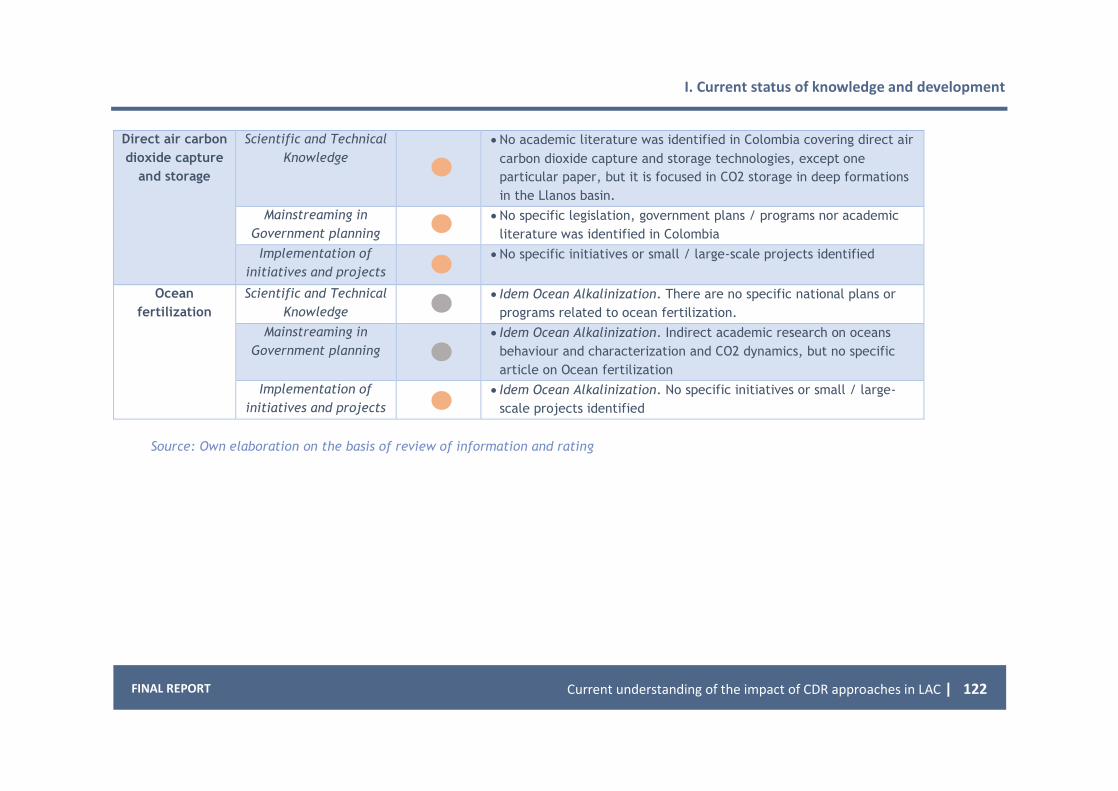
FINAL REPORT
I. Current status of knowledge and development
Current understanding of the impact of CDR approaches in LAC | 122
Direct air carbon
dioxide capture
and storage
Scientific and Technical
Knowledge • No academic literature was identified in Colombia covering direct air
carbon dioxide capture and storage technologies, except one
particular paper, but it is focused in CO2 storage in deep formations
in the Llanos basin.
Mainstreaming in
Government planning • No specific legislation, government plans / programs nor academic
literature was identified in Colombia
Implementation of
initiatives and projects • No specific initiatives or small / large-scale projects identified
Ocean
fertilization
Scientific and Technical
Knowledge • Idem Ocean Alkalinization. There are no specific national plans or
programs related to ocean fertilization.
Mainstreaming in
Government planning • Idem Ocean Alkalinization. Indirect academic research on oceans
behaviour and characterization and CO2 dynamics, but no specific
article on Ocean fertilization
Implementation of
initiatives and projects • Idem Ocean Alkalinization. No specific initiatives or small / large-
scale projects identified
Source: Own elaboration on the basis of review of information and rating
FINAL REPORT Current understanding of the impact of CDR approaches in LAC | 122

FINAL REPORT
I. Current status of knowledge and development
Current understanding of the impact of CDR approaches in LAC | 123
Afforestation and reforestation
The following figure summarizes in a timeline, regulations, plans and programmes related to
afforestation and forest restoration CDR approaches implemented in Colombia, that are
developed in a detailed manner in the following sections.
Figure 17: Afforestation and reforestation related regulations, plans and programmes implemented in
Colombia - Timeline
Source: own elaboration
Alignment with Government Vision and Commitment
Colombia is a country committed to forestry activity and forests protection. Among some of the
laws that regulate the activity, Law N° 2 of 1959 establishes seven areas of forest reserves for
the development of the forest economy and protection of soils, water and wildlife. These areas
are: Cocuy, Sierra Nevada de Santa Marta, Central, Serrania de los Motilones, Rio Magdalena,
Pacific, Amazonia (Amazonas, Cauca, Guainia, Putumayo and Vaupes) and Amazonia (Caqueta,
Guaviare and Huila).
1994
Law N° 139 –Forest incentive cert ificate
1959
Law N° 2 –Forests reserves
2010
Law N° 1.377- commercial reforestat ion
act ivity regulat ion
2017
Decree 1.257 - Intersectoral Commission for
the Control of Deforestation and
Comprehensive Management for the
Protection of Natural Forests
2000
National Forest Development Plan
2004
Support Program for the National
Environmental System
2015
National Plan for Ecological Restoration,
Rehabilitat ion and Recovery of Degraded Area
FINAL REPORT
I. Current status of knowledge and development
Current understanding of the impact of CDR approaches in LAC | 124
In 1994, Law N° 139 was enacted, creating the forest incentive certificate, to promote direct
investments in new protective-product forest plantations on land suitable for forestry. There is
also the "Law of incentives for afforestation, reforestation and the protection of forests", which
establishes incentives to promote the incorporation of the private sector in the execution of
reforestation and forest protection programs in order to reverse the deforestation process
suffered by the country.
In 2010, Law N° 1.377 was enacted, which regulates commercial reforestation activity. Finally,
in 2017, through Decree 1.257, the "Intersectoral Commission for the Control of Deforestation
and Comprehensive Management for the Protection of Natural Forests" was created. Its purpose
is to guide public policies, plans, programmes, activities and strategic projects to be carried out
by entities for the control of deforestation and the management of natural forests.
In recent years, Colombia has been listed as one of the five countries with the highest
deforestation with nearly 43 thousand hectares of forest cut down in the Colombian Amazon.
Therefore, the national authorities have implemented programs in favour of reforestation.
National strategy existing since year 2015 seeks to restore ecosystem services in areas that have
been degraded, providing forest management with alternatives such as silvopastoral crops and
other sustainable restoration strategies.
As part of the government's commitment to climate change, various national plans were
developed.
2000's National Forest Development Plan
The main objective was to establish a strategic framework that actively incorporates the forestry
sector into national development, optimizing comparative advantages and promoting the
competitiveness of timber and non-timber forest products in the national and international
market, based on forests. native and afforested, sustainable management. Specific objectives
were also determined: incorporate, conserve and manage forest ecosystems for the provision of
environmental goods and services and develop processes in which the actors related to the forest
sector, participate in the preservation, protection, conservation, use and management of forest
ecosystems with the objective of building a sustainable society. Within this plan, various
programmes are developed, including the Program for Forests Ecosystems Management,
Conservation and Restoration, carried out by Research Institutes, Universities, National
Corporation for Forest Research and Development (CONIF) and Federacafe, with the support from
the Ministry of the Environment and the participation of NGOs. It seeks in a period of 7 years the
restoration of 245 thousand hectares, the establishment of 271 thousand hectares of protected
forests and 332 thousand hectares of protected/commercial forests.

FINAL REPORT
I. Current status of knowledge and development
Current understanding of the impact of CDR approaches in LAC | 125
2004's Support Program for the National Environmental System
In 2004, with support from the Inter-American Development Bank, the Support Program for the
National Environmental System (SINA II) was financed. The purpose of this program is to improve
environmental management through support in the formulation, implementation and monitoring
of environmental or strategic policies for environmental management, and the promotion of
sustainable development, based on the execution of recovery, conservation programs and
projects. The goal of this program was the implementation of 20,000 hectares, managing to
establish and maintain 20,472 hectares (2% above the established goal).
2015's National Plan for Ecological Restoration, Rehabilitation and Recovery of
Degraded Areas (PNR). 2015
Its objective is to guide and promote the ecological restoration, recovery and rehabilitation of
Colombian degraded areas within a broad framework of biodiversity conservation and adaptation
to global changes. The plan proposes 3 phases that will be developed in a period of 20 years. The
Ministry of Environment and Sustainable Development, through the Directorate of Forests,
Biodiversity and Ecosystem Services, technically supports and manages the implementation of
the Plan, as well as assess the accomplishment of proposed goals, according to key indicators.
The Environmental Authorities coordinate within their powers the implementation of the Plan at
the regional and local levels; the Colombian Network for Ecological Restoration.
Degree of Scientific Development / Academic Literature Review
Several scientific articles have been identified on the subject, being the following ones the most
relevant:
Quinonez Collazo, L. J. 2010. Urban forest management as a mechanism to capture
carbon on the campus of de Pontifical University Javeriana. Thesis for the master's
degree in Environmental Management. Pontifica Universidad Javeriana.
An academic exercise was carried out that allowed identifying the balance of emissions and
carbon capture in the Javeriana University since 1930 to 2008. It was found that according to the
estimates of emissions caused by the students and by constructions, the emissions balance is
completely negative.
Riveros Romero M. A. 2011. Market research: Diagnosis of reforestation projects in the
Colombian Orinoquia. Master oficial en dirección de marketing. Universidad Cardenal
Herrera, Valencia España.
The role of forests in climate change is described, with an overview of the Colombian situation.
The reforestation situation in Colombia and a brief socioeconomic analysis in the Orinoquia area
are described.

FINAL REPORT
I. Current status of knowledge and development
Current understanding of the impact of CDR approaches in LAC | 126
Africano, K., Cely, G. & Serrano, P. "Potential CO2 Capture Associated with Edaphic
Component in Moorlands Guantiva-La Rusia, Department of Boyacá, Colombia".
Perspectiva Geográfica, 21(1), 91-110. 2016
The objective was to determine the effect caused by human activities and the ability to capture
CO2, in permanent sample plots (PPM); one located in an intervened area, another in an
unhampered area and another in a recovery area in the complex of moors in Guantiva-La Rusia
(Boyacá, Colombia). The PPM in recuperation showed greater ability to capture an average of
872.26 t.ha-1; in contrast with the minor capacity PPM which was taken with a mean value of
221.70 t.ha-1. T. This shows the negative effect exerted by human activity on the ability to
capture carbon in these soils, and the role these ecosystems play as carbon drains, hence the
importance of their protection and conservation.
Sanchez Cuervo, A. M et al. "Land cover change in Colombia: surprising forest recovery
trends between 2001 and 2010." PLoS ONE 7(8): e43943.
doi:10.1371/journal.pone.0043943. 2012.
Monitoring land change at multiple spatial scales is essential to identify critical points of change
and to develop and implement policies for the conservation of biodiversity and habitats. Annual
land use and cover mapping was conducted from 2001 to 2010 in Colombia using MODIS products
(250 m) together with reference data from high spatial resolution images (QuickBird) in Google
Earth, to visually interpret the coverage of eight land cover classes used for the classifier training
and accuracy assessment. On the basis of these maps, the land cover change was evaluated at
four country spatial scales, biome, ecoregion and municipality. Of the 1,117 municipalities, 820
had a net gain in afforested vegetation (28,092 km2) While 264 had a net loss (11,129 km2),
which resulted in a net gain of 16,963 km2 in wooded vegetation nationwide. Arboreal regrowth
occurred primarily in areas previously classified as mixed wooded / plantations rather than
agricultural /herbaceous. Most of this gain occurred in the humid forest biome, within the
montane forest ecoregions, while the greatest loss of wooded vegetation occurred in the Llanos
and Apure-Villavicencio ecoregions. It is concluded that the trend towards forest recovery,
especially in the Andes, provides a unique opportunity to expand protected areas and promote
habitat connectivity.
Zúñiga-Escobar, O. et al. "Assessment of the impact of anthropic activities on carbon
storage in soils of high montane ecosystems in Colombia". March, 2013.
The organic carbon in soil was quantified to assess the impact of anthropic activities on montane
ecosystems in Chingaza Parque Nacional Natural (PNN) and Los Nevados Parque Nacional Natural
(PNN ). The calculation of the amount of total carbon stored in soil reflects that, in Colombia,
non-degraded high montane ecosystems (520.9 t ha-1 in paramos and 323.6 t ha-1 in high Andean
forests of Chingaza PNN , and 373.0 t ha-1 in paramos and 254.6 t ha-1 in high Andean forests of
Los Nevados PNN ) currently have more carbon than degredaded ecosystems (135.1 t ha-1 in
paramos and 141.5 t ha-1 in high Andean forests of Chingaza PNN , and 356.3 t ha-1 in paramos

FINAL REPORT
I. Current status of knowledge and development
Current understanding of the impact of CDR approaches in LAC | 127
and 217.1 t ha-1 in high Andean forests of Los Nevados PNN ). It is clear that the degradation of
high montane ecosystems decreases the amount of carbon in the soil.
Sanchez-Cuervo, A. M., and T. M. Aide. "Identifying hotspots of deforestation and
reforestation in Colombia (2001–2010): implications for protected areas". Ecosphere
4(11):143. 2013
The main objective of this work was to evaluate the implications of territorial change in present
and future protected areas. Hot spots of reforestation and deforestation were identified between
2001 and 2010, and the factors that explain the earth shift within these critical points. Four
reforestation foci were identified mainly located in the highlands of the Andes, and four foci of
deforestation that were located in the lowlands. Although protected areas cover 12% of the
country, only 4% of reforestation and deforestation hotspots included protected areas.
Understanding land change dynamics is essential for future planning of protected areas, with
immediate benefits for the conservation of these areas, short- and medium-term benefits for
ecosystems, and medium- and long-term benefits for biodiversity.
Salazar Lopez C. et al. 2016. Benefits of reforestation in water regulation in Colombia.
Thesis for the title of Environmental Engineer. National Open and Distance University.
Studies on reforestation and deforestation in the different Colombian zones and territories were
analyzed. It was found that in 1990 the forest covered 56.5% of the national territory, and by
2010 it reached 51.4%. Colombia has around 67 million hectares with forestry vocation, of which
25 million are considered suitable and suitable for reforestation. Colombia has planted
approximately 9,908,927 hectares of forest in transition and 35,603 of planted forests. From
these studies it is obtained that the benefits caused by reforestation are in the process of
development, since the projects that have been stipulated to reverse the environmental
damage caused by deforestation are from present times, however, the damage caused is
identifiable.
Ruano Parra, J. E. "Estimation of carbon capture in Las Garzas ecopark, Cali Valle del
Cauca". Degree Thesis. Universidad Autonoma de Occidente. Facultad de Ciencias
Basicas, Departamento de Ciencias Ambientales, Programa Administracion Ambiental.
Santiago de Cali, 2019.
Las Garzas eco park is a reforested area of 4.7 hectares. The objective of this work was to
evaluate if the vegetation cover that inhabits this area causes a positive impact on climate
change from carbon capture. It was found that the total biomass is 471 tons, mostly concentrated
in the arboreal vegetation. The total carbon captured by Lago de Las Garzas Eco Park was 224.34
tonnes and 47.73 tonnes / ha.

FINAL REPORT
I. Current status of knowledge and development
Current understanding of the impact of CDR approaches in LAC | 128
Giraldo, A. et al. "Carbon capture and flow in a silvopastoral system of the Colombian
Andean zone." Archivos Latinoamericanos decProduccion Animal. Vol 16, número 4:
241-245 2018.
The objective was to develop a protocol to measure carbon capture and monitoring, as an
environmental service, in silvopastoral of Acacia decurrens + Pennisetum clandestinum located
in the andes (2538 msnm), in two trees densities: high (1111 trees/ha), and low (407 trees/ha).
In low density areas was reached 154tC/ha including pastures and soils. The carbon flow through
animal lees was 0,50, 0,47 and 0,48 tC/cow/ha/year in HD, LD and without trees respectively.
In average for two years, the annual average increases of carbon in the aerial part of the trees
were 9,9 and 11,2 tC/ha for HD and LD respectively.
Chrysobalanus Icaco species as a reforestation alternative to mitigate coastal erosion
processes. Case study environmental sustainability of the species in the department of
Bolívar-Colombia. Fundación Universitaria Tecnológico Comfenalco Cartagena,
Colombia
The objective was to study the species Chrysobalanus Icaco as an alternative of reforestation
for erosion management, considering the potential of the species for soil conservation and
protection. The analysis indicated that the species can be used in the department to reduce
erosion processes. However, environmental conditions must be adapted with fertilizers
rich in trace elements for reforestation with Icaco for the purpose of agro-industrial use, erosion
management and species conservation.
Patiño, S. et al. "Capture of carbon in biomass in forestry plantations and agroforestry
systems in Armero-Guayabal, Tolima, Colombia". Revista de Investigacion Agraria y
Ambiental, Vol. 9, Num. 2. 2018
The study aimed to estimate the total biomass and the storage and fixation of carbon in forest
plantations (FP) and agroforestry systems (AFS). FPs between 5 and 25 years old fixed between
18.6 and 64.4 Mg C ha-1; while the AFS captured 85 Mg C ha-1 (10-15 years). The average carbon
fixation rate was 1.4 and 4.9 Mg C ha-1 year-1 for the FP and AFS, respectively. The results
demonstrate the importance of these systems as mitigation factors of climate change and
emphasize the advantages of involving SAF with forested perennials as a sink for a large amount
of carbon, allowing, in turn, agricultural production.
Ordoñez Jurado, H. M. et al. "Estimation of aerial biomass and carbon capture in
scattered trees in pastures with wild motilon (Freziera canescens) in the Municipality
of Pasto Nariño Colombia".
In the municipality of Pasto, Nariño, 4 circular plots of 500m2 were established, where the
measurement of dasometric variables of trees dispersed in paddocks of wild motilón Freziera
canescens was carried out, in order to estimate the aerial biomass and determine the carbon

FINAL REPORT
I. Current status of knowledge and development
Current understanding of the impact of CDR approaches in LAC | 129
capture capacity. in this traditional silvopastoral practice. For the wild motilón an aerial biomass
of 9.57 ton / ha was determined, which is equivalent to 4.78 ton of C / ha.
Zúñiga-Escobar, O. et al. "Assessment of the impact of anthropic activities on carbon
storage in soils of high montane ecosystems in Colombia". March, 2013.
The organic carbon in soil was quantified to assess the impact of anthropic activities on montane
ecosystems in Colombia in Chingaza Parque Nacional Natural (PNN) and Los Nevados Parque
Nacional Natural (PNN ). The calculation of the amount of total carbon stored in soil reflects
that, in Colombia, non-degraded high montane ecosystems (520.9 t ha-1 in paramos and 323.6 t
ha-1 in high Andean forests of Chingaza PNN , and 373.0 t ha-1 in paramos and 254.6 t ha-1 in
high Andean forests of Los Nevados PNN ) currently have more carbon than degredaded
ecosystems (135.1 t ha-1 in paramos and 141.5 t ha-1 in high Andean forests of Chingaza PNN ,
and 356.3 t ha-1 in paramos and 217.1 t ha-1 in high Andean forests of Los Nevados PNN ). It is
clear that the degradation of high montane ecosystems decreases the amount of carbon in the
soil.
Montenegro, A. M. 2008. Characterization of High Andean forest edges and implications
for their ecological restoration (Colombia)". Biology department, Universidad Nacional
de Colombia.
This study aimed to characterize three types of High Andean forest edge in Cogua Forest Reserve
(Colombia): 1) edge of Chusquea scandens, 2) "paramizado", and 3) old edge, characterized for
being in a later successional state. The paramizado edge needs the most intervention for its
restoration. The Chusquea scandens edge forest is the most sheltered since this species acts as
a protecting shield. However, it still needs to be controlled to allow the adjacent matrix
colonization by the forest species and natural regeneration, as it does in the old edge type
forest, which moreover has an intermediate self-regulating capacity relative to the other two.
The vegetation composition reveals that most of the edge species can also grow inside, beyond
the forest edge.
Bare, M C et al. 2015. Growth of native tree species planted in montane reforestation
projects in the Colombian and Ecuadorian Andes differs among site and species".
Springer Science Business Media Dordrecht.
This study analyzed growth of seven common native species (Alnus acuminata, Baccharis
bogotensis, Cedrela montana, Myrica pubesens, Quercus humboltii, Sambucus nigra,
Smallanthus pyramidalis) on 12 montane forest sites across the northern region of the tropical
Andes. Results indicate that native species can grow in a variety of soil conditions, and exhibit
growth rates comparable to non-native species. However, the results suggest native species are
site restricted for best growth and should be planted on particular soils, and, thus,
recommendations for reforestation for the species are included in this study.

FINAL REPORT
I. Current status of knowledge and development
Current understanding of the impact of CDR approaches in LAC | 130
Evert T, et al. 2017. The importance of species selection and see sourcing in forest
restoration for enhancing adaptive capacity to climate change: Colombian Tropical Dry
Forest as a model." CDB Technical series Nro 89.
Forest restoration projects can derive great benefit from integrating climate modeling,
functional trait analysis and genetic considerations in the selection of appropriate tree species
and sources of forest reproductive material, for their critical importance for the delivery of
ecosystem services and the viability and adaptive capacity of restored forests. Targets in
restoration projects are not only quantitative but also qualitative. There is need for political
commitment to create demand for good quality forest reproductive material of native species
through regulatory frameworks and resource allocations.
Ramirez Mejia, A. F. et al. 2016. Activity patterns and habitat use of mammals in an
Andean forest and a Eucalyptus reforestation in Colombia". Hystrix, the Italian Journal
of Mammalogy. Mammalogy ISSN 1825-5272.
To mitigate deforestation effects, reforestation programs with native and/or exotic species
have been implemented in the Colombian Andes, but little is known about how such
reforestations affect wildlife. The reforestation was a monoculture and an artificial ecosystem;
thus, it’s expected differences in activity and habitat use by mammals in the two forest types.
No significant differences were found in the species richness between the forests. This suggests
that the creation of a new habitat, such as the reforestation, might influence the interactions
among some species and apparently, could reduce interspecific competition and thus contribute
to their co-existence at the study zone though niche differentiation in time and space.
Also some pieces of knowledge were identfied regarding wood for furniture and wood for
construction in Colombia.
Ospina Pantoja, I. M. 2018.Analysis of SMEs in the furniture sector in Colombia a from
the income of foreign companies and products. Thesis degree to qualify for the title
of: Professional in International Business. Universidad Agustiniana.
The aim of this project is to develop an analysis of the competitiveness of SMEs in the furniture
sector in Colombia against the entry of new foreign companies. In order to determine how small
and medium enterprises would face the entry of these foreign companies an impact analysis
derived from the diamond analysis of Porter's competitiveness and the entry of new
competitors, a situation that must be experienced by companies from developing countries
within the current internationalization systems. To this end, an analysis of the furniture sector
was carried out and interviews and surveys were carried out in order to understand the views
of SME entrepreneurs and potential customers in the sector.

FINAL REPORT
I. Current status of knowledge and development
Current understanding of the impact of CDR approaches in LAC | 131
Estimation and characterization study of wood consumption in housing and great works
of infrastructure sectors. Bogotá D.C.: Colombia. Ministerio de Ambiente y Desarrollo
Sostenible; ONF Andina. 2016.
The study describes the development of forest information studies for the characterization of
potential markets that contribute to the formalization of the forestry sector, present wood
consumption indices for two subsectors of the economy of great importance in the country such
as housing construction and the development of large infrastructure works. Indexes and other
information obtained in the study allow an approximation to the consumption of wood.
Initiatives and Projects Development
Several initiatives and projects were identified in Colombia with the objective of reforesting and
restoring forest ecosystem.
In 2011, the National University of Colombia carried out a large project to recover degraded
areas in the country, along the road that leads to Turbo, which is located in the Western
Subregion of the department of Antioquia. After 7 months of execution, 11 hectares have been
established that host around 11,200 trees. The goal is to plant 2,000 trees in some farmers lands
and in lots assigned by the government to increase plant biodiversity.
The Red de Arboles Foundation began its activities in 2015 in the city of Bogotá, offering
voluntary reforestation activities for companies under the concept of Corporate Social
Responsibility. Since then it has planted more than 30,000 trees in different affected areas near
the city of Bogotá and expanding its activities to other cities such as Cali, Medellin, Barranquilla,
Bucaramanga and Cartagena. In 2018, in the company of Porvenir, they planted 5,000 trees in 5
main cities of the country
Celsia, from Grupo Argos, aims to develop actions that allow to conserve water as a basic
resource for generating clean energy. In 2016, an initiative began together with the Regional
Autonomous Corporation of Valle del Cauca (CVC) and that seeks the restoration of watersheds
by means of planting native trees in protected areas of the region's water sources. During the
first year, 562,000 trees were planted in 780 hectares of 16 municipalities in Valle del Cauca.
The final objective is to plant 10 million cultivated and cared trees in an estimated period of 10
years with the participation of rural and peasant communities, generating around 400 direct jobs
in charge of planting, isolating and maintaining reforested areas, in line with the goals of
sustainable development.
Tree Nation has two forestry projects in Colombia. The Tumacoco Project in San Juan de la Costa
en Tumaco - Nariño. The project seeks to cultivate coconut plantations through agroecological
and agroforestry practices that promote and encourage sustainability in the Colombian Pacific.
Environmental sustainability will be consolidated by means of generating agro-ecological
production systems in plantations. Economic sustainability will be achieved through employment

FINAL REPORT
I. Current status of knowledge and development
Current understanding of the impact of CDR approaches in LAC | 132
generation for approximately 25 families directly and indirectly on the Colombian Pacific coast.
An agro-business model will be implemented to allow economic sustainability of coconut
plantations based on the production of value-added coconut products. Social sustainability will
be achieved by including families that have been victims of the armed conflict and mothers who
are heads of families. Thus, the project gives social cohesion, community participation, a sense
of belonging towards the territory where the project will be implemented and also achieving
300.000 Kg of CO2 compensated.
Another project is La Pedregoza, located in the Orinoco River basin of Colombia, started in 2007.
The plantation is designed to provide long-term economic sustainability for the adjacent natural
reserve, dedicated to the conservation of local flora & fauna. The project has 6 main objectives:
to grow plantation wood for lumber; to grow tropical trees for carbon sequestration and cloud
seeding; to plant native trees in order to expand the habitat for endangered wildlife in the region;
to create local socio-economic development opportunities in the areas of agro-forestry natural
farming, permaculture and analog forestry, wood and lumber, forestry management, fruits and
nuts, bio-diesel, organic insecticides and fungicides, liquors and medicines, renewable energy
and oils; to reclaim land and improve depleted and dead soils with nitrogen fixing, carbon fixing
and micro-fauna through tropical trees and natural farming techniques; and to provide financial
sustainability to the Reserva Natural La Pedregoza, a natural reserve and conservation area. This
project has so far compensated 416 million kg of CO2.
In order to reduce greenhouse gas emissions generated by agriculture, deforestation and other
land uses, the Ministry of Agriculture and Rural Development, the Ministry of Environment and
Sustainable Development, and the National Planning Department (DNP), launched the BioCarbono
Fund at the international Tropical Forest Alliance 2020 (TFA) conference, which took place in
Bogotá. This initiative led by the National Government, in strategic collaboration with the World
Bank, will be developed in the departments of Meta, Vichada, Casanare and Arauca, in order to
promote a more productive agriculture and expand the practices and technologies of sustainable
land management, for the protection of forests. It is important to highlight that only five
countries in the world are part of this global initiative; Colombia and Mexico are the only
countries in the Latin American region.
Mangroves - Literature Review Colombia
The present body of literature indicates that coastal ecosystems play a critical role in the global
sequestration of C as well as in providing key ecosystem services. Carbon is sequestered in
vegetated coastal ecosystems, specifically mangrove forests, seagrass beds, and salt marshes,
and the oceanic fraction has been more recently addressed as “blue carbon”. Blue carbon is
sequestered over the short term (decennial) in biomass and over longer (millennial) time scales
mainly in sediments. These ecosystems generally sequester C within their underlying sediments,
living biomass aboveground and belowground, and non-living biomass.

FINAL REPORT
I. Current status of knowledge and development
Current understanding of the impact of CDR approaches in LAC | 133
Mangrove forests, sea-grass meadows and tidal salt marshes are highly efficient C sinks, in part
also due to the structural complexity of those ecosystems. Specifically, in Caribbean mangroves
the sediments in which these ecosystems grow do not become saturated with C, because
sediments accumulate vertically in response to rising sea level (McKee et al., 2007).
However, globally, carbon-rich mangrove forests, one of the most productive and efficient long-
term natural carbon sinks, have experienced increasing deforestation and degradation, as well
as frequent conversion to other land uses. Deforestation and conversion generate substantial
carbon emissions that may increase with the intensification of land use change and cover.
There are different estimates of mangrove carbon stocks (aboveground and belowground) and
areal extent derived from measurement and modelling (Giri et al., 2011; Hutchison et al., 2014;
Kaufman et al., 2020). According to Hamilton and Friess, globally, mangroves stored 4.19 Pg of
carbon in 2012, while Kaufman at al. estimate that mangroves store about 11.7 Pg C. Land use
change is a major cause of loss and degradation, with loss of C carbon stocks that tend to be
higher than losses associated with land-use change in upland forests Kauffman et; al, 2020).
Mangroves are prevalent strategic coastal ecosystems along the Pacific and Caribbean coasts of
Colombia. They provide services that make mangroves important locally, regionally and globally.
However, according to a systematic review recently undertaken,19 the Colombian Pacific coast,
that contains circa 80% of the country’s mangroves, has been under-studied. In this regard, at
the Institute of Marine and Coastal Research (INVEMAR), Colombia, the country has developed
methodological approaches for REDD+ type projects in mangrove ecosystems,20 considering that
according to some estimations, mangroves absorb fifty times mora carbon than tropical forests.
The Ministry of Environment of Colombia issued the Resolution 1263 / 2018 which defined new
terms of reference for the formulation, complementation, and updating of the mangrove
characterization, diagnosis, and zoning studies; formulated the guidelines for its integral
management; and adopted the "Guide for the restoration of mangrove ecosystems in Colombia"
to advance restoration processes, among others.
According to Bernal (2017), the central Government is working towards meeting the target of
developing a comprehensive and sustainable land use planning and management of Colombia’s
mangrove ecosystems by 2025.
Some of the relevant scientific literature related to mangrove in Colombia is described below:
19 Castellanos-Galindo et al. (2020). Mangrove research in Colombia: Temporal trends, geographical coverage and research gaps. Estuarine, Coastal and Shelf Science. Elsevier. 20 Invemar, Carbono y Bosques y CVS. 2015. Guía Metodológica para el desarrollo de proyectos tipo REDD+ en ecosistemas de manglar.
FINAL REPORT
I. Current status of knowledge and development
Current understanding of the impact of CDR approaches in LAC | 134
Urrego, L.E., et al, 2014. "Environmental and anthropogenic influences on the
distribution, structure, and floristic composition of mangrove forests of the Gulf of
Urabá (Colombian Caribbean)"
Under this study, mangrove forests were mapped and classified following analysis of aerial
photographs. Based on 87 circular 500 m2 plots, authors assessed the structure, floristic
composition, and environmental attributes of mangroves. Three mangrove forest types were
identified, according to the physiographic classification based on location; riverine, basin, and
fringe; and a mangrove type in a highly disturbed stage. Significant differences among
mangroves were found; therefore, authors hypothesis was accepted. Rhizophora mangle,
Laguncularia racemosa, and Avicennia germinans exhibited the highest importance values (IVI)
in fringe and riverine mangroves; and in basin mangroves, A. germinans showed the highest IVI,
with the importance order of these species inverted. Small highly disturbed mangrove fragments
were dominated by R. mangle. Tree diameters and heights were asymmetric unimodally
distributed, suggesting large forest disturbances related to timber overexploitation, and poor
conservation status. Differences among mangrove types were related to soil salinity,
granulometry, and nutrient concentrations.
Zárate, T., Maldonado, J., (2015). "Valuing Blue Carbon: Carbon Sequestration Benefits
Provided by the Marine Protected Areas in Colombia". PLoS ONE. 10.
10.1371/journal.pone.0126627.
The objective of this study was to value the services associated with the capture and storage
of oceanic carbon, known as Blue Carbon, provided by a new network of marine protected areas
in Colombia. Authors approached the monetary value associated to these services through the
simulation of a hypothetical market for oceanic carbon. To do that, authors constructed a
benefit function that considers the capacity of mangroves and seagrasses for capturing and
storing blue carbon, and simulated scenarios for the variation of key variables such as the
market carbon price, the discount rate, the natural rate of loss of the ecosystems, and the
expectations about the post-Kyoto negotiations. The results indicate that the expected benefits
associated to carbon capture and storage provided by these ecosystems are substantial, but
highly dependent on the expectations in terms of the negotiations surrounding the extension of
the Kyoto Protocol and the dynamics of the carbon credit market’s demand and supply.
INVEMAR, 2015. Informe del estado de los ambientes y recursos marinos y costeros en
Colombia: Año 2014. Serie de Publicaciones Periódicas No. 3. Santa Marta. 176 p.
Among other natural resources, this study characterizes mangroves in Colombia. An estimation
of the mangrove area is included based in official information from Ministry of Environment
(MADS): Caribbean Coast (88,575 ha) and Pacific Coast (194,880 ha) totalizing 283,456 ha in
Colombia.

FINAL REPORT
I. Current status of knowledge and development
Current understanding of the impact of CDR approaches in LAC | 135
Table 15: Mangrove area in Colombia by deopartment
Department Mangrove area (ha)
San Andrés Providencia y Santa Catalina
245
La Guajira 2,730
Magdalena 40,906
Atlántico 613
Bolívar 15,055
Sucre 12,957
Córdoba 9,077
Antioquía 6,993
Chocó 41,348
Valle del Cauca 32,073
Cauca 18,691
Nariño 102,768
TOTAL 283,456
Source: INVEMAR 2015 based on MADS
It also provides an analysis of the causes of deterioration identified in the mangroves of
Colombia at the departmental level, being land use change (blue bars in following figure) and
resources extraction (red bars) the main causes.

FINAL REPORT
I. Current status of knowledge and development
Current understanding of the impact of CDR approaches in LAC | 136
Figure 18: Causes of deterioration identified in the mangroves of Colombia at the departmental level
Source: INVEMAR 2015
Yepes et al, 2016. "Tree above-ground biomass allometries for carbon stocks estimation
in the Caribbean mangroves in Colombia". Rev. Biol. Trop.
The objective of this study was to analyze the above ground biomass (AGB) of the species
Rhizophora mangle and Avicennia germinans from the Marine Protected Area of Distrito de
Manejo Integrado (DMI), Cispatá-Tinajones-La Balsa, Caribbean Colombian coast. With official
authorization, the researchers harvested and studied 30 individuals of each species, and built
allometric models in order to estimate AGB. The AGB result for the studied mangrove forests
of the DMI Colombian Caribbean was 129.69 ± 20.24 mega grams of biomass per ha, equivalent
to 64.85 ± 10.12 mega grams of C per ha. The DMI has an area of 8,570.9 ha in mangrove forests,
and then the estimated total carbon potential stored was about 555,795.93 Mega grams of C.
The bibliographic analysis of the authors highlighted that "Mangroves are among the most
productive ecosystems on the planet, with an average production of 2.5 grams C / m2 / day
(Jennerjahn & amp Ittekkot, 2002), and for this reason they are well known for their high carbon
accumulation, with reports of superior storing at 1 000 Mega grams C / ha (Donato et al., 2011)".

FINAL REPORT
I. Current status of knowledge and development
Current understanding of the impact of CDR approaches in LAC | 137
Bernal, B. et al, 2017. "Assessment of mangrove ecosystems in Colombia and their
potential for emissions reductions and restoration". Winrock International
This report is a preliminary evaluation of the potential of including mangrove restoration and
sustainable mangrove use in Colombia’s Nationally Appropriate Mitigation Actions (NAMA)
strategy.
According to the literature review of the authors, the largest mangrove forest in Colombia (in
the Ciénaga Grande de Santa Marta), for example, has lost 60% of its coverage since the mid-
1950’s (Elster, 2000), and ten years ago about 21% of Colombia’s remaining mangroves were
considered degraded (INVEMAR, 2014).
Regarding mangrove loss, the authors found in their literature review that Colombia’s
mangroves covered about 371,250 ha in 1997, with about three-fourths located in the Pacific
coast (~283,000 ha) and one-fourth in the Caribbean coast (~88,250 ha) (Sánchez-Páez et al.
1997b). By 2014, the total coverage had decreased to 286,804 ha, a 23% decrease from the 1997
coverage at a loss rate of 4,967 ha y-1 (assuming a constant rate of mangrove loss). The review
by Álvarez-León (2003) reported an even higher loss rate between 1966 and 1991 of 7,965 ha y-
1.
Figure 19: Latest mangrove zoning in Colombia, according to INVEMAR (2014) and to the central
Government
Source: Bernal et al 2017 with information from INVEMAR 2014 and central Government
Authors also analyzed the location of mangroves versus population density in order to assess
the pressure that fuelwood demand has on Colombia’s mangrove ecosystems.

FINAL REPORT
I. Current status of knowledge and development
Current understanding of the impact of CDR approaches in LAC | 138
Figure 20: Map of Location of mangrove coverage and Population density
Source: Bernal et al 2017
An analysis of carbon removal in Colombian mangroves is included in the study based in above
ground biomass estimation. The analysis indicates that mangrove restoration in Colombia can
potentially remove CO2e, through aboveground mangrove biomass growth, at a rate of 16.1 ± 2.9
t CO2e ha-1 y-1, and 4.4 ± 0.7 t CO2e ha-1 y-1 during the first 20 years of restoration of mangrove
trees and shrubs, respectively. After the first 20 years since planting, the emission removal rates
would be 7.4 ± 1.9 t CO2e ha-1 y-1 for mangrove trees and 1.4 ± 1.3 t CO2e ha-1 y-1 for mangrove
shrubs over the next 30 years, assuming a constant rate of growth. These removal rates can be
applied to mangrove restoration areas to estimate the total CO2e removals with mangrove
restoration

FINAL REPORT
I. Current status of knowledge and development
Current understanding of the impact of CDR approaches in LAC | 139
Figure 21: Bio mass C growth curve of mangrove trees and mangrove shrub scrub.
Source: Bernal et al 2017
Figure 22: Average potential CO2e removal rate (t CO2e y-1)) from mangrove restoration in Colombia
Source: Bernal et al 2017
Finally, authors found that "to the date, there is no specific information available on Colombia’s
mangrove restoration targets. Several peer-reviewed publications and Government reports
evaluate the success of mangrove restoration in some areas of the country (see the following
sections on Caribbean and Pacific mangrove current status and the list of bibliographical
references used). Mangroves are included in the latest National Restoration Plan34, without

FINAL REPORT
I. Current status of knowledge and development
Current understanding of the impact of CDR approaches in LAC | 140
specifying explicit restoration locations, target areas (size) of restoration, or even a current
extension of degraded mangroves in the country. Therefore, it seems that an evaluation of
priority restoration targets is lacking in Colombia, as well as a restoration feasibility plan that
would allow identifying benefits of restoring specific mangrove areas in the country".
INVEMAR, 2017. "Basic Restoration And Monitoring Plan For 150 Hectares Of Mangrove
In The Management District Integrated Of Cispata, Córdoba"
Palacios Peñaranda, M., et al, 2019. "Carbon stocks in mangrove forests of the
Colombian Pacific", Estuarine, Coastal and Shelf Science
The study quantified carbon stocks in mangrove forests in two bays in the Colombian Pacific,
and evaluated the effect of forest structure on variations of carbon storage in the different
ecosystem compartments. Significant differences were found in carbon stocks between the
stations of Málaga Bay (a national marine park) and Buenaventura Bay (the main harbor area).
Belowground biomass and sediment represented the greatest carbon stocks in the forest.
Carbon reserves in mangroves in the Colombian Pacific were similar compared with other
tropical mangrove areas.
Above-ground biomass values are a significant carbon reserve (17%of the total carbon stocks) in
the mangrove forest. The lowest values were registered in San Pedro 70 mg C/ha (14%), while
the highest values at Quebrada Valencia 143.2.
Soil carbon values showed differences as a function of depth in all sampling stations. The lowest
values were obtained in the upper part and values increased with soil depth. The lowest values
were obtained at Quebrada Valencia 130.3 Mg C/ha, (18%), while the highest values were
obtained at Pianguita 180.8 Mg C/ha, (25%).
The highest values of carbon stocks in the mangrove forest studied were recorded in below
ground biomass. The greatest values were obtained at Quebrada Valencia 450.26 Mg C/ha
(26.3%), while the lowest values were registered at San Pedro 258.3 MgC/ha (52.2%).

FINAL REPORT
I. Current status of knowledge and development
Current understanding of the impact of CDR approaches in LAC | 141
Figure 23: Above-ground biomass (Agb), below-ground biomass (Bgb), height (H), and basal area (BA) of
mangrove forests at several locations in the tropical zone
Source: Palacios Peñaranda, M., et al, 2019
Blanco-Libreros, J. F.et al, 2019. "Mangroves of Colombia revisited in an era of open
data, global changes, and socio-political transition: Homage to Heliodoro Sánchez-
Páez". Revista de la Academia Colombiana de Ciencias Exactas, Físicas y Naturales,
The voluminous information collected by Heliodoro Sánchez-Páez and his colleagues in the
largest national inventory of mangroves (MCP: Mangroves of Colombia Project, Ministry of the
Environment) undertaken in the mid 1990’s provides an opportunity to re-assess biogeographic
hypotheses (ex:, that high rainfall promotes the increase in the importance value of red
mangroves) and to explore macroecological patterns when combined with open data sets. The
objective of this paper was to introduce HELIO_SP.CO v.1, an open database derived from this
mangrove inventory as a homage to Heliodoro Sánchez-Páez, who passed away in 2017, as a
platform for macroecological studies and benchmark for future impact assessments of climate
change and land-use change on mangroves in Colombia. In addition, the contributions of the
MCP were reviewed and the general geographic patterns were explored by using HELIO_SP.CO
v.1.
INVEMAR, 2019. "20 years (1999-2018) of mangrove monitoring in San Andrés and
Providencia Islands"
CORALINA and INVEMAR present this publication fulfilling the scope to the mangrove monitoring
protocol published in 2014 by both entities, presenting a historical diagnosis in the Archipelago
of San Andrés, Providencia and Santa Catalina in the framework of the Cooperation Agreement
001-19, in order to present the current state of this ecosystem of special interest taking into

FINAL REPORT
I. Current status of knowledge and development
Current understanding of the impact of CDR approaches in LAC | 142
account the current and historical tensors of anthropic and natural origin, to give guidelines to
future administrations on the planning and monitoring of management actions to be taken to
give continuity to its sustainability.
Castellanos-Galindo, G. A., et al, 2020. "Mangrove research in Colombia: Temporal
trends, geographical coverage and research gaps". Estuarine, Coastal and Shelf Science
Mangroves are prevalent coastal ecosystems along the Pacific and Caribbean coasts of Colombia,
with several structural features and service provisions that make them important regionally and
globally. Despite this importance and the existence of national laws to protect them, research
on these ecosystems has been historically scarce if compared to the terrestrial ecosystems of
the country. Here, authors analyse historical trends of mangrove research in Colombia for the
time period 1900 until 2018. To do so, a systematic literature search was carried out based on
the Web of Science (WoS), Scopus and Google Scholar scientific citation databases. A noticeable
increase in the number of mangrove studies in Colombia was found in the 2001–2010 decade.
Although the Colombian Pacific contains ca. 80% of the country's mangroves, a greater number
of mangrove studies has been conducted on the Caribbean coast. Ciénaga Grande de Santa
Marta, a degraded but productive coastal lagoon, is by far the most studied mangrove site in
Colombia. Google Scholar was able to capture ~10 times more studies (mostly grey literature
and peer reviewed articles in Spanish) than the Web of Science and Scopus databases, indicating
the need to include this type of information in systematic reviews. Authors propose that future
mangrove research in Colombia should prioritize: (1) historically understudied areas where
degradation threats are strongest (ex: near planned infrastructure projects), (2) areas poorly
examined but likely to contain healthy, carbon-rich and tall mangroves (ex: most of the Pacific
coast) and (3) interdisciplinary studies that provide for a more holistic social-ecological
understanding of Colombian mangrove systems.
In addition to the communities, non-profit organizations such as WWF Colombia and The Nature
Conservancy are already working on mangroves’ restoration in Colombia; efforts also include
local companies such as Grupo Familia, Bavaria and Grupo Argos (through Fundación Argos); local
technical institutes as Institute for Marine and Coastal systems (Invemar); and both national
(MinAmbiente) and local (Mayor of Cartagena) authorities.
Large international companies are supporting research projects with the technical support of the
Institute for Marine and Coastal systems (Invemar) aiming atmore efficient ways to measure
carbon stored in the mangrove forests of Colombia, using new available technologies, that would
eventually allow to sell carbon offsets to fund the protection and restoration of mangroves, given
what they assume to be their capacity to sequester about 10 times as much carbon per unit area
as terrestrial forests.
In terms of initiatives, through Apple’s Earth Day 2018 Give Backcampaign, the US company has
partnered with Conservation International to protect a 27,000-acre mangrove forest in Cispatá
Bay on the Caribbean coast of Colombia. As indicated by project sponsors, over the course of its

FINAL REPORT
I. Current status of knowledge and development
Current understanding of the impact of CDR approaches in LAC | 143
lifetime, the Cispatá Bay’s mangrove forest could sequester 1 million metric tons of carbon
dioxide.
Bioenergy with carbon capture and storage (BECCS)
The following figure summarizes in a timeline, regulations, plans and programmes related to
BECCS CDR approaches implemented in Colombia, that are developed in a detailed manner in the
following sections.
Figure 24: BECCS related regulations, plans and programmes implemented in Colombia - Timeline
Source: own elaboration
Alignment with Government Vision and Commitment
Almost 20 years ago, in 2001, Colombia passed Law N° 697 "Efficient use of energy and alternative
energy use in Colombia" which declares the rational and efficient use of energy and promotes
alternative energy use within Colombia, creates a program for such objective called PROURE and
sets the first stages for renewable energy development.
2001
Law N° 697 –Efficient use of energy and
alternat ive energy use in Colombia
1992
UPME - Mining and Energy Planning Unit
2014
Law N° 1715 –Regulation of integration of non-
conventional renewable energy to the nat ional
energy system (SIN)
2019
Law N° 1,955 - National Development Plan
(PND)
2015
Generat ion Transmission Reference
Expansion Plan
2018
National development plan to promote wind
and solar (PND 2018-2022).
2019
UPME- Long-term energy auct ions (2)
2020
UPME National Energy Plan 2050

FINAL REPORT
I. Current status of knowledge and development
Current understanding of the impact of CDR approaches in LAC | 144
In 2014, the Colombian Congress issued Law N° 1715, which regulates the integration of non-
conventional renewable energy to the national energy system (SIN) with the intention to promote
efficient energy management through taxation mechanisms, cooperation arrangements, and
investment incentives. This law also aimed to promote investigation in the production and use of
non-conventional energy resources. Establishes a dedicated fund and creates the legal basis for
development of renewable energy support initiatives, thus paving the way for further policy and
regulatory action. Fiscal incentives were also provided by the law, including:
income tax deduction: up to 50% of taxable income during 5 years considering 50% of
the investment value
VAT exemption for renewable energy equipment and services
import duty exemption for renewable energy equipment imported
accelerated depreciation of up to 20% per year for renewable energy investments.
Five years later, In May 2019, Law N° 1,955 was sanctioned. It. issues the National Development
Plan (PND) for 2018-2022 called "Pact for Colombia, Pact for Equity", which replaces the previous
National Development Plan 2010-2014. One of the main goals of the plan was related to
renewable energy, targeting to increase the supply of energy from clean sources from a capacity
of 22 MW to 1500 MW.
Colombia's Mining and Energy Planning Unit (UPME), established in 1992, is the special
administrative/technical unit responsible for the sustainable development of the country's mining
and energy sectors, including hydrocarbons. Dependent on the Ministry of Mines and Energy,
UPME's main objectives are to comprehensively plan, support and assess the development of both
industries, as well as to support the ministry to design national policies and regulations.
In order to guarantee an adequate supply of the country's electricity demand, the National
Government, through the Ministry of Mines and Energy, adopted the Generation Transmission
Reference Expansion Plan 2015 -2029 prepared by UPME, a strategic document for generation
resources planning and the expansion of electricity transmission networks nationwide.
Historically, the renewable energy market in Colombia has been negligible compared to
Colombia’s hydroelectric and thermal generation. Installed renewable energy capacity in
Colombia was estimated around 50 MW. The Colombian government launched a national
development plan to promote wind and solar (PND 2018-2022). One of its goals is that by 2022,
8% to 10% of Colombia’s energy will be produced from renewable energy sources. In accordance
to those goals, during 2019, UPME conducted two long-term energy auctions:
CLPE No. 01-2019: Despite 22 projects were enrolled and 8 offers presented, the
auction was declared empty by UPME in February 2019 because insufficient demand-
side participation and no PPAs were awarded. According to specialized media "the
auction had certain technical and financial requirements that were not considered
commercially attractive by generators, and purchase offers submitted by offtakers

FINAL REPORT
I. Current status of knowledge and development
Current understanding of the impact of CDR approaches in LAC | 145
were too low. In addition, antitrust conditions that had been put in place to avoid
undue advantage by companies that were participants in both the sell and buy sides
were not met".
CLPE No. 02-2019: In October 2019, the auction awarded contracts for nine projects
accounting for 1,374 megawatts (MW) of new wind and solar power generation, at a
historic-low average price for the country of approximately $28 per megawatt hour
(MWh). No biomass or biogas projects were awarded. Projects selected in the auction
will be entitled to a 15-year PPA and must come into operation by January 1, 2022.
The newly awarded clean energy suppliers will mobilize an estimated $1.3 billion in
investment, boost Colombia’s generating capacity by 2,250 megawatts, and attract
another $2 billion of estimated private-sector investment.
Some challenges and critics to Colombian renewable energy auctions were identified by Norton
Rose Fulbright, for improvement in future auctions. "The government is expected to hold a third
renewable energy auction in 2020, but it recognizes that various challenges remain.
A major hurdle to increasing renewable energy production is the lack of infrastructure
in non-interconnected areas. Bidders in future auctions should assume their projects
will have to include grid infrastructure as well as storage.
Notwithstanding criticism from foreign investors in response to the initial auction, the
PPAs awarded in the second auction still set the energy prices in Colombian pesos, and
payments will be made in pesos at a price that will be adjusted on a monthly basis.
This remains a major challenge for foreign investors due to Colombian peso volatility
and currency risk. Investors have to use financial instruments, such as currency swaps,
to hedge against this type of currency risk.
Various developers complain that there has been a lack of planning around community
engagement in areas where projects are to be located, and that conditions placed on
bidders with respect to coordination with communities were overly burdensome and
complicated". [Norton Rose Fulbright, 2020]
Recently, in February 2020, UPME presented a preliminary version of the National Energy Plan
2050, a report that aims to set the basis of the energy planning for the next 30 years in Colombia.
Renewable energy is projected to be the fastest growing source of energy, gaining share on the
country's energy matrix.
Degree of Scientific Development / Academic Literature Review
Similarly as in Argentina, the research performed for Colombia shows that the academic activity
only covers the BioEnergy (BE) part of BECCS and that no integral BECCS literature was identified.
The most relevant academic literature identified and reviewed related to Bioenergy in Colombia
is summarized in this section.

FINAL REPORT
I. Current status of knowledge and development
Current understanding of the impact of CDR approaches in LAC | 146
Henson, I. E. et al. The greenhouse gas balance of the oil palm industry in Colombia:
a preliminary analysis. I Carbon sequestration and carbon offsets.
The first section of the study examines changes in carbon stock in Colombia resulting from
expansion of oil palm cultivation together with factors (offsets) that act to minimize carbon
emissions.
Sagastume Gutiérrez A. et al, The energy potential of agriculture, agroindustrial,
livestock, and slaughterhouse biomass wastes through direct combustion and anaerobic
digestion. The case of Colombia, Journal of Cleaner Production (2020).
An inventory of the main crops and livestock produced in Colombia, and the share processed in
agroindustry was developed to identify the available biomass wastes for energy applications.
Based on the inventory, the biomass-based energy potential was calculated for direct combustion
use and anaerobic digestion systems. The results show a bioenergy potential of 60,000 to 120,000
GWh per year, with higher potentialities for direct combustion systems than for anaerobic
digestion. In total, the combined use of direct combustion and anaerobic digestion can support
the use of gaseous and solid fuels from 50 to 97%. Using combined heat and power systems for
heat and electricity production can increase the biomass share in the end-use energy mix up to
15 to 28%, including 27 to 53% of the 68,943 GWh of electricity produced in 2018.
W Reyes-Calle et al. Drivers of biomass power generation technologies: Adoption in
Colombia. 2020 IOP Conf. Ser.: Mater. Sci. Eng. 844 012010
A structural analysis was carried out for decision making: international experiences were used to
identify Social, Environmental, Technical and Economic indicators and with the MICMAC method,
key variables were identified to define improvement strategies. Due to the flexibility of existing
technologies and energy in the areas of influence, international experiences present biomass as
a reliable alternative for the supply of electricity in areas that are isolated from the electricity
grid. This highlights the need for tariff policies to promote project development and technology
diversification. The electricity market should provide precision in the guidelines concerning the
sale of surplus electricity produced by companies that are not agents in the electricity sector.
Sagastume Gutierrez, A. et al. Data supporting the forecast of electricity generation
capacity from non-conventional renewable energy sources in Colombia. Data in brief
28 (2020). 2019
The forecast developed in this study was calculated based on data provided by the national
project registry provided by the Colombian government. The study forecasts the evolution of the
power generation capacity registered in non-conventional renewable energy source projects in
three scenarios of implementation of the power generation capacity registered.

FINAL REPORT
I. Current status of knowledge and development
Current understanding of the impact of CDR approaches in LAC | 147
Gomez, E. A.et al. Wood, Potencial Lignocellulosic Material for the Production of
Biofuels in Colombia. Inf. tecnol. vol.23 no.6 La Serena 2012.
The availability of wooded resources in Colombia is to assess their potential for ethanol
production. Forest species available in Colombian territory have high enough volumetric biomass
yields and short growth turns to guarantee a fast and constant supply of lignocellulosic biomass
to be used as raw material in a biofuel production process. Given the great technological and
highly competitive commercial products derived from pine and eucalyptus, Colombia should take
advantage of its situation and promote reforestation with these native species.
Garcia Ubaque, C. A. et al. Use of Pelleted Biomass in the Brick Industry in Bogota-
Colombia: Energy and Environmental Analysis. Inf. tecnol. vol.24 no.3 La Serena 2013
This study compared the energy and environmental performance of fuels from two types of
pelleted biomass: wood waste from pruning and waste from furniture production, mainly
sawdust. The biomass with better performance was sawdust, which presented the optimum
energy and environmental variables.
Perez, J. F. et al. Decentralized power generation through biomass gasification: a
technical – economic analysis and implications by reduction of CO2 emissions. Rev.
Fac. Ing. Univ. Antioquia N.° 62 pp. 157-169. Marzo, 2012
This article presents the feasibility analysis of two electricity generation projects with wood
biomass. The first one considers wood harvested from a forest with pine plantation as fuel
source(case 1), and the second one, biomass residues from a teak plantation (case 2). The most
suitable electricity generation technology is thermo-chemical process of gasification coupled
with combustion engines. Generation cost (USD/kWe-h) is calculated for each technological
alternative with a technical-economic analysis, as result the lowest costs are approx. 0.061
USD/kWe-h for 1.0 MWe, and 0.058 USD/kWe-h for 2.2 MWe, and 4.387,46 y 1.994,30 ton CO2e
estimated reductions. The conclusions reached are that the two biomass plants would have the
potential to generate 6,381.76 CERs per year.
Galan Riveros, X. F. Energy potential of agricultural residual biomass in Colombia.
Thesis for the title of Specialist in Environmental management. Faculty of Permanent
and advanced Education. Bogota, 2016.
The authors evaluate the energy potential of agricultural residual biomass in Colombia, by
analysing the advantages and implementation of successful cases. There is a diversification of
the use of agricultural biomass in the agroindustrial sector, although this has not been the result
of the application of the regulations but rather by the results obtained in electric power self-
generation processes at the initiative of certain productive unions.

FINAL REPORT
I. Current status of knowledge and development
Current understanding of the impact of CDR approaches in LAC | 148
Patino Martinez, P. E. Biomass: feasibility study to implement a system of energy
generation from vegetable waste. University of Santander. Postgraduate Directorate
Master in Advanced Energy Systems. Bucaramanga 2014.
A considerable amount of waste from the natural and artificial pruning creates a great potential
for the generation of biogas and electricity generation. A qualification and quantification of the
energy potential was made, and analysed the different processing technologies for vegetable
waste. Among these, the most feasible technology transformation from the environmental,
energy, economic and social, is anaerobic digestion. The construction of an anaerobic digester
requires special design, but in turn uses inexpensive materials. Santander University has
implemented an environmental policy that supports the development of such projects.
Plata Campo, L. A. Agricultural and forestry biomass as a competitive source of
alternative energy in non-interconnected areas: Perspectives and viability of
implementation in Colombia. Universidad de Los Andes. Bogota, 2006.
This paper describes the situation of the energy sector in Colombia. It presents agricultural and
forest biomass as an energy alternative for non-interconnected areas.
Finally, it is relevant to mention that in 2010 UPME published a comprehensive Atlas of the energy
potential of residual biomass in Colombia, with several detailed maps and statistics on the
subject.
Table 16: Energy potential of crop residues
Crop Production
(ton)
Residue Residues (ton) Energy potential
(TJ/year)
Palm 1.137.984 Pit 246.714 3.428
Fiber 712.946 8.845
Rachis 1.206.490 8.622
Sugar cane 2.661.348 Residual cane
harvest (RAC)
8.741.194 42.761
Bagasse 7.186.013 78.814
Panel cane 1.284.771 Bagasse 4.817.888 52.842
RAC 3.250.469 15.901
Coffee 1.092.361 Pulp 2.327.929 8.354
Husk 224.262 3.870
Stalk 3.303.299 44.701
Maize 1.206.467 Stubble 1.126.840 11.080
Husk 325.746 3.389

FINAL REPORT
I. Current status of knowledge and development
Current understanding of the impact of CDR approaches in LAC | 149
Source: UIS-UPME-IDEAM
Table 17: Energy potential of cattle residues
Source: UIS-UPME-IDEAM
Table 18: Energy potential of other residues
Source: UIS-UPME-IDEAM
Initiatives and Projects Development
Colombia’s installed capacity reached 18,217 MW by September 2020, showing an increase of 12%
(a CAGR of 2.4%) since 2015, and is largely based on hydro power (72%.).
Bioenergy-based power generation (bagasse, woodfuel and biogas) is mostly incorporated by
combined heat-and-power (CHP) plants, in some cases co-firing biofuels and natural gas or coal.
Cob 254.564 3.863
Rice 2.318.025 Chaff 5.447.359 19.476
Husk 463.605 6.715
Banana 1.834.822 Rachis 1.834.822 786
Stem 9.174.108 5.172
Residue 275.223 484
Plantain 3.201.476 Rachis 3.201.476 1.374
Stem 16.007.378 9.024
Residue 480.221 844
Total 330.350
Cattle Residues (ton) Energy potential
(TJ/year)
Bovine 99.168.808 84.256
Poultry 3.446.348 29.183
Porcine 2.803.111 4.306
Total 117.748
Other Residues (ton) Energy potential
(TJ/year)
Prunning waste 44.811 318
Collection points 120.210 92
Total 410

FINAL REPORT
I. Current status of knowledge and development
Current understanding of the impact of CDR approaches in LAC | 150
Figure 25: Installed capacity by source, 2015- September 2020
Source: Own elaboration based on data from XM via UPME.
Biomass-fed power generation installed capacity is mostly represented by bagasse CHP and
currently represents 0.8% over Colombia’s installed capacity (140 MW), after an increase of 50
MW (+54%, at a CAGR of 9%) between 2015 and 2020.
Figure 26: Detail of installed capacity from bioenergy sources, 2015- September 2020
Source: Own elaboration based on data from XM via UPME.
-
2,000
4,000
6,000
8,000
10,000
12,000
14,000
16,000
18,000
20,000
1 3 5 7 911
1 3 5 7 911
1 3 5 7 911
1 3 5 7 911
1 3 5 7 911
1 3 5 7 9
2015 2016 2017 2018 2019 2020
MW
Hydro Natural gas Coal Diesel oil Wind
Natgas- Jet blend HFO Bagasse Solar PV JET-A1
Biogas Woodfuel NI Gas Kerosene
-
20
40
60
80
100
120
140
160
1 3 5 7 911
1 3 5 7 911
1 3 5 7 911
1 3 5 7 911
1 3 5 7 911
1 3 5 7 9
2015 2016 2017 2018 2019 2020
MW
Bagasse Biogas Woodfuel

FINAL REPORT
I. Current status of knowledge and development
Current understanding of the impact of CDR approaches in LAC | 151
The large hydro power installed capacity in Colombia creates power generation dependent and
strongly influenced by hydro cycles (please refer in the figure to the end of 2015 and the first
quarter of 2016), resulting in the need of relatively high-power backup capacity in order to
compensate for low-hydraulic seasons and phenomena such as La Niña events.
In this context, while we mentioned that large hydro represented 72% of installed capacity by
the end of 2020, when it comes to power generation this share reaches more than 85% when
water is available and averages 75% per year.
As mentioned in the case of Argentina, power generation in Colombia remained stable during the
last five years, around 5,500 GWh per month (or 7,000 mean MW -month), but was strongly
affected in 2020 so far by restrictions resulting from low demand.
Figure 27: Power generation by source, 2015- September 2020
Source: Own elaboration based on data from XM via UPME.
As mentioned before, biomass-fed power generation is mostly associated to bagasse (sugarcane
residues), and in consequence is also affected by seasonal and agricultural cycles, averaging
697.4 GWh per year (based on 2019 data due to current demand conditions), or 1.1% of total
power generation in Colombia.
0
1,000
2,000
3,000
4,000
5,000
6,000
7,000
1 3 5 7 911
1 3 5 7 911
1 3 5 7 911
1 3 5 7 911
1 3 5 7 911
1 3 5 7 9
2015 2016 2017 2018 2019 2020
GW
h
Hydro Natural gas Goal NI Gas Bagasse
Solar PV HFO Wind Diesel Oil Biogas
Woodfuel JET-A1 Natgas- Jet blend Kerosene

FINAL REPORT
I. Current status of knowledge and development
Current understanding of the impact of CDR approaches in LAC | 152
Figure 28: Detail of Power generation from bioenergy sources, 2015 - September 2020
Source: Own elaboration based on data from XM via UPME.
Colombia’s energy and natural gas regulatory commission (CREG, by its acronym Spanish)
currently surveys by month the state of the key CHP plants in the country. The following table
summarizes the key characteristics of current CHP plants in Colombia by fuel, department and
installed capacity.
Table 19: Current bioenergy combined heat and power capacity, September 2020
Agent Department Source Capacity
(MW)
TERMOCARTAGENA S.A. E.S.P. BOGOTÁ D.E. Biogas 1.7
CELSIA COLOMBIA S.A. E.S.P. MAGDALENA Biogas 2.25
Total Biogas 3.95
COMERCIALIZADORA DEL CAFÉ S.A.S E.S.P CAUCA Bagasse 10
PROYECTOS ENERGETICOS DEL CAUCA S.A. E.S.P. CAUCA Bagasse 19.9
ELECTRIFICADORA DEL META S.A. E.S.P. META Bagasse 1.6
CEMEX ENERGY S.A.S E.S.P. META Bagasse 19.9
EMPRESA DE ENERGIA DEL PACIFICO S.A. E.S.P. RISARALDA Bagasse 17
GENERADORA UNION S.A. E.S.P. VALLE DEL CAUCA Bagasse 2
RIOPAILA ENERGÍA S.A.S E.S.P. VALLE DEL CAUCA Bagasse 19
0
10
20
30
40
50
60
70
80
1 3 5 7 911
1 3 5 7 911
1 3 5 7 911
1 3 5 7 911
1 3 5 7 911
1 3 5 7 9
2015 2016 2017 2018 2019 2020
GW
h
Bagasse Biogas Woodfuel

FINAL REPORT
I. Current status of knowledge and development
Current understanding of the impact of CDR approaches in LAC | 153
COMERCIALIZADORA DEL CAFÉ S.A.S E.S.P VALLE DEL CAUCA Bagasse 19.9
CELSIA COLOMBIA S.A. E.S.P. VALLE DEL CAUCA Bagasse 31.9
EMPRESA MUNICIPAL DE ENERGIA ELECTRICA S.A E.S.P VALLE DEL CAUCA Bagasse
Total Biomass 141.2
Total 145.15
Source: Own elaboration based on data from CREG and from XM via UPME.
Despite no bioenergy project was awarded in Colombia's first two renewable energy auctions,
there are a few biomass projects under study. UPME publishes a registry of all generation
projects. Registered projects are classified by UPME in three phases: Phase1 Pre-feasibility;
Phase 2 Feasibility; Phase 3 Detailed Engineering. According to that registry dated from week 24
of year 2020, there were four biomass-based generation projects registered, totalizing over 25
MW of planned capacity.
Table 20: Registered biomass project in UPME (as for Week 24 of 2020)
Source: UPME
The largest biomass project "Villanueva Project" is developed by SPV VILLANUEVA S.A.S. and is
expected to start operations by the end of year 2021. By mid-2020, this project was in Phase 2
Feasibility, while all other biomass projects were in Phase 1
There is another project (not included in the previous list) of biomass power generation in the
municipality of Carreño Port, close to the border with Venezuela, which aims to gain energy
independence for the Vichada village. The project called "RefoEnergy Bita" would generate
energy from wood chips with an installed capacity of 4.5 MW. The Uruguayan company Berkes
has an EPC contract for the project that has an estimated startup date in 2021. Berkes BD Director
declared in a recent interview that there is an important potential for biomass generation in Non-
Interconnected Zones (ZNI), in which conventional solutions for the provision of electrical energy
Project Name Source Capacity
MW
Departament Municipality
PROYECTO VILLANUEVA Energetic crop 25 CASANARE VILLANUEVA
AUTOGENERACIÓN SABANA
S.A.S.
Bagasse 0.43 SANTANDER RIONEGRO
GENERACIÓN DE ENERGÍA
ELÉCTRICA A PARTIR DE
CASCARILLA DE ARROZ
Biogas 0.35 TOLIMA PIEDRAS
PLANTA DE BIOGÁS MR PIG Bagasse 0.03 TOLIMA HONDA
FINAL REPORT
I. Current status of knowledge and development
Current understanding of the impact of CDR approaches in LAC | 154
are based primarily on the use of diesel generator sets. He also suggested that government should
separate auction by source and implement intraday hourly blocks in the tenders for bioenergy.
UPME has issued connection approval to more than 120 non-conventional renewable energy
(NCRE) projects outside the auction framework, which could potentially result in roughly 7,700
MW of new installed capacity. These figures were provided by the Colombian Minister of Mining
and Energy, Maria Fernanda Suarez, who at a recent forum in Bogota highlighted the positive
economic impact of renewables on the country's economic growth. Solar potential attracted most
of the interest, with UPME approving connection to 107 projects that account for 5,177 MW. Wind
power projects, 18 in total, secured rights for 2,531 MW, while biomass will potentially yield 48
MW across four projects, according to Suarez. All this new capacity is expected to come on top
of 2,500 MW of renewables that Colombia will accumulate by 2022 due to its two power auctions
held in 2019.
Other biomass resources, such as power generation municipal solid waste (MSW), industrial and
agriculture effluents, such as poultry and cattle residues
This subsection covers other biomass resources independently.
Alignment with Government Vision and Commitment
Energy recovery from solid waste is considered to be a renewable energy source in Colombia, in
accordance with Law N° 1,715, Article 18, enacted by the Congress of Colombia. In line with
Article 18, the energy content of solid waste that cannot be reused or recycled is considered to
be a non-conventional energy source.
According to the Colombian Superintendence of Domiciliary Public Utilities (SSPD, for its acronym
in Spanish) 1102 municipalities generated 26,528 T/day of solid waste in 2014, of that waste
80.4% was disposed in sanitary landfills, 3.09% was used in recovery plants, and 1.27% was taken
to containment buildings. Although, the regulations in force (Decree 838 of 2005, Decree 2820 of
2010, and Resolution 1890 of 2011) prohibit other waste disposal methods, a high share of the
adopted methods to dispose the remaining SW persist: release into bodies of water (0.45%),
uncontrolled burning (0.18%), garbage dumps (10.34%), and temporary trenches (4.26%).
Under the formulation of CONPES 3874 of 2016, the National Policy for Comprehensive Solid
Waste Management by 2030 was adopted. The primary objective is to "implement a solid waste
comprehensive management as a national policy of social, economic, environmental and health
interest, to contribute to the promotion of the circular economy, sustainable development and
adaptation and mitigation to climate change”. To achieve this objective, the policy is based on
four strategic axes: adoption of measures aimed at (i) preventing the generation of waste, (ii)
minimizing the amount of waste finally disposed at a site, (iii) promoting the reuse, use and
treatment of solid waste, and (iv) avoid the generation of greenhouse gases.

FINAL REPORT
I. Current status of knowledge and development
Current understanding of the impact of CDR approaches in LAC | 155
Another relevant legislation is the Decree N° 596 of 2016, which encourages to increase the rates
of use of solid waste in the country.
Degree of Scientific Development / Academic Literature Review
Several articles were identified related to other biomass resources in Colombia:
Sagastume, A. et al. 2020. The energy potential of agriculture, agroindustrial,
livestock, and slaughterhouse biomass wastes through direct combustion and anaerobic
digestion. The case of Colombia. Journal of Cleaner Production.
In Colombia, agriculture and livestock production, and the processing agroindustry are a
significant source of biomass wastes. Waste-to-energy technologies are an alternative to
revalorize these wastes as energy sources while reducing their environmental impacts. An
inventory of the main crops and livestock produced in Colombia and the share processed in
agroindustry was developed to identify the available biomass wastes for energy applications.
Based on the inventory, the biomass-based energy potential was calculated for the use of direct
combustion and anaerobic digestion systems. The results show a bioenergy potential of 60,000
to 120,000 GWh per year, with higher potentialities for direct combustion systems than for
anaerobic digestion. Using combined heat and power systems for heat and electricity production
can increase the biomass share in the end-use energy mix up to 15–28%, including 27–53% of the
68,943 GWh of electricity produced in 2018.
Alzate-Arias, S., et al. 2018. Assessment of Government Incentives for Energy from
Waste in Colombia.
This work evaluates the pre-feasibility of energy from waste projects in Colombia under the
guidelines of Law N° 1,715. The potential of electric power generation from municipal solid
waste of each conversion technology was estimated with mathematical models. Additionally, the
economic evaluation considered five cases that combine loan options, accelerated depreciation,
and income tax deductions. The results reveal that only anaerobic digestion and landfill gas
technologies constitute viable projects in case of traditional investment with and without loans.
Acevedo, C. H., et al. 2018. Techno-economic analysis of on-grid biomass renewable
energy power station: A case study in Caribbean region of Colombia
In this article a techno-economic study of an electric-biomass on-grid power plant is presented,
in order to compare the performance and the operating annual cost under some types of biogases
produced from poultry, bovine and porcine manure, and solid urban organic waste, using the
Homer® software to develop many solutions. The results presented a significant operational cost
reduction when the biogas generator is operating on grid, finding an 8.61% of cost decrease using
biogas generated from poultry, bovine, and porcine manure, and a 10.53% of cost decrease using
biogas from solid urban organic waste from centers and grocery marketplaces at Caribbean.
FINAL REPORT
I. Current status of knowledge and development
Current understanding of the impact of CDR approaches in LAC | 156
Alzate, S., et al. 2019. Municipal Solid Waste as a Source of Electric Power Generation
in Colombia: A Techno-Economic Evaluation under Different Scenarios.
This work evaluates the techno-economic pre-feasibility of waste to energy projects in Colombia
using four different conversion technologies of incineration, gasification, anaerobic digestion,
and landfill gas. Three study cases were selected: Guayatá, Andes and Pasto. The cash flows
produced by each technology in the three scenarios were evaluated to obtain the Internal Rate
of Return (IRR), which was found to be influenced by the benefits of this legislation. The results
show that these types of projects can have positive economic results if tax and government
incentives are considered.
Initiatives and Projects Development
There are no large-scale biogas projects identified in Colombia.
Besides the small-scale biogas projects registered in UPME and mentioned before, in Puerto
Tejada (Cauca) there is a project for the construction of a modern 4.4 MW power generation
plant from processed chicken, as part of a program called "Incubadora Santander". The project
was completed in 2017 with an estimated investment of 4.6 million dollars.
Enhancing soil carbon content and Enhancing soil carbon content with biochar
Alignment with Government Vision and Commitment
There are no specific laws or national plans in Colombia covering the enhancement of soil with
biochar.
Even though not mentioning biochar explicitly, there is a national program launched in 2015
called "Colombia Siembra" which main goal was to expand by one million the hectares sown in
the country by 2018. The program is promoted by the Ministry of Agriculture. The objectives of
the program included:
Increase the agricultural supply to guarantee food availability in the country
Increase the area and the yields destined to the production and to promote agricultural
and agro-industrial exports
Promote the development of agricultural businesses to improve the income of
producers
Strengthen technological development and services in the agricultural sector
Indirectly biochar could help to achieve higher yields and strengthen technological development.

FINAL REPORT
I. Current status of knowledge and development
Current understanding of the impact of CDR approaches in LAC | 157
Degree of Scientific Development / Academic Literature Review
Several scientific articles have been identified related to biochar as soil carbon content enhancer
in Colombia:
Molina D, et al. 2010. Maize yield and nutrition during 4 years after biochar application
to a Colombian savanna oxisol. Plant soil.
The application of biochar to soil has been shown to improve crop yields, but the reasons for this
are often not clearly demonstrated. The effect of a single application of 0,8 and 20 t ha−1 of
biochar to a Colombian savanna Oxisol for 4 years (2003–2006) was studied, under a maize-
soybean rotation. Soil sampling to 30 cm was carried out after maize harvest in all years but
2005, maize tissue samples were collected, and crop biomass was measured at harvest. Maize
grain yield did not significantly increase in the first year but increases in the 20 t ha−1 plots over
the control were 28, 30 and 140% for 2004, 2005 and 2006, respectively. The availability of
nutrients such as Ca and Mg was greater with biochar, and crop tissue analyses showed that Ca
and Mg were limiting in this system. Soil pH increased, and exchangeable acidity showed a
decreasing trend with biochar application. The greater crop yield and nutrient uptake were
primarily associated to the 77–320% greater available Ca and Mg in soil where biochar was applied.
Pachón, L. (2013). Economic analysis in the use of traditional knowledge in
anthropogenic Amazonian soils: Biochar. University of Bogota Jorge Tadeo Lozano
This research makes a comparison between two processes of soil improvement according to the
economic, social, cultural and environmental standpoint. The variables used were obtained by
review of secondary data and information produced with the Amazonian farmers, considering
different levels on attributes. Researchers also analysed a financial approach in order to know
the costs and benefits for the implementation of each method of soil improvement, to evaluate
some economic viability of each alternative. The main result shows the importance for the
indigenous people that ancestral soil modification in the Amazon region has, against the
economic efficiency that present contemporary techniques on soils improvement, such as the
Biochar case.
Alonso-Gómez, L.; et al. 2016. Biochar as an amendment in an oxisol and its effect on
the growth of corn. Rev. U.D.C.A Act. & Div. Cient.
In this study, the effect of applying different levels of biochar in a representative oxisol of
Colombian Altillanura and its effect on corn growth was evaluated. Soil samples were collected
and treated with African palm shell biochar, thermochemically obtained in a cylindrical fixed
bed reactor, in a concurrent flow regime. Different temperatures were handled to prioritize
obtaining biochar. Doses of biochar (m/m) of 0, 2, 5 and 10% were used and compared with
treatment with lime. After 45 days incubation, under external environmental conditions, seeds
of maize (Zea mays L.), Guacavía variety were planted in each container, without addition of
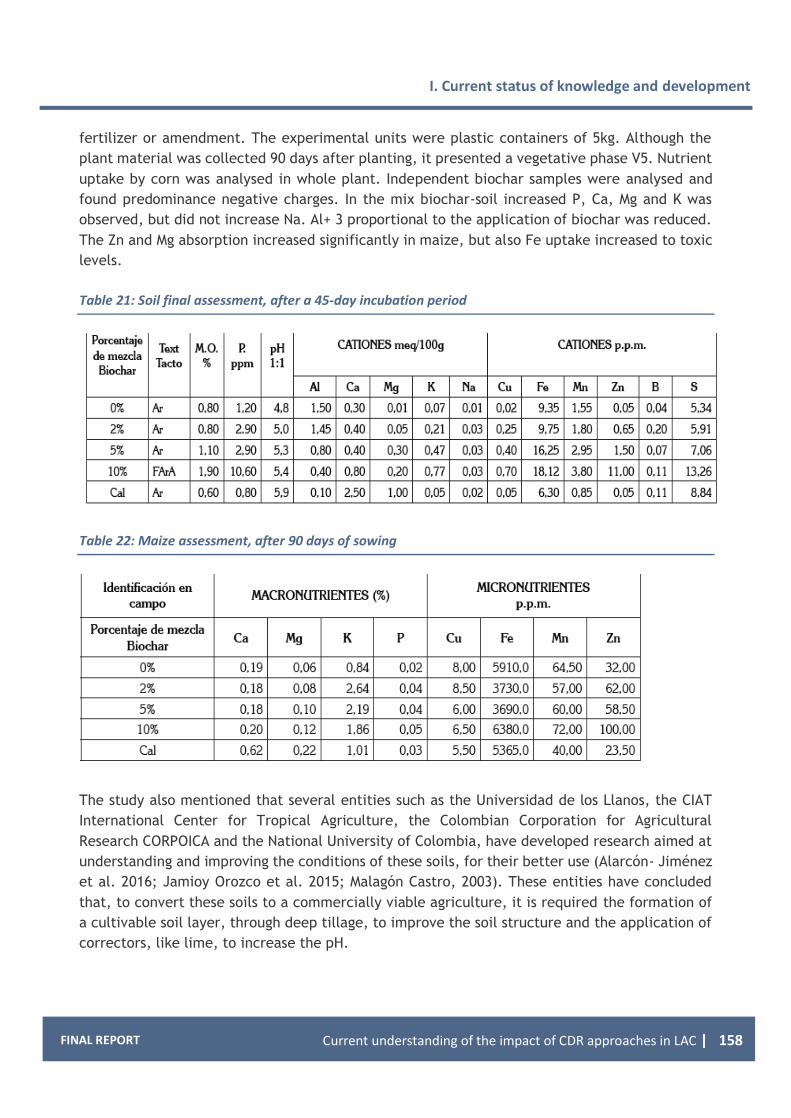
FINAL REPORT
I. Current status of knowledge and development
Current understanding of the impact of CDR approaches in LAC | 158
fertilizer or amendment. The experimental units were plastic containers of 5kg. Although the
plant material was collected 90 days after planting, it presented a vegetative phase V5. Nutrient
uptake by corn was analysed in whole plant. Independent biochar samples were analysed and
found predominance negative charges. In the mix biochar-soil increased P, Ca, Mg and K was
observed, but did not increase Na. Al+ 3 proportional to the application of biochar was reduced.
The Zn and Mg absorption increased significantly in maize, but also Fe uptake increased to toxic
levels.
Table 21: Soil final assessment, after a 45-day incubation period
Table 22: Maize assessment, after 90 days of sowing
The study also mentioned that several entities such as the Universidad de los Llanos, the CIAT
International Center for Tropical Agriculture, the Colombian Corporation for Agricultural
Research CORPOICA and the National University of Colombia, have developed research aimed at
understanding and improving the conditions of these soils, for their better use (Alarcón- Jiménez
et al. 2016; Jamioy Orozco et al. 2015; Malagón Castro, 2003). These entities have concluded
that, to convert these soils to a commercially viable agriculture, it is required the formation of
a cultivable soil layer, through deep tillage, to improve the soil structure and the application of
correctors, like lime, to increase the pH.

FINAL REPORT
I. Current status of knowledge and development
Current understanding of the impact of CDR approaches in LAC | 159
Muegue, L.C.D.; et al. 2017. Characterization and Potential Use of Biochar for the
Remediation of Coal Mine Waste Containing Efflorescent Salts.
In open pit coal mining, soil and vegetation are removed prior to the initiation of mining
activities, causing physical, chemical, and microbiological changes to the soil and landscape. The
study shows the results of an integrated study of the remediation of mine waste with a high level
of salt contamination in areas of the Cesar Department (Colombia), employing biochar as an
amendment. Soil remediation was evaluated in Petri dish seed germination bioassays using
Brachiaria decumbens. Biochar was shown to be effective in the improvement of pH, and
positively influenced the germination percentage and root length of Brachiaria grass seeds.
Figure 29: Biochar effects on germination and root length
The study also recommends that "in the near future, more tests will be required to reduce any
errors arising from the experiments. Another constraint is the scaling of biochar remediation
from Petri dishes to pots and experimental plots".
Rodriguez et al. 2019. Effectiveness of Biochar Obtained from Corncob for
Immobilization of Lead in Contaminated Soil.
The aim of the study was to analyse the efficiency of biochar, obtained from the gasification of
corncob, for the immobilization of lead in contaminated soils. Biochar from corncob was used as
an amendment for soil contaminated with lead (extracted from the municipality of Malambo,
Colombia) in order to estimate its ability to immobilize leaching lead. A comparison laboratory
test applied a modified biochar produced with a 10% hydrogen peroxide chemical treatment.
Laboratory tests indicated that unmodified biochar obtained a maximum retention of 61.46% of
lead, while the modified biochar obtained only 44.53% retention. In the pot experiments, the
modified biochar indicated high germination and growth of seeds (up to 89.8%). Although the
lead immobilization in soil was positive for both cases, the use of soil with high concentrations
of lead (167.62 g/kg) does not indicate biochar’s effectiveness for purposes of comparison with

FINAL REPORT
I. Current status of knowledge and development
Current understanding of the impact of CDR approaches in LAC | 160
the current United States Environmental Protection Agency (USEPA) limit value (400 ppm for bare
soil in urban play areas). Therefore, further studies are recommended using soil with lower lead
concentration levels.
Sánchez-Reinoso AD, et al. 2019. Use of Biochar in Agriculture. Acta Biologica
Colombiana. Universidad Nacional de Colombia
The objective of this review is to show how biochar (BC) can be obtained and its effects on the
physicochemical properties of soils and physiological behaviour of cultivated plants. It has been
found that BC application improves the physicochemical characteristics of the soil, including
fertility. This improvement generates positive responses in the physiological behaviour of plants
such as: the increase of germination, accumulation of dry matter, photosynthesis, yield, and
quality.
The use of BC opens essential opportunities for the sustainable management of agriculture in
Colombia. As mentioned before, BC can be considered in systems in which vegetables are
irrigated with contaminated water (Miranda et al., 2011) and in perennial crops exposed to heavy
metals due to activities related to mining and hydrocarbon exploitation (Jiménez, 2015), in order
to reduce their impact on human health. In this sense, the cocoa crop is cultivated in
contaminated soils with high cadmium content; in these scenarios, biochar can be an important
alternative in bioremediation of heavy metals (Lau et al., 2011). Another interesting opportunity
is to evaluate the different sources of plant and animal material as alternatives to be used in the
pyrolysis process, especially by-products such as sugar cane bagasse (Rodríguez et al., 2009), the
leaves and empty fruits of oil palm crops (Sukiran et al., 2011), corn, sorghum and rice chaffs,
cotton waste, as well as waste from livestock activities (pig, poultry and cattle manure). The
knowledge of the effects on the physiology of cultivated plants is one of the main challenges that
should be taken into consideration. A clear example is the use of solid vegetable residues of
coffee production systems as the pulp obtained from the fruit processing represents about 43.58
% of the coffee fruit on a fresh weight basis (Montoya, 2006). It has been reported that about
2258 kg ha-1 of coffee pulp are produced annually (Rodríguez, 2007). Collectively, about 162 900
t of fresh pulp are generated per each million bags of 60 kg of dried parchment coffee that is
exported from Colombia. If not used correctly, the pollution caused by these residues would be
equivalent to the one generated by the excrements and urine of a population of 868 736
inhabitants (Rodríguez, 2009). For this reason, alternatives such as the application of BC can
improve the productivity, quality and profitability of farmers.
Biochar opens essential doors for the sustainable management of agriculture in Colombia. It can
be considered in agricultural regions exposed to heavy metals, in order to reduce its impact on
human health.
Gallo-Saravia M. et al. 2018. Evaluation of biochar as substrate alternative in tomato
cultives. Universidad de Antioquia

FINAL REPORT
I. Current status of knowledge and development
Current understanding of the impact of CDR approaches in LAC | 161
In this work, two specific types of biochar are evaluated as potential substrate substitutes in
open small-scale cultures. A crop of Solanum lycopersicum (tomato) was used as reference, and
the effect on plant development and harvest (number, diameter and weight of fruits) was
observed when replacing the commercial substrate by biochar in proportions of 0, 20, 50, 80 and
100%. It was observed that with substitutions of 20% and 50% of substrate by biochar, the plants
show a normal development, and the tomato production is comparable to the one obtained in
the absence of biochar; However, when replacing 80% or 100% of the substrate by biochar, the
effect on plant growth is negative, apparently due to the absence of nutrients. From an economic
and environmental perspective, these results are quite satisfactory; since using 20% or 50% of
biochar can represent significant savings for the farmer (less use of substrates), while also giving
utility to agro-industrial waste (biochar).
Garzón E., M. (2010). Biochar from oil palm trunks: an alternative use of biomass and
improvement of soil quality during the renovation stage. Cenipalma.
Cenipalma assessed the agronomic potential of biochar from oil palm trunks undergoing
renovation at the Unipalma S.A. plantation (Colombian Eastern oil palm-growing zone). In a first
stage, researchers determined the amount of biomass from trunks present in one hectare,
characterized the material and quantified the nutrient reserves. In the second stage, the biochar
produced from the trunks was characterized physically and chemically, nutrient reserves were
quantified and the level of nutrients in the soil was assessed. The main results were: a) In biochar
there was an average storage of 23.5 t / ha of carbon; b) In the biochar, between 52 and 76% of
the carbon stored in the stipe was conserved. c) The incorporation of biochar in different doses
significantly affected the concentrations of K and P; acidity and exchangeable Al also decreased.
Table 23: Effects for different biochar doses
Nates Ocampo, E. 2014. Evaluation of the effect of biochar on the soil and the quality
of the fruits in a cape gooseberry crop (uchuva). Pontificia Universidad Javeriana
The aim of this study was to establish the impact of the application of biochar in the quality of
the fruits of an organic crop Cape gooseberry (Physalis peruviana L.) as well as the
Physicochemical and microbiological characteristics of the soil. The effect of biochar after a year
of soil-applied in two doses (3.5 and 8 ton ha1) in Santa Rosa de Viterbo, Boyacá was determined.
For the quality of the fruits, a greater weight of these was found in the 3.5 ton biochar treatment
(P = 0.007 F = 6.04), but in terms of brix degrees, pH and diameter there were no differences

FINAL REPORT
I. Current status of knowledge and development
Current understanding of the impact of CDR approaches in LAC | 162
between treatments. For the physicochemical characteristics of the soil, no significant
differences between treatments were found, nor correlation between soil variables and
characteristics of the fruit. It is concluded that after one year of application of biochar (in a dose
of 3.5 ton / ha of crop Cape gooseberry and without further fertilization) a positive effect on the
weight of the fruit was already observed. It is recommended to continue the study seeking to
know if there are subsequent changes in the physicochemical characteristics of the soil or crop
production, with the addition of biochar.
Initiatives and Projects Development
No large-scale projects have been identified related to biochar as soil enhancer in Colombia.
However, many experimental / laboratory projects and test were performed, as detailed in the
literature review.
Some other examples not included in the academic literature review are the following:
The Physics Department of the Colombia National University (UNC), led by professor Dussan
Cuenca, is working on an initiative for obtaining biochar from coffee plantations waste and apply
it to decontaminate rain and turbid waters in very short times and at low cost. Another
application is for water treatment from mining industry with high levels of heavy metals like lead
and mercury.
The company "r3 Environmental Technology Colombia SAS" conducted a research project from
June 2016 to March 2017, funded by the UK government and supported by the Colombian
Ministries of Mining and Environment and Sustainable Development. The project focused on
strategies for rehabilitating mercury contaminated mining lands for renewable energy and other
self-sustaining re-use strategies. Specific activities included (among others) technology
evaluations and bench scale test work including biochar for mercury stabilization to form an on-
site field-testing plan for techniques promising to be replicable to other similarly contaminated
sites.
Another project seeks to develop a new soil improver for Urabá Antioqueño from biochar
produced with waste from the palm sector. The project, starting in September 2020, is a joint
work of the National University of Colombia (Unal) Medellín Headquarters, the EIA University and
the Pontificia Bolivariana, together with the Sobiotech company.
Enhanced weathering or ocean alkalinization
Alignment with Government Vision and Commitment
In 2000, through Decree N° 347, the Colombian Oceanography Commission was restructured,
adopting the name of the Colombian Ocean Commission (CCO), responsible of proposing to the
National Government a National Policy for the Ocean and Coastal Spaces, for its administration

FINAL REPORT
I. Current status of knowledge and development
Current understanding of the impact of CDR approaches in LAC | 163
and sustainable development, carrying out the necessary inter-institutional and intersectoral
coordination.
Since 2002, the Guidelines for the National Policy of the Ocean and Coastal Spaces (LPNOEC)
were designed, thus establishing a starting point for the design and adoption of a State policy
that allowed identifying the main problems and needs of the regions (Caribbean-Pacific); and
suggested comprehensive strategies for the competitive and effective development of the
country through them. Therefore, since 2007, Colombia has a policy instrument that responds to
the need to assume the ocean from a comprehensive, systemic and total perception, which has
achieved international significance and recognition.
Colombia is a country of immense richness, it has coasts in two oceans and activities that take
place there are vital. The CCO promotes sustainability, integral development, competitiveness
of the ocean and its coasts, the scope of national maritime interests and insertion in new
international scenarios. For the period 2016-2030, the LPNOEC document projects Colombia's
path towards an Oceanic Medium Power (PMO), through guidelines for cooperation and
integration in marine affairs, economic development, sustainable use of resources, planning of
the marine territory and coastal protection of biodiversity and defence of sovereignty.
However, there are no specific laws or national plans or programmes in Colombia covering
enhanced weathering neither ocean alkalinization.
Degree of Scientific Development / Academic Literature Review
Even tough not explicitly covering ocean alkalinization, some academic literature has been
identified related to ocean characterization, its effects due to climate change and initial studies
on carbon sequestration of marine areas.
Zarate-Barrera TG, Maldonado JH. Valuing Blue Carbon: Carbon Sequestration Benefits
Provided by the Marine Protected Areas in Colombia. PLoS ONE 10(5): e0126627.
doi:10.1371/journal. pone.0126627. 2015
The objective of this study is to value the services associated with the capture and storage of
oceanic carbon provided by a new network of marine protected areas in Colombia. Marine
protected areas are aimed to protect and conserve key ecosystems for the provision of a number
of ecosystem services that are the basis for numerous economic activities. The capacity of
sequestering (organic carbon is a regulating service, provided mainly by mangroves and
seagrasses, that gains importance as alternatives for mitigating global warming become a priority
in the international agenda. The results indicate that the expected benefits associated to carbon
capture and storage provided by these ecosystems are substantial but highly dependent on the
expectations in terms of the negotiations surrounding the extension of the Kyoto Protocol and
the dynamics of the carbon credit’s demand and supply. The authors also find that the natural
loss rate of these ecosystems does not seem to have a significant effect on the annual value of

FINAL REPORT
I. Current status of knowledge and development
Current understanding of the impact of CDR approaches in LAC | 164
the benefits. This approach constitutes one of the first attempts to value blue carbon as one of
the services provided by conservation.
Rojas Higuera, P. J, et al. On global ocean warming and acidification and its possible
expression in the Colombian coastal marine environment. Rev. Acad. Colomb. Cienc.
Ex. Fis. Nat. 39(151):201-217, 2015
Based on the analysis of the data on sea surface temperature and pH recorded in sectors of the
Colombian Caribbean and Pacific coast, were deduced the potential impacts on the marine
ecosystems. Based on the review of the evidences published by other authors about the impacts
caused on ecosystems by the recent sea temperature increase and the pH reduction, it can be
assumed that Colombian ecosystems will be dramatically impacted given that changes in the
physical environment are greater than those reported up to day, a situation that will worsen with
time.
Zarate, T. The monetary value of the Colombian Blue Carbon: Benefits of carbon
sequestration and storage provided by the Areas Subsystem Protected Marinas.
Universidad de los Andes, Economy Faculty. 2013.
The objective of this document is to assess the services associated with capture and oceanic
carbon storage –Blue Carbon- provided by the Subsystem of Marine Areas proposed for Colombia.
Through the construction of a profit function and the estimation of possible future scenarios give
the carbon market and its price, obtain the monetary value associated with this service. The
results indicate that the annual expected benefits associated with carbon capture and storage,
provided by ecosystems such as mangroves and seagrasses, is highly dependent on parameters
that reflect the expectations regarding the negotiations on the extension of the Kyoto Protocol
and the dynamics between supply and demand of emission permits. Furthermore, it is found that
the annual rate of loss of these ecosystems does not seem to have greater effect on profits.
Popoyan Hernandez, J. G. Capture of CO2 in the Colombian Pacific Ocean between
2000 and 2011. Revista de Investigaciones Agroempresariales, Volumen 1, Enero -
Diciembre 2015
The flux of CO2 was estimated between the atmosphere and the Colombian Pacific Ocean derived
using satellite data (Sea Surface Temperature, wind speed) between 2000 and 2011 and validated
with in situ data available at the Carbon Dioxide Information and Analysis Center. The statistical
analysis indicated that while validating satellite data flux vs. the in situ showed a good
performance as a preliminary tool for estimating the fluxes, it is concluded that it is necessary
to have greater amounts of data on site, in order to adjust and improve the estimation model.
Regarding enhanced weathering, no specific academic literature was identified in Colombia.

FINAL REPORT
I. Current status of knowledge and development
Current understanding of the impact of CDR approaches in LAC | 165
Initiatives and Projects Development
No specific initiative or project related to ocean alkalinization was identified in Colombia.
Regarding enhanced weathering, neither were initiatives nor large projects identified in
Colombia.
Direct air carbon dioxide capture and storage
Alignment with Government Vision and Commitment
There are no specific laws or national plans or programs in Colombia covering direct air capture
and storage.
Degree of Scientific Development / Academic Literature Review
No academic literature was identified in Colombia covering direct air carbon dioxide capture and
storage technologies, except one particular paper, but it is focused in CO2 storage in deep
formations in the Llanos basin.
Mariño-Martínez, et al. (2018). Possibilities for CO2 capture and storage (CCS) in
Colombia - case Tauramena (Casanare). Universidad Pedagógica y Tecnológica de
Colombia
Although in Colombia there is a considerable concern regarding greenhouse gas emissions, only a
few studies has been focused on the real possibilities of injecting CO2 into the subsoil; for this
reason it is necessary to study the state of the art and consider areas with good possibilities for
capturing CO2. Sedimentary basins are the best option currently available for long-term CO2
storage. The conditions for the implementation of the method of CO2 storage in the Llanos basin
(Tauramena, Casanare) are favourable due to the presence of several members of the Carbonera
formation with good thickness and permeability; additionally, the presence of the overlaying
regional seal of the León formation, and the development of technologies in the hydrocarbon
industry, favouring the selection of this basin for potential pilot projects and subsequent
commercial implementation of the CCS method in the basin. The study only mentions CO2
capture technology in theoretic and broad terms, with no specific mention to Colombia.
Initiatives and Projects Development
The DAC technology provider Global Thermostat (GT) announced in year 2013 that it would start
operations in Colombia. Top management of the US firm held meetings with the Ministry of Energy
and Mines in Colombia. Despite those initial intentions, no specific project was announced in the
following years till present.

FINAL REPORT
I. Current status of knowledge and development
Current understanding of the impact of CDR approaches in LAC | 166
Ocean fertilization
Alignment with Government Vision and Commitment
See ocean alkalinization. We have identified no specific national plans or programs related to
ocean fertilization.
Degree of Scientific Development / Academic Literature Review
No specific academic literature related to ocean fertilization was identified in Colombia.
Same documents reviewed in ocean alkalinization are relevant to ocean fertilization, as they
characterize and cover the effects of climate change in Colombian oceans.
Initiatives and Projects Development
No specific initiative or project related to ocean fertilization was identified in Colombia.
Other CDR approaches in Colombia
PATIÑO RESTREPO, C. A. 2012. Study of the penetration of carbon capture and storage
technologies by systems dynamics. Master’s Thesis Master in Systems Engineering.
Universidad Nacional de Colombia.
For carbon capture and storage technologies (CCS) there is information available related to
current status of the main variables which influence on the weather and its changes, such as
atmospheric CO2. The model built in this study is going to be contrasted with other models to
analyze the adoption process and its barriers. Through the systems dynamic approach, the
interaction between the qualitative and quantitative variables of the model is simulated, such
as global warming perception, reduction goals and competence with carbon cap-and-trade. Using
a Logit model, the system dynamics model simulates competition with other technology and gives
a probability of choice of technologies, based on comparison of similar variables for each type of
technology.
Rodriguez Acevedo, E. et al. 2019. Develop of nanomaterials for CO2 geostorage in
shallow reservoirs. 2nd Latin American Engineering Congress. Colombia.
This study proposes, for the first time, an enhanced CCS process (eCCS), in which the stage of
CO2 separation is eliminated, and the flue gas is injected directly in shallow reservoirs located
at less than 300 m deep, where the adsorptive phenomena control CO2 storage. Carbon
nanomaterials were used as modifying agents of the reservoir porous texture in order to improve

FINAL REPORT
I. Current status of knowledge and development
Current understanding of the impact of CDR approaches in LAC | 167
both the CO2 adsorption capacity and selectivity. For this purpose, sandstone was impregnated
with nanofluids composed of carbon nanospheres dispersed in deionized water. As a main result,
the best materials for industrial application allows increase the adsorption capacity at 0°C to an
increment factor of 499 (from 0.00125 to 0.6265 mmol g-1 ) with only 20 % of nanomaterials at
atmospheric pressure, and by more than 800 (from 0.00125 to 1.1 mmol g-1 ) at 3.0 MPa. The
increment factor of adsorption capacity under shallow reservoir conditions (50°C and 3.0 MPa)
was more than 670 (from 0.00125 to 0.9 mmol g-1 ).
San Martín Cañas Janowsky, Stephanie & Tassinari, Colombo. (2019). Geological
storage of carbón dioxide: perspectives for Colombia. August 2019. Conference XVII
Colombian Geology Congress. Santa Marta, Colombia.
This work seeks to determine the theoretical potential of the geological storage capacity of
carbon dioxide in Colombia. The study was carried out based on the information available from
the Colombian oil basins, analyzing key geological parameters such as mineralogy, organic matter
content, thermal maturity, type of kerogen, porosity and its main characteristics, permeability
and thickness of layers. Additionally, to gain a clear perspective on the potential for CCS project
implementation in Colombia, pilot projects in Algeria, Brazil, France and Norway were analysed
in technical, environmental and social terms. As a result, this work summarizes the main
lithological systems that could be considered for the implementation of CCS in Colombian oil
basins, characterizing them according to their location, depth, type of reservoir, seal and kind
of trap. Additionally, the benefits and challenges for Colombia and its oil industry.
Other initiatives related to bioenergy generation that may provide a basis for further BECCS
development
Alignment with Government Vision and Commitment
Regarding biofuels in Colombia, Marin et al (2011) made an analysis of the initial legal framework.
Since 2002 the government of Colombia decided to strongly support the use and production of
biofuels. The law for the promotion of ethanol had been already adopted in 2001 (Law 693 2001)
while the current law to incentive biodiesel was approved in 2004 (Law 939 2004). These legal
instruments constituted the firsts steps of an ambitious biofuels strategy that estimates more
than 7 million hectares of land as the potential area for biofuels crops (palm oil and sugarcane).
To support this strategy the government resorted to existing policy tools that supported private
investment and adopted new legal instruments specifically aimed at stimulating biofuels
consumption and production (Policy Guidelines Biofuels CONPES 3510/2008; Policy Guidelines
Palm Oil CONPES 3477/2007). Instruments to stimulate production include incentives for both
the agricultural and industrial processes. Sugarcane and palm oil were identified as the most
promissory crops for ethanol and biodiesel production, respectively.
As explained by Gomez (USDA, 2019), the establishment of obligatory blending targets constitute
an important mediating factor in the promotion of biofuels in Colombia. Since March 2018, the

FINAL REPORT
I. Current status of knowledge and development
Current understanding of the impact of CDR approaches in LAC | 168
Colombian government introduced E10 and B10 across most of the country, except for three
border departments with Venezuela where no blend mandate is established for ethanol and only
two percent for biodiesel given cross-border smuggling issues. E10 and B10 are the highest blend
mandates ever established. They were introduced to help with high levels of pollution in major
metropolitan cities, contribute to Colombia’s climate change commitments under COP21, and
incentivize local production. In June 2019, the MME published a draft resolution for comments
that increase the biodiesel blend mandate to B12.
Degree of Scientific Development / Academic Literature Review
Ramón Fernando Colmenares-Quintero, Camilo José Rico-Cruz, Kim E. Stansfield &
Juan Carlos Colmenares-Quintero | Yibing Li (Reviewing editor) (2020) Assessment of
biofuels production in Colombia, Cogent Engineering, 7:1, DOI:
10.1080/23311916.2020.1740041
The methodology to assess biofuels production is as follows: the current drivers and barriers for
biofuels production in Colombia were reviewed. The results exposed that Colombia presents some
special conditions for the production of biofuels that allow to generate a competitive advantage
compared to other countries. However, some barriers can affect the adoption and production of
biofuels in the country. Secondly, a survey to biofuel producers, suppliers and researchers was
done, in order to validate their motivations and perceptions. Some similitudes and differences
with regard to the literature were found in the surveys. Hence, this information allowed the
authors to understand the reality of biofuels in Colombia from the stakeholders´ view.
Additionally, a set of policies were analysed. The authors believe that this set of policies will
help stakeholders to improve biofuels production in Colombia.
Initiatives and Projects Development
Colombia is the third largest biofuel producer in South America behind Brazil and Argentina.
There are twelve biodiesel production plants in Colombia with an aggregate installed capacity of
nearly 850,000 tons per year. Currently this liquid biofuel is produced in Colombia from the palm,
sunflower, soybean and rapeseed oil.

FINAL REPORT
I. Current status of knowledge and development
Current understanding of the impact of CDR approaches in LAC | 169
Table 24: Biodiesel plants in Colombia - Installed Capacity
Plant Location Capacity
(Liters/day)
Start-Up
BioD Facatativá,
Cundinamarca
200 2009
Biocombustibles Sostenibles
del Caribe
Santa Marta,
Magdalena
152 2009
Aceites Manuelita San Carlos de Guaroa,
Meta
120 2009
Ecodiesel Colombia Barrancabermeja,
Santander
115 2008
Oleoflores Codazzi, Cesar 70 2008
Inversiones La Paz San Carlos de Guaroa,
Meta
70 na
Biocosta Green Energy Santa Marta,
Magdalena
70 na
Odín Energy Santa Marta,
Magdalena
35 na
ALPO Barrancabermeja,
Santander
12 na
Romil de la Costa Barranquilla, Atlántico na na
Biodiésel de la Costa Gálapa, Atlántico na na
Biodiesel y Derivados Antioquia na Na
Source: Federacion Nacional de Biocombustibles

FINAL REPORT
I. Current status of knowledge and development
Current understanding of the impact of CDR approaches in LAC | 170
Figure 30: Map of biodiesel production plants
Source: Federacion Nacional de Biocombustibles
There are also seven bioethanol plants with an aggregate installed capacity of nearly 800,000 m3
per year (equivalent to 2.15 million liter per day). Most of the plants are located in the
department of Valle de Cauca and their main raw material is sugarcane bagasse.
According to the association Procaña, in a presentation of the sugar cane agro-industrial sector
from 2018, "biofuels contribute 6% to the reduction of GEI according to the national goal with
the current mixtures 8.4% for ethanol and 9.2% for biodiesel • In Colombia 1.3 million tons of
CO2 are no longer emitted due to the use of ethanol".

FINAL REPORT
I. Current status of knowledge and development
Current understanding of the impact of CDR approaches in LAC | 171
Table 25: Bioethanol plants in Colombia - Installed Capacity
Source: Federacion Nacional de Biocombustibles; Asocaña
Figure 31: Map of biodiesel production plants
Source: Federacion Nacional de Biocombustibles; Asocaña
Plant Location Capacity (Ton/Year)
Incauca, Miranda (Valle de Cauca) 350,000
Ingenio Riopaila Castilla La Paila (Valle de Cauca) 400,000
Ingenio Risaralda La Virginia (Risaralda) 100,000
Bioenergy Puerto López (Meta) 500,000
Ingenio Providencia Palmira (Valle del Cauca) 300,000
Ingenio Mayagüez Candelaria (Valle del Cauca) 250,000
Manuelita Palmira (Valle del Cauca) 250,000

FINAL REPORT
I. Current status of knowledge and development
Current understanding of the impact of CDR approaches in LAC | 172
3. Latin American and Caribbean Countries
This section includes a brief review of the current knowledge and degree of development of the
CDR approaches in Latin America and Caribbean countries.
Afforestation and reforestation
Brazil has various national research plans and programs on biodiversity and ecosystems,
including: National Research Program on Biodiversity and Ecosystems, SISBIOTA BRASIL
Program, PELD Program, REFLORA Program, PROTAX Program, Biodiversity Research
Program, Regional Networks of Research in Biodiversity and Biotechnology. Brazil joined
Initiative 20x20 in 2016 with a pledge to restore 22 million ha of degraded land by 2030.
The National Plan for the Recovery of Native Vegetation (Planaveg) plans to restore 12
million ha through forest restoration, reforestation, and natural regeneration by 2030 as
part of Brazil’s NDC to the Paris agreement. The other 10 million ha will be restored as
part of the Ministry of Agriculture, Livestock and Supply’s Low Carbon Agriculture Program
(ABC Plan), which runs from 2010-2020. The ABC Plan intends to restore 5 million ha of
land through two programs, Livestock-Forestry Integration and Agroforestry Systems. The
restoration of the remaining 5 million ha is planned to be achieved through recovery of
degraded pasture.
In Chile, forests cover an area of 17.6 million hectares, which represents 23.2% of the
surface of the national territory. According to its Nationally Determined Contribution, a
national plan is carried out and set the sustainable management and recovery of 100,000
ha of forest, mainly native, and to reforest 100,000 ha, mostly with native species (2020-
2030). National Consensus within the framework of the Forest Policy Council on the goal
of 500,000 ha afforested by 2035, on lands of preferably forestry aptitude, without
substituting native forest, and which belong to small and medium landowners or are fiscally
owned. It also has an urban reforestation plan, whose goal is set between 5 to 6 million
trees. On the other hand, the Green Climate Fund approved a 63.6 million dollars project
that will promote afforestation actions in more than 25,000 hectares, of which 7,000 will
be forestry and more than 17,000 for management, sustainability, and conservation. The
project will last 6 years and seeks to reduce the accumulated 1,147,800 tons of CO2
emissions. The Chilean National Forestry Corporation (CONAF) will execute the project,
with the support of the United Nations Food and Agriculture Organization (FAO).
Both Brazil and Chile also have made progress on industrialized wood-construction. The
Chilean company E2E is a joint venture between Arauco and the Belgian company Etex
created in 2018. Its factory, which has been operating since February 2019 in Santiago,
Chile, has the capacity to build 1,000 units per year – between prefabricated houses and
timber buildings.E2E estimated a US$25 million sales projection in the first 3 years and
counts on a US$15 million investment plan, of which US$ 6 million was invested in the
WEINMANN machine production plant – a company of the HOMAG Group. Tecverde, based

FINAL REPORT
I. Current status of knowledge and development
Current understanding of the impact of CDR approaches in LAC | 173
in Curitiba, Brazil is a company established in 2009 by entrepreneurs who were seeking to
disrupt and transform the civil construction industry in a sustainable, scalable way.
Tecverde received the support of private equity funds Global Environment Fund (GEF) and
Performa Investimentos. It employs 250 people and has a production capacity of 3,500
houses per year. In 2019, Chilean E2E signed an agreement to acquire a majority stake in
Brazilian Tecverde.
Mexico has an ambitious reforestation program to plant fruit and timber trees, including
cocoa and coffee, on almost 570,000 ha in the south of the country. Two government
programmes, CONABIO’s Restoration and Environmental Compensation Programme, led the
execution of restoration projects between 2004 and 2016; and CONAFOR´s (National
Forestry Commission), an initiative implementing a major reforestation project since 2013.
In addition, 2019's Sembrando Vida Program, Mexico commits to restore 8.5 million
hectares of degraded land under Initiative 20 × 20.
Since 2005, Peru has the National Reforestation Plan, which consists of different programs.
The program of forest plantations for commercial and / or industrial purposes, which aims
to reach, by 2024, a total area of 864,500 ha of forest plantations and industrial
agroforestry, and an average annual rate of 104,500 ha. The forest plantations program,
with purposes of environmental protection and watershed management, seeks to achieve,
by 2024, an annual reforestation rate of 84,500 ha and a surface area of 909,500 ha,
channeling public investments and international cooperation, for an approximate amount
of 688 million dollars and induce the creation of more than 225 thousand permanent jobs
prioritizing women and vulnerable groups.
Ecuador has the 2006 national afforestation and reforestation plan. Its objective is to
achieve forest plantations of 1 million ha in 20 years, 750 thousand ha for industrial and
commercial production plantations, 150 thousand ha of agroforestry plantations and 100
thousand ha plantations of conservation and protection of natural resources.
Uruguay pledged to restore 200,000 ha by 2030 within the National Restoration Program.
Paraguay has a National Reforestation Plan, its objective is the installation of forest
plantations in order to generate raw material for the industrial forestry sector, as well as
to cover the demand for biomass for energy purposes. The goal is the installation of 450,000
ha in a period of 15 years. In addition to the Bosques Project and PROEZA.
Different researchers agree that Latin America and the Caribbean has the second largest
area of mangroves in the world. Examples of climate actions protecting and restoring
mangrove forests comprise those included in Belize’s NDC that indicates that “Restoration
and protection have the potential to turn Belize’s mangrove system into a net carbon sink
by avoiding current emissions of around 11.2Gg CO2 per year and removing additional 2.2
– 35Gg CO2 per year, between 2020 and 2030. These national initiatives will be studied in
depth by reviewing the respective NDCs to identify all the countries that have included this
type of climate action, efforts associated with Blue Carbon mitigation and within REDD+
programmes and countries in the region participating in the Global Mangrove Alliance.

FINAL REPORT
I. Current status of knowledge and development
Current understanding of the impact of CDR approaches in LAC | 174
Mangroves - Literature Review Latin America
According to a recent publication from FAO (2020), there are 2.1 millon hectares of mangroves
in South America, accounting for 14.4% of the total world area of mangroves. "There was an
increase in the area of mangroves in South America in 2010–2020 at an average annual rate of
14,800 ha, reversing the declining trend in 1990–2000, when the region lost mangroves at a rate
of 10,200 ha per year. This reversal was due mainly to the process in Guyana, which reported an
average annual increase in mangrove area of 19,500 ha in 2010–2020, due partly to a mangrove
restoration project and partly to improvements in mapping (and therefore the increase does not
necessarily reflect actual changes in mangrove area)". Brazil is ranked number two among the
largest mangrove area countries in the world, behind Indonesia, with 9% of world's mangrove
area.
Altought the updated 2020 FAO publication does not include detailed statistics by country, there
is a previous study "The world’s mangroves 1980–2005" (FAO, 2007) that includes breakdown by
country within South America. About 90 % of South America's mangrove area is found in five
countries: Brazil, Colombia, the Bolivarian Republic of Venezuela, Ecuador and Surinam, while
Guyana, French Guiana and Peru share the remaining 140,000 hectares. During the 1980s and
1990s, mangrove lands were often considered unproductive and unhealthy. This perception and
the resultant activities caused a loss of some 250 000 ha of mangroves in the region (11 percent
of the 1980 extension).
Figure 32: Status and trends in mangrove area – South America (1980–2005)
Source: FAO 2007
Note: n.a. = not available; n.s. = not significant

FINAL REPORT
I. Current status of knowledge and development
Current understanding of the impact of CDR approaches in LAC | 175
The mangrove tree species diversity of South America region is low – only ten native species– the
lowest worldwide. Three species (Avicennia germinans, Laguncularia racemosa and Rhizophora
mangle) are very common and are found in all eight countries; others, such as Avicennia bicolor
and Pelliciera rhizophorae, are found with less frequency or their presence is less well
determined (FAO, 2007).
Figure 33: Mangrove species composition in South American countries
Source: FAO 2007
a Uncertain.
b Found on both coasts, but rare on the Pacific coast.
c Found only on the Pacific coast.
Bioenergy with carbon capture and storage (BECCS)
This briefing of BECCS literature review relies comprehensively in a very complete research from
Silva-Martínez, R. et al (2020) titled "The state-of-the-art of organic waste to energy in Latin
America and the Caribbean: Challenges and opportunities"
Bagasse from sugarcane is an important source of electricity in Brazil with an operating
power potential of more than 9 GW, considering that burning bagasse is still by far the
most cost-effective option in comparison with other thermochemical routes [Portugal-
Pereira, J. et al, 2015]. Additionally, Brazil is one of the largest agricultural producers
globally with large generation of agricultural residues, and also has already a considerable
number of biomass combustion power plants running on different feedstock beyond

FINAL REPORT
I. Current status of knowledge and development
Current understanding of the impact of CDR approaches in LAC | 176
sugarcane bagasse. For example, black liquor (1.7 GW), wood residues (371 MW), rice husk
(36 MW), charcoal (35 MW), elephant grass (32 MW) and palm oil (4 MW). In addition, the
first thermoelectric plant for eucalyptus residues was already authorized, with a capacity
of 50 MW in the State of Mato Grosso do Sul and should start its operation by 2021. The
owner is also planning to install two more plants in the near future. [Ambiente Energia,
2018] [Silva-Martínez, R. et al, 2020]
In Brazil, there are two plants evidencing viable production of cellulosic bioethanol from
sugarcane bagasse and straw. They are: GranBio power plant installed in Sao Miguel dos
Campos, Alagoas, and Raízen in Piracicaba, Sao Paulo. However, only Raízen is already
successfully producing 2G bioethanol on commercial scale [Gonçalves, F.A., et al, 2015]
The RenovaBio Program is designed to support Brazil’s COP21 goals. RenovaBio was
launched in December 2016 by the Ministry of Mines and Energy (MME) and was instituted
as the “National Biofuels Policy”. The RenovaBio operation is based on three main
instruments: 1. annual carbon intensity reduction targets (gCO2/MJ) for a minimum period
of ten years; 2. certification of biofuels by efficiency in reducing GHG emissions, and 3.
Decarbonization Credits (CBIO). Brazil’s total 2019 ethanol production is estimated at 34.45
billion liters per year, while biodiesel production is estimated at 5.8 billion liters per year.
No changes have been made to the current ethanol mandate, which remains at 27 percent
(E27) for Gasoline C (gasolina comum, more commonly referred to simply as “gasoline”)
since March 16, 2015. The last increase of the biodiesel blend mandate to twelve percent
(B12) took place in March 2020, there is a plan to further increase it to 15% by March 2023.
Brazil has the largest biofuel blend mandate in Latin America. [USDA, 2019]
In Mexico, there are around 59 projects for self-power supply through combustion processes
using biomass residues (i.e., mostly sugarcane bagasse) with an installed capacity of 500
MW [Aleman-Nava, G. S. et al, 2015] [Silva-Martínez, R. et al, 2020]
In Mexico, in 2008, the Law for the Promotion and Development of Bioenergy was
published, in order to contribute to energy diversification and sustainable development.
This laid the foundation for the production of biodiesel at industrial level in the country.
Six first- and second-generation biodiesel production plants were installed in the states of
Chiapas, Michoacán and Nuevo León, capable of processing Jatropha Curcas L., palm oil,
waste vegetable oils and animal tallow. [Montero, G. et al 2015] However, the
development of biofuels production capacity in Mexico is incipient. Biofuel blend mandate
have suffered setbacks recently discouraging investments in new installed capacity.
One of the largest sugar mills in the region is located in Nicaragua; The San Antonio sugar
mill (NSEL), is the top electricity producer from sugarcane bagasse in the region, currently
with an installed capacity of around 79 MW [Proparco, 2018] [Silva-Martínez, R. et al, 2020]
In Belize, there is cogeneration powerplant using sugarcane bagasse as fuel, with an
installed capacity of 31.5 MW [Lincoln, A. E., et al, 2015] [Silva-Martínez, R. et al, 2020]

FINAL REPORT
I. Current status of knowledge and development
Current understanding of the impact of CDR approaches in LAC | 177
Other biomass resources, such as power generation municipal solid waste (MSW), industrial and
agriculture effluents, such as poultry and cattle residues
Research and Development (R&D) in the region has been mostly focused on small-scale
anaerobic digesters (AD) and landfilling [Garfi, M et al, 2016]. In addition, R&D has
examined fermentation to a lesser extent. Nonetheless, interest in large-scale
biodigesters, second-generation (2G) biofuels, and MFCs has been gaining ground in
countries such as Argentina, Brazil, Chile, Colombia, and Mexico [Silva-Martínez, R. et al,
2020]
Brazil and Mexico are amongst the top five countries worldwide that receive more income
from mitigation projects. Most of the Certified Emissions Reductions (CERs) were the result
of biogas capture projects in landfills [Aleman-Nava, G. S. et al, 2015] [Silva-Martínez, R.
et al, 2020]. Landfills with gas capture infrastructure in Mexico receives more than 19
million tonnes of waste annually, amounting to an installed capacity of 16 MW. In the case
of Brazil, the use of biogas from landfills is well implemented for electricity production
and increasing. There are at least 39 projects in operation in the country. In Sao Paulo, for
example, there are nine landfills where gas capture has been used to produce electricity
[De Spuza, et al, 2014] [Silva-Martínez, R. et al, 2020]
In Brazil, large-scale projects are based in vinasse from sugar mills with 2 plants and
landfills with 38 waste to energy (WtE) plants. There are 14 WtE plants using sewage to
produce energy, mostly thermal and/or electricity, but only 1 plant producing biogas as
vehicle fuel in Franca, Sao Paulo State. The plant treats an average of 500 L of sewage per
second and produces around 2500 Nm3 of biogas per day, enough to replace 1500 litters of
common gasoline daily. The development of biogas in Brazil has the potential to avoid CO2
emissions, which may be up to 19.8 MtCO2eq per year, approximately 5% of the National
emissions. In 2016, the Brazilian government launched an auction call aimed to contracting
electricity from new generation projects. The winning project was the first commercial
scale biogas plant in the world using by-products of sugarcane (ex: filter cake and vinasse)
as raw material. The project is located in the north-western region of Sao Paulo State,
which is renowned for its sugar and ethanol production capacity in the country. The biogas
plant enters in operation in 2021 and focuses on electricity generation, with an installed
capacity of 21 MW [Investe Sao Paulo, 2019] [Silva-Martínez, R. et al, 2020]
In Brazil, the first large-scale co-digestion plant is located in Parana State. The plant
produces biogas from 600 m3 of sewage sludge and 150 tonnes of OFMSW per day. The
installed capacity is 2.8 MW, which is enough to supply electricity to 2100 households or
8400 people [C.S. Bioenergia, 2019]
Today around 74 large-scale biodigester exist to treat residues from meat industry (mostly
from pig farming), dairy waste and wastewaters in Chile. Some of the outstanding cases
are the treatment plant “La Farfana” in Santiago, which produces around 24Mm3 of biogas
annually; the plants “Santa Irene” y “Las Pampas”, with a combined installed capacity of
800 kW and supplying electricity for approximately 2500 families [INDAP, 2016]. Chamy

FINAL REPORT
I. Current status of knowledge and development
Current understanding of the impact of CDR approaches in LAC | 178
and Vivanco (2007) estimate biogas presents a power generation potential of approximately
3.5% of the installed capacity of Chile. [Silva-Martínez, R. et al, 2020]
On May 2017, an AD plant was inaugurated in Mexico City (Milpa Alta), for the treatment
of cactus and vegetable waste, generating almost 106 m3 per day of biogas. Since late
2016, the city of Culiacan installed the first large-scale dry anaerobic digestion plant (DAD)
for treating 4500 tonnes per year of agricultural residues. The plant has an installed
capacity of 100 kW. Another project is the AD plant in Atlacomulco, which co-digest OFMSW
and wastewater [Silva-Martínez, R. et al, 2020]
Enhancing soil carbon content (ESCC) and Enhancing soil carbon content with biochar
Enhancing soil carbon content (ESCC)
Literature about Increasing of soil Carbon stocks may be grouped in two main issues: soil C
changes in Cropland (A) and Soil C changes in Grasslands (B).
The main drivers of soil C balance are Soil type, Climate and Management. These factors
determine the C inputs (annual biomass production and humification rates) and the Soil C outputs
(decomposition rates by mineralization).
Soil and climate define the “site quality” that determine the potential conditions for biomass
production. Management practices determine the actual biomass production as well as the
mineralization rates. The main concept in C removal strategies is to maximize the biomass
production (C inputs) and reducing soil C losses. For example, in Croplands a main management
driver is tillage system (no tillage, reduced tillage and full tillage). In grasslands, the main
management driver is grazing pressure.
Soil Carbon sequestration studies in cropland and grazing lands
A – Croplands
Recently, IPCC revised emission factors for soil C stocks changes. An updated literature review
was carried out and the revised factors were included in the chapters 2 and 5 of the volume 4
(2019 Refinement to the 2006 IPCC Guidelines for National Greenhouse Gas Inventories). A long
list of papers, form all countries, used in the 1996, 2006 and 2019 are included in the references
section of this publication.
The following list of papers, from Argentina and neighbour countries, were included, in 2018, in
the recent meta-analysis of the IPCC database related to Soil C changes due to Land Use Changes,
Soil Tillage and Crop intensification practices.

FINAL REPORT
I. Current status of knowledge and development
Current understanding of the impact of CDR approaches in LAC | 179
Land Use Change Factor – Literature review Southern south America
Rojas, J. M., Prause, J., Sanzano, G. A., Arce, O. E. A. & Sánchez, M. C. (2016). Soil quality
indicators selection by mixed Models and multivariate techniques in deforested areas for
agricultural use in NW of Chaco, Argentina. Soil and Tillage Research, 155, 250–262. http://
doi.org/10.1016/j.still.2015.08.010
Berhongaray, G., Alvarez, R., Paepe De, J., Caride, C., Cantet, R., 2013. Land use effects
on soil carbon in the Argentine Pampas. Geoderma 192, 97–110.
Villarino SH, Studdert GA, Baldassini P, Cendoya MG, Ciuffoli L, Mastrángelo M, Piñeiro G
.2017. Deforestation impacts on soil organic carbon stocks in the Semiarid Chaco Region,
Argentina. Sci Total Environ 575:1056-1065. doi: 10.1016/j.scitotenv.2016.09.175
Berthrong ST, Pin˜ eiro G, Jobbagy EG, Jackson RB (2012) Changes in soil carbon and
nitrogen with afforestation of grasslands across gradients of precipitation and plantation
age. Ecological Applications, 22, 76–86.
Cerri CC, Volkoff B, Andreaux F (1991) Nature and behaviour of organic matter in soils
under natural forest, and after deforestation, burning and cultivation, near Manaus. Forest
Ecology and Management, 38, 247–257.
Rangel, O. J. P.; Silva, C. A. 2007. Estoques de carbono e nitrogênio e frações orgânicas
de Latossolo submetido a diferentes sistemas de uso e manejo. Revista Brasileira de Ciência
do Solo, v. 31, p. 1609-1623, 2007.
Lisboa C, Conant R, Haddix M, Cerri C, Cerri C (2009) Soil carbon turnover measurement
by physical fractionation at a forest-to-pasture chronosequence in the Brazilian Amazon.
Ecosystems, 12, 1212–1221.
Batlle-Bayer L, Batjes NH, Bindraban PS (2010) Changes in organic carbon stocks upon land
use conversion in the Brazilian Cerrado: a review. Agriculture, Ecosystems & Environment,
137, 47–58.
Lilienfein J, Wilcke W, Vilela L, Ayarza MA, Lima SDC, Zech W (2003) Soil fertility under
native cerrado and pasture in the Brazilian Savanna. Soil Science Society of America
Journal, 67, 1195–1205.
Maquere V, Laclau JP, Bernoux M et al. (2008) Influence of land use (savanna, pasture,
Eucalyptus plantations) on soil carbon and nitrogen stocks in Brazil. European journal of
soil science, 59, 863–877.
Desjardins T, Barros E, Sarrazin M, Girardin C, Mariotti A (2004) Effects of forest conversion
to pasture on soil carbon content and dynamics in Brazilian Amazonia. Agriculture,
Ecosystems & Environment, 103, 365–373.
Eclesia RP, Jobbagy EG, Jackson RB, Biganzoli F, Piñeiro G (2012) Shifts in soil organic
carbon for plantation and pasture establishment in native forests and grasslands of South
America. Glob Chang Biol 18(10):3237–3251

FINAL REPORT
I. Current status of knowledge and development
Current understanding of the impact of CDR approaches in LAC | 180
Figure 34: Land use change study location
Source: Own elaboration based on the updated literature review included in the "Refinement to the
2006 IPCC Guidelines for national GHG inventories" (IPCC, 2019)"
Tillage Factor - Tillage Studies carried out on the Pampa region
Results from 36 studies were compiled to be used on the revision of the current default Tillage
factors included in the 2006 IPCC Guidelines. One third of the studies were published after 2004
(cutting date for literature for 2006 IPCC GL) and two thirds were completed before 2004, but
not included into the 2006 IPCC GL references for Tillage factors.
Many of the compiled datasets came from studies included into the meta-analysis carried out by
Steinbach and Alvarez (2006). The authors included results from many long term and paired field
experiments, comparing the differences on SOC in the topsoil layer (0-20 cm), between No
tillage, Reduced Tillage and Full Tillage effect and full tillage, in Pampa region. Reduced tillage
treatments vary including either a chisel or a harrow fieldwork.
Besides, some other studies were also included into the database. When possible, some of those
studies were track back to disaggregate, SOC by depth, as reported by the main authors, who

FINAL REPORT
I. Current status of knowledge and development
Current understanding of the impact of CDR approaches in LAC | 181
provided their dataset to fill the “template database” (Studdert et al., 2017; Dominguez et al.,
2016).
The compiled paired datasets represented Sandy (5) and HAC (31) soils (most of them mollisols,
Hapludolls and Argiudolls) and belonged to both Warm Temperate Moist and Warm Temperate
Dry, IPCC climate regions.
Figure 35: Tillage study sites
Source: Own elaboration based on the updated literature review included in the "Refinement to the 2006 IPCC Guidelines for national GHG inventories" (IPCC, 2019)”
Even though the datasets were compiled into a bigger database, the observed SOC stock changes,
from these studies, was consistent with the 2006 IPCC default factors for Temperate regions for
both Reduced Tillage (RT) and No-Tillage (NT).
Most of authors have studied Tillage effects on SOC stocks on the first 20 or 30 cm, assuming
there are no “significant” effects below the top layer. Based on the papers reviewed, and some
other not reported, it seems there is no new evidence or studies to contradict this general
thought.
However, Alvarez et al (2014), found significant differences, at 50 and 100 cm depth, when
comparing NT and RT, under two rotations: Soybean-Soybean and Maize-Soybean rotations.
Authors concluded that this can be explained by the greater residue contribution of the corn crop
in the Mz-Sy sequence

FINAL REPORT
I. Current status of knowledge and development
Current understanding of the impact of CDR approaches in LAC | 182
On the other side, most of new studies on land use change analyze SOC till one-meter depth,
with different results depending on the pristine and current uses.
In this regard, the results are showing a more significant effect of NT than RT, on C sequestration
comparing to Full tillage management in Pampa region.
In general, SOC increasing rate, under NT, did not showed any significant relationship with time,
because of the lack of enough data, over a 20-year period.
These regional studies were integrated into the IPCC master database to derive a global factor
for Dry and Moist Warm temperate Climates, which were published in the Updated tables of the
2019 IPCC Methodology report (2006 revised guidelines).
In addition to the reviewed 2019 Refinement to the 2006 IPCC Guidelines for National
Greenhouse Gas Inventories, a recent paper compiled and analyzed the impact of soil Tillage by
soil type and climate:
Ogle, S.M., C. Alsaker, J.Baldock, M.Bernoux, F.J. Breidt, B. McConkey, K. Regina, and
G.G. Vazquez-Amabile, 2019. "Climate and Soil Characteristics Determine Where No-Till
Management Can Store Carbon in Soils and Mitigate Greenhouse Gas Emissions". Nature
Scientific Reports vol 9, Article number: 11665 https://doi.org/10.1038/s41598-019-
47861-7
IPCC references for Tillage Factor
Dominguez, G.F., G.V. Garcia; G.A Studdert; M.A. Agostini, S.N. Tourn, M.N. Domingo.
2016. Is anaerobic mineralizable nitrogen suitable as soil quality/health indicator? Spanish
J. Soil Sci. 6:82-97
Studdert, G.A.; M.N. Domingo; G.V. Garcia; M.G. Monterubbianesi; G.F. Dominguez. 2017.
Soil organic Carbon under contrasting cropping systems and its relationships with Nitrogen
supply capacity Ciencia del Suelo (Argentina) 35(2): in Press.
Diaz-Zorita, M., M. Barraco, and C. Alvarez. 2004. Effects of twelve years of tillage
practices on a Hapludoll from the Northwetern of Buenos Aires Province, Argentina. Cienc.
Suelo 22:11-17.
Diaz-Zorita, M. 1999. Six years of tillage in a Hapludoll from the Northwestern of Buenos
Aires, Argentina. Cienc. Suelo 17:31-36.
Galantini, J.A., J.O. Iglesias, L. Cutini, H.R. Kruger, and S. Venanzi. 2006 Tillage Systems
in the SW of Buenos Aires province. Long term effect on soil organic fractions and porosity.
Rev. Investigaciones Agropecuarias, RIA, 35 (1): 15-30
Kruger, H.R. 1996. Tillage methods and variation of chemical properties in an Entic
Haplustoll. Cienc. Suelo 14:53-55.

FINAL REPORT
I. Current status of knowledge and development
Current understanding of the impact of CDR approaches in LAC | 183
Steinbach, H and R. Alvarez. 2006. Changes in Soil Organic Carbon Contents and Nitrous
Oxide Emissions after Introduction of No-Till in Pampean Agroecosystems. J.Environ. Qual.
35:3-13 (Metanalisis)
References included into the metanalysis by Steinbach and Alvarez (2006)
Alvarez, R., R.A. Diaz, N. Barbero, O.J. Santanatoglia, and L. Blotta. 1995a. Soil organic
carbon, microbial biomass and CO2-C production from three tillage systems. Soil Tillage
Res. 33:17-28.
Alvarez, R., M.E. Russo, P. Prystupa, J.D. Scheirer, and L. Blotta. 1998b. Soil carbon pools
under conventional and no-tillage systems in the Argentine Rolling Pampa. Agron. J.
90:138-143.
Alvarez, R., O.J. Santanatoglia, P.E. Daniel, and R. Garcia. 1995b. Respiration and specific
activity of soil microbial biomass under conventional and reduced tillage. Pesqui.
Agropecu. Bras. 30:701-709.
Fabrizzi, K.P., A. Moron, and F.O. Garcia. 2003. Soil carbon and nitrogen organic fractions
in degraded vs. non-degraded Mollisols in Argentina. Soil Sci. Soc. Am. J. 67:1831-1841.
Studdert, G.A., Echeverría, H.E., Casanovas, E.M., 1997. Crop-pasture rotation for
sustaining the quality and productivity of a Typic Argiudoll. Soil Science Society of America
Journal 61, 1466–1472
Alvarez, C.R., R. Alvarez, M.S. Grigera, and R.S. Lavado. 1998a. Associations between
organic matter fractions and the active soil microbial biomass. Soil Biol. Biochem. 30:767-
773.
Alvarez, R., O.J. Santanatoglia, and R. Garcia. 1995c. Soil respiration and carbon inputs
from crops in a wheat-soyabean rotation under different tillage systems. Soil Use Manage.
11:45-50.
Chagas, C.I., O.J. Santanatoglia, and M.G. Castiglioni. 1995. Tillage and cropping effects
on selected properties of an Argiudoll in Argentina. Commun. Soil Sci. Plant Anal. 26:643-
655.
Lavado, R.S., C.A. Porcelli, and R. Alvarez. 1999. Concentration and distribution of
extractable elements in a soil as affected by tillage systems and fertilization. Sci. Total
Environ. 232:185-191.
Papers comparing No Tillage versus Reduced Tillage
Alvarez C., C.R. Alvarez, A. Constantini, M. Basanta. 2014. Carbon and nitrogen
sequestration in soils under different management in the semi-arid Pampa (Argentina) Soil
Tillage Research 142 (2014) 25–3126
Ferreras, L.A., J.L. Costa, F.O. Garcia, and C. Pecorari. 2000. Effect of no-tillage on some
soil physical properties of a structural degraded Petrocalcic Paleudoll of the southern
"Pampa" of Argentina. Soil Tillage Res. 54:31-39.

FINAL REPORT
I. Current status of knowledge and development
Current understanding of the impact of CDR approaches in LAC | 184
Cropland INPUT Factor Studies carried out on Pampa region, Argentina
Results from nine (9) studies, published in six different papers, were selected to evaluate the
impact of intensification of C inputs on SOC. Results from these studies were sent using the
standard “template” in order to be compiled into the master database for Input Factor
derivation.
All these studies were not included into the 2006 IPCC guideline literature review and belong to
Pampa region,21 which is a representative biome for Mollisols under dry and moist warm
temperate climates.
Most of them are long term-experiments, with the exception of Novelli et al. (2017). This
experiment is a small part of 15 years old No-tillage-field-experiment, which was re-direct to
evaluate the impact of “ Crop Intensification” under continuous annual cropping.
The compiled paired datasets represented HAC soils (most of them Mollisols, Hapludolls and
Argiudolls) and belonged to both Warm Temperate Moist (6) and Warm Temperate Dry (3),
IPCC climate regions.
The “Medium- input Level” have been considered as “control”, according to table 5.5 (Vol 4,
2006 IPCC Guideline).
21 Authors Selection criteria were: (i) experi¬mental designs were clearly defined and experiments were performed using machinery and practices commonly used by farmers; (ii) only tillage system varied; (iii) sampling depth was equal to or deeper than tillage depth; and (iv) SOC mass per unit area was reported or SOC concentration and soil bulk density were available so that SOC mass could be calculated to the depth of sampling (fixed depth). It was assumed that there were not effects of tillage system below sampling depth.

FINAL REPORT
I. Current status of knowledge and development
Current understanding of the impact of CDR approaches in LAC | 185
Figure 36: Effect on SOC study sites
Source: Own elaboration based on the updated literature review included in the "Refinement to the 2006 IPCC Guidelines for national GHG inventories" (IPCC, 2019)”
The 2006 IPCC guidelines consider a “high-Input” management for croplands, when cover crops,
green manures, or perennial grasses (pastures) are included in annual crop rotations.
The literature review for temperate regions in Argentina, suggests that the higher the biomass
produced (aboveground, belowground and total biomass), the higher SOC stock.
The studies that evaluated the inclusion of 4-year perennial pastures into the annual crop
rotation, showed a significant impact on SOC stock, when comparing versus a continuous cropland
under a Medium-input management (Studdert et al., 1997).
On the other hand, for continuous cropping, the increase in cropping intensity (CI) has been
suggested as a strategy to improve crop residue inputs, which in turn, may increase soil
aggregation and soil organic C (SOC) storage while maintaining or even increasing total sequence
yields (Novelli et al., 2017).
The papers revised to be integrated into the master database, are consistent with the current
Input factor for Temperate region included into the 2006 IPCC guidelines
Steinbach, H.S., Alvarez, R., 2006. Changes in soil organic carbon contents and nitrous
oxide emissions after introduction of no-till in Pampean agroecosystems. Journal of
Environmental Quality 35, 3–13.
Fabrizzi, K.P., A. Moron, and F.O. Garcia. 2003. Soil carbon and nitrogen organic fractions
in degraded vs. non-degraded Mollisols in Argentina. Soil Sci. Soc. Am. J. 67:1831-1841.

FINAL REPORT
I. Current status of knowledge and development
Current understanding of the impact of CDR approaches in LAC | 186
Alvarez C., C.R. Alvarez, A. Constantini, M. Basanta. 2014. Carbon and nitrogen
sequestration in soils under different management in the semi-arid Pampa (Argentina) Soil
Tillage Research 142 25–3126
Giubergia J.P,E. Martellotto,R.S. Lavado. 2013. Complementary irrigation and direct
drilling have little effect on soil organic carbon content in semiarid Argentina. Soil & Tillage
Research (134) 147–152
Novelli L.E., O.P.Caviglia and G.Piñeiro. 2017. Increased cropping intensity improves crop
residue inputs to the soil and aggregate-associated soil organic carbon stocks. Soil & Tillage
Research (165) 128–136
Studdert, G.A., Echeverría, H.E., Casanovas, E.M., 1997. Crop-pasture rotation for
sustaining the quality and productivity of a Typic Argiudoll. Soil Science Society of America
Journal 61, 1466–1472
B – Grazing Lands
Recently, IPCC also revised emission factors for soil C stocks changes in Grasslands, but there
were not enough new studies to perform a new meta-analysis to update emission factors.
However, in the last years there were some large metanalysis that used a large number of studies,
in order to figure out the potential of soil C sequestration in grazing lands and its main drivers.
This question is still controversial, and many issues and management practices are under study
on this respect.
An important paper on the matter is Pete Smith’s: Do grasslands act as a perpetual sink for
carbon? (2014), that analyzed many studies. The author concluded that “…it is untenable that
grasslands act as a perpetual carbon sink, and the most likely explanation for observed grassland
carbon sinks over short periods is legacy effects of land use and land management prior to the
beginning of flux measurement periods. Simply having grassland does not result is a carbon sink,
but judicious management or previously poorly managed grasslands can increase the sink
capacity”.
Smith, P., 2014. Do grasslands act as a perpetual sink for carbon? Global change biology
20, 2708-2711
On this regard, two recent metanalysis may be mentioned as well:
Abdalla, M., Hastings, A., Chadwick, D. R., Jones, D. L., Evans, C. D., Jones, M. B., Rees,
R. M., & Smith, P. (2018). Critical review of the impacts of grazing intensity on soil organic
carbon storage and other soil quality indicators in extensively managed grasslands.
Agriculture Ecosystems & Environment, 253, 62-81.
https://doi.org/10.1016/j.agee.2017.10.023

FINAL REPORT
I. Current status of knowledge and development
Current understanding of the impact of CDR approaches in LAC | 187
Figure 37: Sites analyzed by Abdallah et al., 2018
Source: Abdallah et al., 2018
Another recent paper that hypothesizes about the potential of soil C sequestration in grazing
lands of the Mercosur countries to offset GHG emissions is:
Viglizzo E.F., M.F. Ricard, M.A. Taboada, G. Vázquez-Amábile. 2019. Reassessing the role
of grazing lands in carbon-balance estimations: Meta-analysis and review. Science of The
Total Environment 661, 531-542.
The main discussion about the potential sequestration is about the management strategies and
technologies to make it possible in extensive grazing system.
Enhancing soil carbon content (ESCC) with biochar
In 2019, Wake Forest University worked intensively on a project in the Amazon to restore
Peruvian rainforests devastated by illegal mining using biochar. Some research is being
carried out, for examples Trujillo A. studied the generation of biochar from organic poultry
waste. Miltner, B. C studied the use of biochar in swidden-fallow agroforestry systems in
the Peruvian Amazon.
In Ecuador a study has been identified covering soil ecological restoration applying biochar
(charcoal) and its effects on the Medicago sativa production [Fiallos Ortega, L. R, et al.
2015]
In Brazil a research from 2014 concludes that biochar decreases dissolved organic carbon
but not nitrate leaching in relation to vinasse application in a Brazilian sugarcane soil.
[Eykelbosh, A. et al. 2014]
Another research in Brazil aimed to evaluate the conditions (temperature and residence
time) to produce biochar from Acai processing residues and its potential for use as soil
conditioner in the Amazon region. Authors concluded that considering the favourable
agronomic characteristics of biochar, the temperature of 600 °C and residence time of 60

FINAL REPORT
I. Current status of knowledge and development
Current understanding of the impact of CDR approaches in LAC | 188
min are the most suitable conditions for the production of biochar from Acai seeds. [Sato,
M. et al 2019]
Enhanced weathering or ocean alkalinization
Already in year 2000, there were studies suggesting the use of native-rocks (stone meal) as
the ultimate way to restore to the leached tropical soils in Brazil [Leonardos O.H. et al
2000]
Increased construction and building activities in Brazil have promoted the exploitation of
basaltic reserves, and interest is growing in recycling the accumulating fine basalt dust
waste (with a particle size distribution that peaks in the fine silt range of 10–20 µm
diameter) as a natural agricultural fertilizer. [Nunes, 2014]
Another relevant study assessed the potential of soil carbonation and enhanced weathering
to sequester atmospheric CO2, through Life Cycle Assessment in a case study for Sao Paulo
State in Brazil. In this paper, authors investigated the established mining industry that
extracts basaltic rocks for construction from the Paraná Basin. Through a Life Cycle
Assessment, they determined the balance of carbon dioxide emissions involved in the use
of this material, the relative contribution of soil carbonation and enhanced weathering,
and the potential carbon dioxide removal of Sao Paulo agricultural land through enhanced
weathering of basalt rock. Results show that enhanced weathering and carbonation
respectively emit around 75 and 135 kg carbon dioxide equivalent per tonne of carbon
dioxide equivalent removed (considering a quarry to field distance of 65 km). The authors
underline transportation as the principal process negatively affecting the practice and
uncover a limiting road travel distance from the quarry to the field of 540 ± 65 km for
carbonation and 990 ± 116 km for enhanced weathering, above which the emissions offset
the potential capture. [Lefebvre, D. et al, 2019]
Another article presents a techno-economic assessment framework to analyse the potential
and costs of carbon dioxide removal by enhanced weathering of rocks, concluding that
Brazil is among the best suited locations globally to realize this potential. [Jessica Strefler
et al 2018]
In Mexico a study analysing the intensification of production in organic agriculture (coffee
case) was identified. For the remineralization of soil, it was promoted to incorporate
nonmetallic secondary minerals, such as zeolites, dolomite and rock phosphate [Altamirano
et al, 2014]
No relevant academic literature, nor initiatives or projects were identified regarding ocean
alkalinization in other Latin American and Caribbean countries.
Direct air carbon dioxide capture and storage
No relevant academic literature, nor initiatives or projects were identified regarding
DACCS in other Latin American and Caribbean countries.

FINAL REPORT
I. Current status of knowledge and development
Current understanding of the impact of CDR approaches in LAC | 189
Ocean fertilization
In year 2007 the company Planktos Inc. was planning to dump 100 tonnes of iron dust into
the ocean near Ecuador’s Galápagos Islands, to create a 10,000-square-kilometre “plankton
bloom". The project did not progress due to opposition of environmental groups and marine
scientists.
In 2017, Oceaneos Marine Research Foundation of Vancouver, Canada, also tried to carry
out an ocean fertilization project in Chile and Peru which also failed due to opposition
from environmentalists. The company was seeking permits from the Chilean government
to release up to 10 tonnes of iron particles 130 kilometres off the coast of Coquimbo as
early as 2018. "These experiments would violate international moratoria, and scientific
evidence indicates that the risks and impacts far outweigh the supposed benefits," said
Samuel Leiva from Terram, a Chilean NGO.
Other CDR approaches
Several studies have been found on the potential of storing gas with high CO2 content in
salt caverns built in ultra-deep water in Brazil [Da Costa, 2018] [Rockett, et al 2012]
Simulation results obtained by Da Costa et al 2018, shows the technical feasibility of huge
storage volumes of natural gas and CO2 in giant salt caverns offshore. For the case study
presented in this paper, using giant salt caverns, 450 m high by 150 m in diameter, one
cavern can store 4 billion Sm3 or 7.2 million tons of CO2. The salt dome studied can
accommodate the construction of 15 caverns, thus providing the confinement of
approximately 108 million tons of CO2.
Another study from 2020 regarding technology readiness assessment of ultra-deep salt
caverns for carbon capture and storage in Brazil, estimated a salt cavern could storage 1
billion Sm3 of a natural gas stream with high CO2content.
Potential of storing gas with high CO2 content in salt caverns built in ultra-deep water in
Brazil. [Da Costa, 2018]
Related to other CDR approach, in Mexico, scientists from the Universidad Autónoma
Metropolitana, Cuajimalpa Unit (UAM-C), created a microalgae bioreactor to capture
carbon dioxide (CO2) from combustion gases of the cement industry.

FINAL REPORT
II. Impact analysis
Current understanding of the impact of CDR approaches on SDGs 190
II. Impact Analysis
Based on the analysis on the current status of knowledge, planning and implementation of CDR
approaches in LAC countries and, specifically, in Argentina and Colombia, the following four CDR
approaches were selected to further deep dive in terms of impact analysis:
Afforestation and reforestation
Bioenergy with carbon capture and storage (BECCS)
Enhancing soil carbon content and Enhacing soil carbon content with biochar
Enhanced weathering (land)
Regarding enhanced weathering in land, uncertainties surrounding the technology are still large.
The broader implications of Enhanced weathering (land) technologies for delivering sustainable
development are insufficiently understood at this time and thus, presents limitations to perform
the impact analysis done for the rest of CDR technologies in Argentina and Colombia. The
technology is untested at scale, not exhibiting enough quantitative and qualitative information,
presenting a limitation for impact analysis.
This selection for the impact analysis does not mean the other CDR approaches (DACS, Ocean
Fertilization and Ocean Alkalinization) do not present potential for deployment and/or should
not adressed by policy makers.
This section describes the methodologies adopted, estimation of the impact analysis of the large-
scale deployment for the selected CDR approaches in Argentina and Colombia and the limitations
encountered during the study.
1. Methodology for Impact Analysis
Initially, a compilation of historical statistics for macro and CDR specific variables was
performed, covering the 2000-2020 period subject to data avilability.
In terms of key macroeconomic variables for Argentina and Colombia, the following variables
were identified and analyzed at national level:
Gross Domestic Product (constant prices in local currency)
Gross Agreggate Value (constant prices in local currency)
Gross Production Value (constant prices in local currency)
Gross Fixed Capital Formation (Investment) (constant prices in local currency) and its
breakdown in Production Equipment and/or Machinery and Equipment components
Registered Jobs (number of jobs)
Active Enterprises (number of enterprises)

FINAL REPORT
II. Impact analysis
Current understanding of the impact of CDR approaches on SDGs 191
The sources of data for the above-mentioned variables were mainly the national statitics
institutes of Argentina and Colombia, INDEC and DANE respectively.
Also, CDR specific key variables were identified for Argentina and Colombia and their historical
statistics compiled and analyzed:
Afforestation and reforestation
o Cultivated forest area (hectares)
o Native forest area (hectares)
o Wood forestry production (tons)
o Gross Agreggate Value in Silviculture and Wood Extraction Sector (constant
prices in local currency)
o Gross Production Value in Silviculture and Wood Extraction Sector (constant
prices in local currency)
o Registered Jobs in Silviculture and Wood Extraction Sector (number of jobs),
when available
o Active Enterprises in Silviculture and Wood Extraction Sector (number of
enterprises), when available
BECCS
o Total Installed Capacity (MW) and breakdown by source
o Total Power generation (GWh) and breakdown by source
o Biofuels Production (tons)
o Gross Agreggate Value in Generation Sector (constant prices in local currency)
o Gross Production Value in Generation Sector (constant prices in local currency)
o Registered Jobs in Generation Sector (number of jobs), when available
o Active Enterprises in Generation Sector (number of enterprises), when available
Enhancing soil carbon content and Enhacing soil carbon content with biochar
o Sown Area and Harvested Area (hectares) by crop type
o Crops Production (tons) by crop type
o Gross Agreggate Value in Agricultural Crops Sector (constant prices in local
currency)
o Gross Production Value in Agricultural Crops Sector (constant prices in local
currency)
o Registered Jobs in Agricultural Crops Sector (number of jobs), when available
o Active Enterprises in Agricultural Crops Sector (number of enterprises), when
available
Secondly, for each CDR approach and country, a technical scenario forescating was performed
according to the guidelines defined in the Terms of Reference of the study.
Afforestation and reforestation
o Baseline scenario according to historic trends

FINAL REPORT
II. Impact analysis
Current understanding of the impact of CDR approaches on SDGs 192
o Scenario resulting from the annual increasing of commercial forest plantations
according to the countries’ NDCs and plans
o Scenario of Maximum potential area suitable for forestlands in Argentina and
Colombia, based if possible on “site quality” criteria (soil, topography and
climate), regardless of any economic benefit associated with afforestation and
reforestation activities
BECCS
o Baseline scenario, based on official Energy Scenarios in Argentina (SGE, 2019)
for the period 2019-2030, extended to 2050 / Plan Energético Nacional
Colombia 2020- 2050 (UPME, 2019).
o An enhanced biomass/biogas power generation scenario, with low CCS adoption
o An enhanced biomass/biogas power generation scenario, with high CCS
adoption
Enhancing soil carbon content and Enhacing soil carbon content with biochar
o Baseline scenario: no biochar applied
o An enhanced soil carbon content scenario, with low biochar applied
o An enhanced soil carbon content scenario, with high biochar applied
Finally, several linkages among macro and intrasectorial variables for each CDR approach and
country were identified, estimating long-term impacts of CDR deployment on key variables
contributing to the achievement of the SDGs (Grenhouse emissions, GDP, Employment, others),
based on the aforementioned technical scenario. Also costs and investments needed for the
different CDR deployment scenarios were quantified.
Detailed methodology description for BECCS scenario analysis
This sub-section presents a simplified scenario analysis for the penetration of BECCS in Argentina
and Colombia, considering national sectoral plans and scenarios to 2030 and 2031, respectively,
extended by the consultants to year 2050.
In both cases an assessment on the potential of increasing the share of bioenergy and BECCS is
performed based on the current official scenarios extended to 2050, capped by —but not
reaching— the feedstock availability featured in the Update of the Biomass Balance for energy
purposes in Argentina (FAO, 2020) for forest residues and bagasse and in the Atlas of the energy
potential of residual biomass in Colombia (UPME, 2010) for sugarcane and panel cane bagasse.
The rationale behind each scenario is described in each country’s section. Power generation and
capacity scenarios were built for each country for the analysis period, focused in increasing the
share of biomass-fired conventional power plants (boiler and steam turbine), subject to the
available resources and historic physical (such as power plant efficiency, capacity factor and
emission factors), as well as economic parameters, such as CAPEX requirements O&M and fuel
costs.

FINAL REPORT
II. Impact analysis
Current understanding of the impact of CDR approaches on SDGs 193
Although specifics will be provided in each country’s section, scenarios are differentiated by
increasing ambition both regarding the use of biomass and the penetration of BECCS in the power
grid.
Emissions for each scenario are calculated and exposed taking into account the carbon
sequestered during the lifecycle of the feedstock, including the sequestered carbon during the
biogenic growth of the fuel, transport and processing emissions, computed at 16% of the carbon
content of the fuel, the emissions resulting from the biomass combustion (equivalent to the
biogenic capture during growth), and finally three capture rate scenarios as a percentage of
Carbon input during the CDR phase in the BECCS facility, ranging from 40% to 80%.
A Levelized Cost of Electricity (LCOE) resulting for BECCS facilities is estimated for both countries
taking into account CAPEX requirements and Operation and Maintenance costs based on Langholtz
2020 and supplemental information contained in Stavrakas, 2018, as well as capacity factors and
fuel costs based on country-specific data (SGE, 2020 and UPME 2019), for a non-co-fired steam
turbine firing bagasse with post-combustion capture technologies and excluding CO2 transport
and storage costs.
Finally, a CO2 avoidance cost (CAC) range is calculated for each scenario, taking into account
BECCS LCOE ranges estimated for each country and avoided (due to the displacement of fossil
fuel thermal power generation when applicable) and captured CO2, adapting the methodology
presented in Langholtz 2020, comparing the LCOE of BECCS vs. the LCOE of a reference scenario,
as well as the emission reduction or removal resulting from the implementation of BECCS vs. the
reference scenario:
𝐿𝐶𝑂𝐸𝐵𝐸𝐶𝐶𝑆 − 𝐿𝐶𝑂𝐸𝑟𝑒𝑓𝐸𝑟𝑒𝑓 − 𝐸𝐵𝐸𝐶𝐶𝑆
Where:
LCOEBECCS is the levelized cost of electricity production from BECCS in USD/MWh,
LCOEref is the levelized cost of electricity production from a reference scenario in USD/MWh.
Eref are the emissions per MWh expressed in tCO2e/MWh associated with the reference scenario
or displaced technology.
EBECCS are the per MWh in tCO2e/MWh associated with the BECCS facility.
In the short-run, the displaced units are considered to be the marginal units of natural gas
turbines in the case of Argentina or coal-fired power plants in the case of Colombia.
FINAL REPORT
II. Impact analysis
Current understanding of the impact of CDR approaches on SDGs 194
In the long-run, according to the presented scenarios, for the horizon of 2050, 100% of the
additional fossil fuel-fired installed capacity is introduced to the system for stability and capacity
purposes. In this context, the Build Margin (UNFCCC 2015) which could be used as an analogue
purpose to calculate the Emission Factor of the reference power grid approaches to zero. In
consequence, the reference emissions (of the displaced units) could be considered approaching
to “null”, hence the denominator of the presented equation approaching to EBECCS. However,
results are also presented comparing Scenarios 1 and 2 vs. reference emissions and mean power
generation costs for the baseline scenario, for each capture rate scenarios.
For modelling purposes, these scenarios exclude battery storages and rely on thermal power
generation for frequency stabilization and capacity services, and CHP plants are considered non-
co-fired (i.e. 100% biomass-fired).
2. Argentina
According to the World Bank, Argentina is one of the largest economies in Latin America with a
Gross Domestic Product (GDP) of approximately US$450 billion. Argentina has vast natural
resources in energy and agriculture. Within its 2.8 million square kilometers of territory,
Argentina is endowed with extraordinary fertile lands, gas and lithium reserves, and has great
potential for renewable energy.
However, the historical volatility of economic growth and the accumulation of institutional
obstacles have impeded the country’s development. The COVID-19 pandemic and social isolation
as a way to combat it aggravated the situation. Urban poverty in Argentina remains high and in
the first semester it reached 40,9% of population, while extreme poverty increased to 10,5% and
children poverty rose to 56,3% (World Bank, 2020).
Domestic economy continues to show strong macroeconomic imbalances. Annual inflation,
although it has slowed since the beginning of the year, is still above 40%, despite price controls.
The Government has managed to conclude the process of restructuring all its debt in foreign
currency (both local and external), significantly improving the maturity profile for the next eight
years. In turn, the authorities have formally begun to talk with the International Monetary Fund
to agree a new program for the maturities of the Stand-By loan in the next 3 years.
Afforestation and reforestation
A) Status and trends of forestry sector
There are 53 million hectareas of native forest in Argentina, about 6% of the forest area in South
America. Native forest is concentrated in the Northcenter sector of the country, covering the
provinces of Formosa, Chaco, Tucumán, Santiago del Estero, Córdoba, Santa Fe, Misiones,
Corrientes, La Pampa, Río Negro, Neuquén, Mendoza, San Juan, San Luis and Catamarca.

FINAL REPORT
II. Impact analysis
Current understanding of the impact of CDR approaches on SDGs 195
Figure 38: Main Regions of Native Forest in Argentina
Source: Regiones forestales de Argentina. Archivo de la Secretaría de Medio Ambiente de la Nación
According to the latest official consolidated data by the Dirección de Producción Forestal, the
cultivated forest area in year 2017 was 1,317,793 hectares, representing a CAGR growth of 1.7%
over the 2002-2017 period.

FINAL REPORT
II. Impact analysis
Current understanding of the impact of CDR approaches on SDGs 196
Figure 39: Historical cultivated forest area in Argentina
Source: SSPMicro based onDirección de Producción Forestal 2017; Biennial Update Report (BUR) 2016
The Mesopotamia region (Misiones, Corrientes and Entre Rios provinces) is the largest area of
forest plantations in Argentina. Both in Misiones and Corrientes, the predominant species is pine,
while in Entre Ríos the predominant species is eucalyptus. Salicaceae (willows and poplars) are
found mainly in the north of Buenos Aires and the south of Entre Ríos.
Figure 40: Characterization of cultivated forest area in Argentina
Source: SSPMicro 2019. Foestry, Paper and Furniture Value Chain Report. ISSN 2525-0221

FINAL REPORT
II. Impact analysis
Current understanding of the impact of CDR approaches on SDGs 197
Different estimations on the potential for forest plantations in Argentina have been made by
several entities, including:
5 millon hectares (SENASA)
18 and 20 million hectares of land suitable for forestry, of which 5 million do not compete
in use with other alternative agricultural activities (FAO, 2001)
15 million hectares of areas with wood energy potential (FAO, 2020)
Additionally, ForestAr 2030 national plan set a target to increase cultivated forest area in
Argentina from current 1.3 millon ha to 2.0 millon ha by year 2030. The cornerstone of ForestAr
2030 is the understanding that forests offer the single largest "natural climate solution" through
the conservation, restoration and improved land-management techniques that increase carbon
storage or avoid greenhouse-gas emissions in landscapes worldwide.
The National Statitstics Institute (INDEC) publishes statistics on registered jobs by economic
activity in the private sector in Argentina. According to the latest publications, the value chain
employs near 80 thousand jobs, from which the main are concentrated in the wood manufacturing
with almost 45%.
Figure 41: Historical wood value chain employment in Argentina
Source: INDEC
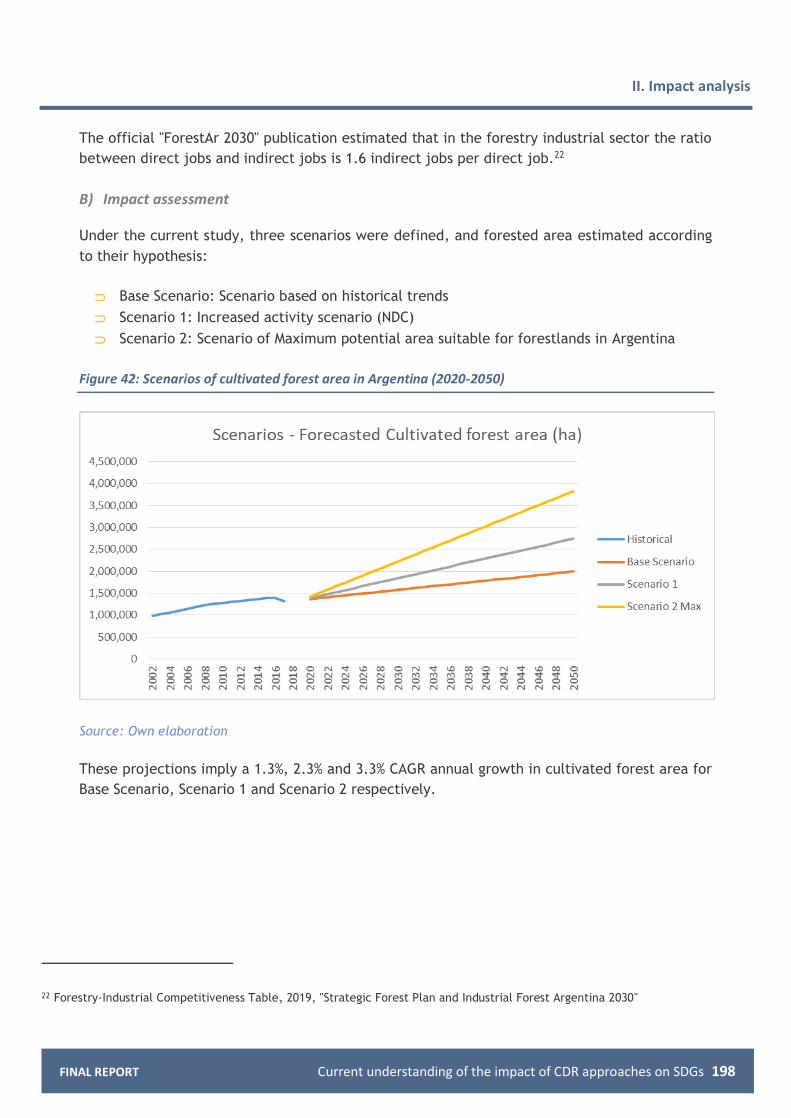
FINAL REPORT
II. Impact analysis
Current understanding of the impact of CDR approaches on SDGs 198
The official "ForestAr 2030" publication estimated that in the forestry industrial sector the ratio
between direct jobs and indirect jobs is 1.6 indirect jobs per direct job.22
B) Impact assessment
Under the current study, three scenarios were defined, and forested area estimated according
to their hypothesis:
Base Scenario: Scenario based on historical trends
Scenario 1: Increased activity scenario (NDC)
Scenario 2: Scenario of Maximum potential area suitable for forestlands in Argentina
Figure 42: Scenarios of cultivated forest area in Argentina (2020-2050)
Source: Own elaboration
These projections imply a 1.3%, 2.3% and 3.3% CAGR annual growth in cultivated forest area for
Base Scenario, Scenario 1 and Scenario 2 respectively.
22 Forestry-Industrial Competitiveness Table, 2019, "Strategic Forest Plan and Industrial Forest Argentina 2030"

FINAL REPORT
II. Impact analysis
Current understanding of the impact of CDR approaches on SDGs 199
Table 26: Comparison of growth rates by Scenario - Cultivated Forest Area - Argentina
Source: Own elaboration
The investment (CAPEX) was estimated based on the cost of implantation23 per hectare of pine
and eucalyptus in the province of Misiones (Resolution 116/2020 from the Secretary of
Agriculture, Livestock and Fisheries). Costs of pruning and thinning activities were also
considered along the years following implantation. An average weighting 75% pine costs and 25%
eucalyptus costs was adopted (representative of Argentinean planted area breakdown by
species). Therefore, resulting in an average cost of implantation of 770 USD/ha and average
pruning and thining costs of 72 USD/ha for the following eight years. A curve with efficiences in
investment over time for scenarios 1 and 2 was assumpted due to sinergies of increased activity
and development of the value chain.
Table 27: Investment by scenario for Afforestation in Argentina
Source: Own elaboration
In order to quantify C sequestration and GHG removal, first step was to estimate the density,
yield and growth rates by species and by provinces. The biomass extracted was calculated for
each group of species considering differences in the cutting schemes for conifers and other
species among provinces, ex: 18 to 40 years for conifers; 12 years for eucalyptus; 11 years for
23 Cost of implantation: Includes land preparation, cost of seedlings, fault replacement, control of weeds and ants of first year
Period / Scenario CAGR Avg Variation (ha/y)
Historical 2003-2009 3.8% 41,091
Historical 2010-2014 2.0% 28,092
Historical 2015-2017 -0.5% -1,317
Proj 2020-2050 -Base 1.3% 21,000
Proj 2020-2050 -Sc1 2.3% 45,000
Proj 2020-2050 -Sc2 Max 3.3% 80,000
Scenario Total Investment 2020-2050
MM USD
Average Annual Investment
MM USD / year
Baseline 875 29
Scenario
1
1,785
(+104% vs Base)
59
Scenario
2
3,006
(+243% vs Base)
100

FINAL REPORT
II. Impact analysis
Current understanding of the impact of CDR approaches on SDGs 200
salicaceae and 15 to 35 years for other species. For scenarios 1 and 2 of increased level of
afforestation, a curve of decreasing yields was assumpted, as new plantations move to less
productive lands.
Table 28: Density values and annual growth rates by species for Argentina
Source: BUR 3 (2019)
The balance or net carbon capture was calculated as the difference between the captures from
annual growth and the emissions from annual extraction. The fixation data correspond to the
initial implanted area (2018), fixing carbon at the corresponding growth rate for each
species/region to which the annual area increase is added (cumulative until 2050). The annual
emission data correspond to the initial implanted area divided by the cutting scheme, according
to the area implanted from 2018 onwards. The biomass values were converted to carbon and
then CO2.
The following figure corresponds to the CO2 balance for the three scenarios proposed for the the
area of forest plantations increase. In this estimate of the CO2 balance, emissions from
intermediate treatments of plantations (pruning and thinning) are not included, neither are
considered emissions / removals of products originating from afforestation.
Species Density
(ton dm/m3)
Yield
(m3/ha/year)
Growth
(ton dm/ha year)
Conifers 0.4 20 8
Eucalyptus 0.65 40 26
Salicaceae 0.35 23 8.05
Other 0.45 18-20 8.1-9

FINAL REPORT
II. Impact analysis
Current understanding of the impact of CDR approaches on SDGs 201
Figure 43: Balance of CO2 by Scenarios of cultivated forest area in Argentina (2020-2050)
Source: Own elaboration
According to the scenarios of afforestation deployment defined and the associated investment
and CO2 capture potential, impacts were analyzed. The following table shows key metrics of
impact analysis for Afforestation deployment in Argentina.
Contribution to GDP was estimated as impact in Gross Aggregated Value for Forestry
and Timber extraction activities consistent with the different planted area scenarios.
Net changes in employment were also estimated based on registered private sector
jobs for forestry and timber extraction activities and wood manufacturing activies with
the different planted area scenarios.
Also, an estimation on the indirect jobs was considered based on the aforementioned
ratio for the forestry-industrial value chain (Strategic Forest Plan and Industrial Forest
Argentina 2030).

FINAL REPORT
II. Impact analysis
Current understanding of the impact of CDR approaches on SDGs 202
Table 29: Impact analysis of Afforestation in Argentina
Note: * Employment impact estimates only for Forestry and Timber extraction activities and Wood
manufacturing activities. Paper production and Furniture production not included. ** Contribution to
GDP estimated as impact in Gross Aggregated Value for Forestry and Timber extraction activities
Source: Own elaboration
Bioenergy with carbon capture and storage (BECCS)
A) Status and trends of BECCS
Power Installed Capacity in Argentina grew to 39,826 MW in 2019 at an average 3.1% annual growth rate (CAGR 2002-2019), led mainly by Thermal Fossil (62% of total installed capacity). Although incipient, Bioenergy and Cogeneration summarized 168 MW of installed capacity by 2019 (0.4% of total installed capacity). Power Generation totalized 131,246 GWh in 2019, achiving a 3.0% annual growth (CAGR 2002-2019).
Figure 44: Historical Power Installed Capacity (MW) and Power Generation (GWh) in Argentina
Scenario Net changes in
employment* per
cultivated forest area
∆ # jobs / '000 ha
Contribution to GDP**
per cultivated forest
area
∆ MM USD GDP /
'000 ha
GHG emissions per
cultivated forest area
MM CO2 ton eq /
ha
Base +20 direct
+32 indirect
+1.0 11
1 +19 direct
+30 indirect
+1.3 8
2 +17 direct
+28 indirect
+1.6 5

FINAL REPORT
II. Impact analysis
Current understanding of the impact of CDR approaches on SDGs 203
Source: CAMMESA
By year 2020, there were no CCS implemented projects on bioenergy installed capacity in
Argentina nor plans to be developed.
The National Statitstics Institute (INDEC) publishes statistics on registered jobs by economic
activity in the private sector in Argentina. According to the latest publications, there are near
10 thousand jobs in power generation sector.
Figure 45: Historical power generation employment in Argentina
Source: Observatorio de Empleo y Dinámica Empresarial, MTEySS based on SIPA.

FINAL REPORT
II. Impact analysis
Current understanding of the impact of CDR approaches on SDGs 204
B) Impact assessment
Under the current study, three scenarios were determined
Baseline scenario, considering official Energy Scenarios in Argentina (SGE, 2019) for the period 2019-2030, extended to 2050. In 2019, the Secretary of Energy Planning issued a study with energy scenario towards year 2030, which were considered as BAU.
Scenario 1: An enhanced biomass/biogas power generation scenario, with low CCS adoption
Scenario 2: An enhanced biomass/biogas power generation scenario, with high CCS adoption
Table 30: Configuration of BECCS Scenarios for Argentina
Baseline Scenario 1 Scenario 2
2020-
2030
Renewables According to National
Energy Scenarios, with
renewable technologies
assigned by the consultants
in line with renewable
power auctions, reaching
23.8% of the system’s
power generation
excluding Hydro (54.6%
including Hydro).
Consistent with the
baseline scenario.
Consistent with the baseline
scenario, with additional 1
percentage points displacing
conventional thermal power
generation.
BE Capacity consistent with
the generation assigned
following the
aforementioned criteria.
Consistent with the
baseline scenario.
Consistent with the baseline
scenario, adding 1
percentage point to biomass
power generation in 2030,
what represents an increase
of 129% of BE for power
generation vs. the baseline.
BECCS No CCS installed capacity. BECCS reach 5.0% of
the bioenergy power
generation in 2030.
BECCS reach 19.1% of the
bioenergy power generation
in 2030.
2031-
2050
Renewables In the consultants’ baseline
scenarios, renewable
power generation
(excluding Hydro) reaches
46.3% of the system
generation by 2050 and
72.2% including Hydro.
Consistent with the
baseline scenario.
In the consultants’ baseline
scenarios, renewable power
generation (excluding Hydro)
reaches 48.2% of the system
generation by 2050,
displacing thermal
conventional power plants
vs. the baseline scenario.
BE Bioenergy represents 2.5%
of the power generation.
Consistent with the
baseline scenario.
Bioenergy represents 4.4% of
the power generation.
BECCS No CCS installed capacity. BECCS reach 10.0%
of the bioenergy
power generation in
2050.
BECCS reach 39.1% of the
bioenergy power generation
in 2050.
Source: Own elaboration partially based on Secretariat of Energy.

FINAL REPORT
II. Impact analysis
Current understanding of the impact of CDR approaches on SDGs 205
2020—2030
Baseline scenario
In the case of Argentina, the baseline scenario is determined by the “Trend Scenario” to 2030 of
the Secretariat of Energy, published in 2019 (SGE 2019). Electricity demand for this period has
been computed according to the official Trend Scenario and represents a CAGR of 2.4% between
2020 and 2030.
Please note that the official energy scenarios for Argentina provide information for power
generation and for capacity classifying power generation technologies as “Hydro, Thermal
Conventional, Nuclear and Renewables (excluding Hydro)”, while the official sources don’t
provide information regarding the primary sources (solar, wind, biomass and biogas) which
constitute the “renewable” set of technologies.
In this context, the consultants assigned the primary sources for renewable power generation for
the 2020-2030 period accordingly to the assignment of technologies during the RenovAr
renewable energy auction rounds launched by the Argentine government during 2016 and 2017,
as shown in the Progress Report (SGE 2017), while the capacity has been assigned accordingly to
the power generation and dispatch factors.
Scenario 1
Scenario 1 considers that the electricity demand and power generation to 2030 is equivalent to
the electricity demand in the baseline scenario, and that renewable power generation reaches
an equivalent level and distribution to that shown in the baseline scenario, but introducing
Carbon Capture Technologies to the biomass-fired installed capacity from 2025 onwards, reaching
5.0% of the bioenergy generation in 2030 and 20 MW in pilot projects (out of 397 MW) of Biomass
power plants.
Scenario 2
Scenario 2 considers the same level of demand used in Scenarios 1 and 2, but increasing the share
of biomass power generation, reaching 1.72% of the system generation, reducing the share of
conventional thermal power generation. BECCS represents 19.1% of the whole biomass power
generation (183 MW installed capacity).
2031—2050
Baseline scenario
From the year 2031 onwards, the Argentine government does not provide official inputs for
electricity demand, nor for power generation or capacity. In this context, the consultants built
a baseline scenario considering a deacceleration by the horizon of the scenario modelling (2050)

FINAL REPORT
II. Impact analysis
Current understanding of the impact of CDR approaches on SDGs 206
of electricity demand consistent with an increased use of electricity in certain sectors (mostly
for mobility) but overtaken by a decoupling of GDP growth to energy consumption, in line with
the premises from the Secretariat’s efficient scenario to 2030.
In the baseline scenario, renewable power generation (excluding Hydro) reaches 46.3% of the
power generation mix (prominently Solar PV 23.6% and Wind power 20.1%), and when computing
Hydro and other non-fossil power generation technologies, such as Nuclear, Thermal Fossil power
generation accounts for 18.2%, fueled by Natural Gas. Bioenergy is present in the horizon of 2050
and represents 2.5% of the power generation, but does not include Carbon Capture Technologies
(i.e., “there is BE but no BECCS”).
Scenario 1
Scenario 1 represents a similar ambition in terms of the penetration of renewables in Argentina’s
integrated power grid but introducing Carbon Capture and Storage technologies to a portion of
the biomass-fired installed capacity.
While the share of renewables in 2050 also reaches 46.3% (Solar PV 23.6% and Wind power 20.1%)
and non-fossil power generation also accounts for 81.8%, Bioenergy installed capacity reaches
6,521 MW (biomass-fired power plants), and BECCS power generation represents 10% of the total
bioenergy power generation, or 0.25% of the system generation.
Scenario 2
In the Scenario 2, from 2030 onwards, while the rest of renewable sources maintain their share
of the system generation, Bioenergy displaces a larger share of Thermal-fossil power generation,
reaching 4.4% of the mix by 2050. Additionally, 39.1% of the Bioenergy generation features CCS
technologies (biomass-fired power plants), associated to a BECCS installed capacity of 1,316 MW.

FINAL REPORT
II. Impact analysis
Current understanding of the impact of CDR approaches on SDGs 207
Figure 46: Power generation by source for 2020, 2030 and 2050 under the described scenarios.
Argentina
Source: Own elaboration.
0% 10% 20% 30% 40% 50% 60% 70% 80% 90% 100%
Scenario 2
Scenario 1
Baseline
Scenario 2
Scenario 1
Baseline
Scenario 2
Scenario 1
Baseline
2050
2030
2020
Hydro Thermal natural gas Nuclear Wind Solar PV Biomass w/o CCS Biomass w/ CCS

FINAL REPORT
II. Impact analysis
Current understanding of the impact of CDR approaches on SDGs 208
Figure 47: Scenarios of bionergy installed capacity in Argentina (2020-2050)

FINAL REPORT
II. Impact analysis
Current understanding of the impact of CDR approaches on SDGs 209
Source: Own elaboration
These estimates imply a 7.5%, 7.5% and 9.7% CAGR annual growth in bionergy installed capacity
for Base Scenario, Scenario 1 and Scenario 2 respectively. Baseline Scenario does not consider
CCS, meanwhile in Scenario 1 BECCS would achieve over 180 MW of capacity and in Scenario 2
that figure would increase to over 1300 MW.
Table 31: Comparison of growth rates by Scenario - Bionergy Installed Capacity - Argentina
Source: Own elaboration
The following table exhibits a summary of key BECCS scenario metrics for Argentina, regarding
power generation, installed capacity and investment.
Period / Scenario CAGR Avg Variation (MW/y)
Historical 2016-2019 9.8% 14
Proj 2020-2050 -Base 7.5% 54
Proj 2020-2050 -Sc1 7.5% 54
Proj 2020-2050 -Sc2 9.7% 105

FINAL REPORT
II. Impact analysis
Current understanding of the impact of CDR approaches on SDGs 210
Table 32: Key BECCS scenario metrics for Argentina
Baseline Scenario 1 Scenario 2
Power generation (net)
TWh 2020 131.8 131.8 131.8
2030 166.7 166.7 166.7
2050 227.7 227.7 227.7
Non-fossil fueled power generation / total
% 2020 40.0% 40.0% 40.0%
2030 67.6% 67.6% 68.6%
2050 81.8% 81.8% 83.6%
BE power generation
TWh 2020 0.6 0.6 0.6
2030 1.3 1.3 2.9
2050 5.8 5.8 10.1
BE / power generation
% 2020 0.5% 0.5% 0.5%
2030 0.8% 0.8% 1.7%
2050 2.5% 2.5% 4.4%
BE / thermal power generation exc. Nuclear
% 2020 0.8% 0.8% 0.8%
2030 2.3% 2.3% 5.2%
2050 12.2% 12.2% 21.3%
BECCS/ BE Power generation
% 2020 - - -
2030 - 5.0% 19.1%
2050 - 10.0% 39.1%
BE Installed capacity
MW 2020 208.6 208.6 208.6
2030 396.9 396.9 560.1
2050 1,838.2 1,838.2 3,369.7
BECCS Installed capacity
MW 2020 - - -
2030 - 19.8 183.0
2050 - 183.8 1,316.3
Investment in BE (no CCS)
MUSD/year 2020-2030 51.8 — 56.5 51.8 — 56.5 96.6 — 105.4
2031-2050 208.6 — 227.6
208.6 — 227.6 406.7 — 443.6
Investment in BECCS (includes power plant)
MUSD/year 2020-2030 - 8.1 — 8.7 75.0 — 80.5
2031-2050 - 35.4 — 38.0 244.6 — 262.5
Source: Own elaboration.
For BECCS CAPEX estimation the following assumptions were taken:
BECCS: 4.100–4.400 USD/kWe (Adapted from Langholtz et al (2020) "The Economic
Accessibility of CO2 Sequestration through Bioenergy with Carbon Capture and Storage
(BECCS) in the US")

FINAL REPORT
II. Impact analysis
Current understanding of the impact of CDR approaches on SDGs 211
Scenarios 1 and 2 would totalize aproximately 800 and 5,000 million dollars cummulated
investments respectively for the period 2020-2050.
Table 33: Investment by scenario for BECCS in Argentina
Scenario Total Investment
2020-2050
MM USD
Average Annual
Investment
MM USD / year
1 800 35
2 5,000 165
Source: Own elaboration.

FINAL REPORT
II. Impact analysis
Current understanding of the impact of CDR approaches on SDGs 212
The following table shows a summary of key scenario results for Argentina
Table 34: Summary of key BECCS emission scenario results in Argentina
Baseline Scenario 1 Scenario 2
BECCS capture rate Scenarios as % of C input: 40 60 80 40 60 80 40 60 80
Combustion Emissions in power generation
MtCO2e 2020 34.1 34.1 34.1 2030 23.6 23.6 24.7 2050 21.5 21.5 24.6
Emissions intensity of combustion for power generation
tCO2e/ MWh
2020 0.259 0.259 0.259 2030 0.141 0.141 0.148 2050 0.095 0.095 0.108
Carbon fixed in biomass feedstock used for power generation
MtCO2e 2020 (0.46) (0.46) (0.46) 2030 (0.88) (0.88) (2.02) 2050 (4.08) (4.08) (7.11)
Other lifecycle emissions from transport and
processing of feedstock and energy use
MtCO2e
2020 0.07 0.07 0.07 2030 0.14 0.14 0.32
2050 0.65 0.65 1.14
Post-combustion capture MtCO2e 2020 - - - - - - - - - 2030 - - - (0.02) (0.03) 0.14 (0.15) (0.23) (0.31) 2050 - - - (0.16) (0.25) 0.08 (1.11) (1.67) (2.22)
Net scenario emissions MtCO2e 2020 33.72 33.72 33.72 33.72 33.72 33.72 33.72 33.72 33.72 2030 22.82 22.82 22.82 22.81 22.80 22.79 22.85 22.77 22.70 2050 18.11 18.11 18.11 17.95 17.87 17.79 17.49 16.93 16.37
Adjusted intensity for power generation
tCO2e/ MWh
2020 0.256 0.256 0.256 0.256 0.256 0.256 0.256 0.256 0.256 2030 0.137 0.137 0.137 0.137 0.137 0.137 0.137 0.137 0.136 2050 0.080 0.080 0.080 0.080 0.078 0.078 0.080 0.074 0.072
Avoided and captured emissions vs. baseline
MtCO2e 2020 - - - - - - - - - 2030 - - - (0.02) (0.03) (0.04) 0.03 (0.05) (0.13) 2050 - - - (0.16) (0.25) (0.33) (0.63) (1.18) (1.74)
Avoided and captured emissions vs. baseline
%
2020 0.0% 0.0% 0.0% 0.0% 0.0% 0.0% 0.0% 0.0% 0.0%
2030 0.0% 0.0% 0.0% -0.1% -0.1% -0.2% 0.1% -0.2% -0.6%
2050 0.0% 0.0% 0.0% -0.9% -1.4% -1.8% -3.5% -6.5% -9.6%
Source: Own elaboration
FINAL REPORT Current understanding of the impact of (CDR) approaches on SDGs 211

FINAL REPORT
II. Impact analysis
Current understanding of the impact of (CDR) approaches on SDGs 213
The penetration of BECCS in Argentina in the short-term is primarily conditioned by increasing
power generation system costs, and in the long-term by the increasing availability of cost
competitive alternatives with declining prices, such as Solar PV and Wind Power, as well as the
availability of competitive natural gas.
The declining use of conventional Thermal power-generation by 2030 implies additional volumes
of natural gas available competing pricewise for demand, hence lowering conventional Thermal
power generation LCOE.
In the long-term, the needs for complementing non-dispatchable sources such as Wind and Solar
PV could increase the competitiveness of Bioenergy and BECCS as an alternative to conventional
thermal but increasing system costs (in absence of relevant carbon taxes for natural gas).
Estimated full LCOE (considering CAPEX and O&M costs) for BECCS in Argentina ranges from 283.3
USD/MWh to 330.3 USD/MWh vs. current average system costs around 61 USD/MWh and estimated
at levels of 63 USD/MWh to 68 USD/MWh in 2050. (See Annex for further detail).
Towards the horizon of 2050, non-fossil power generation reaches 81.8% to 83.6% of the mix in
the three analyzed scenarios. In this context:
The relevance of renewable power sources in displacing fossil fuels for power generation
in challenged by decreasing marginal carbon dioxide avoidance,
In consequence, the cost of carbon dioxide avoidance and removal, computed as the
difference between LCOEs over the difference between specific CO2 emissions/removals
increases, due to a lowering denominator, which converges into the carbon capture
component of BECCS, and reaches between 346 USD/tCO2e and 745.3 USD/tCO2e for the
analyzed scenarios (considering CAPEX and O&M costs).
However, as the potential of displacing fossil fuels becomes irrelevant, CDR technologies,
such as BECCS, become some of the few available options to promote system-wide
decarbonization potentially transforming the power sector of Argentina into a Carbon
Dioxide sink.
Further research should explore extending this analysis to the potential of CDR in Argentina’s
sugarcane and maize Bioethanol, as official scenarios promote the deployment of flex fuel use
for road transportation.

FINAL REPORT
II. Impact analysis
Current understanding of the impact of (CDR) approaches on SDGs 214
Impact on Employment
A study from the Imperial College London from 2018 (Patrizio, et al 2018) on early deployment
of BECCS in the US and replacing 50% of aging coal plants with natural gas plant, estimates that
1.9 permanent jobs per million dollars invested can be created in early deployment of BECCS24.
By 2050, that ratio might decrease to 0.8 jobs / MMUSDA invested from deployment learning
curve, economies of scale and larger operative efficiencies achieved.
Deployment of BECCS plant generates Operation and Maintenance direct jobs, but also jobs are
created during the Construction phase (ex: 4,000 MW Drax BECCS project in UK would generate
up to 17,000 jobs during its peak construction activity, equivalent to over 4 construction jobs /
MW installed). Also, according to Patrizio et al, BECCS facilities generate additional indirect jobs
in the forestry sector and connected to logistics activities (almost 1 to 1 ratio of additional jobs
generated).
Under these assumptions BECCS deployment could generate nearly 3,000 permanent jobs by 2050
in Scenario 1, and over 20,000 permanent jobs by 2050 in Scenario 2. Construction of BECCS
plants could generate an average of 35 construction jobs per year in Scenario 1 and over 250
jobs/year in Scenario 2.
The following table shows key metrics of impact analysis for BECCS deployment in Argentina.
Contribution to GDP was estimated based on the investment in production equipment required
in the different BECCS deployment scenarios.
Table 35: Impact analysis of BECCS deployment in Argentina
* Not considering jobs lost in other sources of energy outplaced
** Investment in Durable Production Equipment vs GDP
Source: Own elaboration
24 Patrizio, et al (2018). "Reducing US Coal Emissions Can Boost Employment". Joule. 2. 10.1016/j.joule.2018.10.004.
Scenario Net changes in
employment* per
BECCS installed
capacity
∆ # jobs / MW
Contribution to GDP**
per BECCS energy
generation
∆ MM USD GDP / TWh
Emissions removal
for BECCS
generation
tCO2e/ MWh
1
BECCS
2 permanent
4 construction
50 0.67 average
2
BECCS
7 permanent
4 construction
140 0.67 average

FINAL REPORT
II. Impact analysis
Current understanding of the impact of (CDR) approaches on SDGs 215
Enhancing soil carbon content with biochar
A) Status and trends of biochar
In Argentina there were over 530 thousand hectares of fruit tree planted in year 2016, as
indicated in Biennial update reports 3 (BUR3) from 2019.
Table 36: Share per type of crop - Year 2018 - Argentina
Source: National agricultural census (2018)
The planting of fruit trees covered 1.4% of the total planted area, with more than 500 thousand
has, showing the highest geographical concentration in the province of Mendoza, where almost
38% of the total were planted, followed by the province of Tucumán with 10.3% and San Juan
with 10.1%.
As for 2020, there is no large-scale biochar project implemented nor planned projects to be
developed in Argentina.
B) Impact assessment
In Argentina, in the agricultural sector, Biochar would have as main use the application on
degraded soils due to a high number of tillages, such as intensive horticultural crops, and non-
degraded soils of intensive fruit trees production. Also, its use could be extended to large areas
Crop Share of cultivated area
Oilseeds 38.5%
Cereals 30.4%
Fodder crops 21.2%
Forests and forests implanted 3.3%
Industrial crops 2.4%
Fruit trees 1.4%
Legumes 1.0%
Vegetables 0.,4%
Aromatic, medicinal and spices 0%
Greenhouse 0%
Flowers 0%
Other 1.5%

FINAL REPORT
II. Impact analysis
Current understanding of the impact of (CDR) approaches on SDGs 216
of degraded soils under agricultural or livestock use. In the latter, biochar use could be more
restricted due to the cost-benefit relation. For the purposes of this study only the fruit tree area
will be considered for potential large-scale biochar deployment.
Under the curret study, two scenarios were considered and elaborated:
Baseline Scenario: Business as ususal without Biochar application
Scenario 1: Biochar application on up to 25% of fruit tree planted area with pellets of 10%
biochar mix. The fruit tree planted area was forecasted to grow at 1.5% annually over the
period 2020-2050
Scenario 2: Biochar application on up to 60% of fruit tree planted area with pellets of 50%
biochar mix. The fruit tree planted area was forecasted to grow at 2.0% annually over the
period 2020-2050
Considering the aforementioned assumption on the percentage of the fruit tree planted area with
biochar application of up to 25% and up to 60% in the Scenario 1 and Scenario 2 respectively, the
following figure exhibits the area estimates for biochar application for the 2020-2050 period in
Argentina. An assumption of 5 ton per ha per year dose of organic-mineral fertilizers in the form
of pellets was taken. In Scenario 1 those pellets present a 10% biochar mix while in Scenario 2
the mix increases to 50% biochar. The change in the slope of the area with biochar application,
reflects both the fruit tree planted area assumptions over time and the curve of adoption of
biochar within that area over time.
Figure 48: Scenarios of Biochar application area in Argentina (2020-2050)
Source: Own elaboration
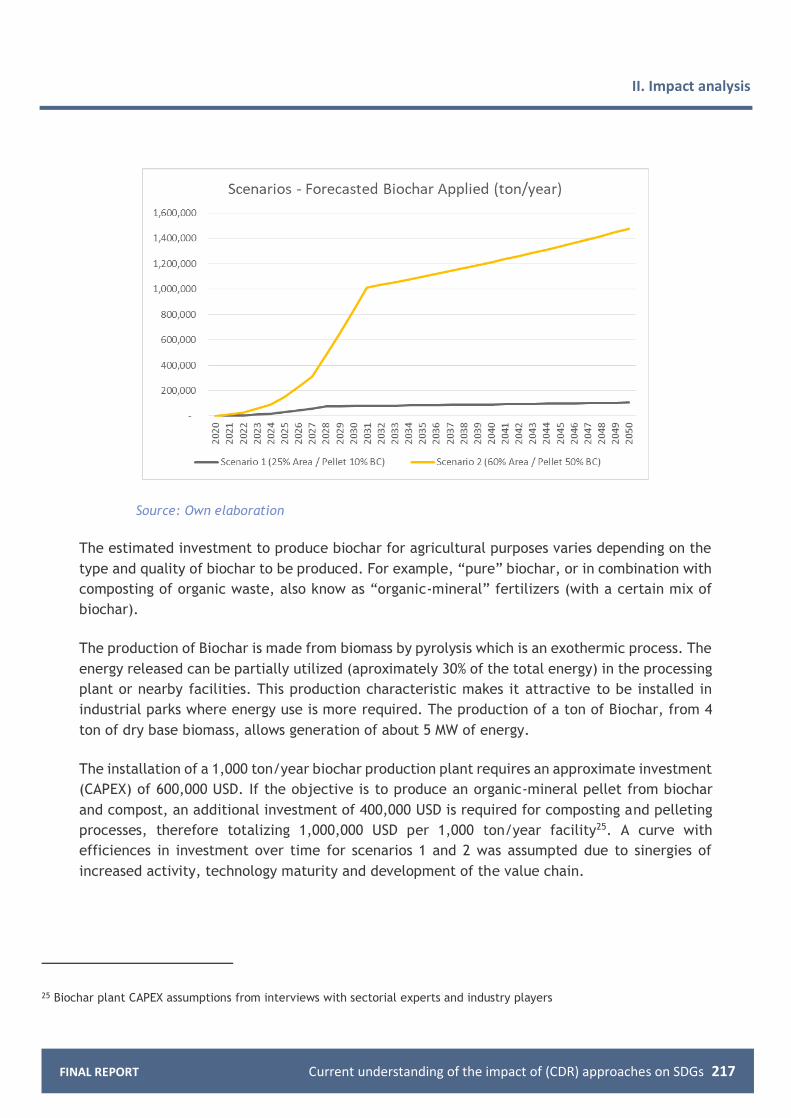
FINAL REPORT
II. Impact analysis
Current understanding of the impact of (CDR) approaches on SDGs 217
Source: Own elaboration
The estimated investment to produce biochar for agricultural purposes varies depending on the
type and quality of biochar to be produced. For example, “pure” biochar, or in combination with
composting of organic waste, also know as “organic-mineral” fertilizers (with a certain mix of
biochar).
The production of Biochar is made from biomass by pyrolysis which is an exothermic process. The
energy released can be partially utilized (aproximately 30% of the total energy) in the processing
plant or nearby facilities. This production characteristic makes it attractive to be installed in
industrial parks where energy use is more required. The production of a ton of Biochar, from 4
ton of dry base biomass, allows generation of about 5 MW of energy.
The installation of a 1,000 ton/year biochar production plant requires an approximate investment
(CAPEX) of 600,000 USD. If the objective is to produce an organic-mineral pellet from biochar
and compost, an additional investment of 400,000 USD is required for composting and pelleting
processes, therefore totalizing 1,000,000 USD per 1,000 ton/year facility25. A curve with
efficiences in investment over time for scenarios 1 and 2 was assumpted due to sinergies of
increased activity, technology maturity and development of the value chain.
25 Biochar plant CAPEX assumptions from interviews with sectorial experts and industry players

FINAL REPORT
II. Impact analysis
Current understanding of the impact of (CDR) approaches on SDGs 218
Scenarios 1 and 2 would totalize aproximately 100 and 900 million dollars investments
respectively for the period 2020-2050.
Table 37: Investment by scenario for Biochar in Argentina
Scenario Total Investment
2020-2050
MM USD
Average Annual
Investment
MM USD / year
1 100 3
2 900 30
Source: Own elaboration
Regarding employment, it is estimated that a 1,000 ton per year biochar plant would generate 4
direct jobs26, resulting in approximate 425 jobs by year 2050 in Scenario 1 (equivalent to 2 directs
jobs per thousand hectares of biochar application) and around 6,000 jobs by 2050 in Scenario 2
(equivalent to 10 directs jobs per thousand hectares of biochar application). Jobs generated
during biochar application on plantations could not be quantified due to lack of information.
Although the “organic-mineral” fertilizer is mostly composed of carbon (from compost and
biochar), only a fraction of the Carbon contained in the biochar is considered as “sequestration”.
The Fraction considered as sequestration is defined by IPCC (2019) on its equation 4A.1 and
depends on two factors: the C content of the biochar (Fcp) and and the fraction of Biochar that
remains in the soil after 100 years (Fpermp). Therefore, the increase in soil carbon results from
multiplying the incorporated mass of Biochar by the C content and the permanence factor. The
latter depends on the temperature at which the Biochar was produced. The lowest temperature
of the pyrolysis process is 350 to 450 degrees Celsius and would correspond to the lowest quality
Biochar, whose permanence fraction is 0.65 (Table 4Ap.2, IPCC, 2019). In the current study, the
values adopted for factors Fcp and Fpermp were 0.7 and 0.65, respectively.
In both scenarios where biochar is added, the required biomass to produce biochar and the
required waste to produce compost, are both well within the limits of availability in Argetina as
estimated by the WISDOM report (FAO-INTA, 2009).
The applied methodology for Argentina results on 2.5 million tons of CO2 equivalent per year
sequestrated for 100 years in Scenario 2 by 2050. Meanwhile Scenario 1 with lower area for
26 Biochar plant employment generation assumptions from interviews with sectorial experts and industry players

FINAL REPORT
II. Impact analysis
Current understanding of the impact of (CDR) approaches on SDGs 219
biochar application and lower biochar mix in pellet results in much lower C sequestration of 0.2
MM ton CO2eq/year by 2050.
Figure 49: Scenarios of forecasted C Sequestration - Biochar (2020-2050)
Source: Own elaboration
The following table shows key metrics of impact analysis for Biochar deployment in Argentina.
Contribution to GDP was estimated based on the investment in machinery and equipment
required in the different biochar application scenarios.
Table 38: Impact analysis of Biochar deployment in Argentina
* Direct jobs generaed in biochar plant. Jobs generated during biochar application on plantations could
not be quantified due to lack of information.
** Investment in Machinery and Equipment vs GDP
*** C sequestration 100 years (65% Fperm; Biochar with 70% C)
Source: Own elaboration
Scenario Net changes in
employment* per
biochar applied area
∆ # jobs / '000 ha
Contribution to GDP per
biochar applied area
∆ MM USD GDP /
'000 ha
GHG emissions***
per biochar applied
area
CO2 ton eq / year /
'000 ha
1 +2 industrial +0.10 835
2 +6 industrial +0.35 4,200

FINAL REPORT
II. Impact analysis
Current understanding of the impact of (CDR) approaches on SDGs 220
3. Colombia
According to the World Bank, Colombia has a track record of prudent macroeconomic and fiscal
management, anchored on an inflation targeting regime, a flexible exchange rate, and a rule-
based fiscal framework, which allowed the economy to grow uninterrupted since 2000. Also,
Colombia halved poverty over the past ten years.
However, productivity growth is low and it has actually been a drag on economic growth. A large
infrastructure gap, low labor productivity, low trade integration and barriers to domestic
competition are among the factors that weigh on total factor productivity. Exports are highly
concentrated in non-renewable commodities (oil in particular), which increases the exposure of
the economy to price shocks. Finally, Colombia is one of the countries with the highest income
inequality and labor market informality in Latin America.
After slowing down to 1.4 percent in 2017, economic growth accelerated to 3.3 percent in 2019,
driven by robust private consumption and stronger investment. Growth was on track to accelerate
further in 2020, but the COVID-19 pandemic hit the economy hard, causing a very deep recession
(World Bank, 2020).
Afforestation and reforestation
A) Status and trends of forestry sector
According to consolidated data by the Ministry of Agriculture and Rural Development (MADR) on
its Forestry Statistical Bulletin Year 2019, cultivated forest area in year 2019 was 568,769
hectares, representing a CAGR growth of 7.0% over the 2002-2019 period.

FINAL REPORT
II. Impact analysis
Current understanding of the impact of (CDR) approaches on SDGs 221
Figure 50: Historical cultivated forest area in Colombia
Source: MADR based on ICA, FINAGRO and FEDERACIÓN DE CAFETEROS; Evaluaciones Agropecuarias
Municipales por Consenso from Dirección de Desarrollo Rural Sostenible
Andina (44%) and Orinoquia (26%) are the main regions in terms of cultivated forest area (being
Antioquia, Vichada, Meta and Córdoba the main department). The largest species are "Pinus
patula+Other pine species" (33%) and "Eucalyptus grandis+Other eucalyptus species" (21%). Most
of the current cultivated area present an age in the range of 6 to 10 years (31%), 11 to 15 years
(22%) and 2 to 5 years (18%).

FINAL REPORT
II. Impact analysis
Current understanding of the impact of (CDR) approaches on SDGs 222
Figure 51: Characterization of cultivated forest area in Colombia (Year 2019)
Source: Own elaboration based on Forestry Statistical Bulletin Year 2019
The Unidad de Planificación Rural Agropecuaria (UPRA) estimated in 2015 that 7,258,442 ha
(equivalent to 7% of Colombian territory) presented high aptitude for forest cultivation for
commercial purposes.27 Two years later, a new study from UPRA analyzed in detail 3 regions and
14 departments of Colombia, concluding that 4.996.171 ha presented high aptitude for forest
cultivation for commercial purposes.28
27 UPRA, 2015. "Zonificacion para Plantaciones forestales con fines comerciales - Colombia - Escala 1:100.000" 28 UPRA, 2017. "Mapa de Zonificación de Aptitud para plantaciones forestales con fines comerciales en 3 regiones y 14 departamentos de Colombia. Escala: 1:100.000"

FINAL REPORT
II. Impact analysis
Current understanding of the impact of (CDR) approaches on SDGs 223
Figure 52: Map of Zones with Aptitude for Forest Plantations with Commercial Purposes
Source: UPRA 2017
Another relevant reference is the National Development Plan of the current Government that has
three goals on forest plantations:
Increase the participation of the forest economy in national GDP by one percent (currently
0.6 percent)
Increase the commercial reforestation area up to 122,000 hectares by 2022 (3,000 ha in
2019; 33,000 ha in 2020; 43,000 ha each in 2021 and 2022) and reach 1.5 million hectares
by 2030
Generate areas with planned productive transformation through forestry cluster initiatives

FINAL REPORT
II. Impact analysis
Current understanding of the impact of (CDR) approaches on SDGs 224
According to the MADR (2019), there were nearly 40 thousand direct jobs in the forestry sector
and about 100 thousand indirect jobs (representing a ratio of aproximate 2.5 indirect jobs per
direct job). The growth rate (CAGR) of forestry direct jobs in Colombia was 2.2% annually for the
period 2010-2018.
Figure 53: Historical forestry employment in Colombia
Source: MADR 2019
B) Impact assessment
Under the current study, three scenarios were determined and elaborated:
Base Scenario: Scenario based on historical trends
Scenario 1: Increased activity scenario (NDC)
Scenario 2: Scenario of Maximum potential area suitable for forestlands in Colombia

FINAL REPORT
II. Impact analysis
Current understanding of the impact of (CDR) approaches on SDGs 225
Figure 54: Scenarios of forecasted cultivated forest area in Colombia (2020-2050)
Source: Own elaboration
These estimates imply a 2.4%, 3.4% and 5.0% CAGR annual growth in cultivated forest area for
Base Scenario, Scenario 1 and Scenario 2 respectively.
Table 39: Comparison of growth rates by Scenario - Cultivated Forest Area - Colombia
Period / Scenario CAGR Avg Variation (ha/y)
Historical 2003-2009 10.8% 23,750
Historical 2010-2014 9.9% 35,636
Historical 2015-2019 1.4% 9,898
Proj 2020-2050 -Base 2.4% 20,000
Proj 2020-2050 -Sc1 3.4% 35,000
Proj 2020-2050 -Sc2 Max 5.0% 70,000
Source: Own elaboration
In terms of investment and costs required, MADR estimated in 2018 a CAPEX of 1,085 USD/ha for
plantation and a Maintenance Operational Expenditures (OPEX) ranging from 200 to 370 USD/ha
over the following four years.

FINAL REPORT
II. Impact analysis
Current understanding of the impact of (CDR) approaches on SDGs 226
Table 40: CAPEX and OPEX - Cultivated Forest Area - Colombia - Year 2018
Source: MADR 2019
A curve with efficiences in investment over time for scenarios 1 and 2 was assumpted due to
sinergies of increased activity and development of the value chain. Scenarios 1 and 2 would
totalize aproximately 2,300 and 4,300 million dollars investments respectively for the period
2020-2050.
Table 41: Investment by scenario for Afforestation in Colombia
Scenario Total Investment
2020-2050
MM USD
Average Annual
Investment
MM USD / year
Base 1,431 48
1 2,327
(+63% vs Base)
78
2 4,331
(+203% vs Base)
144
Source: Own elaboration
In order to quantify C sequestration and GHG removal, the first step was to estimate the density,
yield and growth rates by species and by department. The biomass extracted was calculated for
each group of species considering differences in the cutting schemes for conifers and other
species among regions (ex: 18 to 40 years for conifers; 12 years for eucalyptus; 11 years for
salicaceae and 15 to 35 years for other species. For scenarios 1 and 2 of increased level of
afforestation, a curve of decreasing yields was assumpted, as new plantations move to less
productive lands.

FINAL REPORT
II. Impact analysis
Current understanding of the impact of (CDR) approaches on SDGs 227
The balance or net carbon capture was calculated as the difference between the captures from
annual growth and the emissions from annual extraction. The fixation data correspond to the
initial implanted area (569 thousand ha in 2019), fixing carbon at the corresponding growth rate
for each species/region to which the annual area increase is added (cumulative until 2050).
The annual emission data correspond to the initial implanted area divided by the cutting scheme,
according to the area implanted from 2019 onwards. The biomass values were converted to
carbon and then CO2.
The following figure corresponds to the CO2 balance for the three scenarios proposed for the the
area of forest plantations increase. In this estimate of the CO2 balance, emissions from
intermediate treatments of plantations (pruning and thinning) are not included, neither are
considered emissions / removals of products originating from afforestation.
Figure 55: Balance of CO2 by Scenarios of cultivated forest area in Colombia (2020-2050)
Source: Own elaboration
The following table shows key metrics of impact analysis for Afforestation deployment in
Colombia. Contribution to GDP was estimated as impact in Gross Agregatted Value for Forestry
and Timber extraction activities based on the different planted area scenarios. Net changes in
employment was also estimated based on direct forestry jobs (as classified by MADR) with the
different planted area scenarios.

FINAL REPORT
II. Impact analysis
Current understanding of the impact of (CDR) approaches on SDGs 228
Table 42: Impact analysis of Afforestation in Colombia
Note: * Employment impact estimates for direct forestry jobs (as classified by MADR). ** Contribution to
GDP estimated as impact in Gross Agregatted Value for Forestry and Timber extraction activities
Mangroves - Impact Analysis Colombia
This subsection covers the impact analysis of mangrove restoration in Colombia.
Colombia is a unique as well as globally significant country in terms of mangroves, with world-
class high biomass and carbon reservoirs, and is placed -with 2% of the global mangrove carbon
stock found in Colombia- within the top 20 countries in the world ranking (Hamilton and Friess,
2018).
As mentioned before, Colombia holds the second largest mangrove area in South America behind
Brazil (FAO, 2007). It is the only country in South America with coasts in both the Pacific and the
Atlantic Oceans (in the Caribbean Sea), with about three-fourths of the surface of its mangroves
located in the Pacific coast and one-fourth in the Caribbean coast.
Scenario Net changes in
employment* per
cultivated forest area
∆ # direct jobs / '000 ha
Contribution to GDP**
per cultivated forest
area
∆ MM USD GDP /
'000 ha
GHG emissions per
cultivated forest area
MM CO2 ton eq /
ha
Base 19 direct
47 indirect
+0.35 10
1 16 direct
40 indirect
+0.31 8
2 13 direct
32 indirect
+0.25 6
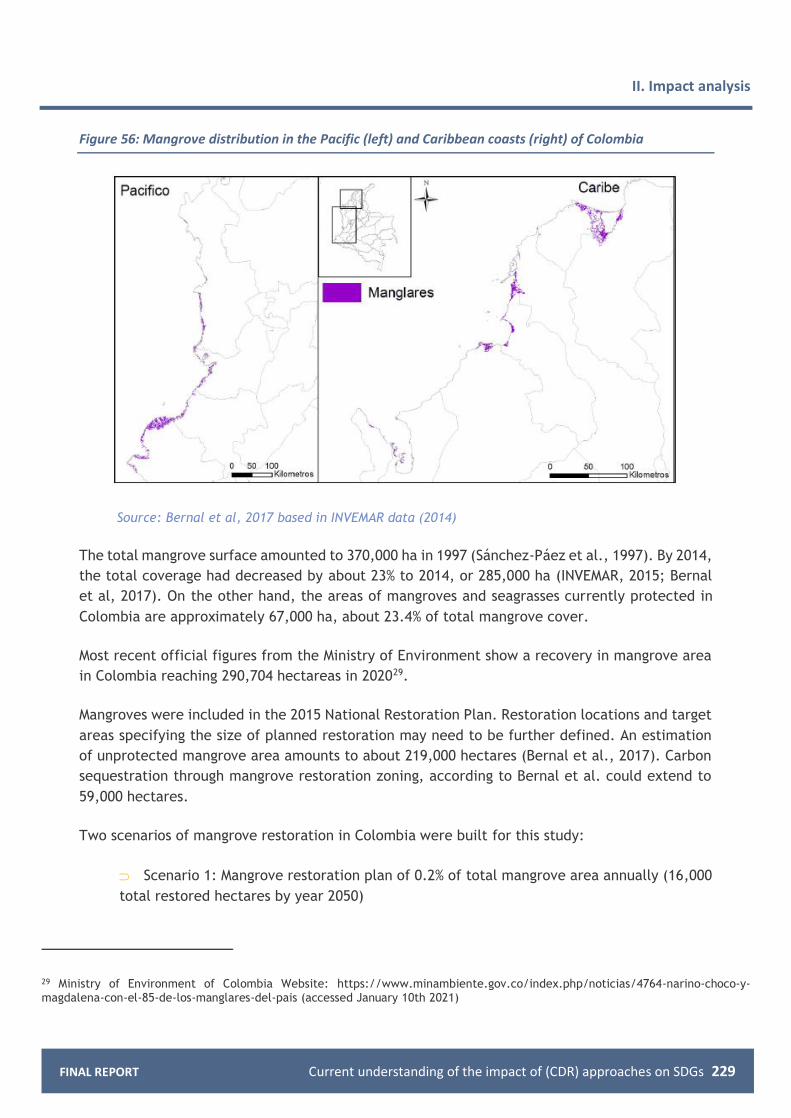
FINAL REPORT
II. Impact analysis
Current understanding of the impact of (CDR) approaches on SDGs 229
Figure 56: Mangrove distribution in the Pacific (left) and Caribbean coasts (right) of Colombia
Source: Bernal et al, 2017 based in INVEMAR data (2014)
The total mangrove surface amounted to 370,000 ha in 1997 (Sánchez-Páez et al., 1997). By 2014,
the total coverage had decreased by about 23% to 2014, or 285,000 ha (INVEMAR, 2015; Bernal
et al, 2017). On the other hand, the areas of mangroves and seagrasses currently protected in
Colombia are approximately 67,000 ha, about 23.4% of total mangrove cover.
Most recent official figures from the Ministry of Environment show a recovery in mangrove area
in Colombia reaching 290,704 hectareas in 202029.
Mangroves were included in the 2015 National Restoration Plan. Restoration locations and target
areas specifying the size of planned restoration may need to be further defined. An estimation
of unprotected mangrove area amounts to about 219,000 hectares (Bernal et al., 2017). Carbon
sequestration through mangrove restoration zoning, according to Bernal et al. could extend to
59,000 hectares.
Two scenarios of mangrove restoration in Colombia were built for this study:
Scenario 1: Mangrove restoration plan of 0.2% of total mangrove area annually (16,000
total restored hectares by year 2050)
29 Ministry of Environment of Colombia Website: https://www.minambiente.gov.co/index.php/noticias/4764-narino-choco-y-magdalena-con-el-85-de-los-manglares-del-pais (accessed January 10th 2021)

FINAL REPORT
II. Impact analysis
Current understanding of the impact of (CDR) approaches on SDGs 230
Scenario 2: Mangrove restoration plan of 0.7% of mangrove area annually (58,000 total
restored hectares by year 2050) (Maximum mangrove restoration area according to Bernal
et al 2017)
Figure 57: Scenarios of forecasted Mangrove Restoration area in Colombia (2020-2050)
Source: Own elaboration
Within these projections, total mangrove area in Colombia would add to 306,000 hectares and
348,000 hectares by 2050 in Scenarios 1 and 2 respectively.
Reported marine coastal restoration costs for mangrove restoration where large contributions of
effort by communities and volunteers are common, is estimated in around 9,000 USD/ha (mean
value of 109 mangrove restoration projects from Bayraktarov et al., 2016a study). A curve with
efficiences in investment over time for scenarios 1 and 2 was assumed due to sinergies of
increased activity and development of the value chain. Scenarios 1 and 2 would totalize
aproximately 140 and 460 million dollars accumulated investments respectively for the period
2020-2050.
Table 43: Investment by scenario for Mangrove Restoration in Colombia
Scenario Total Investment
2020-2050
MM USD
Average Annual
Investment
MM USD / year
1 139 5
2 460 15
Source: Own elaboration

FINAL REPORT
II. Impact analysis
Current understanding of the impact of (CDR) approaches on SDGs 231
In order to quantify C sequestration and GHG removal, the first step was to estimate biomass
growth rates of mangrove plantations. Above Ground Biomass (AGB) growth rates were adopted
from Bernal et al study (2017).30 Bernal et al differentiates growth rate between mangrove trees
and smaller mangrove shrub-scrub and also differentiate growth rates from first 20 years from
following 30 years.
Table 44: Above Ground Biomass (AGB) growth rates for Mangrove Restoration in Colombia
ton CO2e / ha / year AGB Years 0-20 AGB Years 21-50
Mangrove Tree 16.1 7.4
Mangrove shrub-scrub 4.4 1.4
Source: Bernal et al 2017
Palacios Peñaranda et al (2019) estimated that AGB represents only 17% of total carbon stock in
mangroves when considering Below Ground Biomass, Leaf Litter, Fallen Wood and Soil Sediments.
This factor was also considered in our carbon sequestration projections. A conservative factor of
70% was applied to biomass growth rates due to restoration plantations on previously
erosioned/damaged mangroves land.
The applied methodology for Colombia results on nearly 2.9 million tons of CO2 equivalent per
year sequestrated in Scenario 2 by 2050. Meanwhile Scenario 1 with lower area for mangrove
restoration results in much lower C sequestration of 0.8 million ton CO2eq/year by 2050.
Figure 58: Scenarios of C Sequestration - Mangrove Restoration - Colombia (2020-2050)
Source: Own elaboration
30 Described above in subsection Mangrove literature review for Colombia.

FINAL REPORT
II. Impact analysis
Current understanding of the impact of (CDR) approaches on SDGs 232
There is limited information on jobs created in mangrove restoration. A ratio of 50 direct jobs
created in mangrove plantation per 1000 hectares restored was adopted, based on information
published from a 2,100 ha mangrove restoration project in the Ayeyarwady Delta in Myanmar in
which 100 planters were trained and employed (3 million trees were planted up to year 2018)31.
The following table shows key metrics of impact analysis for Mangrove Restoration in Colombia.
Contribution to GDP was estimated based on the investment in machinery and equipment
required in the different mangrove restoration scenarios.
Table 45: Impact analysis of Mangrove restoration in Colombia
* Direct jobs generated in mangrove restoration plantations. Jobs generated on other activities derived
from mangrove ecosystem not included.
** Investment in Machinery and Equipment vs GDP
Source: Own elaboration
Bioenergy with carbon capture and storage (BECCS)
A) Status and trends of BECCS
After a relatively slow growth rate during decade 2000-2010, Power Installed Capacity in
Colombia grew to 17,467 MW in 2019 at a 3.1% annual growth rate (CAGR 2010-2019), led mainly
by Hydro and Thermal Coal. Altough incipient, Bioenergy and Cogeneration summarized 145 MW
of installed capacity by 2019.
Power Generation grew to 70,115 GWh in 2019 at a 1.7% annual growth rate (CAGR 2006-2019).
31 Foundation myclimate, 2019. "Mangrove Restoration and Women Empowerment"
Scenario Net changes in
employment* per
mangrove restored
area
∆ # jobs / '000 ha
Contribution to GDP per
mangrove restored area
∆ MM USD GDP /
'000 ha
GHG emissions per
mangrove restored area
CO2 ton eq / year /
'000 ha
1 50 direct plantation 3.7 48,300
2 50 direct plantation 3.7 49,800
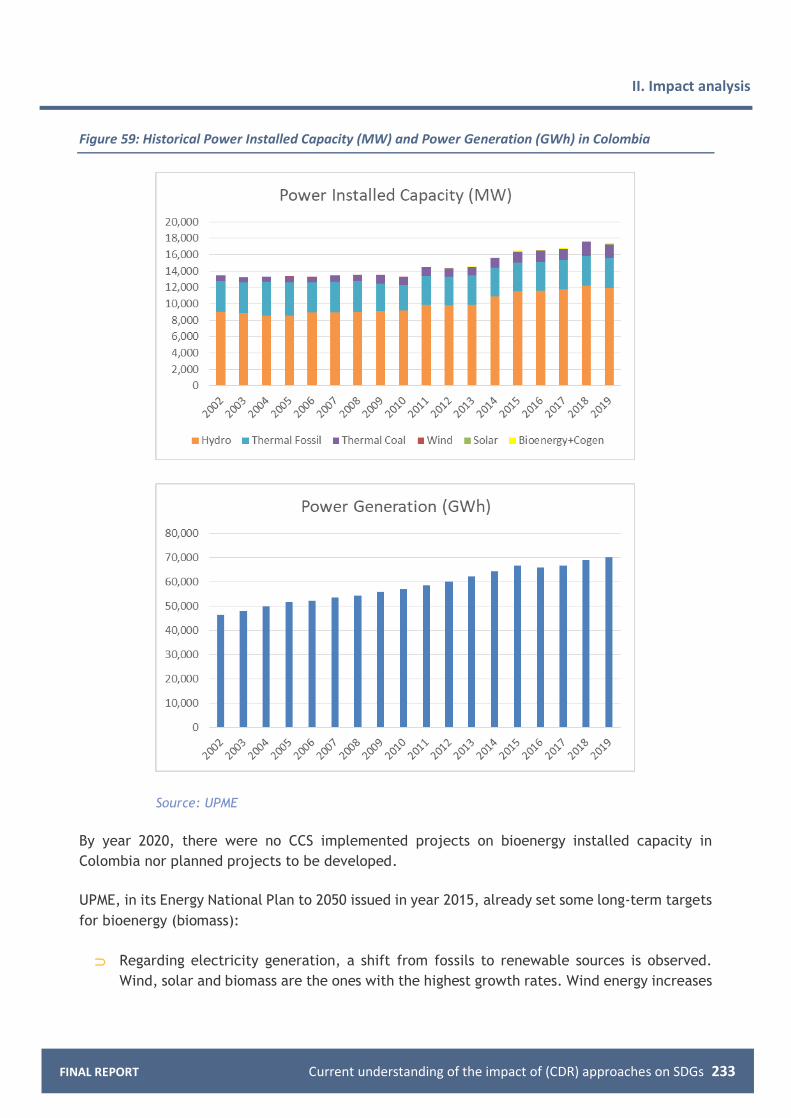
FINAL REPORT
II. Impact analysis
Current understanding of the impact of (CDR) approaches on SDGs 233
Figure 59: Historical Power Installed Capacity (MW) and Power Generation (GWh) in Colombia
Source: UPME
By year 2020, there were no CCS implemented projects on bioenergy installed capacity in
Colombia nor planned projects to be developed.
UPME, in its Energy National Plan to 2050 issued in year 2015, already set some long-term targets
for bioenergy (biomass):
Regarding electricity generation, a shift from fossils to renewable sources is observed.
Wind, solar and biomass are the ones with the highest growth rates. Wind energy increases

FINAL REPORT
II. Impact analysis
Current understanding of the impact of (CDR) approaches on SDGs 234
its participation in the matrix from 5% to 26% in 2050. Solar energy goes from 1% to 9% and
biomass from 4% to 8%
In the most feasible scenario, it is considered that non-conventional sources of energy can
account for 6% of the electric energy basket, which would correspond to an installed
capacity of 1,207 MW in 2028. [..] it is considered possible the installation of 143 MW of
solar energy, 275 of geothermal energy and 314 MW of cogeneration with biomass.
B) Impact assessment
Under the current study, three scenarios were elaborated:
Baseline scenario, considering Plan Energético Nacional Colombia 2020- 2050 (UPME, 2019)
Scenario 1: An enhanced biomass/biogas power generation scenario, with low CCS adoption
Scenario 2: An enhanced biomass/biogas power generation scenario, with high CCS
adoption
Table 46: Configuration of BECCS Scenarios for Colombia
Baseline Scenario 1 Scenario 2
2020-
2030
Renewables According to UPME
expansion plan 2017-
2031 (Scenario 2), with
renewable power
generation based on
historic dispatch values
and capacity factors,
reaching 7.36% of the
system power generation
in 2030, excluding Hydro.
Consistent with the
baseline scenario, but
displacing an additional
1.48 percentage points
of coal-fired power
generation in 2030 with
additional biomass
power generation.
Consistent with the baseline
scenario, but displacing an
additional 1.89 percentage
points of coal-fired power
generation in 2030 with
additional biomass power
generation.
BE According to UPME
expansion plan 2017-
2031, with biomass
power generation based
on historic dispatch
values and capacity
factors.
Biomass power
generation Installed
capacity reaches 257 MW
in 2030.
Biomass power
generation reaches
2.93% of the total
system power
generation in 2030, an
increase of 102% vs. the
baseline scenario.
Biomass power
generation Installed
capacity reaches 519
MW in 2030.
Biomass power generation
reaches 3.34% of the total
system power generation in
2030 an increase of 131% vs.
the baseline scenario.
Biomass power generation
Installed capacity reaches
592 MW in 2030.
BECCS No CCS installed
capacity.
BECCS reach 3.2% of the
bioenergy power
generation in 2030.
BECCS reach 15.1% of the
bioenergy power generation
in 2030.
2031-
2050
Renewables In the consultants’
baseline scenarios,
renewable power
Consistent with the
baseline scenario.
In the consultants’ baseline
scenarios, renewable power
generation (excluding Hydro)

FINAL REPORT
II. Impact analysis
Current understanding of the impact of (CDR) approaches on SDGs 235
generation (excluding
Hydro) reaches 22.2% of
the system generation by
2050, and 85.1%
including Hydro.
reaches 48.2% of the system
generation by 2050,
displacing thermal
conventional power plants
vs. the baseline scenario.
BE Bioenergy represents
3.2% of the power
generation.
Bioenergy represents
5.0% of the power
generation.
Bioenergy represents 9.0% of
the power generation.
BECCS No CCS installed
capacity.
BECCS reach 7.3% of the
bioenergy power
generation in 2050.
BECCS reach 48.3% of the
bioenergy power generation
in 2050.
Source: Own elaboration partially based on UPME.
2020—2030
Baseline scenario
In the case of Colombia, the baseline scenario has been constructed based on the Reference
Expansion Plan for Power Generation and Transmission 2017 – 2031 (UPME 2018). Electricity
demand for this period has been computed according to the expansion plan adjusted by the 2020
values and represents a CAGR of 3.2% between 2020 and 2030.
Please note that the Expansion Plan for Colombia provides information for additional installed
capacity, while it does not provide information regarding power generation, which has been
estimated based on historic capacity factors for each technology.
Scenario 1
Scenario 1 considers that the electricity demand and power generation to 2030 is equivalent to
the electricity demand in the baseline scenario, and that renewable power generation displaces
additional 1.48 percentage points of coal-fired power generation in 2030, covered with additional
biomass power generation. Renewables reach 8.9% of the systems power generation excluding
Hydro in 2030, and 81.32% including Hydro.
Biomass power generation reaches 2.93% of the total system power generation in 2030, an
increase of 102% vs. the baseline scenario, reaching 519 MW in 2030, and BECCS pilot projects
are introduced, reaching 3.2% of the bioenergy power generation in 2030 (16.4 MW).
Scenario 2
Electricity demand and power generation are consistent with the baseline scenario, but displace
an additional 1.89 percentage points of coal-fired power generation in 2030 with additional
biomass power generation. Renewables reach 9.3% of the systems power generation excluding
Hydro in 2030, and 81.7% including Hydro.

FINAL REPORT
II. Impact analysis
Current understanding of the impact of (CDR) approaches on SDGs 236
Biomass power generation reaches 3.3% of the total system power generation in 2030, an increase
of 131% vs. the baseline scenario, reaching 592.5 MW in 2030, and BECCS penetration is faster
than in Scenario 1, reaching 15.1% of the bioenergy power generation in 2030 (89.5 MW).
2031—2050
Baseline scenario
From the year 2032 onwards, the Colombian government does not provide official inputs for new
power generation or capacity, other than information regarding primary energy sources in
preliminary discussion documents such as the current consultation on the National Energy Plan
2020-2050. In this context, the consultants built a baseline scenario considering a deacceleration
by the horizon of the scenario modelling (2050) of electricity demand consistent with an
increased use of electricity in certain sectors but overtaken by a decoupling of GDP growth to
energy consumption. In all the modelled scenarios for the purpose of this document, electricity
demand grows at a CAGR of 1.9%.
In the baseline scenario, renewable power generation (excluding Hydro) reaches 22.2% of the
power generation mix (Solar PV 10.9%, Wind power 8.2% and Biomass 3.2%), and when computing
Hydro it reaches 85.1%, while Thermal Fossil power generation accounts for 14.9%, fueled by
Natural Gas (8.0%) and Coal (6.9%). Bioenergy in the horizon of 2050 and represents 3.2% of the
power generation, but does not include Carbon Capture Technologies (i.e., “there is BE but no
BECCS”).
Scenario 1
Scenario 1 represents a slightly larger ambition in terms of the penetration of renewables in
Colombia’s power grid, reaching 24.1% of the system’s power generation (Solar PV 10.9%, Wind
power 8.2% and Biomass 5.0%) excluding Hydro or 87% including Hydro, and introduces Carbon
Capture and Storage technologies to 7.8% of the biomass-fired installed capacity.
Bioenergy installed capacity reaches 1,309 MW (biomass-fired power plants). BECCS power
generation represents 7.3% of the total bioenergy power generation, or 0.37% of the system
generation.
Scenario 2
In the Scenario 2, from 2030 onwards, while the rest of renewable sources maintain their share
of the system generation, Bioenergy displaces a larger share of coal-fired power generation,
reaching 9.0% of the mix by 2050. Additionally, 48.3% of the Bioenergy generation features CCS
technologies (biomass-fired power plants), associated to a BECCS installed capacity of 2,348 MW.

FINAL REPORT
II. Impact analysis
Current understanding of the impact of (CDR) approaches on SDGs 237
Figure 60: Power generation by source for 2020, 2030 and 2050 under the described scenarios. Colombia
Source: Own elaboration partially based on UPME.
0% 10% 20% 30% 40% 50% 60% 70% 80% 90% 100%
Scenario 2
Scenario 1
Baseline
Scenario 2
Scenario 1
Baseline
Scenario 2
Scenario 1
Baseline
2050
2030
2020
Hydro Thermal other Thermal coal Wind Solar PV Biomass w/o CCS Biomass w CCS

FINAL REPORT
II. Impact analysis
Current understanding of the impact of (CDR) approaches on SDGs 238
Figure 61: Scenarios of Bioenergy Installed Capacity in Colombia (2020-2050)

FINAL REPORT
II. Impact analysis
Current understanding of the impact of (CDR) approaches on SDGs 239
Source: Own elaboration
These estimates imply a 6.0%, 7.6% and 9.8% CAGR annual growth in bionergy installed capacity
for Baseline Scenario, Scenario 1 and Scenario 2 respectively. Baseline Scenario does not consider
CCS, meanwhile in Scenario 1 BECCS would achieve over 100 MW of capacity and in Scenario 2
that figure would increase to over 1100 MW.
Table 47: Comparison of growth rates by Scenario - Bioenergy Installed Capacity - Colombia
Period / Scenario CAGR Avg Variation (MW/y)
Historical 2015-2019 11.7% 13
Proj 2020-2050 -Base 6.0% 23
Proj 2020-2050 -Sc1 7.6% 39
Proj 2020-2050 -Sc2 Max 9.8% 73
Source: Own elaboration
The following table exhibits a summary of key BECCS scenario metrics for Colombia, regarding
power generation, installed capacity and investment.

FINAL REPORT
II. Impact analysis
Current understanding of the impact of (CDR) approaches on SDGs 240
Table 48: Key BECCS scenario metrics for Colombia
Baseline Scenario 1 Scenario 2
Power generation (net)
TWh 2020 62.8 62.8 62.8
2030 86.3 86.3 86.3
2050 126.3 126.3 126.3
Non-fossil fueled power generation / total
% 2020 73.0% 73.0% 73.0%
2030 79.8% 81.3% 81.7%
2050 85.1% 87.0% 91.0%
BE power generation
TWh 2020 1.0 1.0 1.0
2030 1.2 2.5 2.9
2050 4.0 6.4 11.4
BE / power generation
% 2020 1.6% 1.6% 1.6%
2030 1.4% 2.9% 3.3%
2050 3.2% 5.0% 9.0%
BE / thermal power generation exc. Nuclear
% 2020 5.6% 5.6% 5.6%
2030 6.7% 13.6% 15.5%
2050 17.5% 27.9% 50.0%
BECCS/ BE Power generation
% 2020 0.0% 0.0% 0.0%
2030 0.0% 3.2% 15.1%
2050 0.0% 7.3% 48.3%
BE Installed capacity
MW 2020 143.5 143.5 143.5
2030 256.6 519.4 592.5
2050 821.3 1,309.0 2,348.2
BECCS Installed capacity
MW 2020 - - -
2030 - 16.4 89.5
2050 - 95.4 1,134.5
Investment in BE (no CCS)
MUSD/year 2020-2030 26.7 — 28.3 88.7 — 94.2 105.9 — 112.5
2031-2050 70.1 — 74.5 98.0 — 104.1 341.9 — 360.4
Investment in BECCS
(includes power plant)
MUSD/year 2020-2030 - 6.1 — 6.4 33.1 — 34.9
2031-2050 - 15.4 — 16.2 203.5 — 214.5
Source: Own elaboration partially based on UPME.

FINAL REPORT
II. Impact analysis
Current understanding of the impact of (CDR) approaches on SDGs 241
For BECCS investment estimation the following assumptions were taken:
BECCS: 3,700 to 3,900 USD/kWe (Adapted from Langholtz et al (2020) "The Economic
Accessibility of CO2 Sequestration through Bioenergy with Carbon Capture and Storage
(BECCS) in the US")
Scenarios 1 and 2 would totalize aproximately 360 and 4,300 million dollars cummulated
investments respectively for the period 2020-2050.
Table 49: Investment by scenario for BECCS in Colombia
Scenario Total Investment
2020-2050
MM USD
Average Annual
Investment
MM USD / year
1 360 12
2 4,300 146
Source: Own elaboration
The following table in next page shows a summary of key scenario results for Colombia:

FINAL REPORT
II. Impact analysis
Current understanding of the impact of (CDR) approaches on SDGs 242
Table 50: Summary of key BECCS emission scenario results in Colombia
Baseline Scenario 1 Scenario 2 BECCS capture rate Scenarios as % of C input: 40 60 80 40 60 80 40 60 80
Combustion Emissions in power generation
MtCO2e 2020 13.5 13.5 13.5 2030 19.5 18.9 18.7 2050 23.7 24.0 21.7
Emissions intensity of combustion for power generation
tCO2e/ MWh
2020 0.216 0.216 0.216 2030 0.226 0.219 0.217 2050 0.188 0.190 0.172
Carbon fixed in biomass feedstock used for power generation
MtCO2e 2020 (1.17) (1.17) (1.17) 2030 (1.46) (2.95) (3.36) 2050 (4.66) (7.43) (13.33)
Other lifecycle emissions from transport and processing of feedstock and energy use
MtCO2e
2020 0.19 0.19 0.19 2030 0.23 0.47 0.54
2050 0.75 1.19 2.13
Post-combustion capture MtCO2e 2020 - - - - - - - - - 2030 - - - (0.04) (0.06) (0.07) (0.20) (0.30) (0.41) 2050 - - - (0.22) (0.32) (0.43) (2.58) (3.86) (5.15)
Net scenario emissions MtCO2e
2020 12.56 12.56 12.56 12.56 12.56 12.56 12.56 12.56 12.56
2030 18.25 18.25 18.25 16.39 16.37 16.35 15.72 15.61 15.51 2050 19.82 19.82 19.82 17.51 17.40 17.29 7.93 6.64 5.36
Adjusted intensity for power generation
tCO2e/ MWh
2020 0.200 0.200 0.200 0.200 0.200 0.200 0.200 0.200 0.200 2030 0.212 0.212 0.212 0.190 0.190 0.190 0.182 0.181 0.180 2050 0.157 0.157 0.157 0.139 0.138 0.137 0.063 0.053 0.042
Avoided and captured emissions vs. baseline
MtCO2e 2020 - - - - - - - - - 2030 - - - (1.86) (1.88) (1.90) (2.53) (2.64) (2.74) 2050 - - - (2.32) (2.42) (2.53) (11.89) (13.18) (14.47)
Avoided and captured emissions vs. baseline
%
2020 0% 0% 0% 0% 0% 0% 0% 0% 0%
2030 0% 0% 0% -10% -10% -10% -14% -14% -15%
2050 0% 0% 0% -12% -12% -13% -60% -66% -73%
Source: Own elaboration
FINAL REPORT Current understanding of the impact of (CDR) approaches on SDGs 241
FINAL REPORT
II. Impact Analysis
Current understanding of the impact of (CDR) approaches on SDGs 243
The penetration of BECCS in Colombia in the short-term is primarily conditioned by the strong
relevance of hydropower in the power generation mix, highly sensitive to hydraulicity levels and
requiring additional thermal installed capacity to cope with high and low water availability
cycles, with coal presenting a relevant share (around 40% of thermal power generation, followed
by natural gas, but varying according to hydraulicity levels and fuel availability).
In the long-term, the increasing share of non-dispatchable technologies (such as Solar PV and
Wind Power) require additional thermal capacity until storage costs reach more competitive
values, possibly promoting the competitiveness of Bioenergy and BECCS displacing coal-fired
power plants.
Estimated full LCOE (considering CAPEX and O&M costs) for BECCS in Colombia ranges from 199.6
USD/MWh to 239.4USD/MWh vs. current average system costs around 68 USD/MWh and estimated
at levels of 65 USD/MWh to 76 USD/MWh in 2050. (See Annex for further detail).
Towards the horizon of 2050, non-fossil power generation reaches 85.1% to 91.0% of the mix in
the three analyzed scenarios. In this context:
The short-term relevance of Bioenergy and BECCS in displacing coal for power generation
is high, providing substantive emission reductions for the power sector.
In consequence, although BECCS LCOE is considerably higher than the system cost and also
than every other current alternative, the short-term Carbon Dioxide Avoidance and
Removal cost of BECCS —computed as the difference between LCOEs over the difference
between specific CO2 emissions/removals— is notably low when compared to the available
literature, ranging from 50.2 USD/tCO2e to 92.7 USD/tCO2e (considering CAPEX and O&M
costs).
In the long-term, the cost of carbon dioxide avoidance and removal increases, due to a
lowering denominator, which converges into the carbon capture component of BECCS, and
reaches between 123 USD/tCO2e and 279 USD/tCO2e for the analyzed scenarios.
However, as the potential of displacing fossil fuels decreases, CDR technologies in the
power sector, such as BECCS, become some of the few available options to promote system-
wide decarbonization.
Impact on Employment
According to official statistics from DANE in its Households Survey 2019, there were 56,309
registered jobs in the generation, transmission, distribution and commercialization private sector
of Colombia. No historical data on evolution or breakdown by sub-sector was available.
A study from the Imperial College London from 2018 (Patrizio, et al 2018) on early deployment
of BECCS in the US and replacing 50% of aging coal plants with natural gas plant, estimates that

FINAL REPORT
II. Impact Analysis
Current understanding of the impact of (CDR) approaches on SDGs 244
1.9 permanent jobs per million dollars invested can be created in early deployment of BECCS32.
By 2050, that ratio might decrease to 0.8 jobs / MMUSDA invested from deployment learning
curve, economies of scale and larger operative efficiences are achieved.
Deployment of BECCS plant generates Operation and Manintenance direct jobs, but also jobs are
created during the Construction phase (ex: 4,000 MW Drax BECCS project in UK would generate
up to 17,000 jobs during its peak construction activity, equivalent to over 4 construction jobs /
MW installed). Also, according to Patrizio et al, BECCS facilities generate additional indirect jobs
in the forestry sector and connected to logistics activities (almost 1 to 1 ratio of additional jobs
generated).
Under these assumptions BECCS deployment could generate nearly 1,300 permanent jobs by 2050
in Scenario 1, and over 16,000 permanent jobs by 2050 in Scenario 2. Construction of BECCS
plants could generate an average of about 25 construction jobs per year in Scenario 1 and 300
jobs/year in Scenario 2 (over the 2030-2050 period).
The following table shows key metrics of impact analysis for BECCS deployment in Colombia.
Contribution to GDP was estimated based on the investment in production equipment required
in the different BECCS deployment scenarios.
Table 51: Impact analysis of BE/BECCS deployment in Colombia
* Not considering jobs lost in other sources of energy outplaced
** Investment in Durable Production Equipment vs GDP
Source: Own elaboration
32 Patrizio, et al (2018). "Reducing US Coal Emissions Can Boost Employment". Joule. 2. 10.1016/j.joule.2018.10.004.
Scenario Net changes in
employment* per
BE/BECCS installed
capacity
∆ # jobs / MW
Contribution to GDP**
per BE/BECCS energy
generation
∆ MM USD GDP / TWh
Emissions Removal
for BECCSpower
generation
tCO2e/ MWh
1
BE+BECCS
1.2 permanent
4 construction
25 1.3
(average 2020-2050)
2
BE+BECCS
7.4 permanent
4 construction
165 1.3
(average 2020-2050)

FINAL REPORT
II. Impact Analysis
Current understanding of the impact of (CDR) approaches on SDGs 245
Enhancing soil carbon content with biochar
A) Status and trends of Biochar
In Colombia there were in 2018 over 1 million hectares planted with fruit tree, out of which 50%
correspond to plantains. The historical annual growth rate is 2.8% (CAGR 2007-2018).
Figure 62: Historical Fruit Tree Planted Area in Colombia
Source: Evaluaciones Agropecuarias Municipales EVA 2007-2018 from MADR
Regarding Vegetables, Legumes and Tubers, there were in 2018 over 0.6 million hectares planted
in Colombia. Yucca, potatoes and beans are the most relevant crops. The historical annual growth
rate was 0.5% (CAGR 2007-2017). However, in 2018, a sharp 25% decrease in planted area was
reported according to MADR.

FINAL REPORT
II. Impact Analysis
Current understanding of the impact of (CDR) approaches on SDGs 246
Figure 63: Historical Vegetables, Legumes and Tubers Planted Area in Colombia
Source: Evaluaciones Agropecuarias Municipales EVA 2007-2018 from MADR
As for 2020, there is no large-scale biochar project implemented nor planned to be developed in
Colombia.
B) Impact assessment
For the purpose of this study the fruit tree area will be considered for potential large-scale
biochar deployment.
Under the current study, three scenarios were elaborated:
Baseline Scenario: No biochar (business as usual)
Scenario 1: Biochar application on up to 25% of fruit tree planted area with pellets of 10%
biochar mix
Scenario 2: Biochar application on up to 60% of fruit tree planted area with pellets of 50%
biochar mix
The fruit tree planted area was forecasted to grow at its historical 2.8% (CAGR 2007-2018) over
the period 2020-2030, then decreasing it pace to 2.0% annual for the period 2031-2040 and 1.0%
annual for the period 2041-2050.
Considering the aforementioned assumption on the percentage of the fruit tree planted area with
biochar application of up to 25% and up to 60% in the Scenario 1 and Scenario respectively, the
following figure exhibits that estimated area for biochar application for the period 2020-2050 in
Colombia. An assumption of 5 ton per ha per year dose of organic-mineral fertilizers in the form
of pellets was taken. In Scenario 1 those pellets present a 10% biochar mix while in Scenario 2
the mix increases to 50% biochar. The change in the slope of the area with biochar application,

FINAL REPORT
II. Impact Analysis
Current understanding of the impact of (CDR) approaches on SDGs 247
reflects both the fruit tree planted area assumptions over time and the curve of adoption of
biochar within that area over time.
Figure 64: Scenarios of forecasted Biochar application area in Colombia (2020-2050)
Source: Own elaboration
The production of Biochar is made from biomass by pyrolysis which is an exothermic process. The
energy released can be partially used (aproximately 30% of the total energy) in the processing
plant or nearby facilities. This production characteristic makes it attractive to be installed in
industrial parks where energy use is more demanded. The production of a ton of Biochar, from 4
ton of dry base biomass, allows generation of about 5 MW of energy.

FINAL REPORT
II. Impact Analysis
Current understanding of the impact of (CDR) approaches on SDGs 248
The estimated investment to produce biochar for agricultural purposes varies depending on the
type and quality of biochar to be produced. For example, “pure” biochar, or in combination with
composting of organic waste, also know as “organic-mineral” fertilizers (with a certain mix of
biochar). The installation of a 1,000 ton/year biochar production plant requires an approximate
investment (CAPEX) of 600,000 USD. If the objective is to produce an organic-mineral pellet from
biochar and compost, an additional investment of 400,000 USD is required for composting and
pelleting processes, therefore totalizing 1,000,000 USD per 1,000 ton/year facility33. A curve with
efficiences in investment over time for scenarios 1 and 2 was assumpted due to sinergies of
increased activity, technology maturity and development of the value chain. Scenarios 1 and 2
would add aproximately 215 and 1,700 million dollars investments respectively for the period
2020-2050.
Table 52: Investment by scenario for Biochar in Colombia
Scenario Total Investment
2020-2050
MM USD
Average Annual
Investment
MM USD / year
1 216 7
2 1,700 58
Source: Own elaboration
Regarding employment, it is estimated that a 1,000 ton per year biochar plant would generate 4
direct jobs, resulting in approximate 1,000 jobs by year 2050 in Scenario 1 (equivalent to 2 directs
jobs per thousand hectares of biochar application) and over 11,000 jobs by 2050 in Scenario 2
(equivalent to 10 directs jobs per thousand hectares of biochar application)34. Jobs generated
during biochar application on plantations could not be quantified due to lack of information.
Although the “organic-mineral” fertilizer is mostly composed of carbon (from compost and
biochar), only a fraction of the Carbon contained in the biochar is considered as “sequestration”.
The Fraction considered as sequestration is defined by IPCC (2019) on its equation 4A.1 and
depends on two factors: the C content of the biochar (Fcp) and and the fraction of Biochar that
remains in the soil after 100 years (Fpermp). Therefore, the increase in soil carbon results from
multiplying the incorporated mass of Biochar by the C content and the permanence factor. The
latter depends on the temperature at which the Biochar was produced. The lowest temperature
of the pyrolysis process is 350 to 450 degrees Celsius and would correspond to the lowest quality
Biochar, whose permanence fraction is 0.65 (Table 4Ap.2, IPCC, 2019). In the current study, the
values adopted for factors Fcp and Fpermp were 0.7 and 0.65, respectively.
33 Biochar plant CAPEX assumptions from interviews with sectorial experts and industry players 34 Biochar plant employment generation assumptions from interviews with sectorial experts and industry players
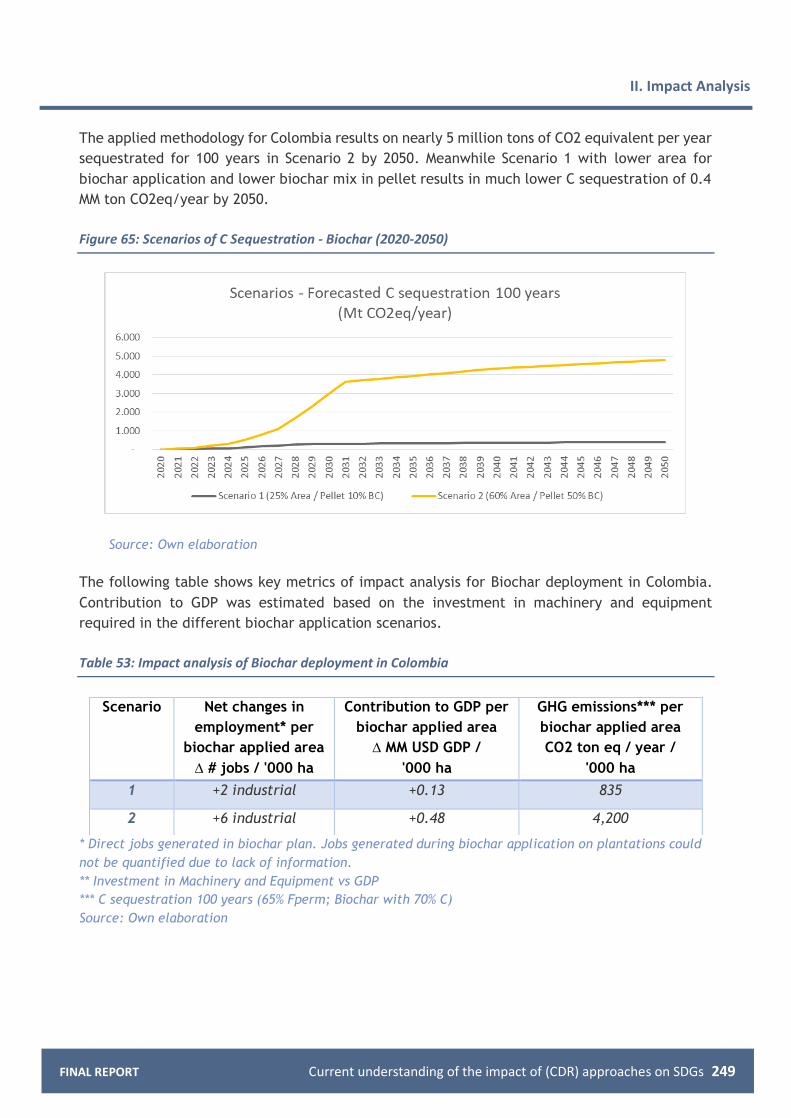
FINAL REPORT
II. Impact Analysis
Current understanding of the impact of (CDR) approaches on SDGs 249
The applied methodology for Colombia results on nearly 5 million tons of CO2 equivalent per year
sequestrated for 100 years in Scenario 2 by 2050. Meanwhile Scenario 1 with lower area for
biochar application and lower biochar mix in pellet results in much lower C sequestration of 0.4
MM ton CO2eq/year by 2050.
Figure 65: Scenarios of C Sequestration - Biochar (2020-2050)
Source: Own elaboration
The following table shows key metrics of impact analysis for Biochar deployment in Colombia.
Contribution to GDP was estimated based on the investment in machinery and equipment
required in the different biochar application scenarios.
Table 53: Impact analysis of Biochar deployment in Colombia
* Direct jobs generated in biochar plan. Jobs generated during biochar application on plantations could
not be quantified due to lack of information.
** Investment in Machinery and Equipment vs GDP
*** C sequestration 100 years (65% Fperm; Biochar with 70% C)
Source: Own elaboration
Scenario Net changes in
employment* per
biochar applied area
∆ # jobs / '000 ha
Contribution to GDP per
biochar applied area
∆ MM USD GDP /
'000 ha
GHG emissions*** per
biochar applied area
CO2 ton eq / year /
'000 ha
1 +2 industrial +0.13 835
2 +6 industrial +0.48 4,200

FINAL REPORT
II. Impact Analysis
Current understanding of the impact of (CDR) approaches on SDGs 250
4. Potential Impacts in LAC countries
The following tables summarize the key potential constrains, positive and negative impacts
identified for CDR large-scale deployment in LAC countries.
Afforestation and reforestation
Table 54: Key potential impacts of Afforestation in LAC countries
Source: Own elaboration; Vivid Economics 2020 "An investor guide to negative emission technologies and
the importance of land use"
Key
constraints
• Land competition with other purposes (ex: crop planted area for food
production)
• Water and nutrients requirements
• Lack of financing for long-term investments
• Development of the value chain downstream: wood manufacturing and
pulp and paper industry are CAPEX intensive activities
Key positive
impacts
• Proven and known technology / practices (for implantation and
maintenance), and know how developed along the years in the country
makes it feasible with higher probability than other undeveloped CDR
approaches, that will be extended in the following years
• Women are critical to ensuring the sustainability of forests and forestry
(full contributions of women to forestry have not been realized yet)
• Reduction of poverty levels due to job creation, economic development,
land health improvement
• Economic development and growth
• Direct and indirects jobs for forestry and wood extraction
• Potential direct and indirect jobs in wood manufacturing and pulp and
paper industries
• Potential development of wood related industries: construction and
furniture (value-added products and responsible production and
consumption)
• Affordable and clean energy provision taking advantage of forestry
residues
Key negative
impacts and
risks
• Impacts on food supply and land tenure
• Bioversity (depending on the species to be planted)
• NOX emissions from nitrogen fertilizers
• Changes in evapotranspiration, albedo and cloud cover
• Water scarcity

FINAL REPORT
II. Impact Analysis
Current understanding of the impact of (CDR) approaches on SDGs 251
Bioenergy with carbon capture and storage (BECCS)
Table 55: Key potential impacts of BECCS in LAC countries
Source: Own elaboration; Vivid Economics 2020 "An investor guide to negative emission technologies and
the importance of land use"
Key
constraints
• Land availability/ competition
• Biomass feedstock availability
• CO2 storage availability (technical feasibility) and CO2 storage
infrastructure investment (economic feasibility)
• CO2 transportation infrastructure
• Poor knowledge and development of CCS phase (and therefore related
technological challenges)
Key positive
impacts
• Clean energy supply that increases power autonomy and security in the
energy supply
• Direct and permanent jobs generated in BECCS plants operation.
• Jobs created for BECCS plants constructions and Indirects jobs related
• Health improvement related to clean energy and forestry requirements
• Know how and technical capabilities to be developed
• Potential development of related industries
Key
negative
impacts and
risks
• Supply chain and land-use change (LUC) emissions
• Water scarcity
• Soil depletion
• Pollution due to fertiliser use
• Risk of CO2 leaks during transportation and/or storage
• Impacts on food supply and land tenure
• In case of wood biomass, lost C sequestration of harvested forest
• Impact on country's power generation cost curve (in case of large-scale
adoption and significant share in the power generation matrix due to
higher costs per MWh than other sources - ex: hydro-)

FINAL REPORT
II. Impact Analysis
Current understanding of the impact of (CDR) approaches on SDGs 252
Enhancing soil carbon content with biochar
Table 56: Key potential impacts of Biochar in LAC countries
Source: Own elaboration; Vivid Economics 2020 "An investor guide to negative emission technologies and
the importance of land use"
Key
constraints
• Availability of biomass for biochar production (competition with other
uses of biomass)
• Logistic constrains: Trade-off distance from raw material (biomass) vs
distance to plantations where to be applied
• Technological challenges for the development, construction and
operation of biochar plants in Argentina
• Lack of long-term financing alternatives for biochar plant CAPEX
Key positive
impacts
• Enhanced soil properties and therefore increasing yields (responsible
production and consumption). Potential increase in fruit tree yields (to
be confirmed by further research), expanding food supply
• Technological know how for the development, construction and
operation of biochar plants
• Long-term C sequestration in soil
• Lower N2O and CH4 emmisions
• Higher soil water balance's
• Potential expansion for biochar application on other crops beyond
intensive crops as fruit trees (ex: vegetables, legumes and tubers)
• Biochar pyrolysis is an exotermic process which can be utilized for power
generation
• Other valuable co-products including wood flavoring and adhesives can
also be obtained as a byproduct of biochar (Czernik and Bridgwater,
2004)
• Direct and permanent jobs generated in biochar plants operation.
• Jobs created for biochar plants constructions.
• Jobs created for biochar application in plantations. Indirects jobs related
Key negative
impacts and
risks
• Logistics costs and environmental impacts of raw material and biochar
transportation
• Lower albedo and radiative forcing
FINAL REPORT
II. Impact Analysis
Current understanding of the impact of (CDR) approaches on SDGs 253
5. Limitations of the analysis
The impact analysis face certain challenges that might impact in terms of its accuracy and
certainty:
Large-scale CDR deployments are a novel field of research and project implementation in
Argentina, Colombia and the other Latin America countries (and, to certain extent,
globally)
Despite some knowledge gained in the technical aspects of CDR approaches, the
understanding of their large-scale deployment impacts in the economy and at the societal
level is at least scarce; moreover, the quantification of the magnitude of those impacts is
still largely incipient.
Impact analysis is estimated based on
o historical statistics with their level of accuracy depending on data collection (not
always on an annual basis) and levels of informality in the Argentine and Colombian
economies
o long-term scenario definitions that inherently present uncertainties
Over the long-term, new breakthrough technologies not yet fully developed today would
significantly impact scenarios conceived for this study
Investment and operating costs may see significant decreases, as each technology is
massively deployed
Comparison between countries can be affected by differences in statistical bases
Accurate assessment of relative risk in between different technologies is not yet possible
but should also be weighed against the risks that alternative options, including following
current trajectories, would pose to successful SDG delivery.
The relative level of potential effects identified may also be a function of the current
quantity or level of maturity of the literature available, plans and projects assessed
throughout the report.
There are large uncertainties resulting from incomplete knowledge, from the complexity
of the ecosystems involved and due to interactions in between different combinations of
options implemented.

FINAL REPORT
III. References
Current understanding of the impact of (CDR) approaches on SDGs 254
III. References
Abdalla, M., Hastings, A., Chadwick, D. R., Jones, D. L., Evans, C. D., Jones, M. B., Rees, R. M., & Smith, P. (2018). Critical review of the impacts of grazing intensity on soil organic carbon storage and other soil quality indicators in extensively managed grasslands. Agriculture Ecosystems & Environment, 253, 62-81. https://doi.org/10.1016/j.agee.2017.10.023
Actualización de Colombia a la Convención Marco de las Naciones Unidas para el Cambio Climático (CMNUCC). IDEAM, PNUD, MADS, DNP, CANCILLERÍA, FMAM. Bogotá D.C., Colombia.
Africano, K., Cely, G. & Serrano, P. 2016. Potential CO2 Capture Associated with Edaphic Component in Moorlands Guantiva-La Rusia, Department of Boyacá, Colombia. Perspectiva Geográfica, 21(1), 91-110.
Aleman-Nava, G.S ; A. Meneses-Jacome, D.L. Cardenas-Chavez, R. Díaz-Chavez, N. Scarlat, J.-F. Dallemand, N. Ornelas-Soto, R. García-Arrazola, R. Parra,Bioenergy in Mexico: status and perspective, Biofuels, Bioprod. Biorefining. 9 (2015) 8e20, https://doi.org/10.1002/bbb.1523.
Allen, M.R., O.P. Dube, W. Solecki, F. Aragón-Durand, W. Cramer, S. Humphreys, M. Kainuma, J. Kala, N. Mahowald, Y. Mulugetta, R. Perez, M.Wairiu, and K. Zickfeld, 2018: Framing and Context. In: Global Warming of 1.5°C. An IPCC Special Report on the impacts of global warming of 1.5°C above pre-industrial levels and related global greenhouse gas emission pathways, in the context of strengthening the global response to the threat of climate change, sustainable development, and efforts to eradicate poverty [Masson-Delmotte, V., P. Zhai, H.-O. Pörtner, D. Roberts, J. Skea, P.R. Shukla, A. Pirani, W. Moufouma-Okia, C. P√©an, R. Pidcock, S. Connors, J.B.R. Matthews, Y. Chen, X. Zhou, M.I. Gomis, E. Lonnoy, T. Maycock, M. Tignor, and T. Waterfield (eds.)].
Alonso-Gómez, L.; Cruz-Dominguez, A.; Jiménez-Madrid, D.; Ocampo-Duran, Á.; Parra-González, S. 2016. Biochar como enmienda en un oxisol y su efecto en el crecimiento de Maize. Rev. U.D.C.A Act. & Div. Cient. 19(2): 341-349.
Altamirano, Gerardo & Rico, Brenda & Cruz, Manuel & Rindermann, Rita & Hernández, Sergio & Baeza, Jesús & Rosa, Eduardo & Reyes, Ulises & Hernández, Alexander. (2014). Intensification of production in organic agriculture: coffee case. 5. 163-169. Alvarez C., C.R. Alvarez, A. Constantini, M. Basanta. 2014. Carbon and nitrogen sequestration in soils under different management in the semi-arid Pampa (Argentina) Soil Tillage Research 142 (2014) 25–3126
Alvarez C., C.R. Alvarez, A. Constantini, M. Basanta. 2014. Carbon and nitrogen sequestration in soils under different management in the semi-arid Pampa (Argentina) Soil Tillage Research 142 (2014) 25–3126
Alvarez, C.R., R. Alvarez, M.S. Grigera, and R.S. Lavado. 1998a. Associations between organic matter fractions and the active soil microbial biomass. Soil Biol. Biochem. 30:767-773.
Alvarez, R., M.E. Russo, P. Prystupa, J.D. Scheirer, and L. Blotta. 1998b. Soil carbon pools under conventional and no-tillage systems in the Argentine Rolling Pampa. Agron. J. 90:138-143.
Alvarez, R., O.J. Santanatoglia, and R. Garcia. 1995c. Soil respiration and carbon inputs from crops in a wheat-soyabean rotation under different tillage systems. Soil Use Manage. 11:45-50.
Alvarez, R., O.J. Santanatoglia, P.E. Daniel, and R. Garcia. 1995b. Respiration and specific activity of soil microbial biomass under conventional and reduced tillage. Pesqui. Agropecu. Bras. 30:701-709.
Alvarez, R., R.A. Diaz, N. Barbero, O.J. Santanatoglia, and L. Blotta. 1995a. Soil organic carbon, microbial biomass and CO2-C production from three tillage systems. Soil Tillage Res. 33:17-28.

FINAL REPORT
III. References
Current understanding of the impact of (CDR) approaches on SDGs 255
Alzate-Arias, S.; Jaramillo-Duque, Á.; Villada, F.; Restrepo-Cuestas, B. Assessment of Government Incentives for Energy from Waste in Colombia. Sustainability 2018, 10, 1294
Alzate, S., et al. 2019. Municipal Solid Waste as a Source of Electric Power Generation in Colombia: A Techno-Economic Evaluation under Different Scenarios.
Ambiente Energia, Mato Grosso do Sul tera termeletrica que funcionara com biomassa de eucalipto, Biomassa e Bioenergia, 2018, p. 1. https://www.biomassabioenergia.com.br/imprensa/mato-grosso-do-sul-teratermeletrica-que-funcionara-com-biomassa-de-eucalipto/20180205-100014-K995. accessed August 20, 2018
Araujo, P I et al, 2015. A shady business: pine afforestation alters the primary controls on litter decomposition along a precipitation gradient in Patagonia. Argentina Journal of Ecology, 103, 1408–1420
Arzuaga S. A. 2016. Carbon and Nitrogen stocks and stratification ratios in oxisols under forest systems. Ciencia y Suelo (ARGENTINA) 34(1): 13-20.
Asensio Cenice, et al. 2019. Installation of a plant for the production of electrical energy from biogas from sanitary landfill. ITBA
Bárcena y otros, La emergencia del cambio climático en América Latina y el Caribe: ¿seguimos esperando la catástrofe o pasamos a la acción?, Libros de la CEPAL, N° 160 (LC/PUB.2019/23-P), Santiago, Comisión Económica para América Latina y el Caribe (CEPAL), 2020.
Bare, M C et al. 2015. Growth of native tree species planted in montane reforestation projects in the Colombian and Ecuadorian Andes differs among site and species". Springer Science Business Media Dordrecht.
Barrionuevo S. A. et al. 2015. Estimating the CO2 fixed by a stand of Pinus halepensis (Miller) in Santiago del Estero, Argentina. Foresta Veracruzana 17(1):27-32.
Batlle-Bayer L, Batjes NH, Bindraban PS (2010) Changes in organic carbon stocks upon land use conversion in the Brazilian Cerrado: a review. Agriculture, Ecosystems & Environment, 137, 47–58.
Berger, M. 2020. Impact of the application of biochar on microbial communities in agricultural soil subject to different levels of nitrogen fertilization. Universidad Nacional de Cordoba.
Berhongaray, G., Alvarez, R., Paepe De, J., Caride, C., Cantet, R., 2013. Land use effects on soil carbon in the Argentine Pampas. Geoderma 192, 97–110.
Bernal B., Sidman, G. and Pearson, T. (2017). Assessment of mangrove ecosystems in Colombia and their potential for emissions reductions and restauration. Winrock International. 29 pp.
Berthrong ST, Pin˜ eiro G, Jobbagy EG, Jackson RB (2012) Changes in soil carbon and nitrogen with afforestation of grasslands across gradients of precipitation and plantation age. Ecological Applications, 22, 76–86.
Berthrong, S T et al. 2012. Soil C and N changes with afforestation of grasslands across gradients of precipitation and plantation age; Ecological Applications 22(1).
Bayraktarov, Elisa & Saunders, Megan & Abdullah, S. & Mills, Morena & Beher, Jutta & Possingham, Hugh & Mumby, Peter & Lovelock, Catherine. (2016). The cost and feasibility of marine coastal restoration. 26. 1055-1074. 10.5061/dryad.rc0jn.
Betzabet, M., et al. 2017. Waste Energy: Assessment of biogas production in Argentina from co-digestion of sludge and municipal solid waste. Universidad Nacional del Litoral-CONICET
Betzabet, M., et al. 2020. Renewable Energy: Optimal process design for integrated municipal waste management with energy recovery in Argentina. INTEC (UNL-CONICET).
Beuttler, C., Charles, L., and Wurzbacher, J. (2019). The role of direct air capture in mitigation of anthropogenic greenhouse gas emissions. Front. Clim. 1:10
FINAL REPORT
III. References
Current understanding of the impact of (CDR) approaches on SDGs 256
Bianchi, A. A et al. 2010. Trapping CO2 in the Patagonian sea. Ciencia Hoy, Vol 20 núm 119
Biochar from Acai agroindustry waste: Study of pyrolysis conditions Keisuke Sato, M. 2019. Waste management 96 158-167.
Blanco-Libreros, Juan F., & Álvarez-León, Ricardo. (2019). Mangroves of Colombia revisited in an era of open data, global changes, and socio-political transition: Homage to Heliodoro Sánchez-Páez. Revista de la Academia Colombiana de Ciencias Exactas, Físicas y Naturales, 43(166), 84-97. https://dx.doi.org/10.18257/raccefyn.780
Bonelli, P & Ramos, M & Buonomo, E & Cukierman, A. (2020). Potentialities of the Biochar Generated from Raw and Acid Pre-Treated Sugarcane Agricultural Wastes. Rodriguez Ortiz L., et al. 2020.
Bonilla et al. 2017. Factores de emision del sistema interconectado nacional Colombia-SIN. UPME, 2017.
C.S. Bioenergia, CS Bioenergia recebe autorizaç~ao para operar a primeira usina de geraç~ao de energia com resíduos org^anicos, 2019.
C2G (2018). Honegger, M.; Derwent, H.; Harrison, N.; Michaelowa, A. and Schäfer, S. Carbon Removal and Solar Geoengineering:
Cabrera Chamorro, G., Mosquera González, J., Ordoñez Jurado, H., Muñoz Guerrero, D., & Ballesteros Possu, W. (2007). Estimación de la biomasa aérea y captura de carbono en árboles dispersos en potreros con motilón silvestre (Freziera canescens) en el municipio de Pasto Nariño - Colombia. Revista De Ciencias Agrícolas, 24(1 y 2), 46-55. Retrieved from https://revistas.udenar.edu.co/index.php/rfacia/article/view/88
Cabrerizo, M. J. et al. 2018. Increased nutrients from aeolian‐dust and riverine origin decrease the CO2‐sink capacity of coastal South Atlantic waters under UVR exposure. Limnology and Oceanography, Vol 63 Issue 3; 1191-1203.
Castelao Caruana, Maria. (2018). Organizational and economic modeling of an anaerobic digestion system to treat cattle manure and produce electrical energy in Argentina´s feedlot sector. Journal of Cleaner Production. 208. 10.1016/j.jclepro.2018.10.133.
Castellanos-Galindo et al. (2020). Mangrove research in Colombia: Temporal trends, geographical coverage and research gaps. Estuarine, Coastal and Shelf Science. Elsevier.
CEPAL, Energy Efficiency in Central America: Progress and Action towards the Fulfillment of the Goals of the Central American Sustainable Energy Strategy, 2014.
Cerri CC, Volkoff B, Andreaux F (1991) Nature and behaviour of organic matter in soils under natural forest, and after deforestation, burning and cultivation, near Manaus. Forest Ecology and Management, 38, 247–257.
Chagas, C.I., O.J. Santanatoglia, and M.G. Castiglioni. 1995. Tillage and cropping effects on selected properties of an Argiudoll in Argentina. Commun. Soil Sci. Plant Anal. 26:643-655.
Chalco Vera, J. E. 2018. Greenhouse gas emissions in sugar cane in Tucumán, Argentina: incidence of the burning of the stubble and nitrogen fertilization. Doctoral thesis Biological Sciences, Faculty of Agronomy and Zootechnics Universidad Nacional de Tucuman.
Chemes, E. D. 2019. Generation of bioenergy from residual biomass in feedlot. Final Integrative Project to qualify for the Higher Academic Degree of Bioenergetic Engineering Specialist. Universidad Tecnologica Nacional, Facultad Regional Tucuman.
Ciais, P., C. Sabine, G. Bala, L. Bopp, V. Brovkin, J. Canadell, A. Chhabra, R. DeFries, J. Galloway, M. Heimann, C. Jones, C. Le Quéré, R.B. Myneni, S. Piao and P. Thornton, 2013: Carbon and Other Biogeochemical Cycles. In: Climate Change 2013: The Physical Science Basis. Contribution of Working Group I to the Fifth Assessment Report of the Intergovernmental Panel

FINAL REPORT
III. References
Current understanding of the impact of (CDR) approaches on SDGs 257
on Climate Change [Stocker, T.F., D. Qin, G.-K. Plattner, M. Tignor, S.K. Allen, J. Boschung, A. Nauels, Y. Xia, V. Bex and P.M. Midgley (eds.)]. Cambridge University Press, Cambridge, United Kingdom and New York, NY, USA. IPCC 2013.
Colmenares-Quintero, R. Rico-Cruz, C; Kim E. Stansfield & Juan Carlos Colmenares-Quintero | Yibing Li (Reviewing editor) (2020) Assessment of biofuels production in Colombia, Cogent Engineering, 7:1, DOI: 10.1080/23311916.2020.1740041
Coproema. 2010. Plan de desarrollo para las fuentes no convencionales de energía en Colombia (PDFNCE). UPME. Botogá, 2010.
Dantas; G.A., L.F.L. Legey, A. Mazzone, Energy from sugarcane bagasse in Brazil: an assessment of the productivity and cost of different technological routes, Renew. Sustain. Energy
de Coninck, H., A. Revi, M. Babiker, P. Bertoldi, M. Buckeridge, A. Cartwright, W. Dong, J. Ford, S. Fuss, J.-C. Hourcade, D. Ley, R. Mechler, P. Newman, A. Revokatova, S. Schultz, L. Steg, and T. Sugiyama, 2018: Strengthening and Implementing the Global Response. In: Global Warming of 1.5°C. An IPCC Special Report on the impacts of global warming of 1.5°C above pre-industrial levels and related global greenhouse gas emission pathways, in the context of strengthening the global response to the threat of climate change, sustainable development, and efforts to eradicate poverty [MassonDelmotte,V., P. Zhai, H.-O. Pörtner, D. Roberts, J. Skea, P.R. Shukla, A. Pirani, W. Moufouma-Okia, C. Péan, R. Pidcock, S. Connors, J.B.R. Matthews, Y. Chen, X. Zhou, M.I. Gomis, E. Lonnoy, T. Maycock, M. Tignor, and T. Waterfield (eds.)]
De Paz, M et al. 2019. Review of revegetation experiences for the purpose of restoration in forests of Argentina; Ecología Austral, 29:194-207.
De Souza, N.M; M. Horttanainen, J. Antonelli, O. Klaus, C.A. Lindino, C.E.C. Nogueira, Technical potential of electricity production from municipal solid waste disposed in the biggest cities in Brazil: landfill gas, biogas and thermal treatment, Waste Manag. Res. 32 (2014) 1015e1023, https://doi.org/10.1177/0734242X14552553.
Delgado Gomez, E. et al. 2016. Development of adsorbent to capure CO2 from an agroindustrial waste. Acta de la XXXIX Reunión de Trabajo de la Asociación Argentina de Energías Renovables y Medio Ambiente Vol. 4, pp. 09.19-09.28.
Desjardins T, Barros E, Sarrazin M, Girardin C, Mariotti A (2004) Effects of forest conversion to pasture on soil carbon content and dynamics in Brazilian Amazonia. Agriculture, Ecosystems & Environment, 103, 365–373.
Diaz-Zorita, M. 1999. Six years of tillage in a Hapludoll from the Northwestern of Buenos Aires, Argentina. Cienc. Suelo 17:31-36.
Diaz-Zorita, M., M. Barraco, and C. Alvarez. 2004. Effects of twelve years of tillage practices on a Hapludoll from the Northwetern of Buenos Aires Province, Argentina. Cienc. Suelo 22:11-17.
Diaz, C.,-Mendoza, L. Ayola -Mendoza, Y. Morelo -Gonzalez, I. Díaz –Gómez, Y-Burgos -Alarcón, y J. Bethsaid Pedroza -Rojas, “Carácterización de la especie Chrysobalanus Icaco como alternativa de reforestación para mitigar procesos de erosión costera. Estudio de caso sostenibilidad ambiental de la especie en el departamento de Bolívar-Colombia”, Investigación e Innovación en Ingenierías, vol. 7, n°. 1, 2019. DOI: https://doi.org/10.17081/in-vinno.7.1.3129
Dominchin, M. F., et al. 2019. Effect of poultry biochar on chemical and microbiological properties in a typical haplustol soil under different land-use intensities
Dominguez, G.F., G.V. Garcia; G.A Studdert; , M.A. Agostini, S.N. Tourn, M.N. Domingo. 2016. Is anaerobic mineralizable nitrogen suitable as soil quality/health indicator? Spanish J. Soil Sci. 6:82-97

FINAL REPORT
III. References
Current understanding of the impact of (CDR) approaches on SDGs 258
Eclesia RP, Jobbagy EG, Jackson RB, Biganzoli F, Piñeiro G (2012) Shifts in soil organic carbon for plantation and pasture establishment in native forests and grasslands of South America. Glob Chang Biol 18(10):3237–3251
Edenhofer, O., Knopf, B., Barker, T., Baumstark, L., Bellevrat, E., Chateau, B., Criqui, P., Isaac, M., Kitous, A., Kypreos, S., Leimbach, M., Lessmann, K., Magne, B., Scrieciu, S., Turton, H., van Vuuren, D. P. (2010). The Economics of Low Stabilization: Model Comparison of Mitigation Strategies and Costs. The Energy Journal 31(1).
Edwards David P., Lim Felix, James Rachael H., Pearce Christopher R., Scholes Julie, Freckleton Robert P. and Beerling David J. 2017. Climate change mitigation: potential benefits and pitfalls of enhanced rock weathering in tropical agricultureBiol. Lett.1320160715
Etter, A. et al. 2000. Andean Forests and Farming Systems in part of the Eastern Cordillera (Colombia). Mountain Research and Development, 20(3):236-245.
European Commission (2019). Identification and Analysis of Promising Carbon Capture and Utilisation Technologies, Including Their Regulatory Aspects. Brussels: European Commission.
Evert T, et al. The importance of species selection and see sourcing in forest restoration for enhancing adaptive capacity to climate change: Colombian Tropical Dry Forest as a model." CDB Technical series Nro 89.
Eykelbosh, Angela & Johnson, Mark & Couto, Eduardo. (2015). Biochar decreases dissolved organic carbon but not nitrate leaching in relation to vinasse application in a Brazilian sugarcane soil. Journal of Environmental Management. 149. 9-16. 10.1016/j.jenvman.2014.09.033.
Fabrizzi, K.P., A. Moron, and F.O. Garcia. 2003. Soil carbon and nitrogen organic fractions in degraded vs. non-degraded Mollisols in Argentina. Soil Sci. Soc. Am. J. 67:1831-1841.
Falasca S. et al. 2011. Forestations with paradise (Melia Azedarach L.) as a mitigating climate change species in Argentina. III International Congress on climate change and sustainable development. CONICET.
Falasca S. et al. 2011. The introduction of the cultivation of oil carob (Pngamia pinnata) promising species to deal with climate change. III International Congress on climate change and sustainable development. CONICET.
Falasca, S. et al. 2011. Agroclimatic aptitude of the arid and semi-arid areas in Argentina for the cultivation with prickly pear (Opuntia ficus indica) as bioetanol source. Quebracho, Vol 19(1,2):66-74.
FAJARDY, M. et al. 2019. BECCS deployment: a reality check. Imperial College, London. Grantham Institute Briefing paper No 28, 2019.
FAO. 2007. The world’s mangroves 1980–2005. Work. Pap. FRA 153, FAO, Rome, Italy
FAO. 2020. Actualización del balance de biomasa con fines energéticos en la Argentina. Colección Documentos Técnicos N.° 19. Buenos Aires. https://doi.org/10.4060/ca8764es.
FAO, 2020. Valorization of externalities of projects with dry biomass and biogas. Collections of technicals reports nr 12. Buenos Aires. https://doi.org/10.4060/ca8761esFermanelli, C. S. 2018. Waste recovery treatments from the agri-food industry in the Middle North Pampean Region. Universidad Tecnologica Nacional, Tesis para Magíster en Ingeniería Ambiental, Cordoba.
FAO. 2020. Global Forest Resources Assessment 2020: Main report. Rome. https://doi.org/10.4060/ca9825en
Fernandez, A.; Saffe, A. Pereyra, R.; G. Mazza, R. Rodriguez, Kinetic study of regional agro-industrial wastes pyrolysis using non-isothermal tga analysis, Applied Thermal Engineering (2016), doi: http://dx.doi.org/10.1016/j.applthermaleng.2016.06.084

FINAL REPORT
III. References
Current understanding of the impact of (CDR) approaches on SDGs 259
Ferreras, L.A., J.L. Costa, F.O. Garcia, and C. Pecorari. 2000. Effect of no-tillage on some soil physical properties of a structural degraded Petrocalcic Paleudoll of the southern "Pampa" of Argentina. Soil Tillage Res. 54:31-39.
Fiallos Ortega, L. R, et al. 2015. Soil ecological restoration apllying biochar (charcoal) and its effects on the Medicago sativa production. Ciencia y Agricultura (Rev Cien Agri) Vol. 12 ( 2). ISSN 0122-8420 pp. 13-20
First Biennial Update Report Colombia (2015)
Gaitan-Espitia J D 2011 Metabolic rates and primary productivity of the marine macroalgae Dictyopteris delicatulain Taganga Bay, Colombian Caribbean Rev. Biol. Mar. Oceanogr. 4673–7
Galan Riveros, X. F. 2016. Energy potential of agricultural residual biomass in Colombia. Thesis for the title of Specialist in Environmental management. Faculty of Permanent and advanced Education. Bogota.
Galantini, J.A., J.O. Iglesias, L. Cutini, H.R. Kruger, and S. Venanzi. 2006 Tillage Systems in the SW of Buenos Aires province. Long term effect on soil organic fractions and porosity. Rev. Investigaciones Agropecuarias, RIA, 35 (1): 15-30
Gallo-Saravia M., Lug-Sierra L., Barrera-Zapata R. 2018. Evaluation of biochar as substrate alternative in tomato cultives. Scientia et Technica Año XXIII, Vol. 23, No. 02, junio de 2018. Universidad Tecnológica de Pereira. ISSN 0122-1701
Garay Schiebelbein, M M. 2015. Carbon sequestering and vertical pattern of chemical properties in forested molisols with Pinus radiata; Doctoral thesis in Agronomy, Universidad Nacional del Sur.
Garfí, M.; J. Martí-Herrero, A. Garwood, I. Ferrer, Household anaerobic digesters for biogas production in Latin America: a review, Renew. Sustain. Energy Rev. 60 (2016) 599e614, https://doi.org/10.1016/j.rser.2016.01.071.
Garzón E., M. (2010). Biocarbón de estípites de palma de aceite: una alternativa para el aprovechamiento de la biomasa y el mejoramiento de la calidad del suelo en fase de renovación. Revista Palmas, 31(especial,), 265-277. Recuperado a partir de https://publicaciones.fedepalma.org/index.php/palmas/article/view/1532
Garzón E., M. (2010). Biochar from oil palm trunks: an alternative use of biomass and improvement of soil quality during the renovation stage. Cenipalma. Vol. 31 No. Especial, Tomo I, 2010 P
Giraldo, A. et al. 2018. Carbon capture and flow in a silvopastoral system of the Colombian Andean zone." Archivos Latinoamericanos de Produccion Animal. Vol 16, número 4: 241-245.
Giri, C. E., L. Ochieng, L. L. Tieszen, Z. Zhu, A. Singh, T. Loveland, J. Masek, and N. Duke. 2011. Status and distribution of mangrove forests of the world using Earth observation satellite data. Global Ecology and Biogeography 20:154–159.
Giubergia J.P,E. Martellotto,R.S. Lavado. 2013. Complementary irrigation and direct drilling have little effect on soil organic carbon content in semiarid Argentina. Soil & Tillage Research (134) 147–152
Goicoa, V., 2016. Technical Report: ‘‘Relevamiento nacional de plantas de biogás” 15° Curso Internacional de agricultura y ganadería de precisión con agregado de valor en origen. INTA: <http://inta.gob.ar/documentos/relevamiento-nacionalde-plantas-de-biogas> (accessed 21.11.16).
Gomez, A. Colombian Policies Will Slow Ethanol Imports - Further Blending Increases Will Incentivize Production. USDA. GAIN Report Number:CO1907. 2019

FINAL REPORT
III. References
Current understanding of the impact of (CDR) approaches on SDGs 260
Gomez, E. A.et al. 2012. Wood, Potencial Lignocellulosic Material for the Production of Biofuels in Colombia. Inf. tecnol. vol.23 no.6 La Serena.
Gonçalves, F.A.; E.S. Dos Santos, G.R. De Macedo, Use of cultivars of low cost, agroindustrial and urban waste in the production of cellulosic ethanol in Brazil: a proposal to utilization of microdistillery, Renew. Sustain. Energy Rev. 50 (2015) 1287e1303, https://doi.org/10.1016/j.rser.2015.05.047.
Goulart, Mariana & Costa, Pedro & Costa, Alvaro & Miranda, A. & Mendes, Andre & Ebecken, Nelson & Meneghini, Julio & Nishimoto, Kazuo & Assi, Gustavo. (2020). Technology readiness assessment of ultra-deep Salt caverns for carbon capture and storage in Brazil. International Journal of Greenhouse Gas Control. 99. 103083. 10.1016/j.ijggc.2020.103083.
Grasso, M. L. 2020. CO2 capture properties of Li4SiO4 after aging in air at room temperature. Journal of CO2 utilization. 38 232-240.
Groenendijk, J.P. 2005. Towards recovery of native dry forest in the Colombian Andes: a plantation experiment for ecological restoration". Amsterdam: Universiteit van Amsterdam, IBED.
Group of Chief Scientific Advisors [SAM] (2018). Novel carbon capture and utilisation technologies. Brussels: Group of Chief Scientific Advisors [SAM].
Häder DP, Banaszak AT, Villafañe VE, Narvarte MA, González RA, Helbling EW. Anthropogenic pollution of aquatic ecosystems: Emerging problems with global implications. Sci Total Environ. 2020 Apr 15;713:136586. doi: 10.1016/j.scitotenv.2020.136586. Epub 2020 Jan 9. PMID: 31955090.
Hamilton, S. E., and Friess, D. A. (2018). Global carbon stocks and potential emissions due to mangrove deforestation from 2000 to 2012. Nature Climate Change, 8, 240–244.
Henson, Ian E, Ruiz R, Rodrigo, & Romero, Hernán Mauricio. (2012). The greenhouse gas balance of the oil palm industry in Colombia: a preliminary analysis. I. Carbon sequestration and carbon offsets. Agronomía Colombiana, 30(3), 359-369. Retrieved October 22, 2020, from http://www.scielo.org.co/scielo.php?script=sci_arttext&pid=S0120-99652012000300007&lng=en&tlng=en.
Hepburn, C., Adlen, E., Beddington, J., Carter, E. A., Fuss, S., Mac Dowell, N., et al. (2019). The technological and economic prospects for CO 2 utilization and removal. Nature 575, 87–97.
Hess, L J T et al. 2017. Pine afforestation alters rhizosphere effects and soil nutrient turnover across a precipitation gradient in Patagonia, Argentina; Springer International Publishing Switzerland.
Honegger, M., Derwent, H., Harrison, N., Michaelowa, A., & Schäfer, S. (2018). Carbon Removal and Solar Geoengineering: Potential implications for delivery of the Sustainable Development Goals. Carnegie Climate Geoengineering Governance Initiative, May 2018, New York, U.S.
Houghton RA, Nassikas AA (2018) Negative emissions from stopping deforestation and forest degradation, globally. Glob Change Biol 24:350–359.
http://www.scielo.org.co/scielo.php?script=sci_arttext&pid=S0120-99652013000100014&lng=en&tlng=en.
Ianni, E., et al. 2010. Applying the Ecosystem Approach to Select Priority Areas for Forest Landscape Restoration in the Yungas, Northwestern Argentina. Environmental Management 46, 748–760.
IDEAM, PNUD, MADS, DNP, CANCILLERÍA. 2018. Segundo Reporte Bienal
INDAP, GORE, Biogas de residuos agropecuarios en la region de los ríos, 2016.
FINAL REPORT
III. References
Current understanding of the impact of (CDR) approaches on SDGs 261
International Energy Agency (2019). Putting CO2 to Use: Creating Value from Emissions. Paris: International Energy Agency.
International Energy Agency (2020). Special Report on Carbon Capture Utilisation and Storage. CCUS in clean energy transitions. Energy Technologies Perspectives 2020.
International Energy Agency. 2011. Combining Bioenergy with CCS Reporting and Accounting for Negative Emissions under UNFCCC and the Kyoto Protocol. Working Document. OECD/IEA, Paris 2011
INVEMAR, Carbono y Bosques y CVS. 2015. Guía Metodológica para el desarrollo de proyectos tipo REDD+ en ecosistemas de manglar.
INVEMAR, UAESPNN, TNC. Plan de acción para la creación del Subsistema Nacional de áreas marinas
INVEMAR, 2015. Informe del estado de los ambientes y recursos marinos y costeros en Colombia: Año 2014. Serie de Publicaciones Periódicas No. 3. Santa Marta. 176 p.
INVEMAR, 2017. "Basic Restoration And Monitoring Plan For 150 Hectares Of Mangrove In The Management District Integrated Of Cispata, Córdoba"
INVEMAR, 2019. "20 years (1999-2018) of mangrove monitoring in San Andrés and Providencia Islands"
Investe Sao Paulo, Raízen and Geo Energetica announce the construction of a biogas plant supported by Investe Sao Paulo. https://www.en.investe.sp.gov.br/news/post/raizen-and-geo-energetica-announce-the-construction-of-abiogas-plant-supported-by-investe-sao-paulo/, 2018 accessed May 28, 2019.
IPCC, 201). Global Warming of 1.5◦C. An IPCC Special Report on the Impacts of Global Warming of 1.5◦C Above Pre-Industrial Levels and Related Global Greenhouse Gas Emission Pathways, in The Context of Strengthening the Global Response to the Threat of Climate Change, Sustainable Development, and Efforts to Eradicate Poverty. Geneva: IPCC.
IPCC, 2019. 2019 Refinement to the 2006 IPCC Guidelines for National Greenhouse Gas Inventories
IPCC, 2018: Annex I: Glossary [Matthews, J.B.R. (ed.)]. In: Global Warming of 1.5°C. An IPCC Special Report on the impacts of global warming of 1.5°C above pre-industrial levels and related global greenhouse gas emission pathways, in the context of strengthening the global response to the threat of climate change, sustainable development, and efforts to eradicate poverty [Masson-Delmotte, V., P. Zhai, H.-O. Pörtner, D. Roberts, J. Skea, P.R. Shukla, A. Pirani, W. Moufouma-Okia, C. Péan, R. Pidcock, S. Connors, J.B.R. Matthews, Y. Chen, X. Zhou, M.I. Gomis, E. Lonnoy, T. Maycock, M. Tignor, and T. Waterfield (eds.)]. In Press
Junco Corujedo, Sara, March 2020. Catalyst to transform and reuse CO2 and methane
Kahl, Lucía Carolina. 2018. Dinámica del CO2 en el Océano Atlántico Sudoccidental. Tesis Doctoral, Universidad de Buenos Aires. Facultad de Ciencias Exactas y Naturales.
Kauffman et al, 2020. Total ecosystem carbon stocks of mangroves across broad global environmental and physical gradients. Ecological Monographs. Volume90, Issue2. May 2020
Kruger, H.R. 1996. Tillage methods and variation of chemical properties in an Entic Haplustoll. Cienc. Suelo 14:53-55.
Langholtz, M, 2020. The Economic Accessibility of CO2 Sequestration through Bioenergy with Carbon Capture and Storage (BECCS) in the US. Land 2020, 9, 299; doi:10.3390/land9090299.
Lavado, R.S., C.A. Porcelli, and R. Alvarez. 1999. Concentration and distribution of extractable elements in a soil as affected by tillage systems and fertilization. Sci. Total Environ. 232:185-191.

FINAL REPORT
III. References
Current understanding of the impact of (CDR) approaches on SDGs 262
Lefebvre, David & Williams, Adrian & Goglio, Pietro & Manning, David & Azevedo, Antonio & Bergmann, Magda & Meersmans, Jeroen & Smith, Pete. (2019). Assessing the potential of soil carbonation and enhanced weathering to sequester atmospheric CO2, through Life Cycle Assessment: a case study for Sao Paulo State, Brazil. 10.1002/essoar.10500893.1.
Leonardos, O., Theodoro, S. & Assad, M. Remineralization for sustainable agriculture: A tropical perspective from a Brazilian viewpoint. Nutrient Cycling in Agroecosystems 56, 3–9 (2000). https://doi.org/10.1023/A:1009855409700
Lilienfein J, Wilcke W, Vilela L, Ayarza MA, Lima SDC, Zech W (2003) Soil fertility under native cerrado and pasture in the Brazilian Savanna. Soil Science Society of America Journal, 67, 1195–1205.
Lincoln, A.E.; Schaubach, K.. Bioenergy Assessment in the Caribbean. Report on Legal Framework Conditions, 2015.
Lisboa C, Conant R, Haddix M, Cerri C, Cerri C (2009) Soil carbon turnover measurement by physical fractionation at a forest-to-pasture chronosequence in the Brazilian Amazon. Ecosystems, 12, 1212–1221.
Lopez Lauenstein D. et al. 2012. Differences in drought responses of seedlings of Prosopis chilensis, P. flexuosa and interspecific hybrids : implications for reforestation in arid zones. Ecología Austral 22:43-52.
Mac Dowell, N., Fennell, P. S., Shah, N., and Maitland, G. C. (2017). The role of CO2 capture and utilization in mitigating climate change. Nat. Clim. Change 7, 243–249.
Maia Da Costa, A. 2018. Potential of storing gas with high Co2 content in salt caverns built in ultra deep water in Brazil. Greenhouse Gas Sci Technol. 0:1–16
Major J, Rondon M, Molina D, Riha SJ, Lehmann J. Maize yield and nutrition during 4 years after biochar application to a Colombian savanna oxisol. Plant soil. 2010;333(1- 2):117-128. Doi: https://doi.org/10.1007/s11104-010- 0327-0
Manrique S. et al. 2012. Agricultura; crops and their role as reservoirs of carbon and energy sources. Avances en Energías Renovables y Medio Ambiente; Vol. 16.
Manrique, S. et al. 2012. Native Forests: Bioenergy or Carbon Sequestering? Avances en energias renovables y medio ambiente, Vol 16.
Manrique, Silvina Magdalena; Salvo, Aien Weni; Villafañe, Florencia; Martín, José Nicolás; Honorato, Martín Omar; Panorama de Tecnologías de bioenergía en Argentina; Red Iberoamericana de Tecnologías de Biomasa y Bioenergía Rural; 2020; 115-125
Maquere V, Laclau JP, Bernoux M et al. (2008) Influence of land use (savanna, pasture, Eucalyptus plantations) on soil carbon and nitrogen stocks in Brazil. European journal of soil science, 59, 863–877.
Mariño-Martínez, Jorge Eliecer, & Moreno-Reyes, Luisa Epimenia. (2018). Posibilidades de captura y almacenamiento geológico de CO2 (CCS) en Colombia – caso Tauramena (Casanare). Boletín de Geología, 40(1), 109-122. https://dx.doi.org/10.18273/revbol.v40n1-2018007
Marquez, J A et al. 2015. Stream macroinvertebrate communities change with grassland afforestation in central Argentina; Limnologica 53, 17-25.
Mastronardi, L. et al. 2019. Escenarios Energéticos Argentina 2030, 2019 edition. Secretaria de Gobierno de Energía, Republica Argentina. Buenos Aires, 2011.
McKee, K., Cahoun, D. and Feller, I. (2007). Caribbean mangroves adjust to rising sea level through biotic controls on soil elevation change.
Mcleod et al. (2011). A blueprint for blue carbon: toward an improved understanding of the role of vegetated coastal habitats in sequestering CO2.

FINAL REPORT
III. References
Current understanding of the impact of (CDR) approaches on SDGs 263
Milesi Delave, L.A., et al. Miscanthus x giganteus and Aspidosperma quebracho-blanco as feedstock sources for biochar production in Argentina. ENCONTRO BRASILEIRO DE SUBSTÂNCIAS HÚMICAS, 11., 2015, São Carlos.
Milesi Delaye, L. A., et al. 2020. Biochar application in a degraded soil under sweet-potato production. Effect on edaphic properties.Ciencia del Suelo, Vol 38 (1) 149-161.
Milesi Delaye, L.A., Irizar, A.B., A. Andriulo and B.Mary. 2013. Effect of Continuous Agriculture of Grassland Soils of the Argentine Rolling Pampa on Soil Organic Carbon and Nitrogen. Applied and Environmental Soil Science.Volume 2013, Article ID 487865, 17 pages. http://dx.doi.org/10.1155/2013/487865
Milesi Delaye, L.A., Irizar, A.B., A. Andriulo and B.Mary. 2013. Effect of Continuous Agriculture of Grassland Soils of
Miltner, B.C., Coomes, O.T. Indigenous innovation incorporates biochar into swidden-fallow agroforestry systems in Amazonian Peru. Agroforest Syst 89, 409–420 (2015). https://doi.org/10.1007/s10457-014-9775-5
MINAMBIENTE (2015). Plan Nacional de Restauración: Recuperación Ecológica, Rehabilitación y Recuperación de Áreas Disturbadas. Santa Fe de Bogotá D.C., Colombia.
Ministerio de Ambiente y Desarrollo Sustentable, Presidencia de la Nación (2016). Republica Argentina – Primera Revisión de su Contribución Determinada a Nivel Nacional.
Montenegro, A. M. 2008. Characterization of High Andean forest edges and implications for their ecological restoration (Colombia)". Biology department, Universidad Nacional de Colombia.
Montero, Gisela & Stoytcheva, Margarita & Coronado Ortega, Marcos & García, Conrado & Cerezo, Jesús & Toscano, Lydia & León, José. (2015). An Overview of Biodiesel Production in Mexico.
Morero, Betzabet & Campanella, Enrique. (2012). Simulation of the Chemical Absorption Process with Amine Solutions for Biogas Purification. Información tecnológica. 24. 25-32. 10.4067/S0718-07642013000100004
Muegue, L.C.D.; González, J.C.A.; Mesa, G.P. Characterization and Potential Use of Biochar for the Remediation of Coal Mine Waste Containing Efflorescent Salts. Sustainability 2017, 9, 2100.
Naims, H. (2016). Economics of carbon dioxide capture and utilization—a supply and demand perspective. Environ. Sci. Pollut. Res. 23, 22226–22241.
Naims, H. (2020). Economic aspirations connected to innovations in carbon capture and utilization value chains. J. Ind. Ecol. 1–14.
Nates Ocampo, E. 2014. Evaluation of the effect of biochar on the soil and the quality of the fruits in a cape gooseberry crop (uchuva). Pontificia Universidad Javeriana. Tesis de grado para titulo de Biologa, Bogota.
North, M., and Styring, P. (eds) (2019). Carbon Dioxide Utilization. From Fundamentals to Production Processes. Berlin: Walter de Gruyter, GmbH.
Novelli L.E., O.P.Caviglia and G.Piñeiro. 2017. Increased cropping intensity improves crop residue inputs to the soil and aggregate-associated soil organic carbon stocks. Soil & Tillage Research (165) 128–136
Nunes, J. M. G., Kautzmann, R. M. & Oliveira, C. 2014. Evaluation of the natural fertilizing potential of basalt dust wastes from the mining district of Nova Prata (Brazil). J. Clean. Prod. 84, 649–656
Nunes, J. M. G., Kautzmann, R. M. & Oliveira, C. Evaluation of the natural fertilizing potential of basalt dust wastes from the mining district of Nova Prata (Brazil). J. Clean. Prod. 84, 649–656 (2014)

FINAL REPORT
III. References
Current understanding of the impact of (CDR) approaches on SDGs 264
Nuñez, M A et al. 2007. Afforestation causes changes in post-fire regeneration in native shrubland communities of northwestern Patagonia, Argentina”. Journal of Vegetation Science 18: 827-834.
Ogle, S.M. ; Kurz, W.A. ; Green, C.; Brandon, A. ; Baldock, J.; Domke, G.; Herold, M.; Bernoux, M.; Chirinda, N. ; de Ligt, R.; Federici, S.; Garcia-Apaza, E. ; Grassi, G. ; Gschwantner, T. ; Hirata, Y. ; Houghton, R. ; House, J.I.; Ishizuka, S. ; Jonckheere, I. ; Krisnawati, H. ; Lehtonen, A. ; Kinyanjui, M.J.; McConkey, B. ; Næsset, E. ; Niinistö, S.M. ; Ometto, J.P. ; Panichelli, L.; Paul, T.; Petersson, H. ; Reddy, S. ; Regina, K. ; Rocha, M.T.; Rock, J. ; Sanz Sanchez, M.J. ; Sanquetta, C. ; Sato, A. ; Somogyi, Z. ; Trunov, A.; Vazquez-Amabile, G.; Vitullo, M. ; Wang, Ch. & Waterworth, R.M. (2019). Chapter 2 Generic methodologies applicable to multiple land-use categories. In: Refinement to the 2006 IPCC Guidelines for National Greenhouse Gas Inventories, 2.1 -2.96 p.
Ogle, S.M.,C. Alsaker, J.Baldock, M.Bernoux, F.J. Breidt, B. McConkey, K. Regina, and G.G. Vazquez-Amabile, 2019. "Climate and Soil Characteristics Determine Where No-Till Management Can Store Carbon in Soils and Mitigate Greenhouse Gas Emissions". Nature Scientific Reports vol 9, Article number: 11665 https://doi.org/10.1038/s41598-019-47861-7
Ogle, S.M. ; Kurz, W.A. ; Green, C.; Brandon, A. ; Baldock, J.; Domke, G.; Herold, M.; Bernoux, M.; Chirinda, N. ; de Ligt, R.; Federici, S.; Garcia-Apaza, E. ; Grassi, G. ; Gschwantner, T. ; Hirata, Y. ; Houghton, R. ; House, J.I.; Ishizuka, S. ; Jonckheere, I. ; Krisnawati, H. ; Lehtonen, A. ; Kinyanjui, M.J.; McConkey, B. ; Næsset, E. ; Niinistö, S.M. ; Ometto, J.P. ; Panichelli, L.; Paul, T.; Petersson, H. ; Reddy, S. ; Regina, K. ; Rocha, M.T.; Rock, J. ; Sanz Sanchez, M.J. ; Sanquetta, C. ; Sato, A. ; Somogyi, Z. ; Trunov, A.; Vazquez-Amabile, G.; Vitullo, M. ; Wang, Ch. & Waterworth, R.M. (2019). Chapter 2 Generic methodologies applicable to multiple land-use categories. In: Refinement to the 2006 IPCC. Guidelines for National Greenhouse Gas Inventories, 2.1 -2.96 p.
Oliveira, M.O., Somariva, R., Júnior, O.H., Neto, J.M., Bretas, A., Perrone, O.E., & Reversat, J.H. (2012). Biomass Electricity Generation Using Industry Poultry Waste. Renewable energy & power quality journal, 1650-1654.
ONGIRSU, National Observatory for the Integral Management of Solid Urban Waste, Statistical data on waste generation in municipalities, 2016, http://observatoriorsu.ambiente.gob.ar/estadisticas.htm.
Osiroff A, et al. Distributions of alkalinity and dissolved inorganic carbon in the atlantic ocean southwest. Naval Hydrography Service
Ospina Pantoja, I. M. 2018.Analysis of SMEs in the furniture sector in Colombia a from the income of foreign companies and products. Thesis degree to qualify for the title of: Professional in International Business. Universidad Agustiniana.
Pachón, L. (2013). Análisis económico en el uso del conocimiento tradicional en los suelos antropógenicos Amazónicos: Biochar /. Recuperado de: http://hdl.handle.net/20.500.12010/1476.
Pachón, L. (2013). Economic analysis in the use of traditional knowledge in anthropogenic Amazonian soils: Biochar. University of Bogota Jorge Tadeo Lozano
Palacios Peñaranda, M., Cantera Kintz, J., Peña Salamanca, E. (2019). Carbon stocks in mangrove forests of the Colombian Pacific, Estuarine, Coastal and Shelf Science, Volume 227, 2019, 106299, ISSN 0272-7714, https://doi.org/10.1016/j.ecss.2019.106299.
Patino Martinez, P. E. 2014. Biomass: feasibility study to implement a system of energy generation from vegetable waste. University of Santander. Postgraduate Directorate Master in Advanced Energy Systems. Bucaramanga.

FINAL REPORT
III. References
Current understanding of the impact of (CDR) approaches on SDGs 265
PATIÑO RESTREPO, C. A. 2012. Study of the penetration of carbon capture and storage technologies by systems dynamics. Master’s Thesis in Systems Engineering. Universidad Nacional de Colombia.
Patiño, S. et al. 2018. Capture of carbon in biomass in forestry plantations and agroforestry systems in Armero-Guayabal, Tolima, Colombia". Revista de Investigacion Agraria y Ambiental, Vol. 9, Num. 2.
Patrizio, Piera & Leduc, Sylvain & Kraxner, Florian & Fuss, Sabine & Kindermann, Georg & Mesfun, Sennai & Spokas, Kasparas & Mendoza, Alma & Dowell, Niall & Wetterlund, Elisabeth & Lundgren, Joakim & Dotzauer, Erik & Yowargana, Ping & Obersteiner, Michael. (2018). Reducing US Coal Emissions Can Boost Employment. Joule. 2. 10.1016/j.joule.2018.10.004.
Perez, J. F. et al. 2012. Decentralized power generation through biomass gasification: a technical – economic analysis and implications by reduction of CO2 emissions. Rev. Fac. Ing. Univ. Antioquia N.° 62 pp. 157-169.
Pieragostini, C. 2014. Optimal design and planning of bioethanol production from corn in Argentina including life cycle analysis. Doctor on Chemical Technology thesis. Universidad Nacional del Litoral, Faculty of Chemical Engineering.
Piola, A. R. et al.2001. Argau Project measurement of CO2 and physical-chemical and biological parameters associates, In the South Atlantic, Austral Ocean and Antarctica. Naval Hydrography Service, IV-number 1.
Plata Campo, L. A. 2006. Biomasa agricola y forestal como fuente competitiva de energia alternativa en zonas no interconectadas: Perspectivas y viabilidad de implementaciones en Colombia. Universidad de Los Andes. Bogota.
Popoyan Hernandez, J. G. 2015. Capture of CO2 in the Colombian Pacific Ocean between 2000 and 2011. Revista de Investigaciones Agroempresariales, Volumen 1.
Portugal-Pereira, J; R. Soria, R. Rathmann, R. Schaeffer, A. Szklo, Agricultural and agro-industrial residues-to-energy: techno-economic and environmental assessment in Brazil, Biomass Bioenergy 81 (2015) 521e533, https://doi.org/10.1016/j.biombioe.2015.08.010.
Potential implications for delivery of the Sustainable Development Goals. C2G Report. May 2018.
Proparco - Groupe Agence Française de Developpement, A loan to support responsible sugar production in Nicaragua. http://www.proparco.fr/en/ suganc, 2018 accessed October 12, 2018.
Protegidas de Colombia. Informe Técnico Final. Santa Marta, Colombia: INVEMAR; 2008.
Quinonez Collazo, L. J. 2010. Urban forest management as a mechanism to capture carbon on the campus of de Pontifical University Javeriana. Thesis for the master's degree in Environmental Management. Pontifica Universidad Javeriana.
Ramirez Mejia, A. F. et al. 2016. Activity patterns and habitat use of mammals in an Andean Forest and a Eucalyptus reforestation in Colombia". Hystrix, the Italian Journal of Mammalogy. Mammalogy ISSN 1825-5272.
Rangel, O. J. P.; Silva, C. A. 2007. Estoques de carbono e nitrogênio e frações orgânicas de Latossolo submetido a diferentes sistemas de uso e manejo. Revista Brasileira de Ciência do Solo, v. 31, p. 1609-1623, 2007.
Reyes-Calle W. et al. 2020. Drivers of biomass power generation technologies: Adoption in Colombia. IOP Conf. Ser.: Mater. Sci. Eng. 844 012010.
Riveros Romero M. A. 2011. Market research: Diagnosis of reforestation projects in the Colombian Orinoquia. Master oficial en dirección de marketing. Universidad Cardenal Herrera, Valencia España.

FINAL REPORT
III. References
Current understanding of the impact of (CDR) approaches on SDGs 266
Roberts, J. J, et al. 2015. Assessment of dry residual biomass potencial for use as alternative energy source in the party of General Pueyrreron, Argentina. Renewable and Sustainable Energy Reviews Volume 41,568-583.
Rockett, Gabriela & van den Broek, Machteld & Ramírez, Andrea & Ketzer, Marcelo. (2012). Large Scale Carbon Capture and Storage in Brazil: a preliminary cost modelling for Campos Basin's Oil Fields. Geociencias. 31. 31-485.
Rodriguez Acevedo, E. et al. 2019. Develop of nanomaterials for CO2 geostorage in shallow reservoirs. 2nd Latin American Engineering Congress. Colombia.
Rodriguez, A. Lemos, D.; Trujillo, Y. Amaya, J. and Ramos, L. (2019) Effectiveness of Biochar Obtained from Corncob for Immobilization of Lead in Contaminated Soil. Journal of Health and Pollution: September 2019, Vol. 9, No. 23, 190907.
Rogelj, J., D. Shindell, K. Jiang, S. Fifita, P. Forster, V. Ginzburg, C. Handa, H. Kheshgi, S. Kobayashi, E. Kriegler, L. Mundaca, R. Séférian, and M.V.Vilariño, 2018: Mitigation Pathways Compatible with 1.5°C in the Context of Sustainable Development. In: Global Warming of 1.5°C. An IPCC Special Report on the impacts of global warming of 1.5°C above pre-industrial levels and related global greenhouse gas emission pathways, in the context of strengthening the global response to the threat of climate change, sustainable development, and efforts to eradicate poverty [Masson-Delmotte, V., P. Zhai, H.-O. Pörtner, D. Roberts, J. Skea, P.R. Shukla, A. Pirani, W. Moufouma-Okia, C. Péan, R. Pidcock, S. Connors, J.B.R. Matthews, Y. Chen, X. Zhou, M.I. Gomis, E. Lonnoy, T. Maycock, M. Tignor, and T. Waterfield (eds.)].
Rojas Higuera, P. J, et al. 2015. On global ocean warming and acidification and its possible expression in the Colombian coastal marine environment. Rev. Acad. Colomb. Cienc. Ex. Fis. Nat. 39(151):201-217.
Rojas, J. M., Prause, J., Sanzano, G. A., Arce, O. E. A. & Sánchez, M. C. (2016). Soil quality indicators selection by mixed Models and multivariate techniques in deforested areas for agricultural use in NW of Chaco, Argentina. Soil and Tillage Research, 155, 250–262. http:// doi.org/10.1016/j.still.2015.08.010
Ruano Parra, J. E. 2019. Estimation of carbon capture in Las Garzas ecopark, Cali Valle del Cauca". Degree Thesis. Universidad Autonoma de Occidente. Facultad de Ciencias Basicas, Departamento de Ciencias Ambientales, Programa Administracion Ambiental. Santiago de Cali.
S. Montico. 2009. Bioenergy production capacity in the province of Santa Fe, Argentina. Cien. Inv. Agr. 36(32):465-474.
Sagastume Gutierrez, A. et al. 2019. Data supporting the forecast of electricity generation capacity from non-conventional renewable energy sources in Colombia. Data in brief 28 (2020).
Sagastume, Alexis & Cabello Eras, Juan & Hens, Luc & Vandecasteele, Carlo. (2020). The energy potential of agriculture, agroindustrial, livestock, and slaughterhouse biomass wastes through direct combustion and anaerobic digestion. The case of Colombia. Journal of Cleaner Production. 122317. 10.1016/j.jclepro.2020.122317.
San Martín Cañas Janowsky, Stephanie & Tassinari, Colombo. (2019). Geological storage of carbón dioxide: perspectives for Colombia. August 2019. Conference XVII Colombian Geology Congress. Santa Marta, Colombia.
Sanchez Cuervo, A. M et al. 2012. Land cover change in Colombia : surprising forest recovery trends between 2001 and 2010." PLoS ONE 7(8): e43943. doi:10.1371/journal.pone.0043943.
Sanchez-Cuervo, A. M., and T. M. Aide. 2013. Identifying hotspots of deforestation and reforestation in Colombia (2001–2010): implications for protected areas". Ecosphere 4(11):143.
Sánchez-Páez H., R. Alvarez-León, F. Pinto-Nolla, et al. 1997. Diagnóstico y zonificación preliminar de los manglares del Caribe de Colombia. In: Sánchez-Páez, H. y R. Alvarez-León (eds.)

FINAL REPORT
III. References
Current understanding of the impact of (CDR) approaches on SDGs 267
Proy. PD 171/91 Rev. 2 (F) Fase I. Conservación y Manejo para el Uso Múltiple y el Desarrollo de los Manglares de Colombia. MINAMBIENTE/OIMT. Santa Fe de Bogotá D.C., Colombia.
Sánchez-Páez H., R. Alvarez-León, O.A. Guevara-Mancera, et al. 1997a. Diagnóstico y zonificación preliminar de los manglares del Pacífico de Colombia. In: Sánchez-Páez, H. y R. Alvarez- León (eds.) Proy. PD 171/91 Rev. 2 (F) Fase I. Conservación y Manejo para el Uso Múltiple y el Desarrollo de los Manglares de Colombia. MINAMBIENTE/OIMT. Santa Fe de Bogotá D.C., Colombia.
Sánchez-Reinoso AD, Ávila-Pedraza E.A., Restrepo-Díaz H. Use of Biochar in Agriculture. Acta biol. Colomb. 2020;25(2):327-338. DOI: http://dx.doi.org/10.15446/abc.v25n2.79466
Secretariat of the Convention on Biological Diversity (2012). Geoengineering in Relation to the Convention on Biological Diversity: Technical and Regulatory Matters, Montreal, Technical Series No. 66, 152 pages.
SGAyDS. 2019. Informe Nacional de Inventario del Tercer Informe Bienal de Actualización de la República Argentina a la Convención Marco de las Naciones Unidas para el Cambio Climático (CMNUCC).
Silva-Martínez, Rodolfo & Sanches-Pereira, Alessandro & Ortiz, Willington & Gómez, Maria & Coelho, Suani. (2020). The state-of-the-art of organic waste to energy in Latin America and the Caribbean: Challenges and opportunities. Renewable Energy. 156. 10.1016/j.renene.2020.04.056.
Sione S M, et al.2019. Carbon fraction in the biomass of Prosopis Affinis sprengel (fabaceae) in a native espinal forest Argentina. Rev. Facultad de Agronomía UBA, 39 (1): 6-15.
Smith, P., 2014. Do grasslands act as a perpetual sink for carbon? Global change biology 20, 2708-2711
Stavrakas, V. et al., 2018. Striving towards the deployment of Bio-Energy with Carbon Capture and Storage (BECCS): A Review of Research Priorities and Assessment Needs — Supplemental Information. Sustainability 2018, 10(7), 2206; https://doi.org/10.3390/su10072206.
Steinbach, H and R. Alvarez. 2006. Changes in Soil Organic Carbon Contents and Nitrous Oxide Emissions after Introduction of No-Till in Pampean Agroecosystems. J.Environ. Qual. 35:3-13 (Metanalisis)
Steinbach, H.S., Alvarez, R., 2006. Changes in soil organic carbon contents and nitrous oxide emissions after introduction of no-till in Pampean agroecosystems. Journal of Environmental Quality 35, 3–13.
Strefler, J. et al 2018. Potential and costs of carbon dioxide removal by enhanced weathering of rocks. Environ. Res. Lett. 13 034010
Studdert, G.A., Echeverría, H.E., Casanovas, E.M., 1997. Crop-pasture rotation for sustaining the quality and productivity of a Typic Argiudoll. Soil Science Society of America Journal 61, 1466–1472
Studdert, G.A.; M.N. Domingo; G.V. Garcia; M.G. Monterubbianesi; G.F. Dominguez. 2017. Soil organic Carbon under contrasting cropping systems and its relationships with Nitrogen supply capacity Ciencia del Suelo (Argentina) 35(2): in Press.
Subsecretaría de Planeamiento Energético, 2019. Factor de Emisión de la red eléctrica de Argentina 2013-2018. Secretariat of Energy, Argentina. http://datos.minem.gob.ar/dataset/calculo-del-factor-de-emision-de-co2-de-la-red-argentina-de-energia-electrica, Accessed November 2020.
THEODORO SH AND LEONARDOS OH. 2006. The use of rocks to improve family agriculture in Brazil. An Acad Bras Cienc 78: 721–730.
Third National Communication on Climate Change. Argentina

FINAL REPORT
III. References
Current understanding of the impact of (CDR) approaches on SDGs 268
Third National Communication on Climate Change. Colombia
Trossero, M. 2009. WISDOM-Woodfuel Integrated Supply/Demand Overview Mapping (WISDOM Argentina). Food and Agriculture Organization of the United Nations (FAO) and Probiomasa AR. Buenos Aires, 2009.
Trujillo A, E et al. 2019. Production and chemical characterization of biochar from organic poultry waste. Rev Soc Quím Perú. 85 (4).
Ubaque, C. A. et al. 2013. Use of Pelleted Biomass in the Brick Industry in Bogota-Colombia: Energy and Environmental Analysis. Inf. tecnol. vol.24 no.3 La Serena.
UNFCCC, 2015. Methodological tool to calculate the emission factor for an electricity system [CDM mechanism]. Version 05.
UPME, 2010, Atlas of the energy potential of residual biomass in Colombia, ISBN: 978-958-8504-59-9.
UPME, 2016. Costos Nivelados de Generación Eléctrica en Colombia http://www.geolcoe.siel.gov.co/. Online tool, accessed November 2020.
UPME. 2018. Plan de expansión de referencia Generación – transmisión 2017 – 2031. Unidad de Planeación Minero Energética. Bogotá, 2018.
UPME. 2019. Plan Energético Nacional Colombia 2020- 2050 - Documento de consulta. Unidad de Planeación Minero Energética. Bogotá, 2019.
UPME. Sistema de Información Eléctrico Colombiano. http://www.siel.gov.co/. Online tool, Accessed December 2020.
Urrego, L.E., Molina, E.C., Suárez, J.A., 2014. Environmental and anthropogenic influences on the distribution, structure, and floristic composition of mangrove forests of the Gulf of Urabá (Colombian Caribbean), Aquatic Botany, Volume 114, Pages 42-49, ISSN 0304-3770, https://doi.org/10.1016/j.aquabot.2013.12.006.
USDA. 2019. Brazil Biofuels Annual 2019. GAIN Report Number:BR19029
V Marin, JC Lovett, JS Clancy. Biofuels and land appropriation in Colombia: Do biofuels national policies fuel land grabs - International Conference on Global Land Grabbing, 2011
V Marin, JC Lovett, JS. Biofuels and land appropriation in Colombia: Do biofuels national policies fuel land grabs
van Dam, J. et al. 2009. Large-scale bioenergy production from soybeans and switchgrass in Argentina Part B. Environmental and socio-economic impacts on a regional level. Renewable and Sustainable Energy Reviews 13 1679–1709.
Van Straaten P. (2006). Farming with rocks and minerals: challenges and opportunities. Anais da Academia Brasileira de Ciencias, 78(4), 731–747. https://doi.org/10.1590/s0001-37652006000400009
Vargas G. G. 2020. Effects of reforestation with species from genus Prosopis in the biodiversity of Epigeal arthropods: Comparison of environments with different conditions natural and anthropic recovery for the Monte Central, Mendoza. Thesis to qualify for the degree of Resource Engineer Natural Renewable. Faculty of Agricultural Sciences, Universidad Nacional de Cuyo.
Viglizzo E.F., M.F. Ricard, M.A. Taboada, G. Vázquez-Amábile. 2019. Reassessing the role of grazing lands in carbon-balance estimations: Meta-analysis and review. Science of The Total Environment 661, 531-542.
Villafañe VE, Paczkowska J, Andersson A, Durán Romero C, Valiñas MS, Helbling EW. Dual role of DOM in a scenario of global change on photosynthesis and structure of coastal phytoplankton from the South Atlantic Ocean. Sci Total Environ. 2018 Sep 1;634:1352-1361. doi: 10.1016/j.scitotenv.2018.04.121. Epub 2018 Apr 18. PMID: 29710635.

FINAL REPORT
III. References
Current understanding of the impact of (CDR) approaches on SDGs 269
Villarino SH, Studdert GA, Baldassini P, Cendoya MG, Ciuffoli L, Mastrángelo M, Piñeiro G .2017. Deforestation impacts on soil organic carbon stocks in the Semiarid Chaco Region, Argentina. Sci Total Environ 575:1056-1065. doi: 10.1016/j.scitotenv.2016.09.175
Vivid Economics 2020 "An investor guide to negative emission technologies and the importance of land use"
World Bank, DNP, MinAgricultura, Profor (2015). COLOMBIA: Potencial de Reforestación Comercial. Diagnóstico.
Yepes A.P, M. Zapata, J. Bolivar, A. Monsalve, S.M. Espinosa, P.C. Sierra-Correa. 2016. Ecuaciones alométricas de biomasa aérea para la estimación de los contenidos de carbono en manglares del Caribe Colombiano. Rev. Biol. Trop. (Int. J. Trop. Biol. ISSN-0034-7744) Vol. 64 (2): 913-926.
Zarate-Barrera TG, Maldonado JH (2015) Valuing Blue Carbon: Carbon Sequestration Benefits Provided by the Marine Protected Areas in Colombia. PLoS ONE 10(5): e0126627. doi:10.1371/journal. pone.0126627
Zarate, T. 2013. The monetary value of the Colombian Blue Carbon: Benefits of the catch and carbon storage provided by the Areas Subsystem Protected Marinas. Universidad de los Andes, Economy Faculty.
Zúñiga-Escobar, Orlando, Uribe V, Andrés, Torres-González, Alba Marina, Cuero-Guependo, Ramiro, & Peña-Óspina, Julián Andrés. (2013). Assessment of the impact of anthropic activities on carbon storage in soils of high montane ecosystems in Colombia. Agronomía Colombiana, 31(1), 112-119. Retrieved October 22, 2020, from
Research projects
Hydrological impacts of solar radiation management in the La Plata Basin in South America. Argentina. SRMGI

FINAL REPORT
Annexes
Current understanding of the impact of (CDR) approaches on SDGs 270
Annex: BECCS - Cost estimation
Bioenergy with carbon capture and storage (BECCS) - Cost Estimation – Argentina
The full LCOE (considering CAPEX and O&M costs) for BECCS in Argentina has been estimated based on the following parameters:
Table 57: Key BECCS LCOE calculation inputs and results for Argentina
Unit Value
CAPEX USD/kW 4,100—4,400
Fixed O&M USD/kWe/y 95.8
Variable O&M USD/MWh 90.6
Fuel costs USD/MWhe 0—35
Discount rate % 10%
Capacity Factor % 34%
Power Generation efficiency kJe/ kJfuel 32%
Fuel Bagasse
LCOE USD/MWh 283.3—330.3
Source: Own elaboration partially based on Secretariat of Energy and Langholtz 2020.
A preliminary estimation of CO2 avoidance full LCOE cost associated with BECCS deployment In
Argentina was performed.

FINAL REPORT
Annexes
Current understanding of the impact of (CDR) approaches on SDGs 271
Table 58: Summary of Carbon Avoidance Costs associated with BECCS in Argentina - Full LCOE
MIN MAX
40 60 80 40 60 80
Short-run
LCOE BECCS USD/MWh 283.3 283.3 283.3 330.0 330.0 330.0
LCOE Natural gas combined cycle USD/MWh 69.1 69.1 69.1 69.1 69.1 69.1
BECCS emissions tCO2e/MWh (0.28) (0.42) (0.56) (0.3) (0.4) (0.6) Gas-fired plant emissions (cc) tCO2e/MWh 0.4 0.4 0.4 0.4 0.4 0.4
CAC USD/tCO2e USD/tCO2e 305.0 254.0 217.7 371.6 309.5 265.2
Long-run
LCOE BECCS USD/MWh 283.3 283.3 283.3 330.0 330.0 330.0
LCOE System USD/MWh 60.7 60.7 60.7 60.7 60.7 60.7
BECCS emissions tCO2e/MWh (0.3) (0.4) (0.6) (0.3) (0.4) (0.6) Reference baseline system emissions tCO2e/MWh 0.1 0.1 0.1 0.1 0.1 0.1
CAC USD/tCO2e USD/tCO2e 615.9 443.1 346.0 745.3 536.2 418.7 Source: Own elaboration partially based on Secretariat of Energy and Langholtz 2020.
Also a preliminary estimation of CO2 avoidance only considering CAPEX was performed.
Table 59: Summary of Carbon Avoidance Costs associated with BECCS in Argentina - Only CAPEX LCOE
40 60 80
LCOE BECCS (only CAPEX) USD/MWh 161 to 173
Emissions BECCS tCO2e/MWh (0.28) (0.42) (0.56)
Emissions ref first 15 years tCO2e/MWh 0.42 0.42 0.42
Emissions ref following 15 years tCO2e/MWh 0.08 0.08 0.08
Removal first 15 years tCO2e/MWh (0.70) (0.84) (0.98)
Removal following 15 years tCO2e/MWh (0.36) (0.50) (0.64)
Reducción promedio tCO2e/MWh (0.53) (0.67) (0.81)
CAC USD/tCO2e MIN USD/tCO2e 302.3 239.0 197.6
CAC USD/tCO2e MAX USD/tCO2e 324.4 256.5 212.1
CAC USD/tCO2e Avg USD/tCO2e 313.4 247.7 204.8
Source: Own elaboration partially based on Secretariat of Energy and Langholtz 2020.

FINAL REPORT
Annexes
Current understanding of the impact of (CDR) approaches on SDGs 272
Bioenergy with carbon capture and storage (BECCS) - Cost Estimation - Colombia
The full LCOE (considering CAPEX and O&M costs) for BECCS in Colombia has been estimated
based on the following parameters:
Table 60: Key BECCS LCOE calculation inputs and results for Colombia
Unit Value
CAPEX USD/kW 3,700—3,900
Fixed O&M USD/kWe/y 95.8
Variable O&M USD/MWh 90.6
Fuel costs USD/MWhe 0—35
Discount rate % 10%
Capacity Factor % 56%
Power Generation efficiency kJe/ kJfuel 30%
Fuel Bagasse
LCOE USD/MWh 199.6—239.4
Source: Own elaboration partially based on UPME and Langholtz 2020.
A preliminary estimation of CO2 avoidance full LCOE cost associated with BECCS deployment in
Colombia was performed.
Table 61: Summary of Carbon Avoidance Costs associated with BECCS in Colombia - Full LCOE
MIN MAX
40 60 80 40 60 80
Short-run
LCOE BECCS USD/MWh 199.6 199.6 199.6 239.4 239.4 239.4
LCOE Coal Steam Turbine USD/MWh 101.2 101.2 101.2 101.2 101.2 101.2
BECCS emissions tCO2e/MWh (0.5) (0.7) (0.9) (0.5) (0.7) (0.9)
Coal-fired plant emissions (gt) tCO2e/MWh 1.0 1.0 1.0 1.0 1.0 1.0
CAC USD/tCO2e USD/tCO2e 66.0 57.0 50.2 92.7 80.1 70.6
Long-run
LCOE BECCS USD/MWh 199.6 199.6 199.6 239.4 239.4 239.4
LCOE System USD/MWh 65.0 65.0 65.0 65.0 65.0 65.0
BECCS emissions tCO2e/MWh (0.5) (0.7) (0.9) (0.5) (0.7) (0.9) Reference baseline system emissions tCO2e/MWh 0.2 0.2 0.2 0.2 0.2 0.2
CAC USD/tCO2e USD/tCO2e 215.78 157.02 123.42 279.63 203.49 159.94
Source: Own elaboration partially based on UPME and Langholtz 2020.

FINAL REPORT
Annexes
Current understanding of the impact of (CDR) approaches on SDGs 273
Also a preliminary estimation of CO2 avoidance only considering CAPEX was performed.
Table 62: Summary of Carbon Avoidance Costs associated with BECCS in Colombia - Only CAPEX LCOE
40 60 80
LCOE BECCS (only CAPEX) USD/MWh 89 to 94
Emissions BECCS tCO2e/MWh (0.47) (0.70) (0.93)
Emissions ref first 15 years tCO2e/MWh 1.03 1.03 1.03
Emissions ref following 15 years tCO2e/MWh 0.16 0.16 0.16
Removal first 15 years tCO2e/MWh (1.49) (1.73) (1.96)
Removal following 15 years tCO2e/MWh (0.62) (0.86) (1.09)
Reducción promedio tCO2e/MWh (1.06) (1.29) (1.52)
CAC USD/tCO2e MIN USD/tCO2e 84.5 69.2 58.6
CAC USD/tCO2e MAX USD/tCO2e 89.0 72.9 61.8
CAC USD/tCO2e Avg USD/tCO2e 86.8 71.1 60.2
Source: Own elaboration partially based on Secretariat of Energy and Langholtz 2020.
Top Related