

![MARY (TUT) HEDGEPETH NASA ORAL HISTORY · 6/12/2001 · Langley Field, [Hampton,] Virginia [NACA Langley Aeronautical Laboratory / (1958) NASA Langley Research Center]. My salary](https://static.fdocuments.in/doc/165x107/5f7335b4760f060dd62414fb/mary-tut-hedgepeth-nasa-oral-history-6122001-langley-field-hampton-virginia.jpg)


Languages
Pages
Legal

January 2014
NASA/TM–2014-218148
Current Performance Characteristics of NASA
Langley Research Center’s Cockpit Motion
Base and Standarized Test Procedure for Future
Performance Characterization
Brandon Cowen and Mary T. Stringer
Adaptive Aerospace Group, Inc., Hampton, Virginia
Brian K. Hutchinson, Paul C. Davidson, and Lawrence E. Gupton
Langley Research Center, Hampton, Virginia

NASA STI Program . . . in Profile
Since its founding, NASA has been dedicated to the
advancement of aeronautics and space science. The
NASA scientific and technical information (STI)
program plays a key part in helping NASA maintain
this important role.
The NASA STI program operates under the
auspices of the Agency Chief Information Officer.
It collects, organizes, provides for archiving, and
disseminates NASA’s STI. The NASA STI
program provides access to the NASA Aeronautics
and Space Database and its public interface, the
NASA Technical Report Server, thus providing one
of the largest collections of aeronautical and space
science STI in the world. Results are published in
both non-NASA channels and by NASA in the
NASA STI Report Series, which includes the
following report types:
TECHNICAL PUBLICATION. Reports of
completed research or a major significant phase
of research that present the results of NASA
Programs and include extensive data or
theoretical analysis. Includes compilations of
significant scientific and technical data and
information deemed to be of continuing
reference value. NASA counterpart of peer-
reviewed formal professional papers, but
having less stringent limitations on manuscript
length and extent of graphic presentations.
TECHNICAL MEMORANDUM. Scientific
and technical findings that are preliminary or of
specialized interest, e.g., quick release reports,
working papers, and bibliographies that contain
minimal annotation. Does not contain extensive
analysis.
CONTRACTOR REPORT. Scientific and
technical findings by NASA-sponsored
contractors and grantees.
CONFERENCE PUBLICATION.
Collected papers from scientific and
technical conferences, symposia, seminars,
or other meetings sponsored or co-
sponsored by NASA.
SPECIAL PUBLICATION. Scientific,
technical, or historical information from
NASA programs, projects, and missions,
often concerned with subjects having
substantial public interest.
TECHNICAL TRANSLATION.
English-language translations of foreign
scientific and technical material pertinent to
NASA’s mission.
Specialized services also include organizing
and publishing research results, distributing
specialized research announcements and feeds,
providing information desk and personal search
support, and enabling data exchange services.
For more information about the NASA STI
program, see the following:
Access the NASA STI program home page
at http://www.sti.nasa.gov
E-mail your question to [email protected]
Fax your question to the NASA STI
Information Desk at 443-757-5803
Phone the NASA STI Information Desk at
443-757-5802
Write to:
STI Information Desk
NASA Center for AeroSpace Information
7115 Standard Drive
Hanover, MD 21076-1320

National Aeronautics and
Space Administration
Langley Research Center
Hampton, Virginia 23681-2199
January 2014
NASA/TM–2014-218148
Current Performance Characteristics of NASA
Langley Research Center’s Cockpit Motion
Base and Standardized Test Procedure for
Future Performance Characterization
Brandon Cowen and Mary T. Stringer
Adaptive Aerospace Group, Inc., Hampton, Virginia
Brian K. Hutchinson, Paul C. Davidson, and Lawrence E. Gupton
Langley Research Center, Hampton, Virginia
Available from:
NASA Center for AeroSpace Information
7115 Standard Drive
Hanover, MD 21076-1320
443-757-5802
ACKNOWLEDGMENTS
Special thanks are extended to the many people that contributed to the extensive testing
and evaluation process during the development of this report. This effort would not have
been possible without the guidance and assistance of Fred Lallman, Robert Redman, Dale
Ashcom, and Gustav Taylor of the NASA Langley Research Center, Keith Hoffler of
Adaptive Aerospace Group, as well as Frank Cardullo of the State University of New
York- Binghamton.
The use of trademarks or names of manufacturers in this report is for accurate reporting and does not
constitute an official endorsement, either expressed or implied, of such products or manufacturers by the
National Aeronautics and Space Administration.

NOMENCLATURE
Symbols
CMB Cockpit Motion Base
CMF Cockpit Motion Facility
DCU Digital Control Unit
DoF Degree-of-Freedom
DVS Data Visualization System
GFD Generic Flight Deck
IFD Integration Flight Deck
PSD Power Spectral Density
RFD Research Flight Deck
SDAB Simulation Development and Analysis Branch
SID System Identification
SIMES SIMulator Evaluation System
iii
Table of Contents
NOMENCLATURE iii
LIST OF FIGURES v
INTRODUCTION 2
CMB MOTION SYSTEM CONFIGURATION 4
DIGITAL CONTROL LAW 4
CMB Parasitic Accelerations- Past and Present 5
Control Law Modification 7
CMB PERFORMANCE AND COMPARISONS 9
Transport Delay 9
Performance Test Input Signals 10
Performance Characteristics 12
CMF STANDARDIZED TESTING PROTOCOL 21
Standard Spectral Inputs 21
Chirp Inputs 21
Banked, Sinusoidal Inputs 22
Standard Test Procedure 23
Standard Post-Processing Tools 23
Automated Processing Scripts 23
Graphical User Interface (GUI) 23
Additional Functions 24
CONSIDERATIONS 24
CONCLUSIONS 25
BIBLIOGRAPHY 26
APPENDIX 27
Comparison of Production Controller to Previous Controller 27
iv
LIST OF FIGURES
Figure 1: GFD interior (left) and exterior on CMB (right) .............................................................. 2
Figure 2: CMF representation showing the CMB, available cabs, and the crane ............................ 3
Figure 3: Control architecture for the CMB..................................................................................... 3
Figure 4: Cab-axes coordinate frame ............................................................................................... 4
Figure 5: Uncommanded motion and residual motion for 0.45 inch- 4Hz sinusoid Leg 1 position command. ......................................................................................................................................... 6
Figure 6: Uncommanded motion during 1 inch- 2Hz sinusoid level heave command .................... 6
Figure 7: Leg target-velocity test results.......................................................................................... 7
Figure 8: Parasitic accelerations during increasing banked heave oscillations ................................ 8
Figure 9: System latency test using SIMES with 10kHz sampling rate- 20 sec step input to Leg 5. ....................................................................................................................................................... 10
Figure 10: Time history of commanded frequency sweep ............................................................. 11
Figure 11: Power Spectral Density of commanded frequency sweep ............................................ 12
Figure 12: Bode Plot for Production Controller - Heave ............................................................... 13
Figure 13: Bode Plot for Production Controller - Sway ................................................................ 13
Figure 14: Bode Plot for Production Controller – Surge ............................................................... 14
Figure 15: Bode Plot for Production Controller – Pitch ................................................................ 14
Figure 16: Bode Plot for Production Controller – Roll .................................................................. 15
Figure 17: Bode Plot for Production Controller – Yaw ................................................................. 15
Figure 18: Production Controller - Parasitic Acceleration from Commanded Heave (dB) ........... 16
Figure 19: Production Controller - Parasitic Acceleration from Commanded Pitch (dB) ............. 17
Figure 20: Production Controller - Parasitic Acceleration from Commanded Roll (dB) .............. 17
Figure 21: Production Controller - Parasitic Acceleration from Commanded Surge (dB) ............ 18
Figure 22: Production Controller - Parasitic Acceleration from Commanded Yaw (dB) .............. 18
Figure 23: Production Controller - Parasitic Acceleration from Commanded Sway (dB) ............ 19
Figure 24: Operational Limits (Heave) .......................................................................................... 20
Figure 25: Operational Limits (Sway) ........................................................................................... 20
Figure 26: Operational Limits (Banked Heave) ............................................................................. 21
Figure 27: Sample sweave-spline time history .............................................................................. 22
Figure 28: GUI - Post Processing Tool .......................................................................................... 24
Figure 29: CMB valve performance .............................................................................................. 25
Figure 30:Bode Plot Comparison – Heave .................................................................................... 27
Figure 31: Bode Plot Comparison – Sway ..................................................................................... 27
v

Figure 32: Bode Plot Comparison – Surge .................................................................................... 28
Figure 33: Bode Plot Comparison – Pitch ..................................................................................... 28
Figure 34: Bode Plot Comparison – Roll ....................................................................................... 29
Figure 35: Bode Plot Comparison – Yaw ...................................................................................... 29
Figure 36: Previous Controller - Parasitic Acceleration from Commanded Heave (dB) ............... 30
Figure 37: Previous Controller - Parasitic Acceleration from Commanded Pitch (dB) ................. 30
Figure 38: Previous Controller - Parasitic Acceleration from Commanded Roll (dB) .................. 31
Figure 39: Previous Controller - Parasitic Acceleration from Commanded Surge (dB) ............... 31
Figure 40: Previous Controller - Parasitic Acceleration from Commanded Sway (dB) ................ 32
Figure 41: Previous Controller - Parasitic Acceleration from Commanded Yaw (dB) ................. 32
Figure 42: Previous Controller – Cross-coupled acceleration gains by increasing cab roll angle . 33
vi
ABSTRACT
This report documents the updated performance characteristics of NASA Langley Research Center's (LaRC) Cockpit Motion Base (CMB) after recent revisions that were made to its inner-loop, feedback control law. The modifications to the control law will be briefly described. The performance of the CMB will be presented. A short graphical comparison to the previous control law can be found in the appendix of this report. The revised controller will be shown to yield reduced parasitic accelerations with respect to the previous controller. Metrics based on the AGARD Advisory Report No. 144 are used to assess the overall system performance due to its recent control algorithm modification. This report also documents the standardized simulator test procedure which can be used in the future to evaluate potential updates to the control law.
INTRODUCTION
The Cockpit Motion Facility (CMF) located at the NASA Langley Research Center (LaRC) contains a 6 degree-of-freedom (6-DOF) motion platform with three intercha ngeable operational flight sim ulator cockpits, also referred to as cabs, as well as a crane to reposition the cabs. The Cockpit Motion Base (CMB) is operated and maintained by LaRC’s Simulation Development and Analysis Branch (SDAB), providing NASA, DoD and many other institutions and companies a state-of-the-art synerg estic motion platform for aerospace research. This report aims to quantif y the current opera tional performance of the motion system and dis cuss a standardized performance test procedure method. The procedure and t ools outlined were used in determing the performance characteristics presented. In addition, the motivation for the recent control la w modification is discussed. The characteristics of the previous controlle r, which was ac tively used on the CMB until October 2012, are provided in the appendix for com parison purposes only. This report will also briefly document the system architecture of the facility, describing the modification of commanded accel erations from a host si mulation as they are filtered, transformed, and finally sent to drive the platform.
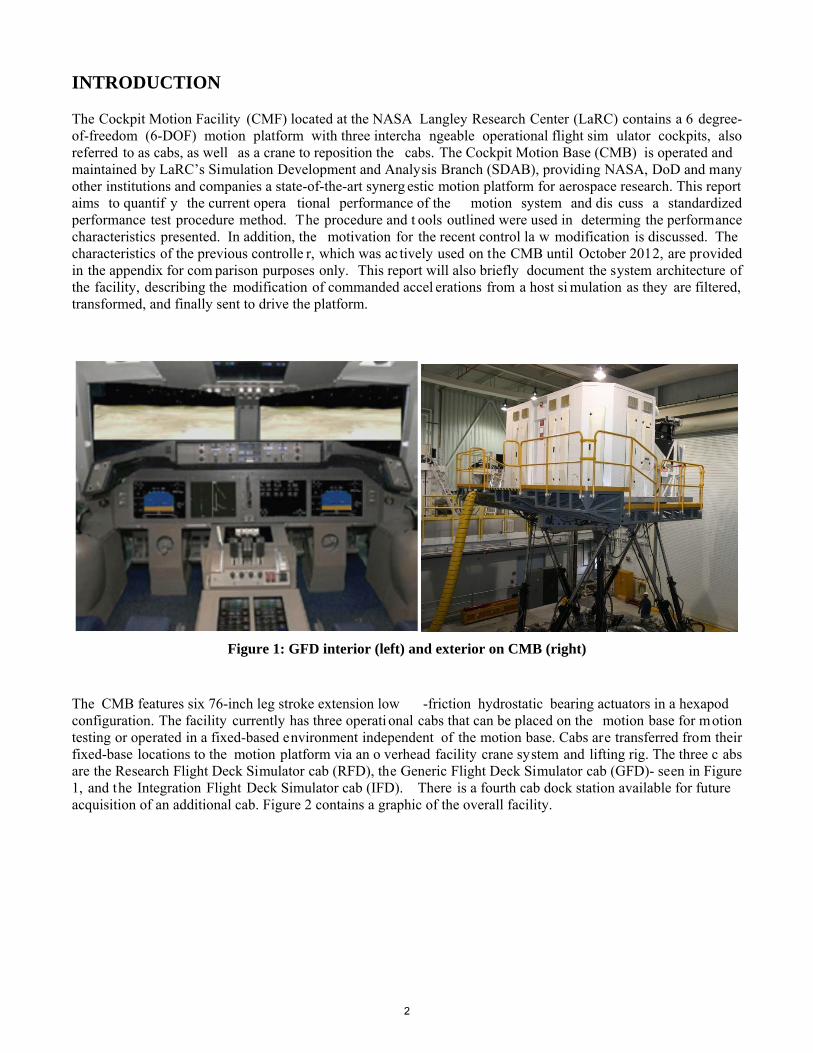
Figure 1: GFD interior (left) and exterior on CMB (right)
The CMB features six 76-inch leg stroke extension low -friction hydrostatic bearing actuators in a hexapod configuration. The facility currently has three operati onal cabs that can be placed on the motion base for motion testing or operated in a fixed-based environment independent of the motion base. Cabs are transferred from their fixed-base locations to the motion platform via an o verhead facility crane system and lifting rig. The three c abs are the Research Flight Deck Simulator cab (RFD), the Generic Flight Deck Simulator cab (GFD)- seen in Figure 1, and the Integration Flight Deck Simulator cab (IFD). There is a fourth cab dock station available for future acquisition of an additional cab. Figure 2 contains a graphic of the overall facility.
2
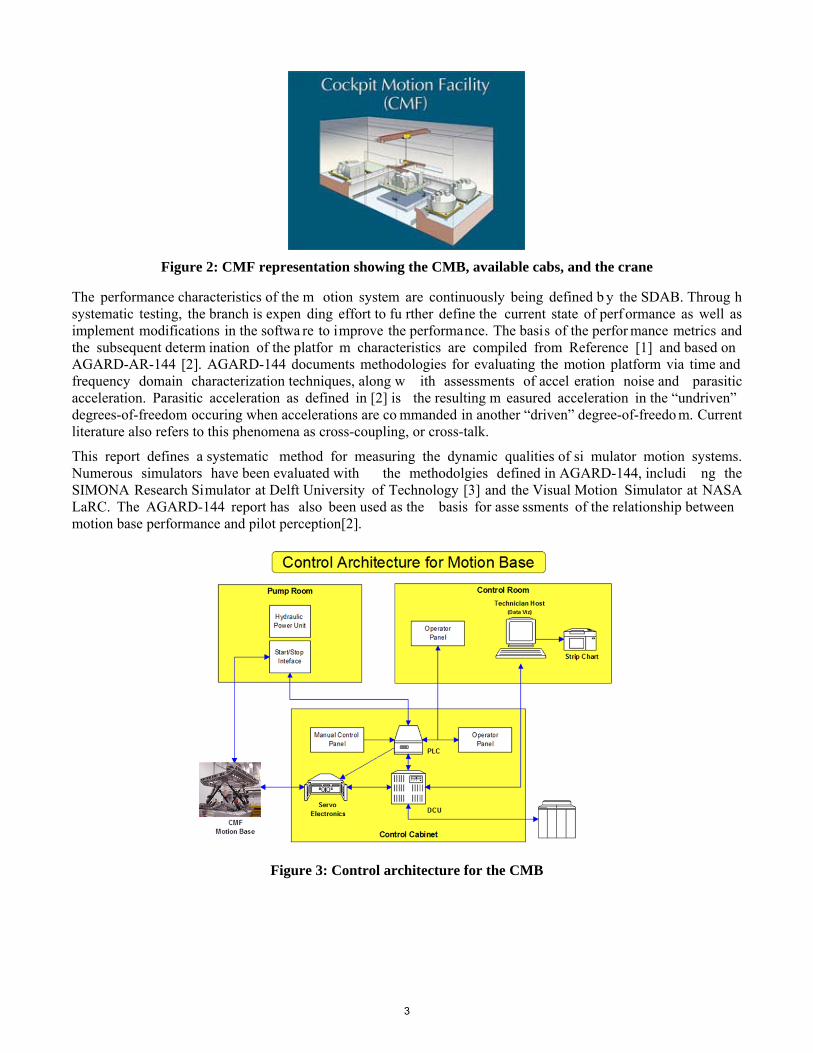
Figure 2: CMF representation showing the CMB, available cabs, and the crane
The performance characteristics of the m otion system are continuously being defined b y the SDAB. Throug h systematic testing, the branch is expen ding effort to fu rther define the current state of perf ormance as well as implement modifications in the softwa re to improve the performance. The basis of the perfor mance metrics and the subsequent determ ination of the platfor m characteristics are compiled from Reference [1] and based on AGARD-AR-144 [2]. AGARD-144 documents methodologies for evaluating the motion platform via time and frequency domain characterization techniques, along w ith assessments of accel eration noise and parasitic acceleration. Parasitic acceleration as defined in [2] is the resulting m easured acceleration in the “undriven” degrees-of-freedom occuring when accelerations are co mmanded in another “driven” degree-of-freedo m. Current literature also refers to this phenomena as cross-coupling, or cross-talk.
This report defines a systematic method for measuring the dynamic qualities of si mulator motion systems. Numerous simulators have been evaluated with the methodolgies defined in AGARD-144, includi ng the SIMONA Research Simulator at Delft University of Technology [3] and the Visual Motion Simulator at NASA LaRC. The AGARD-144 report has also been used as the basis for asse ssments of the relationship between motion base performance and pilot perception[2].
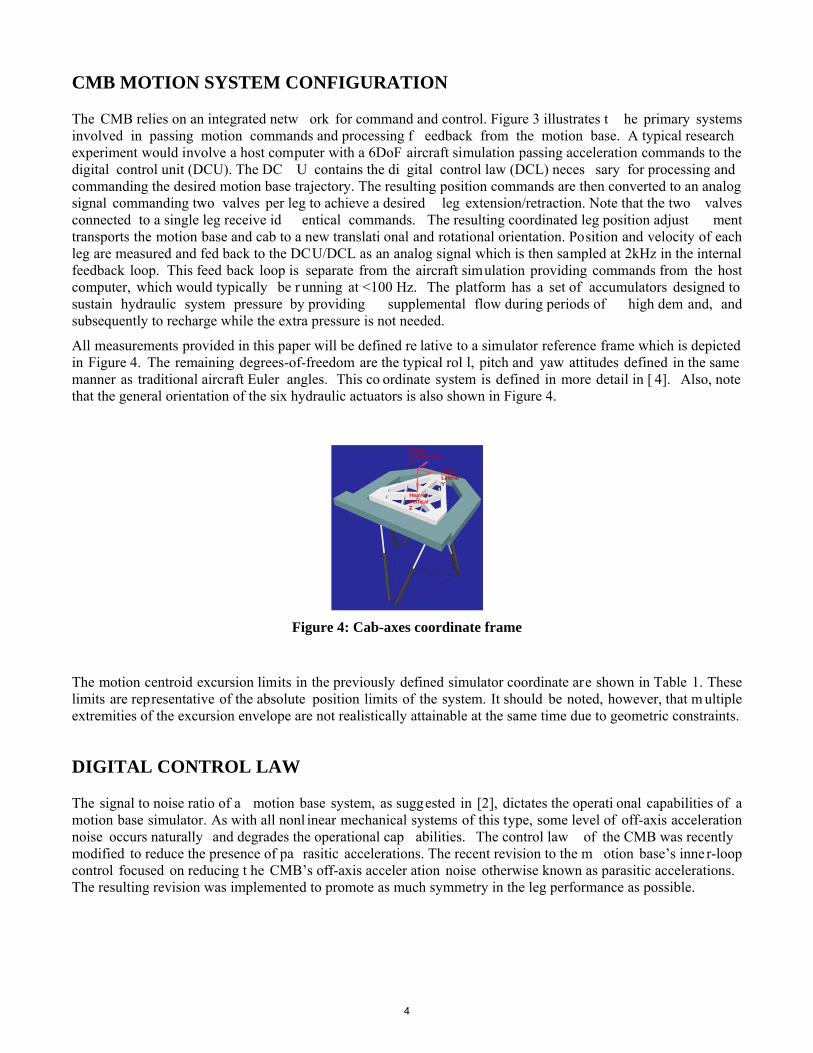
Figure 3: Control architecture for the CMB
3
CMB MOTION SYSTEM CONFIGURATION
The CMB relies on an integrated netw ork for command and control. Figure 3 illustrates t he primary systems involved in passing motion commands and processing f eedback from the motion base. A typical research experiment would involve a host computer with a 6DoF aircraft simulation passing acceleration commands to the digital control unit (DCU). The DC U contains the di gital control law (DCL) neces sary for processing and commanding the desired motion base trajectory. The resulting position commands are then converted to an analog signal commanding two valves per leg to achieve a desired leg extension/retraction. Note that the two valves connected to a single leg receive id entical commands. The resulting coordinated leg position adjust ment transports the motion base and cab to a new translati onal and rotational orientation. Position and velocity of each leg are measured and fed back to the DCU/DCL as an analog signal which is then sampled at 2kHz in the internal feedback loop. This feed back loop is separate from the aircraft simulation providing commands from the host computer, which would typically be r unning at <100 Hz. The platform has a set of accumulators designed to sustain hydraulic system pressure by providing supplemental flow during periods of high dem and, and subsequently to recharge while the extra pressure is not needed.
All measurements provided in this paper will be defined re lative to a simulator reference frame which is depicted in Figure 4. The remaining degrees-of-freedom are the typical rol l, pitch and yaw attitudes defined in the same manner as traditional aircraft Euler angles. This co ordinate system is defined in more detail in [ 4]. Also, note that the general orientation of the six hydraulic actuators is also shown in Figure 4.
Figure 4: Cab-axes coordinate frame
The motion centroid excursion limits in the previously defined simulator coordinate are shown in Table 1. These limits are representative of the absolute position limits of the system. It should be noted, however, that m ultiple extremities of the excursion envelope are not realistically attainable at the same time due to geometric constraints.
DIGITAL CONTROL LAW
The signal to noise ratio of a motion base system, as suggested in [2], dictates the operati onal capabilities of a motion base simulator. As with all nonl inear mechanical systems of this type, some level of off-axis acceleration noise occurs naturally and degrades the operational cap abilities. The control law of the CMB was recently modified to reduce the presence of pa rasitic accelerations. The recent revision to the m otion base’s inne r-loop control focused on reducing t he CMB’s off-axis acceler ation noise otherwise known as parasitic accelerations. The resulting revision was implemented to promote as much symmetry in the leg performance as possible.
4
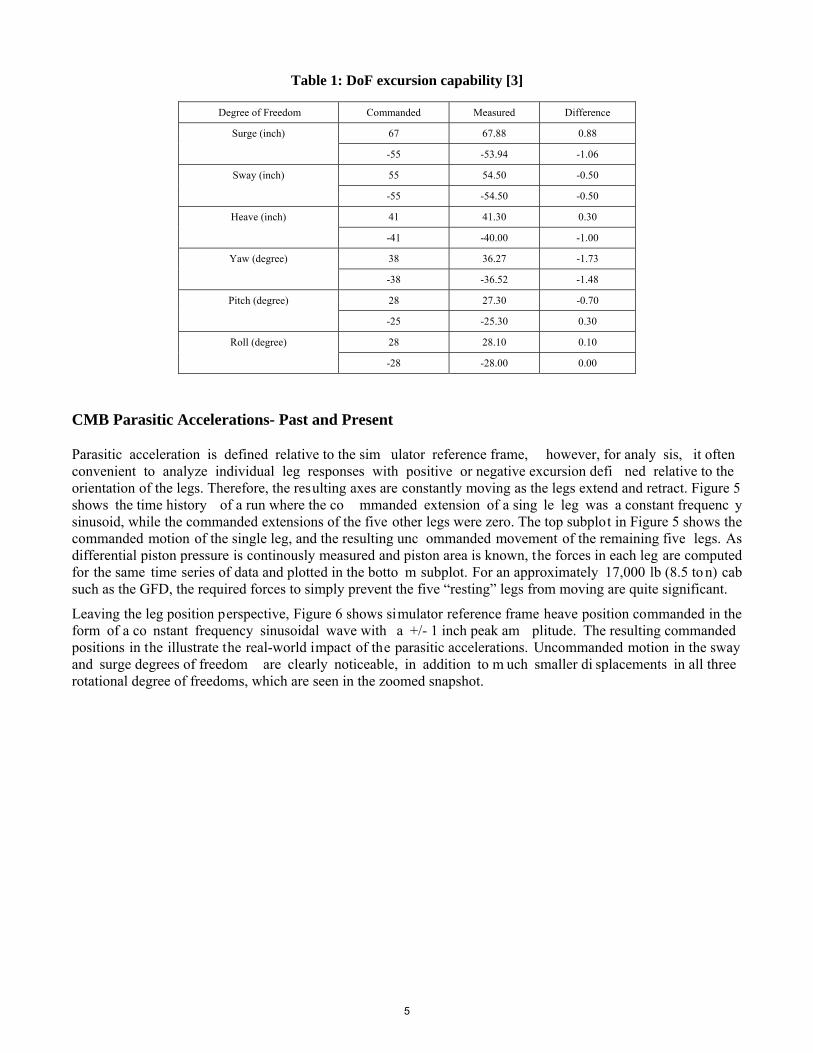
Table 1: DoF excursion capability [3]
Degree of Freedom Commanded Measured Difference
Surge (inch) 67 67.88 0.88
-55 -53.94 -1.06
Sway (inch) 55 54.50 -0.50
-55 -54.50 -0.50
Heave (inch) 41 41.30 0.30
-41 -40.00 -1.00
Yaw (degree) 38 36.27 -1.73
-38 -36.52 -1.48
Pitch (degree) 28 27.30 -0.70
-25 -25.30 0.30
Roll (degree) 28 28.10 0.10
-28 -28.00 0.00
CMB Parasitic Accelerations- Past and Present
Parasitic acceleration is defined relative to the sim ulator reference frame, however, for analy sis, it often convenient to analyze individual leg responses with positive or negative excursion defi ned relative to the orientation of the legs. Therefore, the resulting axes are constantly moving as the legs extend and retract. Figure 5 shows the time history of a run where the co mmanded extension of a sing le leg was a constant frequenc y sinusoid, while the commanded extensions of the five other legs were zero. The top subplot in Figure 5 shows the commanded motion of the single leg, and the resulting unc ommanded movement of the remaining five legs. As differential piston pressure is continously measured and piston area is known, the forces in each leg are computed for the same time series of data and plotted in the botto m subplot. For an approximately 17,000 lb (8.5 to n) cab such as the GFD, the required forces to simply prevent the five “resting” legs from moving are quite significant.
Leaving the leg position perspective, Figure 6 shows simulator reference frame heave position commanded in the form of a co nstant frequency sinusoidal wave with a +/- 1 inch peak am plitude. The resulting commanded positions in the illustrate the real-world impact of the parasitic accelerations. Uncommanded motion in the sway and surge degrees of freedom are clearly noticeable, in addition to m uch smaller di splacements in all three rotational degree of freedoms, which are seen in the zoomed snapshot.
5
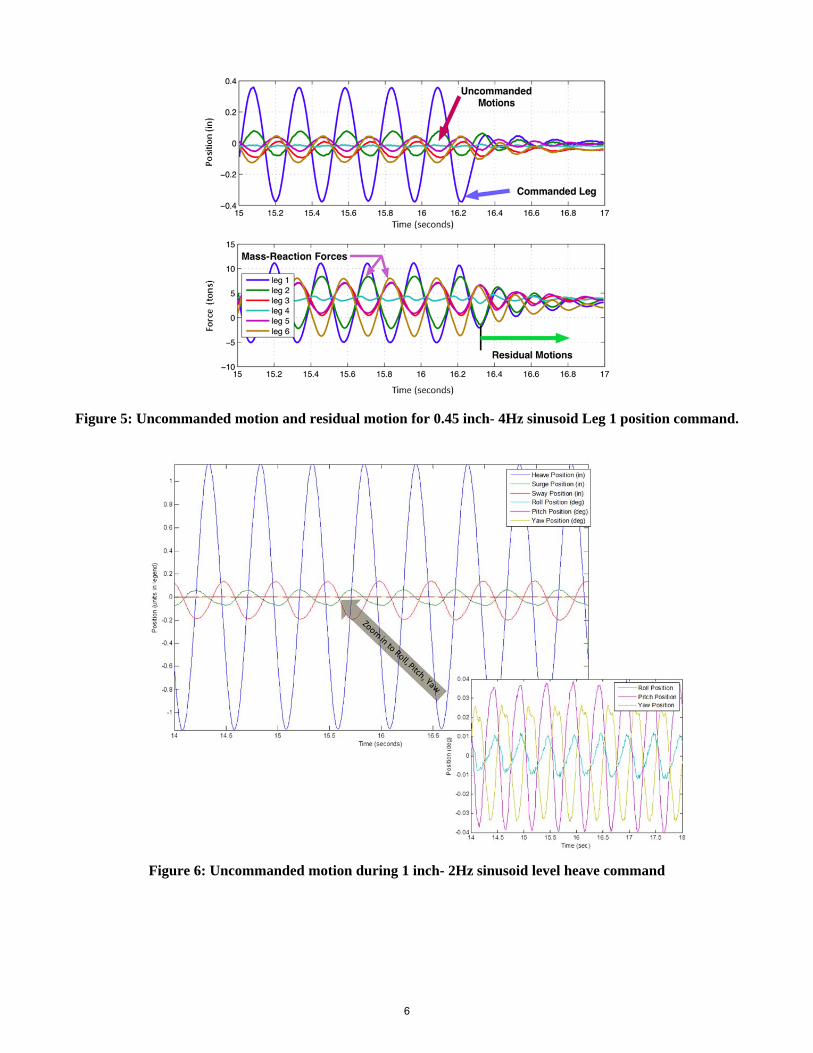
Figure 5: Uncommanded motion and residual motion for 0.45 inch- 4Hz sinusoid Leg 1 position command.
Figure 6: Uncommanded motion during 1 inch- 2Hz sinusoid level heave command
6
Control Law Modification
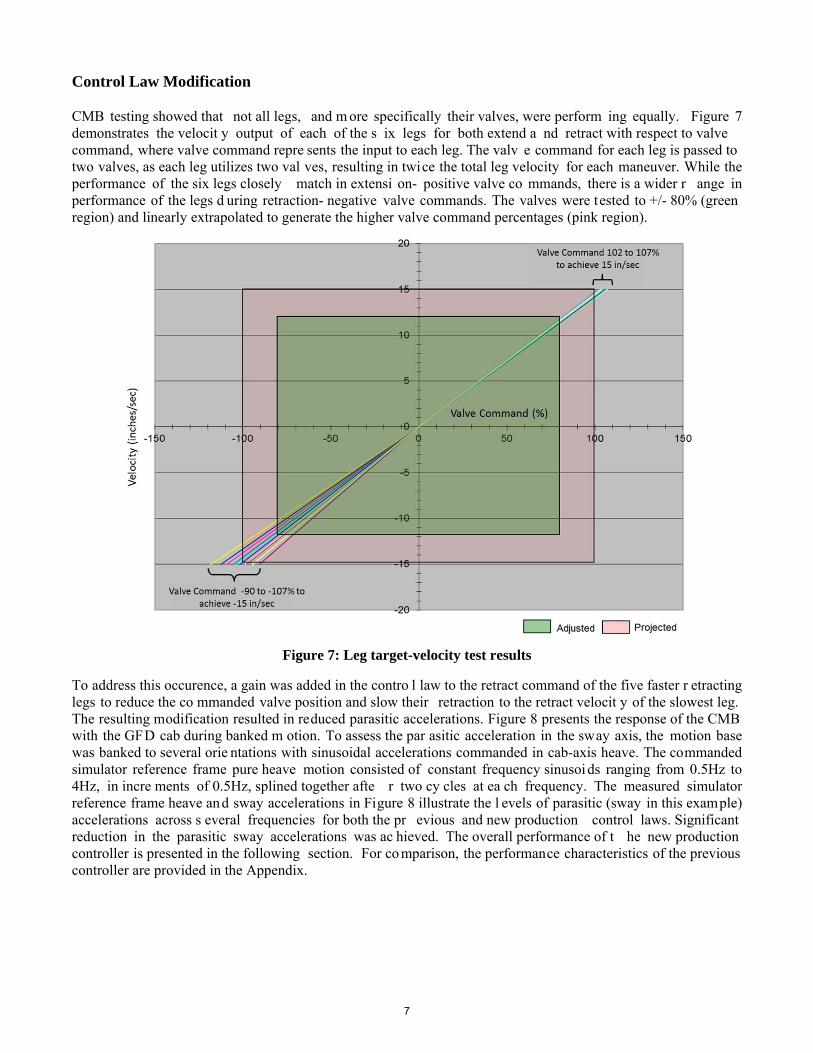
CMB testing showed that not all legs, and m ore specifically their valves, were perform ing equally. Figure 7 demonstrates the velocit y output of each of the s ix legs for both extend a nd retract with respect to valve command, where valve command repre sents the input to each leg. The valv e command for each leg is passed to two valves, as each leg utilizes two val ves, resulting in twice the total leg velocity for each maneuver. While the performance of the six legs closely match in extensi on- positive valve co mmands, there is a wider r ange in performance of the legs d uring retraction- negative valve commands. The valves were tested to +/- 80% (green region) and linearly extrapolated to generate the higher valve command percentages (pink region).
Figure 7: Leg target-velocity test results
To address this occurence, a gain was added in the contro l law to the retract command of the five faster r etracting legs to reduce the co mmanded valve position and slow their retraction to the retract velocit y of the slowest leg. The resulting modification resulted in reduced parasitic accelerations. Figure 8 presents the response of the CMB with the GFD cab during banked m otion. To assess the par asitic acceleration in the sway axis, the motion base was banked to several orie ntations with sinusoidal accelerations commanded in cab-axis heave. The commanded simulator reference frame pure heave motion consisted of constant frequency sinusoids ranging from 0.5Hz to 4Hz, in incre ments of 0.5Hz, splined together afte r two cy cles at ea ch frequency. The measured simulator reference frame heave and sway accelerations in Figure 8 illustrate the l evels of parasitic (sway in this example) accelerations across s everal frequencies for both the pr evious and new production control laws. Significant reduction in the parasitic sway accelerations was ac hieved. The overall performance of t he new production controller is presented in the following section. For co mparison, the performance characteristics of the previous controller are provided in the Appendix.
7
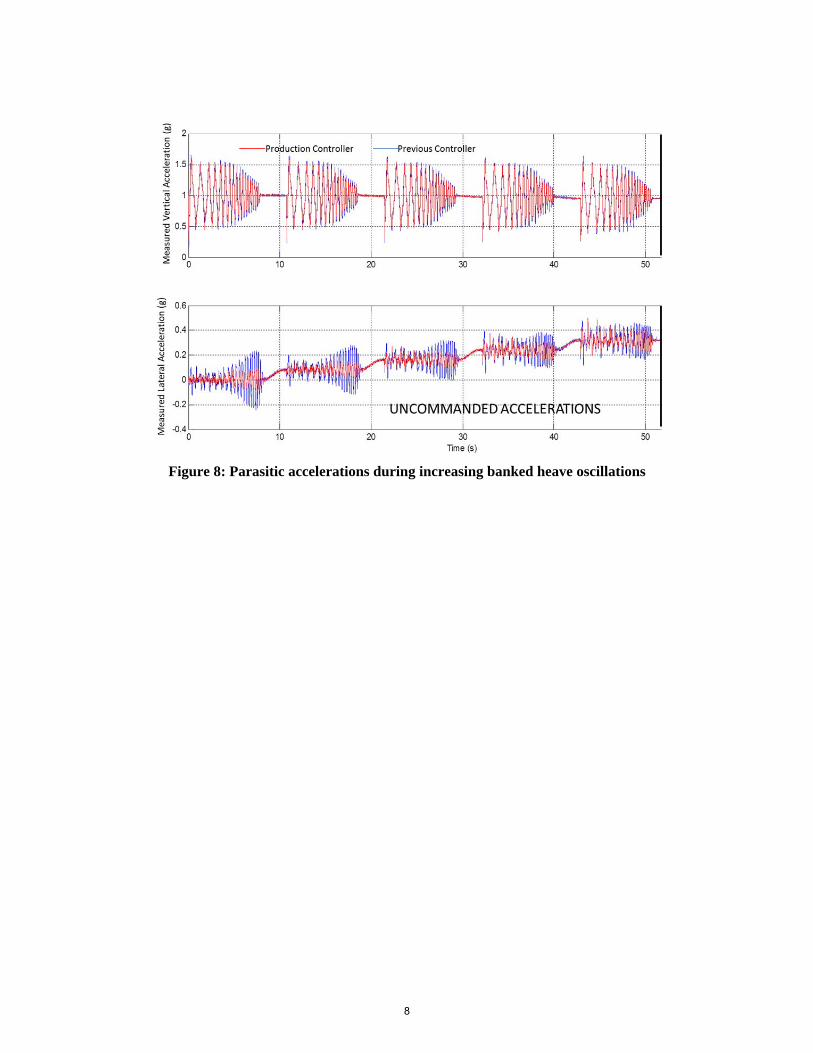
Figure 8: Parasitic accelerations during increasing banked heave oscillations
8
CMB PERFORMANCE AND COMPARISONS
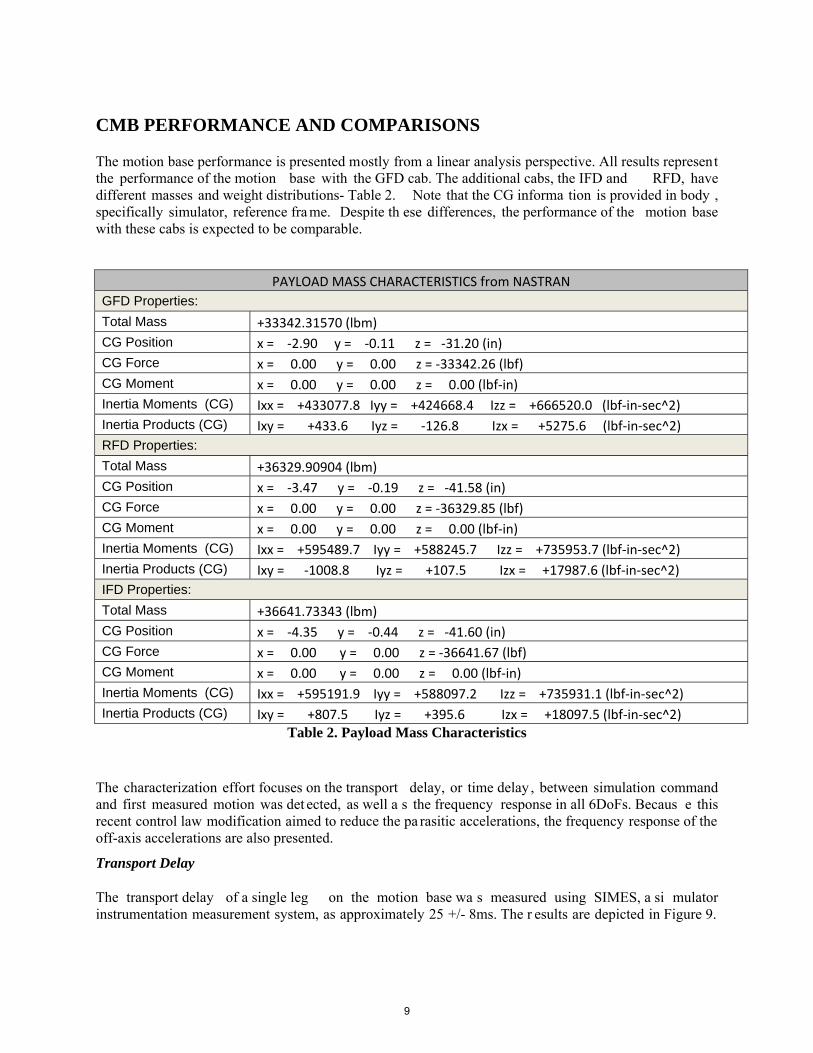
The motion base performance is presented mostly from a linear analysis perspective. All results represent the performance of the motion base with the GFD cab. The additional cabs, the IFD and RFD, have different masses and weight distributions- Table 2. Note that the CG informa tion is provided in body , specifically simulator, reference fra me. Despite th ese differences, the performance of the motion base with these cabs is expected to be comparable.
PAYLOAD MASS CHARACTERISTICS from NASTRAN
GFD Properties:
Total Mass +33342.31570 (lbm)
CG Position x = ‐2.90 y = ‐0.11 z = ‐31.20 (in)
CG Force x = 0.00 y = 0.00 z = ‐33342.26 (lbf)
CG Moment x = 0.00 y = 0.00 z = 0.00 (lbf‐in)
Inertia Moments (CG) Ixx = +433077.8 Iyy = +424668.4 Izz = +666520.0 (lbf‐in‐sec^2)
Inertia Products (CG) Ixy = +433.6 Iyz = ‐126.8 Izx = +5275.6 (lbf‐in‐sec^2)
RFD Properties:
Total Mass +36329.90904 (lbm)
CG Position x = ‐3.47 y = ‐0.19 z = ‐41.58 (in)
CG Force x = 0.00 y = 0.00 z = ‐36329.85 (lbf)
CG Moment x = 0.00 y = 0.00 z = 0.00 (lbf‐in)
Inertia Moments (CG) Ixx = +595489.7 Iyy = +588245.7 Izz = +735953.7 (lbf‐in‐sec^2)
Inertia Products (CG) Ixy = ‐1008.8 Iyz = +107.5 Izx = +17987.6 (lbf‐in‐sec^2)
IFD Properties:
Total Mass +36641.73343 (lbm)
CG Position x = ‐4.35 y = ‐0.44 z = ‐41.60 (in)
CG Force x = 0.00 y = 0.00 z = ‐36641.67 (lbf)
CG Moment x = 0.00 y = 0.00 z = 0.00 (lbf‐in)
Inertia Moments (CG) Ixx = +595191.9 Iyy = +588097.2 Izz = +735931.1 (lbf‐in‐sec^2)
Inertia Products (CG) Ixy = +807.5 Iyz = +395.6 Izx = +18097.5 (lbf‐in‐sec^2) Table 2. Payload Mass Characteristics
The characterization effort focuses on the transport delay, or time delay , between simulation command and first measured motion was det ected, as well a s the frequency response in all 6DoFs. Becaus e this recent control law modification aimed to reduce the pa rasitic accelerations, the frequency response of the off-axis accelerations are also presented.
Transport Delay
The transport delay of a single leg on the motion base wa s measured using SIMES, a si mulator instrumentation measurement system, as approximately 25 +/- 8ms. The r esults are depicted in Figure 9.
9
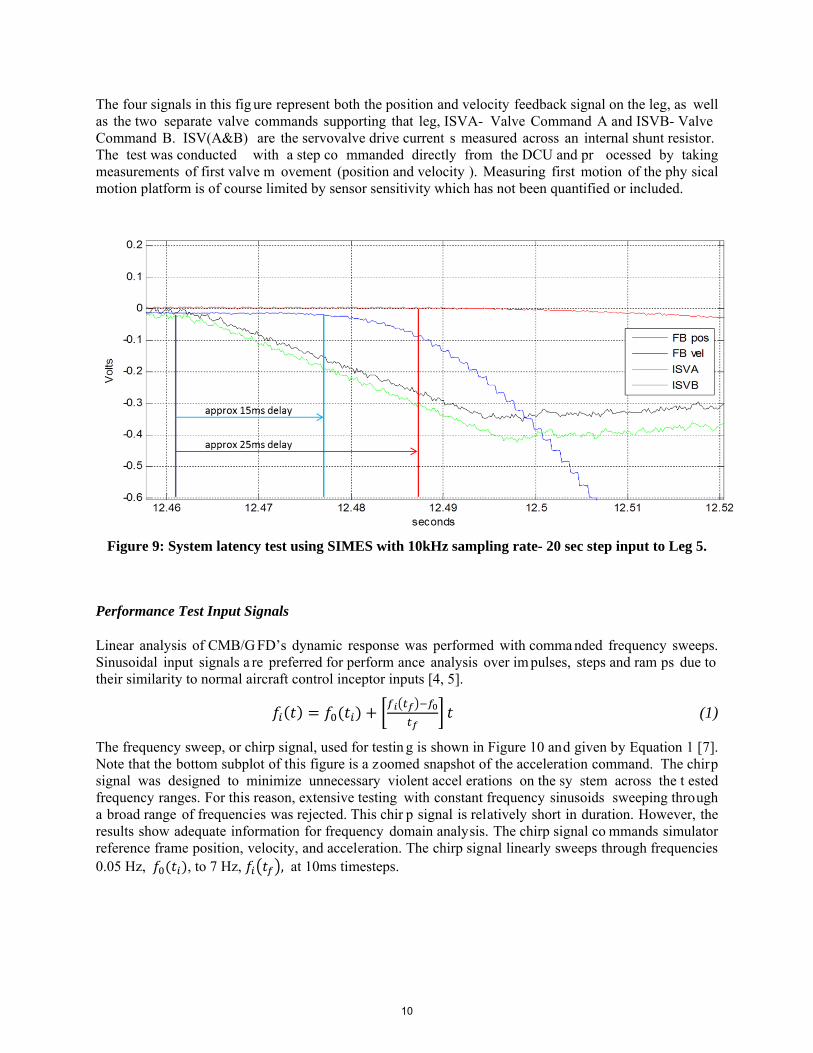
The four signals in this fig ure represent both the position and velocity feedback signal on the leg, as well as the two separate valve commands supporting that leg, ISVA- Valve Command A and ISVB- Valve Command B. ISV(A&B) are the servovalve drive current s measured across an internal shunt resistor. The test was conducted with a step co mmanded directly from the DCU and pr ocessed by taking measurements of first valve m ovement (position and velocity ). Measuring first motion of the phy sical motion platform is of course limited by sensor sensitivity which has not been quantified or included.
Figure 9: System latency test using SIMES with 10kHz sampling rate- 20 sec step input to Leg 5.
Performance Test Input Signals
Linear analysis of CMB/G FD’s dynamic response was performed with comma nded frequency sweeps. Sinusoidal input signals a re preferred for perform ance analysis over im pulses, steps and ram ps due to their similarity to normal aircraft control inceptor inputs [4, 5].
(1)
The frequency sweep, or chirp signal, used for testin g is shown in Figure 10 and given by Equation 1 [7]. Note that the bottom subplot of this figure is a zoomed snapshot of the acceleration command. The chirp signal was designed to minimize unnecessary violent accel erations on the sy stem across the t ested frequency ranges. For this reason, extensive testing with constant frequency sinusoids sweeping through a broad range of frequencies was rejected. This chir p signal is relatively short in duration. However, the results show adequate information for frequency domain analysis. The chirp signal co mmands simulator reference frame position, velocity, and acceleration. The chirp signal linearly sweeps through frequencies 0.05 Hz, , to 7 Hz, , at 10ms timesteps.
10
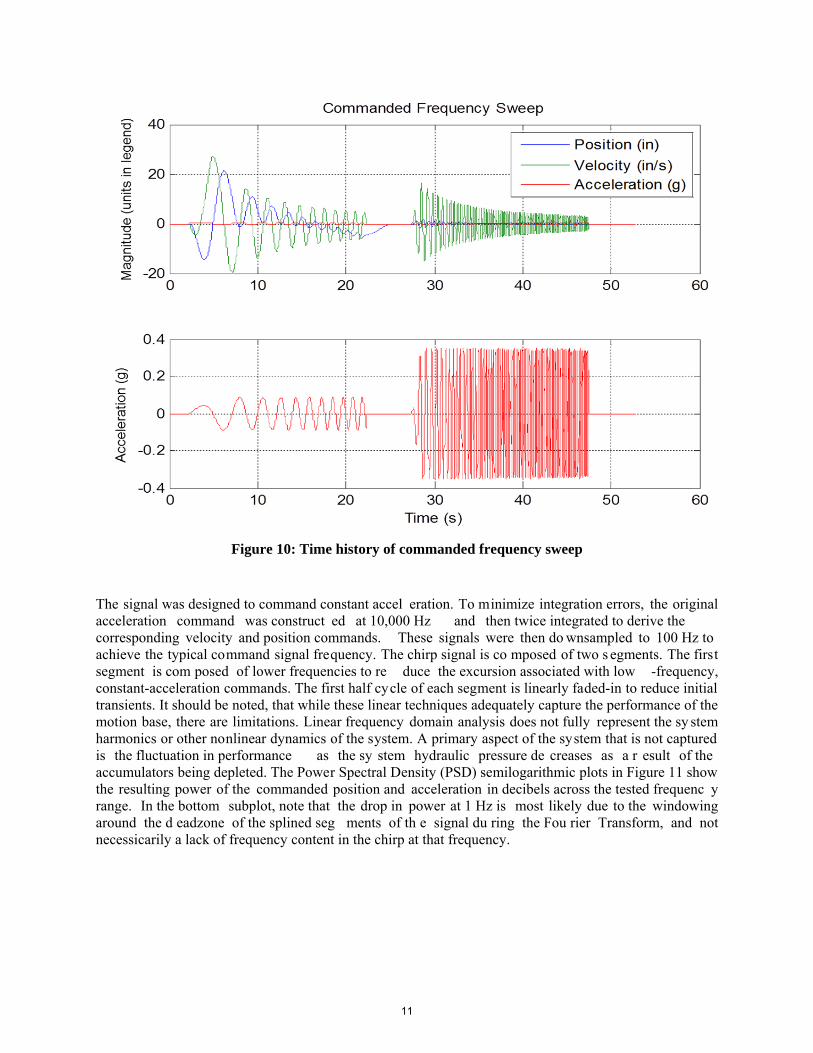
Figure 10: Time history of commanded frequency sweep
The signal was designed to command constant accel eration. To minimize integration errors, the original acceleration command was construct ed at 10,000 Hz and then twice integrated to derive the corresponding velocity and position commands. These signals were then do wnsampled to 100 Hz to achieve the typical command signal frequency. The chirp signal is co mposed of two s egments. The first segment is com posed of lower frequencies to re duce the excursion associated with low -frequency, constant-acceleration commands. The first half cycle of each segment is linearly faded-in to reduce initial transients. It should be noted, that while these linear techniques adequately capture the performance of the motion base, there are limitations. Linear frequency domain analysis does not fully represent the sy stem harmonics or other nonlinear dynamics of the system. A primary aspect of the system that is not captured is the fluctuation in performance as the sy stem hydraulic pressure de creases as a r esult of the accumulators being depleted. The Power Spectral Density (PSD) semilogarithmic plots in Figure 11 show the resulting power of the commanded position and acceleration in decibels across the tested frequenc y range. In the bottom subplot, note that the drop in power at 1 Hz is most likely due to the windowing around the d eadzone of the splined seg ments of th e signal du ring the Fou rier Transform, and not necessicarily a lack of frequency content in the chirp at that frequency.
11
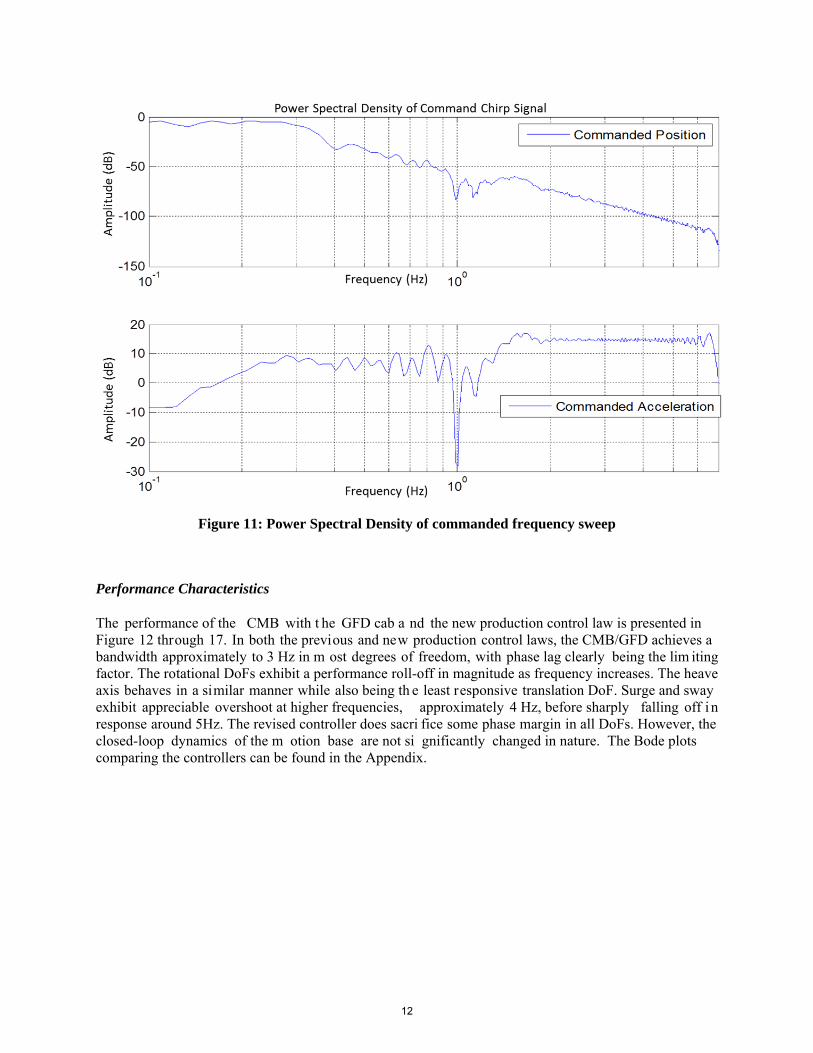
Figure 11: Power Spectral Density of commanded frequency sweep
Performance Characteristics
The performance of the CMB with t he GFD cab a nd the new production control law is presented in Figure 12 through 17. In both the previous and new production control laws, the CMB/GFD achieves a bandwidth approximately to 3 Hz in m ost degrees of freedom, with phase lag clearly being the lim iting factor. The rotational DoFs exhibit a performance roll-off in magnitude as frequency increases. The heave axis behaves in a similar manner while also being th e least responsive translation DoF. Surge and sway exhibit appreciable overshoot at higher frequencies, approximately 4 Hz, before sharply falling off i n response around 5Hz. The revised controller does sacri fice some phase margin in all DoFs. However, the closed-loop dynamics of the m otion base are not si gnificantly changed in nature. The Bode plots comparing the controllers can be found in the Appendix.
12
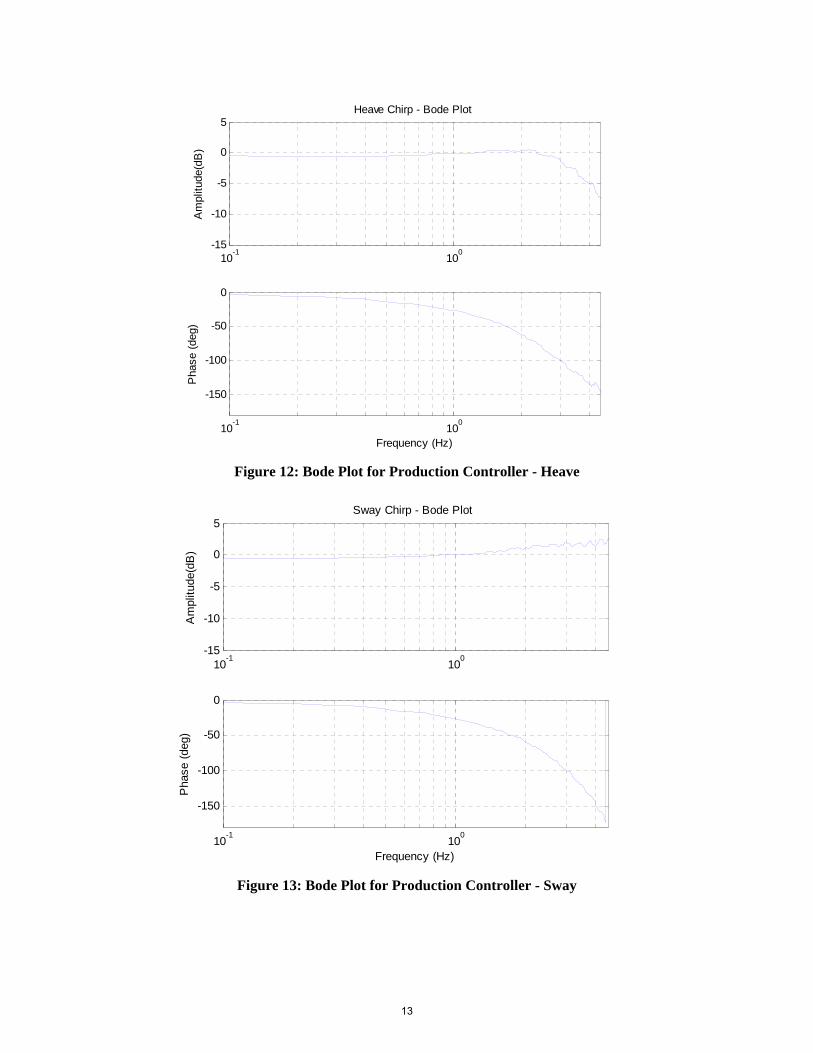
Figure 12: Bode Plot for Production Controller - Heave
Figure 13: Bode Plot for Production Controller - Sway
10-1
100
-15
-10
-5
0
5
Am
plitu
de(d
B)
Heave Chirp - Bode Plot
10-1
100
-150
-100
-50
0
Frequency (Hz)
Pha
se (
deg)
10-1
100
-15
-10
-5
0
5
Am
plitu
de(d
B)
Sway Chirp - Bode Plot
10-1
100
-150
-100
-50
0
Frequency (Hz)
Pha
se (
deg)
13
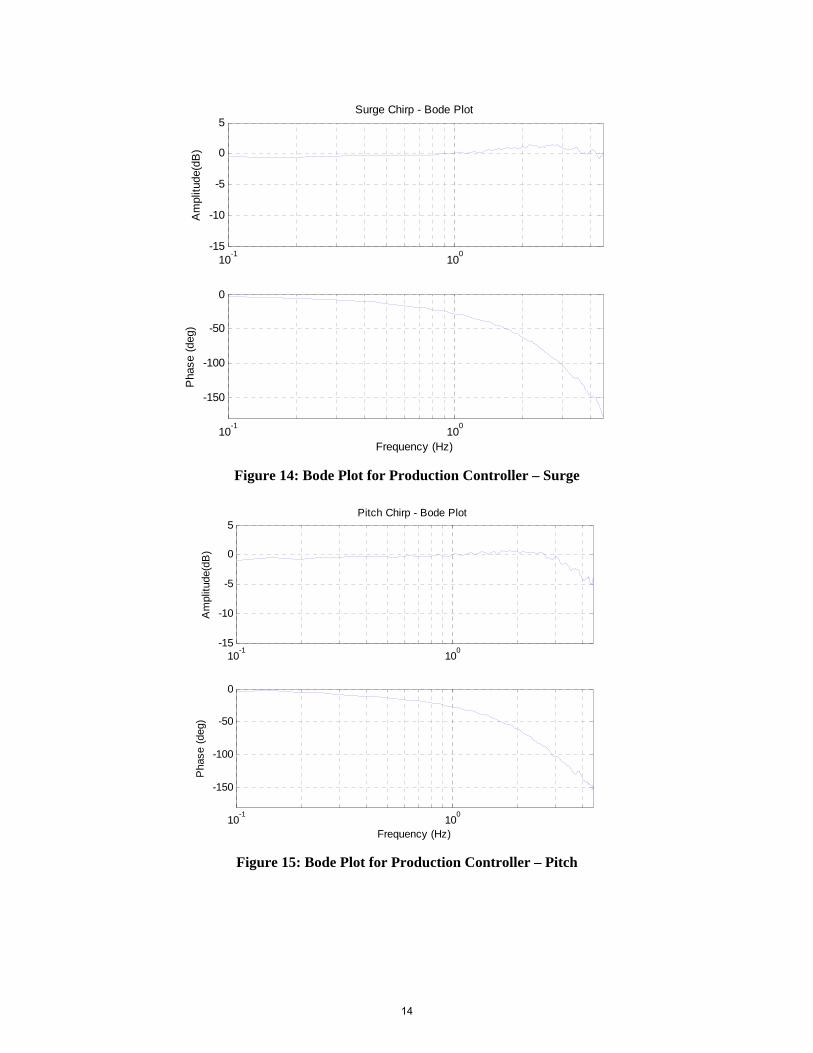
Figure 14: Bode Plot for Production Controller – Surge
Figure 15: Bode Plot for Production Controller – Pitch
10-1
100
-15
-10
-5
0
5
Am
plitu
de(d
B)
Surge Chirp - Bode Plot
10-1
100
-150
-100
-50
0
Frequency (Hz)
Pha
se (
deg)
10-1
100
-15
-10
-5
0
5
Am
plitu
de(d
B)
Pitch Chirp - Bode Plot
10-1
100
-150
-100
-50
0
Frequency (Hz)
Pha
se (
deg)
14

Figure 16: Bode Plot for Production Controller – Roll
Figure 17: Bode Plot for Production Controller – Yaw
The previous linear analysis techniques we re extended to as sess the cur rent levels of parasitic acceleration, as this was the motivation for the recent control law modification. The Bode plots in Figures
10-1
100
-15
-10
-5
0
5
Am
plitu
de (
dB)
Roll Chirp - Bode Plot
10-1
100
-150
-100
-50
0
Frequency (Hz)
Pha
se (
deg)
10-1
100
-15
-10
-5
0
5
Am
plitu
de (
dB)
Yaw Chirp - Bode Plot
10-1
100
-150
-100
-50
0
Frequency (Hz)
Pha
se (
deg)
15
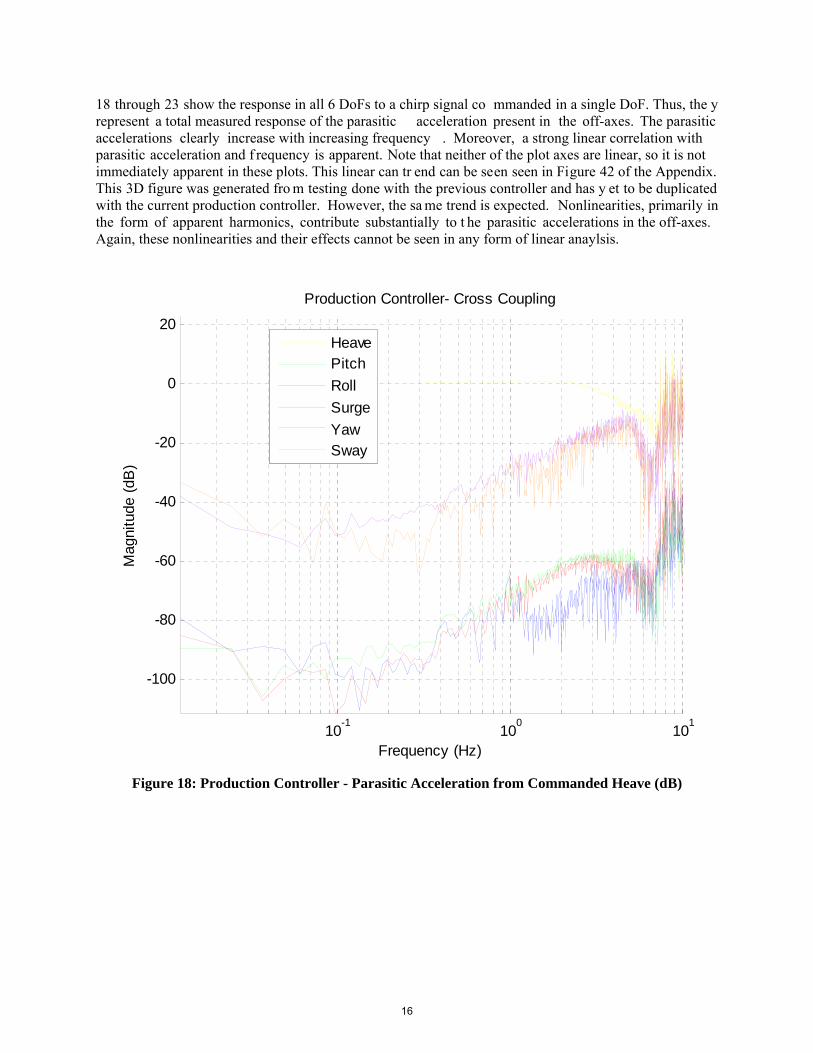
18 through 23 show the response in all 6 DoFs to a chirp signal co mmanded in a single DoF. Thus, the y represent a total measured response of the parasitic acceleration present in the off-axes. The parasitic accelerations clearly increase with increasing frequency . Moreover, a strong linear correlation with parasitic acceleration and f requency is apparent. Note that neither of the plot axes are linear, so it is not immediately apparent in these plots. This linear can tr end can be seen seen in Figure 42 of the Appendix. This 3D figure was generated fro m testing done with the previous controller and has y et to be duplicated with the current production controller. However, the sa me trend is expected. Nonlinearities, primarily in the form of apparent harmonics, contribute substantially to t he parasitic accelerations in the off-axes. Again, these nonlinearities and their effects cannot be seen in any form of linear anaylsis.
Figure 18: Production Controller - Parasitic Acceleration from Commanded Heave (dB)
10-1
100
101
-100
-80
-60
-40
-20
0
20
Frequency (Hz)
Mag
nitu
de (
dB)
Production Controller- Cross Coupling
HeavePitch
Roll
Surge
YawSway
16
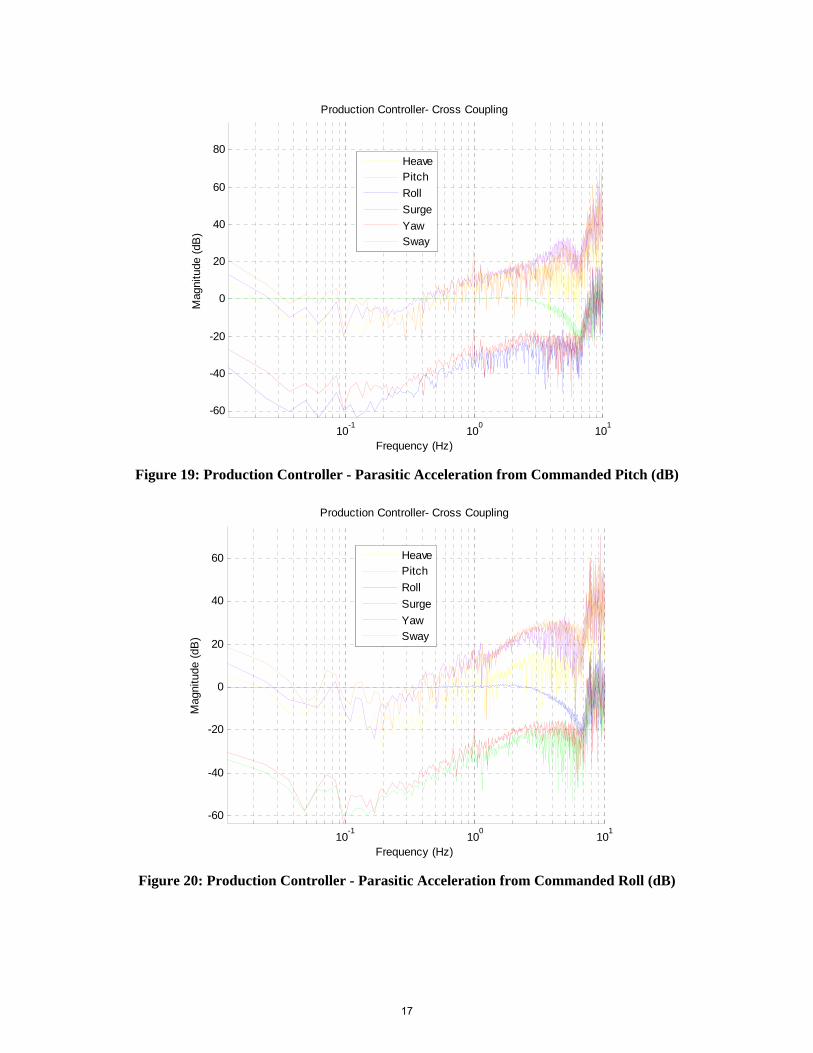
Figure 19: Production Controller - Parasitic Acceleration from Commanded Pitch (dB)
Figure 20: Production Controller - Parasitic Acceleration from Commanded Roll (dB)
10-1
100
101
-60
-40
-20
0
20
40
60
80
Frequency (Hz)
Mag
nitu
de (
dB)
Production Controller- Cross Coupling
HeavePitch
Roll
Surge
YawSway
10-1
100
101
-60
-40
-20
0
20
40
60
Frequency (Hz)
Mag
nitu
de (
dB)
Production Controller- Cross Coupling
HeavePitch
Roll
Surge
YawSway
17
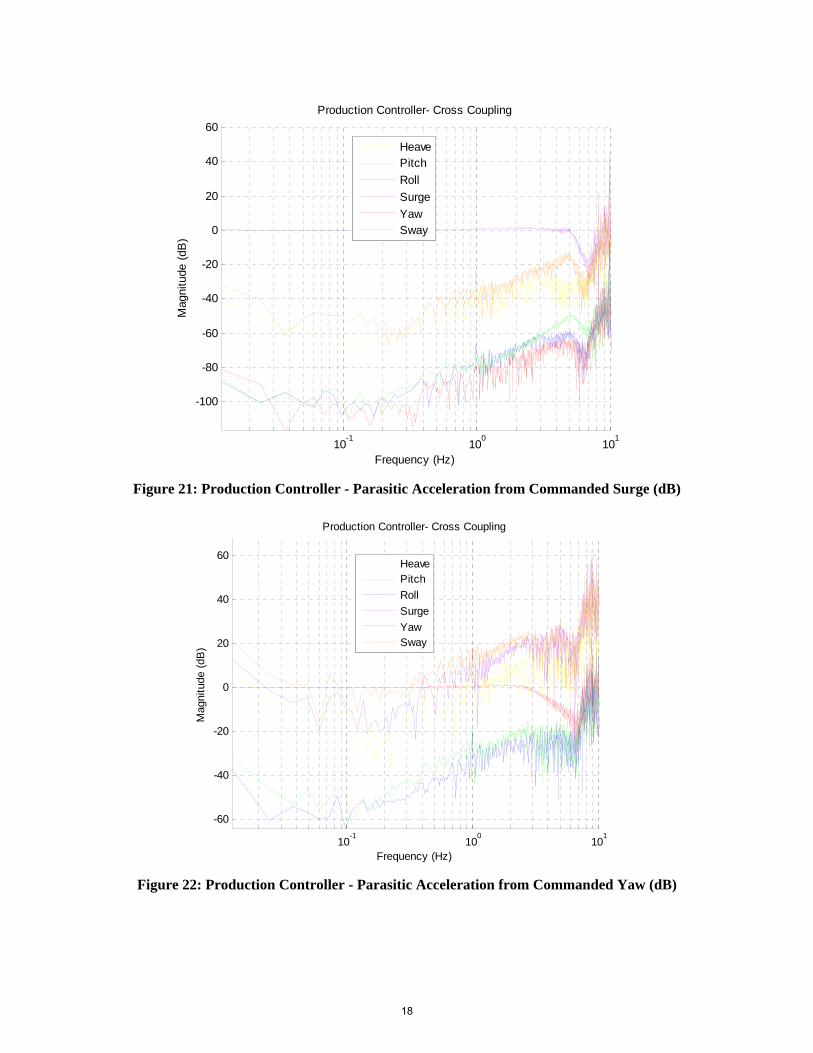
Figure 21: Production Controller - Parasitic Acceleration from Commanded Surge (dB)
Figure 22: Production Controller - Parasitic Acceleration from Commanded Yaw (dB)
10-1
100
101
-100
-80
-60
-40
-20
0
20
40
60
Frequency (Hz)
Mag
nitu
de (
dB)
Production Controller- Cross Coupling
HeavePitch
Roll
Surge
YawSway
10-1
100
101
-60
-40
-20
0
20
40
60
Frequency (Hz)
Mag
nitu
de (
dB)
Production Controller- Cross Coupling
HeavePitch
Roll
Surge
YawSway
18
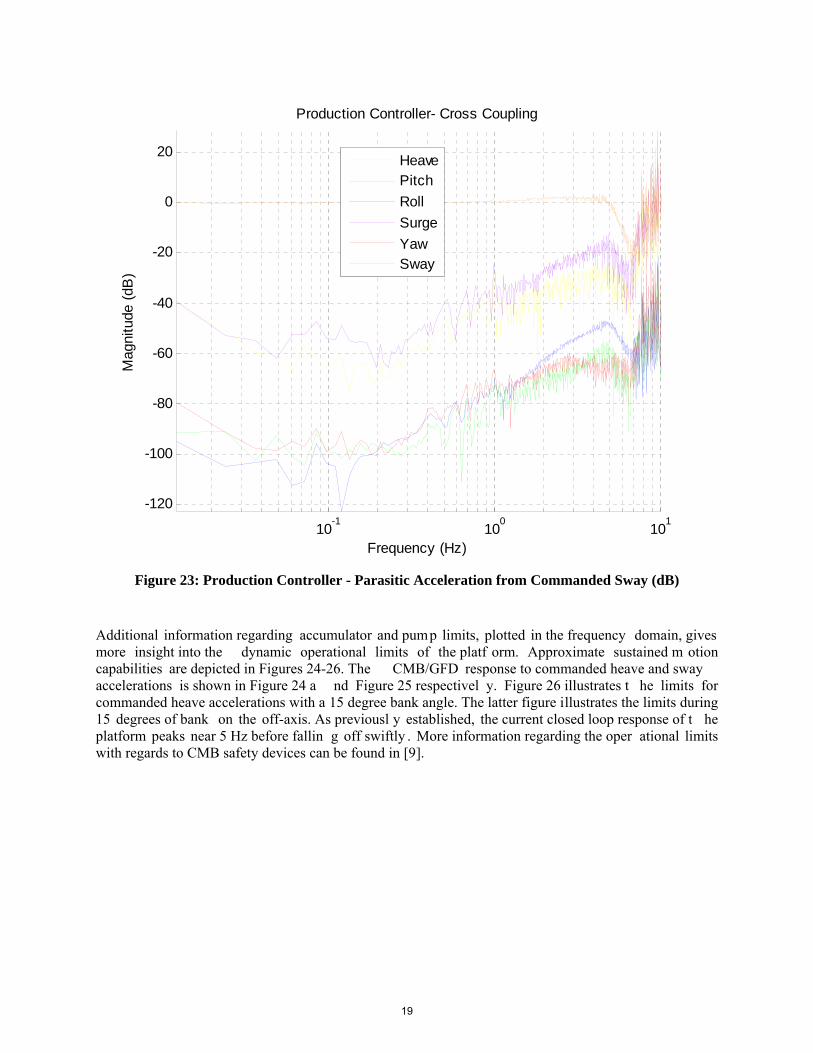
Figure 23: Production Controller - Parasitic Acceleration from Commanded Sway (dB)
Additional information regarding accumulator and pump limits, plotted in the frequency domain, gives more insight into the dynamic operational limits of the platf orm. Approximate sustained m otion capabilities are depicted in Figures 24-26. The CMB/GFD response to commanded heave and sway accelerations is shown in Figure 24 a nd Figure 25 respectivel y. Figure 26 illustrates t he limits for commanded heave accelerations with a 15 degree bank angle. The latter figure illustrates the limits during 15 degrees of bank on the off-axis. As previousl y established, the current closed loop response of t he platform peaks near 5 Hz before fallin g off swiftly . More information regarding the oper ational limits with regards to CMB safety devices can be found in [9].
10-1
100
101
-120
-100
-80
-60
-40
-20
0
20
Frequency (Hz)
Mag
nitu
de (
dB)
Production Controller- Cross Coupling
HeavePitch
Roll
Surge
YawSway
19
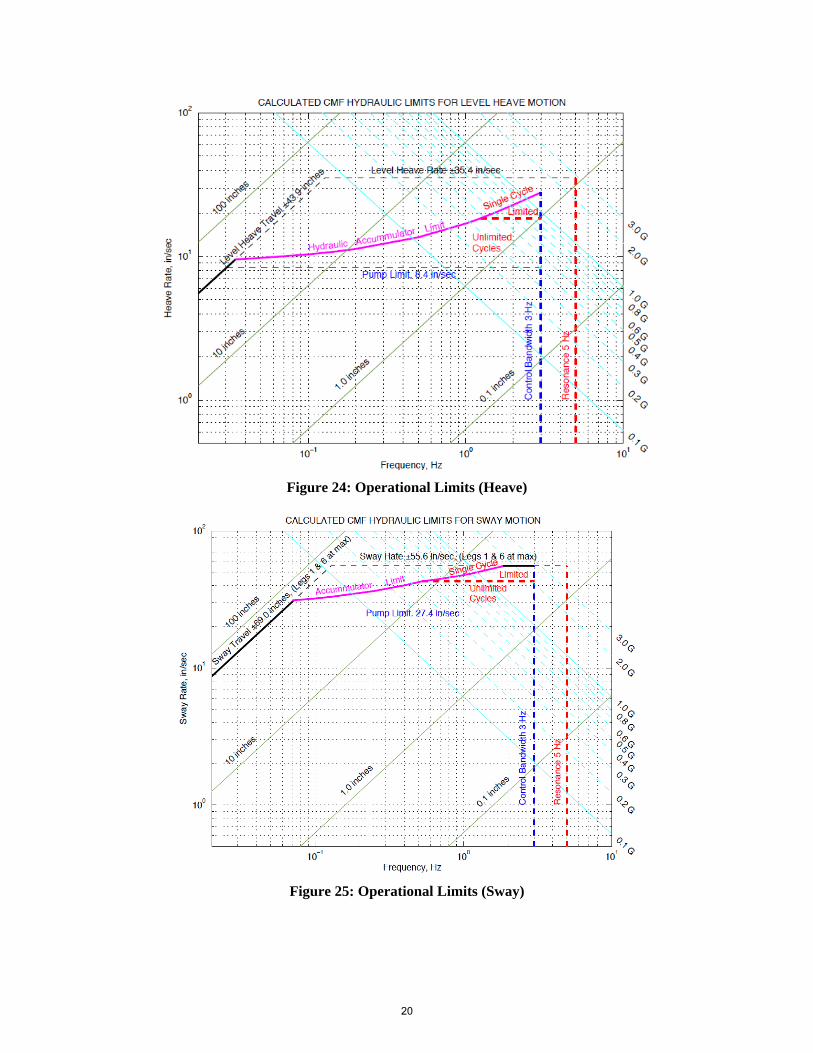
Figure 24: Operational Limits (Heave)
Figure 25: Operational Limits (Sway)
20
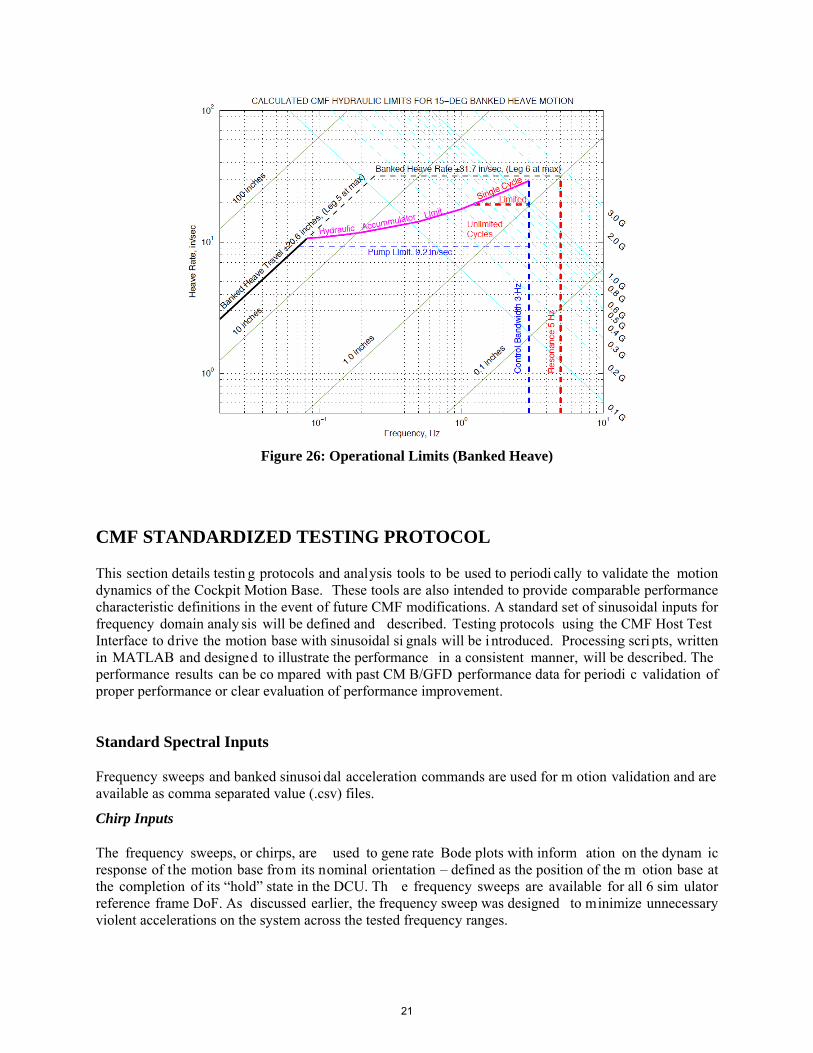
Figure 26: Operational Limits (Banked Heave)
CMF STANDARDIZED TESTING PROTOCOL
This section details testin g protocols and analysis tools to be used to periodi cally to validate the motion dynamics of the Cockpit Motion Base. These tools are also intended to provide comparable performance characteristic definitions in the event of future CMF modifications. A standard set of sinusoidal inputs for frequency domain analy sis will be defined and described. Testing protocols using the CMF Host Test Interface to drive the motion base with sinusoidal si gnals will be i ntroduced. Processing scri pts, written in MATLAB and designed to illustrate the performance in a consistent manner, will be described. The performance results can be co mpared with past CM B/GFD performance data for periodi c validation of proper performance or clear evaluation of performance improvement.
Standard Spectral Inputs
Frequency sweeps and banked sinusoi dal acceleration commands are used for m otion validation and are available as comma separated value (.csv) files.
Chirp Inputs
The frequency sweeps, or chirps, are used to gene rate Bode plots with inform ation on the dynam ic response of the motion base from its nominal orientation – defined as the position of the m otion base at the completion of its “hold” state in the DCU. Th e frequency sweeps are available for all 6 sim ulator reference frame DoF. As discussed earlier, the frequency sweep was designed to minimize unnecessary violent accelerations on the system across the tested frequency ranges.
21
Banked, Sinusoidal Inputs
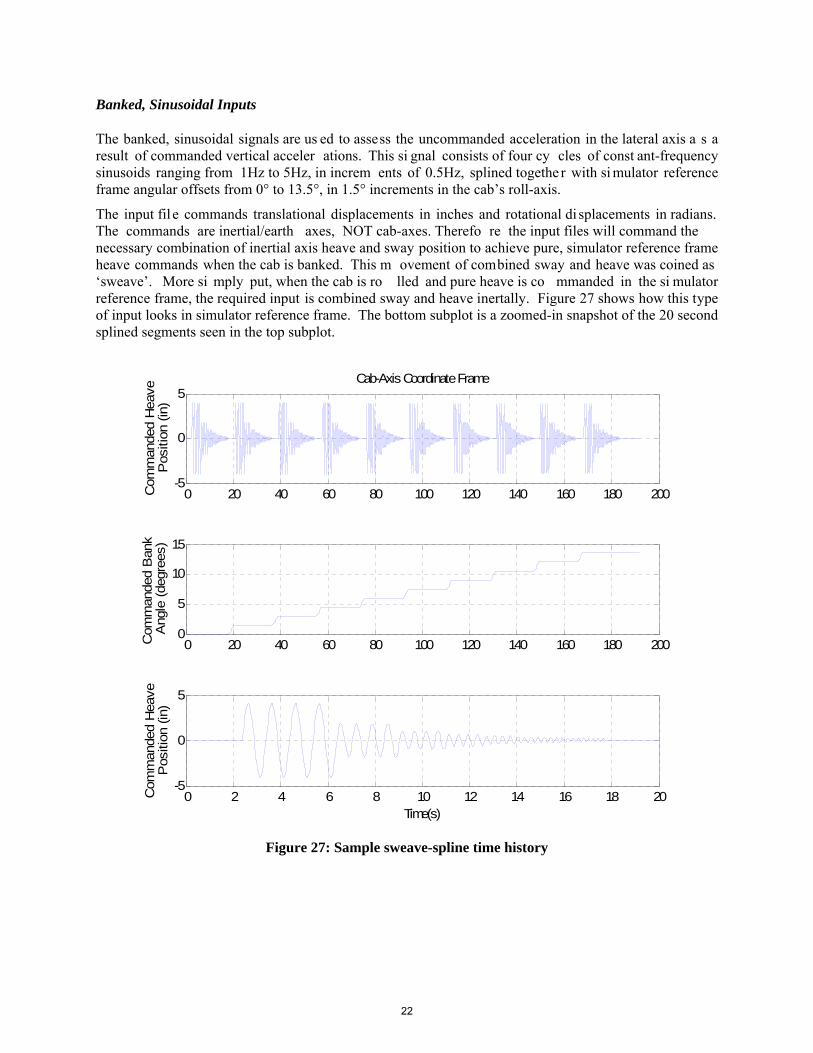
The banked, sinusoidal signals are us ed to assess the uncommanded acceleration in the lateral axis a s a result of commanded vertical acceler ations. This si gnal consists of four cy cles of const ant-frequency sinusoids ranging from 1Hz to 5Hz, in increm ents of 0.5Hz, splined togethe r with si mulator reference frame angular offsets from 0° to 13.5°, in 1.5° increments in the cab’s roll-axis.
The input fil e commands translational displacements in inches and rotational di splacements in radians. The commands are inertial/earth axes, NOT cab-axes. Therefo re the input files will command the necessary combination of inertial axis heave and sway position to achieve pure, simulator reference frame heave commands when the cab is banked. This m ovement of combined sway and heave was coined as ‘sweave’. More si mply put, when the cab is ro lled and pure heave is co mmanded in the si mulator reference frame, the required input is combined sway and heave inertally. Figure 27 shows how this type of input looks in simulator reference frame. The bottom subplot is a zoomed-in snapshot of the 20 second splined segments seen in the top subplot.
Figure 27: Sample sweave-spline time history
0 20 40 60 80 100 120 140 160 180 200-5
0
5
Com
man
ded
Hea
ve P
ositi
on (
in)
Cab-Axis Coordinate Frame
0 20 40 60 80 100 120 140 160 180 2000
5
10
15
Com
man
ded
Ban
k A
ngle
(de
gree
s)
0 2 4 6 8 10 12 14 16 18 20-5
0
5
Com
man
ded
Hea
ve P
ositi
on (
in)
Time(s)
22
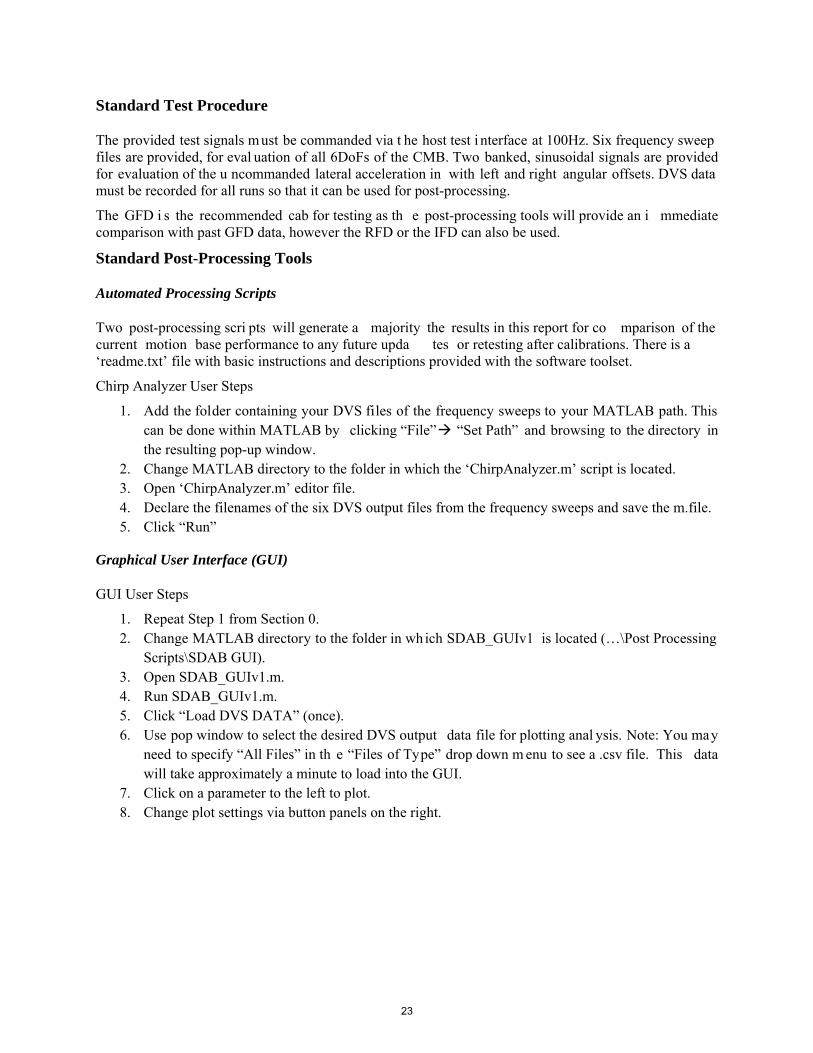
Standard Test Procedure
The provided test signals m ust be commanded via t he host test i nterface at 100Hz. Six frequency sweep files are provided, for eval uation of all 6DoFs of the CMB. Two banked, sinusoidal signals are provided for evaluation of the u ncommanded lateral acceleration in with left and right angular offsets. DVS data must be recorded for all runs so that it can be used for post-processing.
The GFD i s the recommended cab for testing as th e post-processing tools will provide an i mmediate comparison with past GFD data, however the RFD or the IFD can also be used.
Standard Post-Processing Tools
Automated Processing Scripts
Two post-processing scri pts will generate a majority the results in this report for co mparison of the current motion base performance to any future upda tes or retesting after calibrations. There is a ‘readme.txt’ file with basic instructions and descriptions provided with the software toolset.
Chirp Analyzer User Steps
1. Add the folder containing your DVS files of the frequency sweeps to your MATLAB path. This can be done within MATLAB by clicking “File” “Set Path” and browsing to the directory in the resulting pop-up window.
2. Change MATLAB directory to the folder in which the ‘ChirpAnalyzer.m’ script is located. 3. Open ‘ChirpAnalyzer.m’ editor file. 4. Declare the filenames of the six DVS output files from the frequency sweeps and save the m.file. 5. Click “Run”
Graphical User Interface (GUI)
GUI User Steps
1. Repeat Step 1 from Section 0. 2. Change MATLAB directory to the folder in which SDAB_GUIv1 is located (…\Post Processing
Scripts\SDAB GUI). 3. Open SDAB_GUIv1.m. 4. Run SDAB_GUIv1.m. 5. Click “Load DVS DATA” (once). 6. Use pop window to select the desired DVS output data file for plotting anal ysis. Note: You may
need to specify “All Files” in th e “Files of Type” drop down m enu to see a .csv file. This data will take approximately a minute to load into the GUI.
7. Click on a parameter to the left to plot. 8. Change plot settings via button panels on the right.
23
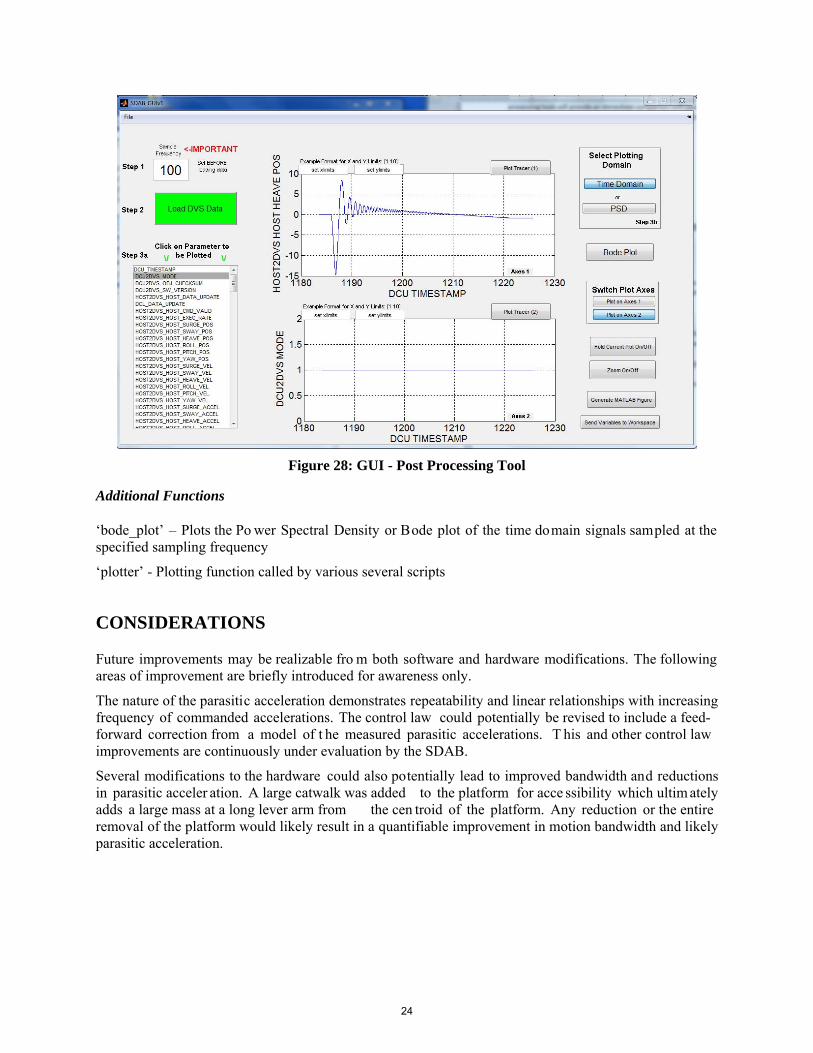
Figure 28: GUI - Post Processing Tool
Additional Functions
‘bode_plot’ – Plots the Po wer Spectral Density or Bode plot of the time domain signals sampled at the specified sampling frequency
‘plotter’ - Plotting function called by various several scripts
CONSIDERATIONS
Future improvements may be realizable fro m both software and hardware modifications. The following areas of improvement are briefly introduced for awareness only.
The nature of the parasitic acceleration demonstrates repeatability and linear relationships with increasing frequency of commanded accelerations. The control law could potentially be revised to include a feed-forward correction from a model of t he measured parasitic accelerations. T his and other control law improvements are continuously under evaluation by the SDAB.
Several modifications to the hardware could also potentially lead to improved bandwidth and reductions in parasitic acceler ation. A large catwalk was added to the platform for acce ssibility which ultim ately adds a large mass at a long lever arm from the cen troid of the platform. Any reduction or the entire removal of the platform would likely result in a quantifiable improvement in motion bandwidth and likely parasitic acceleration.
24
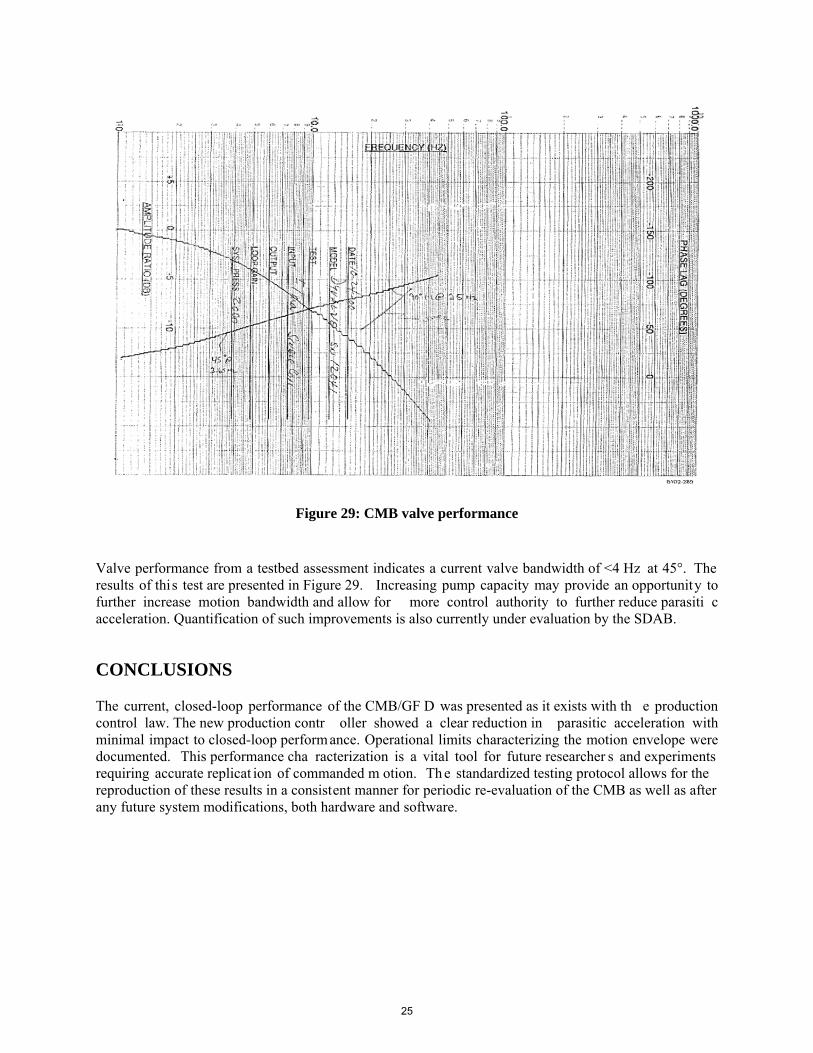
Figure 29: CMB valve performance
Valve performance from a testbed assessment indicates a current valve bandwidth of <4 Hz at 45°. The results of this test are presented in Figure 29. Increasing pump capacity may provide an opportunity to further increase motion bandwidth and allow for more control authority to further reduce parasiti c acceleration. Quantification of such improvements is also currently under evaluation by the SDAB.
CONCLUSIONS
The current, closed-loop performance of the CMB/GF D was presented as it exists with th e production control law. The new production contr oller showed a clear reduction in parasitic acceleration with minimal impact to closed-loop perform ance. Operational limits characterizing the motion envelope were documented. This performance cha racterization is a vital tool for future researcher s and experiments requiring accurate replicat ion of commanded m otion. Th e standardized testing protocol allows for the reproduction of these results in a consistent manner for periodic re-evaluation of the CMB as well as after any future system modifications, both hardware and software.
25

BIBLIOGRAPHY
[1] B. R. Bryant, CMF Motion Base Control Sy stem Derived Requirements. Version A., Ham pton, VA: NASA Langley Research Center. Airbone Systems Competency. Systems and Development Branch, February 5, 2001.
[2] “Dynamic Characteristics of Flig ht Simulator Motion Systems,” Advisory Group for Aerospace Research and Development, North Atlantic Treaty Organization, num ber AGARD-AR-144, AGARD Advisory Report, 1979
[3] B. N. Tomlinson, “Simulator Motion Characteristics and Perceptual Fidelity, A Progress Report,” AGARD Conference Proceedings Num ber 408, Flight Simulation, 7 Rue A ncelle, 922200 Neuill y sur Seine, France, pages 6A- 1--6A-12, Advisory Group for Aerospace R esearch and Development, North Atlantic Treaty Organization, 1986.
[4] Robert J. Telban, Weim in Wu and Frank M. Cardullo, Motion Cu eing Algorithm Development: Initial Investigation and R edesign of the Algorith ms, NASA Langley Research Center, Ham pton (VA), number NASA-CR-2000-209863, Contractor Report, 2000.
[5] L. Gupton, PRT for GFD Motion Shakedown (Test Plans 3.1 - 3. 5 and 3.10). Safety Interlocks and DOF Performance Evaluation, October 6, 2008.
[6] W.R. Berkouwer, O. Stroo sma, M.M. van Paassen, M. Mulder and J.A. Muld er, “Measuring the Performance of the SIMONA Research Simulator's Motion System,” Proceedings of the AIAA Modeling and Simulation Technologies Conference, San Francisco, California, Aug. 15-18, 2005.
[7] P. M. T. Zaal, F. M. Nieuwenhuizen, M. Mulder and M. M. va n Paassen, "Maximum Likelihood Estimation of Multi-Modal Pilot Cont rol Behavior in a Target-Following T ask," IEEE International Conference on Systems, Man and Cybernetics, Singapore, Oct. 12-15 2008.
[8] Mathworks, "R2012a Documentation -> DSP System Toolbox -> Blocks -> Sources - > "Chirp"," Mathworks. Product Documentation., 2012.
[9] L. E. Gupton, R. B. Bry ant and D. J. Ca rrelli, "Evaluating the Perfo rmance of the NASA L aRC CMF Motion Base Safety Devices," Proceedings of the AIAA Modeling and Sim ulation Technologies Conference, Keystone, Colorado, August 21-24, 2006.
[10] "Integrated Intelligent Flight Deck T echnologies (2006-2010). Facilities: Cockpit Motion Faciility (CMF)," [Online]. Available: http://www.aeronautics.nasa.gov/avsafe/iifd/cmf.htm. [Accessed 08 August 2012].
26
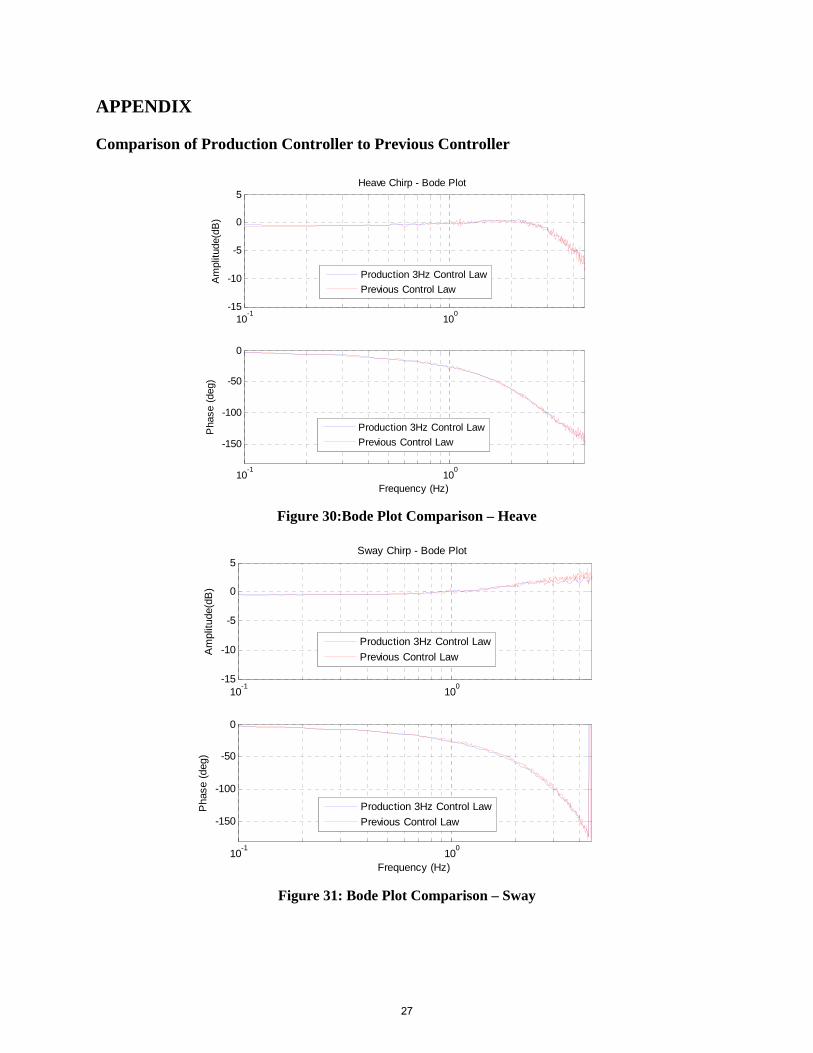
APPENDIX
Comparison of Production Controller to Previous Controller
Figure 30:Bode Plot Comparison – Heave
Figure 31: Bode Plot Comparison – Sway
10-1
100
-15
-10
-5
0
5
Am
plitu
de(d
B)
Heave Chirp - Bode Plot
Production 3Hz Control Law
Previous Control Law
10-1
100
-150
-100
-50
0
Frequency (Hz)
Pha
se (
deg)
Production 3Hz Control Law
Previous Control Law
10-1
100
-15
-10
-5
0
5
Am
plitu
de(d
B)
Sway Chirp - Bode Plot
Production 3Hz Control Law
Previous Control Law
10-1
100
-150
-100
-50
0
Frequency (Hz)
Pha
se (
deg)
Production 3Hz Control Law
Previous Control Law
27
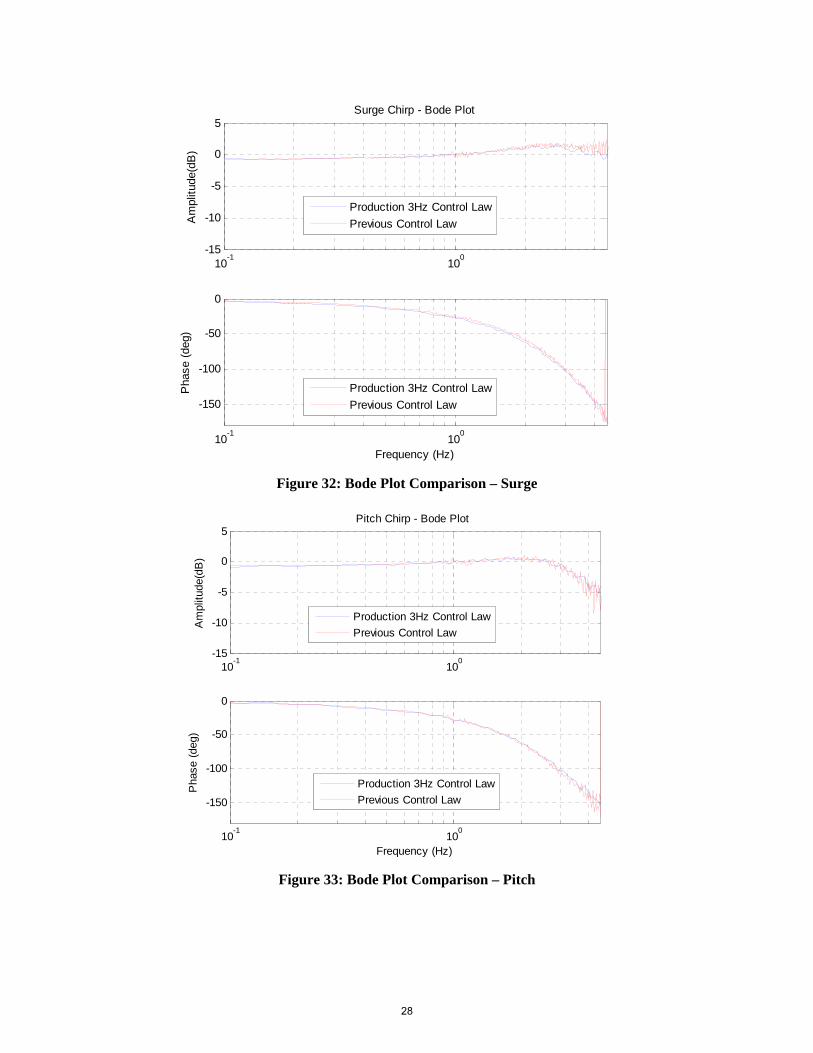
Figure 32: Bode Plot Comparison – Surge
Figure 33: Bode Plot Comparison – Pitch
10-1
100
-15
-10
-5
0
5
Am
plitu
de(d
B)
Surge Chirp - Bode Plot
Production 3Hz Control Law
Previous Control Law
10-1
100
-150
-100
-50
0
Frequency (Hz)
Pha
se (
deg)
Production 3Hz Control Law
Previous Control Law
10-1
100
-15
-10
-5
0
5
Am
plitu
de(d
B)
Pitch Chirp - Bode Plot
Production 3Hz Control Law
Previous Control Law
10-1
100
-150
-100
-50
0
Frequency (Hz)
Pha
se (
deg)
Production 3Hz Control Law
Previous Control Law
28
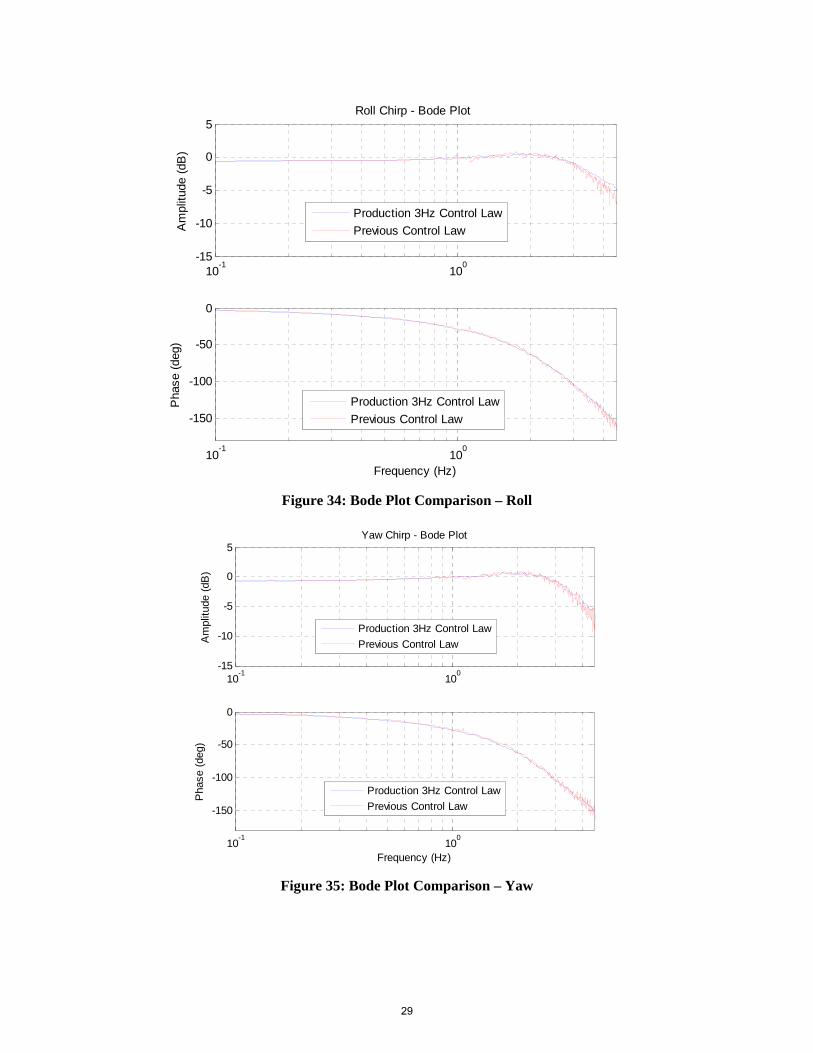
Figure 34: Bode Plot Comparison – Roll
Figure 35: Bode Plot Comparison – Yaw
10-1
100
-15
-10
-5
0
5
Am
plitu
de (
dB)
Roll Chirp - Bode Plot
Production 3Hz Control Law
Previous Control Law
10-1
100
-150
-100
-50
0
Frequency (Hz)
Pha
se (
deg)
Production 3Hz Control Law
Previous Control Law
10-1
100
-15
-10
-5
0
5
Am
plitu
de (
dB)
Yaw Chirp - Bode Plot
Production 3Hz Control Law
Previous Control Law
10-1
100
-150
-100
-50
0
Frequency (Hz)
Pha
se (
deg)
Production 3Hz Control Law
Previous Control Law
29
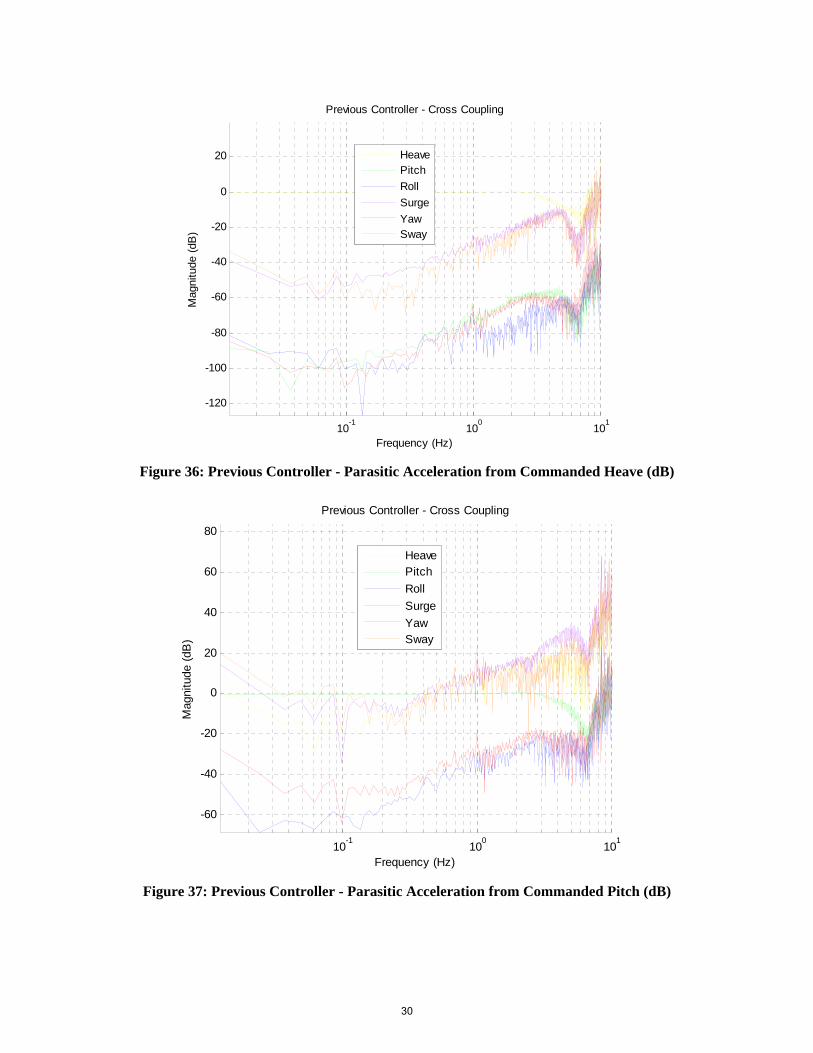
Figure 36: Previous Controller - Parasitic Acceleration from Commanded Heave (dB)
Figure 37: Previous Controller - Parasitic Acceleration from Commanded Pitch (dB)
10-1
100
101
-120
-100
-80
-60
-40
-20
0
20
Frequency (Hz)
Mag
nitu
de (
dB)
Previous Controller - Cross Coupling
HeavePitch
Roll
Surge
YawSway
10-1
100
101
-60
-40
-20
0
20
40
60
80
Frequency (Hz)
Mag
nitu
de (
dB)
Previous Controller - Cross Coupling
HeavePitch
Roll
Surge
YawSway
30
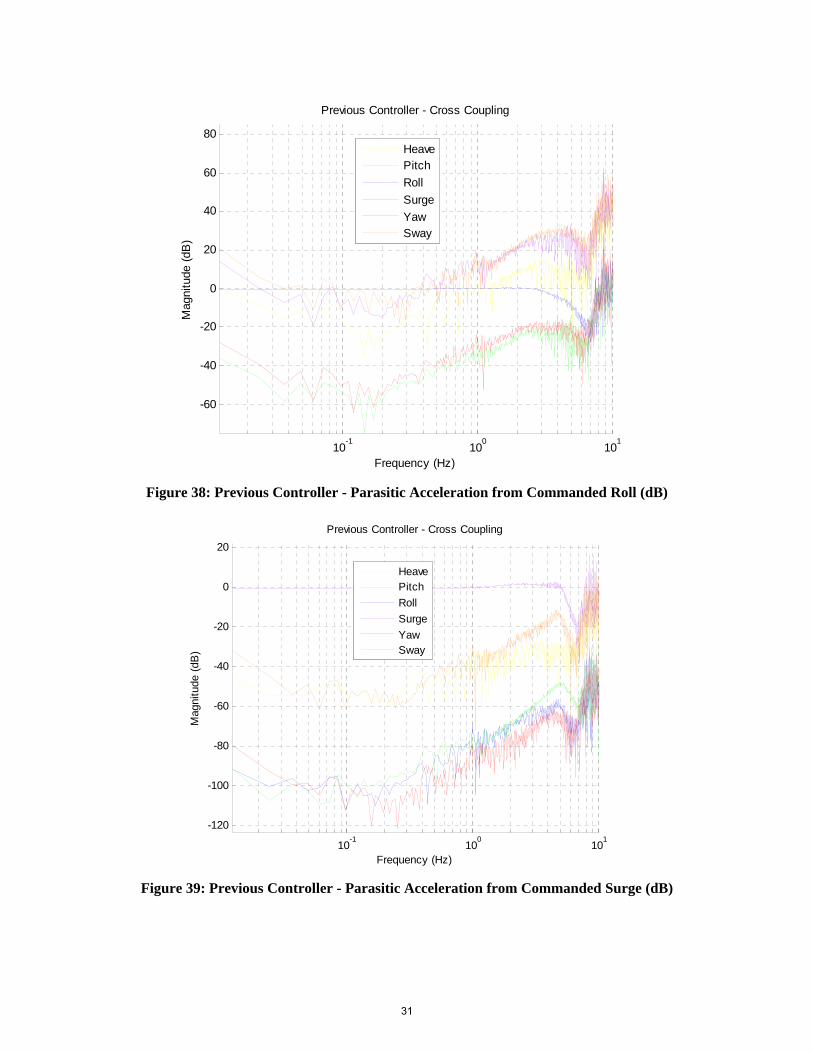
Figure 38: Previous Controller - Parasitic Acceleration from Commanded Roll (dB)
Figure 39: Previous Controller - Parasitic Acceleration from Commanded Surge (dB)
10-1
100
101
-60
-40
-20
0
20
40
60
80
Frequency (Hz)
Mag
nitu
de (
dB)
Previous Controller - Cross Coupling
HeavePitch
Roll
Surge
YawSway
10-1
100
101
-120
-100
-80
-60
-40
-20
0
20
Frequency (Hz)
Mag
nitu
de (
dB)
Previous Controller - Cross Coupling
HeavePitch
Roll
Surge
YawSway
31
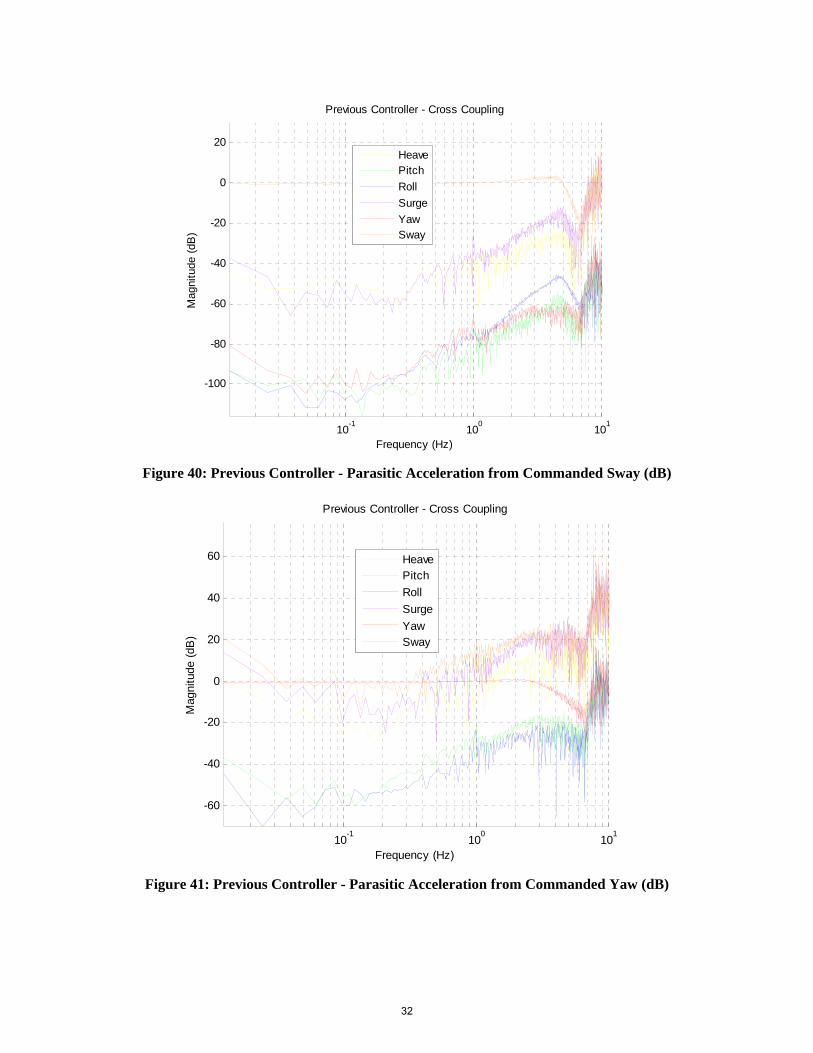
Figure 40: Previous Controller - Parasitic Acceleration from Commanded Sway (dB)
Figure 41: Previous Controller - Parasitic Acceleration from Commanded Yaw (dB)
10-1
100
101
-100
-80
-60
-40
-20
0
20
Frequency (Hz)
Mag
nitu
de (
dB)
Previous Controller - Cross Coupling
HeavePitch
Roll
Surge
YawSway
10-1
100
101
-60
-40
-20
0
20
40
60
Frequency (Hz)
Mag
nitu
de (
dB)
Previous Controller - Cross Coupling
HeavePitch
Roll
Surge
YawSway
32
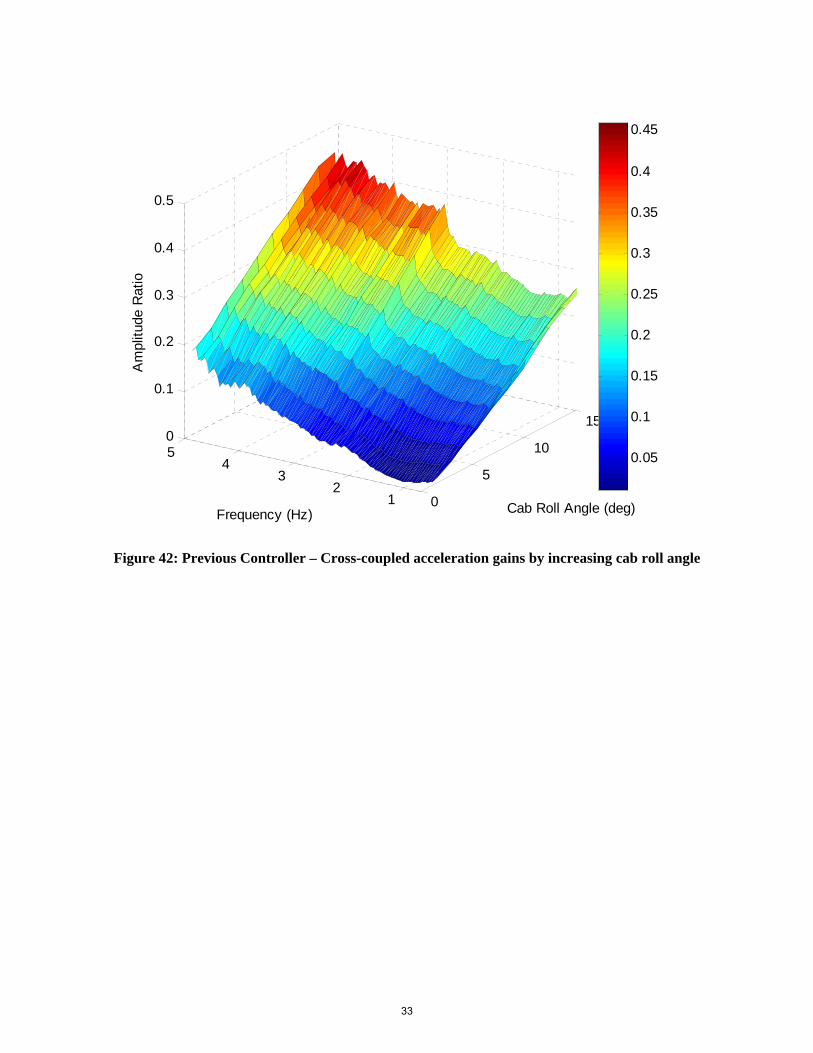
Figure 42: Previous Controller – Cross-coupled acceleration gains by increasing cab roll angle
0
5
10
15
12
34
50
0.1
0.2
0.3
0.4
0.5
Cab Roll Angle (deg)Frequency (Hz)
Am
plitu
de R
atio
0.05
0.1
0.15
0.2
0.25
0.3
0.35
0.4
0.45
33
REPORT DOCUMENTATION PAGEForm Approved
OMB No. 0704-0188
2. REPORT TYPE
Technical Memorandum 4. TITLE AND SUBTITLE
Current Performance Characteristics of NASA Langley Research Center's Cockpit Motion Base and Standardized Test Procedure for Future Performance Characterization
5a. CONTRACT NUMBER
6. AUTHOR(S)
Cowen, Brandon; Stringer, Mary T.; Hutchinson, Brian K.; Davidson, Paul C.; Gupton, Lawrence E.
7. PERFORMING ORGANIZATION NAME(S) AND ADDRESS(ES)
NASA Langley Research CenterHampton, VA 23681-2199
9. SPONSORING/MONITORING AGENCY NAME(S) AND ADDRESS(ES)
National Aeronautics and Space AdministrationWashington, DC 20546-0001
8. PERFORMING ORGANIZATION REPORT NUMBER
L-20355
10. SPONSOR/MONITOR'S ACRONYM(S)
NASA
13. SUPPLEMENTARY NOTES
12. DISTRIBUTION/AVAILABILITY STATEMENTUnclassified - UnlimitedSubject Category 12Availability: NASA CASI (443) 757-5802
19a. NAME OF RESPONSIBLE PERSON
STI Help Desk (email: [email protected])
14. ABSTRACT
This report documents the updated performance characteristics of NASA Langley Research Center's (LaRC) Cockpit Motion Base (CMB) after recent revisions that were made to its inner-loop, feedback control law. The modifications to the control law will be briefly described. The performance of the Cockpit Motion Facility (CMF) will be presented. A short graphical comparison to the previous control law can be found in the appendix of this report. The revised controller will be shown to yield reduced parasitic accelerations with respect to the previous controller. Metrics based on the AGARD Advisory Report No. 144 are used to assess the overall system performance due to its recent control algorithm modification. This report also documents the standardized simulator test procedure which can be used in the future to evaluate potential updates to the control law.
15. SUBJECT TERMS
Control Theory; Motion Base; Simulation18. NUMBER OF PAGES
4219b. TELEPHONE NUMBER (Include area code)
(443) 757-5802
a. REPORT
U
c. THIS PAGE
U
b. ABSTRACT
U
17. LIMITATION OF ABSTRACT
UU
Prescribed by ANSI Std. Z39.18Standard Form 298 (Rev. 8-98)
3. DATES COVERED (From - To)
5b. GRANT NUMBER
5c. PROGRAM ELEMENT NUMBER
5d. PROJECT NUMBER
5e. TASK NUMBER
5f. WORK UNIT NUMBER
160961.01.02.01
11. SPONSOR/MONITOR'S REPORT NUMBER(S)
NASA/TM-2014-218148
16. SECURITY CLASSIFICATION OF:
The public reporting burden for this collection of information is estimated to average 1 hour per response, including the time for reviewing instructions, searching existing data sources, gathering and maintaining the data needed, and completing and reviewing the collection of information. Send comments regarding this burden estimate or any other aspect of this collection of information, including suggestions for reducing this burden, to Department of Defense, Washington Headquarters Services, Directorate for Information Operations and Reports (0704-0188), 1215 Jefferson Davis Highway, Suite 1204, Arlington, VA 22202-4302. Respondents should be aware that notwithstanding any other provision of law, no person shall be subject to any penalty for failing to comply with a collection of information if it does not display a currently valid OMB control number.PLEASE DO NOT RETURN YOUR FORM TO THE ABOVE ADDRESS.
1. REPORT DATE (DD-MM-YYYY)
01 - 201401-
Top Related