


Languages
Pages
Legal

Critical Success Factors for Risk Management Systems
Yaraghi N.*
Despite the existence of extensive literature regarding risk management, there still seems to be lack of knowledge in identification of Critical Success Factors (CSFs) in this area. In this research Grounded Theory is implemented to identify CSFs in Risk Management Systems (RMS). Factor analysis and one-sample t-test are then used to refine and rank the CSFs based on the results of a survey which has been performed among Risk Management practitioners in various types of Swedish corporations. CSFs are defined from three different perspectives: (a) the factors that have influence on the inclination and readiness of corporation for implementing RMS. (b) the factors that are important during the design and implementation of RMS in corporation and can significantly affect the success of RMS design and implementation and (c) the factors that are crucially important to successfully run, maintain and administrate RMS after the closure of the project of RMS design and Implementation.This systematic approach towards understanding the taxonomy of the success dimension in RMS is important for re-enforcing effective risk management practices.
KEY WORDS: Risk Management System, Success criteria, Grounded Theory, Factor Analysis
* Master thesis report; Project Management and Operational Development Royal Institute of Technology (KTH), Stockholm, Sweden.
1. INTRODUCTION
The expanded spectrum of new regulations and legal changes has created an increasing need to re-evaluate and better manage risk across the entire organization.(1) Studies show that risk management is gaining international focus(2) and corporations are considering risk management as one their main objectives.(3) Not only governance authorities regard risk management as of the most important responsibilities of managers,(4,5) but also clients expectations about risk management is much more than before.(6,7)
Despite the necessity, benefits(8,9) and effectiveness(10,11) of implementing Risk Management Systems (RMS), various researchers state that the organizations which have been successful in practical implementation of RMS are still in a small minority which doesn't exceed from 25% by the most optimistic reports.(12-18)
Although there is a well developed body of knowledge about design and implementation of different processes of RMS like risk management planning,(19) risk identification,(20) risk assessment,(21) risk analysis,(22,23) and risk response planning,(24,25) or even manuals for creation of risk management standard operating procedures,(26) There is not yet any approved and globally accepted standard or guideline available to help organizations with a successful design and implementation of RMS without limitation of business type. There have been some valuable efforts for providing risk management standards and guidelines but they neither have global acceptance nor the required universality. Most of these standards either lack the required clarity of a general purpose guideline or are limited to a small range of business types. (27-32)
There is an urge in the field of risk management to develop a knowledge-body related to Critical Success Factors (CSF). Moreover, it is also important to realize how these factors relate to each other and how RMS strategies can be defined, monitored and controlled to provide adequate treatment to these factors since a corporation decides to implement RMS, during the project of design and implementation of RMS and finally throughout the life of RMS.
The remainder of the paper is organized as follows; Section 2 reviews empirical studies that have investigated factors affecting Risk Management success. Section 3 describes the research method of our study. Section 4 discusses the qualitative and quantitative analysis results of interviews and a survey that we conducted with Risk Management practitioners involved in Swedish industry. We also describe in section 4 the relationships of some of the major factors that emerged from the survey results. Finally, section 5 presents conclusions and points out future work.
2. LITERURE REVIEW
Identifying critical success factors can bridge the gap between literature and practice in the field of risk management; rationally organizations would focus their limited resource on those things which really make the difference between success and failure.(33) Rockart(34) defines CSFs as: "those few key areas of activity in which favorable results are absolutely necessary for a manager to reach his/her goals". Leidecker et al. (35) define CSFs as a few things that must go right for the business to flourish. Through CSF methodology key areas that are essential for management success are made explicit.(36) CSFs may also be used by managers as descriptions, predictors, and guidelines for achievement levels.(37)
CSFs have been used as a management measure since the 1970s in so many different disciplines such as financial services,(36) information systems,(34)
manufacturing industry,(38) project management,(39-41) quality management,(42)
supply chain management, (43) etc.
Wood(44) states the enhancement of the transparent practical linkage of the risk mitigation plan and risk register to the corporate plan objectives as a key measure of success. According to Meltzer(45) success in risk management is based upon knowledge, relationships and sharing best practices. Lenckus(46) mentions securing management support, committing ample time to the effort, planning wisely, proving the plan's worth early and pacing risk manager among the critical success factors for Enterprise Risk Management. Coccia(47) believes that communication and the promotion of behavioral changes throughout an organization are the key success factors for Enterprise Risk Management. Based on a survey results by McDonald(48) Clearly defined risk appetite articulated through limits and monitoring procedures, involvement of managerial board, centralized ERM organizations, proper communication and instilling risk into the culture of business are among the most important success factors in ERM. Some other experts like Lemos et al.(49)
and McNamee(50) limit the success of risk management to the successful performance of its formal processes of risk management planning, risk identification, risk analysis, risk response planning and risk monitoring and control.
In addition to the mentioned factors above, solving major organization's problems, application of divers tools of risk management, creative and effective use of insurance markets, establishment of a workable information systems, performance of general managerial functions, cost and time efficiency,
development of technical expertise, attitude to risk management practices and career development are considered as the decision criteria for annual Business Insurance Risk Manager of the Year Award and Risk Management Honor Roll.(51)
According to our review, not only just a few numbers of CSFs have previously been identified in risk management literature, but also their importance relative to each other has not yet been uncovered. Moreover, the majority of these CSFs are introduced based on personal knowledge and experiences of the authors and apparently there is not any survey results available to support them. On the other hand, the CSFs in different periods of RMS lifecycle may be different from those in other stages. In previous studies success factors are ostensibly regarded as ‘critical’ but, as some must be more important than others, it is reasonable to attempt to rank them; particularly in terms of the attention that should be given to them in the different lifecycle stages of risk management.
3. RESEARCH METHOD
In order to overcome the lack of adequate literature about CSFs in the field of RMS, we have applied two strategies; the first was to study the CSFs in the other related context. Due to the fact that risk management can be implemented in and combined with an extended variety of related managerial disciplines like safetymanagement, project management, supply chain management, enterprise resource management, product development management, etc., we have decided to study the literature in these fields from the perspective of risk management and extract the CSFs that may also be important in RMS. As the second strategy, we interviewed 12 Risk Management Experts and elicited their points of view
and ideas regarding CSFs in Risk Management Systems that they already have their hands on.
3.1 Grounded Theory
At both of the previous two approaches, Grounded Theory (GT) was used to build a theory about CSFs and their properties. As a subdivision of management science, Risk Management is social-cultural in nature and the research should present the basis for interpreting social, psychological and cultural issues.(52)
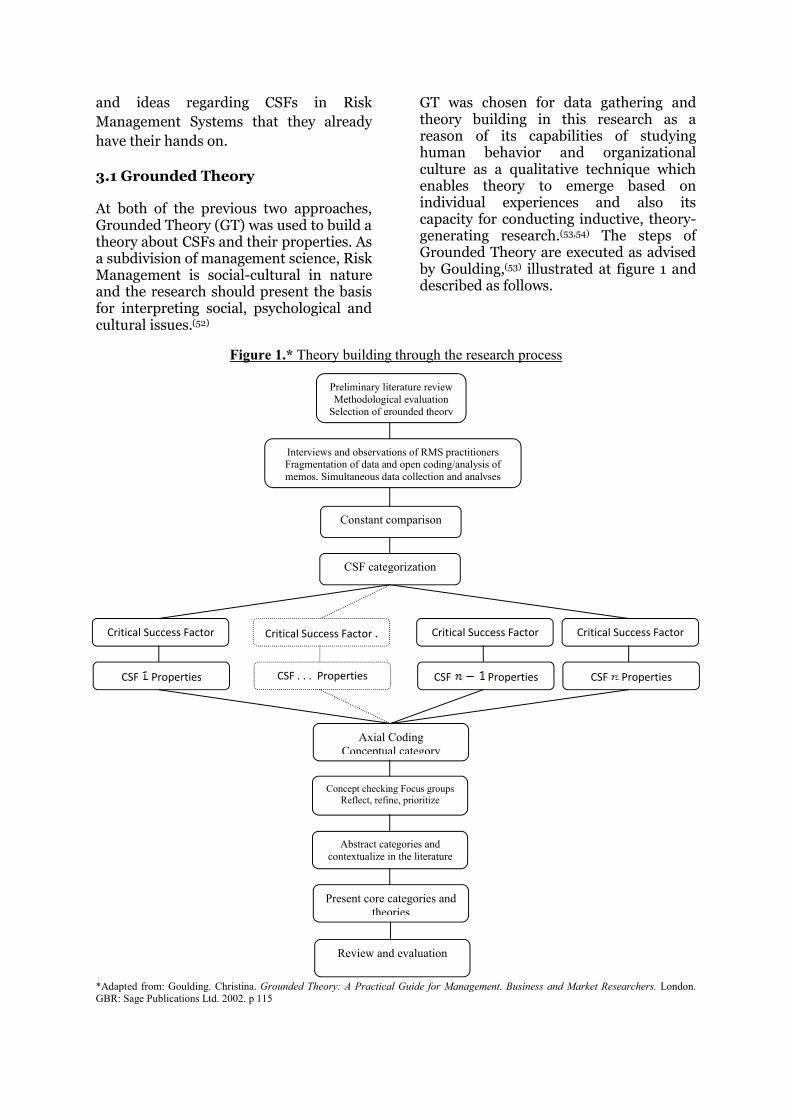
GT was chosen for data gathering and theory building in this research as a reason of its capabilities of studying human behavior and organizational culture as a qualitative technique which enables theory to emerge based on individual experiences and also its capacity for conducting inductive, theory-generating research.(53,54) The steps of Grounded Theory are executed as advised by Goulding,(53) illustrated at figure 1 and described as follows.
Figure 1.* Theory building through the research process
*Adapted from: Goulding. Christina. Grounded Theory: A Practical Guide for Management. Business and Market Researchers. London.GBR: Sage Publications Ltd. 2002. p 115
Critical Success Factor
Preliminary literature reviewMethodological evaluation
Selection of grounded theory
Interviews and observations of RMS practitionersFragmentation of data and open coding/analysis of memos, Simultaneous data collection and analyses
Constant comparison
CSF categorization
Critical Success FactorCritical Success Factor Critical Success Factor .
CSF PropertiesCSF Properties CSF Properties CSF . . . Properties
Axial CodingConceptual category
Concept checking Focus groups Reflect, refine, prioritize
Abstract categories and contextualize in the literature
Present core categories and theories
Review and evaluation
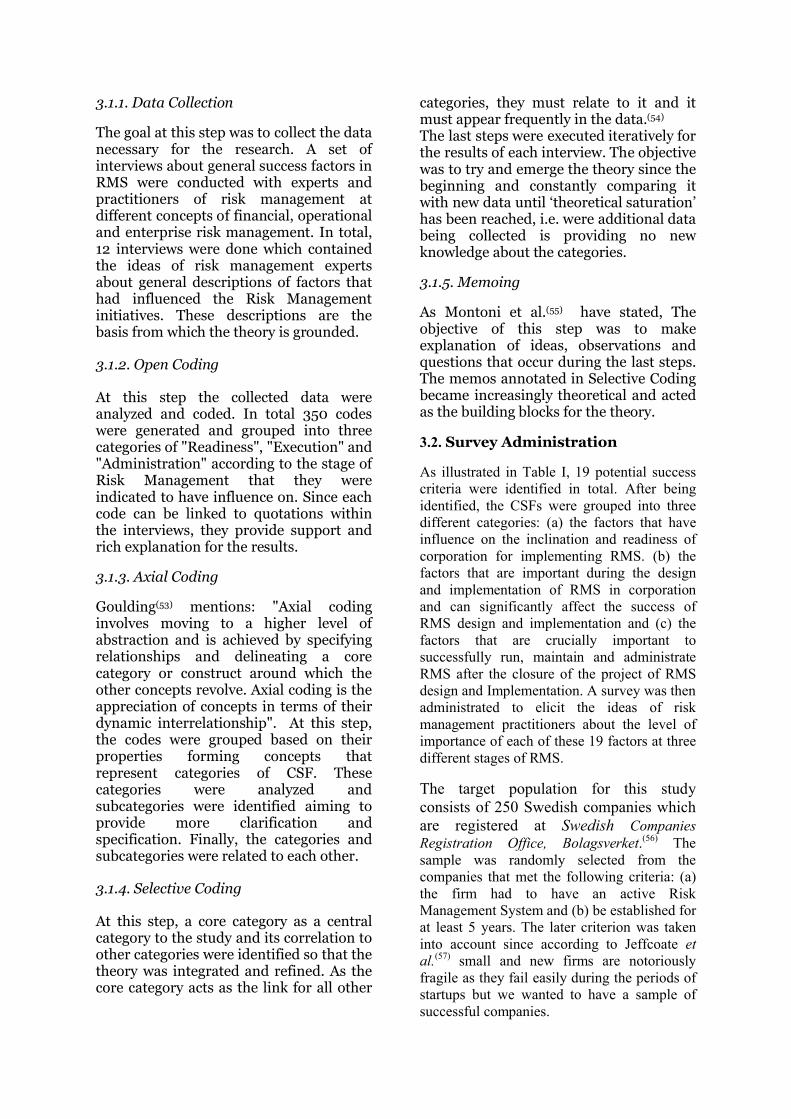
3.1.1. Data Collection
The goal at this step was to collect the data necessary for the research. A set of interviews about general success factors in RMS were conducted with experts and practitioners of risk management at different concepts of financial, operational and enterprise risk management. In total, 12 interviews were done which contained the ideas of risk management experts about general descriptions of factors that had influenced the Risk Management initiatives. These descriptions are the basis from which the theory is grounded.
3.1.2. Open Coding
At this step the collected data were analyzed and coded. In total 350 codes were generated and grouped into three categories of "Readiness", "Execution" and "Administration" according to the stage of Risk Management that they were indicated to have influence on. Since each code can be linked to quotations within the interviews, they provide support and rich explanation for the results.
3.1.3. Axial Coding
Goulding(53) mentions: "Axial coding involves moving to a higher level of abstraction and is achieved by specifying relationships and delineating a core category or construct around which the other concepts revolve. Axial coding is the appreciation of concepts in terms of their dynamic interrelationship". At this step, the codes were grouped based on their properties forming concepts that represent categories of CSF. These categories were analyzed and subcategories were identified aiming to provide more clarification and specification. Finally, the categories and subcategories were related to each other.
3.1.4. Selective Coding
At this step, a core category as a central category to the study and its correlation to other categories were identified so that the theory was integrated and refined. As the core category acts as the link for all other
categories, they must relate to it and it must appear frequently in the data.(54)
The last steps were executed iteratively for the results of each interview. The objective was to try and emerge the theory since the beginning and constantly comparing it with new data until ‘theoretical saturation’ has been reached, i.e. were additional data being collected is providing no new knowledge about the categories.
3.1.5. Memoing
As Montoni et al.(55) have stated, The objective of this step was to make explanation of ideas, observations and questions that occur during the last steps. The memos annotated in Selective Coding became increasingly theoretical and acted as the building blocks for the theory.
3.2. Survey Administration
As illustrated in Table I, 19 potential success criteria were identified in total. After being identified, the CSFs were grouped into three different categories: (a) the factors that have influence on the inclination and readiness of corporation for implementing RMS. (b) the factors that are important during the design and implementation of RMS in corporation and can significantly affect the success of RMS design and implementation and (c) the factors that are crucially important to successfully run, maintain and administrate RMS after the closure of the project of RMS design and Implementation. A survey was then administrated to elicit the ideas of risk management practitioners about the level of importance of each of these 19 factors at three different stages of RMS.
The target population for this studyconsists of 250 Swedish companies which are registered at Swedish Companies Registration Office, Bolagsverket.(56) The sample was randomly selected from the companies that met the following criteria: (a) the firm had to have an active Risk Management System and (b) be established for at least 5 years. The later criterion was taken into account since according to Jeffcoate et al.(57) small and new firms are notoriously fragile as they fail easily during the periods ofstartups but we wanted to have a sample of successful companies.
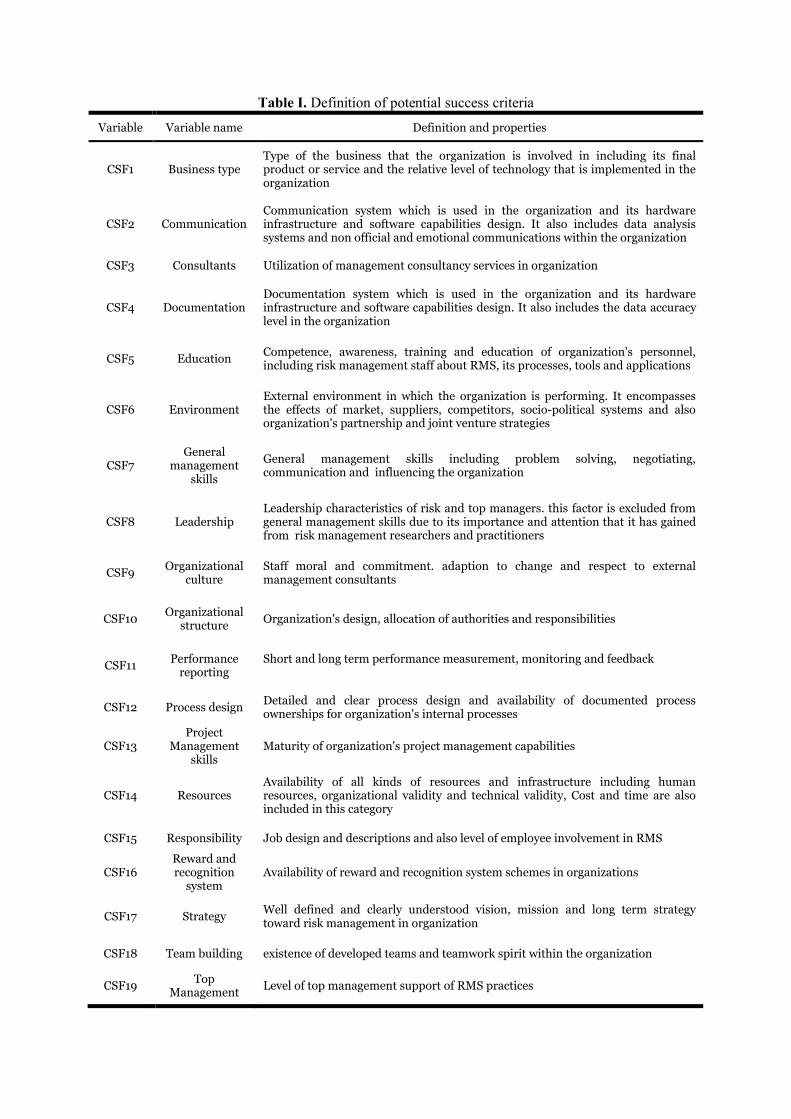
Table I. Definition of potential success criteria
Variable Variable name Definition and properties
CSF1 Business typeType of the business that the organization is involved in including its final product or service and the relative level of technology that is implemented in the organization
CSF2 CommunicationCommunication system which is used in the organization and its hardware infrastructure and software capabilities design. It also includes data analysis systems and non official and emotional communications within the organization
CSF3 Consultants Utilization of management consultancy services in organization
CSF4 DocumentationDocumentation system which is used in the organization and its hardware infrastructure and software capabilities design. It also includes the data accuracy level in the organization
CSF5 EducationCompetence, awareness, training and education of organization's personnel, including risk management staff about RMS, its processes, tools and applications
CSF6 EnvironmentExternal environment in which the organization is performing. It encompasses the effects of market, suppliers, competitors, socio-political systems and also organization's partnership and joint venture strategies
CSF7General
management skills
General management skills including problem solving, negotiating, communication and influencing the organization
CSF8 LeadershipLeadership characteristics of risk and top managers. this factor is excluded from general management skills due to its importance and attention that it has gained from risk management researchers and practitioners
CSF9 Organizational culture
Staff moral and commitment. adaption to change and respect to external management consultants
CSF10Organizational
structure Organization's design, allocation of authorities and responsibilities
CSF11 Performance reporting
Short and long term performance measurement, monitoring and feedback
CSF12 Process designDetailed and clear process design and availability of documented process ownerships for organization's internal processes
CSF13Project
Management skills
Maturity of organization's project management capabilities
CSF14 ResourcesAvailability of all kinds of resources and infrastructure including human resources, organizational validity and technical validity, Cost and time are also included in this category
CSF15 Responsibility Job design and descriptions and also level of employee involvement in RMS
CSF16Reward and recognition
systemAvailability of reward and recognition system schemes in organizations
CSF17 StrategyWell defined and clearly understood vision, mission and long term strategy toward risk management in organization
CSF18 Team building existence of developed teams and teamwork spirit within the organization
CSF19 Top Management
Level of top management support of RMS practices
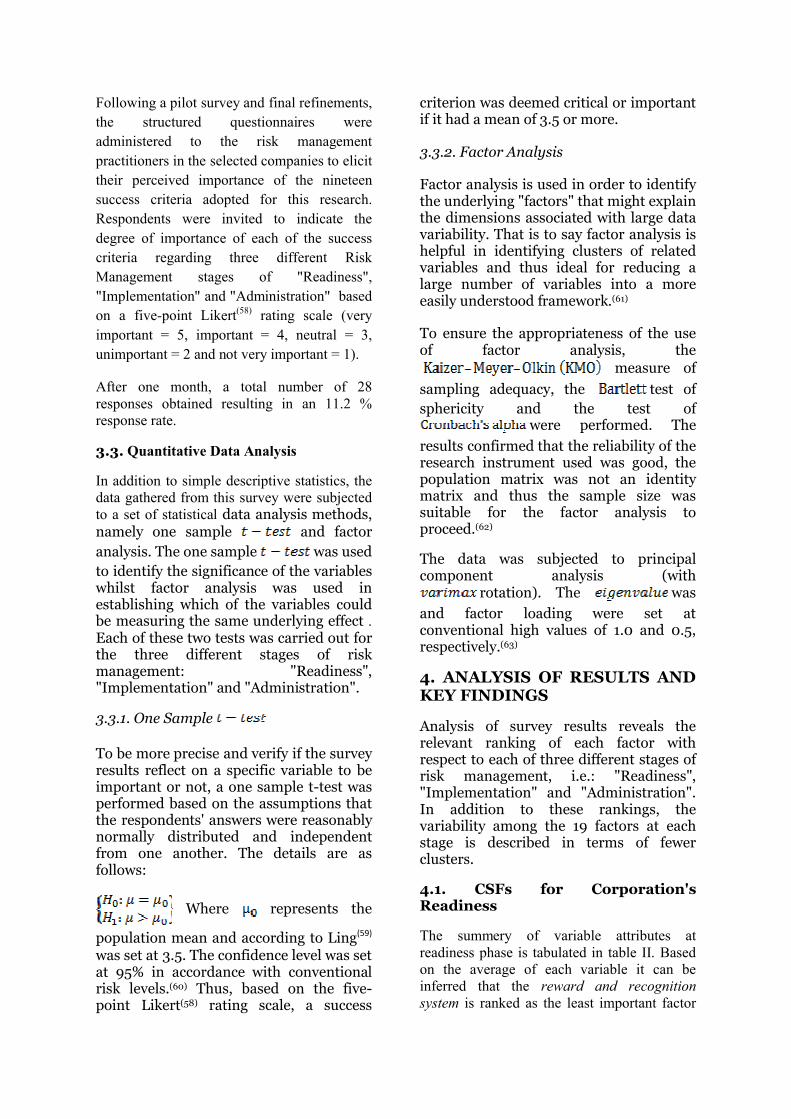
Following a pilot survey and final refinements,the structured questionnaires were administered to the risk management practitioners in the selected companies to elicit their perceived importance of the nineteen success criteria adopted for this research. Respondents were invited to indicate the degree of importance of each of the success criteria regarding three different Risk Management stages of "Readiness", "Implementation" and "Administration" based on a five-point Likert(58) rating scale (very important = 5, important = 4, neutral = 3,unimportant = 2 and not very important = 1).
After one month, a total number of 28 responses obtained resulting in an 11.2 % response rate.
3.3. Quantitative Data Analysis
In addition to simple descriptive statistics, the data gathered from this survey were subjected to a set of statistical data analysis methods, namely one sample and factor analysis. The one sample was used to identify the significance of the variables whilst factor analysis was used in establishing which of the variables could be measuring the same underlying effect .Each of these two tests was carried out for the three different stages of riskmanagement: "Readiness", "Implementation" and "Administration".
3.3.1. One Sample
To be more precise and verify if the survey results reflect on a specific variable to be important or not, a one sample t-test was performed based on the assumptions that the respondents' answers were reasonably normally distributed and independent from one another. The details are as follows:
Where represents the
population mean and according to Ling(59)
was set at 3.5. The confidence level was set at 95% in accordance with conventional risk levels.(60) Thus, based on the five-point Likert(58) rating scale, a success
criterion was deemed critical or important if it had a mean of 3.5 or more.
3.3.2. Factor Analysis
Factor analysis is used in order to identify the underlying "factors" that might explain the dimensions associated with large data variability. That is to say factor analysis is helpful in identifying clusters of related variables and thus ideal for reducing a large number of variables into a more easily understood framework.(61)
To ensure the appropriateness of the use of factor analysis, the
measure of
sampling adequacy, the test of sphericity and the test of
were performed. The
results confirmed that the reliability of the research instrument used was good, the population matrix was not an identity matrix and thus the sample size was suitable for the factor analysis to proceed.(62)
The data was subjected to principal component analysis (with
rotation). The was and factor loading were set at conventional high values of 1.0 and 0.5, respectively.(63)
4. ANALYSIS OF RESULTS AND KEY FINDINGS
Analysis of survey results reveals the relevant ranking of each factor with respect to each of three different stages of risk management, i.e.: "Readiness", "Implementation" and "Administration". In addition to these rankings, the variability among the 19 factors at each stage is described in terms of fewer clusters.
4.1. CSFs for Corporation's Readiness
The summery of variable attributes at readiness phase is tabulated in table II. Based on the average of each variable it can be inferred that the reward and recognition system is ranked as the least important factor
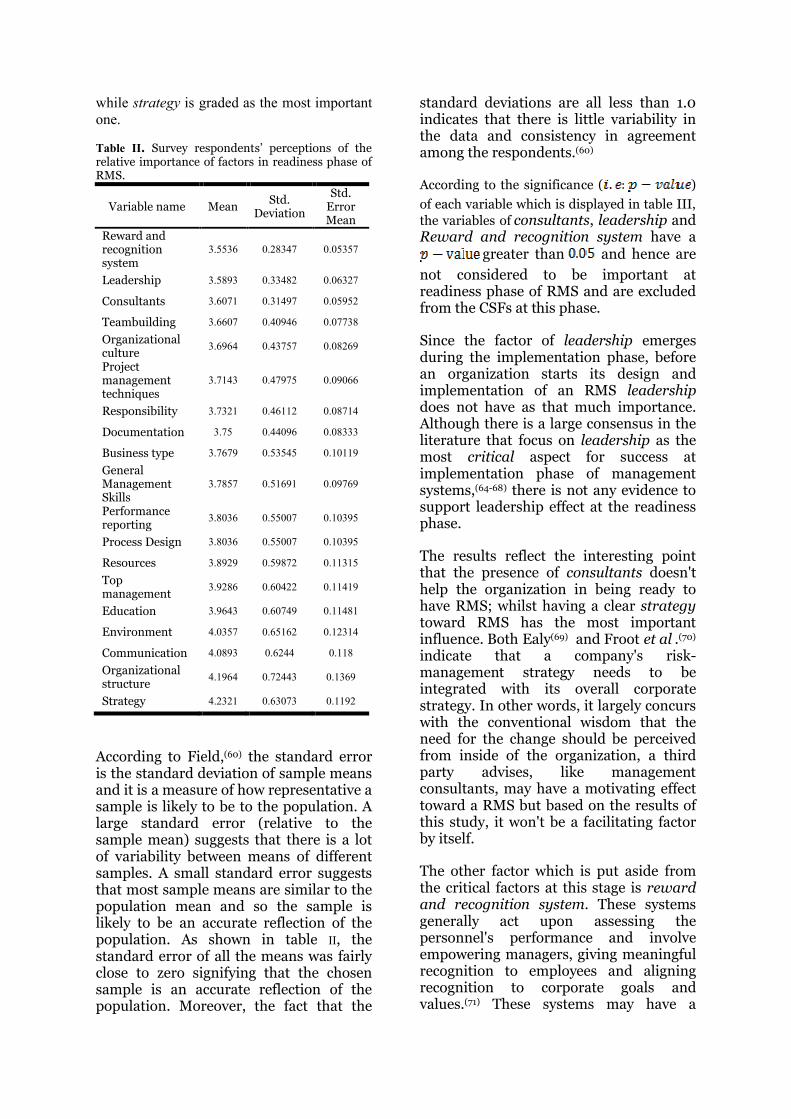
while strategy is graded as the most important one.
Table II. Survey respondents’ perceptions of the relative importance of factors in readiness phase of RMS.
According to Field,(60) the standard error is the standard deviation of sample means and it is a measure of how representative a sample is likely to be to the population. A large standard error (relative to the sample mean) suggests that there is a lot of variability between means of different samples. A small standard error suggests that most sample means are similar to the population mean and so the sample is likely to be an accurate reflection of thepopulation. As shown in table II, the standard error of all the means was fairly close to zero signifying that the chosen sample is an accurate reflection of the population. Moreover, the fact that the
standard deviations are all less than 1.0 indicates that there is little variability in the data and consistency in agreement among the respondents.(60)
According to the significance ( )
of each variable which is displayed in table III,the variables of consultants, leadership and Reward and recognition system have a
greater than and hence are not considered to be important at readiness phase of RMS and are excluded from the CSFs at this phase.
Since the factor of leadership emerges during the implementation phase, before an organization starts its design and implementation of an RMS leadershipdoes not have as that much importance. Although there is a large consensus in the literature that focus on leadership as the most critical aspect for success at implementation phase of management systems,(64-68) there is not any evidence to support leadership effect at the readiness phase.
The results reflect the interesting point that the presence of consultants doesn't help the organization in being ready to have RMS; whilst having a clear strategytoward RMS has the most important influence. Both Ealy(69) and Froot et al .(70)
indicate that a company's risk-management strategy needs to be integrated with its overall corporate strategy. In other words, it largely concurs with the conventional wisdom that the need for the change should be perceived from inside of the organization, a third party advises, like management consultants, may have a motivating effect toward a RMS but based on the results of this study, it won't be a facilitating factor by itself.
The other factor which is put aside from the critical factors at this stage is reward and recognition system. These systems generally act upon assessing the personnel's performance and involve empowering managers, giving meaningful recognition to employees and aligning recognition to corporate goals and values.(71) These systems may have a
Variable name MeanStd.
Deviation
Std. Error Mean
Reward and recognition system
3.5536 0.28347 0.05357
Leadership 3.5893 0.33482 0.06327
Consultants 3.6071 0.31497 0.05952
Teambuilding 3.6607 0.40946 0.07738
Organizational culture
3.6964 0.43757 0.08269
Project management techniques
3.7143 0.47975 0.09066
Responsibility 3.7321 0.46112 0.08714
Documentation 3.75 0.44096 0.08333
Business type 3.7679 0.53545 0.10119
General Management Skills
3.7857 0.51691 0.09769
Performance reporting
3.8036 0.55007 0.10395
Process Design 3.8036 0.55007 0.10395
Resources 3.8929 0.59872 0.11315
Top management
3.9286 0.60422 0.11419
Education 3.9643 0.60749 0.11481
Environment 4.0357 0.65162 0.12314
Communication 4.0893 0.6244 0.118
Organizational structure
4.1964 0.72443 0.1369
Strategy 4.2321 0.63073 0.1192
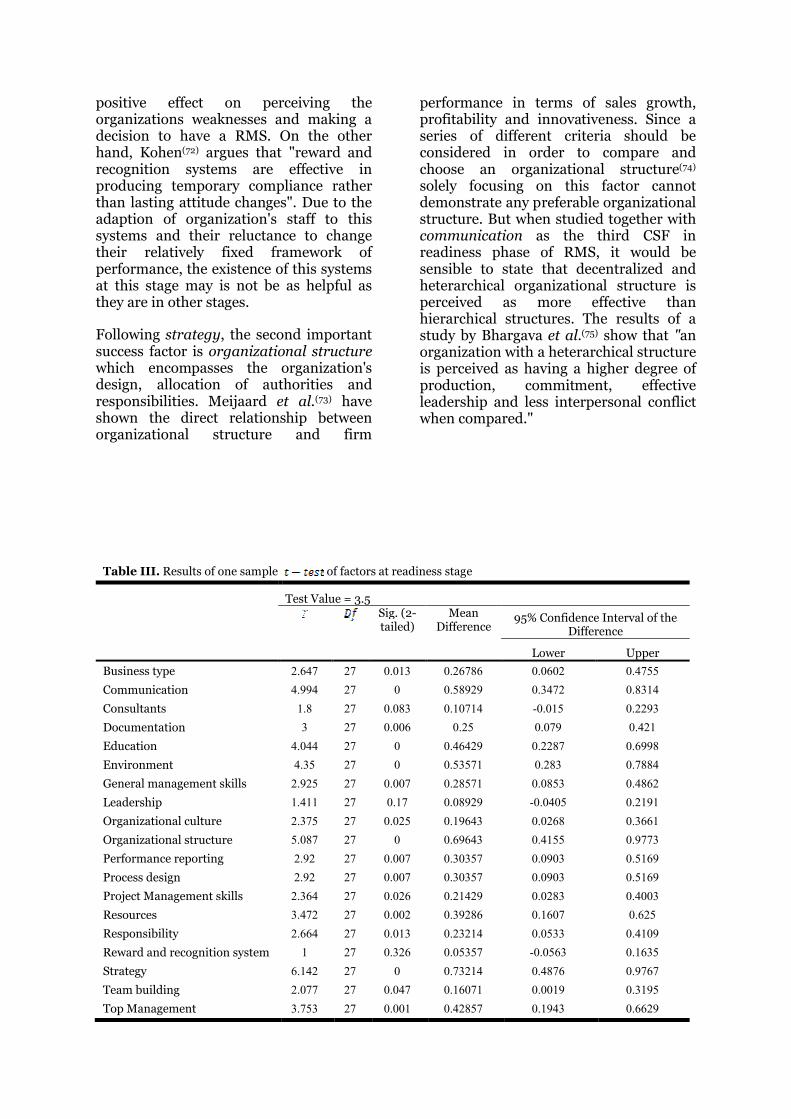
positive effect on perceiving the organizations weaknesses and making a decision to have a RMS. On the other hand, Kohen(72) argues that "reward and recognition systems are effective in producing temporary compliance rather than lasting attitude changes". Due to the adaption of organization's staff to this systems and their reluctance to change their relatively fixed framework of performance, the existence of this systems at this stage may is not be as helpful as they are in other stages.
Following strategy, the second important success factor is organizational structurewhich encompasses the organization's design, allocation of authorities and responsibilities. Meijaard et al.(73) have shown the direct relationship between organizational structure and firm
performance in terms of sales growth,profitability and innovativeness. Since a series of different criteria should be considered in order to compare and choose an organizational structure(74)
solely focusing on this factor cannot demonstrate any preferable organizational structure. But when studied together with communication as the third CSF in readiness phase of RMS, it would be sensible to state that decentralized and heterarchical organizational structure is perceived as more effective than hierarchical structures. The results of a study by Bhargava et al.(75) show that "an organization with a heterarchical structureis perceived as having a higher degree of production, commitment, effective leadership and less interpersonal conflict when compared."
Table III. Results of one sample of factors at readiness stage
Test Value = 3.5
Sig. (2-tailed)
Mean Difference
95% Confidence Interval of the Difference
Lower Upper
Business type 2.647 27 0.013 0.26786 0.0602 0.4755
Communication 4.994 27 0 0.58929 0.3472 0.8314
Consultants 1.8 27 0.083 0.10714 -0.015 0.2293
Documentation 3 27 0.006 0.25 0.079 0.421
Education 4.044 27 0 0.46429 0.2287 0.6998
Environment 4.35 27 0 0.53571 0.283 0.7884
General management skills 2.925 27 0.007 0.28571 0.0853 0.4862
Leadership 1.411 27 0.17 0.08929 -0.0405 0.2191
Organizational culture 2.375 27 0.025 0.19643 0.0268 0.3661
Organizational structure 5.087 27 0 0.69643 0.4155 0.9773
Performance reporting 2.92 27 0.007 0.30357 0.0903 0.5169
Process design 2.92 27 0.007 0.30357 0.0903 0.5169
Project Management skills 2.364 27 0.026 0.21429 0.0283 0.4003
Resources 3.472 27 0.002 0.39286 0.1607 0.625
Responsibility 2.664 27 0.013 0.23214 0.0533 0.4109
Reward and recognition system 1 27 0.326 0.05357 -0.0563 0.1635
Strategy 6.142 27 0 0.73214 0.4876 0.9767
Team building 2.077 27 0.047 0.16071 0.0019 0.3195
Top Management 3.753 27 0.001 0.42857 0.1943 0.6629
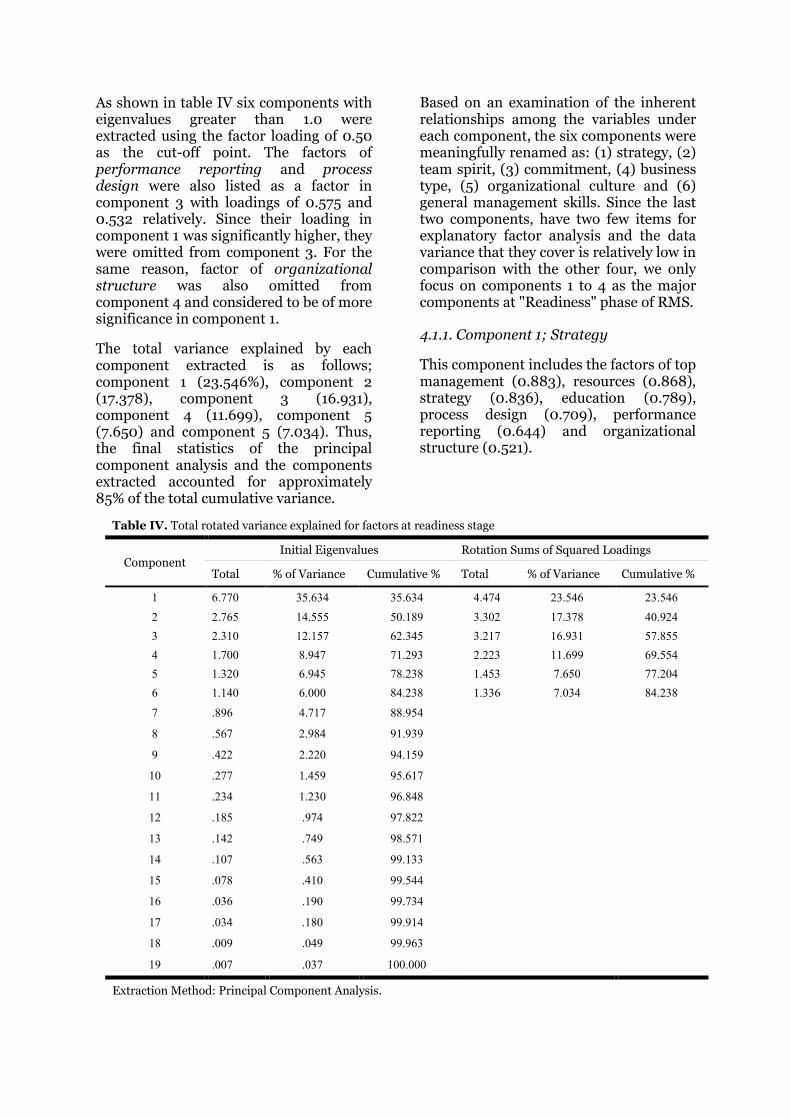
As shown in table IV six components with eigenvalues greater than 1.0 were extracted using the factor loading of 0.50 as the cut-off point. The factors of performance reporting and process design were also listed as a factor in component 3 with loadings of 0.575 and 0.532 relatively. Since their loading in component 1 was significantly higher, they were omitted from component 3. For the same reason, factor of organizational structure was also omitted from component 4 and considered to be of more significance in component 1.
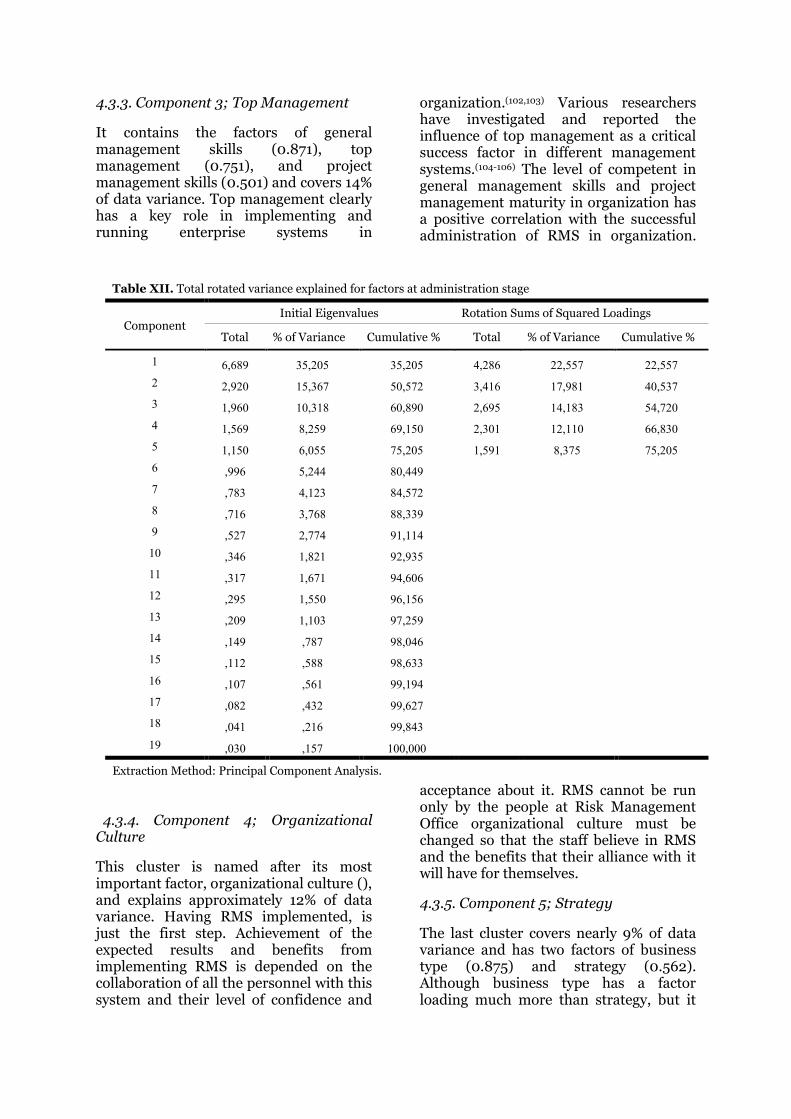
The total variance explained by each component extracted is as follows; component 1 (23.546%), component 2 (17.378), component 3 (16.931), component 4 (11.699), component 5 (7.650) and component 5 (7.034). Thus, the final statistics of the principal component analysis and the components extracted accounted for approximately 85% of the total cumulative variance.
Based on an examination of the inherent relationships among the variables under each component, the six components were meaningfully renamed as: (1) strategy, (2)team spirit, (3) commitment, (4) business type, (5) organizational culture and (6) general management skills. Since the last two components, have two few items for explanatory factor analysis and the data variance that they cover is relatively low in comparison with the other four, we only focus on components 1 to 4 as the major components at "Readiness" phase of RMS.
4.1.1. Component 1; Strategy
This component includes the factors of top management (0.883), resources (0.868), strategy (0.836), education (0.789), process design (0.709), performance reporting (0.644) and organizational structure (0.521).
Table IV. Total rotated variance explained for factors at readiness stage
ComponentInitial Eigenvalues Rotation Sums of Squared Loadings
Total % of Variance Cumulative % Total % of Variance Cumulative %
1 6.770 35.634 35.634 4.474 23.546 23.546
2 2.765 14.555 50.189 3.302 17.378 40.924
3 2.310 12.157 62.345 3.217 16.931 57.855
4 1.700 8.947 71.293 2.223 11.699 69.554
5 1.320 6.945 78.238 1.453 7.650 77.204
6 1.140 6.000 84.238 1.336 7.034 84.238
7 .896 4.717 88.954
8 .567 2.984 91.939
9 .422 2.220 94.159
10 .277 1.459 95.617
11 .234 1.230 96.848
12 .185 .974 97.822
13 .142 .749 98.571
14 .107 .563 99.133
15 .078 .410 99.544
16 .036 .190 99.734
17 .034 .180 99.914
18 .009 .049 99.963
19 .007 .037 100.000
Extraction Method: Principal Component Analysis.
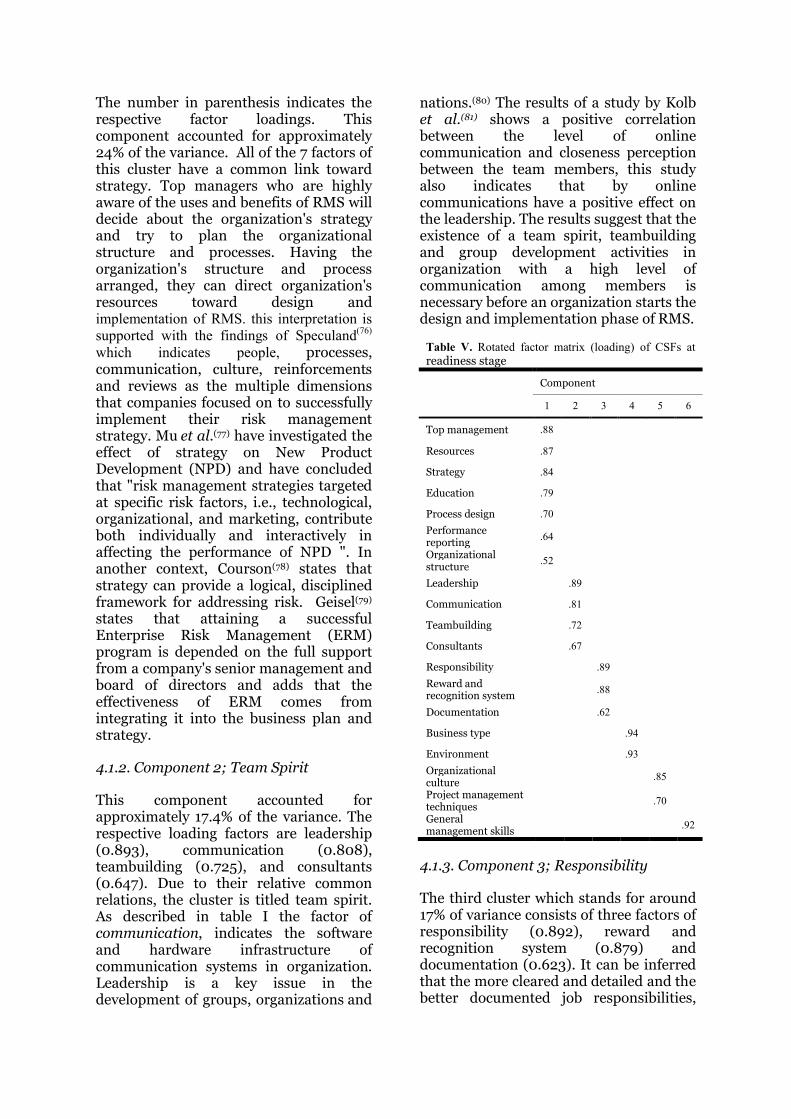
The number in parenthesis indicates the respective factor loadings. This component accounted for approximately 24% of the variance. All of the 7 factors of this cluster have a common link toward strategy. Top managers who are highly aware of the uses and benefits of RMS will decide about the organization's strategy and try to plan the organizational structure and processes. Having the organization's structure and process arranged, they can direct organization's resources toward design and implementation of RMS. this interpretation is supported with the findings of Speculand(76)
which indicates people, processes, communication, culture, reinforcements and reviews as the multiple dimensions that companies focused on to successfully implement their risk management strategy. Mu et al.(77) have investigated the effect of strategy on New Product Development (NPD) and have concluded that "risk management strategies targeted at specific risk factors, i.e., technological, organizational, and marketing, contribute both individually and interactively in affecting the performance of NPD ". In another context, Courson(78) states thatstrategy can provide a logical, disciplined framework for addressing risk. Geisel(79)
states that attaining a successful Enterprise Risk Management (ERM)program is depended on the full supportfrom a company's senior management and board of directors and adds that the effectiveness of ERM comes from integrating it into the business plan and strategy.
4.1.2. Component 2; Team Spirit
This component accounted for approximately 17.4% of the variance. The respective loading factors are leadership (0.893), communication (0.808), teambuilding (0.725), and consultants (0.647). Due to their relative common relations, the cluster is titled team spirit. As described in table I the factor of communication, indicates the software and hardware infrastructure of communication systems in organization. Leadership is a key issue in the development of groups, organizations and
nations.(80) The results of a study by Kolb et al.(81) shows a positive correlation between the level of online communication and closeness perception between the team members, this study also indicates that by online communications have a positive effect on the leadership. The results suggest that the existence of a team spirit, teambuilding and group development activities in organization with a high level of communication among members is necessary before an organization starts the design and implementation phase of RMS.
Table V. Rotated factor matrix (loading) of CSFs at readiness stage
Component
1 2 3 4 5 6
Top management .88
Resources .87
Strategy .84
Education .79
Process design .70
Performance reporting .64
Organizational structure
.52
Leadership .89
Communication .81
Teambuilding .72
Consultants .67
Responsibility .89
Reward and recognition system .88
Documentation .62
Business type .94
Environment .93
Organizational culture
.85
Project management techniques .70
General management skills
.92
4.1.3. Component 3; Responsibility
The third cluster which stands for around 17% of variance consists of three factors of responsibility (0.892), reward and recognition system (0.879) and documentation (0.623). It can be inferred that the more cleared and detailed and the better documented job responsibilities,
the easier it would be would for the organization to start design and implementation of its RMS. Lawson et al.(82) believe that the employees will be reluctant to change unless they see the point of the change and agree with it. They add that the reward and recognition systems should be adapted with the preferred changes. Altering the regular reward and recognition systems into a system which is tuned with long term strategy of corporation for having RMS is vital before initiation of RMS. More over suitable team development methods should be chosen in order to convince the personnel that the changes would be beneficial for themselves and agree with it.
4.1.4. Component 4; Business Type
Business type covers 11.7% of the total variance. It consists of only two factors of business type (0.941) and environment (0.935). the results confirm the common belief that the organizations with a higher level of uncertainty in their produces and production system will be more attracted to RMS. the results also prove that the high level of competition and roughness of the environment that the company is performing in plays an important role in company's decision upon starting a RMS.
4.2. CSFs for Design and Implementation of RMS
The factors which will be introduced are those which are critical during the project of design and implementation of RMS in the organization.
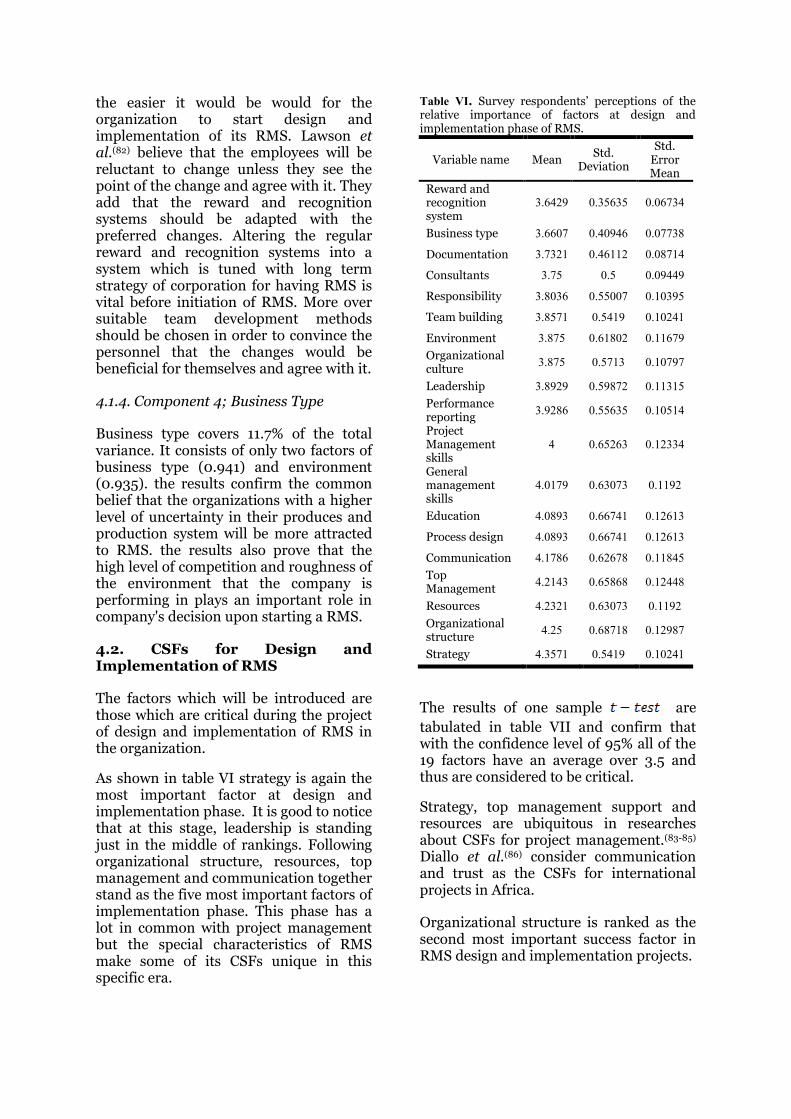
As shown in table VI strategy is again the most important factor at design and implementation phase. It is good to notice that at this stage, leadership is standing just in the middle of rankings. Following organizational structure, resources, top management and communication togetherstand as the five most important factors of implementation phase. This phase has a lot in common with project management but the special characteristics of RMS make some of its CSFs unique in this specific era.
Table VI. Survey respondents’ perceptions of the relative importance of factors at design and implementation phase of RMS.
The results of one sample are tabulated in table VII and confirm that with the confidence level of 95% all of the 19 factors have an average over 3.5 and thus are considered to be critical.
Strategy, top management support and resources are ubiquitous in researches about CSFs for project management.(83-85)
Diallo et al.(86) consider communication and trust as the CSFs for international projects in Africa.
Organizational structure is ranked as the second most important success factor in RMS design and implementation projects.
Variable name MeanStd.
Deviation
Std. Error Mean
Reward and recognition system
3.6429 0.35635 0.06734
Business type 3.6607 0.40946 0.07738
Documentation 3.7321 0.46112 0.08714
Consultants 3.75 0.5 0.09449
Responsibility 3.8036 0.55007 0.10395
Team building 3.8571 0.5419 0.10241
Environment 3.875 0.61802 0.11679
Organizational culture
3.875 0.5713 0.10797
Leadership 3.8929 0.59872 0.11315
Performance reporting
3.9286 0.55635 0.10514
Project Management skills
4 0.65263 0.12334
General management skills
4.0179 0.63073 0.1192
Education 4.0893 0.66741 0.12613
Process design 4.0893 0.66741 0.12613
Communication 4.1786 0.62678 0.11845
Top Management
4.2143 0.65868 0.12448
Resources 4.2321 0.63073 0.1192
Organizational structure
4.25 0.68718 0.12987
Strategy 4.3571 0.5419 0.10241

On the other side of this table, consultants are considered to be of the least important factors in these projects. Considering these two factors and their position in the ranking, and also bring the low rank of consultants at the readiness phase into account, we have concluded that the RMS projects which are designed and implemented primarily by the members of organization are more likely to be successful. Although consultants can be very beneficial at both phases, but it wouldn't be very obliging to stand aside and outsource the system design and implementation to them. They are better to be in organization as mentors and advisors but not the key people who design, implement and run the RMS. Organizations with a matrix structure can assign human staff and allocate other resources to their critical projects(87) and thus RMS design and implementation project can be performed much easier in
within a matrix organizational structure. The studies of Kuprenas(88) and Bates et al.(89) demonstrate that the performanceof both private and public sector organizations while operating under a matrix structure has improved.
The data has been subjected to factor analysis following the same procedures described at section 3.3.2; the results are tabulated in tables VIII and IX.
Six components have been extracted which totally cover 77.124% of the data variance, but the last three components have too few variables to calculate a Cronbach alpha coefficient and do not have high rotated factor loadings of the exploratory factor analysis. Therefore, weconsider the components 1 to 3 as the major CSF components. The first three components account for 56% of total data
Table VII. Results of one sample of factors at design and implementation stage
Test Value = 3.5
Sig. (2-tailed)
Mean Difference
95% Confidence Interval of the Difference
Lower Upper
Business type 2.077 27 .047 .16071 .0019 .3195
Communication 5.729 27 .000 .67857 .4355 .9216
Consultants 2.646 27 .013 .25000 .0561 .4439
Documentation 2.664 27 .013 .23214 .0533 .4109
Education 4.672 27 .000 .58929 .3305 .8481
Environment 3.211 27 .003 .37500 .1354 .6146
General management skills 4.345 27 .000 .51786 .2733 .7624
Leadership 3.472 27 .002 .39286 .1607 .6250
Organizational culture 3.473 27 .002 .37500 .1535 .5965
Organizational structure 5.775 27 .000 .75000 .4835 1.0165
Performance reporting 4.076 27 .000 .42857 .2128 .6443
Process design 4.672 27 .000 .58929 .3305 .8481
Project Management skills 4.054 27 .000 .50000 .2469 .7531
Resources 6.142 27 .000 .73214 .4876 .9767
Responsibility 2.920 27 .007 .30357 .0903 .5169
Reward and recognition system 2.121 27 .043 .14286 .0047 .2810
Strategy 8.370 27 .000 .85714 .6470 1.0673
Team building 3.487 27 .002 .35714 .1470 .5673
Top Management 5.738 27 .000 .71429 .4589 .9697
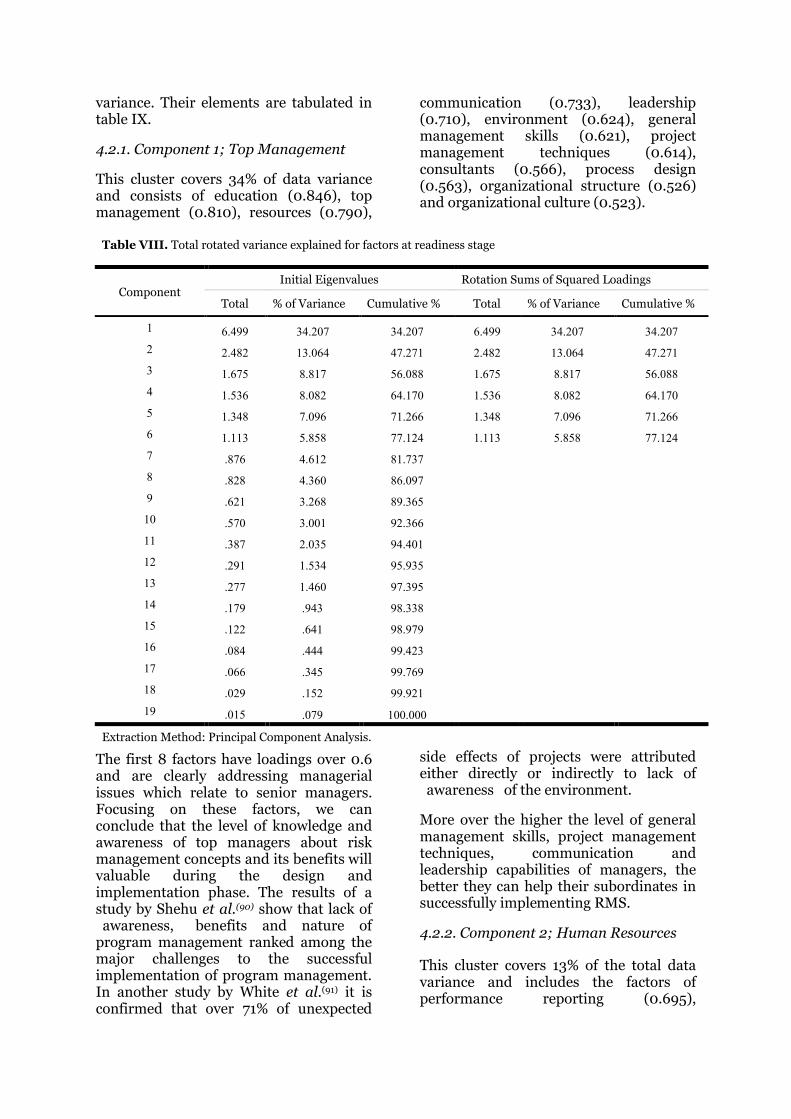
variance. Their elements are tabulated in table IX.
4.2.1. Component 1; Top Management
This cluster covers 34% of data variance and consists of education (0.846), top management (0.810), resources (0.790),
communication (0.733), leadership (0.710), environment (0.624), general management skills (0.621), project management techniques (0.614), consultants (0.566), process design (0.563), organizational structure (0.526) and organizational culture (0.523).
Table VIII. Total rotated variance explained for factors at readiness stage
ComponentInitial Eigenvalues Rotation Sums of Squared Loadings
Total % of Variance Cumulative % Total % of Variance Cumulative %
1 6.499 34.207 34.207 6.499 34.207 34.207
2 2.482 13.064 47.271 2.482 13.064 47.271
3 1.675 8.817 56.088 1.675 8.817 56.088
4 1.536 8.082 64.170 1.536 8.082 64.170
5 1.348 7.096 71.266 1.348 7.096 71.266
6 1.113 5.858 77.124 1.113 5.858 77.124
7 .876 4.612 81.737
8 .828 4.360 86.097
9 .621 3.268 89.365
10 .570 3.001 92.366
11 .387 2.035 94.401
12 .291 1.534 95.935
13 .277 1.460 97.395
14 .179 .943 98.338
15 .122 .641 98.979
16 .084 .444 99.423
17 .066 .345 99.769
18 .029 .152 99.921
19 .015 .079 100.000
Extraction Method: Principal Component Analysis.
The first 8 factors have loadings over 0.6 and are clearly addressing managerial issues which relate to senior managers. Focusing on these factors, we can conclude that the level of knowledge and awareness of top managers about risk management concepts and its benefits will valuable during the design and implementation phase. The results of a study by Shehu et al.(90) show that lack of awareness, benefits and nature of
program management ranked among the major challenges to the successful implementation of program management.In another study by White et al.(91) it is confirmed that over 71% of unexpected
side effects of projects were attributed either directly or indirectly to lack of awareness of the environment.
More over the higher the level of general management skills, project management techniques, communication and leadership capabilities of managers, the better they can help their subordinates in successfully implementing RMS.
4.2.2. Component 2; Human Resources
This cluster covers 13% of the total data variance and includes the factors of performance reporting (0.695),
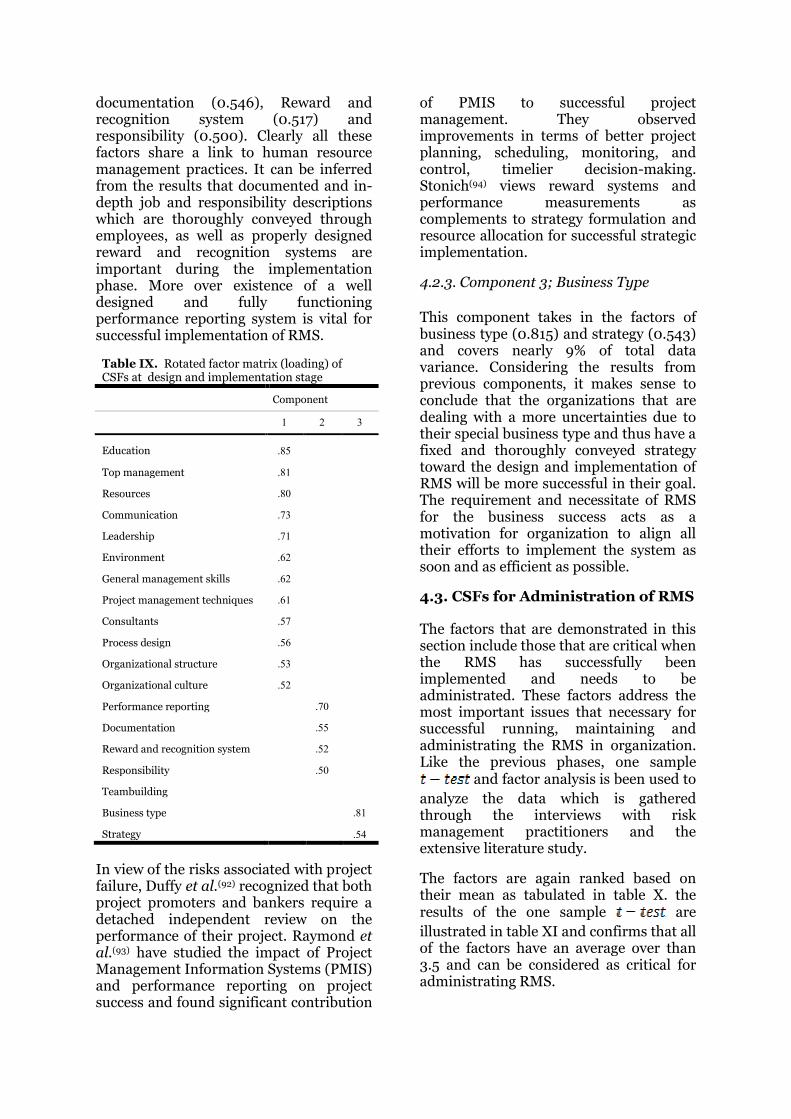
documentation (0.546), Reward and recognition system (0.517) and responsibility (0.500). Clearly all these factors share a link to human resource management practices. It can be inferred from the results that documented and in-depth job and responsibility descriptions which are thoroughly conveyed through employees, as well as properly designed reward and recognition systems are important during the implementation phase. More over existence of a well designed and fully functioning performance reporting system is vital for successful implementation of RMS.
In view of the risks associated with project failure, Duffy et al.(92) recognized that both project promoters and bankers require a detached independent review on the performance of their project. Raymond et al.(93) have studied the impact of Project Management Information Systems (PMIS)and performance reporting on project success and found significant contribution
of PMIS to successful project management. They observed improvements in terms of better project planning, scheduling, monitoring, and control, timelier decision-making.Stonich(94) views reward systems and performance measurements as complements to strategy formulation and resource allocation for successful strategic implementation.
4.2.3. Component 3; Business Type
This component takes in the factors of business type (0.815) and strategy (0.543) and covers nearly 9% of total data variance. Considering the results from previous components, it makes sense to conclude that the organizations that are dealing with a more uncertainties due to their special business type and thus have a fixed and thoroughly conveyed strategy toward the design and implementation of RMS will be more successful in their goal. The requirement and necessitate of RMS for the business success acts as a motivation for organization to align all their efforts to implement the system as soon and as efficient as possible.
4.3. CSFs for Administration of RMS
The factors that are demonstrated in this section include those that are critical when the RMS has successfully been implemented and needs to be administrated. These factors address the most important issues that necessary for successful running, maintaining and administrating the RMS in organization. Like the previous phases, one sample
and factor analysis is been used to analyze the data which is gathered through the interviews with risk management practitioners and the extensive literature study.
The factors are again ranked based on their mean as tabulated in table X. the results of the one sample are illustrated in table XI and confirms that all of the factors have an average over than 3.5 and can be considered as critical for administrating RMS.
Table IX. Rotated factor matrix (loading) of CSFs at design and implementation stage
Component
1 2 3
Education .85
Top management .81
Resources .80
Communication .73
Leadership .71
Environment .62
General management skills .62
Project management techniques .61
Consultants .57
Process design .56
Organizational structure .53
Organizational culture .52
Performance reporting .70
Documentation .55
Reward and recognition system .52
Responsibility .50
Teambuilding
Business type .81
Strategy .54
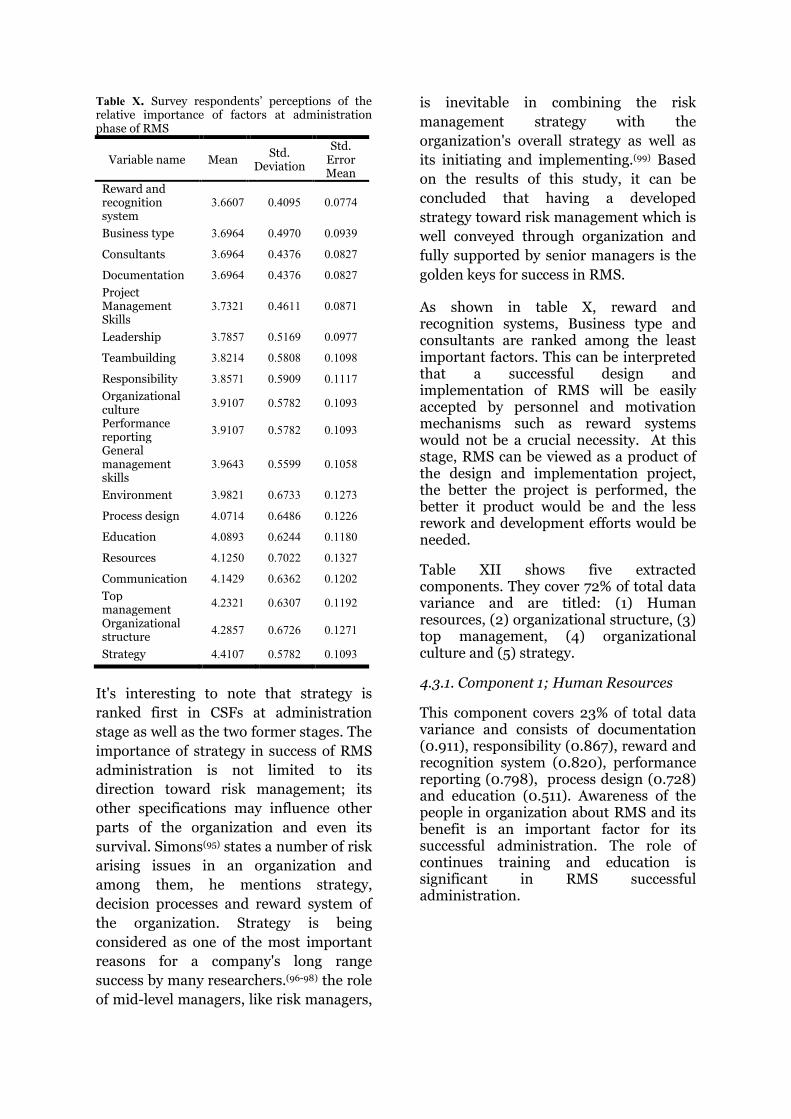
Table X. Survey respondents’ perceptions of the relative importance of factors at administration phase of RMS
It's interesting to note that strategy is ranked first in CSFs at administration stage as well as the two former stages. The importance of strategy in success of RMS administration is not limited to its direction toward risk management; its other specifications may influence other parts of the organization and even its survival. Simons(95) states a number of risk arising issues in an organization and among them, he mentions strategy, decision processes and reward system of the organization. Strategy is being considered as one of the most important reasons for a company's long range success by many researchers.(96-98) the role of mid-level managers, like risk managers,
is inevitable in combining the risk management strategy with the organization's overall strategy as well as its initiating and implementing.(99) Based on the results of this study, it can be concluded that having a developed strategy toward risk management which is well conveyed through organization and fully supported by senior managers is the golden keys for success in RMS.
As shown in table X, reward and recognition systems, Business type andconsultants are ranked among the least important factors. This can be interpreted that a successful design and implementation of RMS will be easily accepted by personnel and motivation mechanisms such as reward systems would not be a crucial necessity. At this stage, RMS can be viewed as a product of the design and implementation project, the better the project is performed, the better it product would be and the less rework and development efforts would be needed.
Table XII shows five extracted components. They cover 72% of total data variance and are titled: (1) Human resources, (2) organizational structure, (3) top management, (4) organizational culture and (5) strategy.
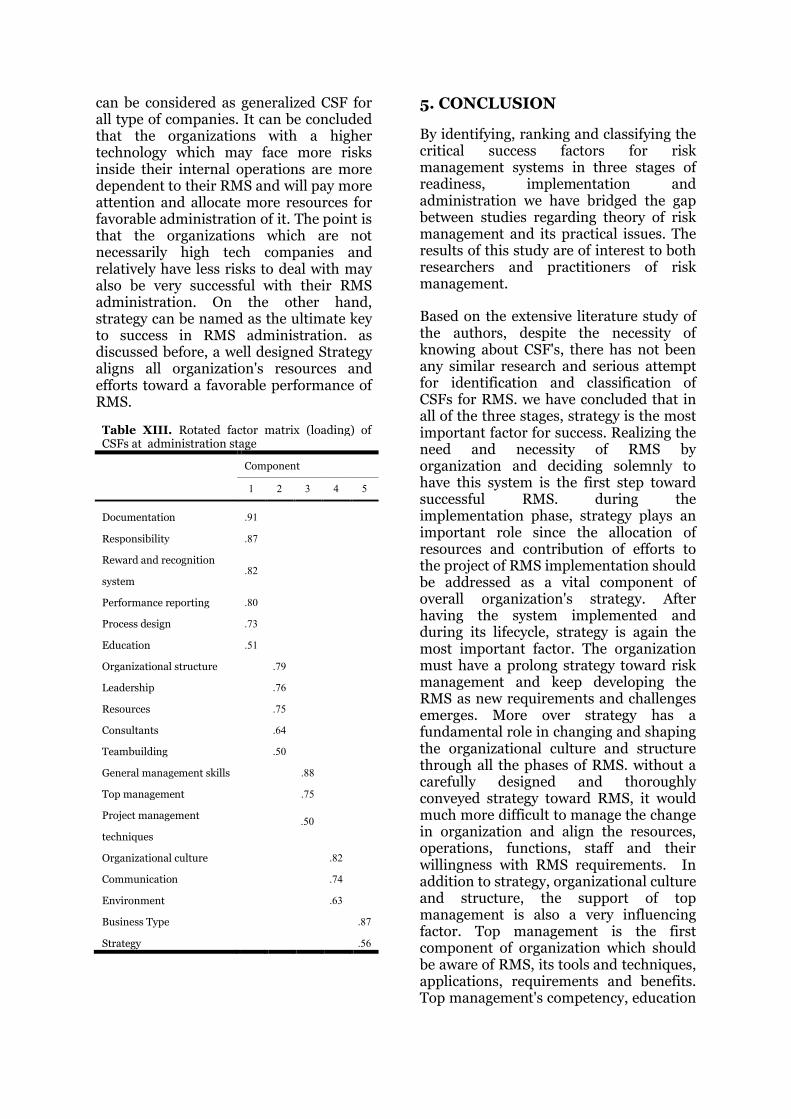
4.3.1. Component 1; Human Resources
This component covers 23% of total datavariance and consists of documentation (0.911), responsibility (0.867), reward and recognition system (0.820), performance reporting (0.798), process design (0.728) and education (0.511). Awareness of the people in organization about RMS and its benefit is an important factor for its successful administration. The role of continues training and education is significant in RMS successful administration.
Variable name MeanStd.
Deviation
Std. Error Mean
Reward and recognition system
3.6607 0.4095 0.0774
Business type 3.6964 0.4970 0.0939
Consultants 3.6964 0.4376 0.0827
Documentation 3.6964 0.4376 0.0827
Project Management Skills
3.7321 0.4611 0.0871
Leadership 3.7857 0.5169 0.0977
Teambuilding 3.8214 0.5808 0.1098
Responsibility 3.8571 0.5909 0.1117
Organizational culture
3.9107 0.5782 0.1093
Performance reporting
3.9107 0.5782 0.1093
General management skills
3.9643 0.5599 0.1058
Environment 3.9821 0.6733 0.1273
Process design 4.0714 0.6486 0.1226
Education 4.0893 0.6244 0.1180
Resources 4.1250 0.7022 0.1327
Communication 4.1429 0.6362 0.1202
Top management
4.2321 0.6307 0.1192
Organizational structure
4.2857 0.6726 0.1271
Strategy 4.4107 0.5782 0.1093
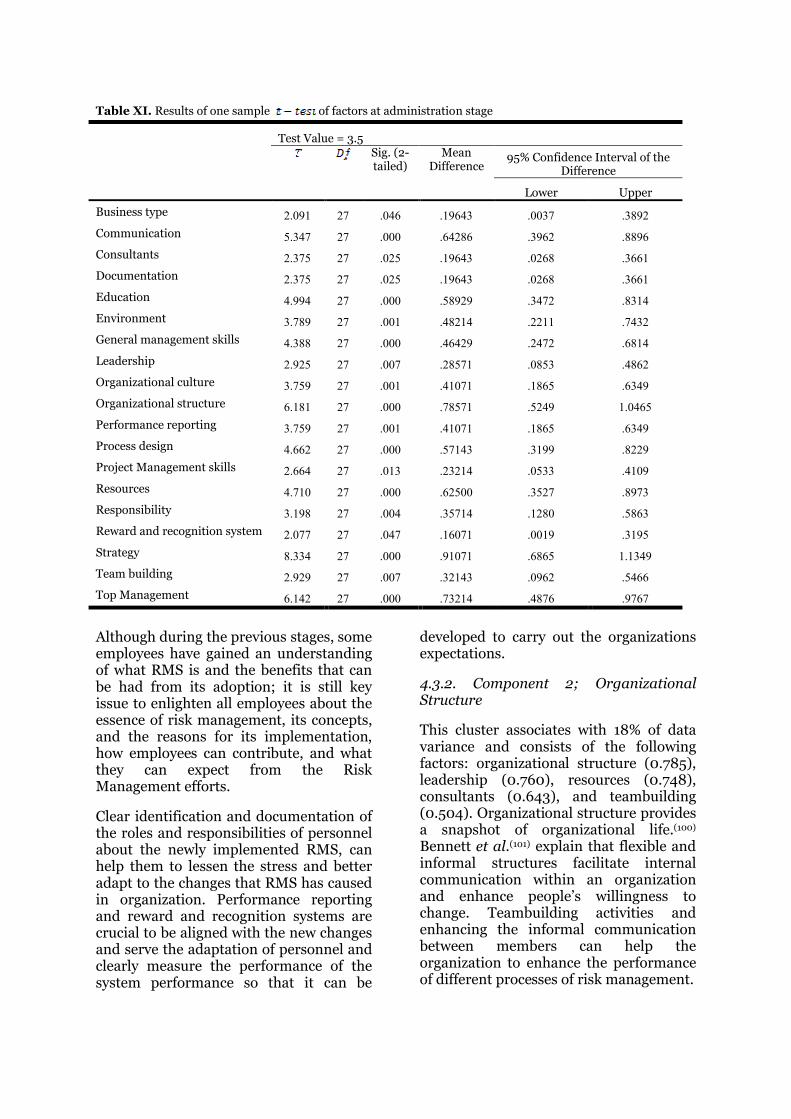
Although during the previous stages, some employees have gained an understanding of what RMS is and the benefits that can be had from its adoption; it is still key issue to enlighten all employees about the essence of risk management, its concepts, and the reasons for its implementation, how employees can contribute, and what they can expect from the Risk Management efforts.
Clear identification and documentation of the roles and responsibilities of personnel about the newly implemented RMS, can help them to lessen the stress and better adapt to the changes that RMS has caused in organization. Performance reporting and reward and recognition systems are crucial to be aligned with the new changes and serve the adaptation of personnel and clearly measure the performance of the system performance so that it can be
developed to carry out the organizations expectations.
4.3.2. Component 2; Organizational Structure
This cluster associates with 18% of data variance and consists of the following factors: organizational structure (0.785), leadership (0.760), resources (0.748), consultants (0.643), and teambuilding (0.504). Organizational structure provides a snapshot of organizational life.(100)
Bennett et al.(101) explain that flexible and informal structures facilitate internal communication within an organization and enhance people’s willingness to change. Teambuilding activities and enhancing the informal communication between members can help the organization to enhance the performance of different processes of risk management.
Table XI. Results of one sample of factors at administration stage
Test Value = 3.5
Sig. (2-tailed)
Mean Difference
95% Confidence Interval of the Difference
Lower Upper
Business type 2.091 27 .046 .19643 .0037 .3892
Communication 5.347 27 .000 .64286 .3962 .8896
Consultants 2.375 27 .025 .19643 .0268 .3661
Documentation 2.375 27 .025 .19643 .0268 .3661
Education 4.994 27 .000 .58929 .3472 .8314
Environment 3.789 27 .001 .48214 .2211 .7432
General management skills 4.388 27 .000 .46429 .2472 .6814
Leadership 2.925 27 .007 .28571 .0853 .4862
Organizational culture 3.759 27 .001 .41071 .1865 .6349
Organizational structure 6.181 27 .000 .78571 .5249 1.0465
Performance reporting 3.759 27 .001 .41071 .1865 .6349
Process design 4.662 27 .000 .57143 .3199 .8229
Project Management skills 2.664 27 .013 .23214 .0533 .4109
Resources 4.710 27 .000 .62500 .3527 .8973
Responsibility 3.198 27 .004 .35714 .1280 .5863
Reward and recognition system 2.077 27 .047 .16071 .0019 .3195
Strategy 8.334 27 .000 .91071 .6865 1.1349
Team building 2.929 27 .007 .32143 .0962 .5466
Top Management 6.142 27 .000 .73214 .4876 .9767
4.3.3. Component 3; Top Management
It contains the factors of general management skills (0.871), top management (0.751), and project management skills (0.501) and covers 14% of data variance. Top management clearly has a key role in implementing and running enterprise systems in
organization.(102,103) Various researchers have investigated and reported the influence of top management as a critical success factor in different management systems.(104-106) The level of competent in general management skills and project management maturity in organization has a positive correlation with the successful administration of RMS in organization.
Table XII. Total rotated variance explained for factors at administration stage
ComponentInitial Eigenvalues Rotation Sums of Squared Loadings
Total % of Variance Cumulative % Total % of Variance Cumulative %
1 6,689 35,205 35,205 4,286 22,557 22,557
2 2,920 15,367 50,572 3,416 17,981 40,537
3 1,960 10,318 60,890 2,695 14,183 54,720
4 1,569 8,259 69,150 2,301 12,110 66,830
5 1,150 6,055 75,205 1,591 8,375 75,205
6 ,996 5,244 80,449
7 ,783 4,123 84,572
8 ,716 3,768 88,339
9 ,527 2,774 91,114
10 ,346 1,821 92,935
11 ,317 1,671 94,606
12 ,295 1,550 96,156
13 ,209 1,103 97,259
14 ,149 ,787 98,046
15 ,112 ,588 98,633
16 ,107 ,561 99,194
17 ,082 ,432 99,627
18 ,041 ,216 99,843
19 ,030 ,157 100,000
Extraction Method: Principal Component Analysis.
4.3.4. Component 4; Organizational Culture
This cluster is named after its most important factor, organizational culture (), and explains approximately 12% of data variance. Having RMS implemented, is just the first step. Achievement of the expected results and benefits from implementing RMS is depended on the collaboration of all the personnel with this system and their level of confidence and
acceptance about it. RMS cannot be run only by the people at Risk Management Office organizational culture must bechanged so that the staff believe in RMS and the benefits that their alliance with it will have for themselves.
4.3.5. Component 5; Strategy
The last cluster covers nearly 9% of data variance and has two factors of business type (0.875) and strategy (0.562). Although business type has a factor loading much more than strategy, but it
can be considered as generalized CSF for all type of companies. It can be concluded that the organizations with a higher technology which may face more risks inside their internal operations are more dependent to their RMS and will pay more attention and allocate more resources for favorable administration of it. The point is that the organizations which are not necessarily high tech companies and relatively have less risks to deal with may also be very successful with their RMS administration. On the other hand, strategy can be named as the ultimate key to success in RMS administration. as discussed before, a well designed Strategy aligns all organization's resources and efforts toward a favorable performance of RMS.
Table XIII. Rotated factor matrix (loading) of CSFs at administration stage
Component
1 2 3 4 5
Documentation .91
Responsibility .87
Reward and recognition
system.82
Performance reporting .80
Process design .73
Education .51
Organizational structure .79
Leadership .76
Resources .75
Consultants .64
Teambuilding .50
General management skills .88
Top management .75
Project management
techniques
.50
Organizational culture .82
Communication .74
Environment .63
Business Type .87
Strategy .56
5. CONCLUSION
By identifying, ranking and classifying the critical success factors for risk management systems in three stages of readiness, implementation and administration we have bridged the gap between studies regarding theory of risk management and its practical issues. The results of this study are of interest to both researchers and practitioners of risk management.
Based on the extensive literature study of the authors, despite the necessity of knowing about CSF's, there has not been any similar research and serious attempt for identification and classification of CSFs for RMS. we have concluded that in all of the three stages, strategy is the most important factor for success. Realizing the need and necessity of RMS by organization and deciding solemnly to have this system is the first step toward successful RMS. during the implementation phase, strategy plays an important role since the allocation of resources and contribution of efforts to the project of RMS implementation should be addressed as a vital component of overall organization's strategy. After having the system implemented and during its lifecycle, strategy is again the most important factor. The organization must have a prolong strategy toward risk management and keep developing the RMS as new requirements and challenges emerges. More over strategy has a fundamental role in changing and shaping the organizational culture and structure through all the phases of RMS. without a carefully designed and thoroughly conveyed strategy toward RMS, it would much more difficult to manage the change in organization and align the resources, operations, functions, staff and their willingness with RMS requirements. In addition to strategy, organizational culture and structure, the support of top management is also a very influencing factor. Top management is the first component of organization which should be aware of RMS, its tools and techniques, applications, requirements and benefits. Top management's competency, education
and awareness about RMS play an undeniable role in having a constructive strategy and combining it with risk management strategy in future.
The main limitation of this study is its relatively small survey sample. Although the necessary primarily tests associated with the adequacy of sample size proved favorable for analysis to proceed, generalization of the results should be done with caution. The other limitation of this study is its restricted geographical focus on Swedish companies. Although all the identified factors are ubiquitous in almost every kind of organizations in everywhere, the ranking and their relative importance may be different regarding the special conditions and geographical characteristics of the company location. For example reward and recognition systems may be more or less important in different countries regarding the unique cultural issues of personnel.
This study can be the basis of a series of other studies regarding risk management. Future studies may include relatively larger sample sizes in more expanded geographical boarders. The CSF's for RMS can also be studied in special organizations and industries to compare the importance of each in different contexts. The authors are currently working on designing a Risk Management System Maturity Model based on the identified CSFs. The impact of each of the CSF's can also be studied in further details to shed light over the best possible ways and approaches that can be undertaken for achieving them.
REFRENCES
(1). Bedell D. Taking Risk Beyond Regulation. Global Finance. 2007 Jun; 21(6):58-60.
(2). Gjerdrum D. Risk Management Continues to Gain International Focus. Professional Safety. 2008 Dec;53(12):50-52.
(3). Rawls SW, Smithson CW. Strategic Risk Management. Continental Bank Journal of Applied Corporate Finance. 1990;2(4):6-18.
(4). Atkinson AA. Risk management and Monte Carlo simulation: an illustration and cautionary tale. CMA management. 2005; 79(9): 36-40.
(5). Aquila A. Best practices in risk management for firms. Accounting Today. September 04, 2006;20(16):8.
(6). Feinberg P. Importance of risk management stressed. Pensions & Investments. June 28, 1999;27(13):48.
(7). Unsworth E. U.K. companies urged to prepare for Year 2000. Business Insurance. September 15, 1997;31(37):67.
(8). Rao TVM, Leung HM, Mok CK, Burchett JF, Leung YH. Practices, barriers and benefits of using risk management approaches in selected Hong Kong industries. International Journal of Project Management. 1997 Oct; 15(5):297-312.
(9). Stripling T. Success requires embracing systematic risk management. Pipe Line & Gas Industry . January 2001;84(1):83.
(10). Schmit J, Roth K. Cost Effectiveness of Risk Management Practices. Journal of Risk & Insurance. 1990 Sep;57(3):455-470.
(11). Raz T, Michael E. Use and benefits of tools for project risk management. International Journal of Project Management. 2001 Jan; 19(1):9-17.
(12). Mitroff I, Alpaslan M. Preparing for Evil. Harvard Business Review. 2003 Apr; 81(4):109-115.
(13). Lock D. Project Management. Brookfield, Vermont: Gower Press, 1992.
(14). Han L, Lai G. An Analysis of Securitization in the Insurance Industry. Journal of Risk & Insurance. 1995 Jun;62(2):286-296.
(15). Gates S. Incorporating Strategic Risk into Enterprise Risk Management: ASurvey of Current Corporate Practice. Journal of Applied Corporate Finance. 2006;18(4): 81-90
(16). Akintoye AS, MacLeod MJ. Risk analysis and management in construction. International Journal of Project Management. 1997 Feb; 15(1):31-38

(17). Kutsch E, Hall M. Deliberate ignorance in project risk management. International Journal of Project Management, In Press, Corrected Proof, Available online 10 June 2009, ISSN 0263-7863, DOI: 10.1016/j.ijproman.2009.05.003.
(18). Ceniceros R. ERM growth rate slows, interest remains strong. Business Insurance. April 28, 2008;42(17):3-63.
(19). Lifang X, Jun L. Case Study on Project Risk Management Planning Based on Soft System Methodology. Part 2 in Cutting-Edge Research Topics on Multiple Criteria Decision Making. 2009;37-44.
(20). Letens G, Van NL, Heene A, Leysen J. Towards A Balanced Approach In Risk Identification. Engineering Management Journal. 2008 Sep;20(3):3-9
(21). Gogin C, Johnson D. Stay Focused on the Intent. Journal of Accountancy. 2008 Jan;205(1):46-47
(22). Campbell S, Currie G .Against Beck: In Defense of Risk Analysis. Philosophy of the Social Sciences. 2006 Jun;36: 149 - 172.
(23). Vose D. quantitative risk analysis: a guide to Monte Carlo simulation modeling. Wiley, New York ,1996.
(24). Liu HZ, Zheng ML. Analysis on Integrated Risk Response Planning inLarge Projects. proceedings of the 3rd international conference on product innovation management.2008; VOLS I AND II : 1325-1328
(25). Lee J ,Chun J. Risk Response Analysis Model for Construction Method Using the Forced-Decision Method and Binary Weighting Analysis. Journal of Asian Architecture and Building engineering. 2009 May; 8(1): 205-212
(26). Kallman J. Creating a Standard Operating Procedures Manual. Risk Management. 2006 Oct;53(10):42-42.
(27). Stoneburner G, Goguen A, Feringa A. Risk Management Guide for Information Technology Systems. Natl. Inst. Stand. Technol. Spec. Publ. 800-30 Rev A, 58 pages (January 2004(
(28). A Risk Management Standard © AIRMIC, ALARM, IRM: 2002
(29). ISO/IEC 27005:2008. Information technology -- Security techniques --Information security risk management. International Organization for Standardization, Geneva, Switzerland.
(30). ISO 17666:2003. Space systems --Risk management. International Organization for Standardization, Geneva, Switzerland.
(31). ISO/IEC 16085:2006. Systems and software engineering -- Life cycle processes -- Risk management. International Organization for Standardization, Geneva, Switzerland.
(32). ISO/TS 16732:2005. Fire safety engineering -- Guidance on fire risk assessment. International Organization for Standardization, Geneva, Switzerland.
(33). Bullen CV, Rockart JF. A primer on critical success factors. Working papers 1220-81. Report (Alfred P, Massachusetts Institute of Technology (MIT), Sloan School of Management. 1981.
(34). Rockart, JF. The changing role of the information systems executive: a critical success factors perspective. Sloan Management Review. 1982; 24(1): 3–13.
(35). Leidecker JK, Bruno AV. Identifying and Using Critical Success Factors. Long Range Planning Journal.1984;17(1):23-32
(36). Boynton AC, Zmud RW. An assessment of critical success factors. Sloan Management Review. Summer 1984;25: 17–27.
(37). Vedder J. How much can we learn from success?. Academy of Management Executive. 1992 Feb;6(1):56-66.
(38). Mohr J, Spekman R. Characteristics of partnership success: partnership attributes, communication behavior, and conflict resolution techniques. Strategic Management Journal. 1994; 15: 135–52.
(39). Baker BN, Murphy DC, Fisher D. Factors affecting project success.
Project management handbook (2nd ed.). New York: John Wiley, 1988.
(40). Pinto JK, Slevin DP. Critical success factors across the project life cycle. Project Management Journal. 1988;19(3):67–75 .
(41). Davies T. The ‘‘real’’ success factors on projects. International Journal of Project Management 2002;(20) 185–190
(42). Seetharaman A, Sreenivasan J, Boon LP. Critical Success Factors of Total Quality Management. Quality and Quantity. 2006 Oct 40(5): 675-695
(43). Kim CS, Yang KH, Johnson R, Roussos G ,Kim J. Finding critical success factors of ubiquitous supply chain management.12th pacific asia conference on information systems (PACIS ). 2008;1309-1320
(44). Wood P. Risk management off the shelf and into practice. Manager: British Journal of Administrative Management. 2005 Feb;45:26-27.
(45). Hampton J. Risk pro knows value of networking. Business Insuran. November 06, 2006;40(45):50-50.
(46). Lenckus D. To ensure success, get backing from management. Business Insurance. May 09, 2005;39(19):9-13.
(47). Coccia R. Communication key to success in enterprise risk management. Business Insurance . May 09, 2005;39(19):18.
(48). McDonald C. ERM Success Checklist.National Underwriter / Property & Casualty Risk & Benefits Management. 2004 Mar;108(10):26-26.
(49). Lemos T, Betts M, Eaton D, Almeida L. Model for Management of Whole Life Cycle Risk Uncertainty in the Private Finance Initiative (PFI). Journal of Project Finance. 2001;6(4):68.
(50). Roth J, Espersen D. Risk Reflections. Internal Auditor. 2004 Oct;61(5):75-79
(51). Criteria for Risk Manager of the Year award. Business Insurance. April 15, 2002;36(15):63.
(52). Berstelsen OW. Towards a Unified Field of SE Research and Practice.
IEEE Software. Nove/Dec 1997; 87–88.
(53). Goulding C. Grounded theory: a practical guide for management, business and market researchers. London: Thousand Oaks, Calif.: SAGE, 2002.
(54). Strauss AL. Basics of qualitative research: techniques and procedures for developing grounded theory. Thousand Oaks, Calif.: SAGE, cop. 1998.
(55). Montoni M, Rocha AR. A Methodology for Identifying Critical Success Factors That Influence Software Process Improvement Initiatives: An Application in the Brazilian Software Industry. Software Process Improvement. 2007:175-186.
(56). Bolagsverket: Swedish Companies Registration Office, available online at:http://www.bolagsverket.se/index.html
(57). Jeffcoate J, Chappell C, Feindt S. Best practice in SME adoption of e-commerce. Benchmarking: An international Journal. 2002; 9(2): 122–132.
(58). Likert R. A technique for the measurement of attitudes. Archives of Psychology. 1932; 22(140):55.
(59). Ling YY. A conceptual model for the selection of architects by project managers in Singapore. International Journal of Project Management. 2003;21:135–44.
(60). Field A. Discovering statistics, using SPSS for windows. London: Sage Publications; 2005.
(61). Norusis MJ. SPSS 10.0 guide to data analysis. Englewood Cliffs, NJ: Prentice Hall; 2000.
(62). Hair JF, Anderson RE., Tatham RL, Black WC.. Multivariate Data Analysis, fifth ed. Prentice-Hall,Englewood Cliffs, NJ: 1998.
(63). Lewis-Beck MS. Factor analysis and related techniques. London : SAGE, 1994
(64). Moura P, Kanji GK. Leadership for excellence in the Portuguese municipalities: critical success factors,
measurements and improvement strategies. Total Quality Management & Business Excellence March 2003;14(2):131
(65). Chin K, Chan B, Lam P. Identifying and prioritizing critical success factors for competition strategy. Industrial Management & Data Systems , 2008 May;108(3/4):437-454.
(66). O'Connor K. Leadership Development Is Critical To Distribution Growth. National Underwriter / Life & Health Financial Services. March 20, 2006;110(11):14-30.
(67). Thamhain H. Team Leadership Effectiveness in Technology Based Project Environments. Project Management Journal. 2004 Dec;35(4):35-46.
(68). Lee C, Shimpi P. The Chief Risk Officer: What Does It Look Like and How Do You Get There?. Risk Management. September 2005;52(9):34-38
(69). Ealy T. Bringing Risk Management Into the Boardroom. Risk Management. April 1993;40(4):30-37.
(70). Froot K, Scharfstein D, Stein J. A Framework for Risk Management. Harvard Business Review. 1994 Nov;72(6):91-102
(71). Van DM, Garlick R. Recognition and Reward. Leadership Excellence . 2008 Jan;25(1):17-18
(72). Kohn A. Reward and recognition or `controlled seduction'?. Potentials in Marketing. 1996 Aug;29(8):27.
(73). Meijaard J, Brand M, Mosselman M. Organizational Structure and Performance in Dutch small Firms. Small Business Economics 2005 Aug;25(1):83-96.
(74). Biggiero L, Laise D. Comparing and choosing organizational structures: A multicriteria methodology. Human Systems Management. 2003 Sep;22(4):185-195.
(75). Bhargava S, Sinha B. Prediction of Organizational Effectiveness as a Function of Type of Organizational Structure. Journal of Social Psychology. 1992 Apr;132(2):223-231.
(76). Speculand R. One million pound investment and 90 percent chance of failure – would you sign off? strategic direction. 2007; 23(2):3-5
(77). Mu J, Peng G, MacLachlan D. Effect of risk management strategy on NPD performance. Technovation. 2009 Mar;29(3):170-180.
(78). Courson W. liability-driven investing an enterprise risk management strategy. (cover story). Healthcare Financial Management. 2008 Aug;62(8):58-62.
(79). Geisel R. Top-to-bottom support backs successful ERM programs. Business Insurance. April 07, 2008;42(13):16-17.
(80). Yehuda Baruch. Leadership - Is That What We Study? Journal of Leadership & Organizational Studies. 1998;5(1):100-124 .
(81). Kolb DG, Prussia G, Francoeur J. Connectivity and Leadership: The Influence of Online Activity on Closeness and Effectiveness. Journal of Leadership and Organizational Studies, 2009 May;15:342-52.
(82). Lawson E, Price C. The psychology of change management. McKinsey Quarterly. 2003 Jun; 2:30-41.
(83). Clarke A. A practical use of key success factors to improve the effectiveness of project management. International Journal of Project Management 1999 Jun; 17(3):139-146.
(84). Bryde D. Perceptions of the impact of project sponsorship practices on project success. International Journal of Project Management. 2008 Nov;26(8):800-809
(85). Westerveld E. The Project Excellence Model®: linking success criteria and critical success factors. International Journal of Project Management. 2003 Aug;21(6):411-419
(86). Diallo A, Thuillier D. The success of international development projects, trust and communication: an African perspective. International Journal of Project Management. 2005 Apr;23(3):237-252.
(87). Turner JR. The handbook of project-based management. , McGraw-Hill, England: 1993 .
(88). Kuprenas J. Implementation and performance of a matrix organization structure. International Journal of Project Management. 2003 Jan; 21(1):51-63.
(89). Bates GD, Roenker G, Junker DJ. A new matrix organization for a design firm. Issues in Engineering Journal of Professional Activities. 1981 Oct;107(4): 237-246
(90). Shehu Z, Akintoye A. Major challenges to the successful implementation and practice of programme management in the construction environment: A critical analysis. International Journal of Project Management, In Press, Corrected Proof, Available online 14 March 2009, ISSN 0263-7863, DOI: 10.1016/j.ijproman.2009.02.004.
(91). White D, Fortune J. Current practice in project management: an empirical study. International Journal of Project Management. 2002 Jan; 20(1):1-11
(92). Duffy PJ, Thomas RD, Project performance auditing. International Journal of Project Management. 1989 May; 7(2):101-104 ,
(93). Raymond L, Bergeron F. Project management information systems: An empirical study of their impact on project managers and project success,International Journal of Project Management, 2008 Feb; 26(2):213-220
(94). Stonich PJ. The performance measurement and reward system: Critical to strategic management, Organizational Dynamics. 1984; 12(3):45-57
(95). Simons R.. How risky is your company? Harvard Business Review. 1999; 77(3): 85–94.
(96). First Thought. Business Strategy Review. Fall2008;19(3):1-1
(97). Markides C. What is Strategy and How Do You Know If You have One?. Business Strategy Review;2004;15(2):5-12.
(98). Helms MM. Manufacturing Strategy and its Importance to Organizational
Competitiveness. Competitiveness Review: An International Business Journal incorporating Journal of Global Competitiveness. 1994; 4(2):47-53
(99). Altinay L, Roper A. The role and importance of development directors in initiating and implementing development strategy. International Journal of Contemporary Hospitality Management..2001;13(7):339 - 346
(100).Rapert M, Wren B. Reconsidering Organizational Structure; A Dual Perspective of Frameworks and Processes. Journal of Managerial Issues Fall 1998;10(3):287-294
(101). Bennett R, Gabriel H. Organizational factors and knowledge management within large marketing departments: An empirical study. Journal of Knowledge Management. 1999; 3(3), 212-225.
(102). Dong L. Modeling top management influence on ES implementation.Business Process Management Journal. 2001; 7(3):243-250
(103). Kakabadse AP, Alderson S, Randlesome C, Myers A. Austrian Boardroom Success: A European Comparative Analysis of Top Management. Journal of Managerial Psychology. 1993; 8 (4):2-32
(104).Keller AZ, Huwaishel AM. Top-management Attitude towards Safety in the Western European Chemical and Petrochemical Industries .Disaster Prevention and Management; 1993;2(3)
(105). Ahire SL, O’Shaughnessy KC. The role of top management commitment in quality management: an empiricalanalysis of the auto parts industry. International Journal of Quality Science. 1998; (3)1:5-37
(106).Myers A, Kakabadse A, Gordon C. Effectiveness of French management: Analysis of the behaviour, attitudes and business impact of top managers. Journal of Management Development. 1995;14(6):56-72
Top Related