


Languages
Pages
Legal


© Orica Limited Group
Credit Suisse Asian Investment Conference
Hong Kong
25th
– 27th
March 2014
Ian Smith, Managing Director and CEO

Disclaimer
Forward looking statements
This presentation has been prepared by Orica Limited. The information contained in this presentation is for informational purposes only. The information contained in this presentation is not investment or financial product advice and is not intended to be used as the basis for making an investment decision. This presentation has been prepared without taking into account the investment objectives, financial situation or particular needs of any particular person.
No representation or warranty, express or implied, is made as to the fairness, accuracy, completeness or correctness of the information, opinions and conclusions contained in this presentation. To the maximum extent permitted by law, none of Orica Limited, its directors, employees or agents, nor any other person accepts any liability, including, without limitation, any liability arising out of fault or negligence, for any loss arising from the use of the information contained in this presentation. In particular, no representation or warranty, express or implied, is given as to the accuracy, completeness or correctness, likelihood of achievement or reasonableness of any forecasts, prospects or returns contained in this presentation. Such forecasts, prospects or returns are by their nature subject to significant uncertainties and contingencies.
Before making an investment decision, you should consider, with or without the assistance of a financial adviser, whether an investment is appropriate in light of your particular investment needs, objectives and financial circumstances. Past performance is no guarantee of future performance.
Non-International Financial Reporting Standards (Non-IFRS)
information
This presentation makes reference to certain non-IFRS financial information. Management use this information to measure the operating performance of the business and has been presented as this may be useful for investors. This information has not been reviewed by the Group’s auditor.
2
3
Introduction 3 - 7
Sustainability 8 - 11
Projects Update 12 - 16
►Business Update 17 - 24

What We Are
1. World’s largest provider of commercial explosives to mining and infrastructure
markets with ~ 28% global market share.
2. Largest supplier of chemical products to mining, water treatment and other
industrial, food and cosmetics markets in Australia and New Zealand and a growing
presence in Latin America.
3. Global leader in providing ground support in mining & tunneling.
4. Leading global supplier of cyanide for use in gold extraction.
5. ASX listed with market capitalization in the Top 50.
4

Where We Are
5
~14,500 Employees
Operations in 50 countries
Customers in over 100 countries
Orica Coverage

Geographic & Commodity Diversity
• 92% of Group EBIT is generated from
mining related industries including
quarrying and construction
29%
6%
19% 6%
12%
14%
13%
Thermal Coal
Coking Coal
Gold
Iron ore
Copper
Q&C
Others
6
FY13 Mining Services Revenue
• Commodity and geographic diversity
reduces earnings volatility.
33%
10%
24%
17%
11%
5%
Africa and CIS
Europe
Latin America
North America
Asia & Pacific
Australia

Delivery of Strategy
7
• Removal of functional duplication
• Cost control and efficiencies
• Supply chain and manufacturing excellence
• Capital light approach to manufacturing
• Disciplined approach to project management
• Minimise working capital needs
Leverage
New
Operating
Model
Value in Use
Disciplined
Capital
Allocation
• Advanced blasting techniques
• Integrated service solutions
• Differentiated and innovative products

8
Introduction 3 - 7
Sustainability 8 - 11
Projects Update 12 - 16
►Business Update 17 - 24

43.9
29.5
25.0
22.4
18.5
17.4
16.8
16.8
14.9
12.7
11.5
10.6
9.2
8.4
8.2
7.8
7.6
7.1
6.8
6.7
6.0
5.9
5.8
5.4
4.6
4.1
4.0
3.6
3.5
3.5 2.7
2.2
1.5
0.1
0.0 5.0 10.0 15.0 20.0 25.0 30.0 35.0 40.0 45.0 50.0
Wesfarmers Ltd
Qantas Airways Ltd
Asciano Group
Whitehaven Coal Ltd
David Jones
CSR Ltd
Toll Holdings Ltd
Boral Ltd
Brambles Ltd
Treasury Wine Estates
Beach Energy Limited
Emeco Holdings Ltd
Stockland
ResMed Inc
Ridley Corporation Ltd
UGL Ltd
Fortescue Metals Group Ltd
SP AusNet
Fletcher Building Ltd
Origin Energy Ltd
Transfield Services Ltd
AGL Energy Ltd
Incitec Pivot Ltd
Downr EDI Ltd
BHP Biliton Ltd
Mondelphous Group
AWE Limited
Newcrest Mining Ltd
Amcor Ltd
Transurban Group
Orica Ltd
Nufarm Limited
Perseus Mining Ltd
WorleyParsons Ltd
YTD is 2.0 (as at end February 2014)
9
Safety Performance
2013 Total Recordable Injury Frequency Rate Data (per million hours worked, excludes December Y/E companies)
Source: Citi Research

• The net cost of the Australian carbon tax to Orica is immaterial:
− the cost of direct emissions is mostly offset through free permits allowed for EITE
(Emissions Intensive Trade Exposed) activities
− installment of abatement at most nitric acid plants in Australia generates benefits
which help offset the cost of Scope 2 and Scope 3 emissions.
• Abatement technology has reduced annual carbon emissions by more than 750,000
tonnes at a total capital cost of approximately A$9M.
• The future direction of carbon tax legislation remains unclear following a recent change
in government in Australia.
Greenhouse Gas
Abatement has reduced Orica’s annual carbon emissions by the equivalent of the
total emissions from taking more than 250,000 vehicles off the road
10
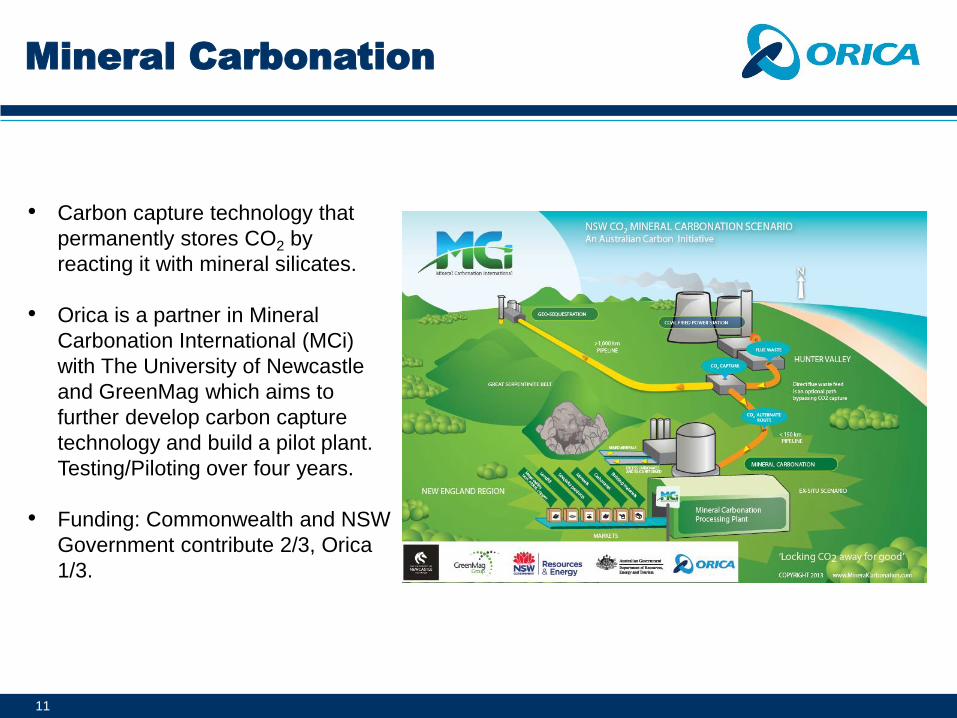
Mineral Carbonation
• Carbon capture technology that
permanently stores CO2 by
reacting it with mineral silicates.
• Orica is a partner in Mineral
Carbonation International (MCi)
with The University of Newcastle
and GreenMag which aims to
further develop carbon capture
technology and build a pilot plant.
Testing/Piloting over four years.
• Funding: Commonwealth and NSW
Government contribute 2/3, Orica
1/3.
11

12
Introduction 3 - 7
Sustainability 8 - 11
Projects Update 12 - 16
►Business Update 17 - 24

Burrup Ammonium Nitrate Project
• 330ktpa capacity AN plant on the Burrup Peninsula,
Western Australia, in joint venture with Yara and Apache
(Orica share: 45%).
• Unique project and capital structure
− $110M entry fee
− 45% of project capital
− 100% marketing rights for all AN
• Provides access into the growing North West Australian
iron ore market (geographic & commodity diversification).
• Onsite construction 39% complete, module fabrication
68% complete and overall project 73% complete.
• Project on schedule for commissioning mid to late 2015,
with nameplate production rates expected by end of 2016.
13
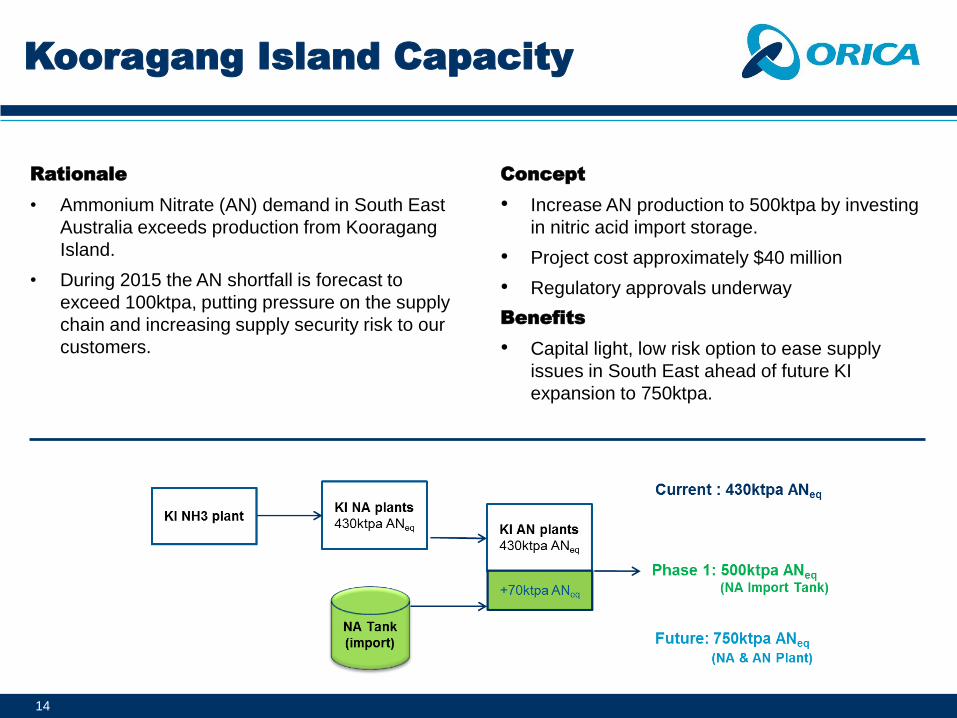
Rationale
• Ammonium Nitrate (AN) demand in South East
Australia exceeds production from Kooragang
Island.
• During 2015 the AN shortfall is forecast to
exceed 100ktpa, putting pressure on the supply
chain and increasing supply security risk to our
customers.
Kooragang Island Capacity
Concept
• Increase AN production to 500ktpa by investing
in nitric acid import storage.
• Project cost approximately $40 million
• Regulatory approvals underway
Benefits
• Capital light, low risk option to ease supply
issues in South East ahead of future KI
expansion to 750ktpa.
14

• AN plant with capacity of ~ 300 ktpa located at
Bontang, Indonesia.
• The plant is currently operating at name plate
capacity on an annualised basis and product
quality is within specification.
• Investment returns will improve over the next 2
years now that full plant capacity has been
achieved.
• The CY14 export licence will enabled regional
supply chain flexibility.
Bontang Ammonium Nitrate Plant
0
50
100
150
200
250
300
Actual Actual Actual
H2 2012 H1 2013 H2 2013
An
nu
alised
AN Production kt
15
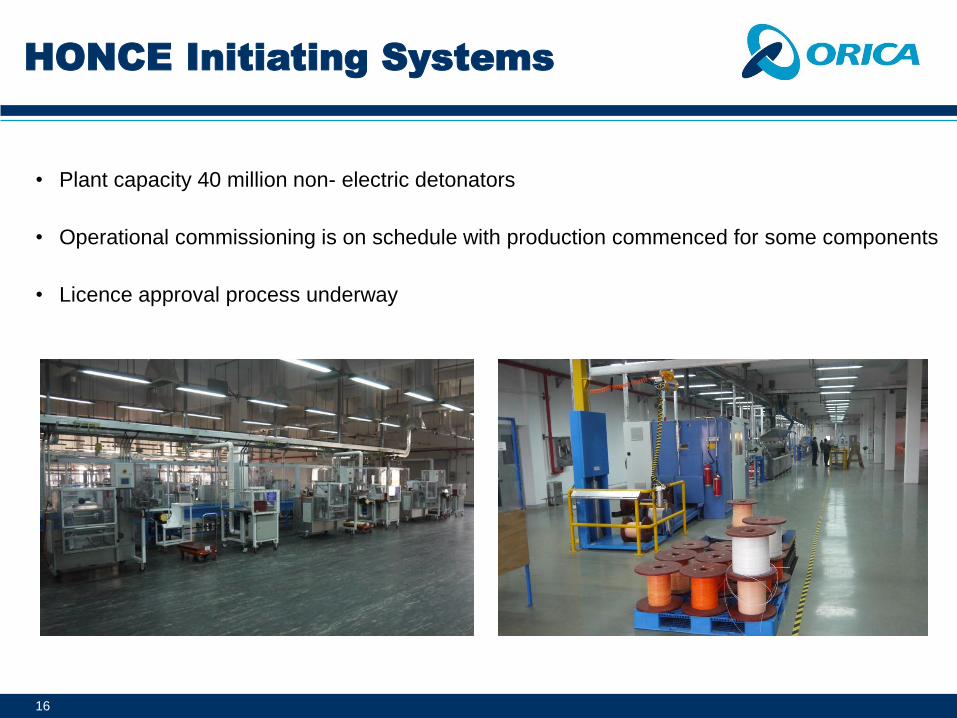
HONCE Initiating Systems
• Plant capacity 40 million non- electric detonators
• Operational commissioning is on schedule with production commenced for some components
• Licence approval process underway
16

17
Introduction 3 - 7
Sustainability 8 - 11
Projects Update 12 - 16
►Business Update 17 - 24

North American AN Agreement
• Entered 10 year agreement with CF Industries Inc to
supply up to 800,000 tonnes for North American
operations
– Commencing in January 2017 with an option for
Orica to extend for further 5 years until end 2031
• AN sourced from Yazoo city facility in Mississippi
Cost Implications
• Maintain an equivalent cost base across its AN
supplier network compared to current cost profile
• Future contract prices based on the lower of:
1) Combination of inflation and gas price
movements (with gas the minor component) or
2) CF’s market prices for explosive products
18

Gas Agreement with ESSO / BHPB
• Entered 3 year deal with Esso Australia and BHP
Billiton to supply KI’s total gas requirement from 1
January 2017 to 31 December 2019
– 14PJ per annum (total supply of 42PJ)
– pathway to extend for a further 3 years
• Gas sourced from Gippsland basin via ExxonMobil’s
Longford processing plant
Cost Implications
• Strike unsuccessful: cost increases of ~ $12mpa
compared to current contract (~$8m at KI & ~$4m at
Yarwun)
• Strike successful: costs flat compared to current
contract
• Reduces cost volatility for customers
19

Strike Energy
• Agreement with Strike to develop a highly prospective
gas resource
– Orica is the only foundation customer
– Initial agreement - 20 year supply agreement for up
to 150PJ
– Additional agreement – an extra 100PJ over 10
years
– Strengthens Orica’s east coast gas position
• Southern Cooper Basin Gas Project
– Gas saturated deep coals in PEL96
– 2 appraisal drilling holes completed in Q4 2013
with results indicating:
› Coal is thicker and hence holds more gas
› Not water saturated so reduces operating costs
– Q2 2014 Initial production testing
– Targeting gas supply to Orica in late 2016
20

East Coast Australia Gas Supply
• Orica’s forward-looking Australian east coast gas supply strategy now provides for natural
gas supply at competitive pricing until 2029
• Annual gas requirements for east coast from 2014 – 2016 are covered by current
agreements
• The total annual gas requirement for Kooragang Island and Yarwun is 17.5PJ
21
2017 2018 2019 2020 2021 2022 2023 2024 2025 2026 2027 2028 2029
Esso/BHPB Gas Supply Agreement
Strike Energy Gas Agreement
Total
14 PJ per annum
7.5 PJ per annum
21.5 PJ per annum
17.5 PJ per annum
17.5 PJ per annum
potential extension

Chemicals
Represents ~ 8% of Group EBIT ($92 million)
• operates in Australasia, Latin America and Asia
• diverse range of markets
• strategic review of business underway
First half earnings have been impacted by
• lower acid volumes due to temporary customer
shutdowns
• lower average global caustic soda prices
• rationalisation of Latin American business
22
FY13 Chemicals Revenue
Traded Chemicals
80%
Manufactured
Chemicals 20%

Explosives
Contribution per tonne is better in 2014 YTD than FY 2013
YTD volumes are lower than same time in FY2013
Volumes expected to improve in H2 FY2014
1. Contribution includes all income and costs directly attributable to the sale of explosives products and services and excludes any allocation of shared support costs which are managed functionally and for the benefit of the
entire product portfolio within a region. The negative impact to EBIT in 2012 of $87million related to the KI incident has been excluded from this analysis.
2. The contribution for the Asia region includes only contribution from explosives products and services sold in the Asia region and excludes profits generated in the Global Hub relating to North America and Latin America.
These profits have been adjusted against the respective region (the amounts are as disclosed in the 2013 Full Year Results Profit Report).
23
-50
-40
-30
-20
-10
0
10
20
30
Australia / Pacific North America Latin America EMEA Asia Total
FY 2
01
3 v
ers
us
FY 2
01
2 %
mo
vem
en
t Change in Explosives Contribution per Tonne
1
H1 2013 H2 2013 FY 2013
2

24
Update
As flagged in November 2013, market conditions in H1 2014 are proving to
be more challenging than what is expected in H2 2014.
The profit in H1 2014 is expected to be below H1 2013 due to market
demand and weather.
No change to guidance (Group net profit after tax before individually material
items in FY 2014 is expected to exceed FY 2013), however volatile market
conditions and weather add a degree of uncertainty.
25
Supplementary Information

Group Financial Performance
Full year ended 30 September (A$M) 2013 2012 % o
EBITDA1 1,269.2 1,274.0 0
EBIT2 984.8 1,022.6 (4)
Statutory profit after tax3 601.6 402.8 49 h
Underlying profit after tax4 601.6 650.2 (7)
Net operating cash flow 1,058.7 544.1 95 h
1. Earnings before interest and tax plus depreciation and amortisation.
2. Profit/(loss) before individually material items, net financing costs and income tax expense as disclosed in note 2 within the Orica Annual Report.
3. Net profit for the period attributable to shareholders of Orica Limited as disclosed in note 2 to the Orica Annual Report.
4. Profit after income tax expense before individually material items attributable to shareholders of Orica Limited as disclosed in note 2 within the Orica Annual Report.
26

Investing Activities
Capital Expenditure1 / Acquisitions Actual 2013 Budget 2014
Sustaining 243 211
Customer Facing Contract Capital2 116 121
Growth3
217 95
Burrup4, 5 200 162
Total 776 589
1. Excludes capitalised interest.
2. Capital expenditure invested for the supply of products and services on a customer site. These assets are generally specified within customer contracts.
3. 2013 includes $3M of other acquisition expenditure.
4. The total Orica project spend is US$360 million (45% of US$800 million) plus Orica’s project entry fee of US$110 million in 2013 to Yara and Apache. In 2015, the Burrup
capital spend will be approximately US$80million.
5. Classified as an investment in associates accounted for using the equity method. Cash outflows associated with this investment are included as Payments for purchase of
investments in the Statement of Cash Flows within the Orica Annual Report.
Lower capital expenditure forecast in FY14
27
Top Related