


Languages
Pages
Legal


CREATING A LEADINGMID-TIER GOLD COMPANY
OCTOBER 25, 2017
Trek Mining, NewCastle Gold, Anfield Gold
TSX-V: EQX
CAUTIONARY STATEMENTSForward-looking information and reserve/resource estimates
2
information currently available, they may prove to be incorrect. Forward-looking statements are basedon information available at the time those statements are made and/or management's and/or itsqualified persons' good faith belief as of that time with respect to future events, and are subject toknown and unknown risks and uncertainties outlined in the Companies’ corporate disclosure and otherdocuments filed on www.sedar.com, that could cause actual performance or results to differ materiallyfrom those expressed in or suggested by the forward-looking statements. Forward-looking statementsspeak only as of the date those statements are made. Except as required by applicable law, we assumeno obligation to update or to publicly announce the results of any change to any forward-lookingstatement contained herein to reflect actual results, future events or developments, changes inassumptions or changes in other factors affecting the forward- looking statements. If we update any oneor more forward-looking statements, no inference should be drawn that we will make additional updateswith respect to those or other forward-looking statements. You should not place undue importance onforward-looking statements and should not rely upon these statements as of any other date. All forward-looking statements contained in this presentation are expressly qualified in their entirety by thiscautionary statement.Technical Information. David Laing, BSc, MIMMM, Trek Mining's COO, and Scott Heffernan, MSc,PGeo, Trek Mining’s EVP Exploration, are the Qualified Persons under NI 43-101 for Trek Mining andhave reviewed, approved and verified the technical content of this presentation as it relates to theAurizona, Warintza, Ricardo, Elk Gold and Koricancha Projects. All technical information related toAurizona is based on the “Feasibility Study on the Aurizona Gold Mine Project” prepared byLycopodium Minerals Canada Ltd. with an effective date of July 10, 2017, which is available fordownload on the Company’s website at www.trekmining.com and on SEDAR at www.sedar.com. MarcLeduc, P.Eng., NewCastle’s Interim Chief Executive Officer, is the Qualified Person for NewCastle andhas reviewed, approved and verified the technical content of this presentation as it relates to the CastleMountain and La Verde projects. Leo Hathaway, MSc, PGeo, Anfield’s Chief Geological Officer, is theQualified Person for Anfield and has reviewed, approved and verified the technical content of thispresentation as it relates to the Coringa project.Cautionary Note to U.S. Investors Concerning Estimates of Mineral Resources. These estimateshave been prepared in accordance with the requirements of Canadian securities laws, which differ fromthe requirements of U.S. securities laws. The terms "mineral resource", "measured mineral resource","indicated mineral resource" and "inferred mineral resource" are defined in NI 43-101 and recognized byCanadian securities laws but are not defined terms under the U.S. Securities and ExchangeCommission ("SEC") Guide 7 ("SEC Guide 7") or recognized under U.S. securities laws. U.S. investorsare cautioned not to assume that any part or all of mineral deposits in these categories will ever beupgraded to mineral reserves. "Inferred mineral resources" have a great amount of uncertainty as totheir existence, and great uncertainty as to their economic and legal feasibility. It cannot be assumedthat all or any part of an "inferred mineral resource" will ever by upgraded to a higher category. UnderCanadian securities laws, estimates of "inferred mineral resources" may not form the basis of feasibilityor pre-feasibility studies. U.S. investors are cautioned not to assume that all or any part of an inferredmineral resource exists or is economically or legally mineable. Accordingly, these mineral resourceestimates and related information may not be comparable to similar information made public by U.S.companies subject to the reporting and disclosure requirements under the U.S. federal securities lawsand the rules and regulations thereunder, including SEC Guide 7.Non-GAAP Measures. This presentation refers to expected AISC and other financial measures whichare non-GAAP measures. These measurements have no standardized meaning under IFRS and maynot be comparable to similar measures presented by other companies. These measurements areintended to provide additional information and should not be considered in isolation or as a substitute formeasures of performance prepared in accordance with IFRS.Exchange rate assumed is 0.78 USD:CAD. Numbers may not add due to rounding.
This presentation does not constitute an offering of securities and the information contained herein issubject to the information contained in the Companies’ continuous disclosure documents.
Forward-looking StatementsThis presentation includes certain statements that constitute "forward-looking statements", and"forward-looking information" within the meaning of applicable securities laws (collectively, “forward-looking statements"). These statements appear in a number of places in this presentation andinclude statements regarding our intent, or the beliefs or current expectations of our officers anddirectors. Such forward-looking statements involve known and unknown risks and uncertainties thatmay cause our actual results, performance or achievements to be materially different from any futureresults, performance or achievements expressed or implied by such forward-looking statements.When used in this presentation words such as “intends”, “expects”, “will be”, “underway”, “targeted”,“expected”, “potential”, “look forward”, “continue”, “estimated”, “would”, “subject to” and similarexpressions are intended to identify these forward-looking statements. Forward-looking statementsmade herein include statements derived from the feasibility study on the Aurizona Project, including,without limitation: estimated construction costs, operating costs, cash costs, all-in sustaining cost("AISC") per ounce, initial and sustaining capex and other costs, estimated net present value("NPV"), initial rate of return ("IRR"), expected life of mine ("LOM"), estimated reserves andresources, expected production rates, expected gold recoveries, and other economic and operationalparameters inherent to a feasibility study for a mineral project. In addition, this presentation mayinclude forward-looking statements relating to statements regarding the proposed Transaction, theproposed name change of the combined company, satisfaction of certain approvals (including TSX-Vand shareholder approvals), the growth potential of Equinox Gold and its assets, the completion ofthe proposed US$85 million credit facility and US$200 million development and acquisition facility,the proposed Board and management team of Equinox Gold, the anticipated restart of production atAurizona, the anticipated restart of production at Castle Mountain, and the financial position ofEquinox Gold following the Transaction. Although Trek Mining, NewCastle and Anfield (the“Companies”) believe that the expectations reflected in such forward-looking statements and/orinformation are reasonable, undue reliance should not be placed on forward-looking statementssince the Companies can give no assurance that such expectations will prove to be correct. Thesestatements involve known and unknown risks, uncertainties and other factors that may cause actualresults or events to differ materially from those anticipated in such forward-looking statements,including the risks, uncertainties and other factors identified in the Companies’ periodic filings withCanadian securities regulators, and assumptions made with regard to: the Companies’ ability tocomplete the proposed Transaction; the Companies’ ability to secure the necessary shareholder,legal and regulatory approvals required to complete the Transaction; the anticipated results of thepre-feasibility study for Castle Mountain; the anticipated Board of Directors decision to approveconstruction of Aurizona; the timing for receipt of permits required to commence full-scaleconstruction at Aurizona; the ability to complete the debt facility required to fund construction anddevelopment of Aurizona; the estimated costs associated with construction of Aurizona; the ability torestart production at Aurizona; the timing of the anticipated restart of production; the ability toachieve the gold production rates and costs outlined in the Aurizona feasibility study; the ability toincrease throughput and production levels at the Koricancha Mill; the ability to advance explorationefforts at Aurizona and Castle Mountain, the results of exploration efforts at Aurizona and CastleMountain; and the Companies’ ability to achieve the synergies expected as a result of theTransaction. We have based these forward-looking statements largely on our current expectationsand projections about future events and financial trends affecting the financial condition of ourbusiness. These forward-looking statements were derived using numerous assumptions regardingexpected project parameters, results of operations, performance and business prospects andopportunities that could cause actual results to differ materially from those in the forward-lookingstatements. While the company considers these assumptions to be reasonable, based on

CREATING A LEADING GOLD COMPANYMulti-asset company with exceptional long-term growth platform
31. Cash and marketable securities at September 30, 2017, before Transaction costs. 2. First gold pour for Aurizona targeted for late 2018. 3. Market capitalization calculated using Transaction price of C$1.03 per share and based on Pro Forma basic shares outstanding (including assumed conversion of US$15M of convertible note at US$0.81 per share).
~C$98 MCASH 1
FIRST GOLD POURBY LATE 2018 2
5.8 Moz GOLDM&I RESOURCE
~C$436 MMARKET CAP 3
Broadened shareholder base and enhanced liquidity• Ross Beaty to become Chairman and major shareholder• Heavily invested management team and directors collectively own ~12% of company
Strong financial platform to fully fund Aurizona and advance Castle Mountain• US$85 M credit facility with Sprott• US$200 M development and acquisition facility• Non-core asset divestments will add to cash
Multi-million-ounce gold resource• Significant exploration potential with expansion drilling underway• Portfolio of highly prospective gold and copper projects
Two past-producing gold mines with expansion potential • Aurizona (Brazil) – early works construction underway, low capital intensity
near-term gold producer• Castle Mountain (California) – prefeasibility study underway
EXPERIENCED LEADERSHIP TEAMCompany builders. Mine builders. Explorers.
Christian Milau, CEO and Executive DirectorLuna Gold, True Gold, Endeavour Mining, New Gold
Greg Smith, President and Executive DirectorJDL Gold, Esperanza Resources, Minefinders
David Laing, COOLuna Gold, True Gold, Quintana Resources, Endeavour Mining
Peter Hardie, CFOLuna Gold, True Gold, Nevsun
EXECUTIVE TEAM
A TRACK RECORD OF SUCCESSRoss Beaty, ChairmanPan American Silver, Lumina Copper, Lumina Gold, Alterra Power, Equinox Resources
Lenard Boggio, DirectorNewCastle Gold, PricewaterhouseCoopers, Sprott, BC Hydro
Marcel de Groot, DirectorPathway Capital
Marshall Koval, DirectorAnfield Gold, Lumina Gold, Northern Peru Copper
Jacques McMullen, DirectorNewCastle Gold, Barrick Gold, Highland Gold, Fire River Gold
BOARD OF DIRECTORS
4
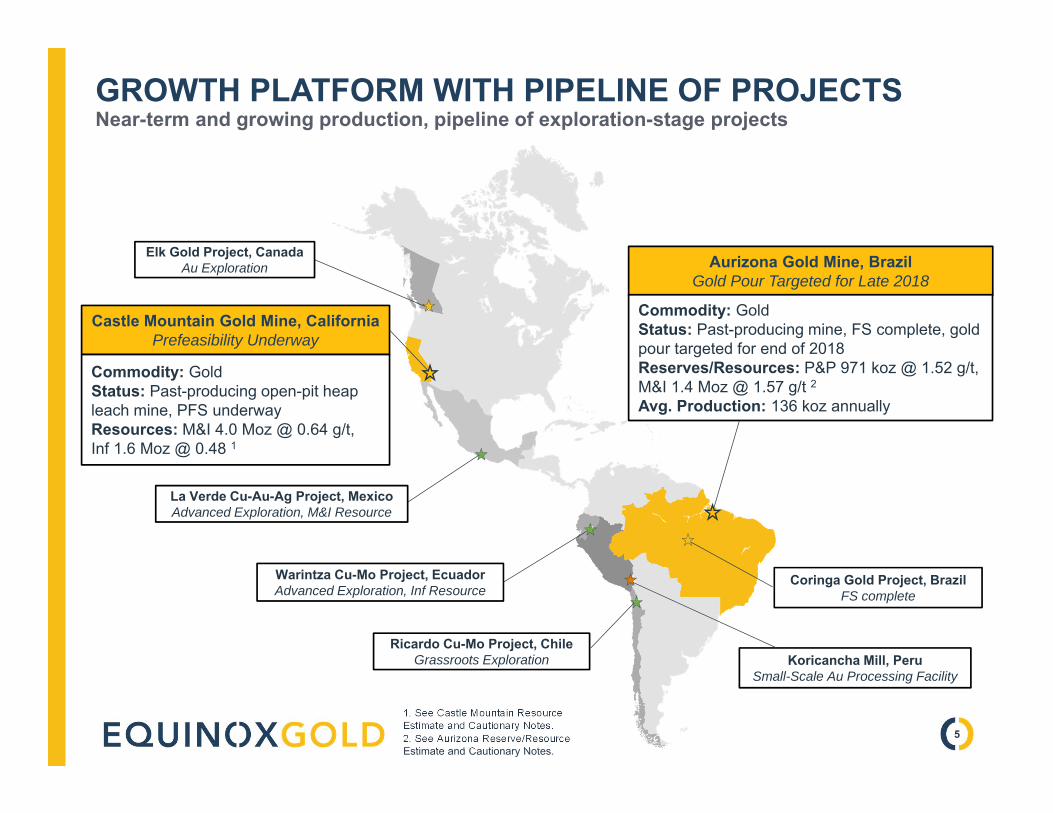
GROWTH PLATFORM WITH PIPELINE OF PROJECTSNear-term and growing production, pipeline of exploration-stage projects
1. See Castle Mountain Resource Estimate and Cautionary Notes. 2. See Aurizona Reserve/Resource Estimate and Cautionary Notes.
Warintza Cu-Mo Project, EcuadorAdvanced Exploration, Inf Resource
Aurizona Gold Mine, BrazilGold Pour Targeted for Late 2018
Commodity: GoldStatus: Past-producing mine, FS complete, gold pour targeted for end of 2018Reserves/Resources: P&P 971 koz @ 1.52 g/t, M&I 1.4 Moz @ 1.57 g/t 2Avg. Production: 136 koz annually
Castle Mountain Gold Mine, CaliforniaPrefeasibility Underway
Commodity: GoldStatus: Past-producing open-pit heap leach mine, PFS underwayResources: M&I 4.0 Moz @ 0.64 g/t, Inf 1.6 Moz @ 0.48 1
Elk Gold Project, CanadaAu Exploration
Ricardo Cu-Mo Project, ChileGrassroots Exploration
La Verde Cu-Au-Ag Project, MexicoAdvanced Exploration, M&I Resource
Koricancha Mill, PeruSmall-Scale Au Processing Facility
Coringa Gold Project, BrazilFS complete
5
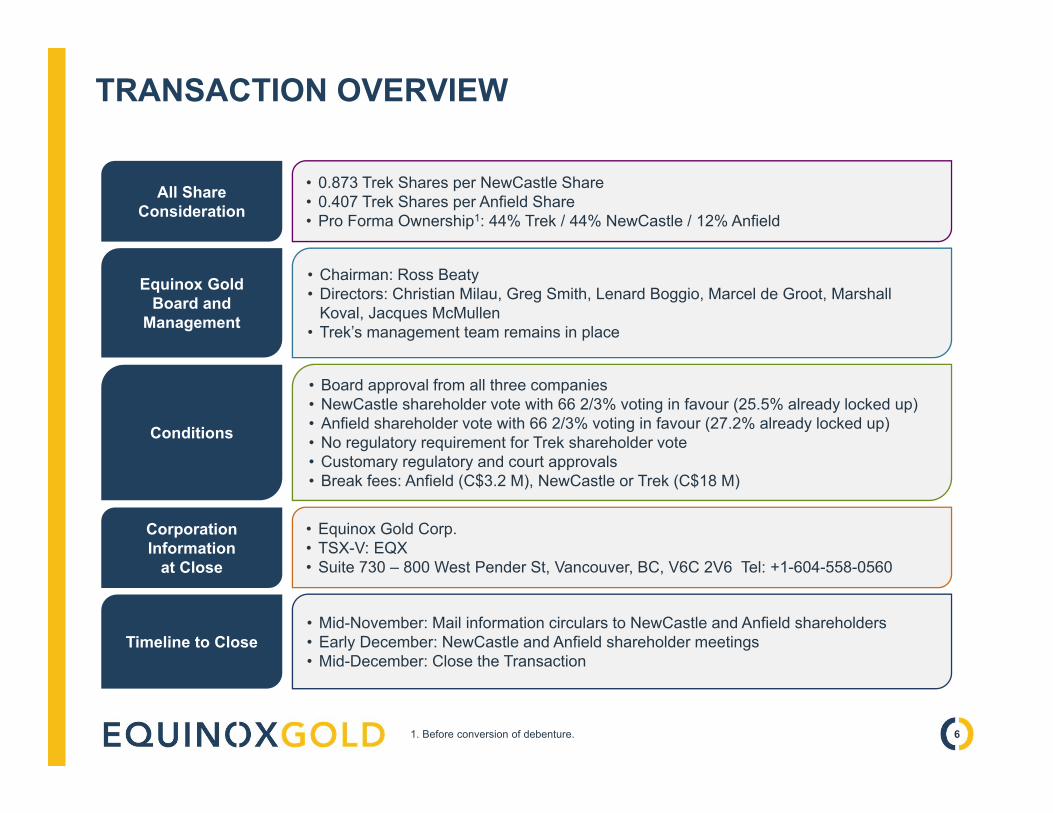
TRANSACTION OVERVIEW
All Share Consideration
Equinox Gold Board and
Management
Conditions
• 0.873 Trek Shares per NewCastle Share• 0.407 Trek Shares per Anfield Share• Pro Forma Ownership1: 44% Trek / 44% NewCastle / 12% Anfield
• Chairman: Ross Beaty• Directors: Christian Milau, Greg Smith, Lenard Boggio, Marcel de Groot, Marshall
Koval, Jacques McMullen• Trek’s management team remains in place
• Board approval from all three companies• NewCastle shareholder vote with 66 2/3% voting in favour (25.5% already locked up)• Anfield shareholder vote with 66 2/3% voting in favour (27.2% already locked up)• No regulatory requirement for Trek shareholder vote• Customary regulatory and court approvals• Break fees: Anfield (C$3.2 M), NewCastle or Trek (C$18 M)
Corporation Information
at Close
• Equinox Gold Corp.• TSX-V: EQX• Suite 730 – 800 West Pender St, Vancouver, BC, V6C 2V6 Tel: +1-604-558-0560
Timeline to Close• Mid-November: Mail information circulars to NewCastle and Anfield shareholders• Early December: NewCastle and Anfield shareholder meetings• Mid-December: Close the Transaction
61. Before conversion of debenture.

TRANSACTION SNAPSHOTIncreased scale creates solid platform for growth
1. Assumes conversion of US$15 M of convertible note at US$0.81 per share. 2. Assuming 423.0 M shares outstanding and using the Transaction share price of C$1.03. 3. Cash at September 30, 2017, before Transaction costs. 4. Assuming exercise of all in-the-money options and warrants. 5. Before conversion of convertible note. 5. Enterprise value calculated as market cap - cash + convertible note.6. Pro-forma ownership is before conversion of convertible note.
Share/Offer Price C$ $1.03 $0.90 $0.42
Shares Outstanding 1(Basic) M 178.0 203.8 119.2 423.0
Shares Outstanding 1(FDIM) M 199.0 211.9 119.2 451.1
Market Capitalization 2(Basic at deal price) C$M $183.3 $183.3 $50.0 $435.6
Market Capitalization (FDIM) C$M $205.0 $190.6 $50.0 $464.6
Cash and Marketable Securities 3 C$M $77.1 $10.0 $10.8 $97.9
Cash from ITM Options & Warrants 4 C$M $15.7 $5.2 - $20.9
Convertible Debt 1 C$M $42.9 - - $23.9
Enterprise Value (FDIM) 5 C$M $155.0 $175.4 $39.2 $369.6
Ownership 6(Basic) % 44% 44% 12% 100%
7
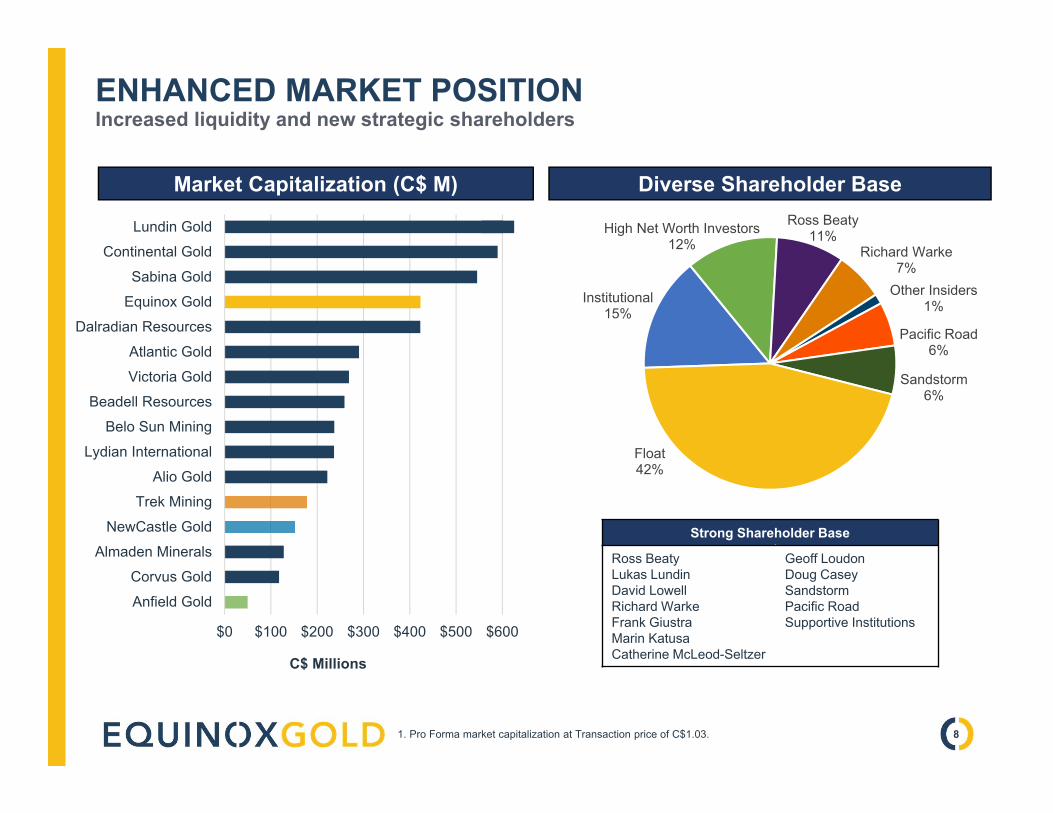
ENHANCED MARKET POSITIONIncreased liquidity and new strategic shareholders
C$ Millions
Market Capitalization (C$ M)
1. Pro Forma market capitalization at Transaction price of C$1.03.
$0 $100 $200 $300 $400 $500 $600
Lundin Gold
Continental Gold
Sabina Gold
Equinox Gold
Dalradian Resources
Atlantic Gold
Victoria Gold
Beadell Resources
Belo Sun Mining
Lydian International
Alio Gold
Trek Mining
NewCastle Gold
Almaden Minerals
Corvus Gold
Anfield Gold
Diverse Shareholder Base
Institutional15%
High Net Worth Investors12%
Ross Beaty11%
Richard Warke7%
Other Insiders1%
Pacific Road6%
Sandstorm6%
Float42%
8
Strong Shareholder Base
Ross BeatyLukas LundinDavid LowellRichard WarkeFrank GiustraMarin KatusaCatherine McLeod-Seltzer
Geoff LoudonDoug CaseySandstormPacific RoadSupportive Institutions
$0
$1,000
$2,000
$3,000
$4,000
Mar
ket C
ap (C
$ M
illion
s)
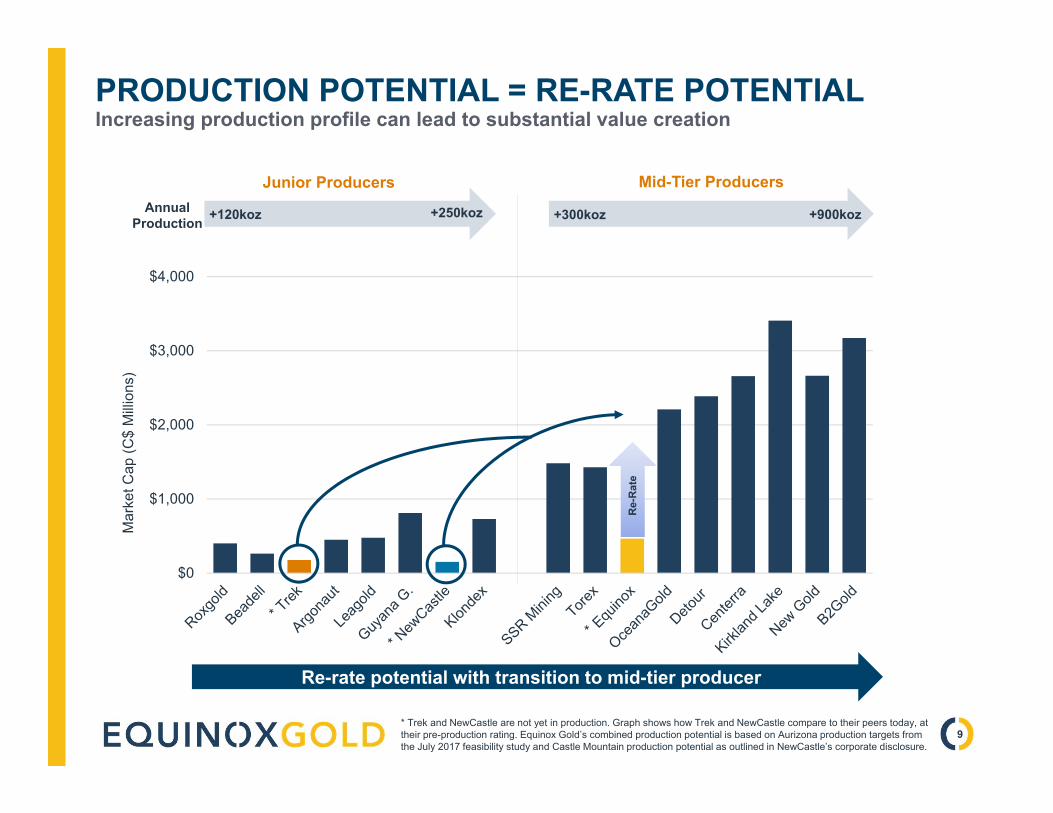
PRODUCTION POTENTIAL = RE-RATE POTENTIALIncreasing production profile can lead to substantial value creation
Re-
Rat
e
+120koz +250koz +300koz +900kozAnnual Production
Junior Producers Mid-Tier Producers
Re-rate potential with transition to mid-tier producer
* Trek and NewCastle are not yet in production. Graph shows how Trek and NewCastle compare to their peers today, at their pre-production rating. Equinox Gold’s combined production potential is based on Aurizona production targets from the July 2017 feasibility study and Castle Mountain production potential as outlined in NewCastle’s corporate disclosure.
9
*

0.00x
0.20x
0.40x
0.60x
0.80x
1.00x
EQUINOX GOLD RE-RATING POTENTIALEquinox Gold undervalued compared to peer group
1. P/NAV calculated using analyst consensus NAV and October 23, 2017 share prices.
Peer average: 0.56x P/NAV
10
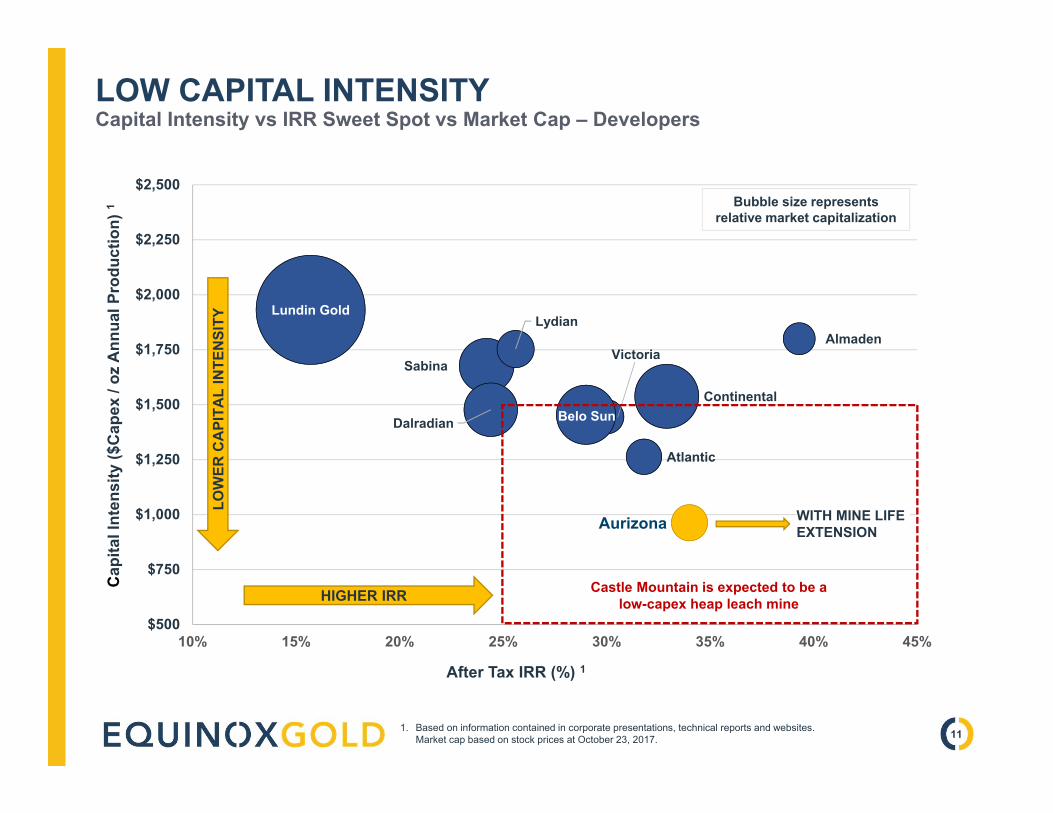
LOW CAPITAL INTENSITYCapital Intensity vs IRR Sweet Spot vs Market Cap – Developers
1. Based on information contained in corporate presentations, technical reports and websites. Market cap based on stock prices at October 23, 2017. 11
Lundin Gold
Sabina
Dalradian
Victoria
Lydian
Belo Sun
Atlantic
Continental
Almaden
$500
$750
$1,000
$1,250
$1,500
$1,750
$2,000
$2,250
$2,500
10% 15% 20% 25% 30% 35% 40% 45%
LOW
ER C
API
TAL
INTE
NSI
TY
HIGHER IRR
After Tax IRR (%) 1
Cap
ital I
nten
sity
($C
apex
/ oz
Ann
ual P
rodu
ctio
n) 1 Bubble size represents
relative market capitalization
WITH MINE LIFE EXTENSIONAurizona
Castle Mountain is expected to be a low-capex heap leach mine

ADVANCING THE AURIZONA PROJECT
FEASIBILITYReleased July 31, 2017
CONSTRUCTIONEarly works underway
GOLD POURTargeted for YE-2018
12
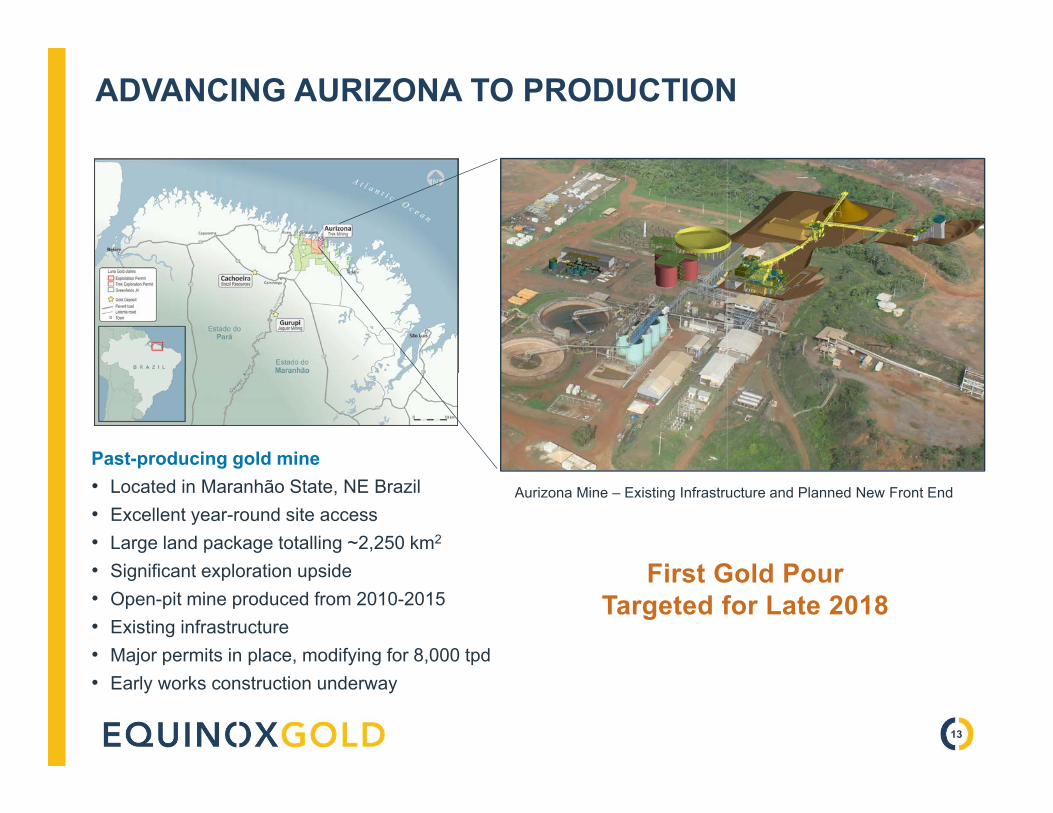
ADVANCING AURIZONA TO PRODUCTION
Past-producing gold mine• Located in Maranhão State, NE Brazil• Excellent year-round site access• Large land package totalling ~2,250 km2
• Significant exploration upside• Open-pit mine produced from 2010-2015• Existing infrastructure• Major permits in place, modifying for 8,000 tpd• Early works construction underway
Aurizona Mine – Existing Infrastructure and Planned New Front End
13
First Gold Pour Targeted for Late 2018

2017 FEASIBILITY HIGHLIGHTS Gold Price (Base case) $1,250/oz
M&I Resource 1 1.4 Moz/ 28.3 Mt @ 1.57 g/t Au
P&P Reserve 971 koz/ 19.8 Mt @ 1.52 g/t Au
Initial Mine Life 6.5 years
Annual Production (LOM) Avg. ~136,000 oz gold
Strip Ratio / Recovery 5.7:1 / 91%
Cash Cost (LOM) 2 $691/oz
AISC (LOM) $754/oz
Initial Capital $131M ($148/oz)
Sustaining Capital 4 $51M ($54/oz)
NPV5% (after tax) $197M ($254M at $1,350/oz gold)
IRR (after tax) 34% (42% at $1,350/oz gold)
ROBUST ECONOMICS: LEVERAGE EXISTING INFRASTRUCTURELow initial capex, rapid payback
1. Mineral resources are inclusive of mineral reserves. 2. For IFRS accounting purposes, some stripping costs may be capitalized and included in sustaining capital instead of in operating costs. 3. Net of initial capital costs. 4. Including closure costs, net of salvage value.
$197M
34%
136 koz
NPV5% AFTER-TAX
IRR AFTER-TAX
GOLD PER YEAR
40%MARGIN
14
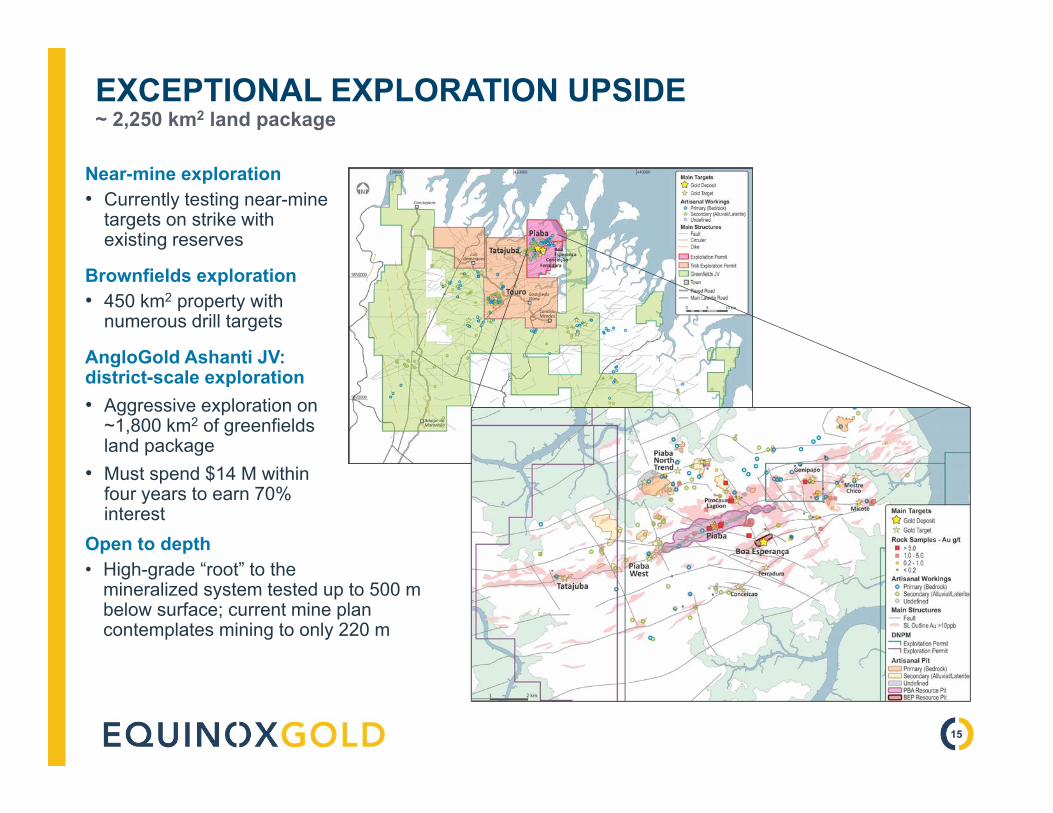
EXCEPTIONAL EXPLORATION UPSIDE~ 2,250 km2 land package
Near-mine exploration• Currently testing near-mine
targets on strike with existing reserves
Brownfields exploration• 450 km2 property with
numerous drill targets
AngloGold Ashanti JV: district-scale exploration• Aggressive exploration on
~1,800 km2 of greenfieldsland package
• Must spend $14 M within four years to earn 70% interest
Open to depth• High-grade “root” to the
mineralized system tested up to 500 m below surface; current mine plan contemplates mining to only 220 m
15

0
50
100
150
200
250
300
350
400
450
Ann
ual P
rodu
ctio
n Pr
ofile
(koz
) 1AURIZONA IS A RARE ASSETScarcity of low capex near-term gold production opportunities
2020 20192018Now in Production
Aurizona is one of just a few projects expected to commence production in the next three years 1
1. Based on information contained in corporate presentations, technical reports and websites.
$135 M $175 M $137 M $697 M $370 M $131 M $289 M $669 M $260 M $389 M $298 MInitial Capex 1
Planned Castle Mountain Production
16
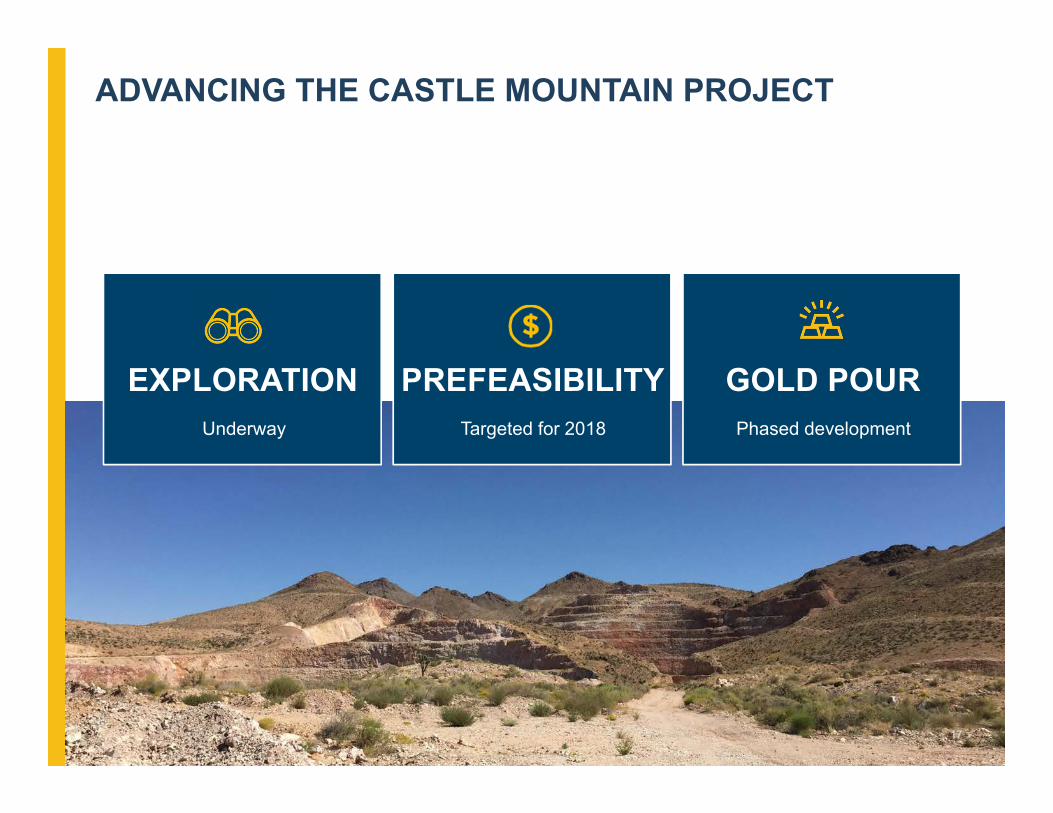
ADVANCING THE CASTLE MOUNTAIN PROJECT
PREFEASIBILITYTargeted for 2018
EXPLORATIONUnderway
GOLD POURPhased development
17

ADVANCED-STAGE GOLD PROJECTPast-producing gold mine with re-start strategy
Brownfields project with key permits in place• Past producing open-pit heap leach mine
in California with over 1 Moz produced • 14,500 acres of mining claims• Federal mining permit to process up to
22,000 tpd• Local operational permitting underway
Significant progress in 2017• 44,500 m of definition drilling including the
JSLA starter pit• New discovery in the JSLA pit footwall• Resource update: 70% increase to M&I• Run-of-mine (“ROM”) evaluation for starter pit• Successful water drilling in the permit area
CASTLE MOUNTAIN
18

SIGNIFICANT RESERVE & PRODUCTION POTENTIALPre-feasibility study targeted for 2018: convert resources to reserves
Substantial gold resource• 4.0 Moz M&I gold resource with significant
exploration upside
Proven metallurgy• Simple, low-cost heap leach based on prior
operations and current test work• Current test work indicates viability of ROM
heap leaching
Pre-feasibility study underway• Targeted for 2018: convert resources to
reserves• Plan for two-phase production ramp up, with
potential expansion to ~300,000 oz/year 1- Phase 1: Initial ROM operation - Phase 2: Full restart including ROM heap
leach, crushed ore heap leach and milling of higher grade ore
1. Based on strategy outlined in NewCastle corporate presentation. 19
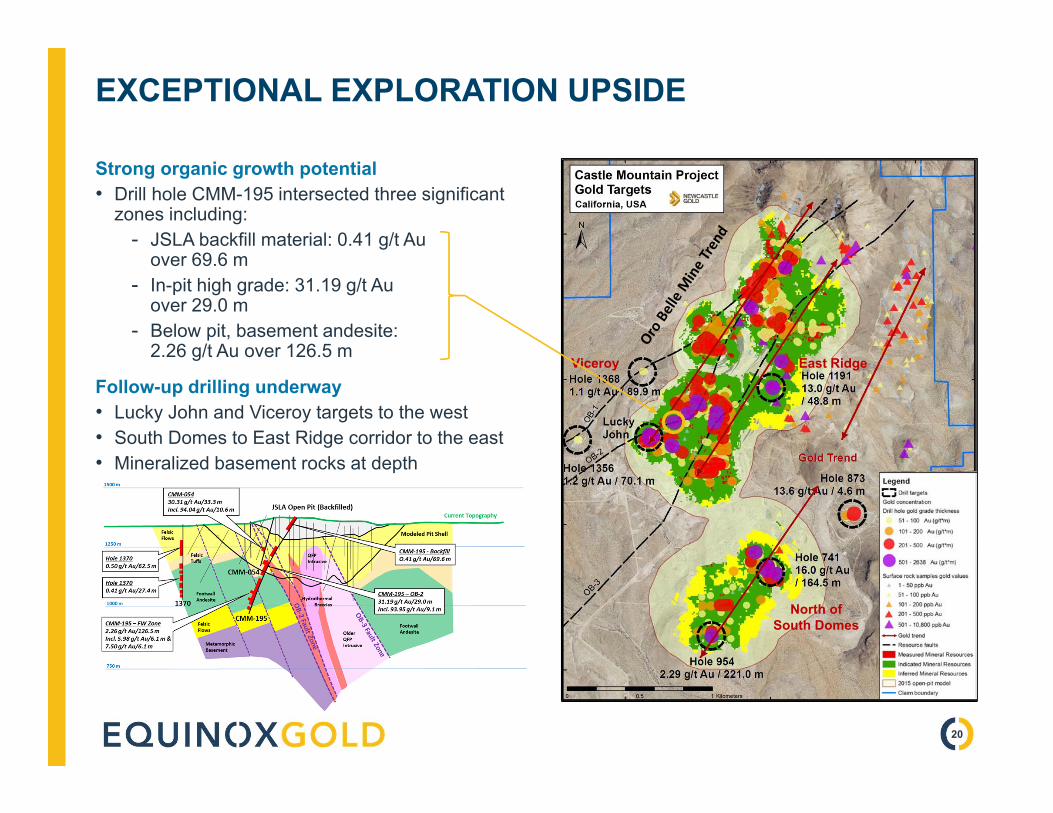
EXCEPTIONAL EXPLORATION UPSIDE
Strong organic growth potential• Drill hole CMM-195 intersected three significant
zones including:- JSLA backfill material: 0.41 g/t Au
over 69.6 m- In-pit high grade: 31.19 g/t Au
over 29.0 m- Below pit, basement andesite:
2.26 g/t Au over 126.5 m
Follow-up drilling underway• Lucky John and Viceroy targets to the west• South Domes to East Ridge corridor to the east• Mineralized basement rocks at depth
Viceroy
North of South Domes
East Ridge
20

DEVELOPMENT PIPELINE OF GOLD AND COPPER ASSETSGeographical diversity, expansion potential, exploration upside
COPPER PORPHYRY
HIGH-GRADE GOLD
PROCESSING FACILITY
21
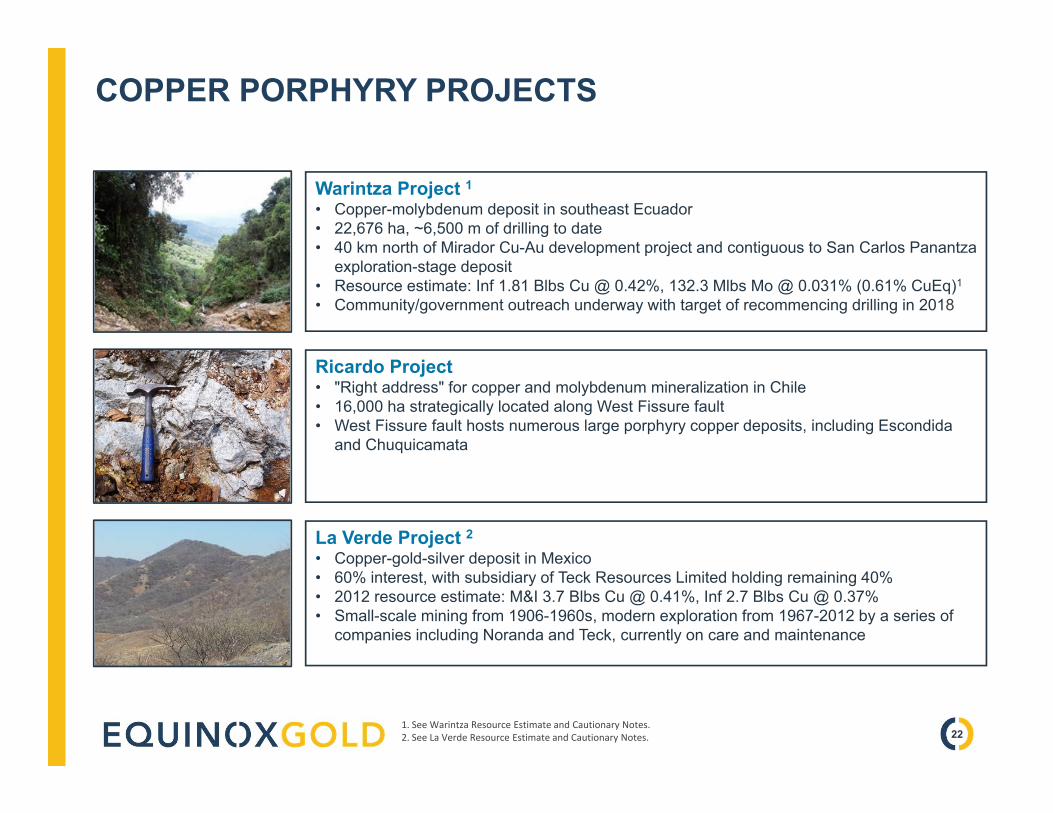
COPPER PORPHYRY PROJECTS
1. See Warintza Resource Estimate and Cautionary Notes. 2. See La Verde Resource Estimate and Cautionary Notes.
Warintza Project 1• Copper-molybdenum deposit in southeast Ecuador• 22,676 ha, ~6,500 m of drilling to date• 40 km north of Mirador Cu-Au development project and contiguous to San Carlos Panantza
exploration-stage deposit• Resource estimate: Inf 1.81 Blbs Cu @ 0.42%, 132.3 Mlbs Mo @ 0.031% (0.61% CuEq)1
• Community/government outreach underway with target of recommencing drilling in 2018
Ricardo Project• "Right address" for copper and molybdenum mineralization in Chile• 16,000 ha strategically located along West Fissure fault• West Fissure fault hosts numerous large porphyry copper deposits, including Escondida
and Chuquicamata
La Verde Project 2• Copper-gold-silver deposit in Mexico• 60% interest, with subsidiary of Teck Resources Limited holding remaining 40%• 2012 resource estimate: M&I 3.7 Blbs Cu @ 0.41%, Inf 2.7 Blbs Cu @ 0.37%• Small-scale mining from 1906-1960s, modern exploration from 1967-2012 by a series of
companies including Noranda and Teck, currently on care and maintenance
22
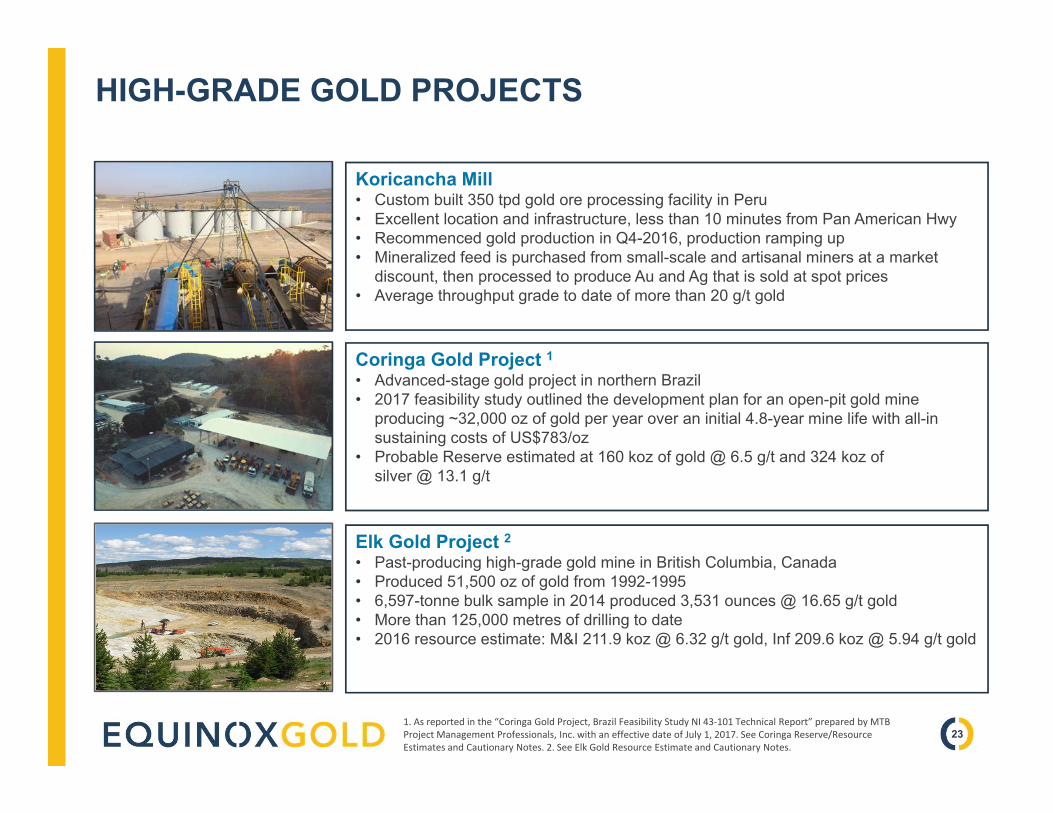
HIGH-GRADE GOLD PROJECTS
231. As reported in the “Coringa Gold Project, Brazil Feasibility Study NI 43‐101 Technical Report” prepared by MTB Project Management Professionals, Inc. with an effective date of July 1, 2017. See Coringa Reserve/Resource Estimates and Cautionary Notes. 2. See Elk Gold Resource Estimate and Cautionary Notes.
Coringa Gold Project 1• Advanced-stage gold project in northern Brazil• 2017 feasibility study outlined the development plan for an open-pit gold mine
producing ~32,000 oz of gold per year over an initial 4.8-year mine life with all-in sustaining costs of US$783/oz
• Probable Reserve estimated at 160 koz of gold @ 6.5 g/t and 324 koz of silver @ 13.1 g/t
Elk Gold Project 2• Past-producing high-grade gold mine in British Columbia, Canada• Produced 51,500 oz of gold from 1992-1995• 6,597-tonne bulk sample in 2014 produced 3,531 ounces @ 16.65 g/t gold• More than 125,000 metres of drilling to date• 2016 resource estimate: M&I 211.9 koz @ 6.32 g/t gold, Inf 209.6 koz @ 5.94 g/t gold
Koricancha Mill• Custom built 350 tpd gold ore processing facility in Peru• Excellent location and infrastructure, less than 10 minutes from Pan American Hwy• Recommenced gold production in Q4-2016, production ramping up• Mineralized feed is purchased from small-scale and artisanal miners at a market
discount, then processed to produce Au and Ag that is sold at spot prices• Average throughput grade to date of more than 20 g/t gold

CREATING EQUINOX GOLDOutstanding upside potential
Properties• Near-term production with significant growth potential from two flagship assets
- Aurizona Gold Mine, Brazil: targeting first gold pour by late 2018- Castle Mountain Gold Mine, California: prefeasibility study underway
• Multi-million-ounce gold resource with near-term reserve and resource growth potential• Impressive long-term growth platform
People• Heavily invested Board and management team with Ross Beaty as Chairman• Strategic shareholders
Plan• Construct Aurizona• Advance Castle Mountain toward construction• Strong treasury and US$85 M credit facility to fully fund Aurizona construction • Flexible US$200 M development and acquisition facility• Potential additional proceeds from monetization of non-core assets
Information CircularsMid-November
Shareholder MeetingsEarly December
Complete TransactionExpected ~December 21
TSX-VEQX
24

Appendix25

EQUINOX GOLD CORPORATE SUMMARY
1. Assumes early conversion of US$15 M of Sandstorm convertible note.2. Trek warrants are listed on the TSX.V under the symbol “TREK.WT”.3. Warrant and option exercise prices are weighted averages. Warrant numbers are shown as the number of common shares that would be issued
upon exercise of warrants. Unlisted warrants are primarily held by Pacific Road and Sandstorm Gold.4. Restricted share units are shares committed to management, and issued subject to vesting terms, as part of equity-based compensation.5. Assumes early conversion of US$15 M of Sandstorm convertible note.6. Basic assuming 423.0 M shares outstanding and using the Transaction share price of C$1.03.7. Includes cash and marketable securities as at September 30, 2017, excluding Transaction costs.8. Convertible note is held by Sandstorm Gold and is convertible to shares at the 20-day VWAP at Trek’s option. Balance is shown in C$ assuming
early conversion of US$15 M at US$0.81 per share.9. Enterprise value calculated as market cap - cash + convertible note.10. Cash to Equinox Gold should all warrants and options be exercised.
Shares (Basic) 1 423.0 million Market Cap 6 C$435.6 million
Listed Warrants @ C$3.00 2 80.5 million Cash – Basic 7 C$97.9 million
Unlisted Warrants @ avg C$1.40 3 35.8 million Cash – FDIM 7 C$118.8 million
Options @ avg C$1.49 3 14.2 million Convertible Note 8 C$23.9 million
Restricted Share Units 4 2.9 million Enterprise Value 9 C$369.6 million
Fully Diluted Shares Outstanding 5 556.4 million Cash from FD Opts & Wts 10 C$312.8 million
Existing Analyst Coverage
Beacon Securities, BMO Capital Markets, Canaccord Genuity, Cormark Securities, GMP Securities, Haywood Securities, M Partners, Macquarie Financial, National Bank Financial, Paradigm Capital, PI Financial, Raymond James, TD Securities
26

AURIZONA: RESERVE & RESOURCE ESTIMATE
This Mineral Reserve estimate has an effective date of May 29, 2017 and is based on the Mineral Resource estimate dated January 5, 2017 and prepared by SRK. TheMineral Reserve calculation was completed under the supervision of Gordon Zurowski, P.Eng of AGP Mining Consultants Inc., who is a Qualified Person as defined under NI43-101. Mineral Reserves are stated within the final design pit based on a $1,056 per ounce gold price pit shell with a $1,200 per ounce gold price for revenue. The cutoffgrade was 0.60 g/t Au for the Piaba pit area and 0.41 g/t Au for the Boa Esperança area. The mining cost averaged $2.32/tonne mined, processing averages $11.30/tonnemilled and G&A was $2.84/tonne milled. The process recovery averaged 90.3%. The exchange rate assumption applied was R$3.30 equal to US$1.00. This MineralResource estimate has an effective date of January 5, 2017 and was prepared by Mr. Marek Nowak, M.A.Sc., P.Eng. of SRK, who is a qualified person under NI 43-101.Open pit mineral resources are reported at 0.6 g/t gold cut-off and underground resources are reported at 2.0 g/t gold cut-off. Tonnes are rounded to the nearest 10,000;ounces are rounded to the nearest 1,000. Small tonnage and grade differences may be found due to rounding. Mineral Resources are inclusive of Mineral Reserves.
AURIZONA MINERAL RESOURCES
Category Measured Indicated Total M&I Inferred
DepositTonnes
ktGrade g/t Au
Contained Gold koz
Tonneskt
Grade g/t Au
Contained Gold koz
Tonneskt
Grade g/t Au
Contained Gold koz
Tonneskt
Grade g/t Au
Contained Gold koz
Open Pit
Piaba 8,860 1.46 415 19,030 1.64 1,002 27,890 1.58 1,417 740 1.56 37
Boa Esperança 370 1.14 14 370 1.14 14 140 1.88 8
Total 8,860 1.46 415 19,400 1.63 1,016 28,260 1.57 1,431 880 1.61 45
Underground
Piaba 5,090 2.99 490
AURIZONA MINERAL RESERVES
Category Proven Probable Total P&P
Ore TypeTonnes
ktGrade g/t Au
Contained Gold koz
Tonneskt
Grade g/t Au
Contained Gold koz
Tonneskt
Grade g/t Au
Contained Gold koz
Laterite 122 1.94 8 539 0.98 17 661 1.16 25
Saprolite 1,684 1.52 82 1,310 1.38 58 2,994 1.46 140
Transition 2,553 1.34 110 1,363 1.18 52 3,916 1.29 162
Fresh Rock 4,079 1.46 192 8,186 1.72 452 12,265 1.63 644
Total 8,438 1.44 392 11,398 1.58 579 19,836 1.52 971
27
CASTLE MOUNTAIN: RESOURCE ESTIMATE
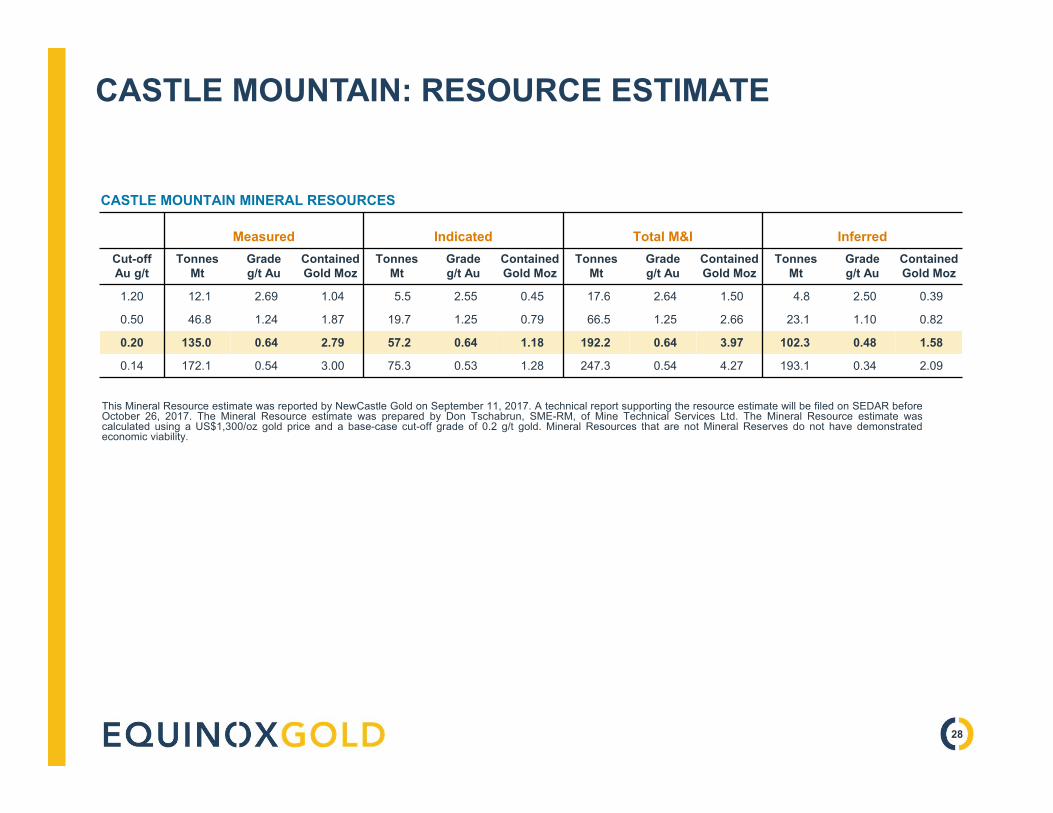
This Mineral Resource estimate was reported by NewCastle Gold on September 11, 2017. A technical report supporting the resource estimate will be filed on SEDAR beforeOctober 26, 2017. The Mineral Resource estimate was prepared by Don Tschabrun, SME-RM, of Mine Technical Services Ltd. The Mineral Resource estimate wascalculated using a US$1,300/oz gold price and a base-case cut-off grade of 0.2 g/t gold. Mineral Resources that are not Mineral Reserves do not have demonstratedeconomic viability.
CASTLE MOUNTAIN MINERAL RESOURCES
Measured Indicated Total M&I InferredCut-off Au g/t
TonnesMt
Grade g/t Au
Contained Gold Moz
TonnesMt
Grade g/t Au
Contained Gold Moz
TonnesMt
Grade g/t Au
Contained Gold Moz
TonnesMt
Grade g/t Au
Contained Gold Moz
1.20 12.1 2.69 1.04 5.5 2.55 0.45 17.6 2.64 1.50 4.8 2.50 0.39
0.50 46.8 1.24 1.87 19.7 1.25 0.79 66.5 1.25 2.66 23.1 1.10 0.82
0.20 135.0 0.64 2.79 57.2 0.64 1.18 192.2 0.64 3.97 102.3 0.48 1.58
0.14 172.1 0.54 3.00 75.3 0.53 1.28 247.3 0.54 4.27 193.1 0.34 2.09
28
CORINGA & ELK GOLD: RESERVE & RESOURCE ESTIMATES
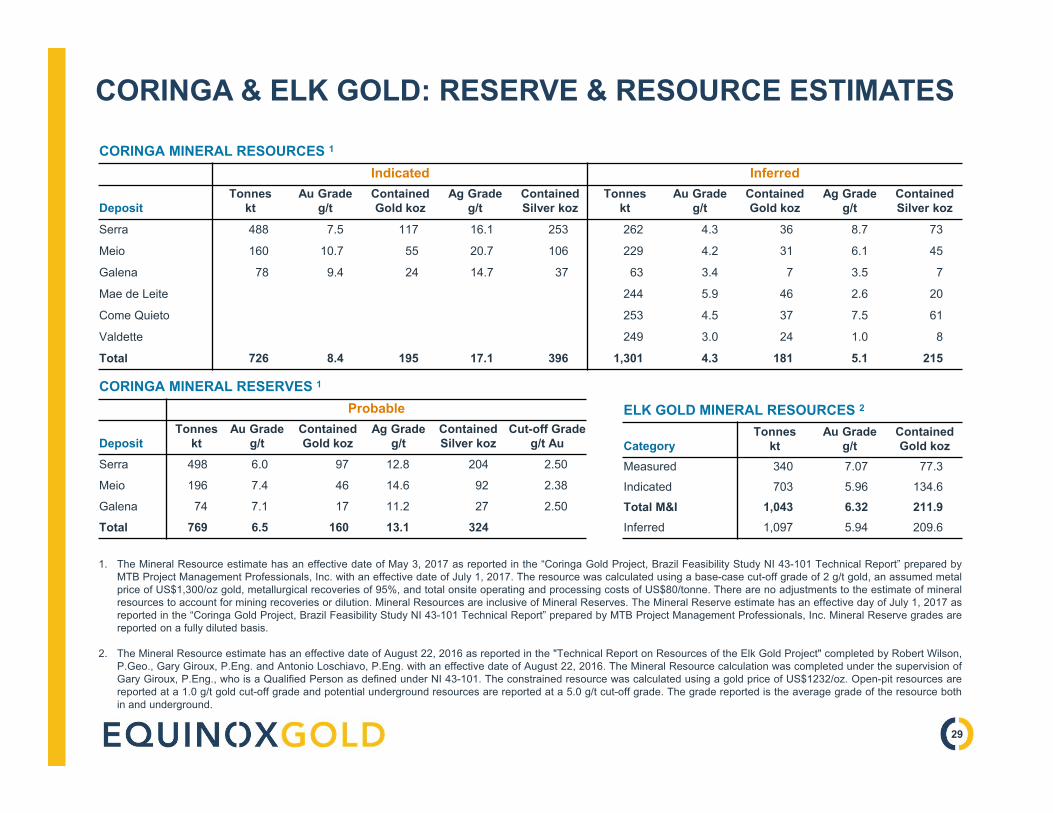
CORINGA MINERAL RESOURCES 1
Indicated Inferred
DepositTonnes
ktAu Grade
g/tContained Gold koz
Ag Gradeg/t
Contained Silver koz
Tonneskt
Au Gradeg/t
Contained Gold koz
Ag Gradeg/t
Contained Silver koz
Serra 488 7.5 117 16.1 253 262 4.3 36 8.7 73
Meio 160 10.7 55 20.7 106 229 4.2 31 6.1 45
Galena 78 9.4 24 14.7 37 63 3.4 7 3.5 7
Mae de Leite 244 5.9 46 2.6 20
Come Quieto 253 4.5 37 7.5 61
Valdette 249 3.0 24 1.0 8
Total 726 8.4 195 17.1 396 1,301 4.3 181 5.1 215
CORINGA MINERAL RESERVES 1
Probable
DepositTonnes
ktAu Grade
g/tContained Gold koz
Ag Gradeg/t
Contained Silver koz
Cut-off Gradeg/t Au
Serra 498 6.0 97 12.8 204 2.50
Meio 196 7.4 46 14.6 92 2.38
Galena 74 7.1 17 11.2 27 2.50
Total 769 6.5 160 13.1 324
ELK GOLD MINERAL RESOURCES 2
CategoryTonnes
ktAu Grade
g/tContained Gold koz
Measured 340 7.07 77.3Indicated 703 5.96 134.6Total M&I 1,043 6.32 211.9Inferred 1,097 5.94 209.6
1. The Mineral Resource estimate has an effective date of May 3, 2017 as reported in the “Coringa Gold Project, Brazil Feasibility Study NI 43-101 Technical Report” prepared byMTB Project Management Professionals, Inc. with an effective date of July 1, 2017. The resource was calculated using a base-case cut-off grade of 2 g/t gold, an assumed metalprice of US$1,300/oz gold, metallurgical recoveries of 95%, and total onsite operating and processing costs of US$80/tonne. There are no adjustments to the estimate of mineralresources to account for mining recoveries or dilution. Mineral Resources are inclusive of Mineral Reserves. The Mineral Reserve estimate has an effective day of July 1, 2017 asreported in the “Coringa Gold Project, Brazil Feasibility Study NI 43-101 Technical Report” prepared by MTB Project Management Professionals, Inc. Mineral Reserve grades arereported on a fully diluted basis.
2. The Mineral Resource estimate has an effective date of August 22, 2016 as reported in the "Technical Report on Resources of the Elk Gold Project" completed by Robert Wilson,P.Geo., Gary Giroux, P.Eng. and Antonio Loschiavo, P.Eng. with an effective date of August 22, 2016. The Mineral Resource calculation was completed under the supervision ofGary Giroux, P.Eng., who is a Qualified Person as defined under NI 43-101. The constrained resource was calculated using a gold price of US$1232/oz. Open-pit resources arereported at a 1.0 g/t gold cut-off grade and potential underground resources are reported at a 5.0 g/t cut-off grade. The grade reported is the average grade of the resource bothin and underground.
29
WARINTZA & LA VERDE: RESOURCE ESTIMATES
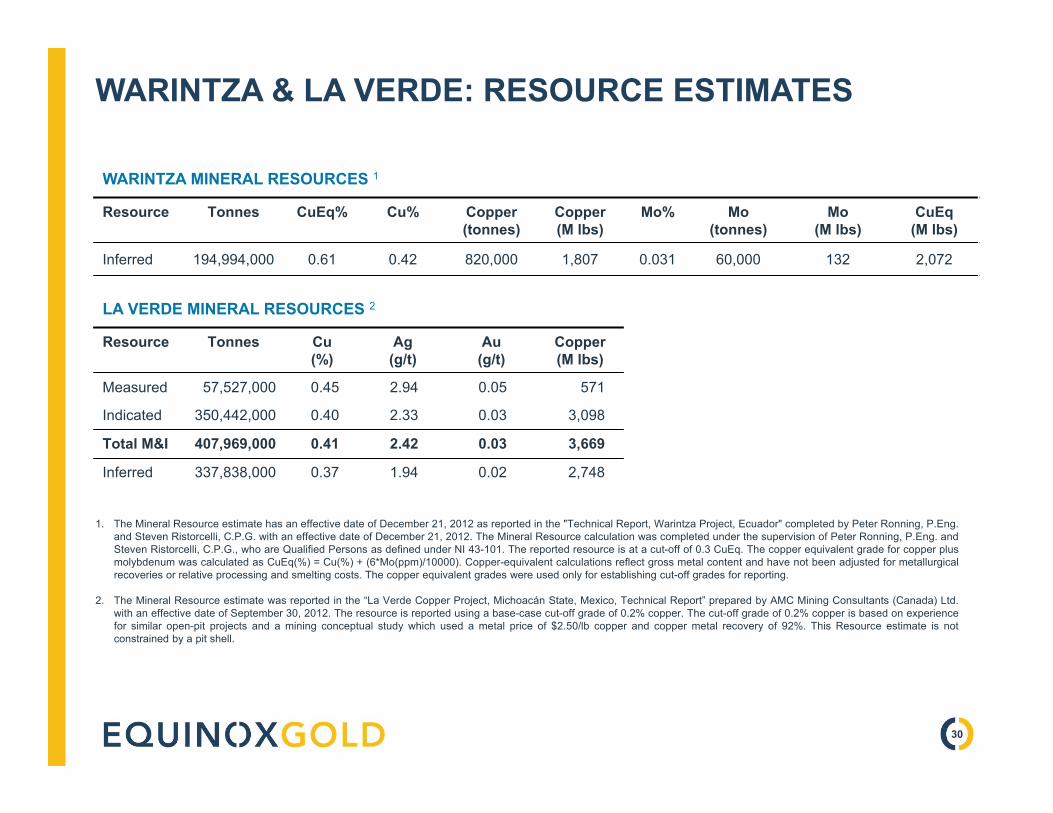
WARINTZA MINERAL RESOURCES 1
Resource Tonnes CuEq% Cu% Copper (tonnes)
Copper (M lbs)
Mo% Mo (tonnes)
Mo (M lbs)
CuEq (M lbs)
Inferred 194,994,000 0.61 0.42 820,000 1,807 0.031 60,000 132 2,072
1. The Mineral Resource estimate has an effective date of December 21, 2012 as reported in the "Technical Report, Warintza Project, Ecuador" completed by Peter Ronning, P.Eng.and Steven Ristorcelli, C.P.G. with an effective date of December 21, 2012. The Mineral Resource calculation was completed under the supervision of Peter Ronning, P.Eng. andSteven Ristorcelli, C.P.G., who are Qualified Persons as defined under NI 43-101. The reported resource is at a cut-off of 0.3 CuEq. The copper equivalent grade for copper plusmolybdenum was calculated as CuEq(%) = Cu(%) + (6*Mo(ppm)/10000). Copper-equivalent calculations reflect gross metal content and have not been adjusted for metallurgicalrecoveries or relative processing and smelting costs. The copper equivalent grades were used only for establishing cut-off grades for reporting.
2. The Mineral Resource estimate was reported in the “La Verde Copper Project, Michoacán State, Mexico, Technical Report” prepared by AMC Mining Consultants (Canada) Ltd.with an effective date of September 30, 2012. The resource is reported using a base-case cut-off grade of 0.2% copper. The cut-off grade of 0.2% copper is based on experiencefor similar open-pit projects and a mining conceptual study which used a metal price of $2.50/lb copper and copper metal recovery of 92%. This Resource estimate is notconstrained by a pit shell.
LA VERDE MINERAL RESOURCES 2
Resource Tonnes Cu(%)
Ag(g/t)
Au(g/t)
Copper (M lbs)
Measured 57,527,000 0.45 2.94 0.05 571
Indicated 350,442,000 0.40 2.33 0.03 3,098
Total M&I 407,969,000 0.41 2.42 0.03 3,669
Inferred 337,838,000 0.37 1.94 0.02 2,748
30
Top Related