


Languages
Pages
Legal


covid19.healthdata.org 1 Institute for Health Metrics and Evaluation
COVID-19 Results Briefing
The United States of America
September 22, 2021 This document contains summary information on the latest projections from the IHME model on COVID-19 in the United States of America. The model was run on September 21, 2021, with data through September 20, 2021.
The Delta surge overall appears to have peaked; infections likely peaked in late August and reported cases and hospitalizations in early September. Given prior lags between cases, hospitalizations, and deaths, we expect deaths should peak in the coming week. The overall pattern masks that many Southern states are farther past their peaks of Delta. Ongoing surges are concentrated in the Midwest and some Atlantic states. Vaccination rates are continuing to increase and may reach levels limited by vaccine hesitancy by early November. Likewise, the fraction of the population with prior natural infection, currently 32%, will also increase in the coming months. These two forces increase effective immunity against the Delta variant, which could potentially reach 65% by the end of the year. Despite the rising levels of immunity, we expect seasonality will increase transmission enough to stop the declines in transmission by the end of October, leading to modest increases in November and December. The late fall and winter increases in reported cases and deaths will be much smaller in proportionate terms than last winter, even if the level of infections may be 75% of last winter’s level. Our forecasts of even modest increases in hospitalization rates after an early fall decline combined with likely flu transmission this winter suggests stress on hospitals may be substantial and more than expected. Our forecasts may be optimistic for two critical reasons. First, we have not yet incorporated into our models waning immunity against infection, for which there is strong evidence. Nor have we incorporated waning immunity of vaccination and natural infection against hospitalization and death, for which the evidence is more limited. Second, we do not take into account the potential risk of a new variant with substantial immune escape emerging somewhere in the world with ongoing high levels of transmission that will eventually reach the US. As boosters are delivered in the US to the population at risk or over 65, we will incorporate this into our forecasts. As our mask use scenario demonstrates, a critical factor in the magnitude of hospitalization and death in the US will be the extent to which the current mask use level of 41% is sustained or even increased. Individual behavioral responses in aggregate will substantially affect the trajectory of the pandemic in the coming months.
Current situation • Estimated daily infections in the last week decreased to 285,300 per day on average
compared to 300,800 the week before (Figure 1).
• Daily hospital census in the last week (through September 20) decreased to 96,800 per day on average compared to 101,600 the week before.
• Daily reported cases in the last week stayed relatively constant at 146,200 per day on average compared to 144,100 the week before (Figure 2).
covid19.healthdata.org 2 Institute for Health Metrics and Evaluation
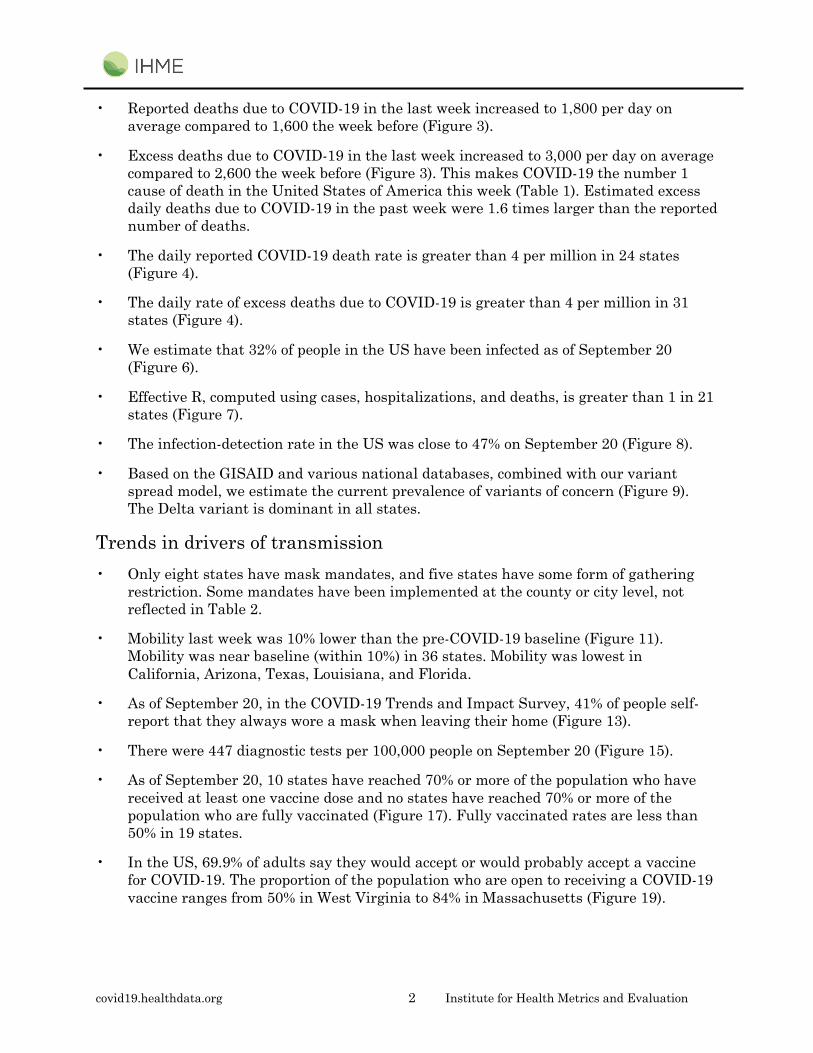
• Reported deaths due to COVID-19 in the last week increased to 1,800 per day on average compared to 1,600 the week before (Figure 3).
• Excess deaths due to COVID-19 in the last week increased to 3,000 per day on average compared to 2,600 the week before (Figure 3). This makes COVID-19 the number 1 cause of death in the United States of America this week (Table 1). Estimated excess daily deaths due to COVID-19 in the past week were 1.6 times larger than the reported number of deaths.
• The daily reported COVID-19 death rate is greater than 4 per million in 24 states (Figure 4).
• The daily rate of excess deaths due to COVID-19 is greater than 4 per million in 31 states (Figure 4).
• We estimate that 32% of people in the US have been infected as of September 20 (Figure 6).
• Effective R, computed using cases, hospitalizations, and deaths, is greater than 1 in 21 states (Figure 7).
• The infection-detection rate in the US was close to 47% on September 20 (Figure 8).
• Based on the GISAID and various national databases, combined with our variant spread model, we estimate the current prevalence of variants of concern (Figure 9). The Delta variant is dominant in all states.
Trends in drivers of transmission • Only eight states have mask mandates, and five states have some form of gathering
restriction. Some mandates have been implemented at the county or city level, not reflected in Table 2.
• Mobility last week was 10% lower than the pre-COVID-19 baseline (Figure 11). Mobility was near baseline (within 10%) in 36 states. Mobility was lowest in California, Arizona, Texas, Louisiana, and Florida.
• As of September 20, in the COVID-19 Trends and Impact Survey, 41% of people self-report that they always wore a mask when leaving their home (Figure 13).
• There were 447 diagnostic tests per 100,000 people on September 20 (Figure 15).
• As of September 20, 10 states have reached 70% or more of the population who have received at least one vaccine dose and no states have reached 70% or more of the population who are fully vaccinated (Figure 17). Fully vaccinated rates are less than 50% in 19 states.
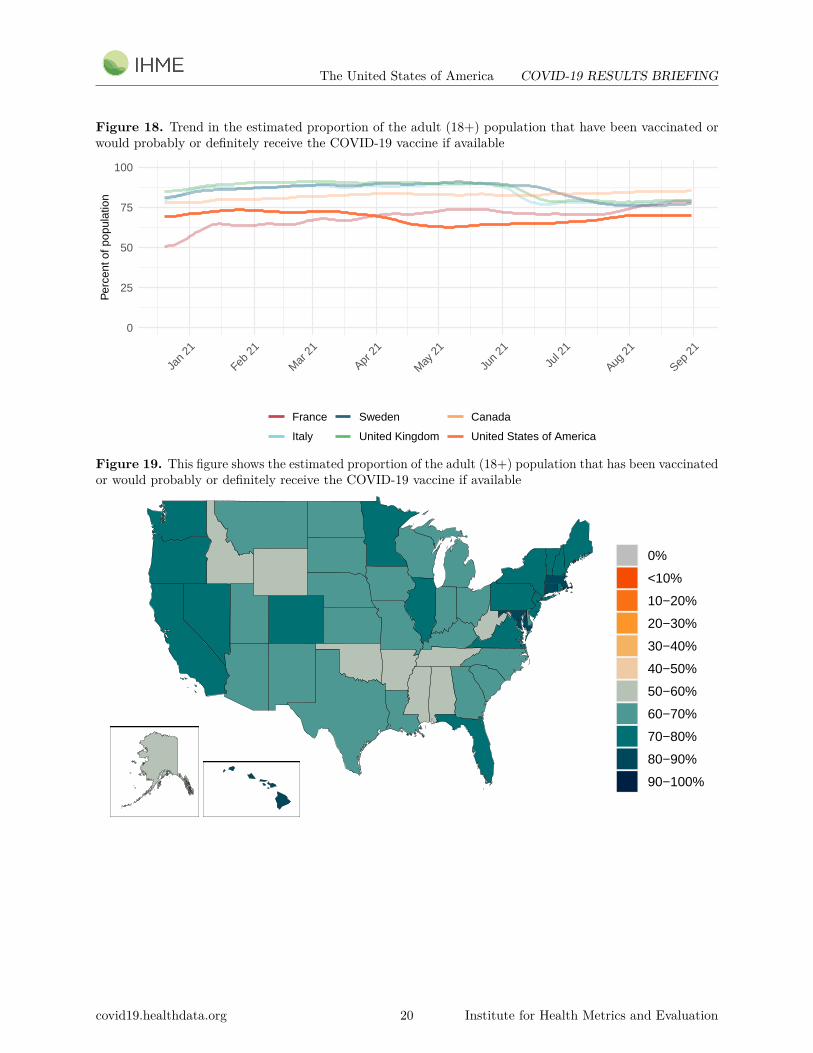
• In the US, 69.9% of adults say they would accept or would probably accept a vaccine for COVID-19. The proportion of the population who are open to receiving a COVID-19 vaccine ranges from 50% in West Virginia to 84% in Massachusetts (Figure 19).

covid19.healthdata.org 3 Institute for Health Metrics and Evaluation
• In our current reference scenario, we expect that 208 million people will be vaccinated with at least one dose by January 1 (Figure 20). We expect that 60% of the population will be fully vaccinated by January 1.
• Based on the estimate of the population that have been infected with COVID-19 and vaccinated to date, combined with assumptions on protection against infection with the Delta variant provided by either natural infection, vaccination, or both, we estimate that 55% of the region is immune to the Delta variant. In our current reference scenario, we expect that by January 1, 65% of people will be immune to the Delta variant (Figure 21). These two calculations do not take into account waning of natural or vaccine-derived immunity.
Projections • In our reference scenario, which represents what we think is most likely to happen,
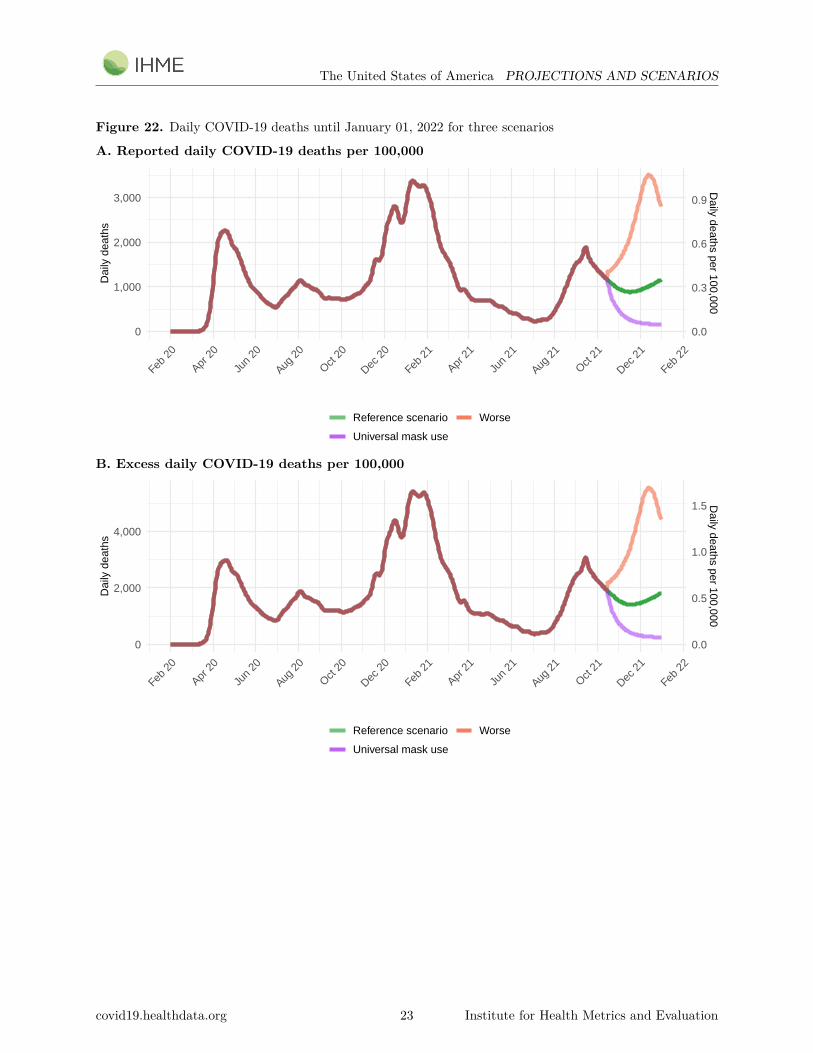
our model projects 784,000 cumulative reported deaths due to COVID-19 on January 1. This represents 111,000 additional deaths from September 20 to January 1. Daily reported deaths will decline to below 900 by mid-November and then will increase to over 1,000 by early December (Figure 22).
• Under our reference scenario, our model projects 1,223,000 cumulative excess deaths due to COVID-19 on January 1. This represents 179,000 additional deaths from September 20 to January 1 (Figure 22).
• If universal mask coverage (95%) were attained in the next week, our model projects 52,000 fewer cumulative reported deaths compared to the reference scenario on January 1.
• Under our worse scenario, our model projects 898,000 cumulative reported deaths on January 1, an additional 114,000 deaths compared to our reference scenario. Daily reported deaths in the worse scenario will rise to 3,500 by mid-December (Figure 22).
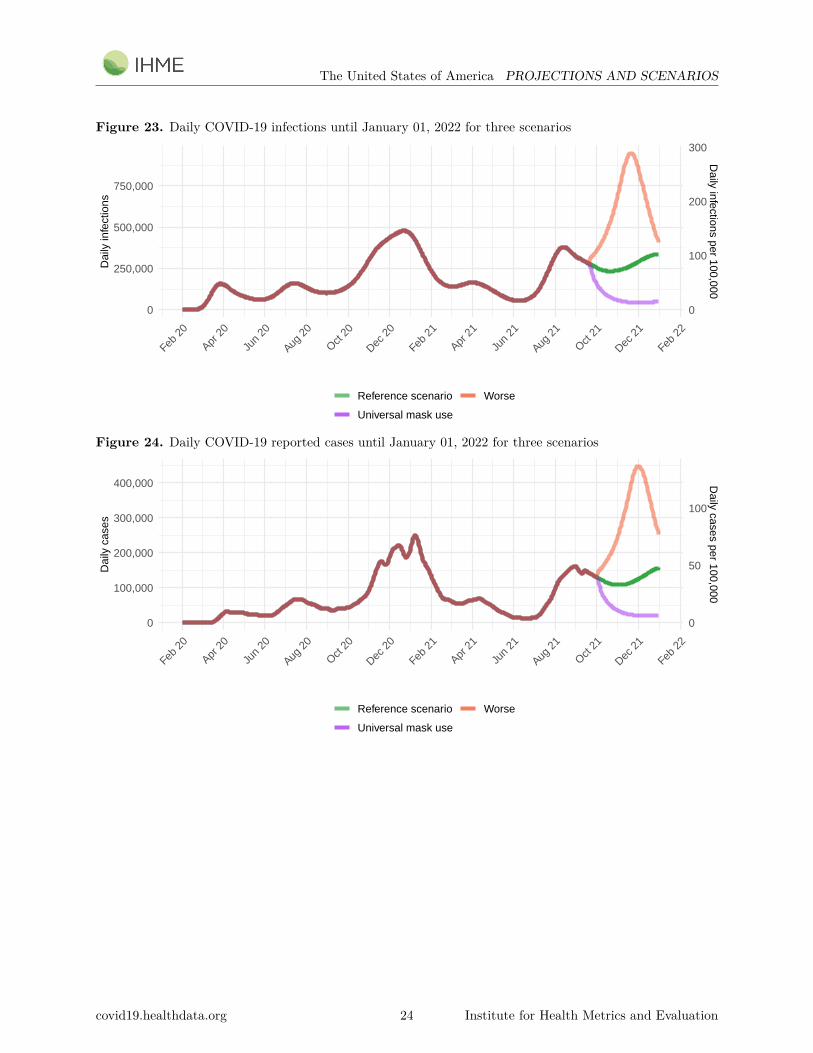
• Daily infections in the reference scenario will decline to 235,000 by the third week of October and then increase again, reaching 350,000 by the end of the year (Figure 23). Daily infections in the worse scenario will rise to 950,000 by mid-November (Figure 23).
• Daily cases in the reference scenario will decline to 1ess than 110,000 by the beginning of November and then increase to over 150,000 by the end of the year (Figure 24). Daily cases in the worse scenario will rise to 450,000 by the end of November (Figure 24).
• Daily hospital census in the reference scenario will decline to 75,000 by November 3, 2021 (Figure 25). Daily hospital census in the worse scenario will rise to 300,000 by December 8, 2021 (Figure 25).
• Figure 26 compares our reference scenario forecasts to other publicly archived models. LANL forecasts increasing mortality from early October onward. Other models suggest declines until mid-November. After that date, only the IHME model suggests an increase.

covid19.healthdata.org 4 Institute for Health Metrics and Evaluation
• At some point from September through January 1, 35 states will have high or extreme stress on hospital beds (Figure 27). At some point from September through January 1, 47 states will have high or extreme stress on intensive care unit (ICU) capacity (Figure 28).

The United States of America COVID-19 RESULTS BRIEFING
Model updatesPreviously, our global total for vaccinations was based only on the locations that we produce COVIDestimates for. Starting this week, we are including vaccination in all locations in the world that report dataon vaccinations. This will ensure vaccination numbers reflect what is happening around the world and arenot impacted by the selection of locations that we publish COVID-19 estimates for. We currently only reportCOVID-19 estimates for locations that have reported greater than 500 cumulative COVID-19 deaths.
covid19.healthdata.org 4 Institute for Health Metrics and Evaluation

The United States of America COVID-19 RESULTS BRIEFING
Figure 1. Daily COVID-19 hospital census and infections
0
100,000
200,000
300,000
400,000
500,000
Feb
20
Apr 2
0
Jun
20
Aug 2
0
Oct 20
Dec 2
0
Feb
21
Apr 2
1
Jun
21
Aug 2
1
Oct 21
Num
ber
of p
eopl
e
Daily hospital census Daily infections
Figure 2. Reported daily COVID-19 cases, moving average
0
50,000
100,000
150,000
200,000
250,000
Feb
20
Apr 2
0
Jun
20
Aug 2
0
Oct 20
Dec 2
0
Feb
21
Apr 2
1
Jun
21
Aug 2
1
Oct 21
Cou
nt
Daily cases
covid19.healthdata.org 5 Institute for Health Metrics and Evaluation

The United States of America COVID-19 RESULTS BRIEFING
Table 1. Ranking of excess deaths due to COVID-19 among the leading causes of mortality this week,assuming uniform deaths of non-COVID causes throughout the year
Cause name Weekly deaths RankingCOVID-19 20,177 1Ischemic heart disease 10,724 2Tracheal, bronchus, and lung cancer 3,965 3Chronic obstructive pulmonary disease 3,766 4Stroke 3,643 5Alzheimer’s disease and other dementias 2,768 6Chronic kidney disease 2,057 7Colon and rectum cancer 1,616 8Lower respiratory infections 1,575 9Diabetes mellitus 1,495 10
Figure 3. Smoothed trend estimate of reported daily COVID-19 deaths (blue) and excess daily deaths dueto COVID-19 (orange)
0
2,000
4,000
Feb
20
Apr 2
0
Jun
20
Aug 2
0
Oct 20
Dec 2
0
Feb
21
Apr 2
1
Jun
21
Aug 2
1
Oct 21
Dai
ly d
eath
s
covid19.healthdata.org 6 Institute for Health Metrics and Evaluation

The United States of America COVID-19 RESULTS BRIEFING
Figure 4. Daily COVID-19 death rate per 1 million on September 20, 2021
A. Daily reported COVID-19 death rate per 1 million
<1
1 to 1.9
2 to 2.9
3 to 3.9
4 to 4.9
5 to 5.9
6 to 6.9
7 to 7.9
>=8
B. Daily excess COVID-19 death rate per 1 million
<1
1 to 1.9
2 to 2.9
3 to 3.9
4 to 4.9
5 to 5.9
6 to 6.9
7 to 7.9
>=8
covid19.healthdata.org 7 Institute for Health Metrics and Evaluation

The United States of America COVID-19 RESULTS BRIEFING
Figure 5. Cumulative COVID-19 deaths per 100,000 on September 20, 2021
A. Reported cumulative COVID-19 deaths per 100,000
<50
50 to 99
100 to 149
150 to 199
200 to 249
250 to 299
300 to 349
350 to 399
>=400
B. Excess cumulative COVID-19 deaths per 100,000
<50
50 to 99
100 to 149
150 to 199
200 to 249
250 to 299
300 to 349
350 to 399
>=400
covid19.healthdata.org 8 Institute for Health Metrics and Evaluation

The United States of America COVID-19 RESULTS BRIEFING
Figure 6. Estimated percent of the population infected with COVID-19 on September 20, 2021
<5
5−9.9
10−14.9
15−19.9
20−24.9
25−29.9
30−34.9
35−39.9
>=40
Figure 7. Mean effective R on September 9, 2021. Effective R less than 1 means that transmission shoulddecline, all other things being held the same. The estimate of effective R is based on the combined analysisof deaths, case reporting, and hospitalizations where available. Current reported cases reflect infections 11-13days prior, so estimates of effective R can only be made for the recent past.
<0.87
0.87−0.89
0.9−0.93
0.94−0.96
0.97−0.99
1−1.02
1.03−1.05
1.06−1.09
1.1−1.12
>=1.13
covid19.healthdata.org 9 Institute for Health Metrics and Evaluation

The United States of America COVID-19 RESULTS BRIEFING
Figure 8. Percent of COVID-19 infections detected. This is estimated as the ratio of reported dailyCOVID-19 cases to estimated daily COVID-19 infections based on the SEIR disease transmission model. Dueto measurement errors in cases and testing rates, the infection-detection rate can exceed 100% at particularpoints in time.
0%
25%
50%
75%
100%
Mar
20
May
20
Jul 2
0
Sep 2
0
Nov 2
0
Jan
21
Mar
21
May
21
Jul 2
1
Sep 2
1
Per
cent
of i
nfec
tions
det
ecte
d
France
Italy
Sweden
United Kingdom
Canada
United States of America
covid19.healthdata.org 10 Institute for Health Metrics and Evaluation

The United States of America COVID-19 RESULTS BRIEFING
Figure 9. Estimated percent of circulating SARS-CoV-2 for primary variant families on September 20, 2021
A. Estimated percent Alpha variant
0%
1−9%
10−24%
25−49%
50−74%
75−89%
90−100%
B. Estimated percent Beta variant
0%
1−9%
10−24%
25−49%
50−74%
75−89%
90−100%
covid19.healthdata.org 11 Institute for Health Metrics and Evaluation

The United States of America COVID-19 RESULTS BRIEFING
C. Estimated percent Delta variant
0%
1−9%
10−24%
25−49%
50−74%
75−89%
90−100%
D. Estimated percent Gamma variant
0%
1−9%
10−24%
25−49%
50−74%
75−89%
90−100%
covid19.healthdata.org 12 Institute for Health Metrics and Evaluation

The United States of America COVID-19 RESULTS BRIEFING
Figure 10. Infection-fatality rate on September 20, 2021. This is estimated as the ratio of COVID-19 deathsto estimated daily COVID-19 infections.
< 0.2%
0.2% to 0.39%
0.4% to 0.59%
0.6% to 0.79%
0.8% to 0.99%
> 1%
covid19.healthdata.org 13 Institute for Health Metrics and Evaluation

The United States of America COVID-19 RESULTS BRIEFING
Critical driversTable 2. Current mandate implementation
Prim
ary
scho
ol c
losu
re
Sec
onda
ry s
choo
l clo
sure
Hig
her
scho
ol c
losu
re
Bor
ders
clo
sed
to a
ny n
on−
resi
dent
Bor
ders
clo
sed
to a
ll no
n−re
side
nts
Indi
vidu
al m
ovem
ents
res
tric
ted
Cur
few
for
busi
ness
es
Indi
vidu
al c
urfe
w
Gat
herin
g lim
it: 6
indo
or, 1
0 ou
tdoo
r
Gat
herin
g lim
it: 1
0 in
door
, 25
outd
oor
Gat
herin
g lim
it: 2
5 in
door
, 50
outd
oor
Gat
herin
g lim
it: 5
0 in
door
, 100
out
door
Gat
herin
g lim
it: 1
00 in
door
, 250
out
door
Res
taur
ants
clo
sed
Bar
s cl
osed
Res
taur
ants
/ ba
rs c
lose
d
Res
taur
ants
/ ba
rs c
urbs
ide
only
Gym
s, p
ools
, oth
er le
isur
e cl
osed
Non
−es
sent
ial r
etai
l clo
sed
Non
−es
sent
ial r
etai
l cur
bsid
e on
ly
Non
−es
sent
ial w
orkp
lace
s cl
osed
Sta
y ho
me
orde
r
Sta
y ho
me
fine
Mas
k m
anda
te
Mas
k m
anda
te fi
ne
WyomingWisconsin
West VirginiaWashington
VirginiaVermont
UtahTexas
TennesseeSouth Dakota
South CarolinaRhode IslandPennsylvania
OregonOklahoma
OhioNorth Dakota
North CarolinaNew York
New MexicoNew Jersey
New HampshireNevada
NebraskaMontanaMissouri
MississippiMinnesota
MichiganMassachusetts
MarylandMaine
LouisianaKentucky
KansasIowa
IndianaIllinoisIdaho
HawaiiGeorgiaFlorida
District of ColumbiaDelaware
ConnecticutColoradoCaliforniaArkansas
ArizonaAlaska
Alabama
Mandate in placeMandate in place(imposed this week)Mandate in place(updated from previous reporting)
No mandateNo mandate(lifted this week)No mandate(updated from previous reporting)
covid19.healthdata.org 14 Institute for Health Metrics and Evaluation

The United States of America COVID-19 RESULTS BRIEFING
Figure 11. Trend in mobility as measured through smartphone app use, compared to January 2020 baseline
−80
−60
−40
−20
0
Jan
20
Mar
20
May
20
Jul 2
0
Sep 2
0
Nov 2
0
Jan
21
Mar
21
May
21
Jul 2
1
Sep 2
1Per
cent
red
uctio
n fr
om a
vera
ge m
obili
ty
France
Italy
Sweden
United Kingdom
Canada
United States of America
Figure 12. Mobility level as measured through smartphone app use, compared to January 2020 baseline(percent) on September 20, 2021
=<−50
−49 to −45
−44 to −40
−39 to −35
−34 to −30
−29 to −25
−24 to −20
−19 to −15
−14 to −10
>−10
covid19.healthdata.org 15 Institute for Health Metrics and Evaluation

The United States of America COVID-19 RESULTS BRIEFING
Figure 13. Trend in the proportion of the population reporting always wearing a mask when leaving home
0
25
50
75
Mar
20
May
20
Jul 2
0
Sep 2
0
Nov 2
0
Jan
21
Mar
21
May
21
Jul 2
1
Sep 2
1
Per
cent
of p
opul
atio
n
France
Italy
Sweden
United Kingdom
Canada
United States of America
Figure 14. Proportion of the population reporting always wearing a mask when leaving home on September20, 2021
0%
<10%
10−20%
20−30%
30−40%
40−50%
50−60%
60−70%
70−80%
80−90%
90−100%
covid19.healthdata.org 16 Institute for Health Metrics and Evaluation

The United States of America COVID-19 RESULTS BRIEFING
Figure 15. Trend in COVID-19 diagnostic tests per 100,000 people
0
500
1000
1500
Mar
20
May
20
Jul 2
0
Sep 2
0
Nov 2
0
Jan
21
Mar
21
May
21
Jul 2
1
Sep 2
1
Test
per
100
,000
pop
ulat
ion
France
Italy
Sweden
United Kingdom
Canada
United States of America
Figure 16. COVID-19 diagnostic tests per 100,000 people on September 20, 2021
<5
5 to 9.9
10 to 24.9
25 to 49
50 to 149
150 to 249
250 to 349
350 to 449
450 to 499
>=500
covid19.healthdata.org 17 Institute for Health Metrics and Evaluation

The United States of America COVID-19 RESULTS BRIEFING
Table 3. Estimates of vaccine efficacy for specific vaccines used in the model at preventing disease andinfection. The SEIR model uses variant-specific estimates of vaccine efficacy at preventing symptomaticdisease and at preventing infection. We use data from clinical trials directly, where available, and makeestimates otherwise. More information can be found on our website.
Vaccine
Efficacy atpreventing disease:
ancestral andAlpha
Efficacy atpreventing infection:ancestral and Alpha
Efficacy atpreventing disease:Beta, Delta, &
Gamma
Efficacy atpreventing infection:
Beta, Delta, &Gamma
AstraZeneca 90% 52% 85% 49%CoronaVac 50% 44% 43% 38%Covaxin 78% 69% 68% 60%Johnson &Johnson
86% 72% 60% 56%
Moderna 94% 89% 94% 80%Novavax 89% 79% 79% 69%Pfizer/BioNTech 94% 86% 85% 78%Sinopharm 73% 65% 63% 56%Sputnik-V 92% 81% 80% 70%TianjinCanSino
66% 58% 57% 50%
Othervaccines
75% 66% 65% 57%
Othervaccines(mRNA)
91% 86% 85% 78%
covid19.healthdata.org 18 Institute for Health Metrics and Evaluation

The United States of America COVID-19 RESULTS BRIEFING
Figure 17. Percent of the population (A) having received at least one dose and (B) fully vaccinated againstSARS-CoV-2 by September 20, 2021
A. Percent of the population having received one dose of a COVID-19 vaccine
0%
<10%
10−20%
20−30%
30−40%
40−50%
50−60%
60−70%
70−80%
80−90%
90−100%
B. Percent of the population fully vaccinated against SARS-CoV-2
0%
<10%
10−20%
20−30%
30−40%
40−50%
50−60%
60−70%
70−80%
80−90%
90−100%
covid19.healthdata.org 19 Institute for Health Metrics and Evaluation
The United States of America COVID-19 RESULTS BRIEFING
Figure 18. Trend in the estimated proportion of the adult (18+) population that have been vaccinated orwould probably or definitely receive the COVID-19 vaccine if available
0
25
50
75
100
Jan
21
Feb
21
Mar
21
Apr 2
1
May
21
Jun
21
Jul 2
1
Aug 2
1
Sep 2
1
Per
cent
of p
opul
atio
n
France
Italy
Sweden
United Kingdom
Canada
United States of America
Figure 19. This figure shows the estimated proportion of the adult (18+) population that has been vaccinatedor would probably or definitely receive the COVID-19 vaccine if available
0%
<10%
10−20%
20−30%
30−40%
40−50%
50−60%
60−70%
70−80%
80−90%
90−100%
covid19.healthdata.org 20 Institute for Health Metrics and Evaluation

The United States of America COVID-19 RESULTS BRIEFING
Figure 20. Percent of people who receive at least one dose of a COVID-19 vaccine and those who are fullyvaccinated
0%
10%
20%
30%
40%
50%
60%
Dec 2
0
Jan
21
Feb
21
Mar
21
Apr 2
1
May
21
Jun
21
Jul 2
1
Aug 2
1
Sep 2
1
Oct 21
Nov 2
1
Dec 2
1
Jan
22
Per
cent
of p
opul
atio
n
At least one dose Fully vaccinated
Figure 21. Percentage of people who are immune to non-escape variants and the percentage of people whoare immune to escape variants
0%
10%
20%
30%
40%
50%
60%
70%
Feb
20
Apr 2
0
Jun
20
Aug 2
0
Oct 20
Dec 2
0
Feb
21
Apr 2
1
Jun
21
Aug 2
1
Oct 21
Dec 2
1
Feb
22
Per
cent
Imm
une
Immune to escape variants Immune to non−escape variants
covid19.healthdata.org 21 Institute for Health Metrics and Evaluation

The United States of America PROJECTIONS AND SCENARIOS
Projections and scenariosWe produce three scenarios when projecting COVID-19. The reference scenario is our forecast of what wethink is most likely to happen:
• Vaccines are distributed at the expected pace. Brand- and variant-specific vaccine efficacy is updatedusing the latest available information from peer-reviewed publications and other reports.
• Future mask use is the mean of mask use over the last 7 days.• Mobility increases as vaccine coverage increases.• Governments adapt their response by re-imposing social distancing mandates for 6 weeks whenever
daily deaths reach 8 per million, unless a location has already spent at least 7 of the last 14 days withdaily deaths above this rate, and not yet re-imposed social distancing mandates. In this case, thereference scenario assumes that mandates are re-imposed when daily deaths reach 15 per million.
• Variants Alpha, Beta, Gamma, and Delta continue to spread regionally and globally from locationswith sufficient transmission.
The worse scenario modifies the reference scenario assumption in four ways:
• 100% of vaccinated individuals stop using masks.• Mobility increases in all locations to 25% above the pre-pandemic winter baseline, irrespective of vaccine
coverage.• Governments are more reluctant to re-impose social distancing mandates, waiting until the daily death
rate reaches 15 per million, unless a location has already spent at least 7 of the last 14 days with dailydeaths above this rate, and not yet re-imposed social distancing mandates. In this case, the referencescenario assumes that mandates are re-imposed when daily deaths reach 38 per million. In either case,we assume social distancing mandates remain in effect for 6 weeks.
• Variants Alpha, Beta, Gamma, and Delta spread between locations twice as fast when compared withour reference scenario.
The universal masks scenario makes all the same assumptions as the reference scenario but assumes alllocations reach 95% mask use within 7 days.
covid19.healthdata.org 22 Institute for Health Metrics and Evaluation
The United States of America PROJECTIONS AND SCENARIOS
Figure 22. Daily COVID-19 deaths until January 01, 2022 for three scenarios
A. Reported daily COVID-19 deaths per 100,000
0
1,000
2,000
3,000
0.0
0.3
0.6
0.9
Feb
20
Apr 2
0
Jun
20
Aug 2
0
Oct 20
Dec 2
0
Feb
21
Apr 2
1
Jun
21
Aug 2
1
Oct 21
Dec 2
1
Feb
22
Dai
ly d
eath
sD
aily deaths per 100,000
Reference scenario
Universal mask use
Worse
B. Excess daily COVID-19 deaths per 100,000
0
2,000
4,000
0.0
0.5
1.0
1.5
Feb
20
Apr 2
0
Jun
20
Aug 2
0
Oct 20
Dec 2
0
Feb
21
Apr 2
1
Jun
21
Aug 2
1
Oct 21
Dec 2
1
Feb
22
Dai
ly d
eath
sD
aily deaths per 100,000
Reference scenario
Universal mask use
Worse
covid19.healthdata.org 23 Institute for Health Metrics and Evaluation
The United States of America PROJECTIONS AND SCENARIOS
Figure 23. Daily COVID-19 infections until January 01, 2022 for three scenarios
0
250,000
500,000
750,000
0
100
200
300
Feb
20
Apr 2
0
Jun
20
Aug 2
0
Oct 20
Dec 2
0
Feb
21
Apr 2
1
Jun
21
Aug 2
1
Oct 21
Dec 2
1
Feb
22
Dai
ly in
fect
ions
Daily infections per 100,000
Reference scenario
Universal mask use
Worse
Figure 24. Daily COVID-19 reported cases until January 01, 2022 for three scenarios
0
100,000
200,000
300,000
400,000
0
50
100
Feb
20
Apr 2
0
Jun
20
Aug 2
0
Oct 20
Dec 2
0
Feb
21
Apr 2
1
Jun
21
Aug 2
1
Oct 21
Dec 2
1
Feb
22
Dai
ly c
ases
Daily cases per 100,000
Reference scenario
Universal mask use
Worse
covid19.healthdata.org 24 Institute for Health Metrics and Evaluation

The United States of America PROJECTIONS AND SCENARIOS
Figure 25. Daily COVID-19 hospital census until January 01, 2022 for three scenarios
0
100,000
200,000
300,000
0
25
50
75
Feb
20
Apr 2
0
Jun
20
Aug 2
0
Oct 20
Dec 2
0
Feb
21
Apr 2
1
Jun
21
Aug 2
1
Oct 21
Dec 2
1
Feb
22
Hos
pita
l cen
sus
Hospital census per 100,000 population
Reference scenario
Universal mask use
Worse
Figure 26. Comparison of reference model projections with other COVID modeling groups. For thiscomparison, we are including projections of daily COVID-19 deaths from other modeling groups when available:Delphi from the Massachusetts Institute of Technology (Delphi), Imperial College London (Imperial), TheLos Alamos National Laboratory (LANL), the SI-KJalpha model from the University of Southern California(SIKJalpha), and the CDC Ensemble Model (CDC) Daily deaths from other modeling groups are smoothed toremove inconsistencies with rounding. Regional values are aggregates from available locations in that region.
0
1,000
2,000
3,000
4,000
Oct 21
Nov 2
1
Dec 2
1
Jan
22
Date
Dai
ly d
eath
s
Models
IHME
Delphi
Imperial
LANL
SIKJalpha
CDC
covid19.healthdata.org 25 Institute for Health Metrics and Evaluation

The United States of America PROJECTIONS AND SCENARIOS
Figure 27. The estimated inpatient hospital usage is shown over time. The percent of hospital beds occupiedby COVID-19 patients is color-coded based on observed quantiles of the maximum proportion of beds occupiedby COVID-19 patients. Less than 5% is considered low stress, 5-9% is considered moderate stress, 10-19% isconsidered high stress, and 20% or greater is considered extreme stress.
WyomingWisconsin
West VirginiaWashington, DC
WashingtonVirginia
VermontUtah
TexasTennessee
South DakotaSouth Carolina
Rhode IslandPennsylvania
OregonOklahoma
OhioNorth Dakota
North CarolinaNew York
New MexicoNew Jersey
New HampshireNevada
NebraskaMontanaMissouri
MississippiMinnesota
MichiganMassachusetts
MarylandMaine
LouisianaKentucky
KansasIowa
IndianaIllinoisIdaho
HawaiiGeorgiaFlorida
DelawareConnecticut
ColoradoCaliforniaArkansas
ArizonaAlaska
Alabama
Mar
20
May
20
Jul 2
0
Sep 2
0
Nov 2
0
Jan
21
Mar
21
May
21
Jul 2
1
Sep 2
1
Nov 2
1
Jan
22
Stress level
Low
Moderate
High
Extreme
All hospital beds
covid19.healthdata.org 26 Institute for Health Metrics and Evaluation

The United States of America PROJECTIONS AND SCENARIOS
Figure 28. The estimated intensive care unit (ICU) usage is shown over time. The percent of ICU bedsoccupied by COVID-19 patients is color-coded based on observed quantiles of the maximum proportion ofICU beds occupied by COVID-19 patients. Less than 10% is considered low stress, 10-29% is consideredmoderate stress, 30-59% is considered high stress, and 60% or greater is considered extreme stress.
WyomingWisconsin
West VirginiaWashington, DC
WashingtonVirginia
VermontUtah
TexasTennessee
South DakotaSouth Carolina
Rhode IslandPennsylvania
OregonOklahoma
OhioNorth Dakota
North CarolinaNew York
New MexicoNew Jersey
New HampshireNevada
NebraskaMontanaMissouri
MississippiMinnesota
MichiganMassachusetts
MarylandMaine
LouisianaKentucky
KansasIowa
IndianaIllinoisIdaho
HawaiiGeorgiaFlorida
DelawareConnecticut
ColoradoCaliforniaArkansas
ArizonaAlaska
Alabama
Mar
20
May
20
Jul 2
0
Sep 2
0
Nov 2
0
Jan
21
Mar
21
May
21
Jul 2
1
Sep 2
1
Nov 2
1
Jan
22
Stress level
Low
Moderate
High
Extreme
Intensive care unit beds
covid19.healthdata.org 27 Institute for Health Metrics and Evaluation

The United States of America MORE INFORMATION
More informationData sources:
Mask use and vaccine confidence data are from the The Delphi Group at Carnegie Mellon University andUniversity of Maryland COVID-19 Trends and Impact Surveys, in partnership with Facebook. Mask use dataare also from Premise, the Kaiser Family Foundation, and the YouGov COVID-19 Behaviour Tracker survey.
Genetic sequence and metadata are primarily from the GISAID Initiative. Further details available on theCOVID-19 model FAQ page.
A note of thanks:
We wish to warmly acknowledge the support of these and others who have made our COVID-19 estimationefforts possible.
More information:
For all COVID-19 resources at IHME, visit http://www.healthdata.org/covid.
To download our most recent results, visit our Data downloads page.
Questions? Requests? Feedback? Please contact us at https://www.healthdata.org/covid/contact-us.
covid19.healthdata.org 28 Institute for Health Metrics and Evaluation
Top Related